1. Introduction
Due to its low cost, clear-burning, and less CO
2 release per energy unit, natural gas is considered as a clean energy resource compared with conventional fossil fuels including coal, crude oil, and petroleum [
1,
2]. However, around one third of raw natural gases contain CO
2 and sulfur components (H
2S, RSH, RSSH, CS
2, and COS), which need to be removed to meet specifications of sales gas [
3]. These acidic impurities have no heating value. In addition, these contaminants tend to form acids that can corrode pipelines and other equipment with the presence of water. Therefore, these acidic impurities have to be removed from the sour gas. Particularly, the maximum allowed level of CO
2 in natural gas transmitted to customers by pipeline is typically less than 3% [
4,
5]. Product natural gas quality standards for natural gas content also have more stringent restriction: CO
2 needs to be less than 2% (mol), and H
2S needs to be less than 6 mg·m
−3 in sweet gas. Therefore, it is of critical importance to remove the acid gases in natural gas to a certain extent to meet the requirements of commodity gas quality standards [
6].
The process that removes the acid gas from natural gases is referred as acid gas removal (AGR) process. There are many different methods to remove acid gas from natural gas. To name just a few, these methods include absorption, which can be chemical absorption, physical absorption or combined absorption. Membrane separation is another method that has been used for natural gas sweetening [
7,
8]. Other methods include but are not limited to biochemical method [
9], molecular sieving [
10], and low-temperature fractionation [
11]. Among those technologies listed above, chemical absorption is the most widely used method for acid gas removal. Various amines have been commonly used as chemical solvents, such as monoethanolamine (MEA), diethanolamine (DEA), and methyldiethanolamine (MDEA). Compared with MEA and DEA, MDEA can selectively remove H
2S with the existence of CO
2. Secondly, MDEA can remove most CO
2 and H
2S from the raw natural gas, which can be beneficial to sulfur recovery. Thirdly, the foaming tendency and corrosiveness of MDEA are low compared to MEA and DEA. Last but not least, the reaction of MDEA with CO
2 is an acid-base reaction with less heat of reaction; thus, less heat is needed during regeneration, so it is ideal for removing CO
2 in large quantities [
12,
13,
14].
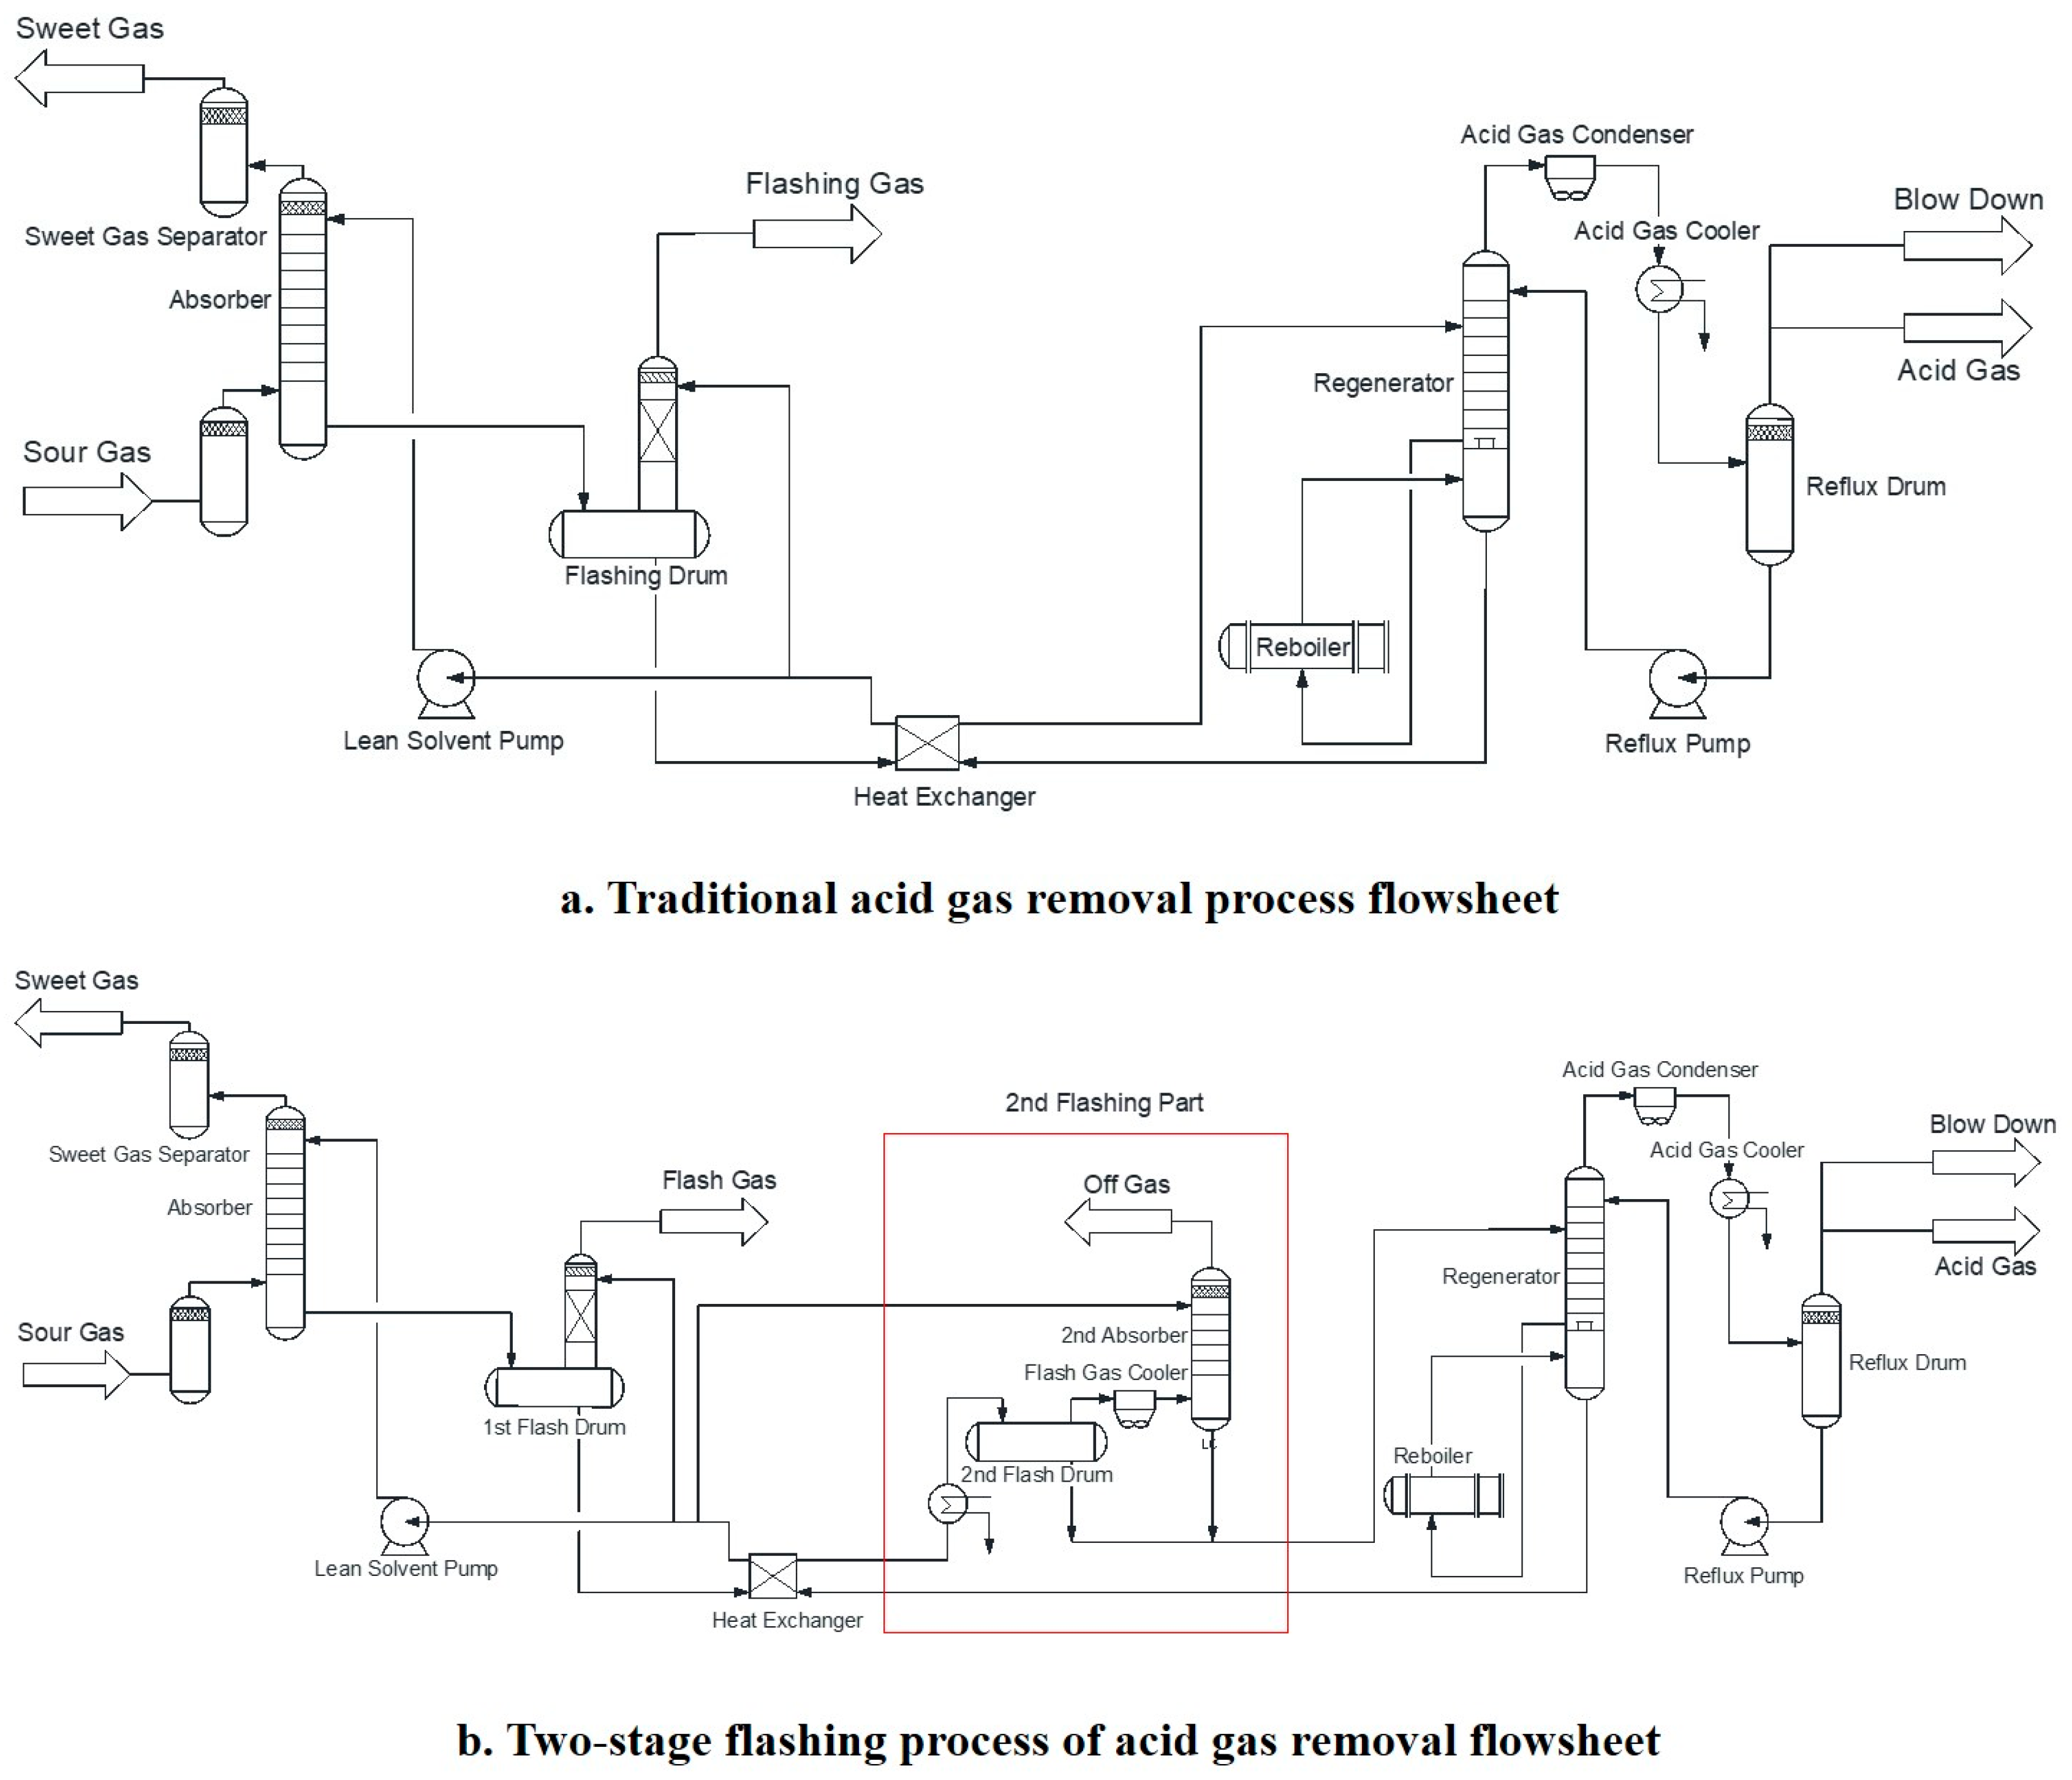
Generally, traditional acid gas removal process includes three main steps, absorption, hydrocarbon flash and regeneration [
15] units, which are shown in
Figure 1a.
In the process shown above, one absorber, one flashing drum, and one regenerator are normally used in the acid gas removal process. The acid gases absorbed in the liquid absorbent can be partly released in the flashing drum; then, the rich solvent is further sent to the regenerator. Traditional acid gas removal process can effectively remove most of H2S from acid gas. It should be noticed that if high carbon/sulfur ratio natural gas is involved, the basic absorbents could remove both sulfur compounds and CO2, but the sulfur compounds (e.g., H2S) cannot be easily regenerated, consequently reducing the overall acid gas removal efficiency. Secondly, the CO2 could diffuse to the regenerator vapor, which could lead to increased cooling water consumption. Thirdly, if the CO2 content in the natural gas is high, CO2 may enter into the sulfur recovery stage and increase the operational cost of the sulfur recovery unit.
Various methods have been used to improve these problems. Zhao et al. [
16] studied different concentrations of amine to absorb acid gas, but the energy saving was not very good. Gutierrez et al. [
17] used Aspen HYSYS and Aspen plus to simulate the process of natural gas sweetening in northern Argentina and analyzed CO
2 mole fraction in absorber and regenerator; however, they did not say how to effectively reduce process energy consumption. Roy et al. [
18] used Aspen HYSYS to simulate the Bakhrabad gas processing plant at Sylhet and compared the simulated results with the plant data. However, they simply simulated the natural gas processing plant without optimizing those parameters. Mohamadirad et al. [
19] simulated the effect of using MDEA blended with MEA or DEA to improve the performance of an industrial sweetening process in Iran. They found out that those blends improve CO
2 removal efficiency significantly. However, they also did not optimize the effect of other parameters, such as temperature and pressure. Fouad et al. [
20] simulated the use of mixed amines to reduce the energy requirements of the Habshan gas sweetening unit in Abu Dhabi, UAE. They used a blend of MDEA and TEA and found a 3% reduction in the operating costs of the unit while still meeting the specifications of acid gas removal. Like Mohamadirad et al., they did not analyze the effect of other parameters, such as temperature and pressure, on the overall energy consumption.
In this paper, to enrich CO
2 and reduce regenerator energy consumption, a new two-stage flashing process is proposed to remove more acid gas in the high C/S ratio natural gas. Aspen HYSYS V10 was used to simulate the whole two-stage flashing process. Detailed process description is shown in
Section 2. The newly proposed process was compared with conventional AGR process, as well as the combination of AGR and acid gas enrichment (AGE) processes. In addition, Aspen HSYSY sensitivity analysis function was used to study the effect of different operation parameters on the overall energy consumption [
21,
22]. The rest of the paper is structured as follows:
Section 2 contains the description of the novel two stage process and the raw material data,
Section 3 contains the simulation results of the novel two stage process,
Section 4 contains the sensitivity analysis of different AGR process,
Section 5 contains the comparison between the traditional acid gas removal process and the novel two stage acid gas removal process.
2. Process Description
The novel two stage process is shown in
Figure 1b. Compared with traditional AGR process, this novel process has the 2nd flashing part which contains two flash drums and two absorbers, and it is shown in red box of
Figure 1b.
The first absorption column is used to remove most of the acid gas; afterwards, two flashing drums are used instead of one flashing drum. The first flashing drum is used to remove most of the light hydrocarbon, while the second flashing section is used to remove most of the CO2 and part of the H2S. The flashing gases from both flashing sections are sent to another two absorbers. After the two flashing drums, the liquid absorbent is sent to the regeneration column to remove the H2S.
The acid gas enrichment section is the most important section in this process. The rich solvent which exchanges heat with the lean solvent enters the 2nd flash drum to remove most of the acid gas. The 2nd flashing vapor is cooled by air and enters into the 2nd absorber. The 2nd flashing vapor enters into the bottom of the 2nd absorber, and the cyclic MDEA enters into the top of 2nd absorber. Vapor and liquid flow counter-currently to allow the absorption of H2S from the acid gas.
Following reactions take place in three absorbers [
23,
24]:
The regeneration of MDEA solvent is endothermic and is favored by low pressure. Chemical reactions that take place in regenerator are the same but to the opposite direction due to high temperature.
Compared to the conventional one stage absorption process, this novel two-stage acid gas removal process has many advantages including: (1) CO2 can be enriched in this novel acid gas, which can reduce the consumption of cooling water; (2) The sulfur compounds and CO2 can be separated in a much more effective way that the recovery investment is reduced.
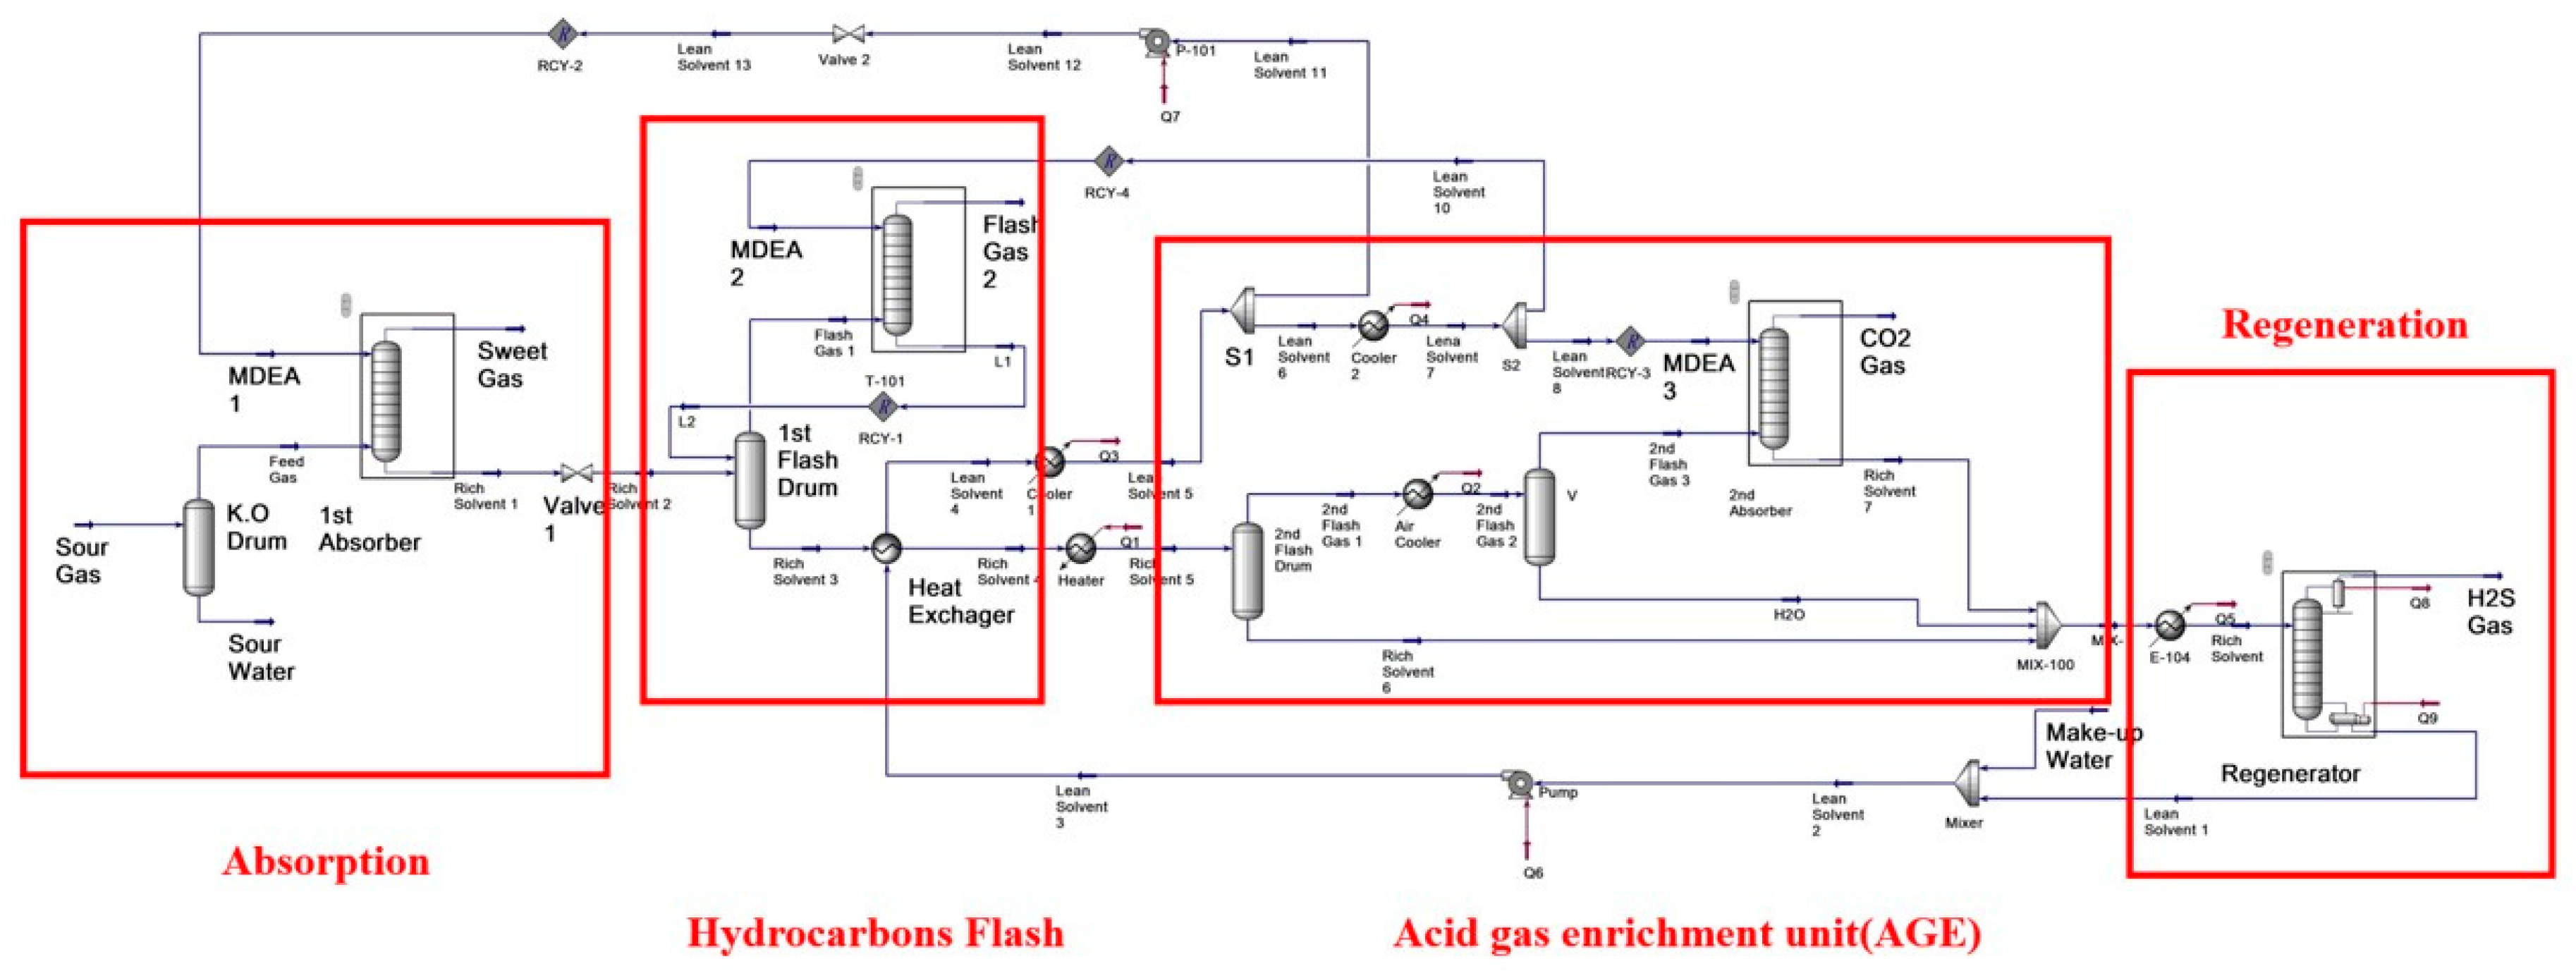
The novel acid gas removal process was simulated by Aspen HYSYS. The simulation flowsheet is shown in
Figure 2.
The choice of appropriate thermodynamic models and the accuracy of parameters are crucial for the reliability of the design. Acid Gas-Chemical Solvent was used as the property package for acid gas removal process [
25,
26].
The sour gas composition used in the study was based on the raw material of a middle east plant, which is designed by Saudi Arabian Oil Company. Its composition is shown in
Table 1. The carbon to sulfur ratio is 2.3, which justifies the necessity to adopt acid gas enrichment process to remove CO
2 and enrich H
2S. According to the standard, the CO
2 in sweet gas should be lower than 2%, and H
2S should be lower than 6 mg·m
−3. The mass fraction of MDEA solvent is MDEA: H
2O = 55:45.
4. Discussion
The Aspen HYSYS sensitivity analysis function is used to evaluate the influence of different operational parameters in the two-stage acid gas removal process.
4.1. The Effects of MDEA Flow Rate on the Process Performance
4.1.1. First Absorber
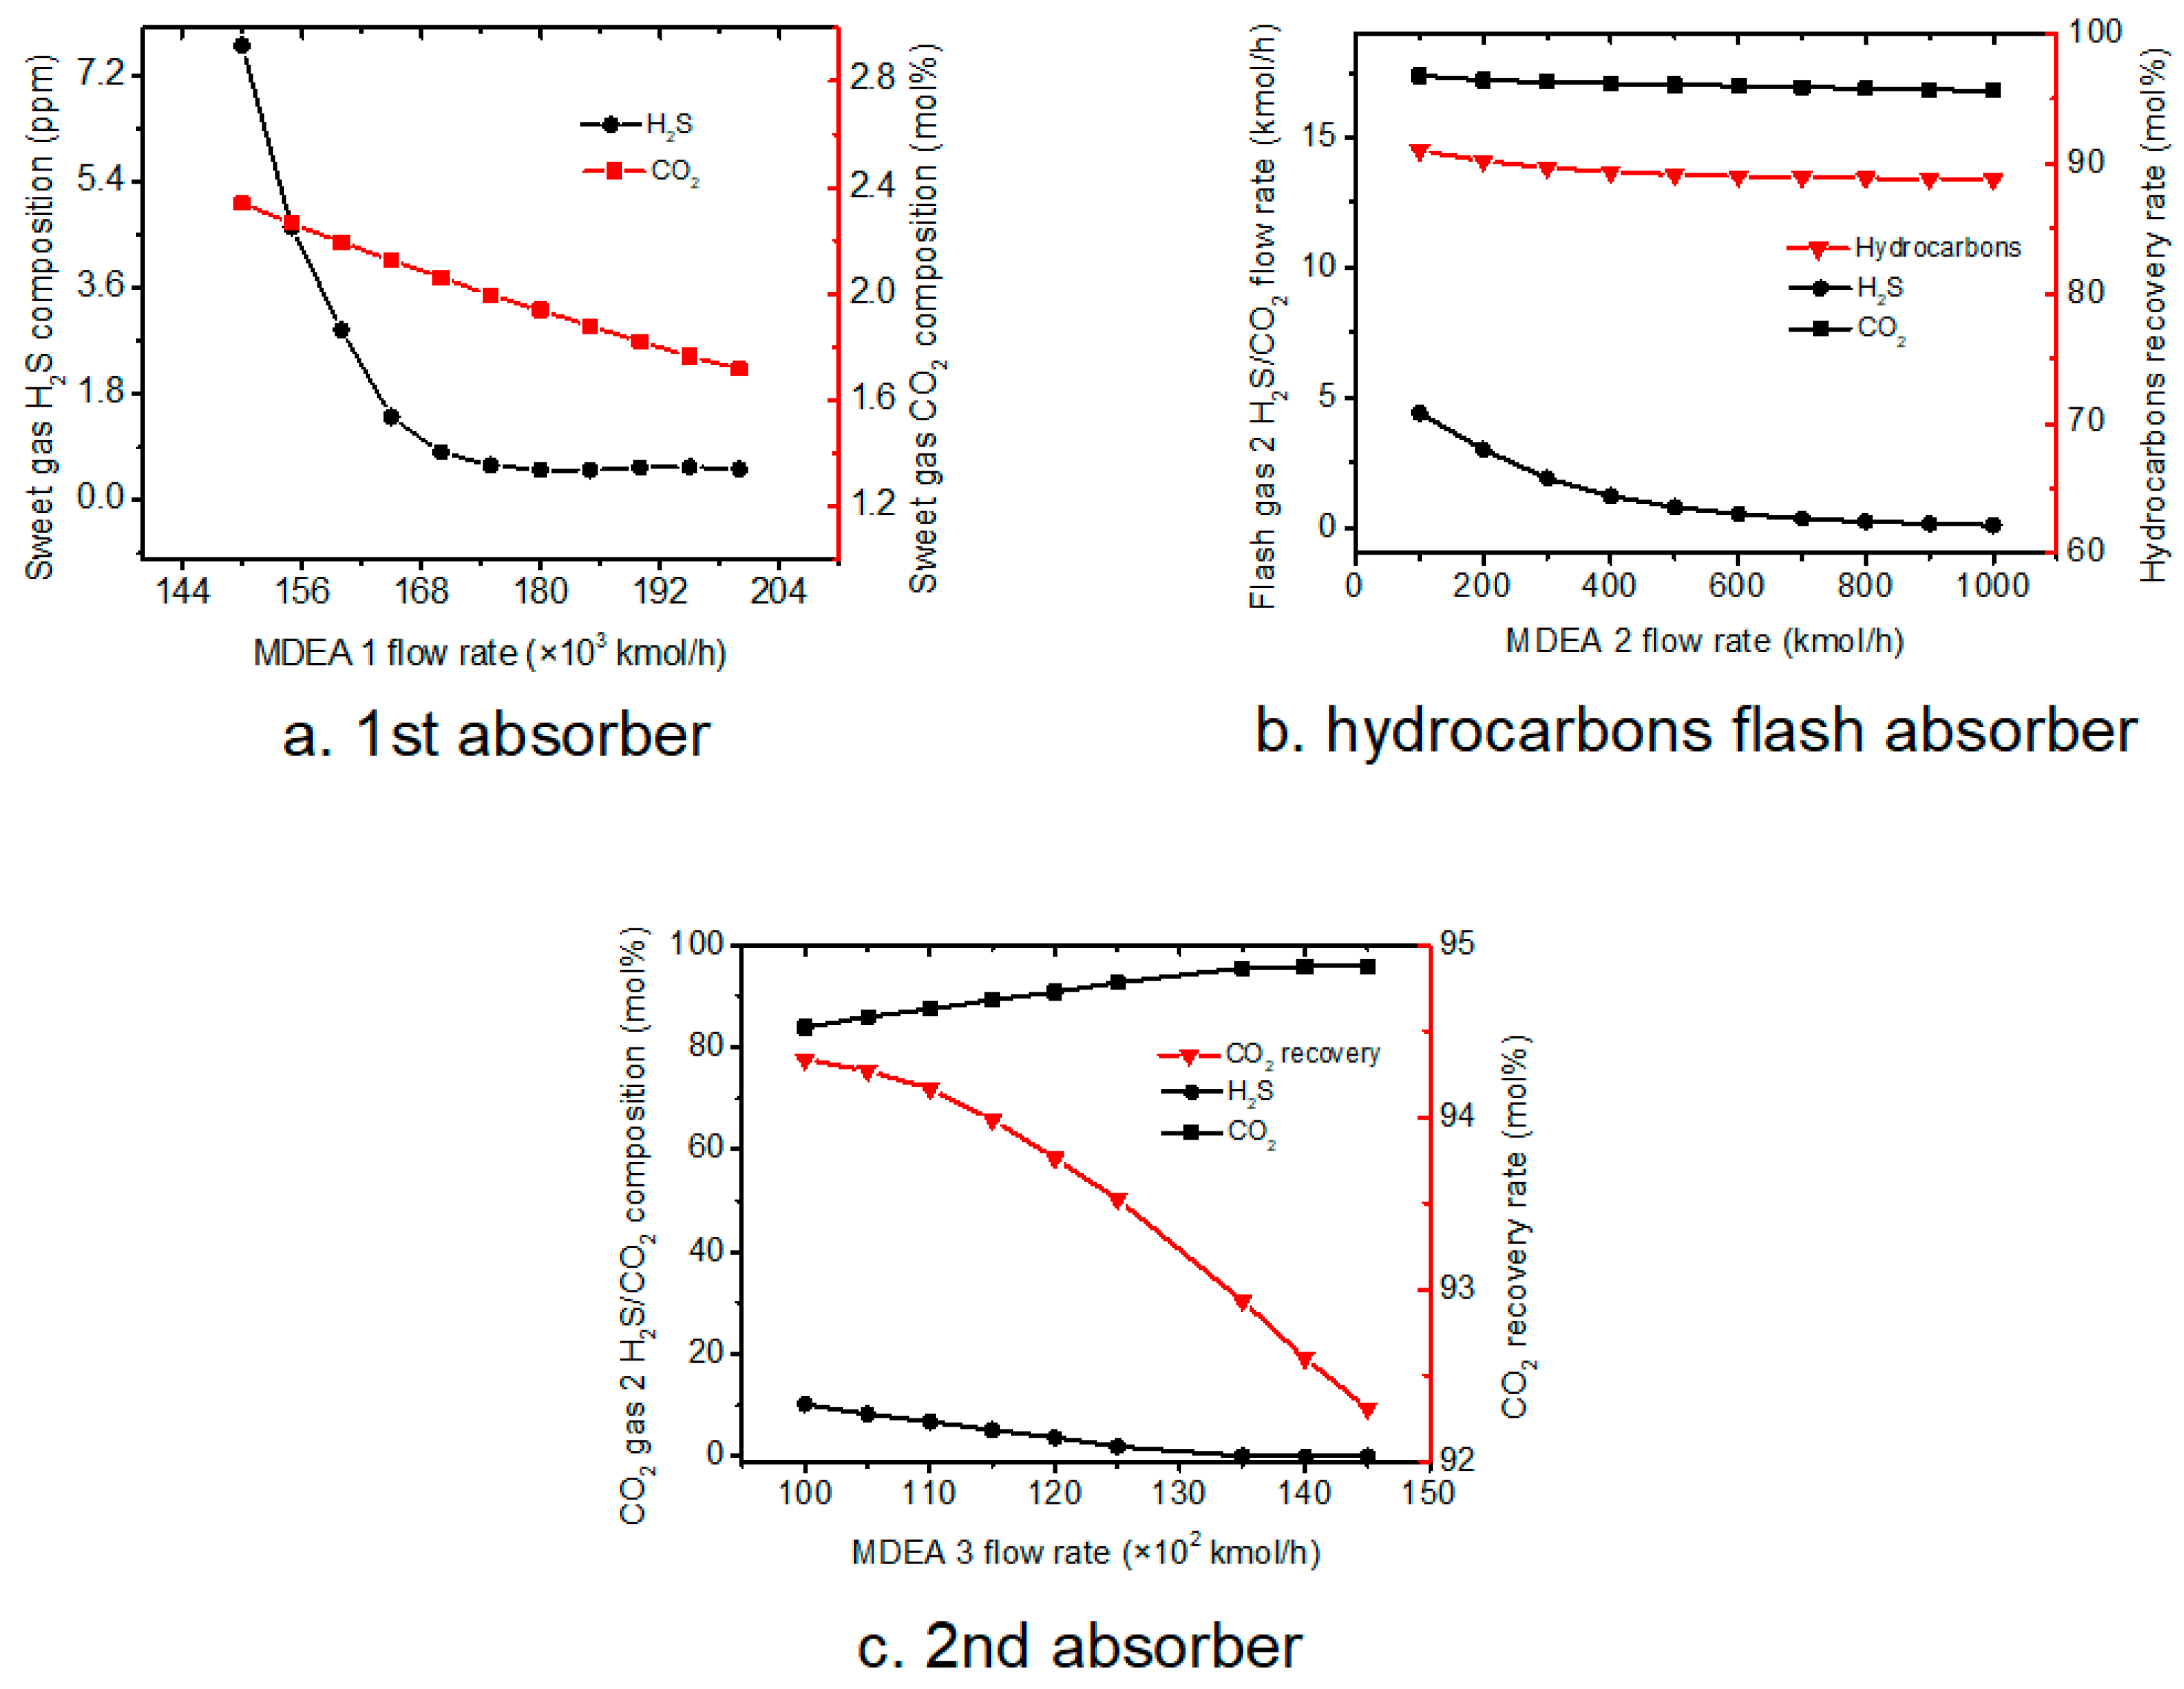
The MDEA flow rate is a key factor for the three absorbers to absorb acid gas. The purpose of the analysis is to optimize the MDEA flow rate, to make the 1st absorber sweet gas reach the standard and hydrocarbon flash absorber, 2nd absorber, absorb more acid gas. The effect of MEDA flow rate on the final sweet gas H
2S and CO
2 composition was studied, and results were shown in
Figure 3a.
As the basic case, the 1st absorber pressure is set as 8500 kPa, and the MDEA flow rate are varied from 1.5 × 10⁵ to 2.0 × 10⁵ kmol·h−1. It was found that the H2S concentration dramatically decreases with MEDA flow rate increasing at a lower flow rate range. Further increases the MDEA flow from 1.75 × 10⁵ to 2.0 × 10⁵ kmol·h−1 have limited effect on reducing H2S composition in the sweet gas. On the other hand, the CO2 concentration decreases lineally while MEDA flow rate increases. A MDEA flow rate higher than 1.75 × 10⁵ kmol·h−1 could ensure a CO2 content lower than 2%.
4.1.2. Hydrocarbons Flash Section
MEDA was also used in hydrocarbon flash section, thus the effect of MEDA flow rate on CO
2 gas 2 composition and CO
2 recovery rate was studied and results are shown in
Figure 3b.
Hydrocarbons flash section aims to remove hydrocarbons and absorb acid gas, so with the increase of the MDEA flow rate, more acid gas can be absorbed while more hydrocarbons also can be absorbed into rich solvent. Hydrocarbons flash temperature and pressure are 63 °C and 500 kPa; the MDEA flow rates are varied from 100 to 1000 kmol·h
−1.
Figure 3b shows that the compositions of H
2S and CO
2 decrease as the MDEA flow rate increases, while the MDEA flow rate reaches 700 kmol·h
−1, the flow rates of H
2S and CO
2 stabilize at 16 kmol·h
−1 and 0 kmol·h
−1; and hydrocarbons recovery in hydrocarbons flash section decreases with the increase of MDEA flow rate.
4.1.3. Acid Gas Enrichment Section
The effect of MEDA flow rate on acid gas enrichment section was also studied, and results are presented in
Figure 3c.
The temperature and pressure of 2nd absorber gas feed is 60 °C and 300 kPa; the MDEA flow rates are varied from 1.00 × 10
5 to 1.45 × 10
5 kmol·h
−1.
Figure 3c shows that increasing MDEA flow rate increases the CO
2 composition in the enriched CO
2 gas flow, while H
2S concentration decreases. In addition, increasing MDEA flow rate also resulted in a slight decrease in CO
2 recovery rate.
4.2. The Effects of Temperature on Process Performance
Temperature is the crucial factor for the flash temperature, the change of temperature on absorption section have little effect, so this paper did not list the sensitivity analysis results, but the change of temperature has large influence on other sections, especially the 2nd flash temperature. Therefore, the effect on temperature on different sections were studied and results were shown below.
4.2.1. Hydrocarbons Flash Section
In the hydrocarbons flash section, MDEA flow rate is set as 730 kmol·h
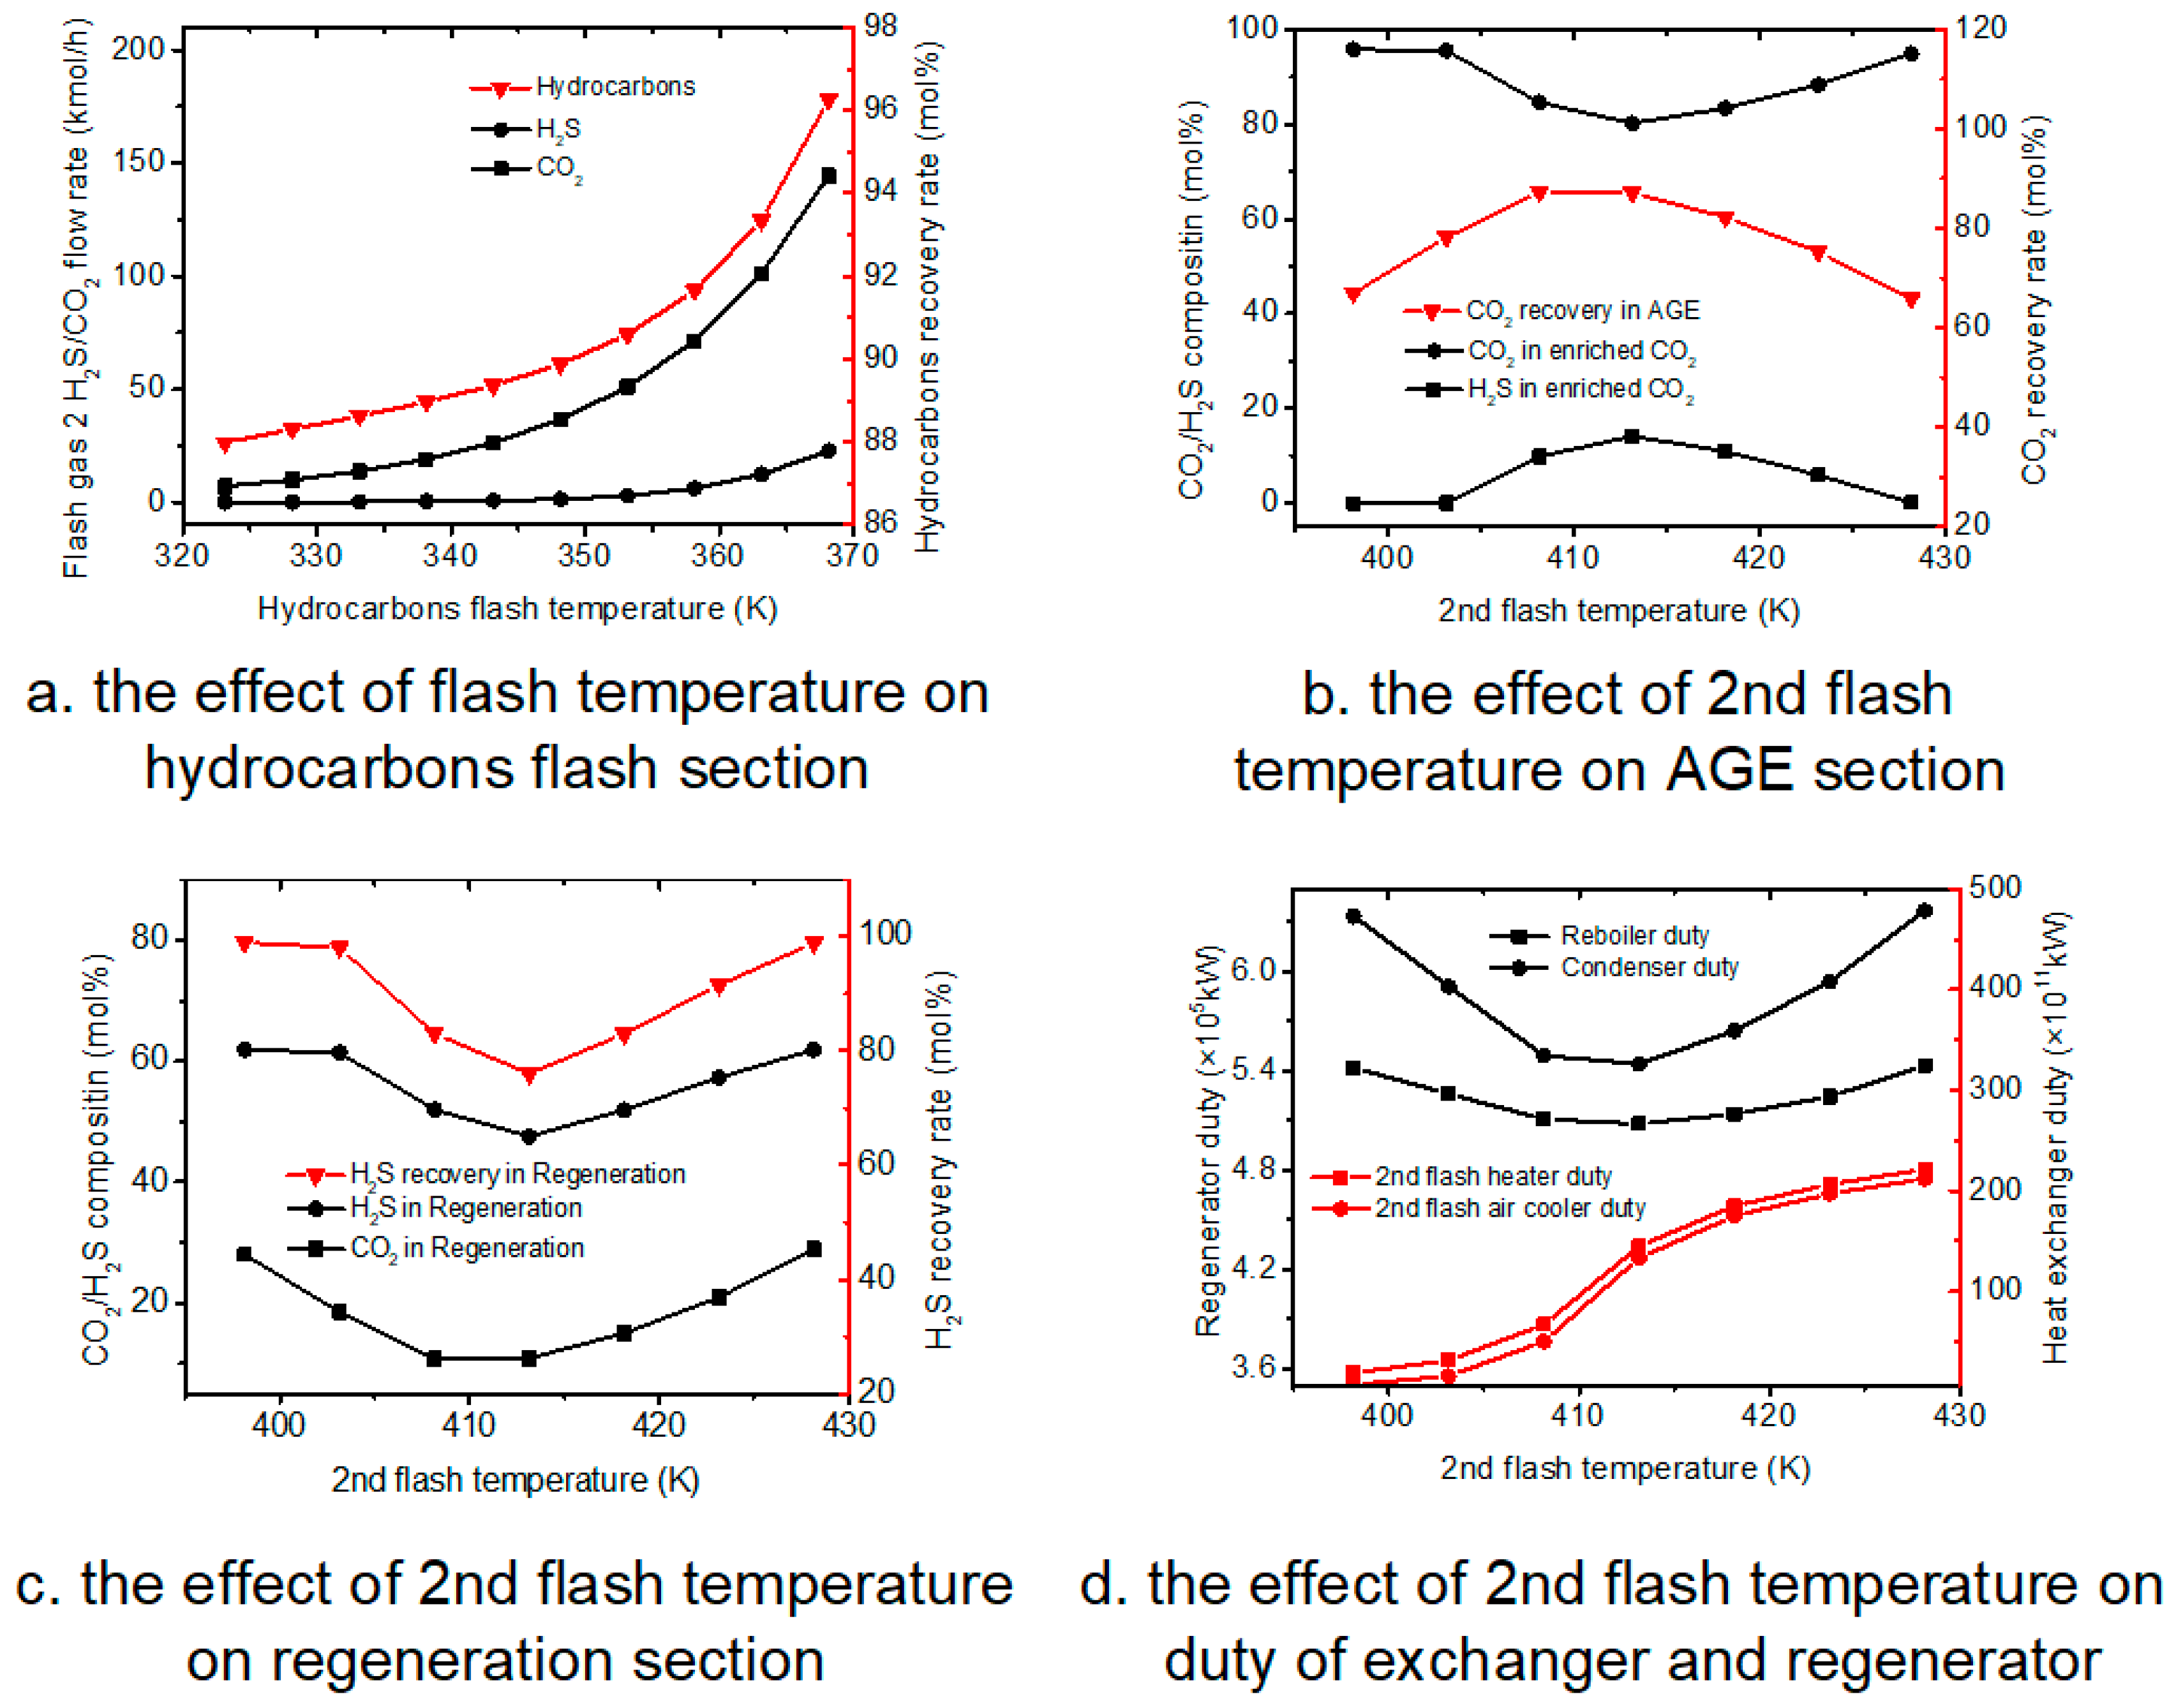
−1, and the hydrocarbons flash pressure is set as 500 kPa. The hydrocarbons flash temperature is varied from 323.15 to 368.15 K.
Figure 4a shows that, as the operation temperature increases, the flow rate of H
2S and CO
2 are both increases, while increasing T is more effective in promoting CO
2 flow rate than H
2S flow rate. On the other hand, increasing temperature also increased the hydrocarbon recovery rate. A possible explanation can be that at higher temperature conditions, the hydrocarbon solubility in the liquid absorber decreases, thus resulting in a higher hydrocarbon recovery rate.
4.2.2. Acid Gas Enrichment Section
From the
Figure 4b, as the 2nd flash temperature increases, CO
2 composition in enriched CO
2 gas first decreases while the H
2S composition increases; when 2nd flash temperature reaches 413.15 K, CO
2 composition in enriched CO
2 gas starts to increase while the H
2S composition decreases; meanwhile, the CO
2 recovery rate reaches the maximum 87.17% when the temperature is 413.15 K.
At the beginning, more CO2 and H2S enter enriched CO2 gas, meanwhile the total enriched CO2 flow rate also increases, so the CO2 in enriched CO2 remains steady while the total CO2 flow rate increases, and CO2 recovery in acid gas enrichment section also increases. With the increase of the 2nd temperature, more acid gas enters into 2nd absorber. Because MDEA flow rate is constant, more H2S enters into enriched CO2 gas, which causes the H2S composition in enriched CO2 to increase. When the temperature reaches 413.15 K, more H2O enters into the 2nd absorber, which causes the H2O composition in enriched CO2 gas to increase so that the compositions of H2S and CO2 in enriched CO2 gas decrease.
4.2.3. Regeneration Section
Figure 4c shows that as the 2nd flash temperature increases, the CO
2 and H
2S compositions in desorbed H
2S gas first decrease, then the compositions of CO
2 and H
2S start to increase when the temperature reaches 413.15 K.
Based on the results of
Figure 4b, when temperature is lower than 413.15 K, more H
2S and CO
2 enter into enriched CO
2 gas, so that the concentrations of H
2S and CO
2 in regenerator feed decrease, which can lead to the decrease of H
2S and CO
2 compositions in desorbed H
2S and total H
2S recovery. When temperature is higher than 413.15 K, more H
2S and some CO
2 is absorbed, so the concentrations of H
2S and CO
2 in regenerator feed increase, which can lead to the increase of H
2S and CO
2 compositions in desorbed H
2S and total H
2S recovery.
4.2.4. Duty of Exchangers and Regeneration
From the
Figure 4d, the duties of 2nd flash heater and air cooler have increased as 2nd flash temperature increases. Meanwhile the reboiler and condenser increase first upon increasing 2nd flash temperature, then increase when 2nd flash temperature reaches 413.15 K.
When temperature is lower than 413.15 K, more H2S and CO2 enter into enriched CO2 gas, so that the concentration of H2S and CO2 in regenerator feed decrease, which can lead to the decrease of duty of reboiler and condenser. When temperature is higher than 413.15 K, more H2S and some CO2 are absorbed, so the concentrations of H2S and CO2 in regenerator feed increase, which can lead to the increase of reboiler and condenser duty.
4.3. The Effects of Pressure on Process Performance
Pressure is an influencing factor for this process, especially the 2nd flash pressure; this paper analyzes the pressure of hydrocarbons flash section and acid gas enrichment section.
In the sensitivity analysis of the effect of flash temperature on acid gas enrichment section and regeneration section, MDEA flow rate is 13,500 kmol·h
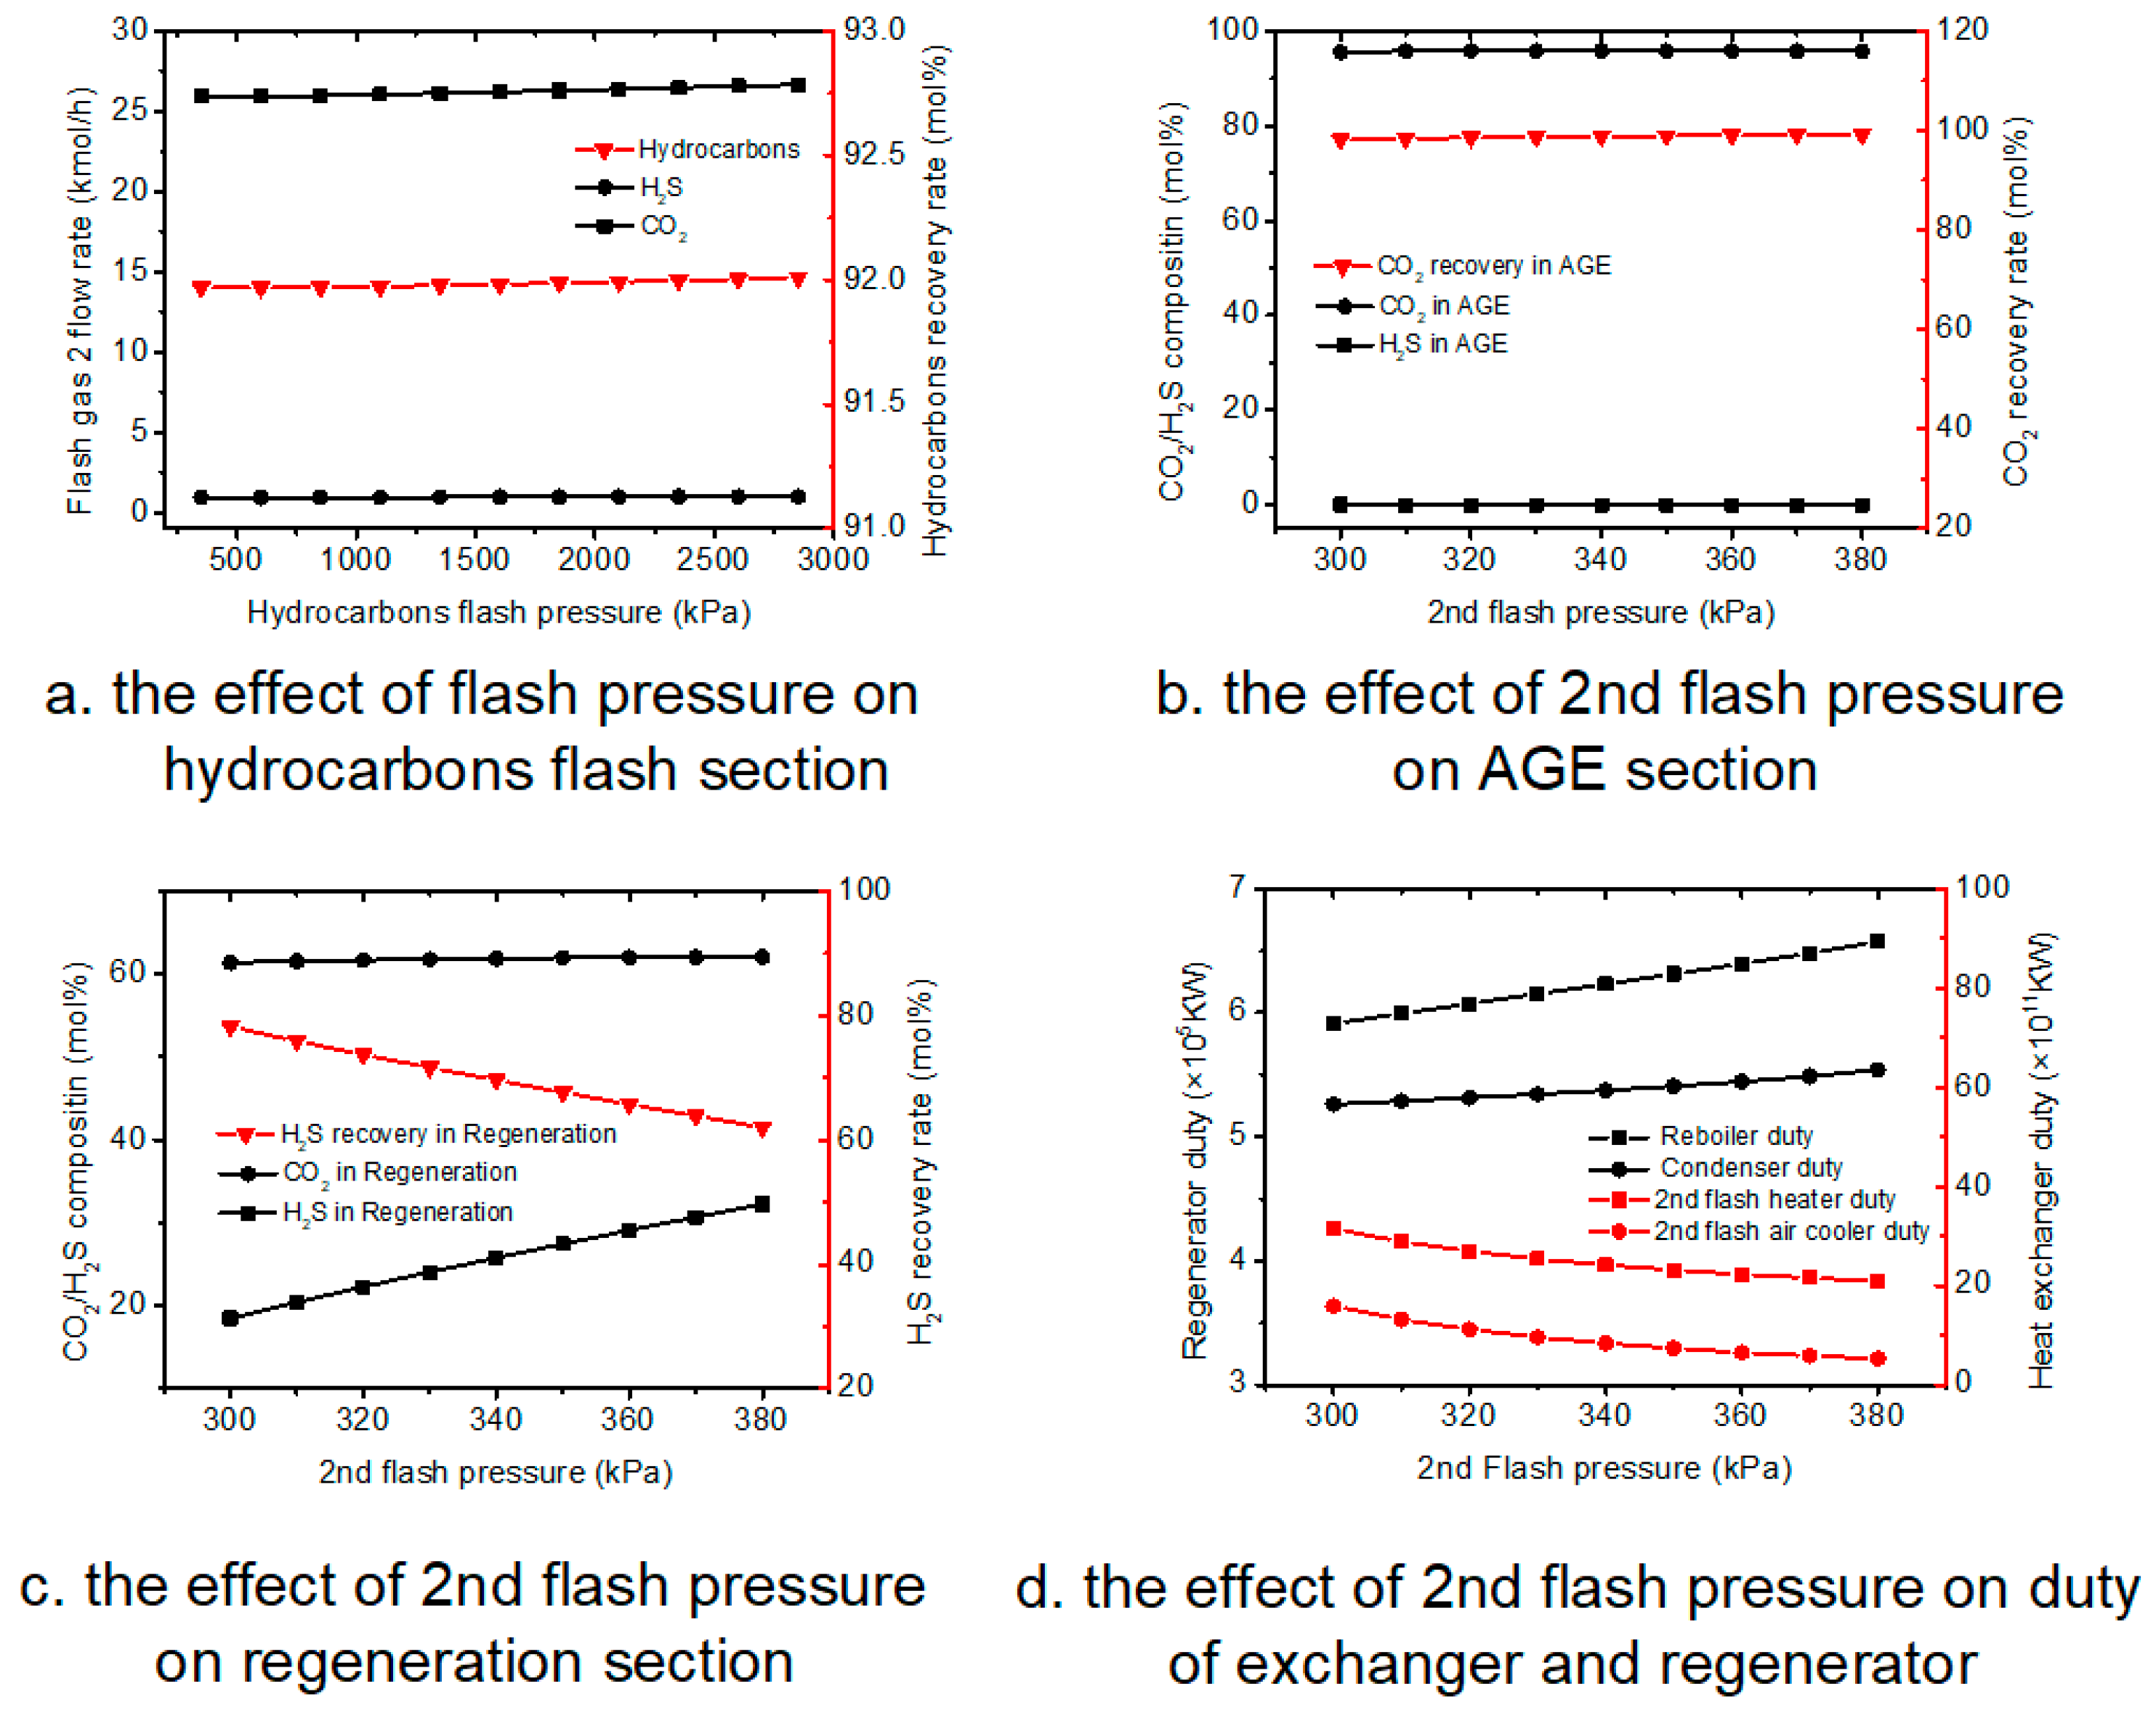
−1, and the hydrocarbons flash temperature is 130 °C, and 2nd absorber pressure is 300 kPa; the 2nd flash pressure are varied from 300 to 380 kPa. The results of sensitivity analysis are shown in
Figure 5.
4.3.1. Hydrocarbons Flash Section
As shown in
Figure 5a, with the increase of 1st flash pressure, the concentration of H
2S and CO
2 in sweet gas stabilizes at 0 and around 25 kmol·h
−1, and hydrocarbons recovery rate is also stable at around 92%.
Because the pressure has little effect on the composition of the hydrocarbons flash vapor, and the hydrocarbons flash temperature, and pressure of the hydrocarbons flash absorber is constant, the change of hydrocarbons flash pressure has no effect on the concentration of H2S and CO2 in sweet gas and the hydrocarbons recovery rate.
4.3.2. Acid Gas Enrichment Section
As shown in
Figure 5b, with the 2nd flash pressure increase, the compositions of CO
2 and H
2S in enriched CO
2 gas and CO
2 recovery rate are basically stable.
With the increase of the 2nd pressure, the CO2 and H2S compositions in 2nd absorber feed flow decrease; H2S is basically absorbed by MDEA, and most CO2 enters into enriched CO2 gas, which causes the compositions of CO2 and H2S in enriched CO2 gas and CO2 recovery rate to be basically stable.
4.3.3. Regeneration Section
As shown in
Figure 5c, with the increase of 2nd flash pressure, H
2S composition has been increasing while CO
2 composition is stable at around 61.5%, and the H
2S recovery rate has been decreasing.
With the increase of the 2nd pressure, more rich solvent enters into regenerator, more H2S and H2O will enter into desorbed H2S gas, which causes the H2S composition of desorbed H2S gas to increase; because the increase of H2O in desorbed H2S gas, the H2S recovery decreases.
4.3.4. Duty of Exchangers and Regeneration
From
Figure 5d, it can be indicated that as the increase of pressure, the duty of 2nd flash heater and 2nd flash air cooler decrease while the regenerator duty increase.
With the increase of the 2nd pressure, less 2nd flash gas enters into 2nd absorber, which causes the duties of 2nd flash heater and 2nd flash air cooler to decrease, and more acid gas enters into regenerator, which causes regenerator duty increase.
4.4. The Effects of Other Parameters on Process Performance
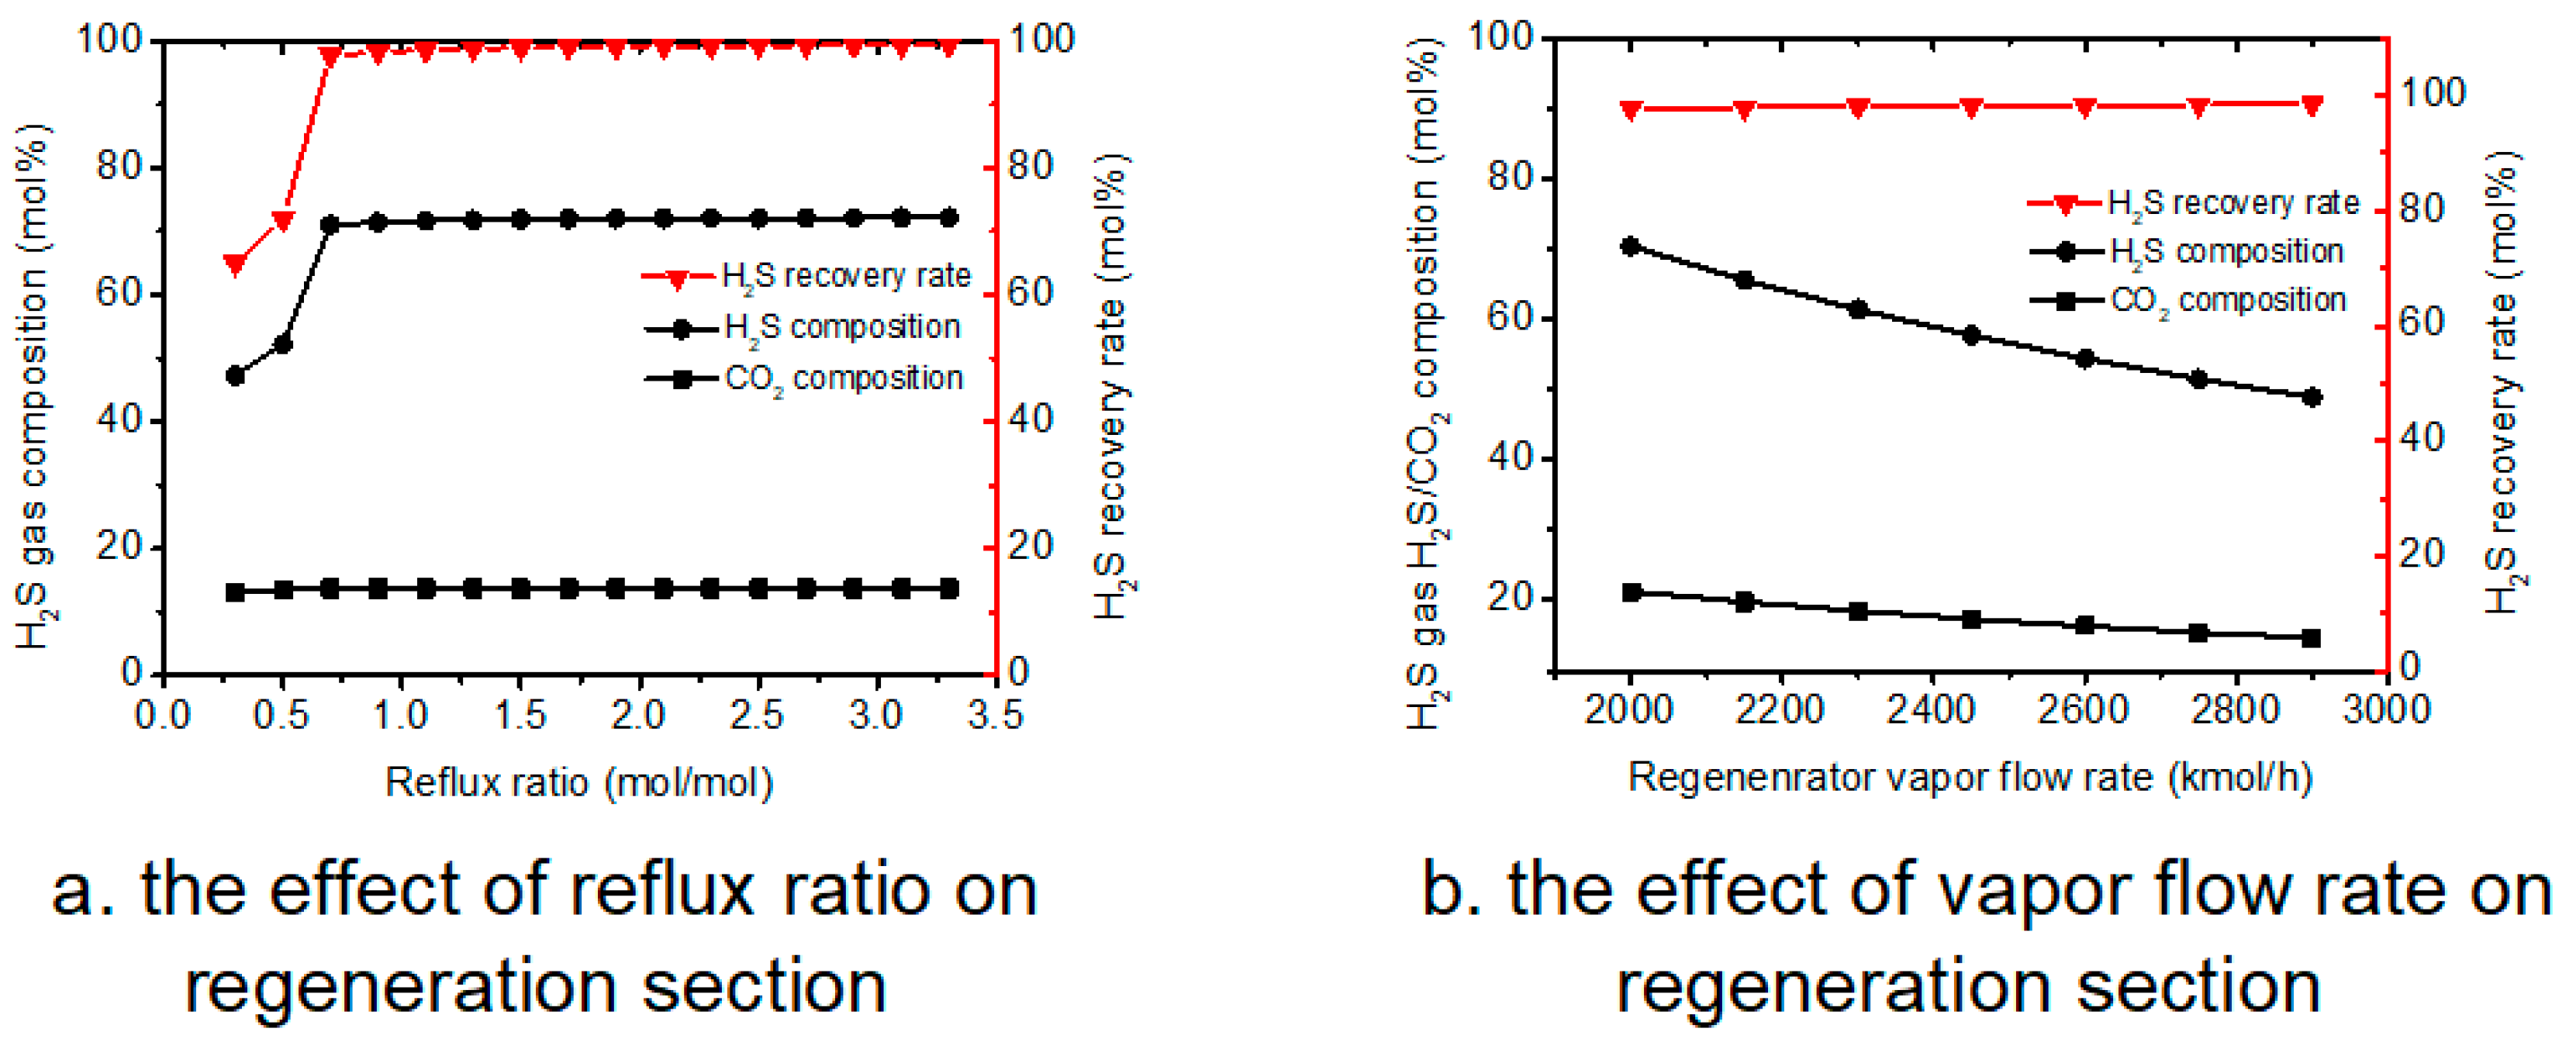
There are some other factors in this process, and some sensitivity analyses are shown in
Figure 6.
As shown in
Figure 6a, increasing reflux ratio significantly increases the H
2S composition in the H
2S gas flow and H
2S recovery rate. As the reflux ratio increased to a value of 0.8, the H
2S recovery rate was approaching 100%, denoting that almost all the H
2S moved to the gas phase; thus, further increasing the reflux ratio has a negligible effect on changing the H
2S gas flow composition.
It is known that changing vapor flow rate could also influence the H
2S gas composition and H
2S recovery rate. The effect of vapor flow rate was studied and results are shown in
Figure 6b. Based on the results, it is clear that increasing vapor flow rate could reduce both CO
2 and H
2S composition in the H
2S gas, while it could also slightly increase the H
2S recovery.
In this section, Aspen HYSYS sensitivity was used to evaluate the influence of different operating parameters in two-stage flashing process of acid gas removal. It can be indicated that (1) temperature is the most important parameter in this novel AGR process, especially the 2nd flash temperature, as it can influence the CO2 removal rate and the regenerator energy consumption. From the sensitivity results, it can be indicated that the best 2nd flash temperature is 413.15 K. (2) MDEA flow rate is another important parameter, the novel AGR process has one more absorber than traditional AGR process, so the MDEA can influence the acid gas content in sweet gas, flash gas, and 2nd absorber vapor. The best 2nd absorber MDEA flow rate is 1.35 × 10⁵ kmol·h−1. (3) Reflux ratio and vapor flow rate of regenerator can influence the H2S recovery rate; the reflux ratio and vapor flow rate of regenerator are 0.8 and 2200 kmol·h−1. (4) From the pressure sensitivity, pressure has little influence in this novel AGR process.
This paper simulates traditional acid gas removal process and novel two stage process and optimizes some of the operating parameters, but this novel two stage process is only suitable for high C/S ratio natural gas, and in future works, this novel process can consider natural gas C/S ratio approximate range, amine solvent type, and composition. Compared to the conventional AGR processes, even though this two-stage acid gas removal process has slightly higher equipment cost and maintenance cost, it has much less energy consumption than traditional AGR process; thus, it could reduce up to more than 10% separation cost. It has been reported that the membrane separation can separate acid gas more efficiently, so future work could study the energy consumption and separation cost of using membrane separation technology in AGR process.


