Article

Research on Overburden Movement Characteristics of Large Mining Height Working Face in Shallow Buried Thin Bedrock

1
School of Energy Engineering, Xi’an University of Science and Technology, Shaanxi, Xi’an 710054, China
2
Key Laboratory of Western Mine Exploitation and Hazard Prevention with Ministry of Education, Xi’an University of Science and Technology, Shaanxi, Xi’an 710054, China
*
Authors to whom correspondence should be addressed.
Energies 2019, 12(21), 4208; https://doi.org/10.3390/en12214208
Submission received: 5 August 2019 / Revised: 18 October 2019 / Accepted: 31 October 2019 / Published: 4 November 2019

Abstract

:
The overburden movement of the large mining height working face of shallow buried thin bedrock (SBTB) is a complex engineering problem with “time-space-intension”, which is of great significance to realize efficient and safe mining in the northern Shaanxi mining area. Based on the research object of No. 22201 working face in Zhangjiamao Coal Mine, the roof structure characteristics of large mining height working face in SBTB are researched by field drilling measurement, laboratory test, physical and numerical simulation. The results show that: (1) Based on the measured data of the drillholes, it is concluded that under the mining conditions of SBTB with large mining height, the roof movement is ahead of the weighting of the working face, and the working resistance has a significant time effect. The advanced movement distance is about 20 m, which can be used as an early warning index of the weighting. The lag movement distance in the roof with horizon of 30 m is two periodic weighting intervals, which are about 26 m. (2) The first weighting interval of the working face is 32 m. The roof first break has obvious step sinking phenomenon, and the measured surface appears at a position 45 m away from the transport slot. It is statistically concluded that the periodic weighting interval is 9.5~16.5 m, the average weighting interval is 13 m, which is equivalent to the periodic dynamic crack spacing of the surface. (3) The results of field measurement and physical simulation show that the breaking angle of the roof of the No. 22201 large mining height is about 66°, and the periodic stepping distance of the T-junction suspension area is 6~8m. Along the strike of the working face, the roof breaking is mainly arc arched. The research results ensure the safe and green mining of shallow coal seam.

1. Introduction

Shallow coal seam is characterized by shallow buried depth (less than 100~150 m depth), and it is divided into typical shallow buried coal seam and near shallow buried coal seam [1,2]. Underground mining of shallow buried coal seam is mainly distributed in China [1], USA, Poland, Australia, England, India, etc., [3,4,5,6]. The practice of mining in shallow coal seams shows that the dynamic surface of the working face is obvious during the mining process [1,7,8], and the roof is performed to strong mining pressure such as step sinking [9,10,11,12], especially in the special geological conditions such as thin bedrock [13], gully terrain [14], concentrated coal pillars [15,16,17,18], surface subsidence [19,20,21] and water protection mining [22,23,24,25,26]. With the improvement of comprehensive mechanization technology of large mining height, it has been widely popularized and applied in China, especially the Shenfu mining area is widely used in recent decades. The thick coal seams in the mining area of the Jurassic coal field in northern Shaanxi are mainly No. 2-2 coal seam and No. 5-2 coal seam [1,2], as shown in Figure 1 (the red dot represent the research area in the figure).
For the control theory of stope rock strata for shallow buried high mining working face, there are Qian et al. [27,28] “Voussoir Beam” theory, Huang “Asymmetric Triple Hinge” structural model [1,29], periodic pressure of “short voussoir beam” [30] and "step rock beam" structural [10], reveal the mechanism of the immediate roof thickening of the large mining height working face and the upward movement of the hinge point of the overburden structure. Gong et al. [31,32] proposed a “trapezoidal body” structure for overburden damage in large mining height, and partitioned the deformation and failure characteristics of the structure. Xu et al. [15,16,33] gave three kinds of movement patterns of the key stratum “cantilever beam” of large mining height working face in shallow buried, and considered that the movement of the overburden changes periodically with the breaking of the main key stratum. Tu et al. [17,34] according to the characteristics of strong mine pressure in stope of large mining height working face, they put forward the concept of the direct mining key stratum of large mining height, and preliminarily established the relationship model of support surrounding rock of “W-R-F-S”. Liu [35] and Wang et al. [36] analyzed the overburden structure characteristics and support compression accident of hard roof coal seam with large mining height, and obtained the calculation method of working resistance of cantilever beam and support in key stratum of direct roof. Zhang [37] and Jiang et al. [38] have carried out research on the characteristics of overlying strata movement and roof structure of large mining height working face. Restricted by the field measurement factors, Scholars mainly based on the single method of support load measurement, or combined with the physical and numerical simulation methods, so that the law of roof structure movement is rarely measured by the field. The time-space relationship between the law of overburden movement and the mining pressure is not systematically studied.
Authors take the No. 22201 working face of No. 2 coal seam in Zhangjiamao Coal Mine of Shennan Mining area as the background. By using the method of field drilling measurement, field mine pressure statistics, physical simulation and numerical simulation experiments, in order to research the law of mine pressure appearance and the characteristics of overburden movement structure of large mining height working face in SBTB. The research results enrich and improve the control theory and technology of large mining height in shallow coal seam, ensure safe and efficient mining, and provide reference significance for similar working face mining.

2. The Experimental Methods

2.1. Field Measurement Plan Design

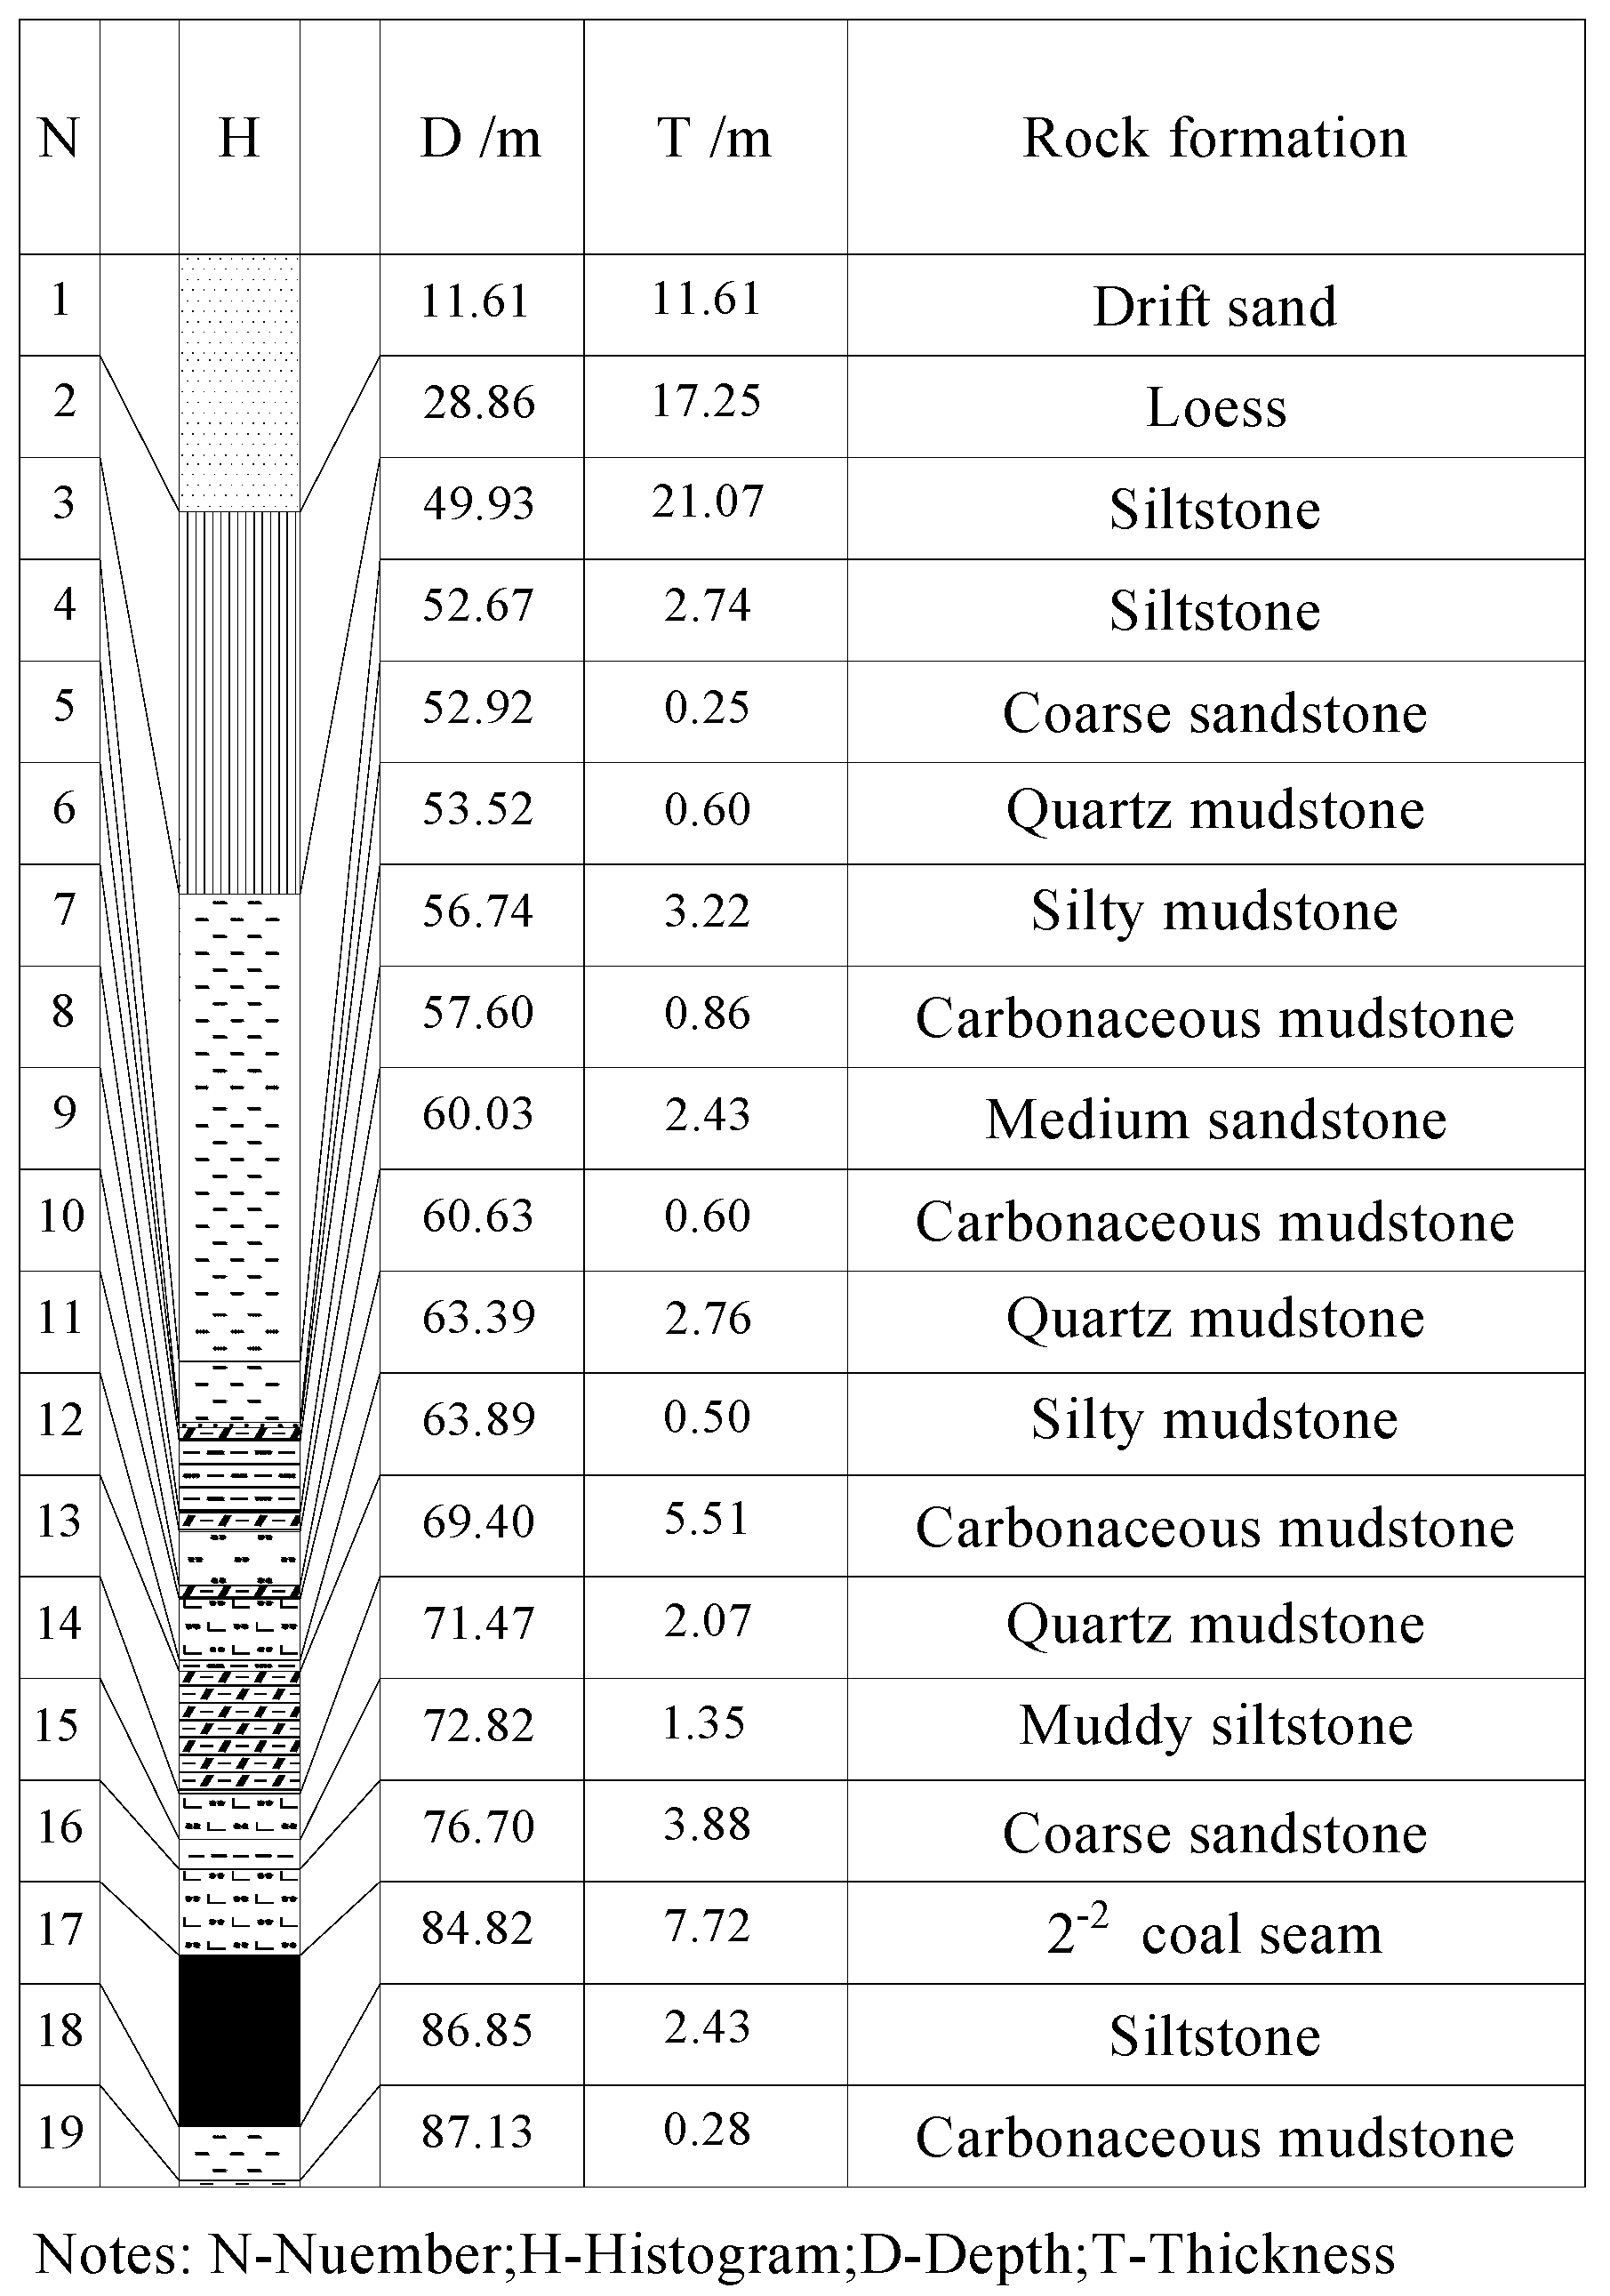
The No. 22201 working face is the first working face of No.2-2 coal seam in Zhangjiamao Coal Mine. The average buried depth is 95 m, the thickness of the coal seam is 7.3~9.6 m, the mining height is 6.0m, the face length is 252 m and mining distance is 1739 m, the inclination angle is 1~2 degrees. Through the drilling statistics near the working face, it is concluded that the No. 22201 working face belongs to the typical SBTB with large mining height and fully mechanized mining face. The 176 drillhole histogram, as shown in Figure 2.
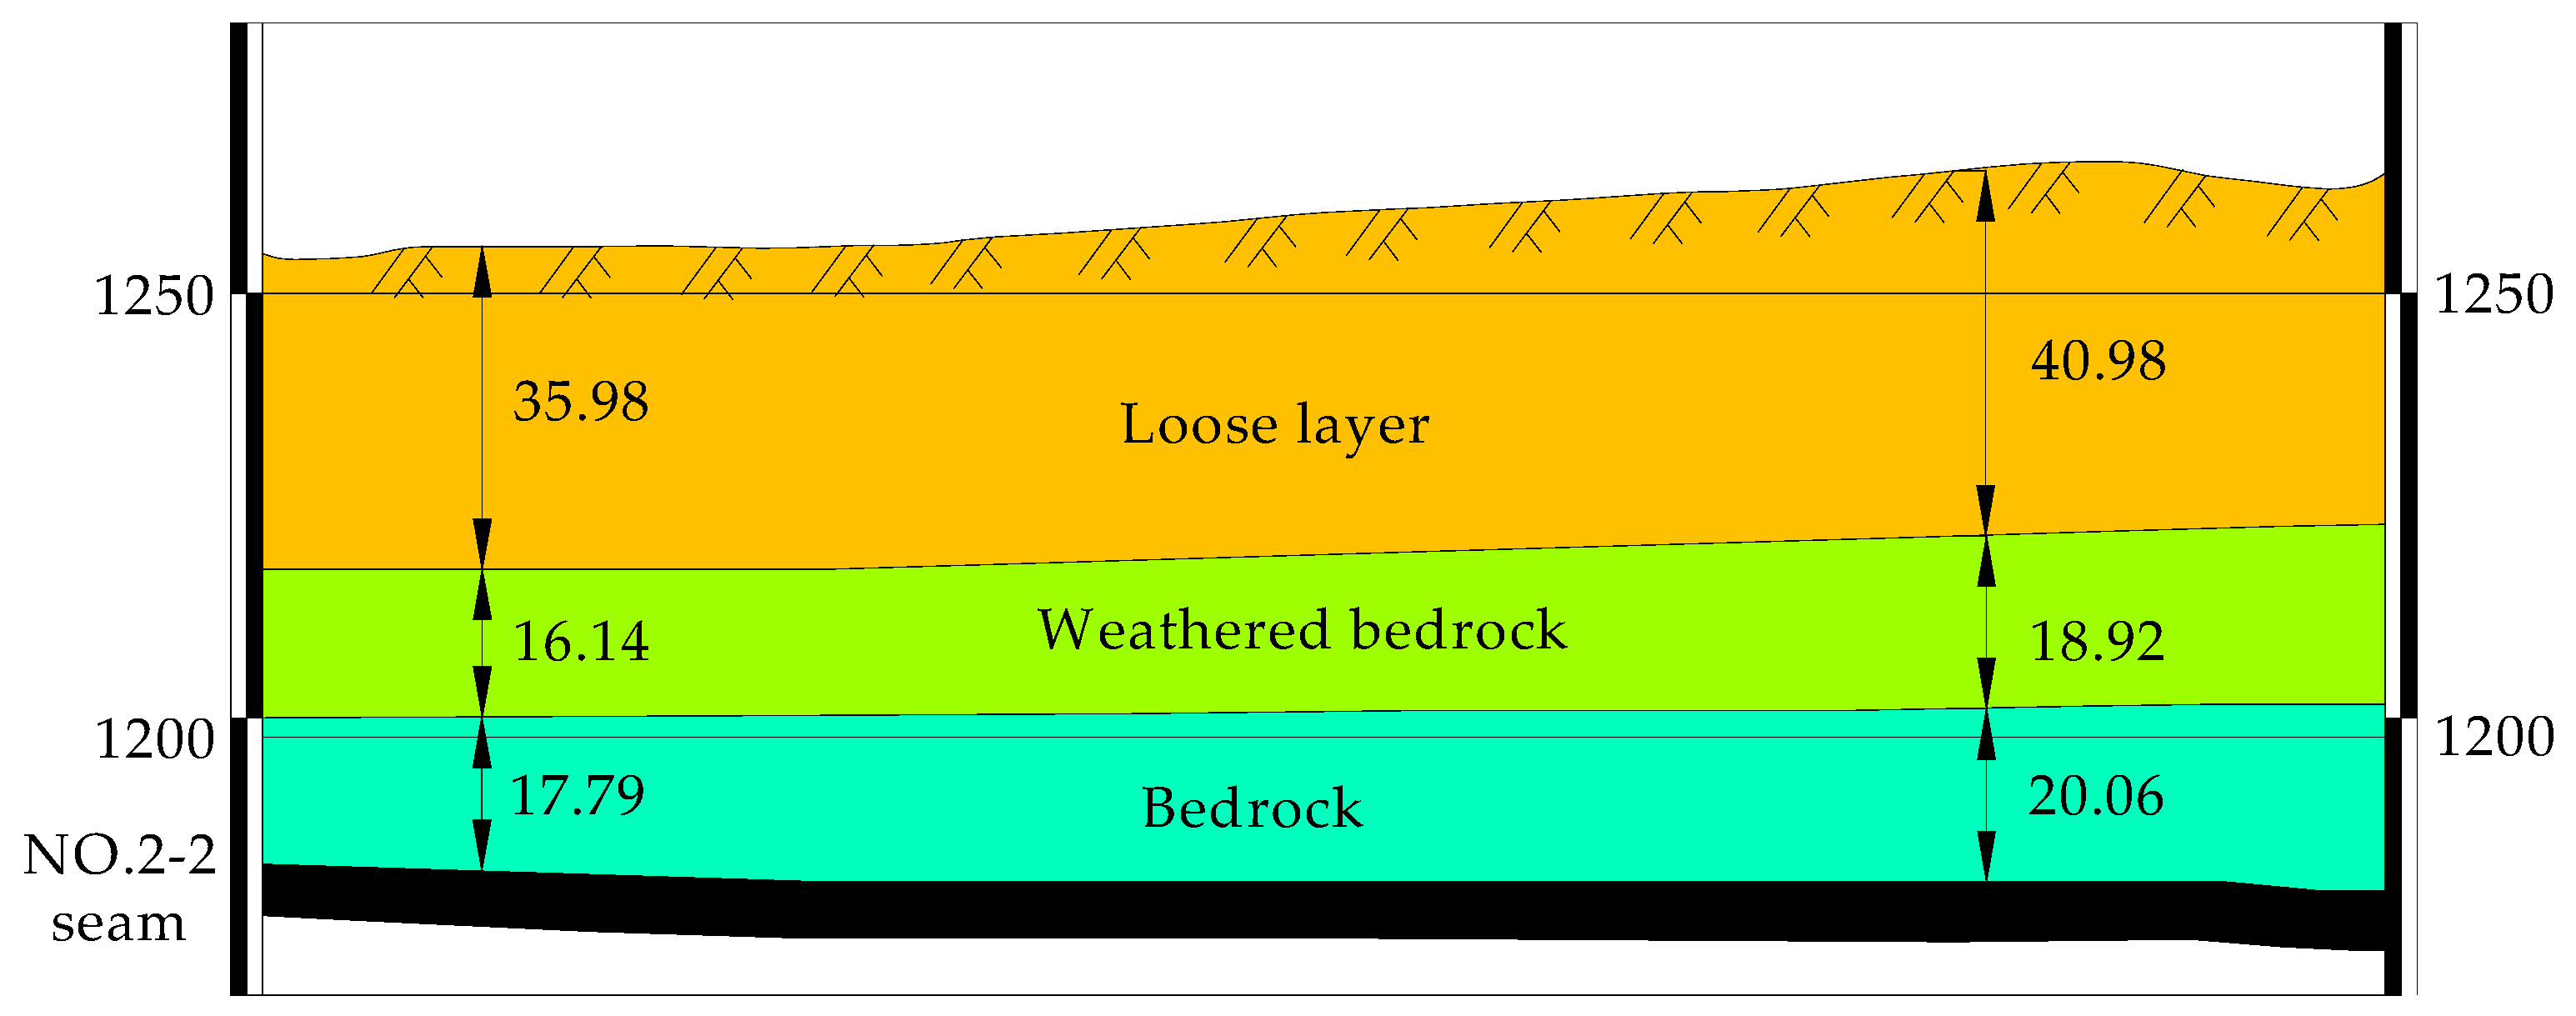
According to the drilling data, the thickness of the bedrock in the overburden is about 18m, the thickness of the weathered bedrock is about 20 m, and the thickness of the loose horizon is about 40 m (Figure 3). The roof fracture is fierce, which may lead to strong mine working resistance disasters in shallow coal seam mining. Therefore, it is of great significance to carry out the observation of the roof breaking law and establish the roof structure model and reveal the working resistance mechanism.
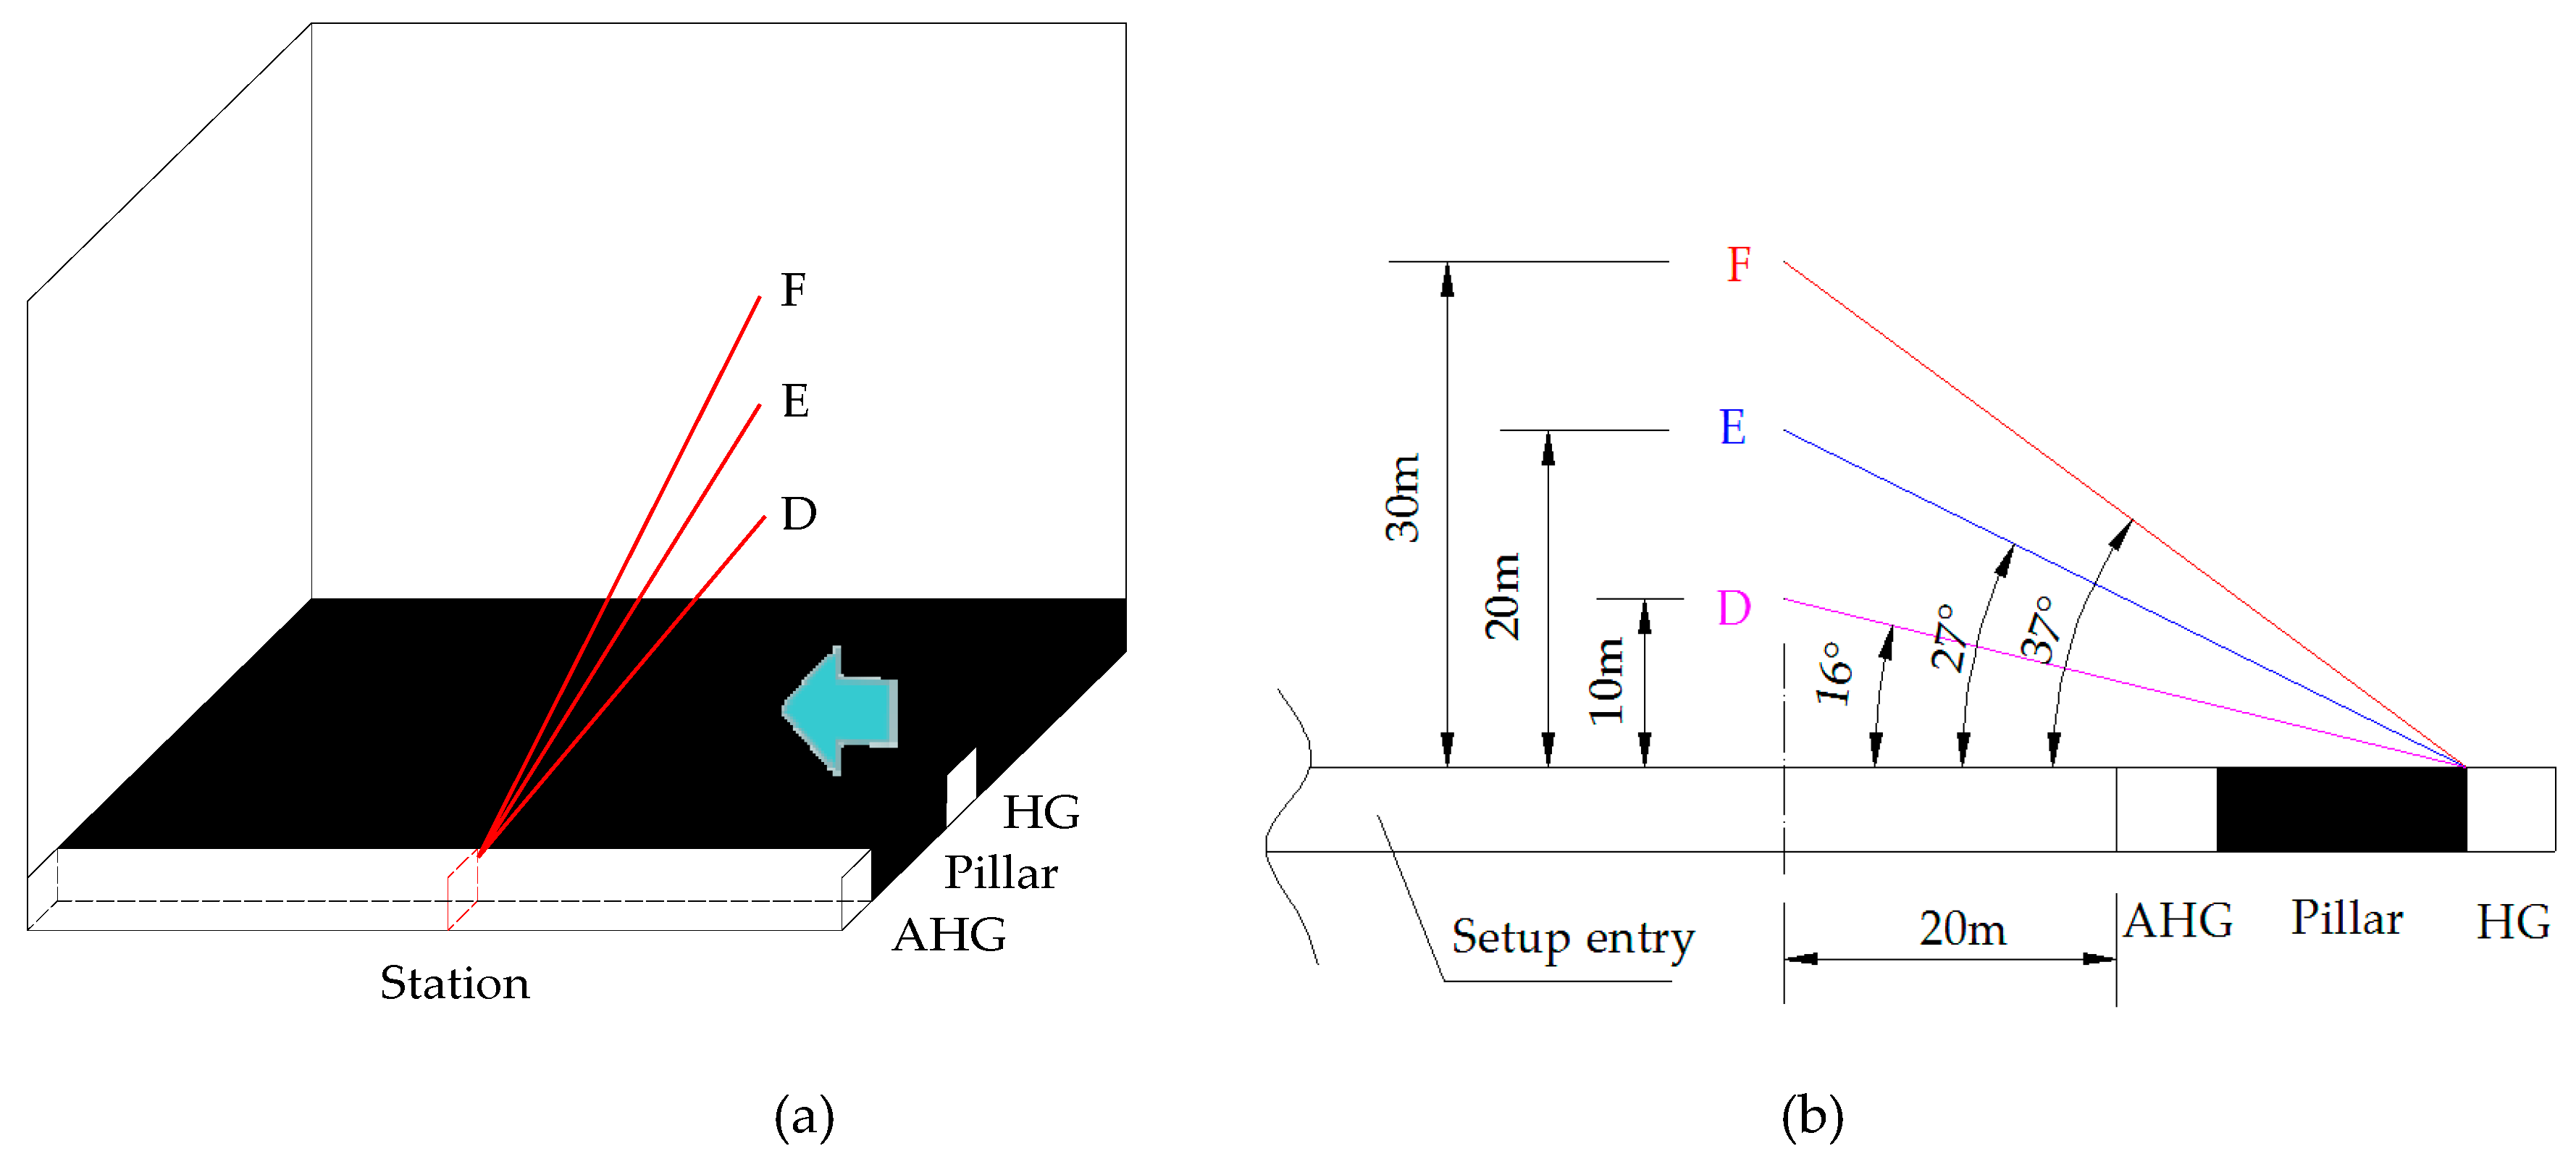
In order to grasp the roof breaking law of the different horizons of the No. 22201 working face in mining, three stations are located in 28 m, 58 m and 88 m in front of the setup entry, drilling holes into the roof along the auxiliary headgate gateway (AHG), as shown in Figure 4. The observation drillholes include displacement observation dirllholes and peeping dirllholes. Arrange the displacement measuring points along the roof with horizon 10 m, 20 m and 30 m, and contain the first weighting and periodic weighting motion of the roof. Through the drilling peep and the displacement of the different horizon base points in the hole, the breaking process of the roof is observed.
Through the YCJ90/360 mining drillhole instrument, the angle and depth of the drillhole were sampled in the AHG. The flat section of the system is shown in Figure 5. The drilling holes in site construction consistent with the design requirements, ensure the reliability and authenticity of subsequent data analysis.
At the same time, the yield pressure monitoring report of the working face console and the reading of the data of the hydraulic support column (Figure 6) can be used to more accurately grasp the pressure of the bracket for subsequent analysis.

2.2. Physical Simulation Experiment

2.2.1. Physical Mechanics Parameter Determination

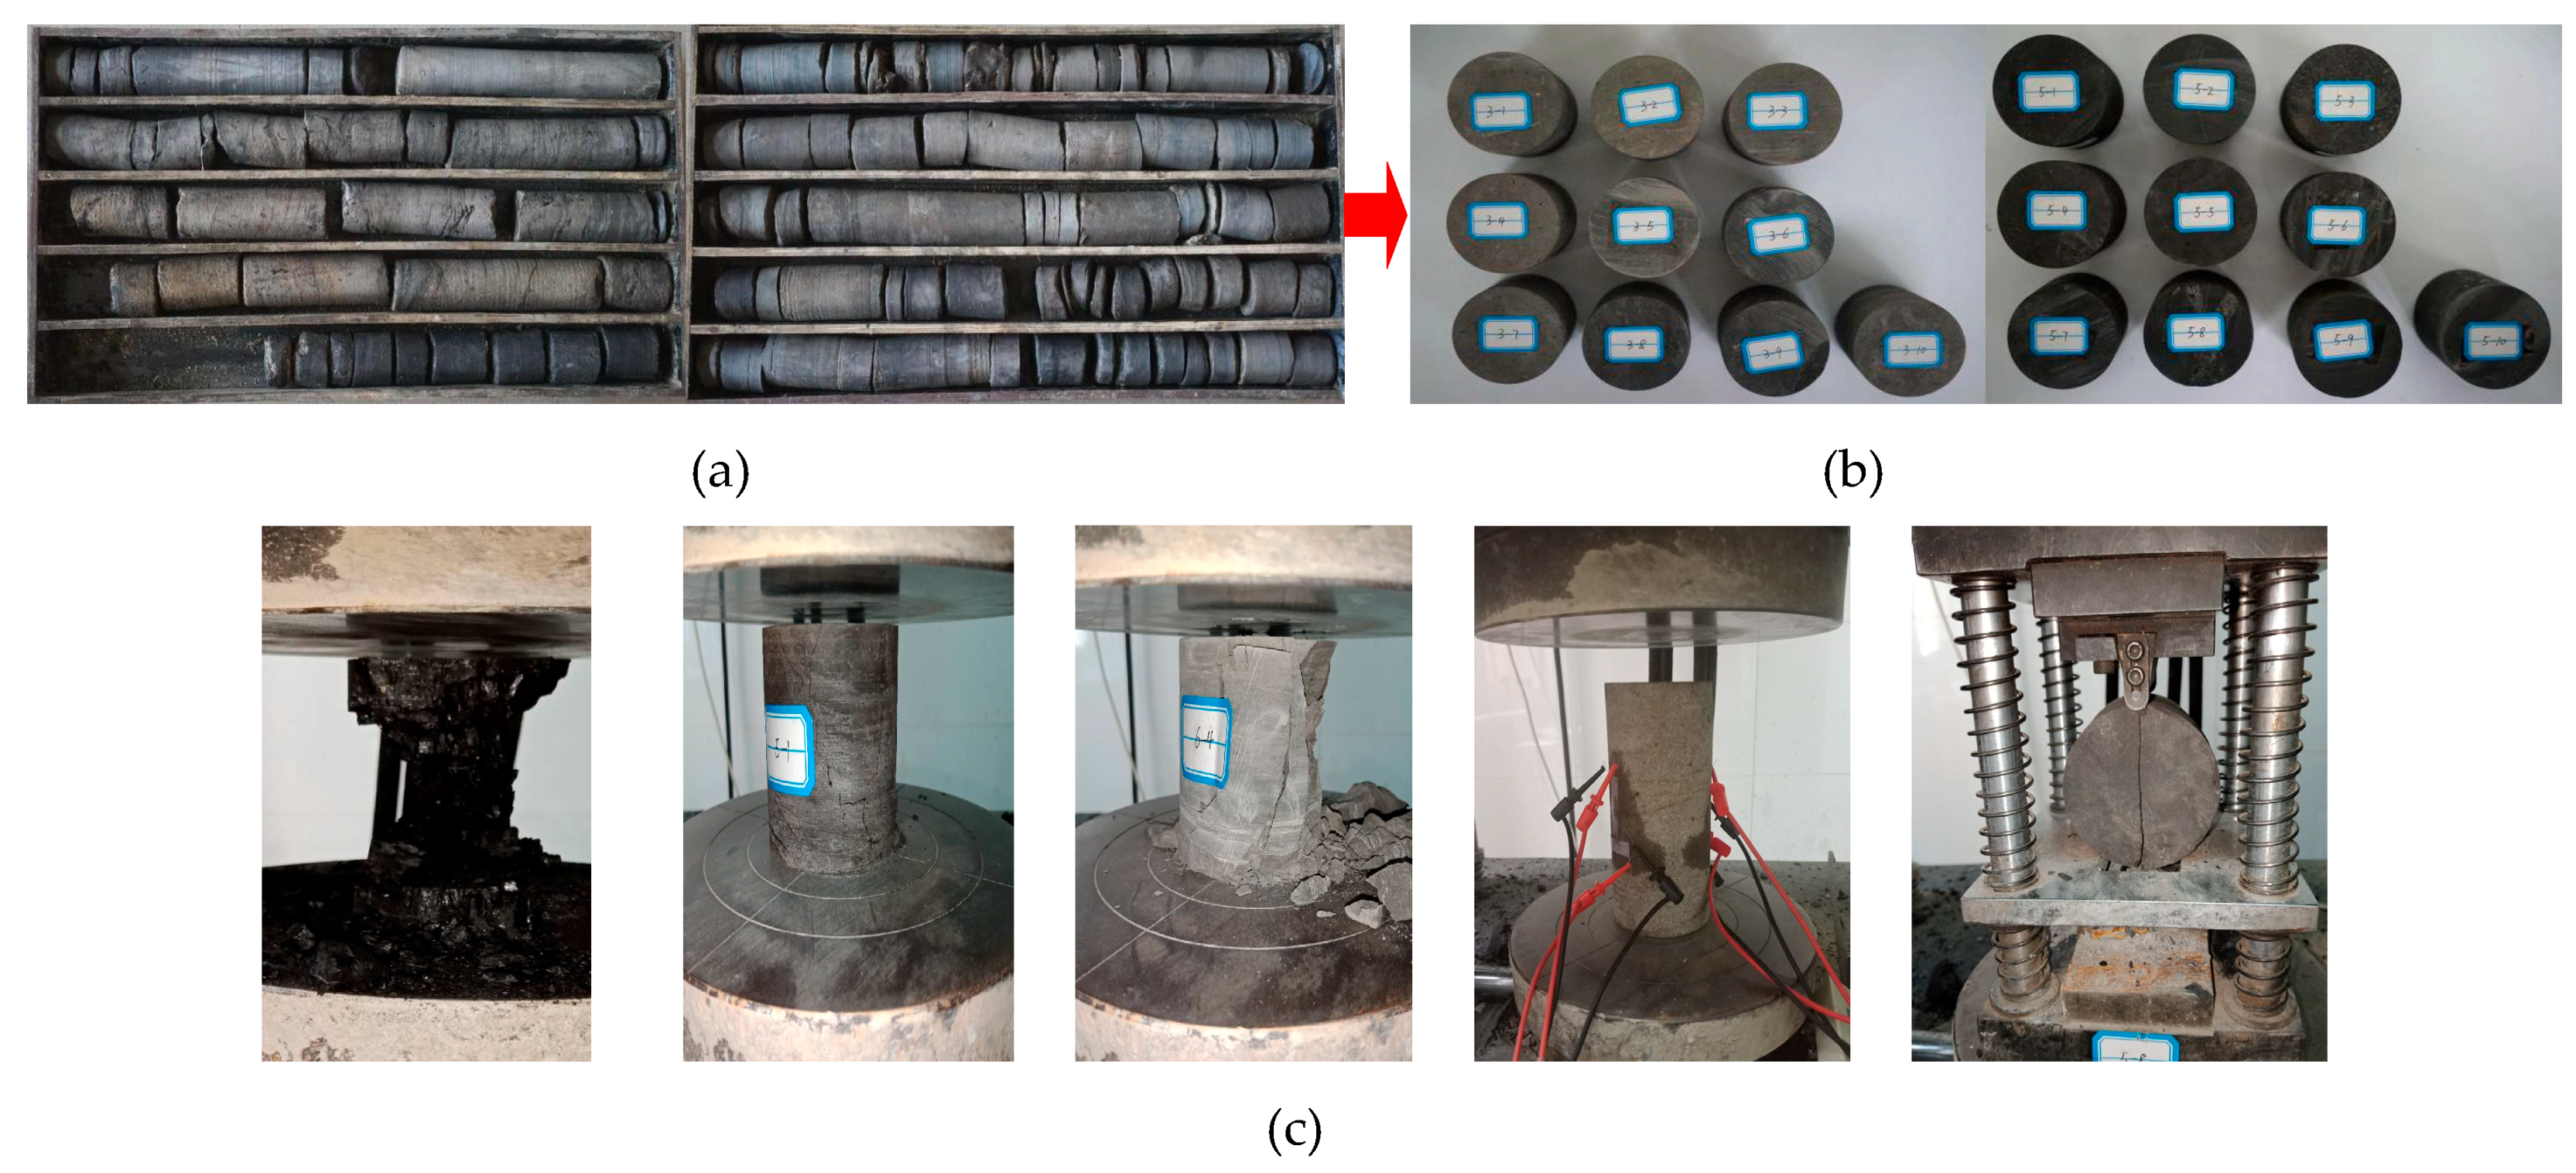
In the middle of the No. 22201 working face, the cores are drilled to the top coal and overburden, in order to obtain more complete rock sample, and measuring mechanical parameters in the laboratory. Mainly measured the compressive strength, tensile strength, elastic modulus and poisson’s ratio of coal rock mass, experimental results as shown in Figure 7 and Table 1.
The micro-structures of rock are formed by the combination of particles of different mineral components in a certain order. The micro-structures of the rock affect the physical and mechanical parameters, such as compressive strength, permeability and weathering. In this paper, the lithology in Table 1 is scanned by scanning electron microscope (SEM) from the School of Chemical Engineering, Xi’an University of Science and Technology. The results are shown in Figure 8.
According to the analysis of Figure 8a–f, due to the particle distribution between particles in coal and rock, uneven distribution of cement, obvious pores are formed. The coarse grain sandstone has larger particle size and the particles maintain a relatively intact original geometry. Comparing the distribution uniformity of the three kinds of rocks, the mudstone and siltstone are muddier and more uniform than the coarse sandstone. Figure 8g–h shows when the energy of the scanning electron microscope is 15KV, the weathered rock (siltstone) are broken down and cannot be observed. Therefore, when the energy is reduced to 10KV, the weathered bedrock fissures develop significantly and their strength naturally decreases. The results of SEM showed that with the increase of weathered degree, the degree of muddy rock increases and the strength decreases gradually, which is consistent with the results of mechanical experiments.

2.2.2. Physical Simulation Scheme

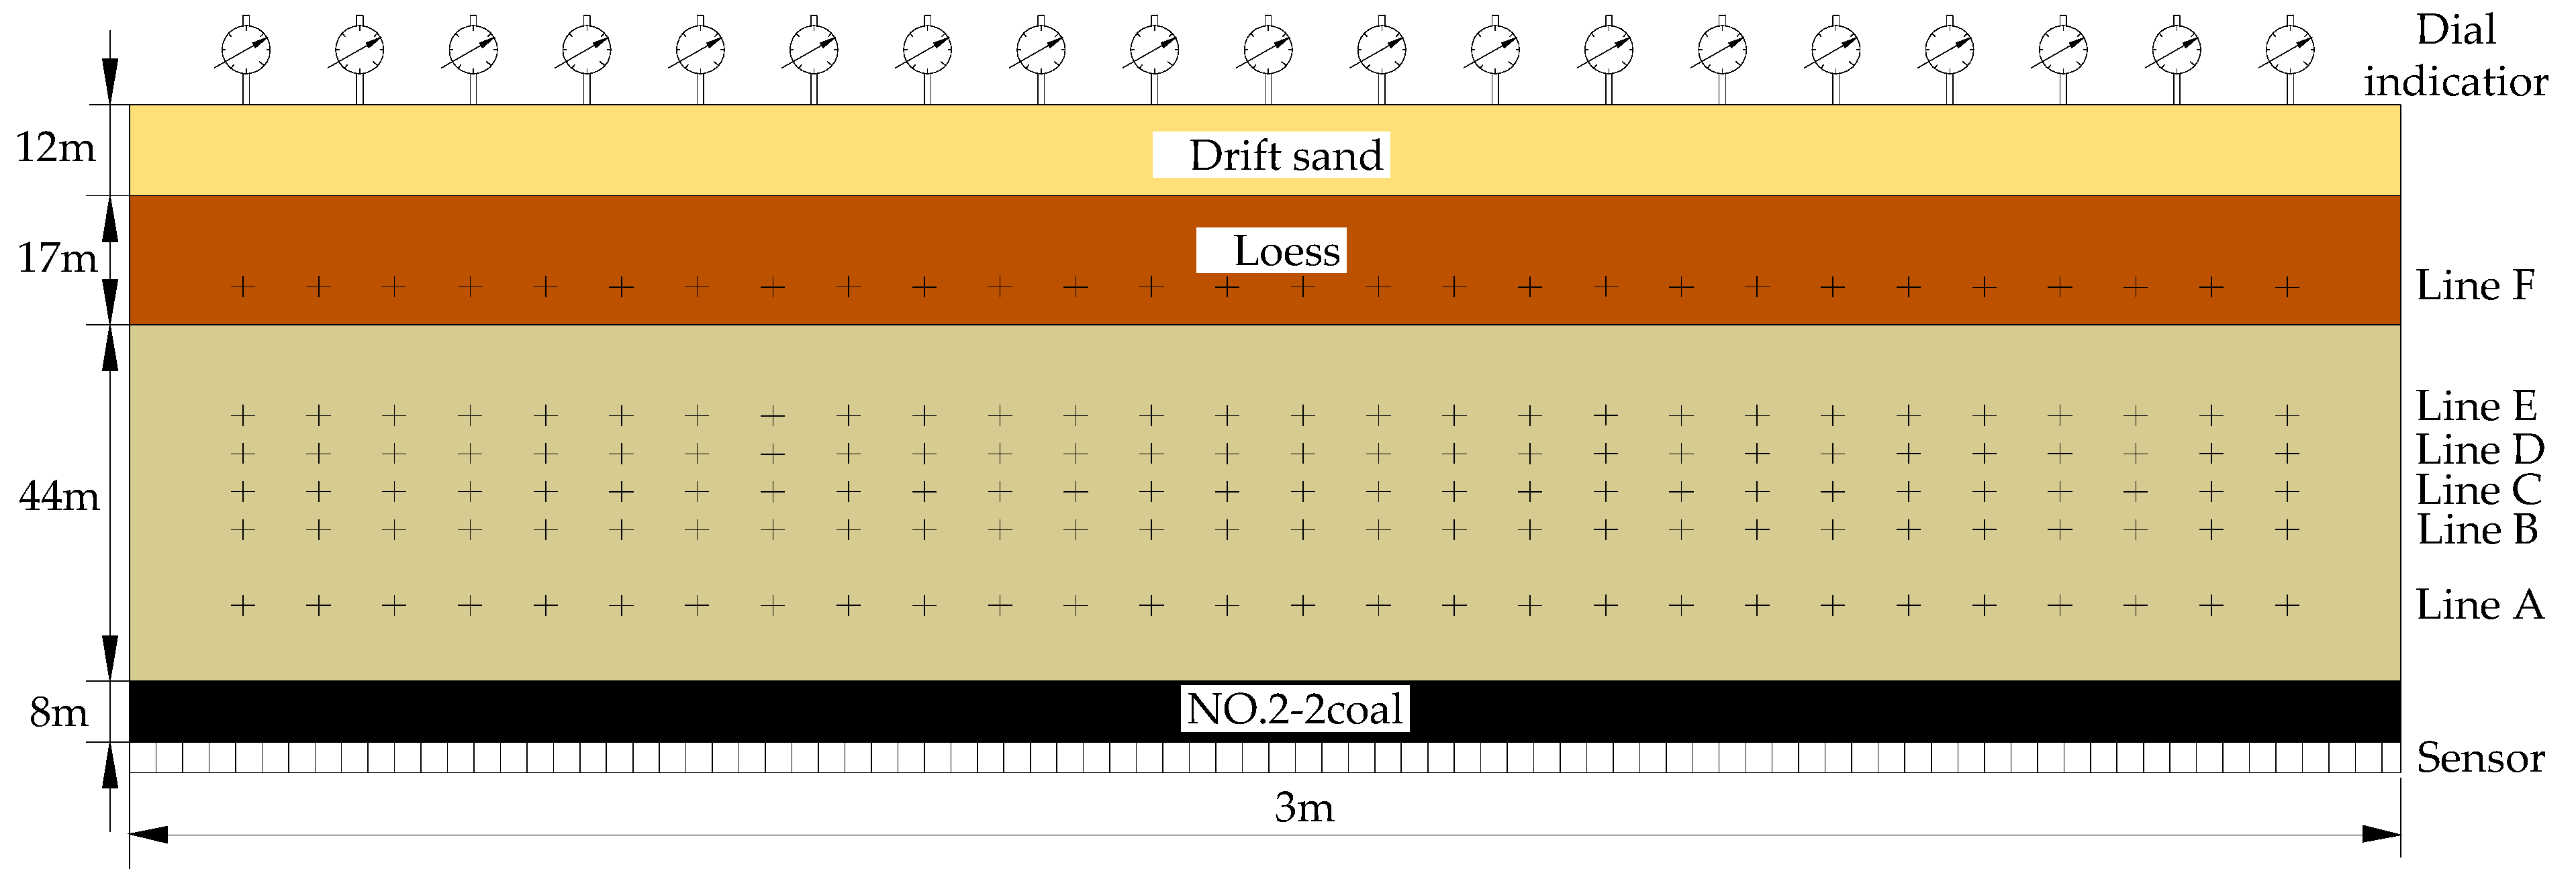
The experiment takes the large mining height mining of No. 22201 working face as the prototype, and establishes the plane strain physical model. In order to better reflect the damage characteristics of the overburden, some modification and simplifications have been made, based on the strata lithology form the Table 1. The simulation experiment is carried out with 1:100 geometric similarity ratio. The dimensions of 3.00 m long × 0.30 m wide × 0.84 m high. The major similarity coefficients were chosen as follows: α l is 100, bulk density ratio α γ is 1.5 and α R strength ratio is 150. The physical simulation experimental material ratio of No. 22201 working face as listed in Table 2.
As shown in Figure 9, the wireless stress sensor is installed on the floor of the model coal seam to monitor the stress in the mining process in real time. Converted to the prototype value, the pressure law and the distribution law of the supporting pressure in the working face are obtained, and the first weighting and the period weighting intervals are determined. A total of 6 measuring lines (Line A~Line F) were arranged at different horizons of the model, which were located at 10 m, 20 m, 25 m, 30 m, 35 m and 60 m (5 m from the lower part of the red soil horizon) above the roof. The displacement of the actual rock mass was converted into the displacement of the actual rock mass according to the geometric similarity ratio, and the subsidence law of the bedrock in different strata was obtained. Meanwhile, the subsidence curves of the surface are given by using the dial indicator. The instruments required during the experiment are shown in Figure 10.

2.3. Numerical Simulation Modeling

Performing of 3D/2D numerical simulations is much less time (and money) consuming than performing in situ or physical modeling. Combined with the 22201 working face background, the numerical model was built with dimensions of 300 m long×90 m high by the UDEC2D software. The thickness of the coal seam was 6m, the brick length in the immediate roof was set to 2 m, the brick length in the immediate floor was set to 5 m, the brick length in the main roof was set to 5 m, and the brick length in the weathered roof was set to 16 m. The Mohr-Coulomb constitutive relation was adopted. The physical and mechanical parameters of the overlying strata and the coal seam were chosen according to the Table 1. In the numerical simulation model, mining started 50m from the model boundary to eliminate boundary effect and in step of 2 m.
The bulk modulus (K), shear modulus (G), normal stiffness (Kn) and shear stiffness (Ks) for contacts in the numerical model can also be calculated as follows [39,40]: K=E/3(1-2μ), G=E/2(1+2μ), Kn =10(K+4G)/ΔZmin, Ks=0.4Kn, where ΔZmin represents the smallest width of the zone adjoining the contact in the normal direction [39,40].
UDEC numerical simulation software is used to simulate and analyze the collapse process of the roof under normal mining of the working face. It is important to find out the rock overburden collapse rule of 22201 working face, and compare the numerical simulation results with the measured and physical simulation results, and get more accurate simulation results.

3. Roof Structural Shape Measured Results

3.1. The Law of Mining Resistance in No. 22201 Working Face

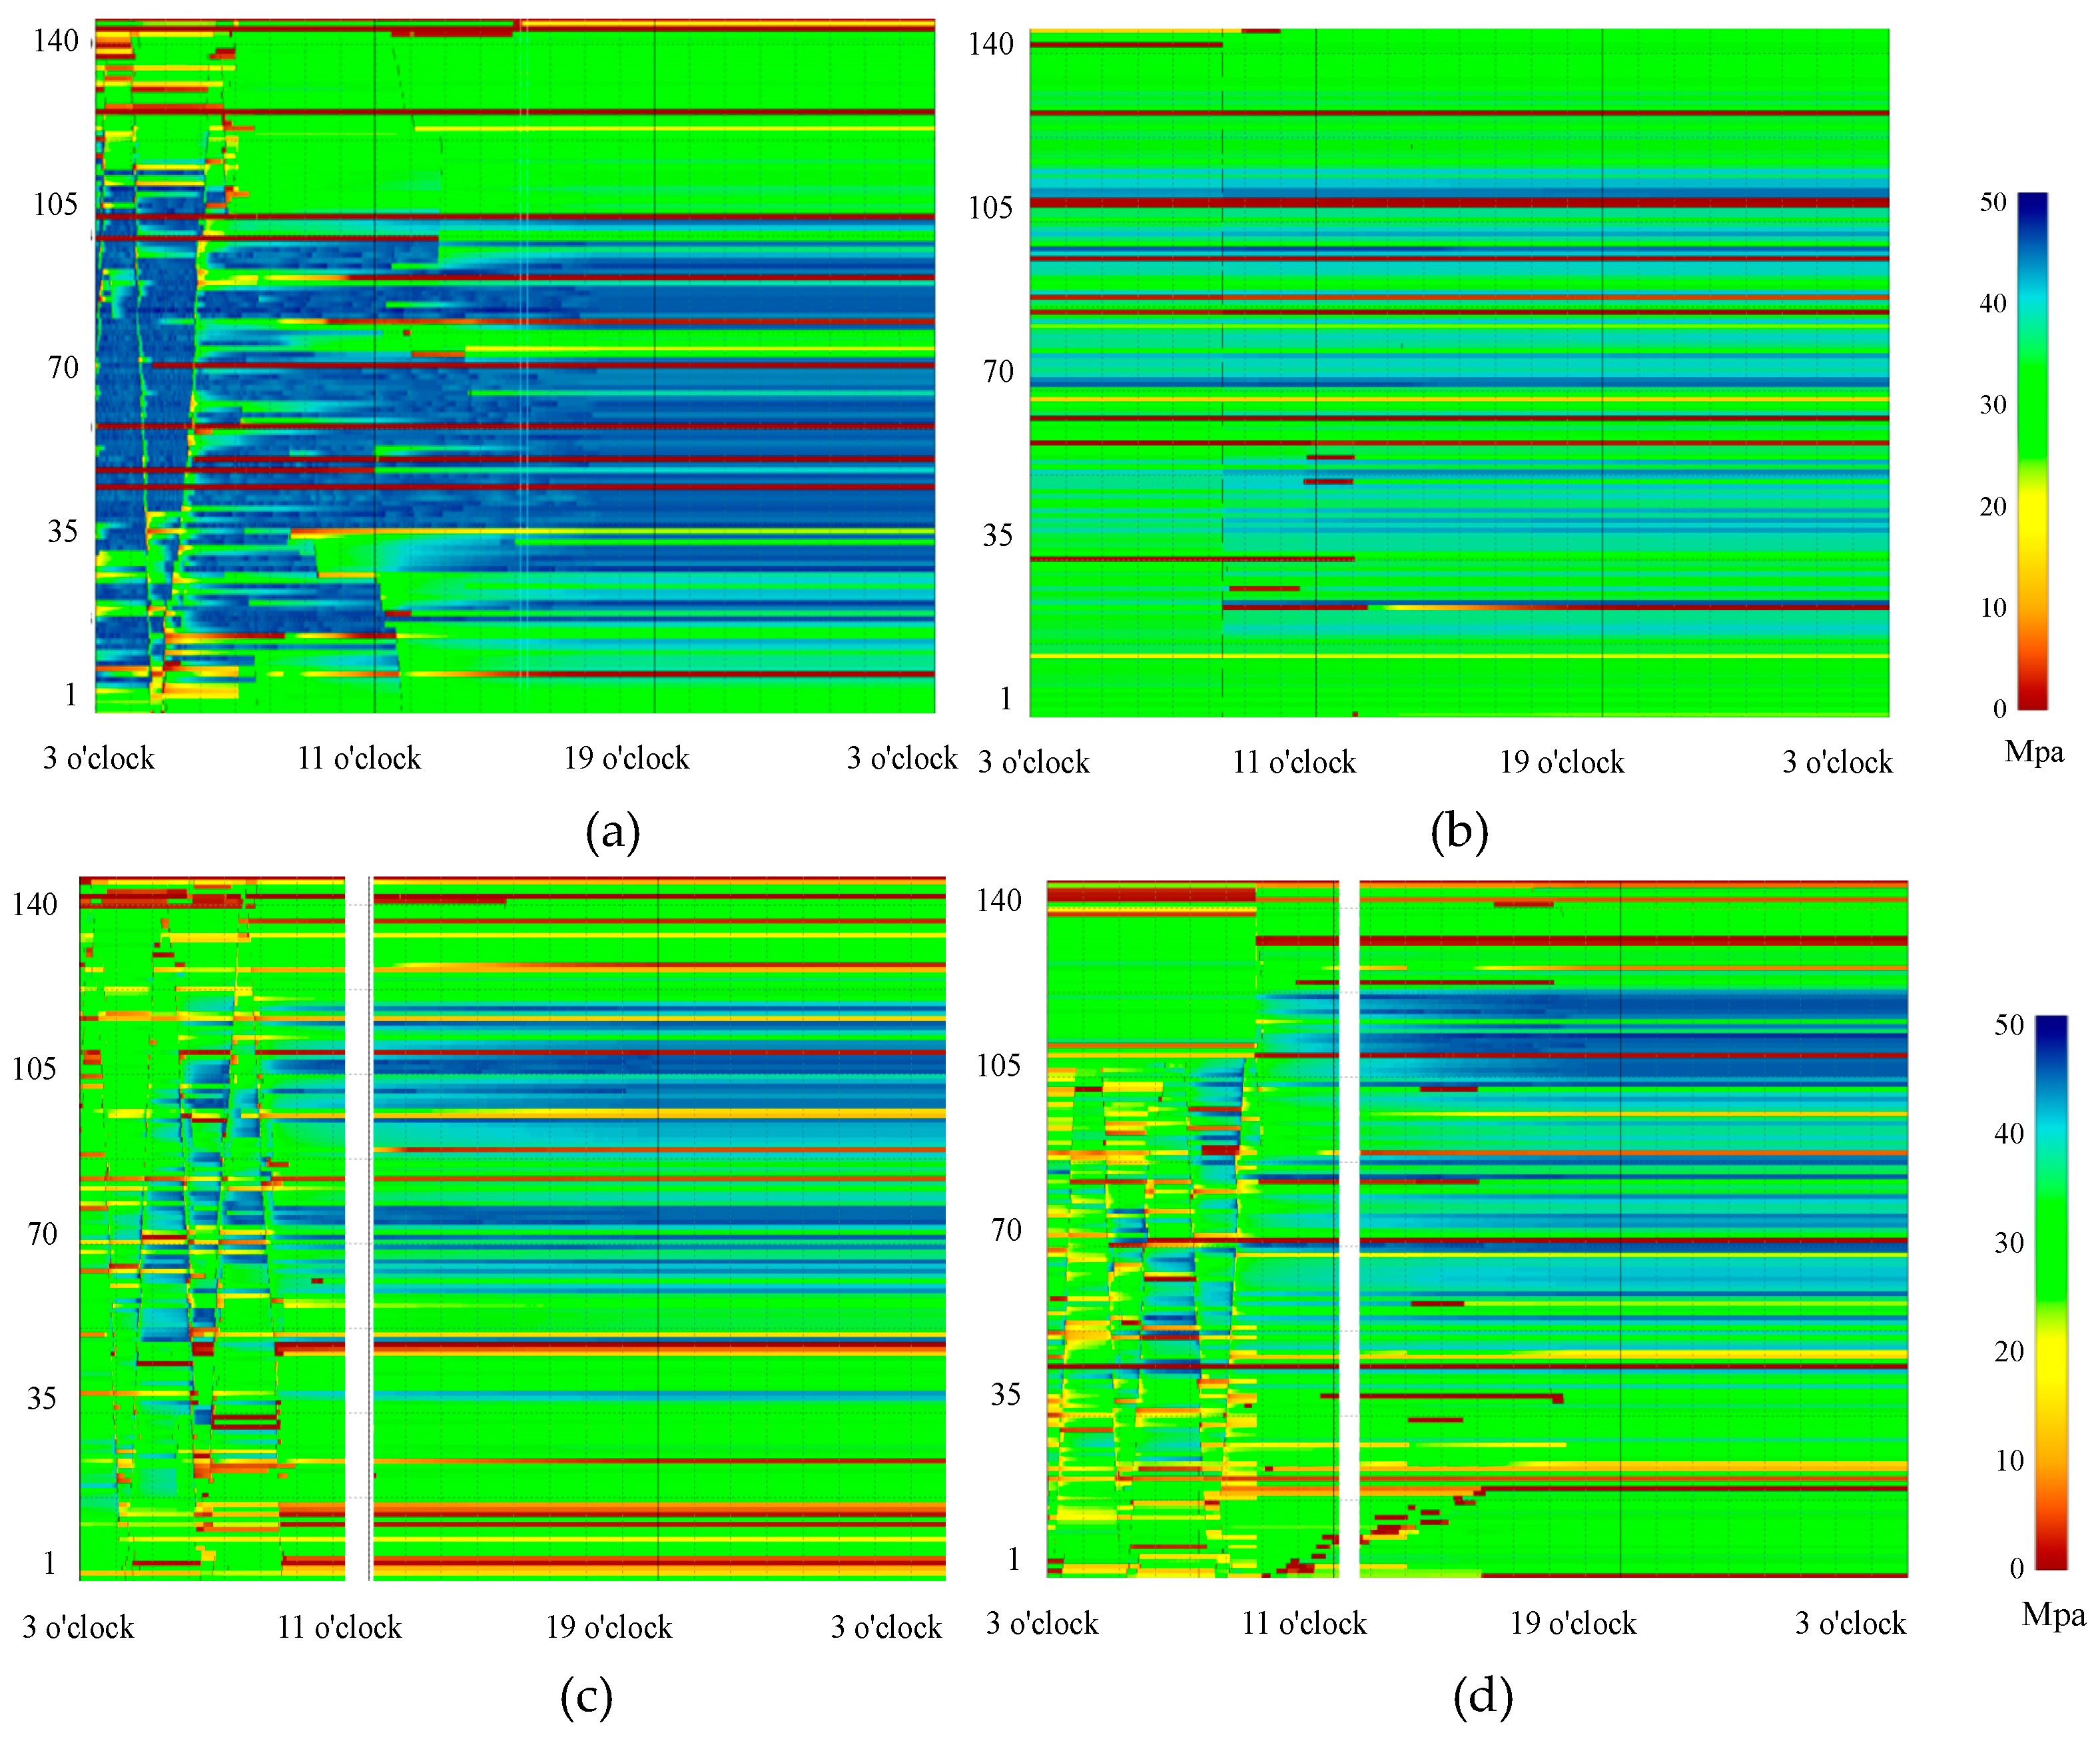
Through the field measurement of the working resistance of the hydraulic support post and the online monitoring report, the working resistance law of the No. 22201 working face along the strike of the coal seam is obtained. As the working face advanced over 32 m, the working face is first weighting (In particular, it is stated that in order to avoid large range roof weighting in actual production, hydraulic fracturing method is used to weaken the roof, and the normal first weighting interval is about 40~60 m [1,7]). The working resistance when weighting is 9550 kN~11,560 kN, which is 88%~96% of the rated working resistance, and the continuous distance is 4.5 m (Figure 11a). When the working face advanced to 45 m, the FPW, the supports of the 20~50# and 70~120# are obviously pressed, the main roof experience periodic caving at 13 m intervals, and the continuous distance is 3.4 m (Figure 11b). When the working face advanced to 61.5 m, the working face is SPW. The working resistance of the supports of 60~126# are obviously increased, the weighting interval is 16.5 m, and the continuous distance is 4 m (Figure 11c). When the working face is advanced to 71 m, the working face is TPW, the supports of 60~120# have obvious working resistance, and the weighting interval is 9.5 m, and the continuous distance is 3.6 m (Figure 11d).
Figure 12 shows that the load of the middle part of the working face is larger than the head area of the both ends when the working resistance is applied, but the position and range of the weighting force are not fixed.
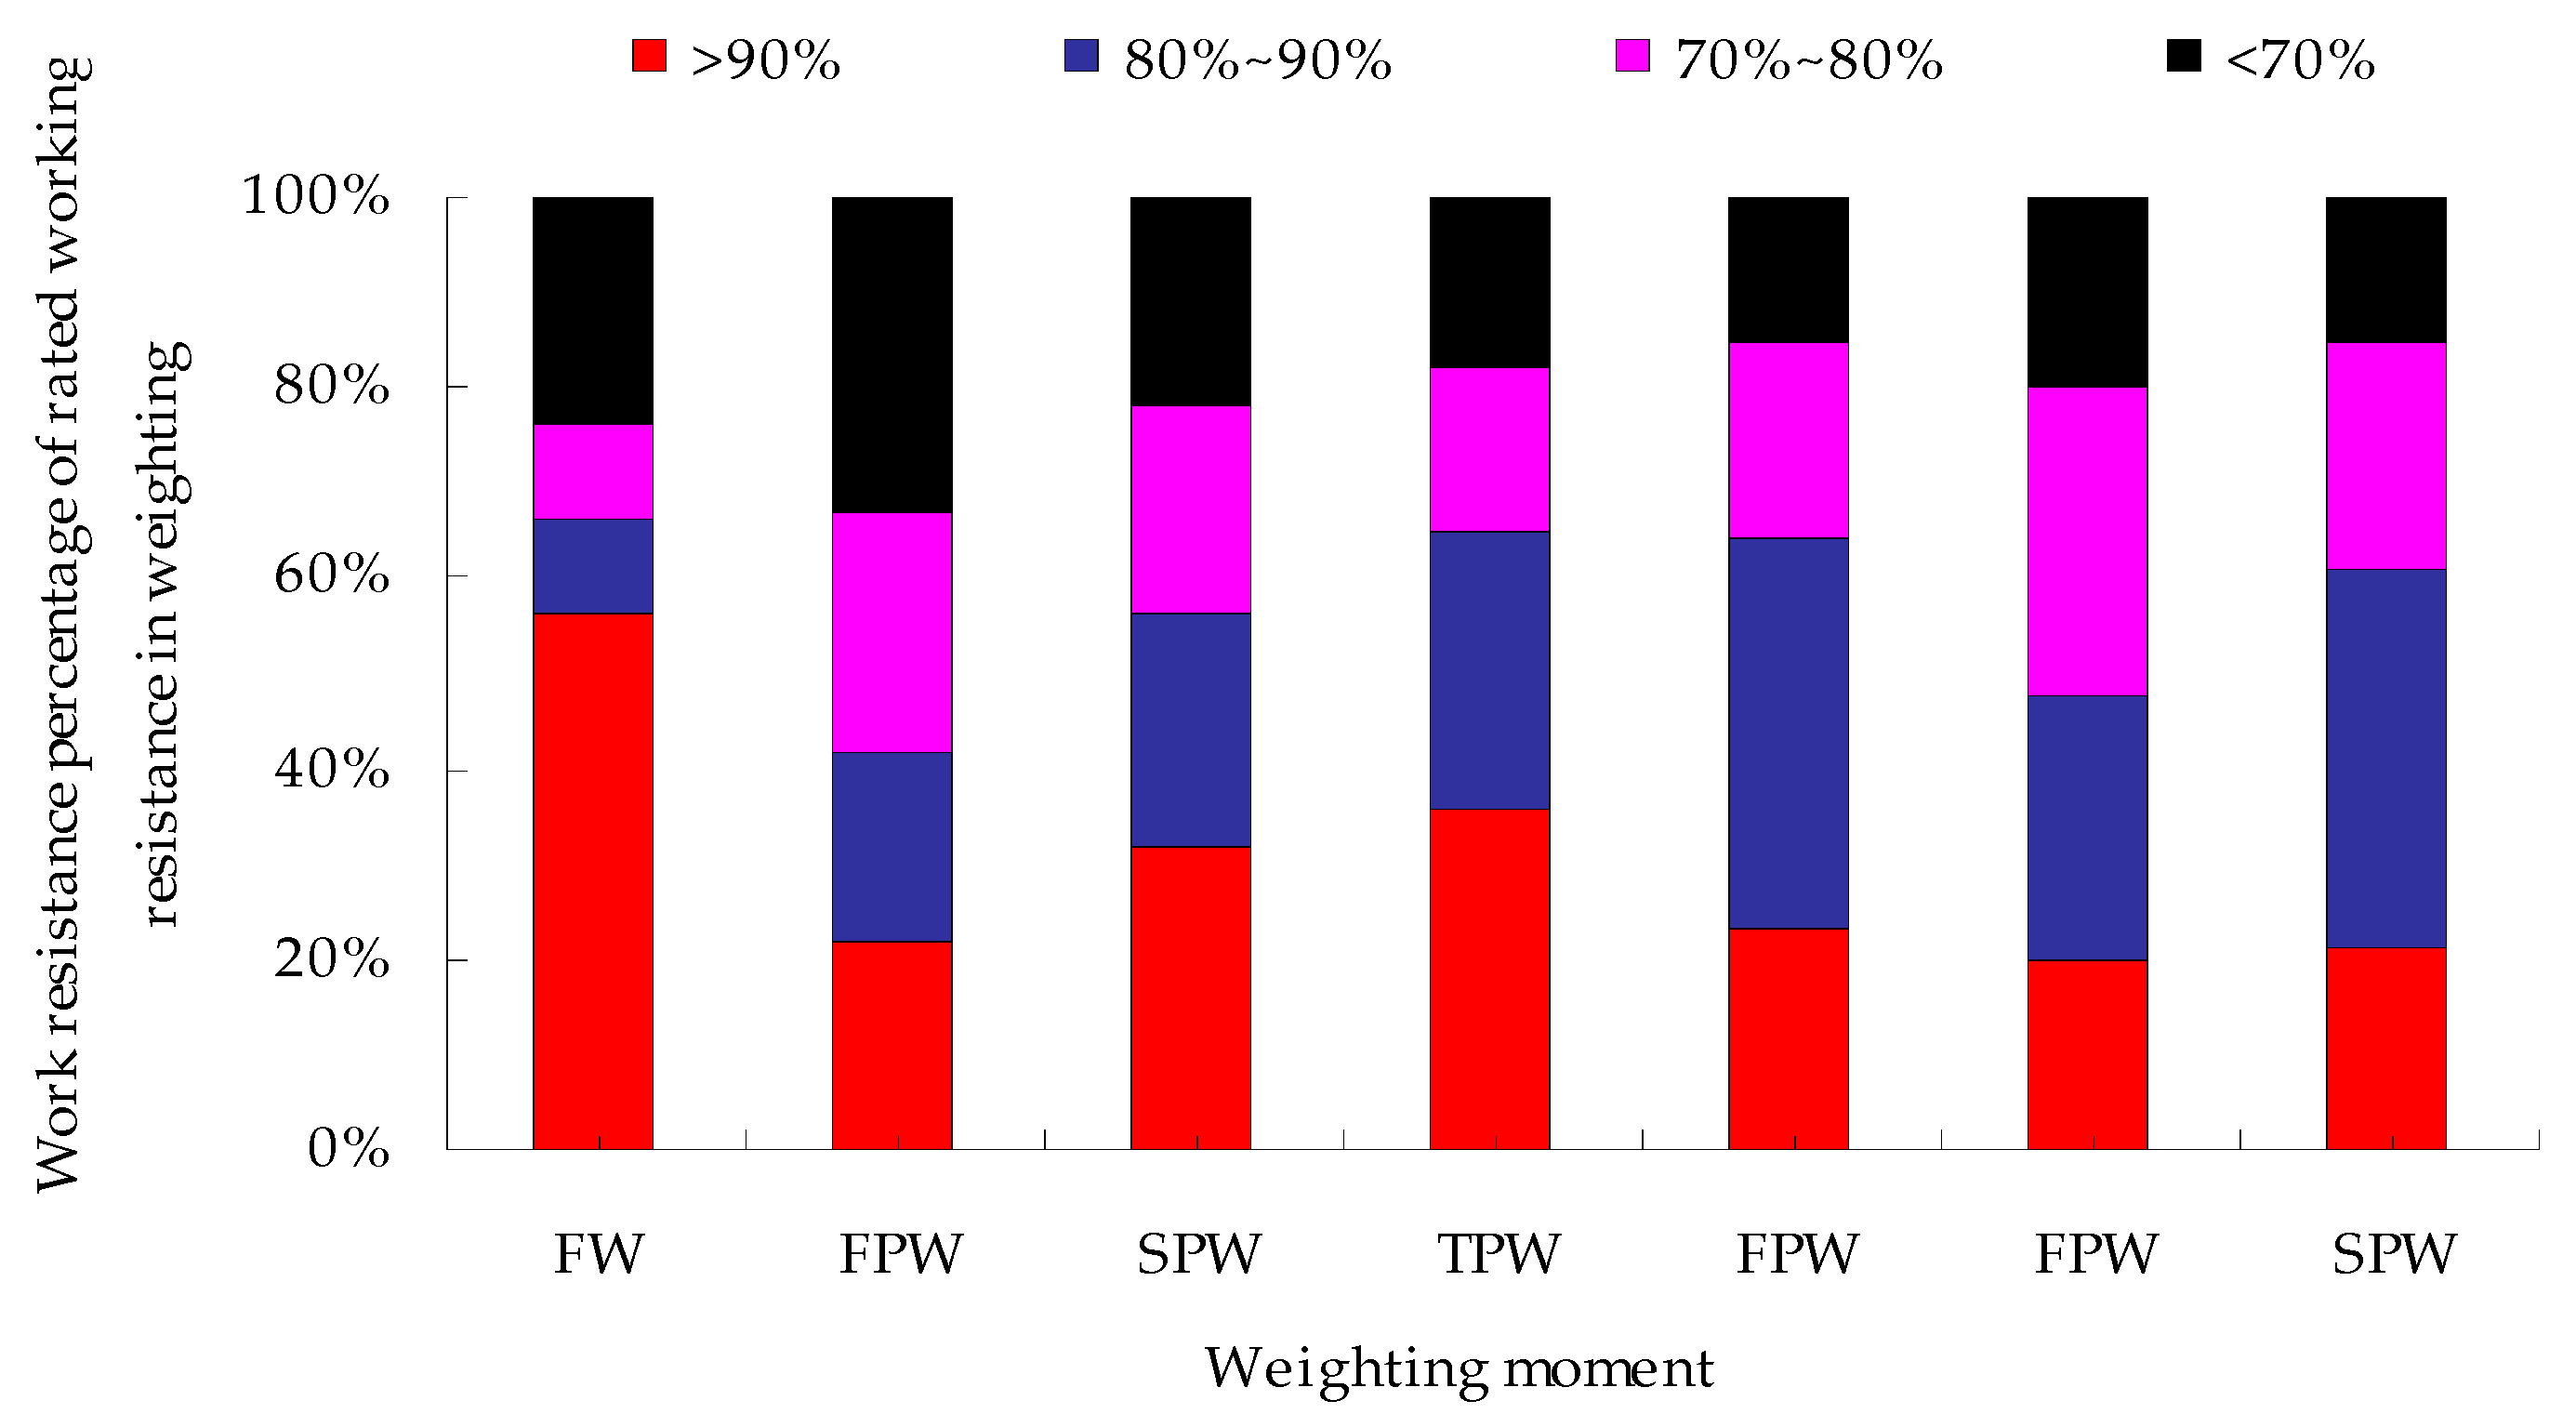
Based on the statistical analysis of six periodic weightings, the periodic weighting intervals are 13 m, 16.5 m, 9.5 m, 15 m, 12 m and 12 m, average of periodic weighting interval is 13 m; the average working resistance of the upper, middle and lower parts of the working resistance is 9058 kN/frame, 10,343 kN/frame and 8682 kN/frame, accounting for 72.4%~86.2% of rated working resistance (RWR). Meantime, concluded that 76% of the supports reach more than 70% of the RWR, and 56% of the supports reach 90% of the RWR, the safety valve opening rate is less than 8%, during the first weighting. 81% of the supports reach more than 70% of the RWR, and 27% of the supports reach 90% of the RWR, during the periodic weightings, as shown in Figure 13. The overall utilization rate of the support is high and the adaptability is good.
During the period of normal stage and the weighting, the front abutment pressure (FAP) of the support post on the AHG and TA is obtained. The peak value of the FPA is within 5 m in front of the working face, and the significant affected area is 10 m, the general affected area is 15 m. During the weighting working resistance is higher than the normal stage, the AHG is 1.31 times, and the TA side is 1.35.

3.2. Evolution of Roof Breaking Angle

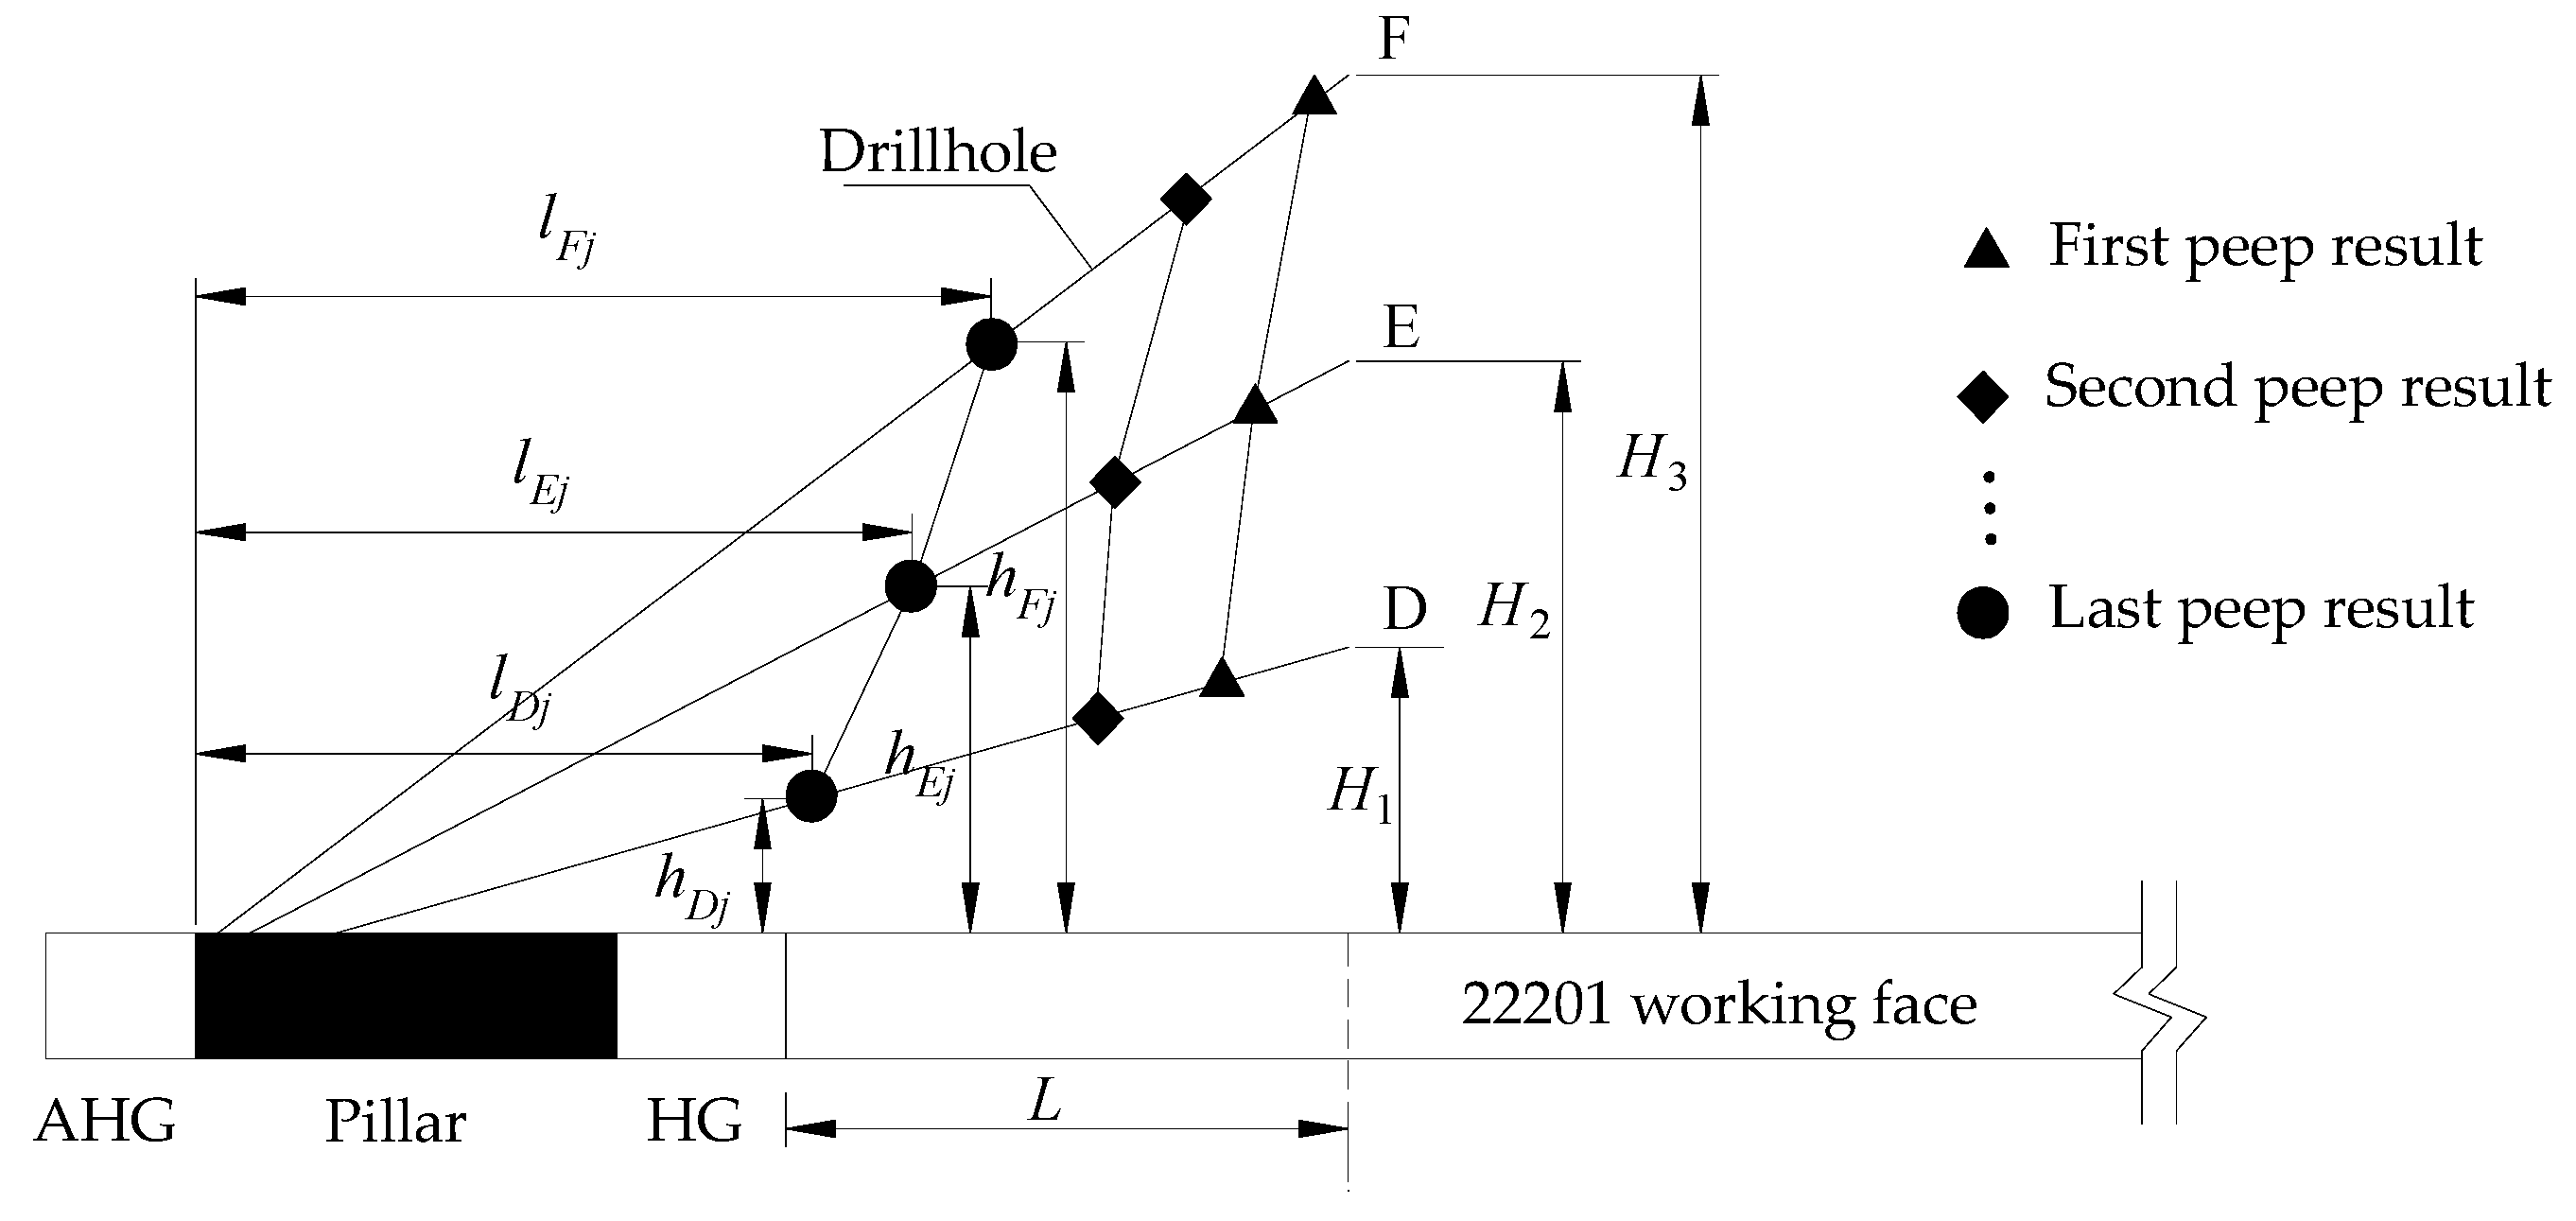
According to the drilling design parameters given in Section 2.1, the evolution law of the roof breaking angle is obtained according to the following steps:
(1) The horizontal distance of the drillhole to the coal body is L/m, L should be larger than the nature suspension distance of the T-junction; the vertical height H/m of the drillhole, determined the measured horizons. When the horizontal distance L and the observed horizon height H are determined, the drilling angle α/° can be calculated according to the formula (1).
α = arctan ( H + a L + B + b )
In the formula, a is the distance from the hole position of the roof on AHG, m; B is the width of the section coal pillar, m; b is the width of the HG, m.
(2) During the working face mining process, all the drillholes are continuously observed by the drillcope to obtain the location of the crack, separation or slump in the drillhole, recorded the drilling depth dij which corresponding to each position (i is the drillhole number, such as A, B, C...; j is the number of observations, taking 1, 2, 3...n; unit / m, the same below). Until the goaf roof movement is relatively stable, and the final position corresponding of the break to each drillhole is obtained. Used formula (2) to acquire the position of different peep results, the horizontal distance lij from the orifice and the corresponding vertical height hij are:
l i j = d i j × sin α h i j = d i j × cos α
(3) According to formula (2) calculated points of each break position, draw a different horizon of the roof break position evolution map, as shown in Figure 14.
Based on the broken position of the drillhole, when the roof has relatively stabled. By the formula (3), obtained the break angle θ1/° of the roof horizon between H1 and H2, and the top of the horizon is between the H2 and H3. The breaking angle is θ2/°, and the average breaking angle of the roof below the H3 horizon is θ3/°.
θ 1 = arctan h E j h D j l E j l D j θ 2 = arctan h F j h E j l F j l E j θ 3 = arctan h F j h D j l F j l D j
(4) Through the analysis of the results of the drillcope, found the roof fracture of different horizons has temporal and spatial characteristics. Take the borescope results of the station I as an example:
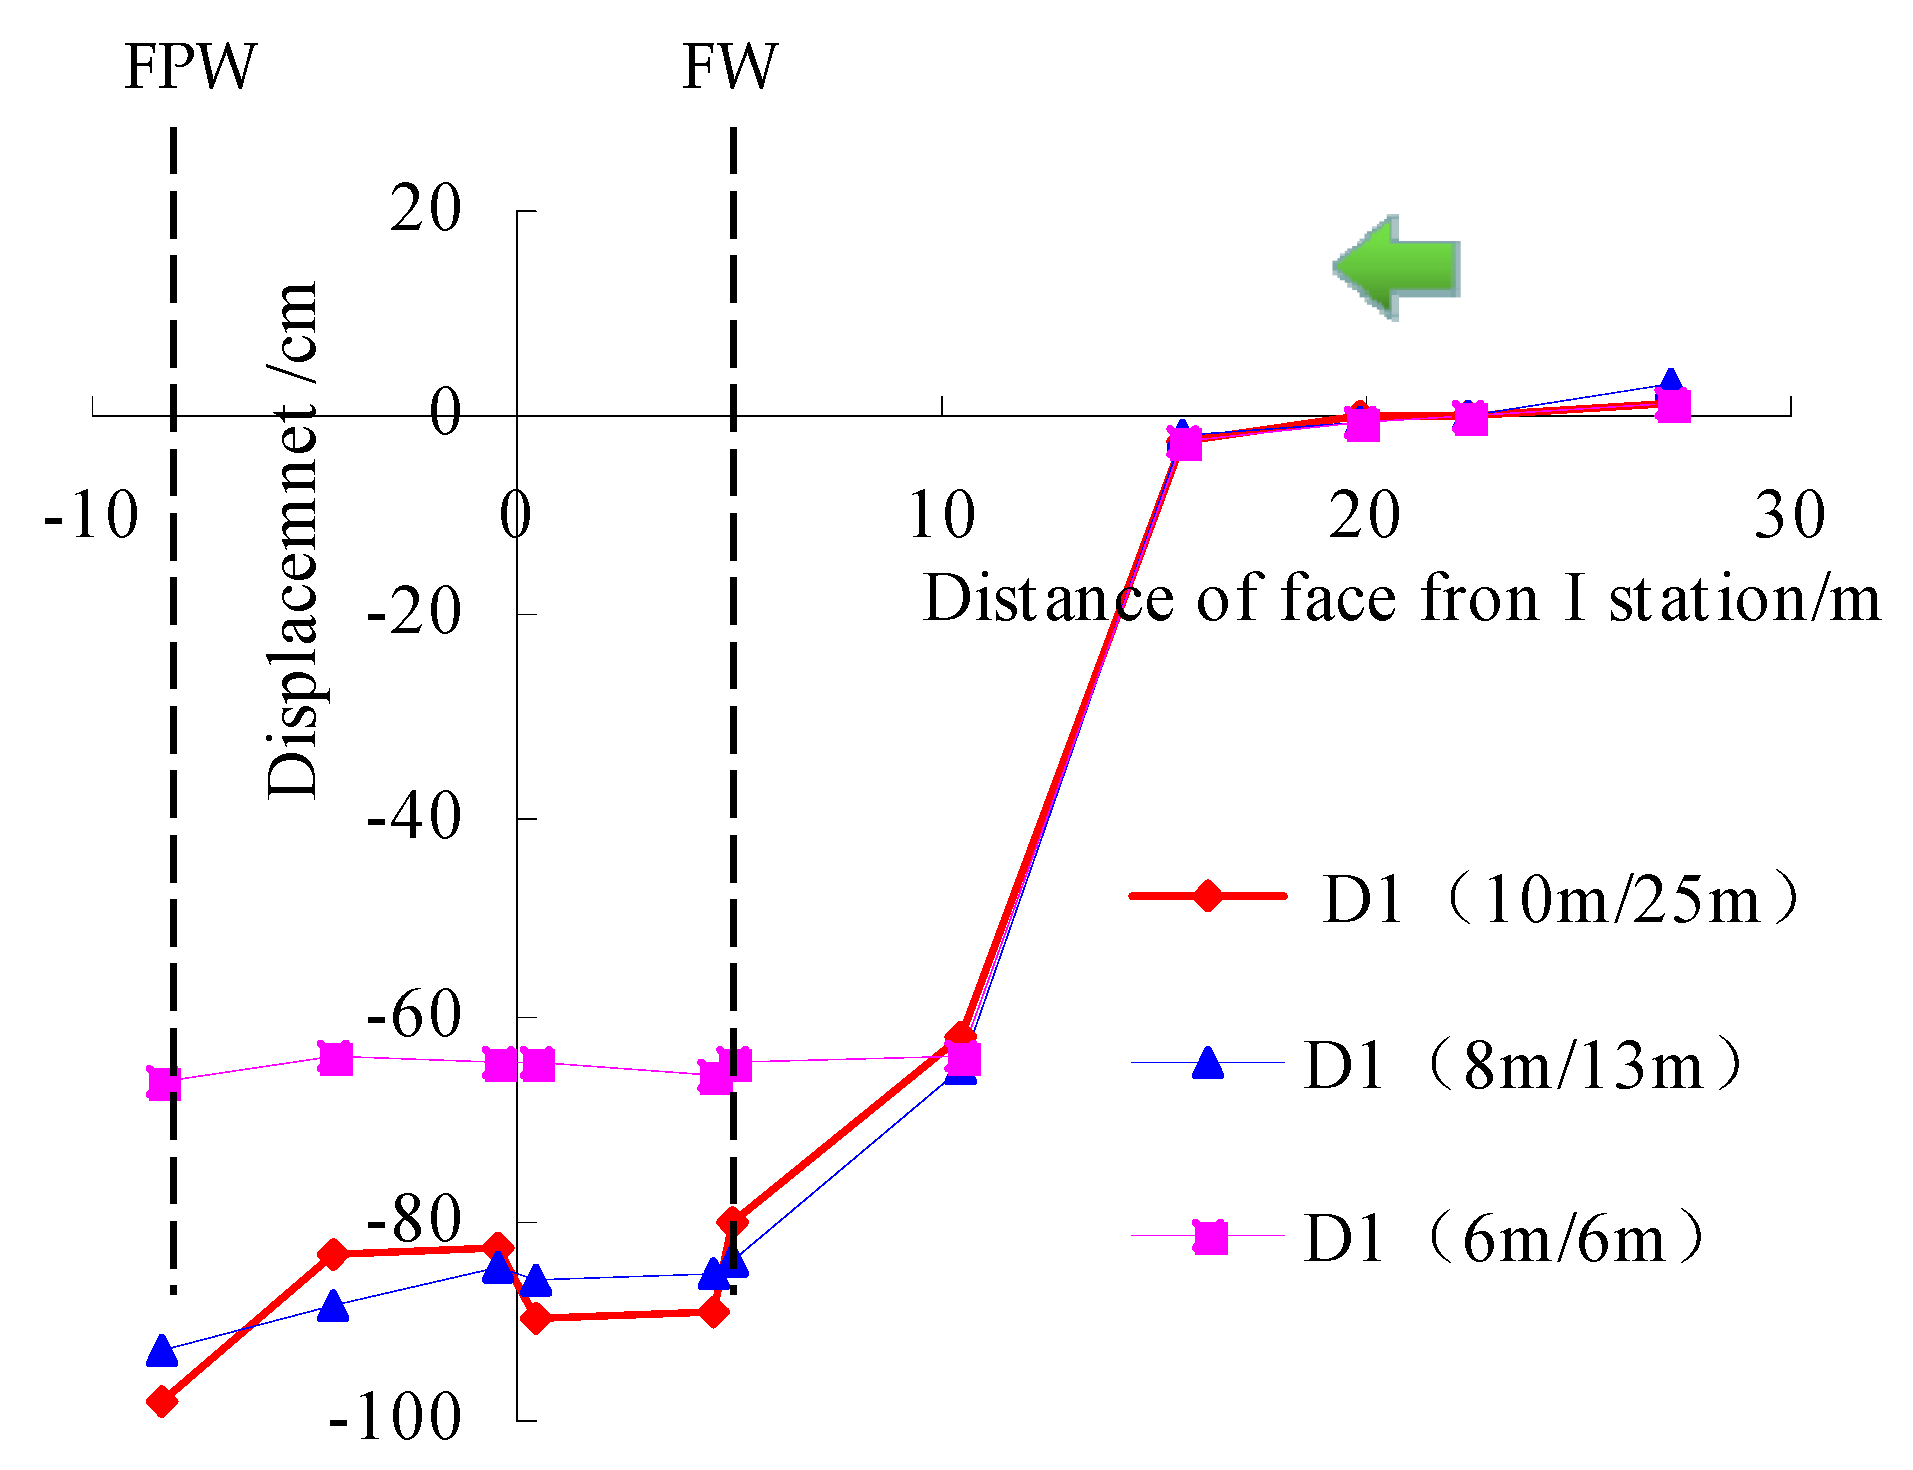
A: When the working face advanced to 32 m, the roof is FW, in front of the roof 5 m is not obviously broken. However, the advance movement of the horizon of 0~10 m is monitored (obvious displacement monitored), which indicates the roof strata movement is ahead of the mining working face weighting.
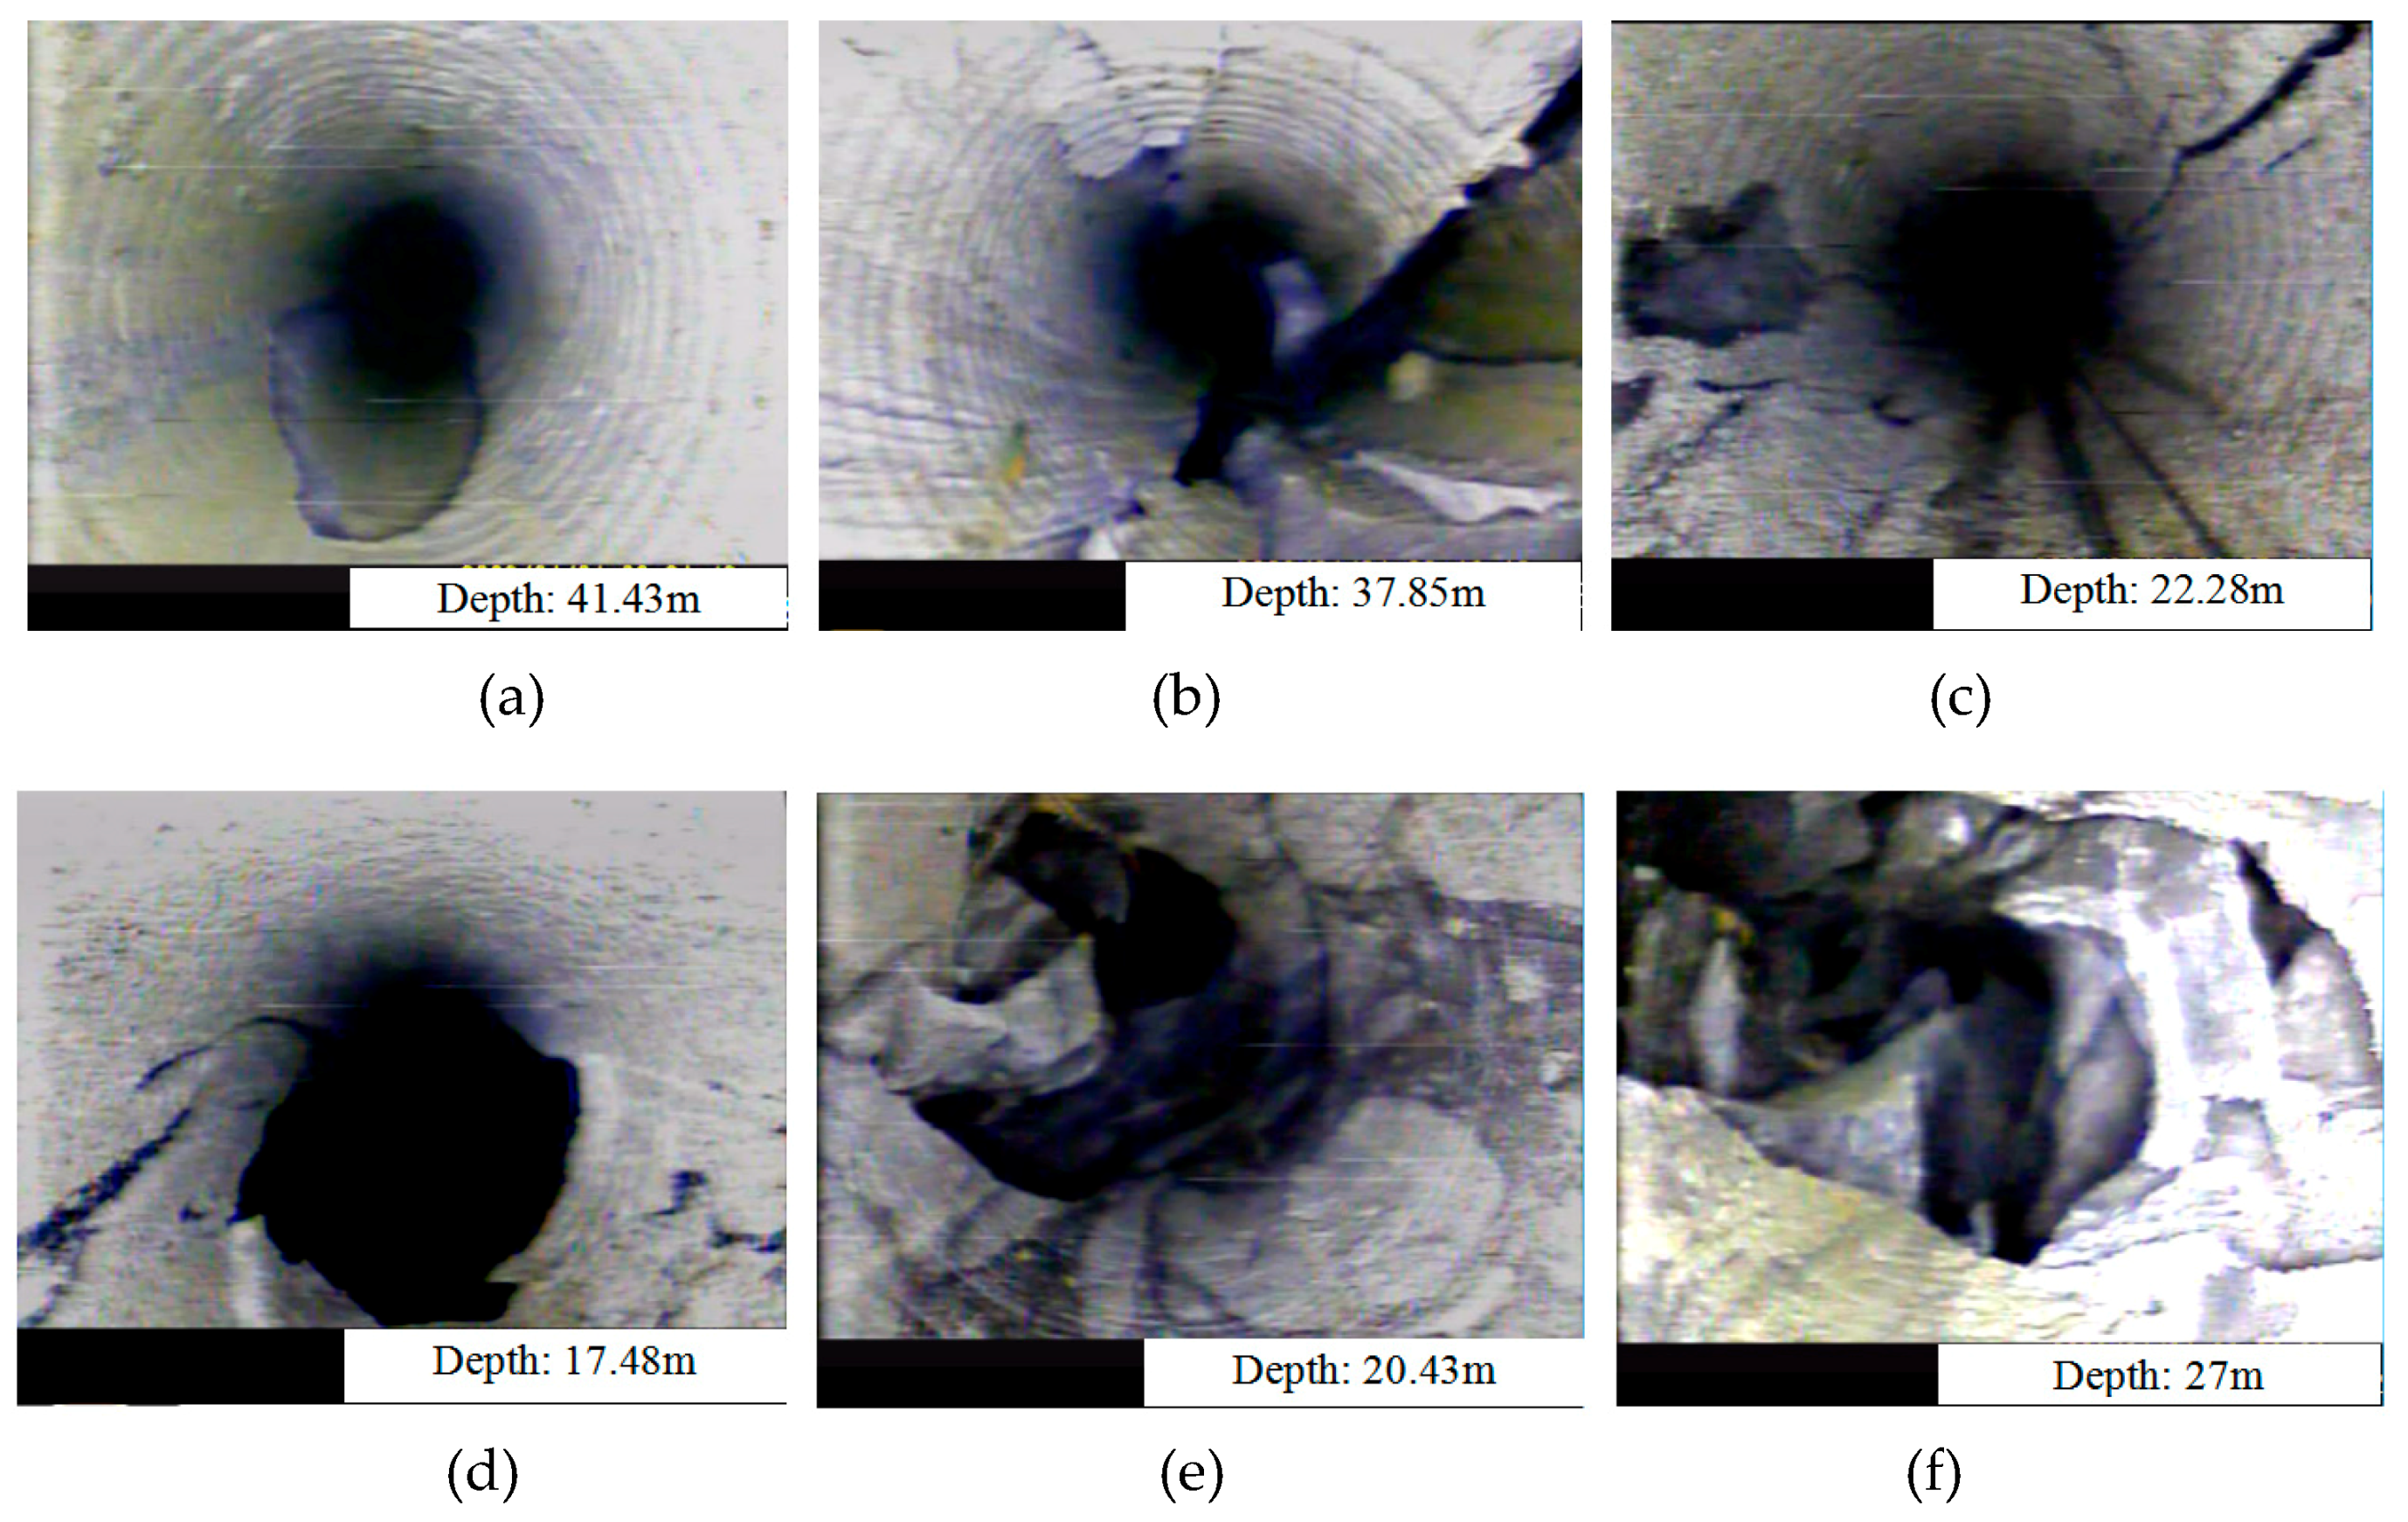
B: As the working face advanced to 36.6 m, the roof with horizon of 24.4 m (suspension distance is 19 m) was broken is shown in Figure 15a. As the face advanced to 45.4 m, behind the coal wall of the working face, the roof with horizon of 22.1 m (suspension distance is 15 m) was fractured, as shown in Figure 15 b. Figure 15 c shows the horizon of 6m (suspension distance is 6.5 m) above the roof caving. When the FPW, the caving height of 9.6 m roof behind the coal wall is 6.4 m. The D1 drillhole was continuously measured, the horizon of 10 m above the roof caving interval in the T-junction area is 7~9 m.
C: When the working face advanced to 75 m, at 38 m behind the coal wall of the face, the roof with horizon of 4.8 m (suspension distance is 1.8 m), the roof with horizon of 9.3 m (suspension distance is 3.2 m) and the roof with horizon of 16.2 m (suspension distance is 6.6 m), the main roof caving, as shown in Figure 15e–f. It shows that when the working face advanced over 2~3 times period weighting intervals, the movement of the overburden is basically stable.
According to the observed hole fractured position at three stations, the average breaking angle in the roof of 10m~30m horizon is 64°~ 68°, the average breaking angle is about 66°.
Through the continuous observation of the holes of D, E and F in every station during the mining process (Figure 5), the positions of the three sets of drillholes with fissures, separations and slumps at the same propulsion distance are counted. The continuous peeping results are shown in Figure 16. Figure 16 not only reflects the evolution process of the breaking angle of the top surface of the working face, but also reflects the arc-shaped arching process of the working face along the top of the 10 m, 20 m and 30 m horizon. The above conclusions are similar to the previous studies.

3.3. Analysis of Roof Movement Characteristics

(1) Before the first weighting of the working face, the overlying strata below the 10m horizon (D1 hole) will be separated and broken ahead of time, and the overburden movement will be ahead of the weighting of the working face (the cracks in the hole are observed), and the distance of the overlying rock will be about 5~8 m, as shown in Figure 17. An example of D1(10 m/25 m) drillhole: the first number represents horizon of the roof, the second number represents the distance between the broken position and the opening of drillhole.
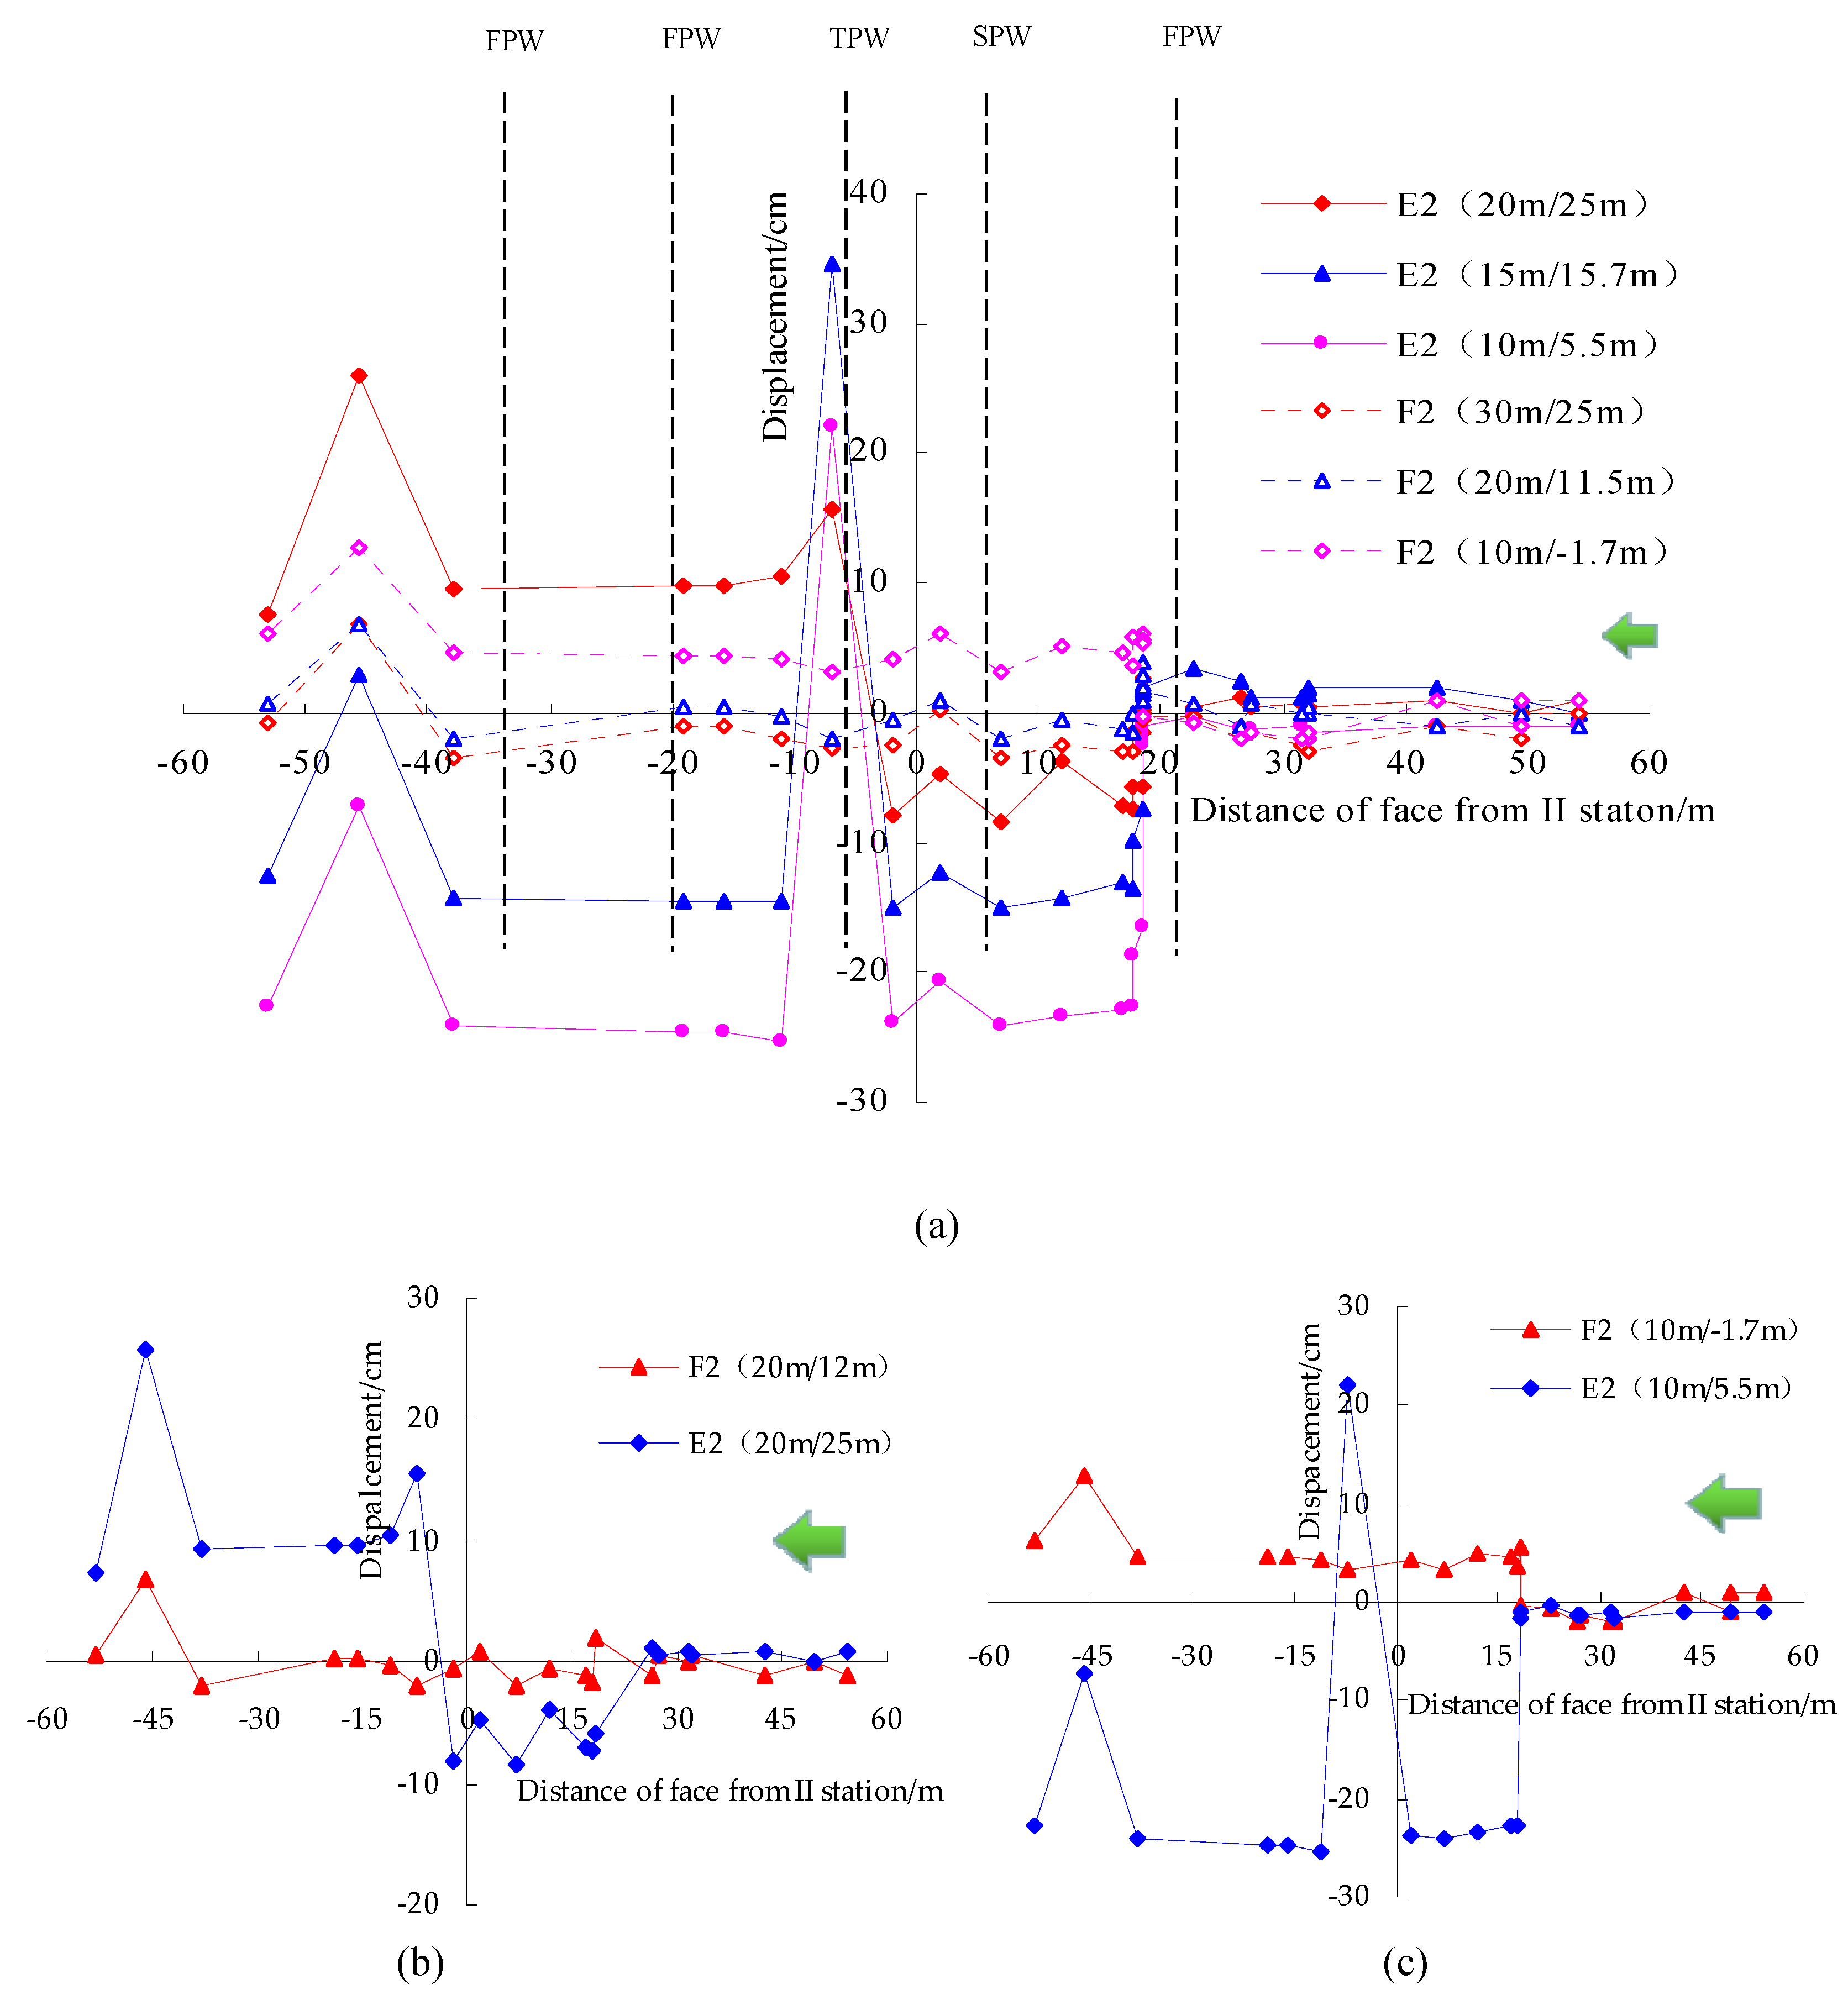
(2) Near the T-junction influenced area, four base points with the same vertical position and different horizontal side hanging distance are selected. From the data analysis, it is available that the overlying rock movement is more severe when the lateral suspended top distance of the working face tip is greater than 5 m, and the influence of the suspended top is weak. After the working face has been pushed through the measuring station for 24-28 m (about two periodic weighting intervals), the rock-covering movement is basically stable, as shown in Figure 18.
(3) At the same vertical position, the movement has the similarity (Figure 19). The displacement is large when the horizon is pressed at the level of 0 to 15 m, but the displacement is small at the time of 15-30 m horizon, indicating that the horizon of about 15 m and the movement of the overlying strata are not synchronized, and the bed separation area is easy to occur. With the different movement stages of different measuring points, the step distance is equivalent to the period of the current phase. After the working face has been pushed through the observation position, the amount of displacement to be monitored in the rear of the goaf is small, and when the face is close to full mining, the overburden in the rear of the goaf is monitored to be settled again in a large range. It is verified that the square effect is the same as that of the square, and the position of the fourth and fifth cycle in the figure is close to the full mining.
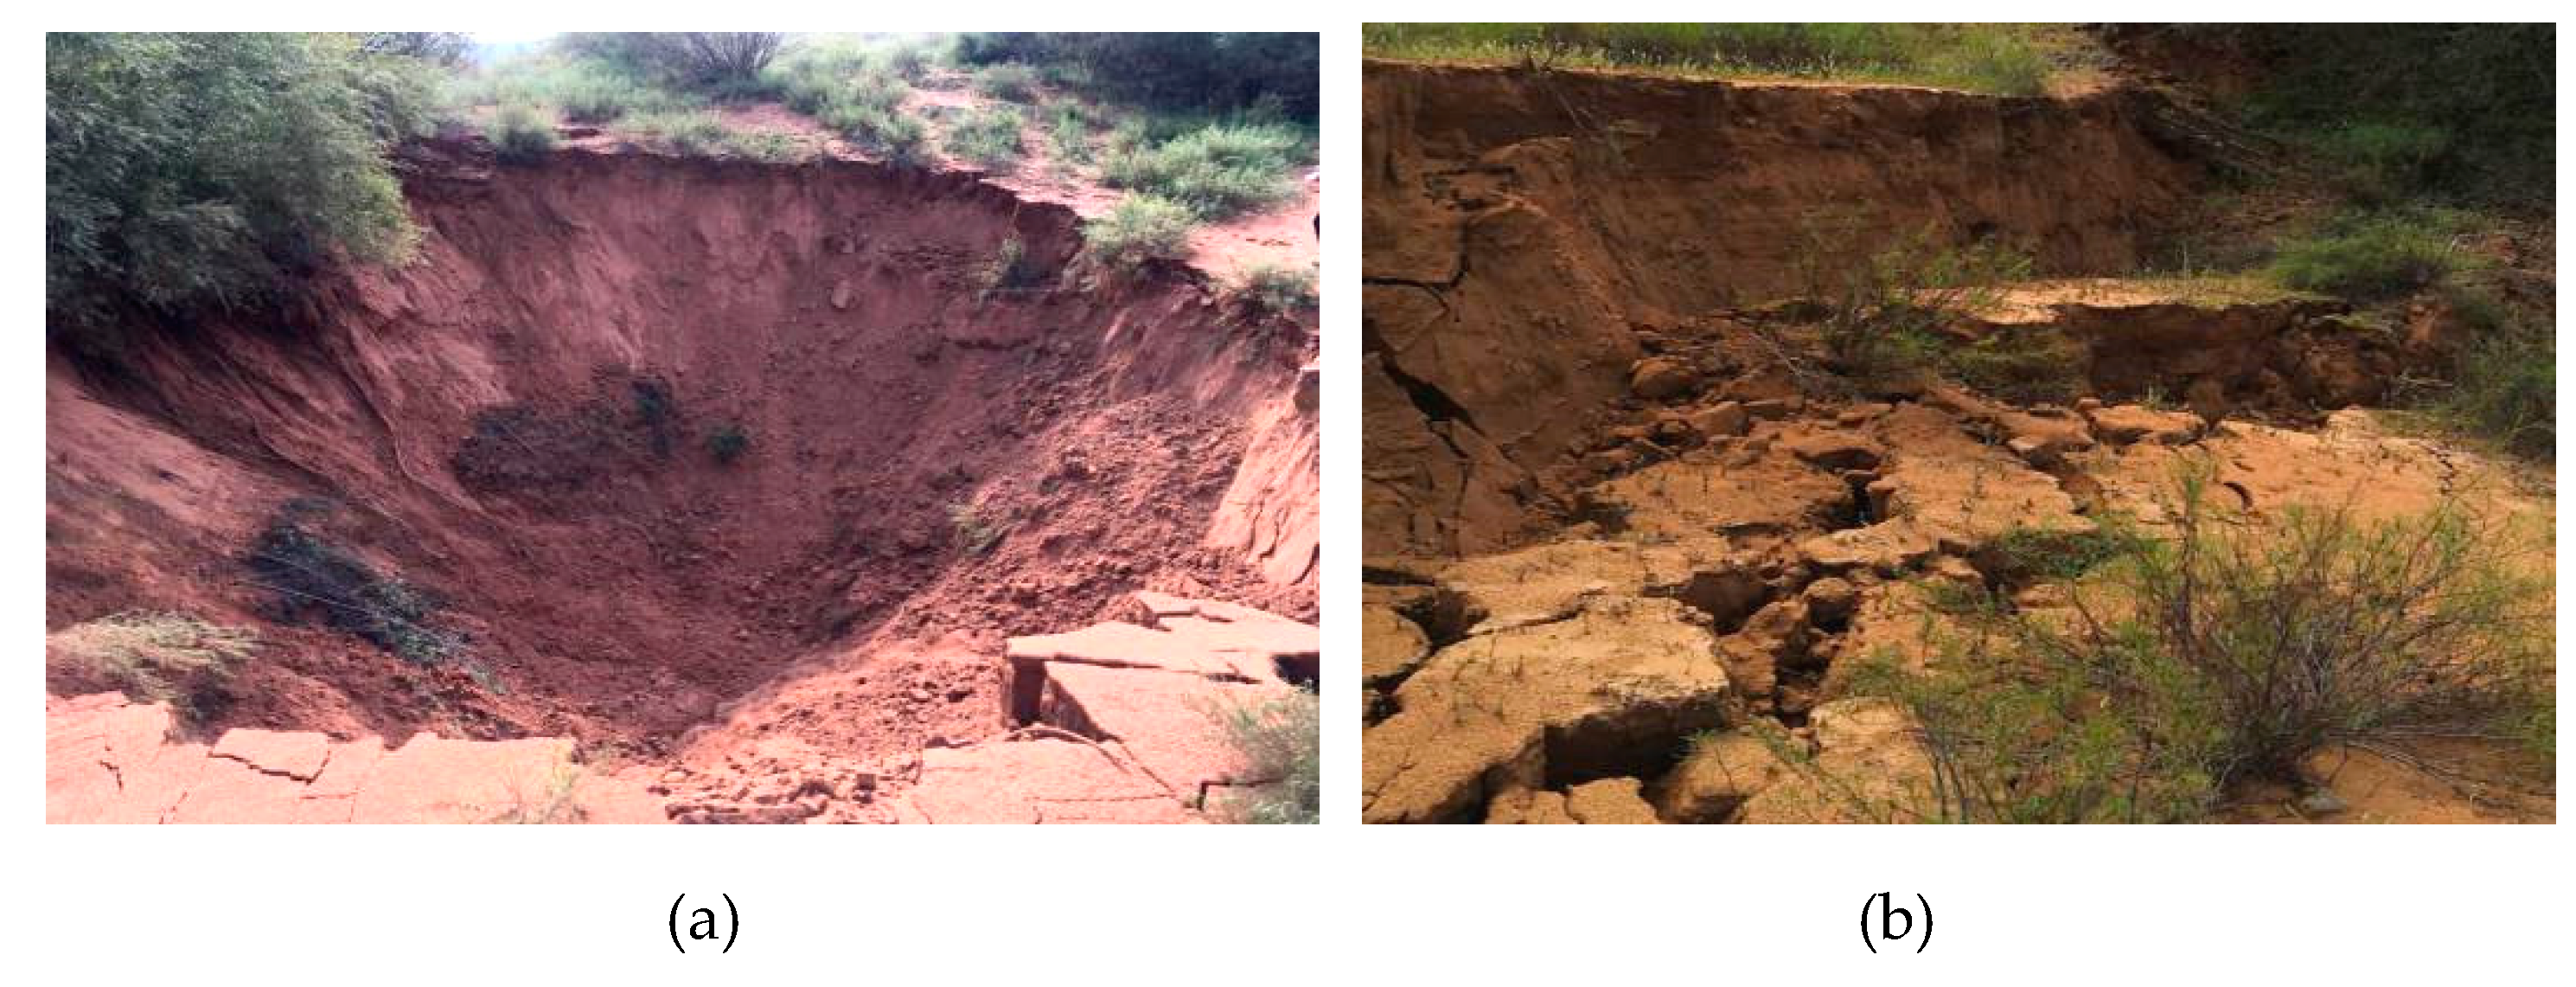
Based on the above analysis, the height of the overburden caving zone is about 15~18 m. Through the surface observation, the sinking funnel appears on the surface when the first weighting is applied, and the periodic step crack height reaches 1.7m, indicating that the roof of the large mining height in typical shallow buried forms the “step rock beam” [1], and the surface is discontinuously deformed. Field the surface formed step cracks, as shown in Figure 20.

4. Physical Simulation Experiment Results

4.1. Law of Overlying Strata Movement

(1) The caving of immediate roof: With the advancement of the working face, the top coal and the immediate roof are gradually caved. When the working face advanced to 42 m, the height of the immediate roof reaches 4 m, as shown in Figure 21a.
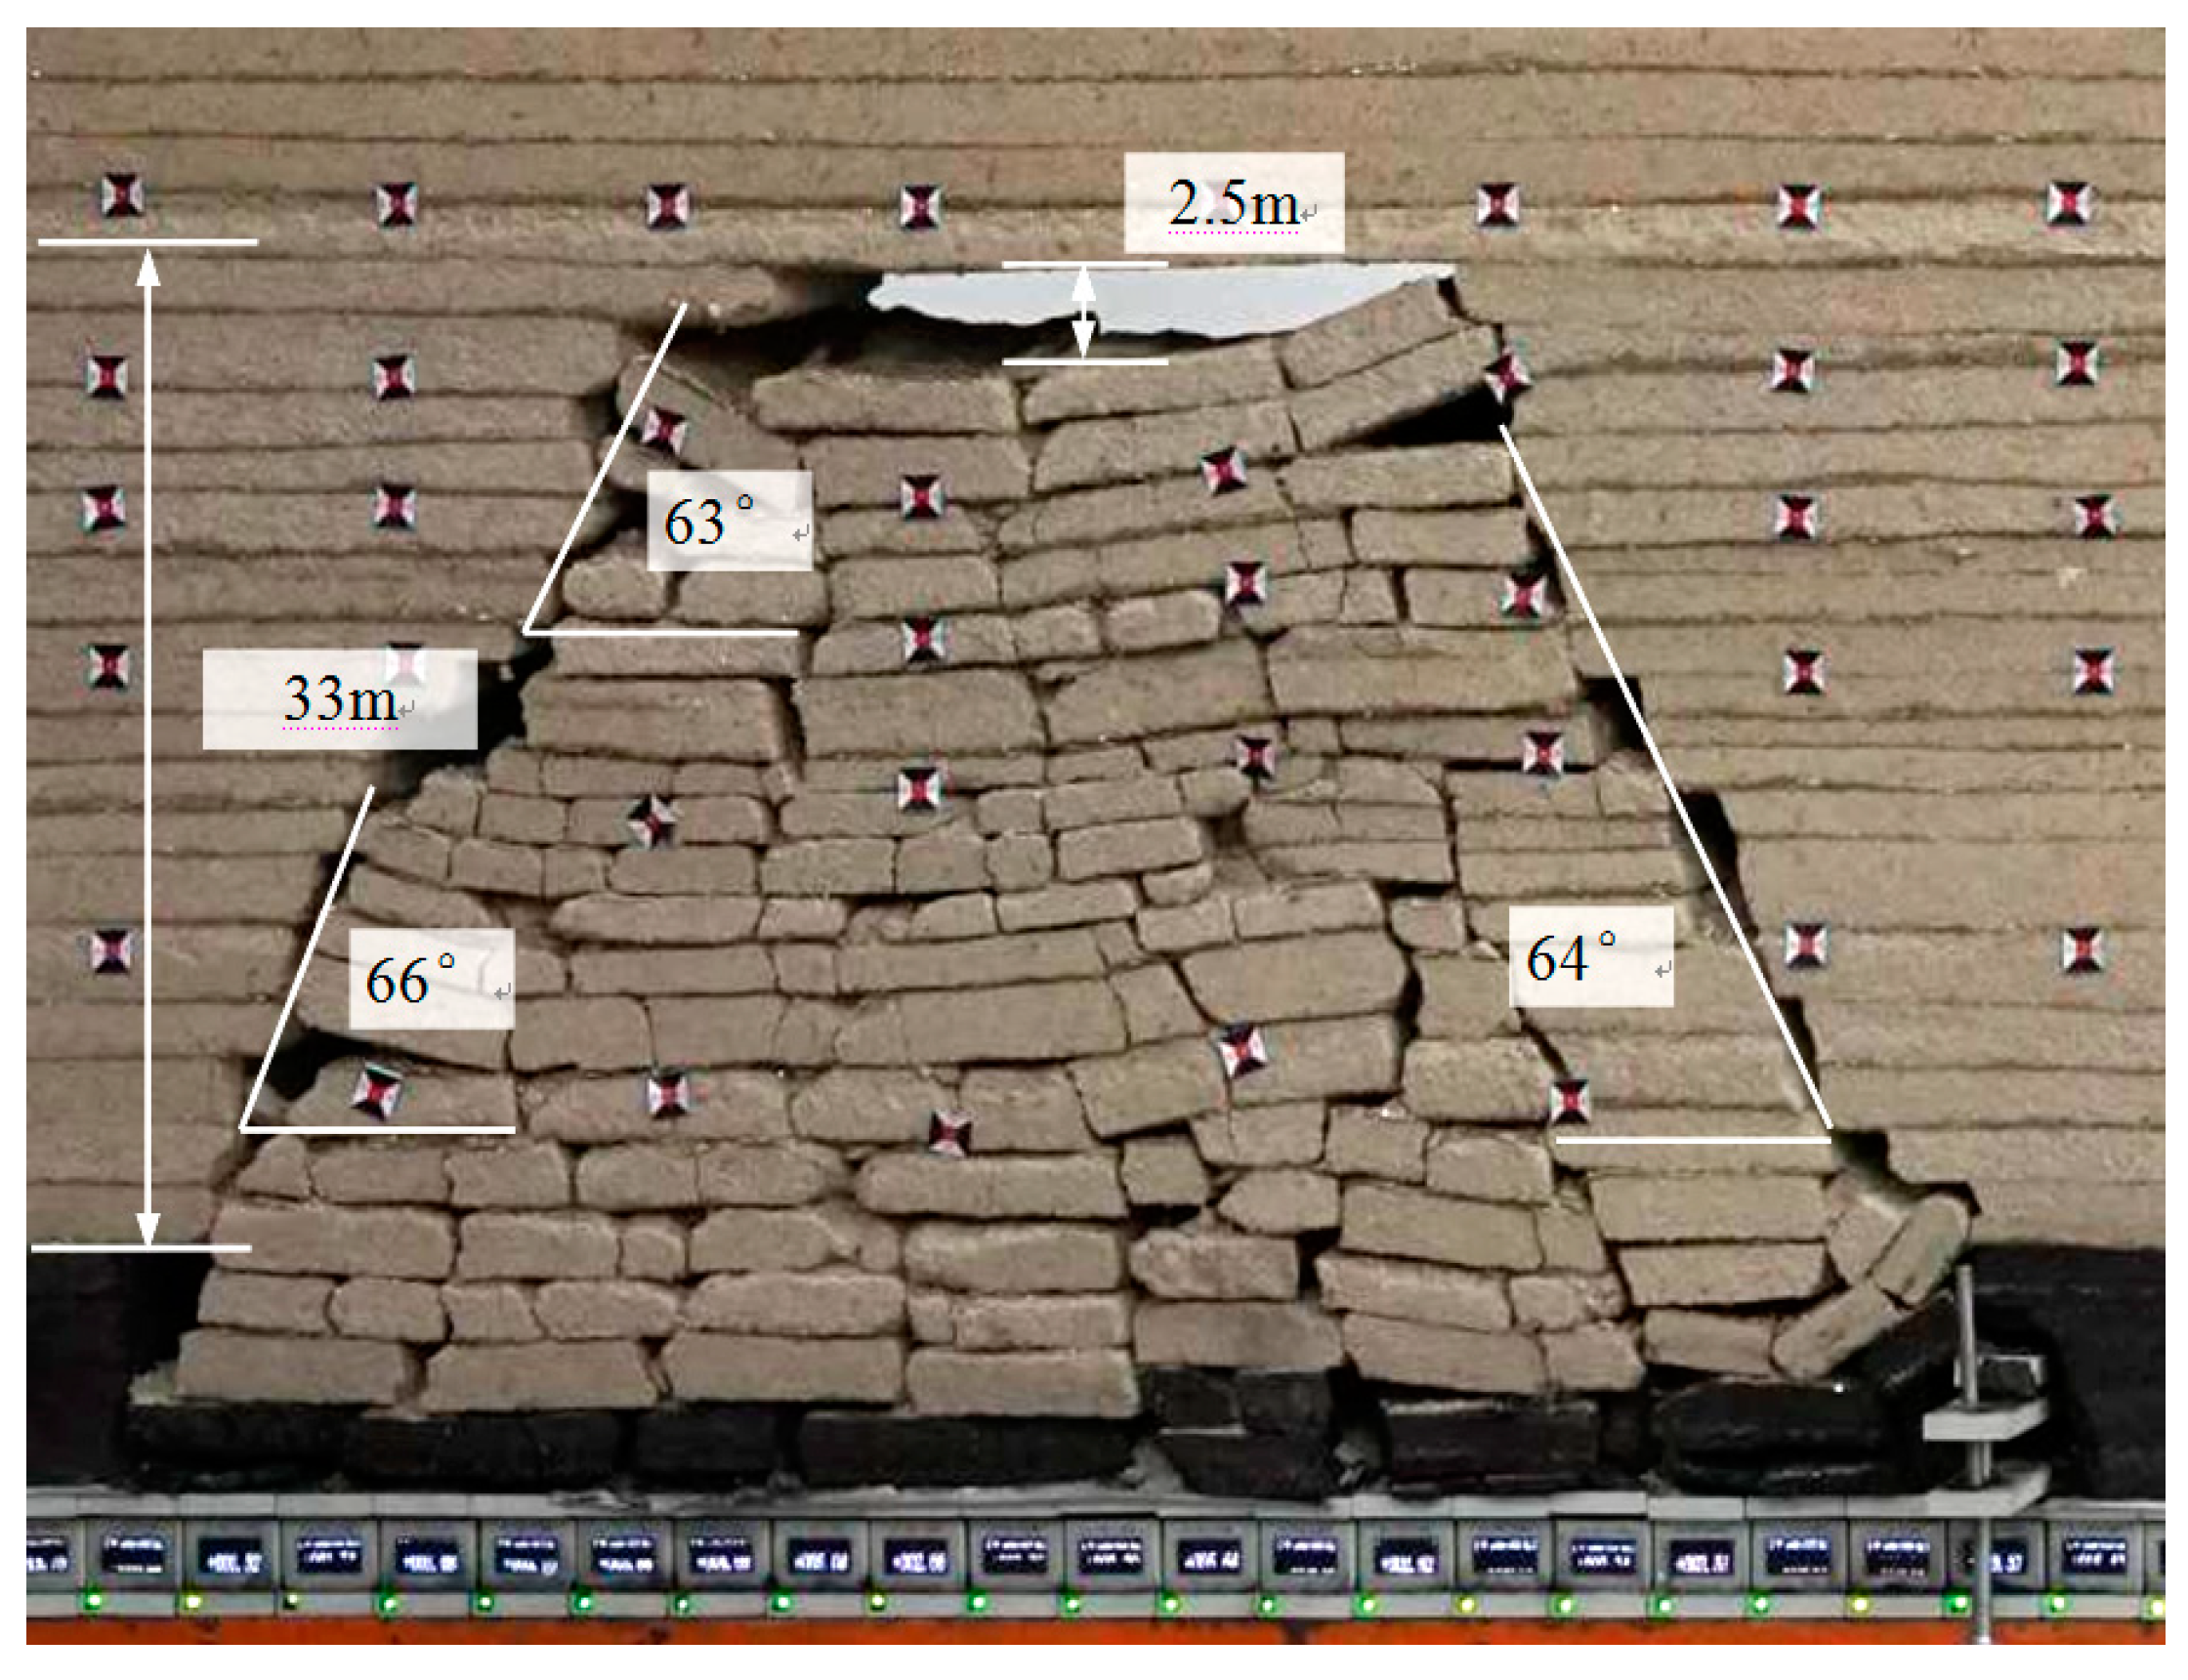
(2) The first caving of the main roof: When the working face advanced to 56 m, the strata falls to a large extent, the height of caving zone reaches 17.5 m, and the height of the separation is 3.2 m; as shown in Figure 21b. It is consistent with the field measurement; the field height of caving zone is about 15~18 m.
(3) The periodic caving of the main roof: When the working face advanced to 68 m, the working resistance of the simulated support and wireless sensors begin to increase, the working resistance of wireless sensors were increased from 6300 kN to 10,800 kN. The key stratum of the main roof was first period caving at the horizon of 20~35 m above the roof, the FPW interval is 12 m. The development height of the overburden fracture zone was 33 m, and the height of the separation zone was about 2.5 m (Figure 22). Figure 22 shows that the breaking angle of the roof with horizon of 0~30 m is about 63°~66°.
When the working face advanced to 78 m, the advanced fractures will be generated in the bedrock of the hinged separation zone. The advanced fractures are located in the range of 3~5 m in front of the coal wall (Figure 23a); when the working face is advanced to 80m, the pre-fractures that have been generated continue to develop, and the upper horizons are obviously separated, and some of the rock horizons in the caving zone have fallen (Figure 23b); The advance bearing working resistance increased from 7200 kN to 10,400 kN, the weighting of the face is to come.
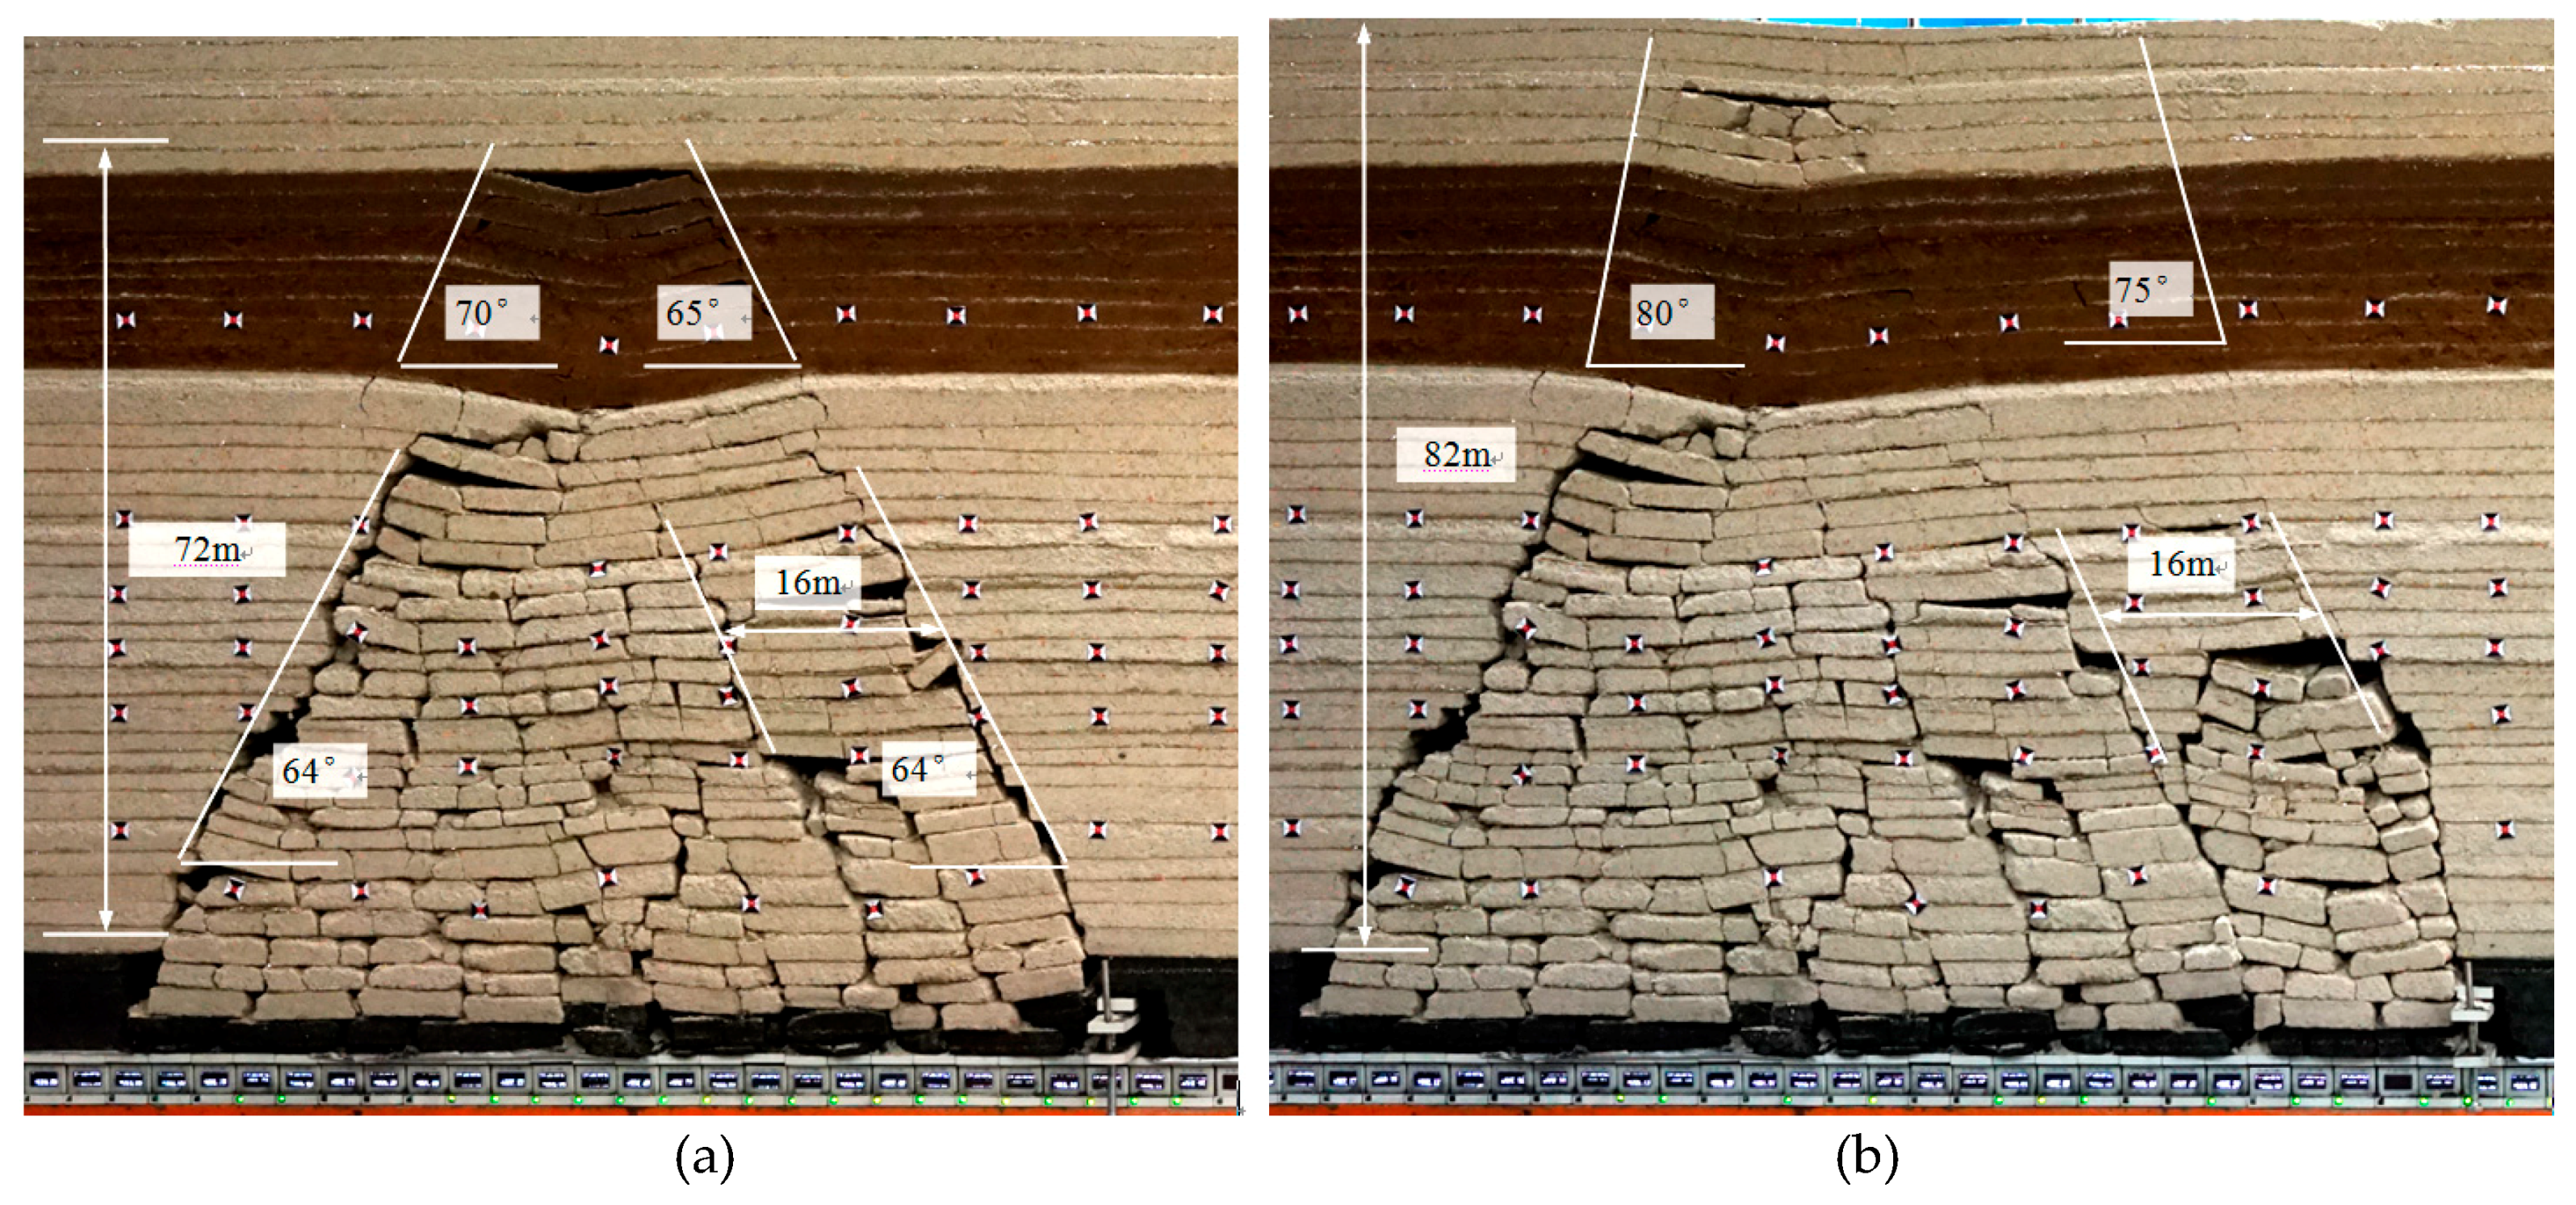
As the working face advanced to 82 m, the SPW interval is 14m, which is approximately equal to the length of the pre-breaking key stratum. The overburden fracture zone is highly developed to the upper boundary of the red soil horizon with a height of 72 m, as shown in Figure 24a. Meanwhile, the breaking angle of the overburden in the 0~40m horizon is about 64° on the setup entry side, and the breaking angle of the overlying stratum in the 0~40 m horizon is about 64° on the mining side. Because of the friction angle in the soil horizon is small, the breaking angle is increased. The break angle on the setup entry side is 70°, and the mining side is 65°.
When the working face advanced to 98 m, the third periodic caving occurs in the key stratum, the TPW interval is 16m. The height of the overburden fracture zone is developed to the surface, the height is 82 m, and the surface close to the setup entry appears obvious non-uniform settlement, as shown in Figure 24b. Simultaneously, the breaking angle of the setup entry side soil horizon and the loose drifting sand horizon is increased from 70° to 80°, and the mining side is increased from 65° to 75°, which indicates that the soil horizon and the loose flow sand horizon are destroyed by vertical cutting along the breaking line.
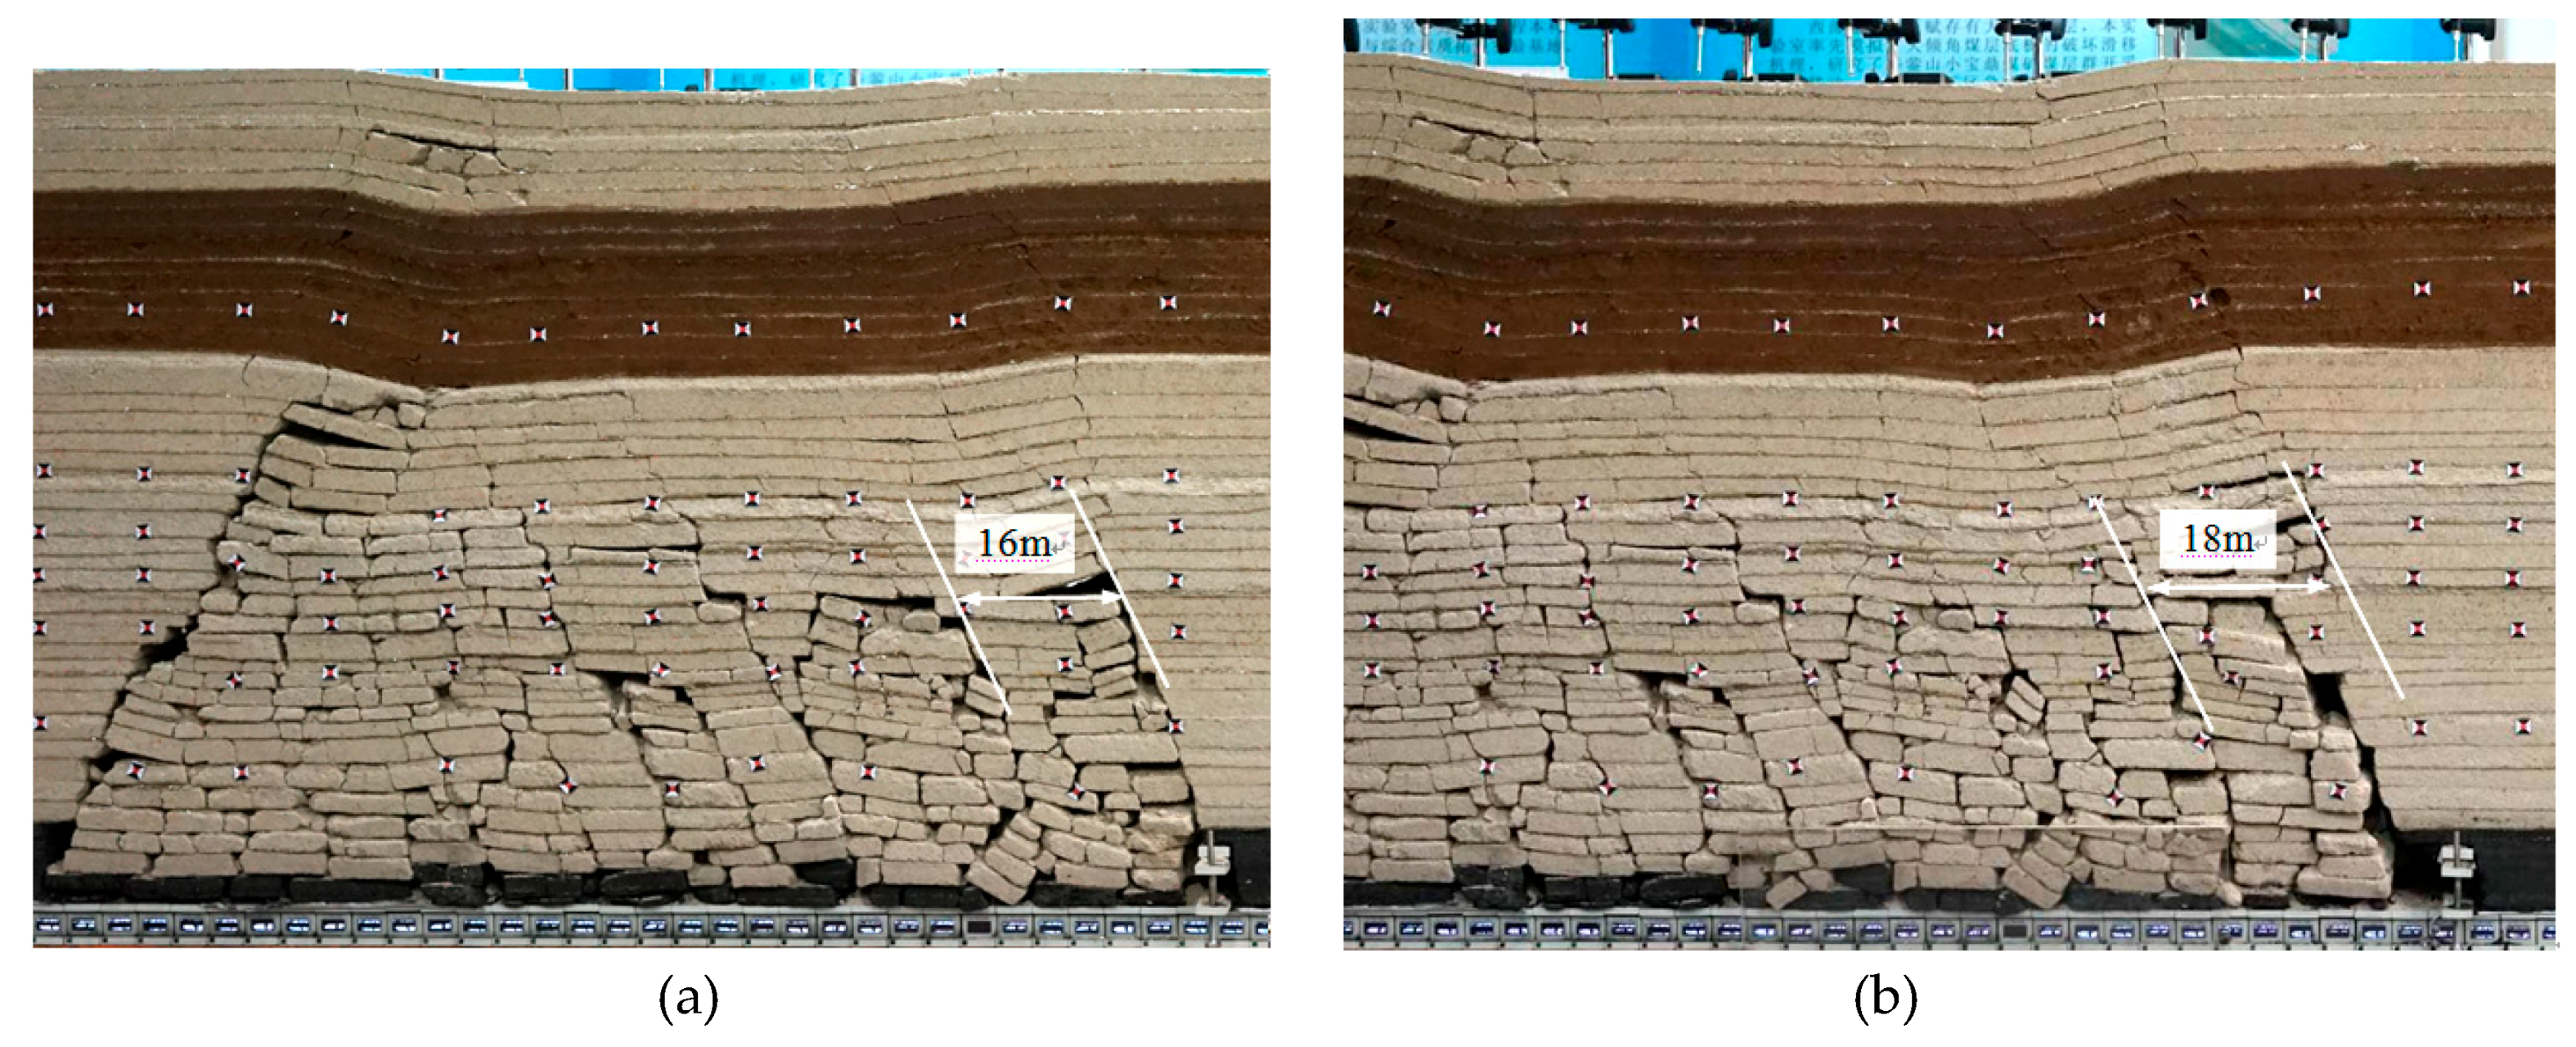
When the working face advanced to 114 m, the third periodic caving occurs in the key stratum, the FPW interval is 16 m, as shown in Figure 25a. When the working face advanced to 132 m, the FPW occurs in the key stratum, and the FPW interval is 18 m, as shown in Figure 25b.
This physical simulation, a total of 240 m of excavation working face is simulated (Figure 26). The first weighting interval is 56 m, the periodic weighting occurs 14 times, and the first seven times periodic weighting intervals are 12 m,14 m, 16 m, 16 m, 18 m, 16 m and 14 m, the average interval is 15 m. The physical simulation step is basically consistent with the measured results, indicating that the simulation is reliable.
Meanwhile, according to the physical similarity simulation experiment, the basic laws of overlying strata of No. 22201 working face are basically as follows: The first caving of main roof interval of is 56 m, and the roof caving height is 17.5 m. The average period of the weighting interval is 16 m. When the working face advanced to 97 m, the face reaches full mining. The breaking angle of the roof is 63°-68°. After full mining, the step cracks reached 2 m, and the maximum large subsidence of the surface reached 3 m after the overlying rock was stabilized. The results of the above simulation are in agreement with the results of the field measurement.

4.2. FAP Distribution Characteristics and Observation of the Overburden

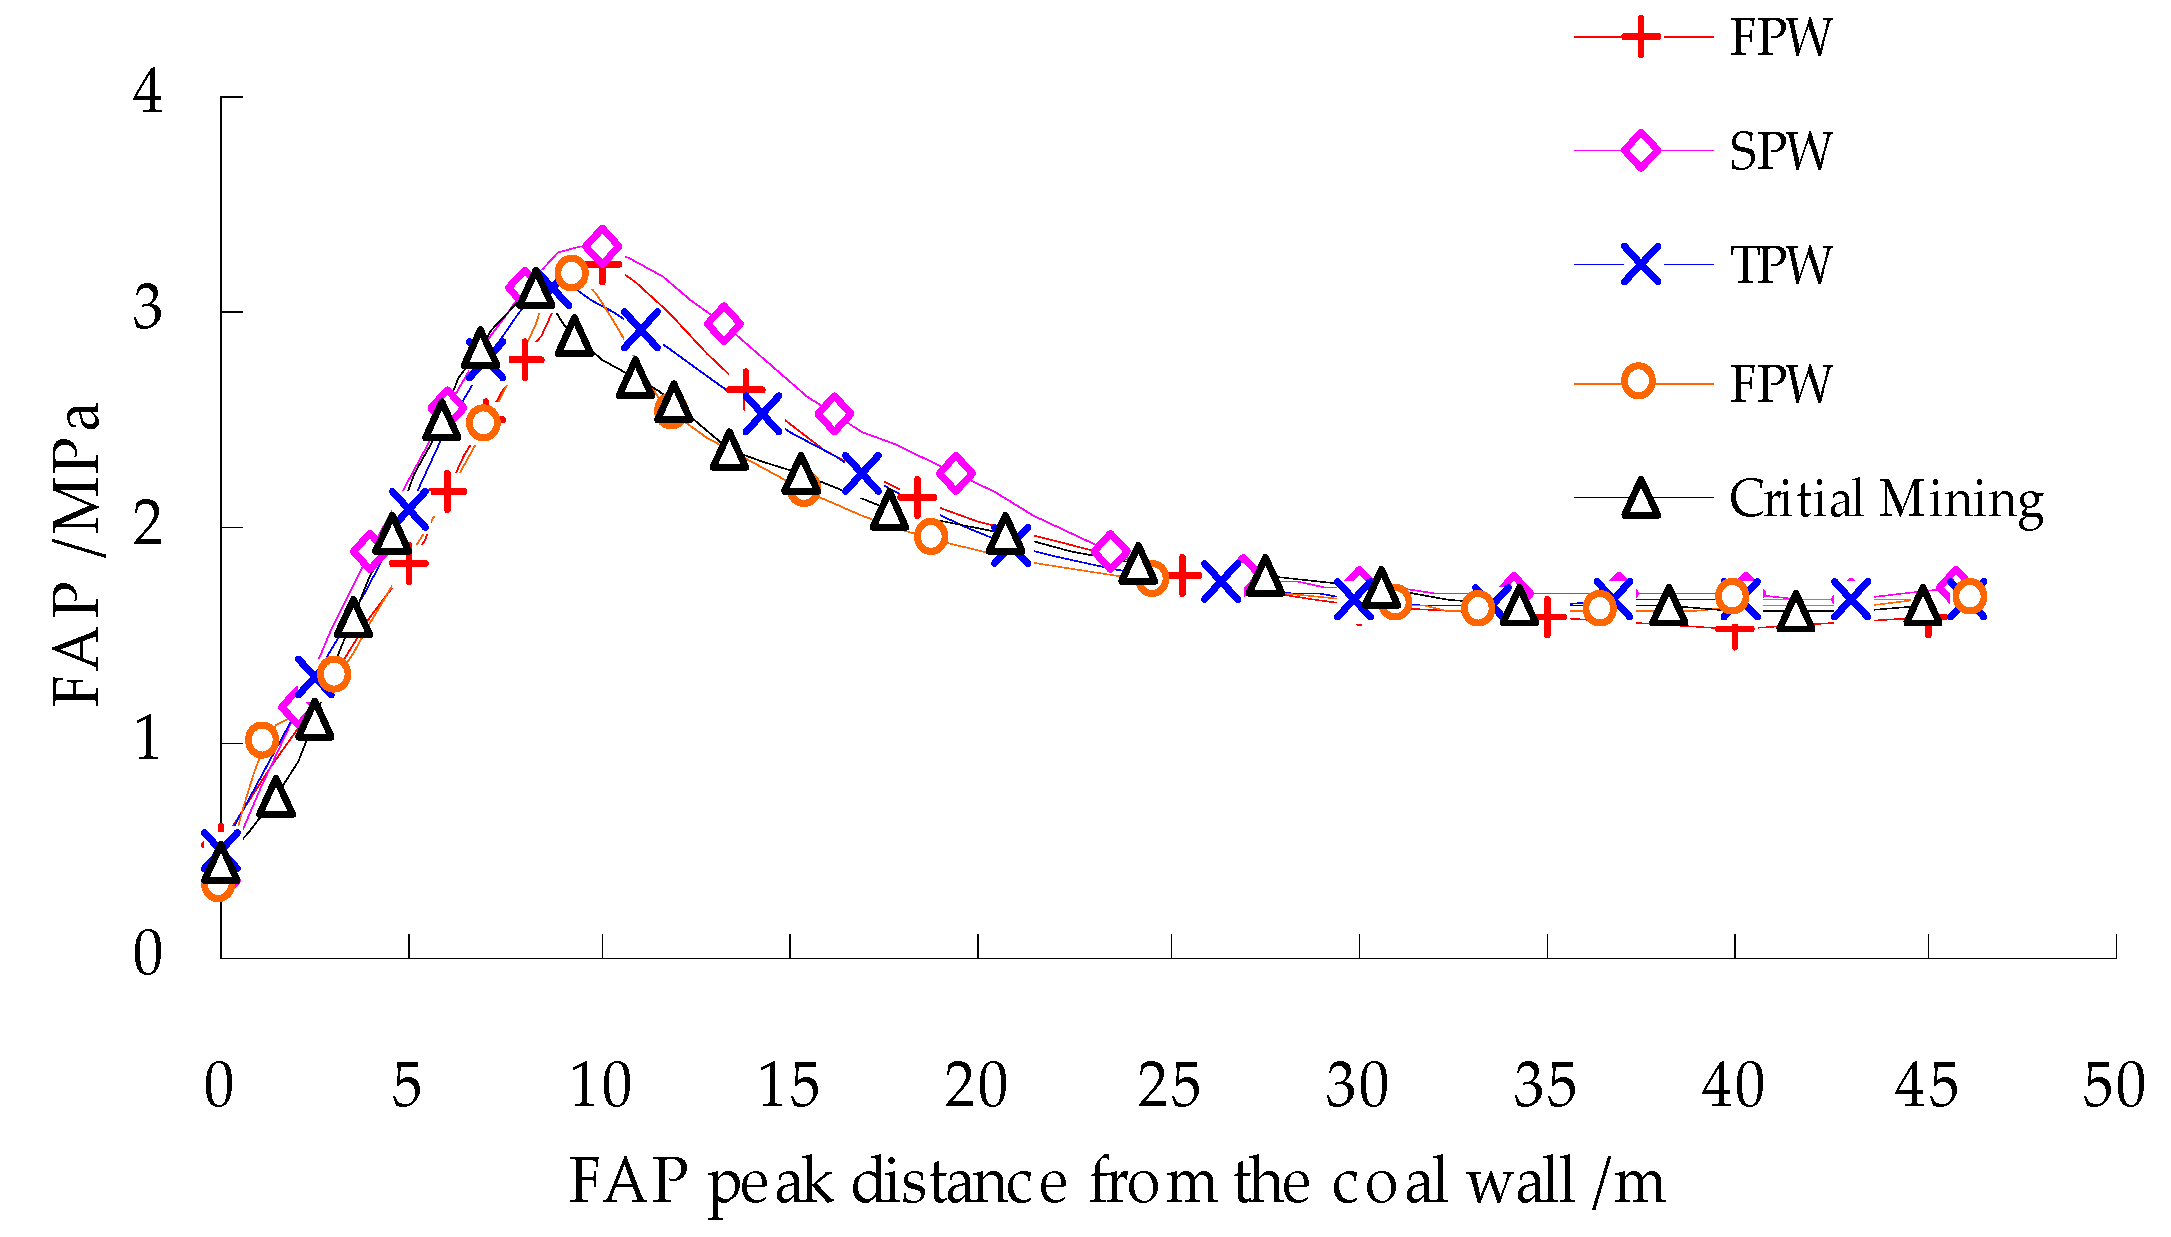
During the first weighting period, the FAWR range of the working face is 35 m, the peak value is about 8m in front of the working face, the maximum value is close to 2.98 MPa, and the peak coefficient is 1.87. During the period of periodic weighting, the FAWR peak position is close to the coal wall, the peak value is 10m in front of the working face, the peak value is 3.5MPa, and the peak coefficient is 2.18, as shown in Figure 27. Through the real data of the floor wireless sensor, it can be seen that the significant influence range of the leading supporting weighting is 4~5 wireless sensors (the width of sensor is 3.5 cm), it converted to the actual value is about 15 m, which is in good agreement with the measured results.
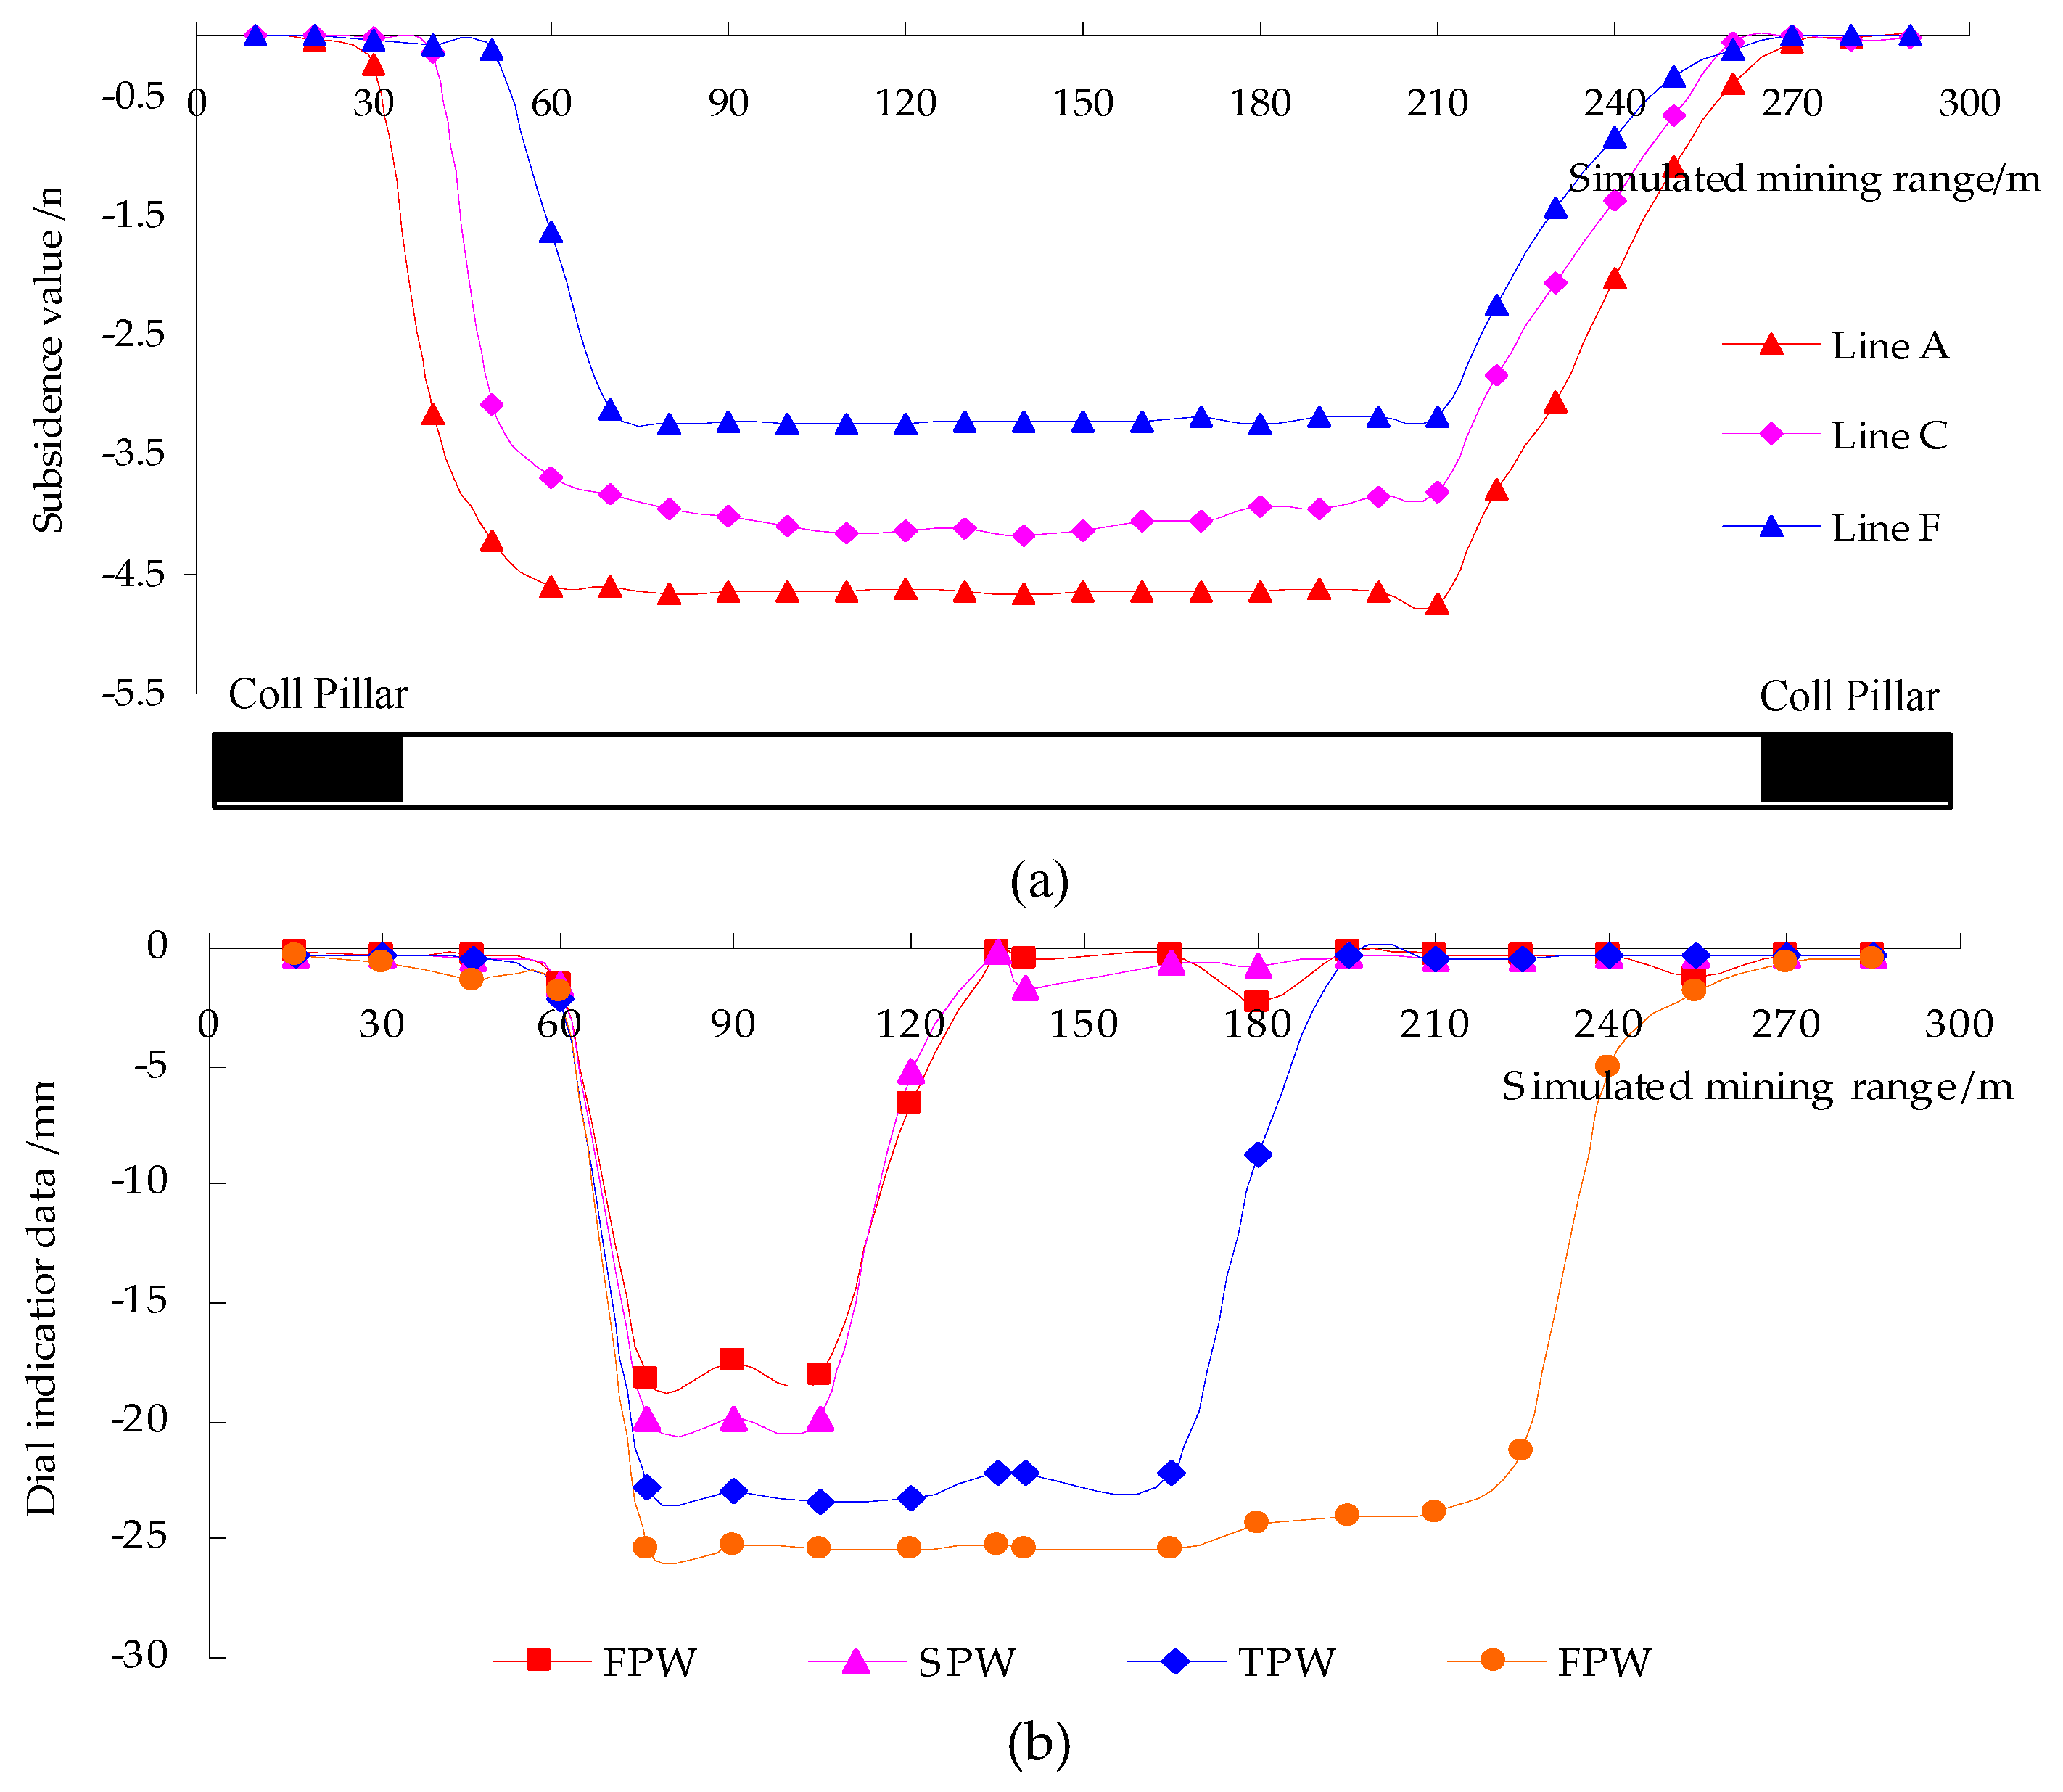
According to the lines of the physical model, the line A, line C and line F corresponding to the horizon of 10 m, 25 m and 60 m above the roof are selected. When the mining of the model was finished, the subsidence curve of the three lines in the bedrock is shown in Figure 28a. Compared between Line A and Line C, the overburden subsidence of the two horizon has a certain lag, and the subsidence values are different, which is consistent with the results described in Section 3.3. At the same time, the subsidence curve of the surface, as shown in Figure 20b, shows that the surface subsidence of the working face after the first weighting is 1.8 m, which is consistent with the results measured in the field (Figure 20b). The final subsidence value is about 2.5 m.

5. Numerical Simulation Results

5.1. The Law of Overlying Strata during the First Weighting

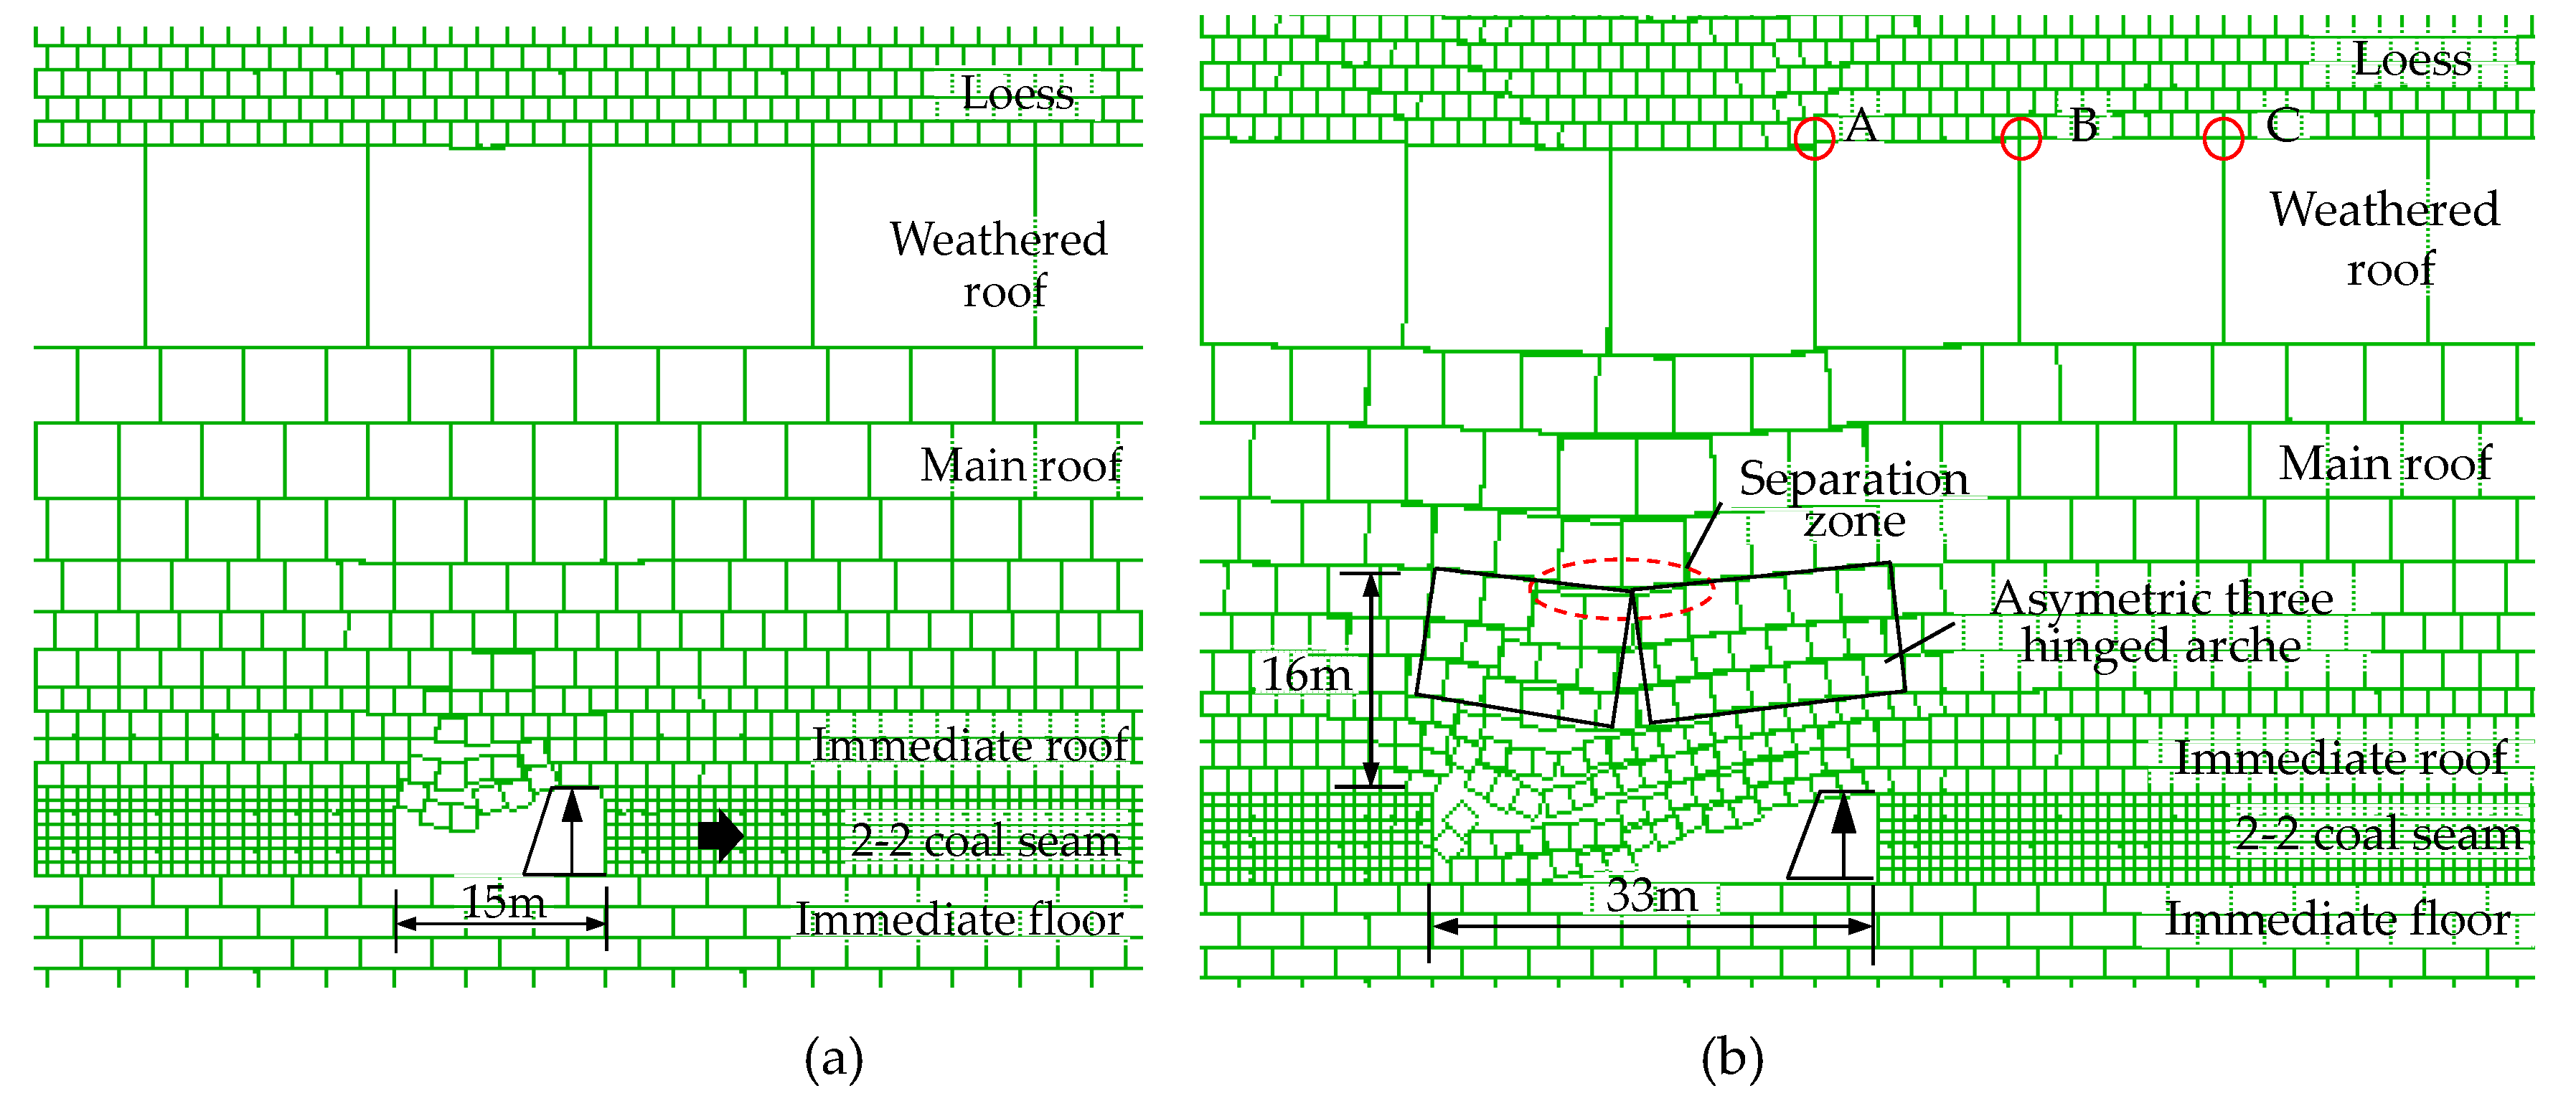
The numerical model is not supported at the setup entry. When the working face advanced to 15 m, the immediately roof appears obviously separated, and the displacement of the roof with horizon of 5~10 m is small. When the working face advanced to 33 m, the main roof first caved, and formed an asymmetric three hinged arch structure [1,5] (Figure 29).
The distance between the boundary pillars on both sides is 50 m in simulation model. By selecting the three points of A(80,68), B(96,68), C(112,68) of the weathered roof block, the law of roof movement of the working face during the first weighting and periodic weighting process is analyzed.
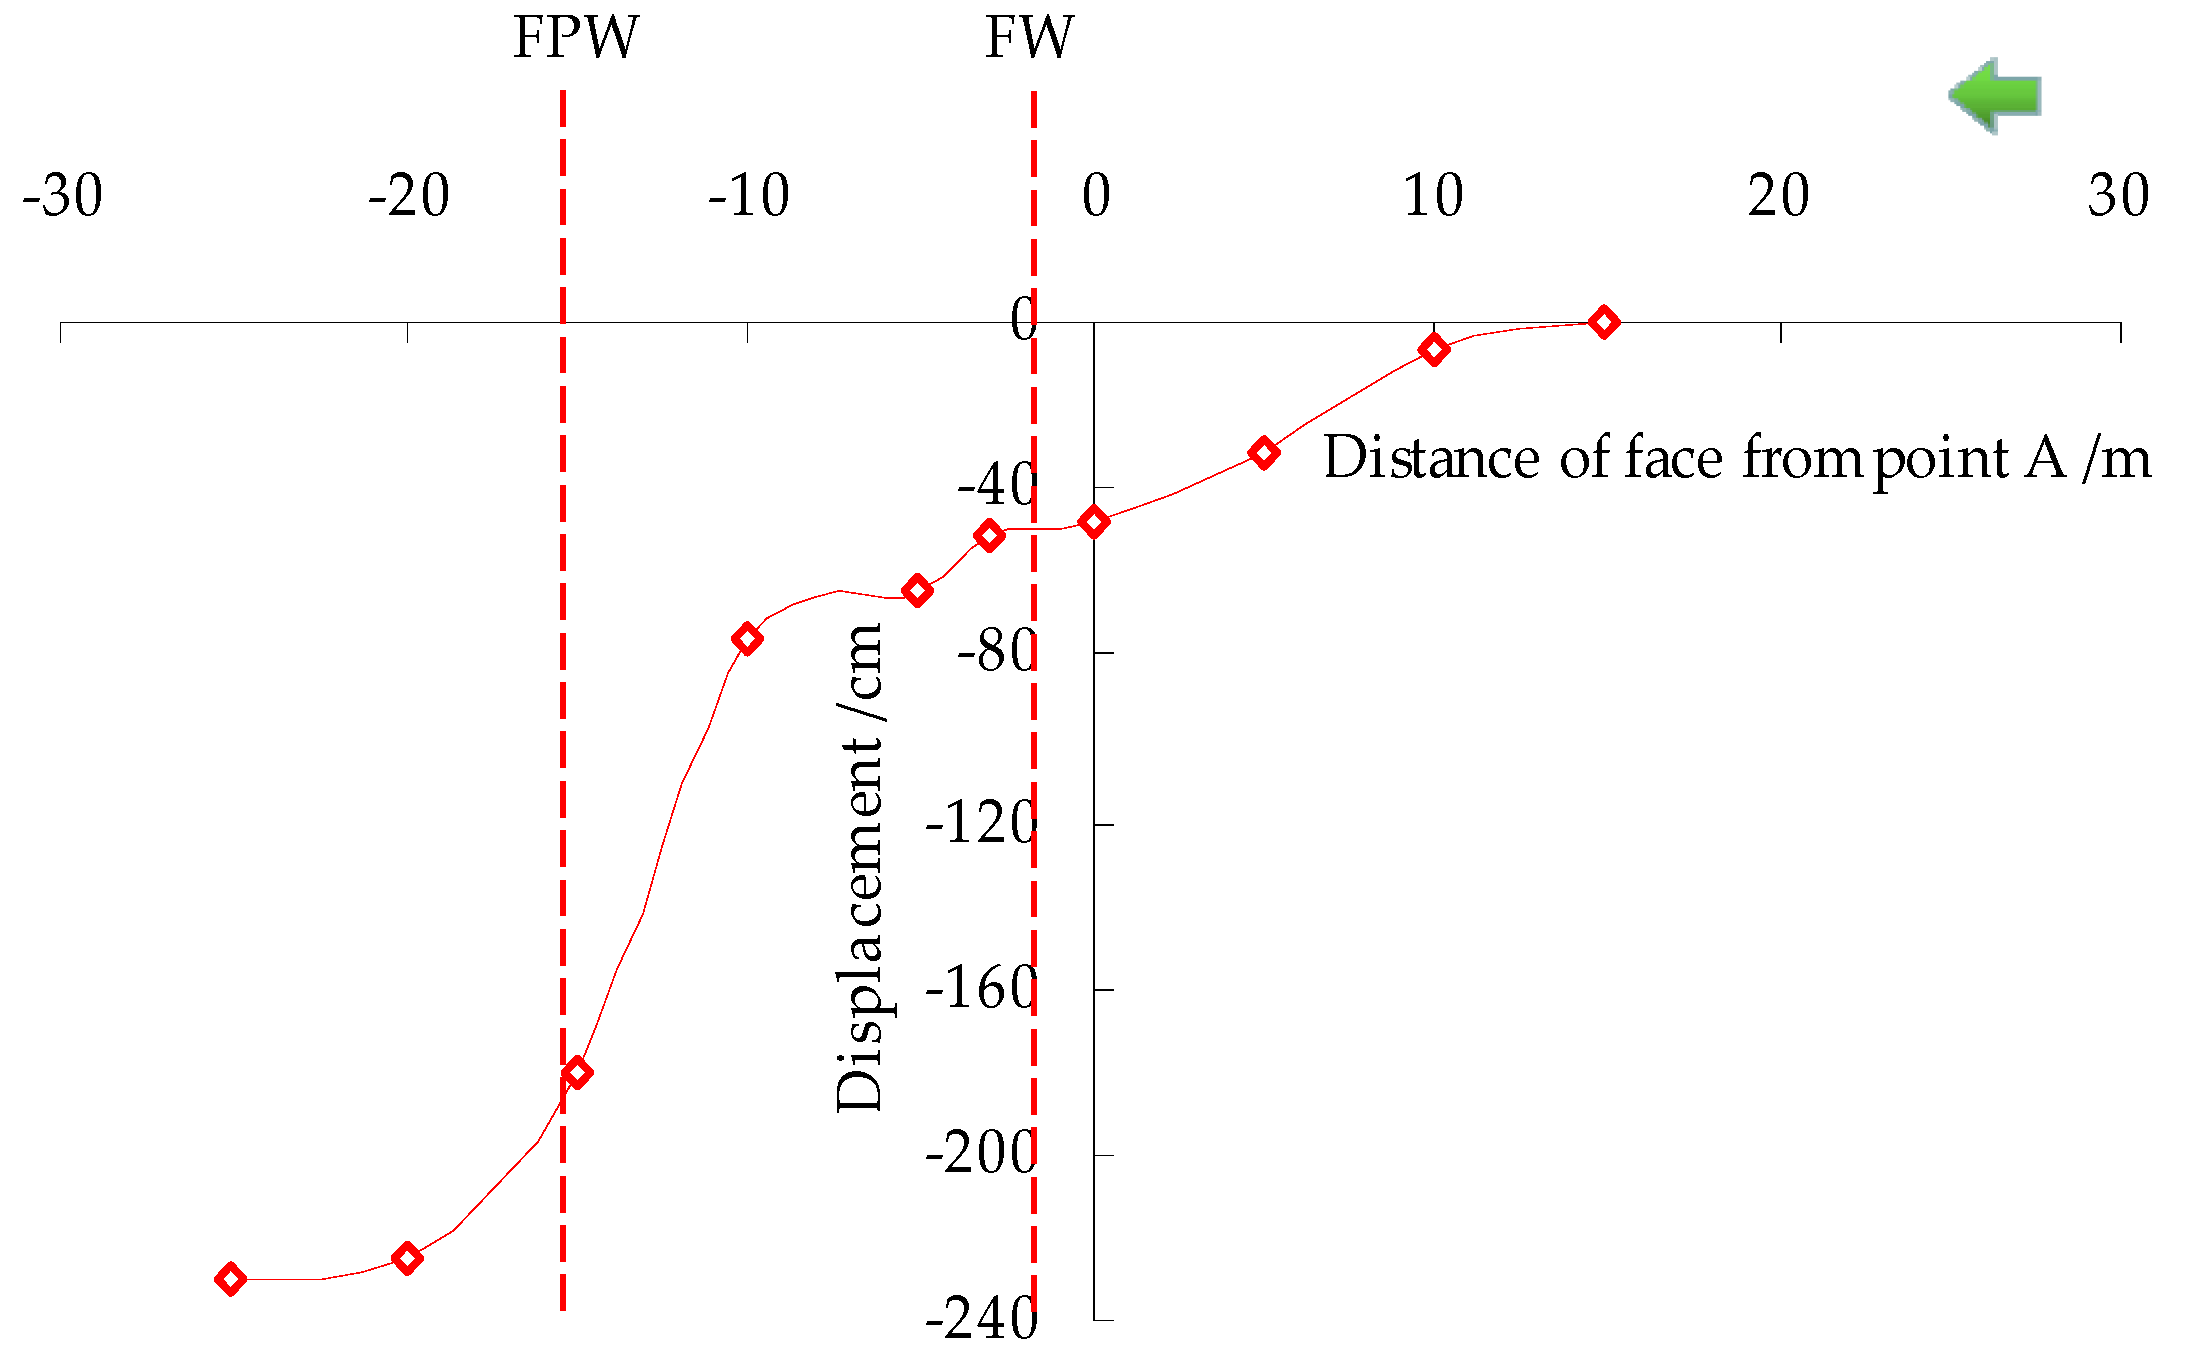
The point A is at located 30m ahead of the setup entry, and the displacement of point A with the working face advanced, as shown in Figure 30 (the zero point in Figure 30 represents the position of the A point), which has the following rules:
As the working face advanced to 25 m, the roof with horizon of 8 m in front of the working face moves ahead, indicating that cracks begin to appear in the layer 8 m ahead of the coal wall. When the working face advanced to 33 m, the working face is FW. During the FW, the displacement of the A point is about 0.4 m. After the FPW is finished, the overlying strata continues to sink, the subsidence value reaches 2.2 m.

5.2. The Law of Overlying Strata during the Period Weighting

When the working face advanced over 40 m, a large-scale movement occurs, the point A at 5 m behind the goaf of the working face. As the working face advanced to 47 m, the first period weighting occurred, the period weighting interval is 14 m, and the main roof is stepped, and the loose layer of the old top layer is sunk, as shown in Figure 31a. At the FPW, the vertical displacement of the point A is 1.9 m (Figure 30), and the displacement of the point B is 0.3 m (Figure 31c). It can be judged that the sinking of the main roof is 1.6 m at the FPW, which is basically consistent with the field results.
When the working face advanced to 63 m, the SPW happened, the period weighting interval is 16 m, and the leading break occurred at the position of about 6m in front of the coal wall, as shown in Figure 31b. At the SPW, compared with Figure 31c and Figure 31d the value of sinking displacement at point B is about 1.5 m. The main roof is basically stable after about 2 times interval behind the working face. Meanwhile, the weighting intervals of numerical simulation is about 14~16 m, and the breaking angle of numerical simulation is 63°~66°, which are in good agreement with the measured results in the field.
By analyzing the vertical displacement of the overlying strata at weighting, it is concluded that the working pressure has a time-space relationship with the strata movement. The strata movement generally exceeds the coal wall of the working face by 5~8 m, and the roof doesn’t move at 30 m behind the working surface. It is shown that the established numerical model is reasonable, construction of calibrated numerical model will add much more practical and universal value to this paper, and provide reference for the research of overburden movement of large mining height working face in SBTB.
In the future, it is necessary to research about evolution law of roof structure by numerical; 3D modeling should be performed to provide us more information about the roof structure evolution of large mining height working face in SBTB.

6. Conclusions

Through the field drilling measurement, combined with the displacement observation and drilling peeping results, it is concluded that the horizon of 0~10 m above the roof can monitor the displacement of roof advance movement, during the period of the weighting of large mining height in shallow buried thin bedrock (SBTB). The distance of advance movement is about 5~8 m, which can provide early warning of weighting for the field. When the working face over the measuring station about two period weighting intervals, the overburden movement in the goaf is basically stable. The "time and space" relationship between roof movement and mining pressure is revealed by numerical calculation. It is basically consistent with the field and physical simulation.
The measured height of the caving zone is 15~18 m, and the height of the caving zone is 3 times as high as that of the mining height, the development height of the weak fractured zone is about 35 m, which is about 6 times of that of the mining height, but the fractured zone develops to the surface. The length of the main roof about periodic weighting interval is 13~15 m, and the thickness is 12~15 m. At the same time, the average breaking angle is about 66°, which provides quantitative parameters for the analysis of the roof structure.
The results of field measurement, statistics and physical simulation analysis show that the working resistance of the first weighting support in the working face is 95.4% of the rated value, the first weighting range is wide and the strength is large, the average periodic weighting interval is 13 m, the yield pressure appears obviously in the middle of the working face, and the average working resistance of the support is 10,343 kN/ frame, and the practical effect is good.
The peak value of leading support pressure in SBTB is close to the coal wall, which is 5 m in front of the working face, the range of significant influence area of support pressure is 10 m, and the range of general influence area is 15 m. Therefore, it is necessary to strengthen protective measures in the process of production practice.

Author Contributions

Conceptualization, Q.H.; Experimental Design, Q.H. and Y.H.; Validation, Q.H. and Y.H.; Data Curation, Y.H.; Supervision, Q.H.; Writing —Original Draft Preparation, Y.H.; Writing—Review & Editing, Q.H. and Y.H.; Supervision, Q.H.; Project Administration, Q.H.; Funding Acquisition, Q.H.

Funding

This research was funded by the National Natural Science Foundation of China, grant number No.51674190 and No. 51174278. Natural Science Basic Research Program of Shaanxi, program No.2019JLP-08.

Acknowledgments

We thank the National Natural Science Foundation of China and Natural Science Basic Research Program of Shaanxi for its support of this study. We thank the academic editors and anonymous reviewers for their kind suggestions and valuable comments.

Conflicts of Interest

The authors declare no conflict of interest.

References

  1. Huang, Q.X. Study on roof structure and ground control in shallow seam longwall mining; China University of Mining and Technology press: Xuzhou, China, 2000. [Google Scholar]
  2. Wang, S.M.; Huang, Q.X.; Fan, L.M.; Wang, W.K. The Key Technology of Water Conservation Mining in Fragile Ecologically Mining Coal Resources; Science Press: Beijing, China, 2010. [Google Scholar]
  3. Sadasivam, S.; Thomas, H.R.; Zagorscak, R.; Davies, T.; Price, N. Baseline geochemical study of the Aberpergwm mining site in the South Wales Coalfield. J. Geo. Exlpor. 2019, 202, 100–112. [Google Scholar] [CrossRef]
  4. Szurgacz, D.; Brodny, J. Analysis of the Influence of Dynamic Load on the Work Parameters of a Powered Roof Support’s Hydraulic Leg. Sustainability 2019, 11, 2570. [Google Scholar] [CrossRef]
  5. Ritesh, L.D.; Murthy, V.M.S.R.; Kalendra, S. Semi-empirical model for predicting pot-hole depth in underground coal mining. Current Sci. 2018, 115, 1761–1769. [Google Scholar] [CrossRef]
  6. Maleki, H. Coal pillar mechanics of violent failure in U.S. Mines. Int. J. Min. Sci. Technol. 2017, 27, 387–392. [Google Scholar] [CrossRef]
  7. Huang, Q.X.; He, Y.P.; Cao, J. Experimental investigation on crack development characteristics in shallow coal seam mining in China. Energies 2019, 12, 1302. [Google Scholar] [CrossRef]
  8. Li, G.D.; Cao, S.G.; Luo, F.; Li, Y.; Wei, Y.X. Research on mining-induced deformation and stress, insights from physical modeling and theoretical analysis. Arabia J. Geo. 2018, 11, 100. [Google Scholar] [CrossRef]
  9. Holla, L.; Buizen, M. Strata movement due to shallow longwall mining and the effect on ground permeability. AusIMM Bull. Proc. 1990, 295, 11–18. [Google Scholar]
  10. Huang, Q.X.; Qian, M.G.; Shi, P.W. Structural analysis of main roof stability during periodic weighting in longwall face. J. China Coal Soc. 1999, 24, 581–585. [Google Scholar]
  11. Hou, Z.J. Concept of both short voussoir beam and step beam in shallow seam and voussoir beam theory. J. China Coal Soc. 2008, 33, 1201–1204. [Google Scholar]
  12. Huang, Q.X. Experimental research of overburden movement and subsurface water seeping in shallow seam mining. J. Univ. Sci. Tech Beijing 2007, 14, 483–489. [Google Scholar] [CrossRef]
  13. Huang, Q.X. Study on loading distribution law on key roof and its structure upon mining face under thick sandy horizon. J. China Univ. Min. Technol. 2005, 34, 289–293. [Google Scholar]
  14. Zhang, Z.Q.; Xu, J.L.; Liu, H.L.; Li, H.W. Influencing laws study of depth of gully on dynamic strata pressure of working face in shallow coal seams. J. Min. Saf. Eng. 2013, 30, 501–505. [Google Scholar]
  15. Ju, J.F.; Xu, J.L. Prevention measures for support crushing while mining out the upper coal pillar in close distance shallow seams. J. Min. Saf. Eng. 2013, 30, 323–330. [Google Scholar]
  16. Zhu, W.B.; Qi, X.R.; Ju, J.F.; Xu, J.M. Mechanisms behind strong strata behaviour in high longwall mining face-ends under shallow covers. J. Geo. Eng. 2019, 16, 559–570. [Google Scholar] [CrossRef] [Green Version]
  17. Wang, F.T.; Duan, C.H.; Tu, S.H.; Liang, N.N.; Bai, Q.S. Hydraulic support crushed mechanism for the shallow seam mining face under the roadway pillars of room mining goaf. Int. J. Min. Sci. Eng. 2017, 27, 853–860. [Google Scholar] [CrossRef]
  18. Reed, G.; Mctyer, K.; Frith, R. An assessment of coal pillar system stability criteria based on a mechanistic evaluation of the interaction between coal pillars and the overburden. Int. J. Min. Sci. Eng. 2017, 27, 9–15. [Google Scholar] [CrossRef]
  19. Singh, K.B.; Kumar, P.; Kiran, S.; Saxena, N.C.; Singh, B. Subsidence behavior of Motur clays. J. Mines Met Fuels. 1992, 2, 93–100. [Google Scholar]
  20. Peng, S.S. Topical areas of research needs in ground control a state of the art review on coal mine ground control. Int. J. Min. Sci. Technol. 2015, 25, 1–6. [Google Scholar] [CrossRef]
  21. Satya, P.S.; Manish, Y.; Arka, J.D.; Amar, P.; Ajay, K. Multivariate statistical approach for assessment of subsidence in Jharia coalfields, India. Arab J. Geosci. 2017, 10, 191. [Google Scholar]
  22. Huang, Q.X. Study on water resisting property of subsurface aquiclude in shallow coal seam mining. J. Coal Sci. Eng. 2008, 14, 369–372. [Google Scholar] [CrossRef]
  23. Li, Y.; Peng, S.S.; Zhang, J.W. Impact of longwall mining on groundwater above the longwall panel in shallow coal seams. J. Rock Mech. Geo. Eng. 2015, 7, 298–305. [Google Scholar] [CrossRef] [Green Version]
  24. Huang, Q.X. Research on roof control of water conservation mining in shallow seam. J. Min. Saf. Eng. 2017, 42, 50–55. [Google Scholar]
  25. Wang, S.R.; Wu, X.G.; Zhao, Y.H.; Hagan, P.; Cao, C. Evolution characteristics of composite pressure-arch in thin bedrock of overlying strata during shallow coal mining. Int. J. App. Mech. 2019, 11, 3. [Google Scholar] [CrossRef]
  26. Wang, F.T.; Tu, S.H.; Zhang, C.; Zhang, Y.W.; Bai, Q.S. Evolution mechanism of water-flowing zones and control technology for longwall mining in shallow coal seams beneath gully topography. Environ. Earth Sci. 2016, 75, 1309. [Google Scholar] [CrossRef]
  27. Qian, M.G.; Shi, P.W.; Xu, J.L. Coal mine pressure and strata control; China University of Mining and Technology Press: Xuzhou, China, 2010. [Google Scholar]
  28. Liu, C.Y.; Li, H.M.; Mitri, H.; Jiang, D.J.; Li, H.G.; Feng, J.F. Voussoir beam model for lower strong roof strata movement in longwall mining-Case study. J. Rock. Mech. Geo. Eng. 2017, 9, 1171–1176. [Google Scholar] [CrossRef]
  29. Huang, Q.X. Ground pressure behavior and definition of shallow seams. J. Rock Mech. Eng. 2002, 21, 1174–1177. [Google Scholar]
  30. Huang, Q.X.; Zhou, J.L.; Ma, L.T.; Tang, P.F. Double key stratum structure analysis of large mining height longwall face in nearly shallow coal seam. J. China Coal Soc. 2017, 42, 2504–2510. [Google Scholar]
  31. Gong, P.L.; Jin, Z.M. Study on the structure characteristics and movement laws of overlying strata with large mining height. J. China Coal Soc. 2004, 29, 7–12. [Google Scholar]
  32. Gong, P.L.; Jin, Z.M. Mechanical model study on roof control for fully-mechanized coal face with large mining height. Chin. J. Rock Mech. Eng. 2008, 27, 193–198. [Google Scholar]
  33. Xu, J.L.; Zhu, W.B.; Wang, X.Z.; Yi, M.S. Classification of key stratum structure of overlying strata in shallow coal seam. J. China Coal Soc. 2009, 34, 865–870. [Google Scholar]
  34. Yuan, Y.; Tu, S.H.; Zhang, X.; Li, B. System dynamics model of the support- surrounding rock system in fully mechanized mining with large mining height face and its application. Int. J. Min. Sci. Tec. 2013, 23, 879–884. [Google Scholar] [CrossRef]
  35. Wang, G.F.; Pang, Y.H. Full-mechanized coal mining and caving mining method evaluation and key technology for thick coal seam. J. China Coal Soc. 2018, 43, 33–42. [Google Scholar]
  36. Wang, C.L.; Zhang, C.S.; Zhao, X.D.; Liao, L.; Zhang, S.L. Dynamic structural evolution of overlying strata during shallow coal seam longwall mining. Int. J. Rock Mech. Min. Sci. 2018, 103, 20–32. [Google Scholar] [CrossRef]
  37. Li, M.; Zhang, J.X.; Huang, Y.L.; Gao, R. Measurement and numerical analysis of influence of key stratum breakage on mine pressure in top-coal caving face with super great mining height. J. Cent. South. Univ. 2017, 24, 1881–1888. [Google Scholar] [CrossRef]
  38. Li, D.; Jiang, F.X.; Wang, C.W.; Tian, Z.J.; Wang, Y. Study on the mechanism and prevention technology of “square position” and “stress breakdown effect” inducing rockburst. J. Min. Saf. Eng. 2018, 35, 1015–1021. [Google Scholar]
  39. Yao, Q.L.; Li, X.H.; Sun, B.Y.; Ju, M.H.; Chen, T.; Zhou, J.; Liang, S.; Qu, Q.D. Numerical investigation of the effects of coal seam dip angle on coal wall stability. Int. J. Rock Mech. Mining Sci. 2017, 100, 298–309. [Google Scholar] [CrossRef]
  40. Sun, Y.J.; Zuo, J.P.; Murat, K.; Wang, J.T. Investigation of movement and damage of integral overburden during shallow coal seam mining. Int. J. Rock Mech. Mining Sci. 2019, 117, 63–75. [Google Scholar] [CrossRef]
Figure 1. Occurrence feature of No.2-2 coal seam in Jurassic Coalfield in Shenfu mining area, China [2]: (a) the contour of thickness of No.2-2 coal seam; (b) the contour of depth of No.2-2 coal seam.
Energies 12 04208 g001
Figure 2. 176# drilling histogram of No. 22201 working face.
Energies 12 04208 g002
Figure 3. Sectional view of the setup entry of No. 22201 working face.
Energies 12 04208 g003
Figure 4. Drillholes design in AHG: (a) Spatial distribution diagram; (b) Sectional view.
Energies 12 04208 g004
Figure 5. Field measurement equipment: (a) Drilling peep; (b) Multi-point displacement.
Energies 12 04208 g005
Figure 6. Pressure monitoring equipment in the 22201 working face.
Energies 12 04208 g006
Figure 7. Physical simulation experiment process: (a) Field drilled core; (b) Test specimen; (c) Different experimental stage phenomenon records.
Energies 12 04208 g007
Figure 8. Coal and rock SEM results: (a) 2-2 coal; (b) Coarse sandstone; (c) Muddy siltstone; (d) Mudstone; (e) Carbonaceous mudstone; (f) Silt stone; (g) and (h) are Weathered bedrock.
Energies 12 04208 g008
Figure 9. Experimental model diagram of similar simulation (Similarity ratio is 100).
Energies 12 04208 g009
Figure 10. Experimental equipment: (a) Power box of wireless sensor; (b) Wireless sensor and receiver; (c) Total Station; (d) Dial indicator.
Energies 12 04208 g010
Figure 11. The online monitoring report at different times: (a) FW; (b) FPW; (c) SPW; (d) TPW.
Energies 12 04208 g011
Figure 12. Working resistance at different weighting times.
Energies 12 04208 g012
Figure 13. Supportability statistics of the support.
Energies 12 04208 g013
Figure 14. Peephole drilling break position evolution diagram.
Energies 12 04208 g014
Figure 15. Drilling peep results of the station I: (a) the horizon of 24.4 m; (b) the horizon of 22.1 m; (c) the horizon of 6 m; (d) the horizon of 4.8 m; (e) the horizon of 9.3 m; (f) the horizon of 16.2 m.
Energies 12 04208 g015
Figure 16. Roof failure schematic diagram along the dip directions.
Energies 12 04208 g016
Figure 17. Displacement change of the D drillholes at the I station.
Energies 12 04208 g017
Figure 18. Displacement of the E and F drillholes at the I station.
Energies 12 04208 g018
Figure 19. Displacement of the E and F drillholes at the II station: (a) displacement of the E and F drillholes; (b) displacement of the E2(20 m/12 m) and E2(20 m/25 m); (c) displacement of the E2(10 m/ 5.5 m) and F2(10 m/−1.7 m).
Energies 12 04208 g019
Figure 20. Field surface cracks: (a) sinking funnel; (b) step crack.
Energies 12 04208 g020
Figure 21. Roof caving: (a) advanced to 42m; (b) advanced to 56 m.
Energies 12 04208 g021
Figure 22. The working face advanced to 68 m
Energies 12 04208 g022
Figure 23. Development of overburden pre-fracture: (a) advanced to 78 m; (b) advanced to 80 m.
Energies 12 04208 g023
Figure 24. The main roof caving moment: (a) advanced to 82 m; (b) advanced to 98 m.
Energies 12 04208 g024
Figure 25. The main roof caving moment: (a) advanced to 114 m; (b) advanced to 132 m.
Energies 12 04208 g025
Figure 26. Panorama of the simulated working face after excavation.
Energies 12 04208 g026
Figure 27. Front abutment working resistance distribution curve.
Energies 12 04208 g027
Figure 28. Subsidence curve of bedrock and surface: (a) subsidence curve of line A, line C and line F; (b) subsidence curve of surface.
Energies 12 04208 g028
Figure 29. Overburden structure under different distances: (a) advanced to 15 m; (b) advanced to 33 m.
Energies 12 04208 g029
Figure 30. The displacement of point A.
Energies 12 04208 g030
Figure 31. Movement and displacement of overburden during periodic weighting: (a) FPW; (b) SPW; (c) the displacement of point B; (d) the displacement of point C.
Energies 12 04208 g031
Table 1. The parameters of coal and roof of No. 22201 working face.
LithologyBulk Density (kg/m3)Compressive Strength (MPa)Elastic Modulus ×104 (MPa)Poisson’s RatioCohesion (MPa)Internal Friction AngleTensile Strength (MPa)
Coal1.3235.5728270.19///
Coarse sandstone2.6818.9422170.221.4031.970.46
Muddy siltstone2.4539.0475880.144.9534.291.82
Mudstone2.4031.5729560.194.2932.591.18
Carbonaceous mudstone2.1719.7926180.212.6031.721.72
Siltstone2.4122.1629010.202.7932.671.04
Weathered siltstone2.1112.2737290.181.7530.470.47
Table 2. Physical simulation experimental material ratio of No. 22201 working face.
LithologyMatch Ratio NumberConsumables (kg)
SandGypsumCalcium CarbonateCoal Ash
Drif sandSand:Calcium Carbonate=9:18.64/0.96
LoessSand: Soil: Oil=4.5:4.5:1Sand (8.64) : Soil (8.64) : Oil (1.92)
Silt stone7468.400.480.72
Silt stone7378.400.360.84
Coarse sandstone7288.400.240.96
Medium sandstone6468.230.550.82
Quartz mudstone6468.230.550.82
Carbonaceous mudstone7378.400.360.84
Quartz mudstone6468.230.550.82
Muddy siltstone7468.400.480.72
Coarse sandstone6468.230.550.82
No. 2−2 seam20:20:1:53.800.190.953.80