Abstract
The thermal characteristics of the positive leader discharges occurring under the different electrode terminals in a 1 m rod-plate air gap were studied quantitatively using Mach–Zehnder interferometry and a high-speed video camera. When disturbed by the discharge channel, the interference fringes are distorted because of the change in the refractive index of air, which is related to the gas density. Therefore, the gas temperature and gas density distribution in the leader channel can be retrieved from the offset of the interference fringes. Based on these results, the thermal characteristics of the leader channel were studied under different electrode terminals with a radius of curvature of 2.5 mm and 5 mm for cone electrodes and a diameter of 40 mm for a spherical electrode. The results show that the gas temperature in the leader channel increased while the gas density decreased as the radius of curvature of the electrode terminal decreased. Additionally, a smaller radius of curvature leads to a larger thermal diameter, but the difference in the thermal diameter is not obvious; for the terminals used in this paper, the difference is within 2 mm.
1. Introduction
Overhead power transmission lines, which are used for long-distance transmission in power systems, are insulated by the air [1]. When the electric field reaches a specific threshold value, the air electrically breaks down and accidents occur [2]. Therefore, it is very important to study the mechanism of gas discharges in long air gaps via both simulations and experiments [3,4,5,6].
The leader discharge is the essential breakdown mechanism in long air gaps and leader discharges also exist widely in natural phenomena such as lightning [7,8,9,10,11,12,13]. The study of the characteristics of leader discharges can not only provide a basis for optimization of the external insulation in power systems, but also provides a theoretical basis for the design of insulation, which has great theoretical and practical application value.
The Renardières Laboratory established the first comprehensive system for the observation of long air gap discharges and divided the long air discharge process into three main stages: the streamer, the leader, and the final jump. [14,15,16,17]. The gas temperature of a leader channel can reach more than 1500 K [18,19,20] and the different gas temperatures will directly affect the ionization mechanism in the discharge process. Therefore, it is highly important to study the thermal characteristics of the leader channels. In short air gap discharges, emission spectroscopy, absorption spectroscopy, laser-induced fluorescence technology, the Rayleigh scattering method, the Schlieren method, and laser interferometry are widely used to quantitively study the thermal parameters of discharge processes [21,22,23,24,25,26]. However, when the gap is relatively large (e.g., more than 1 m), the streamer will transform into a leader, which is quite different to the typical short gap discharge process. In long gap discharges, the shock wave phenomenon has been observed in the air gap, and measurement of the shock wave propagation trajectory can provide an estimate of the energy injected into the leader channel during the discharge [27]. Cui et al. studied the dynamic expansion process and the thermal characteristics of the leader under a positive voltage impulse with different rise times using Mach–Zehnder (M–Z) interferometry [28]. Their results showed that the gas temperatures at the center of the leader channel were in the 5000–7000 K, 4000–6000 K, and 3000–4500 K ranges for voltages with rise times of 1.2 μs, 40 μs and 100 μs, respectively. For a discharge process with negative voltages, there exists bidirectional propagation and connection processes. The temperatures of the connecting area and of the two sides of the negative channels are approximately 800 K and 1500–1800 K, respectively. Meanwhile, the temperature at the discharge center is 1000–1500 K, and the gas density is approximately 20%–30% of the ambient density [29]. Zhao et al. used a calibrated Toepler’s lens-type Schlieren system and a numerical simulation model to perform a quantitative analysis of the temperature of the leader channel and proposed several suggestions for the application of quantitative Schlieren techniques to measure the temperatures of the leader channels. They found that the initial radius and the current distribution of the streamer have little effect on the simulation results for temperature [30].
In addition, the electrode terminals with their different radii of curvature also influence the leader discharge process. Uman photographed static images of air discharges in 10 m rod-plate air gaps [31]. It was concluded from these photographs that the optical diameter of the leader channel was approximately 4–8 mm and is related to the radius of the rod electrode. The discharge characteristics of the Franklin rod terminal, the multi-ring terminal and two other terminals that were similar to the early streamer emission (ESE) type dynasphere, were tested under the application of a compound voltage composed of a negative DC voltage and a negative switching pulse [32]. It was found that the initial formation time for the upward leader on the Franklin terminal was 10 μs longer than that for the other terminals.
In summary, different electrode terminals result in different discharge characteristics in leader channels and the thermal characteristics of the leader represent important parameters for leader discharges. Therefore, it is highly important to study the thermal characteristics of the leader channels under different electrode terminals. In this study, a measurement platform was built using M–Z interferometry. The radial temperature, the density distribution, and the thermal diameter in leader channels under different electrode terminals were obtained through displacement of the fringes in the interference images.
2. Principles of M–Z Interferometry
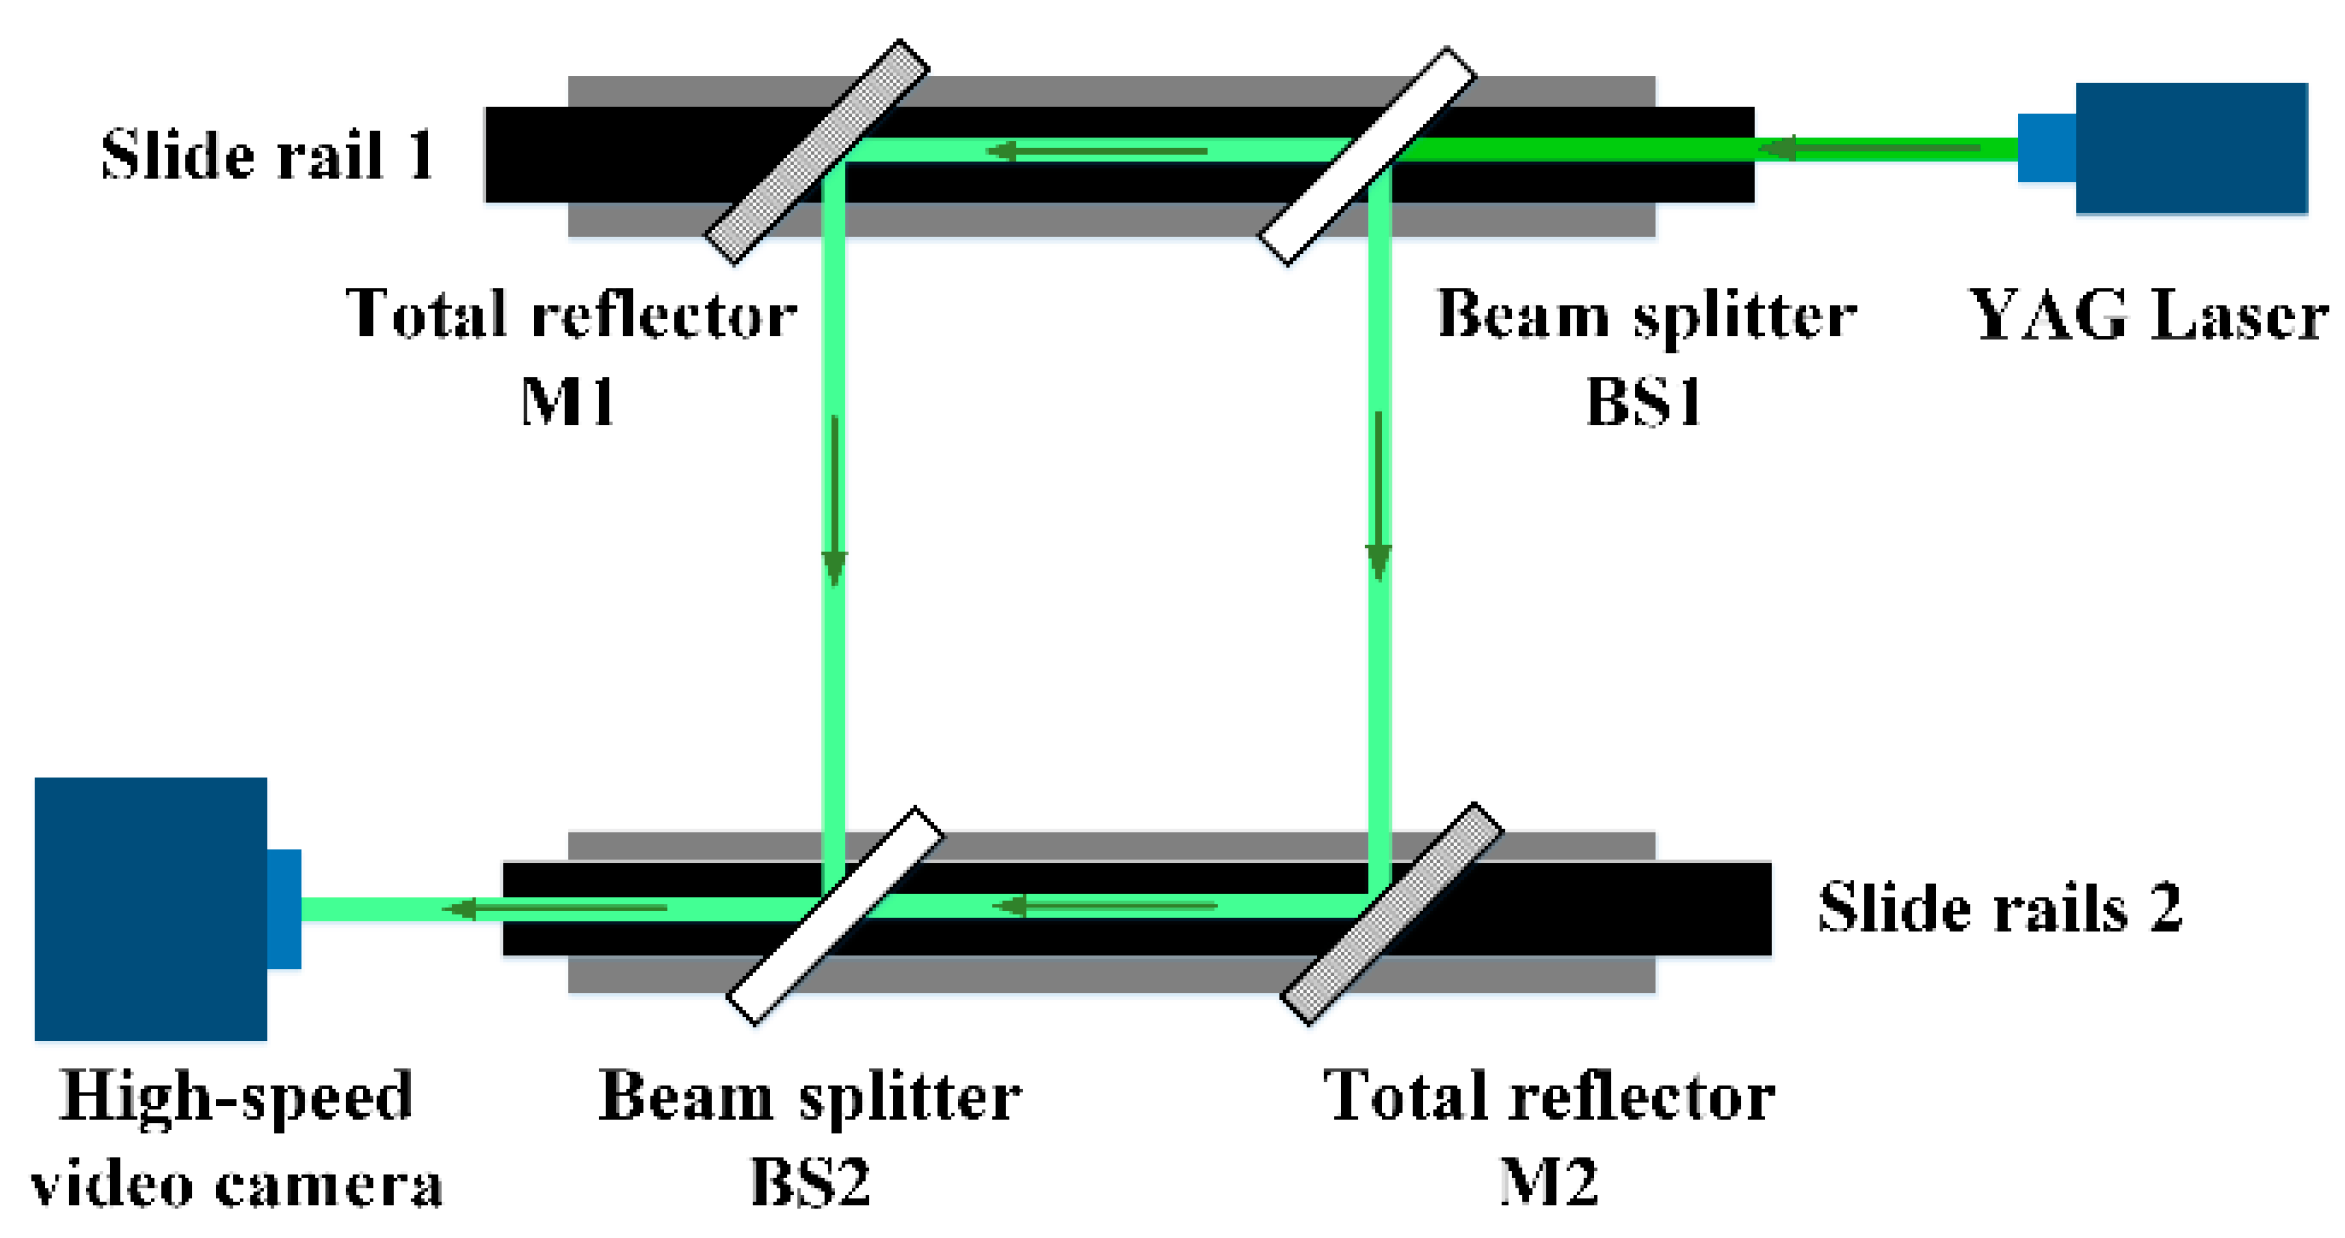
As shown in Figure 1, the beam splitters BS1 and BS2 and the full reflectors M1 and M2 are placed in a rectangle with all these elements oriented at 45° to the slide rail. The collimated laser beam emitted from the YAG (yttrium aluminum garnet) laser is divided into two equal-intensity beams by BS1. After reflection by M1 and M2, the two beams then converge at BS2. As shown, after the beams are reflected and transmitted by BS2 the two beams finally interfere with each other. The resulting interference image can be captured using a high-speed video camera. When there are no disturbances on the optical path, the interference images are horizontal fringes that lie parallel to each other. When a leader channel passes through the optical path, the refractive index of the air changes, and this results in the interference fringes being distorted.
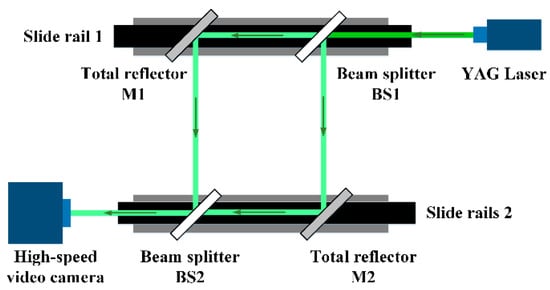
Figure 1.
Schematic diagram of a Mach–Zehnder (M–Z) interferometer.
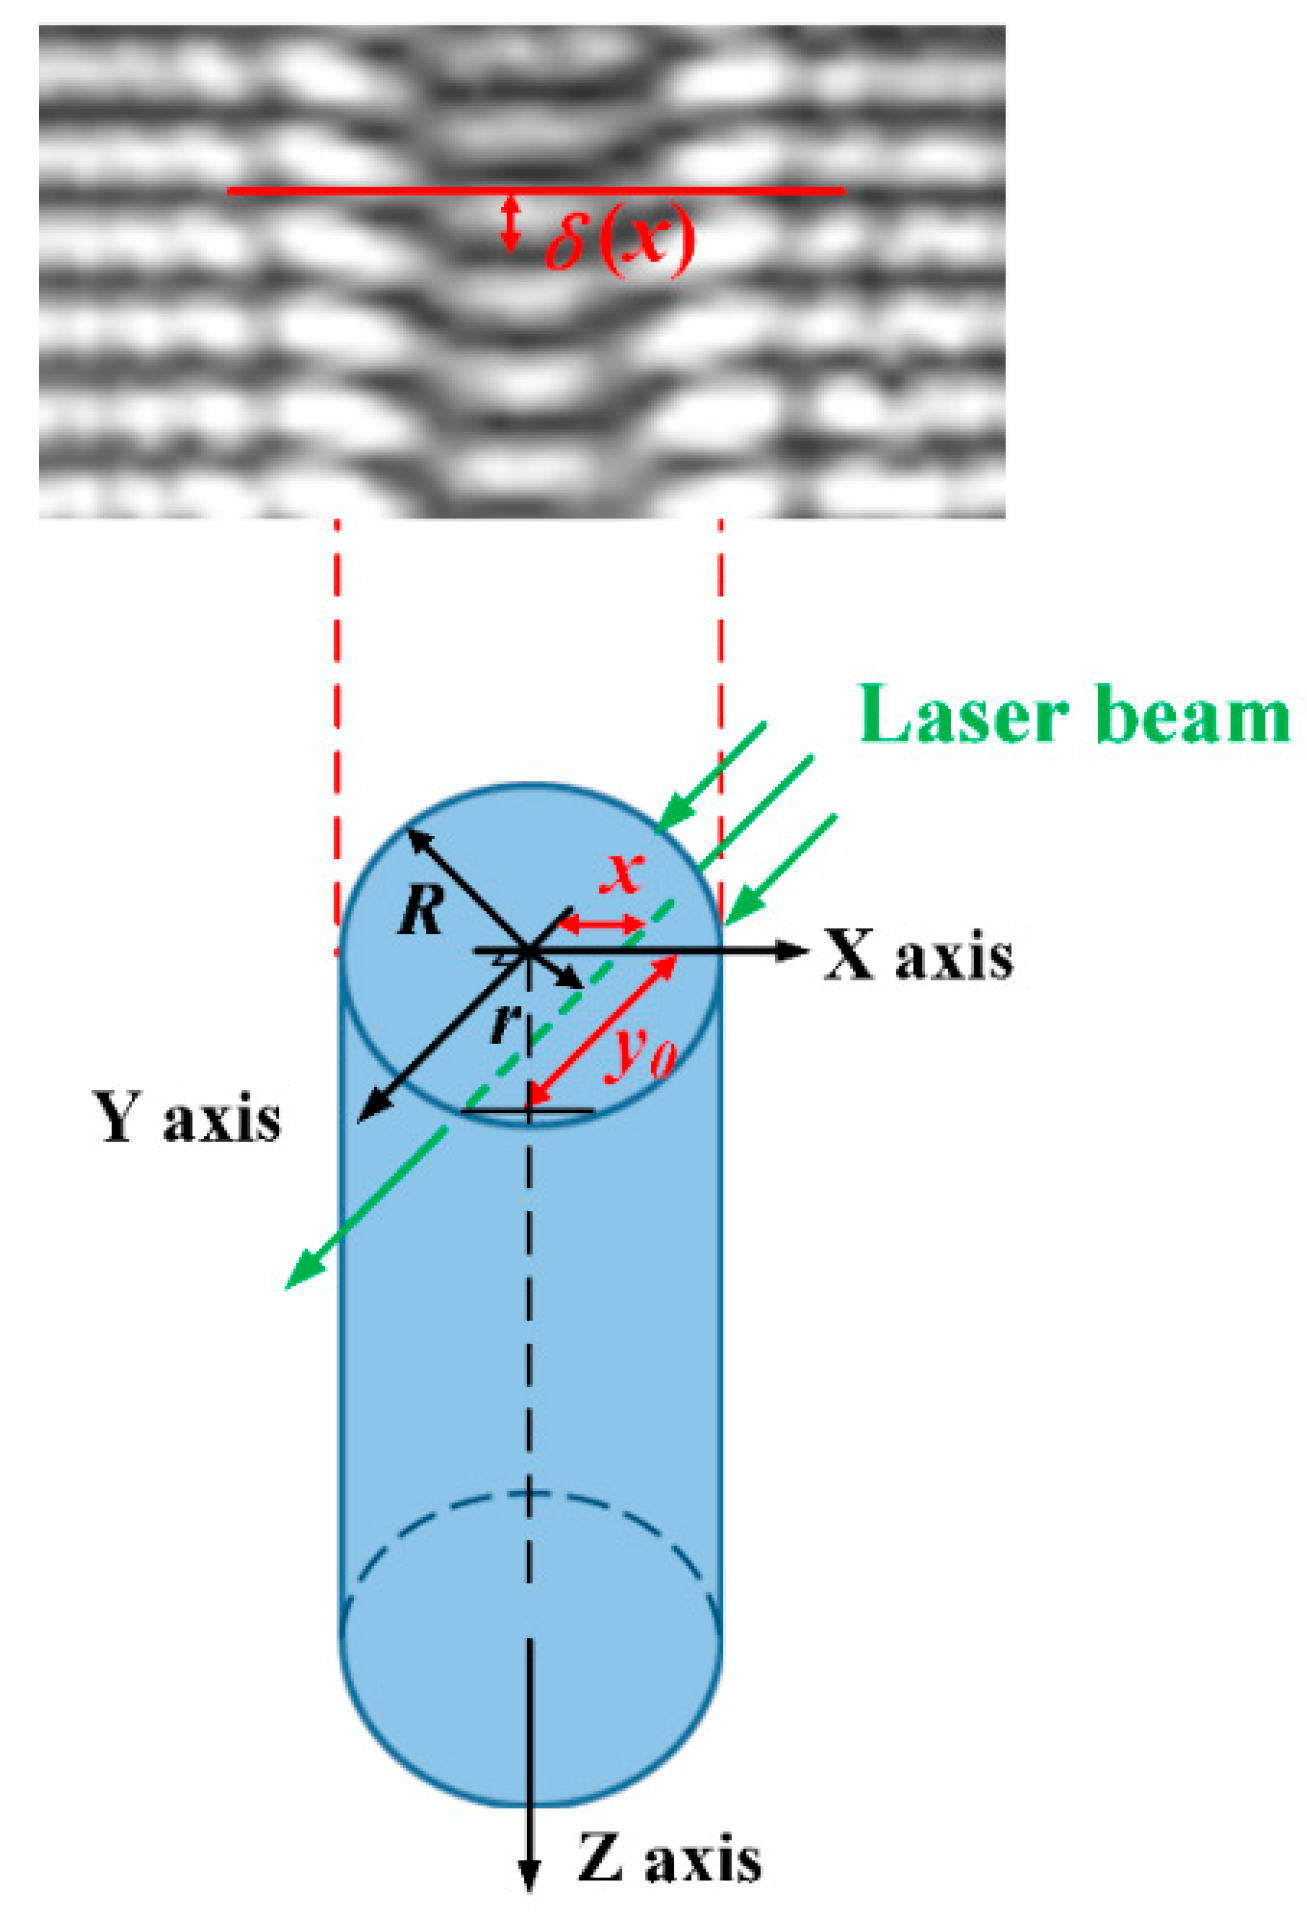
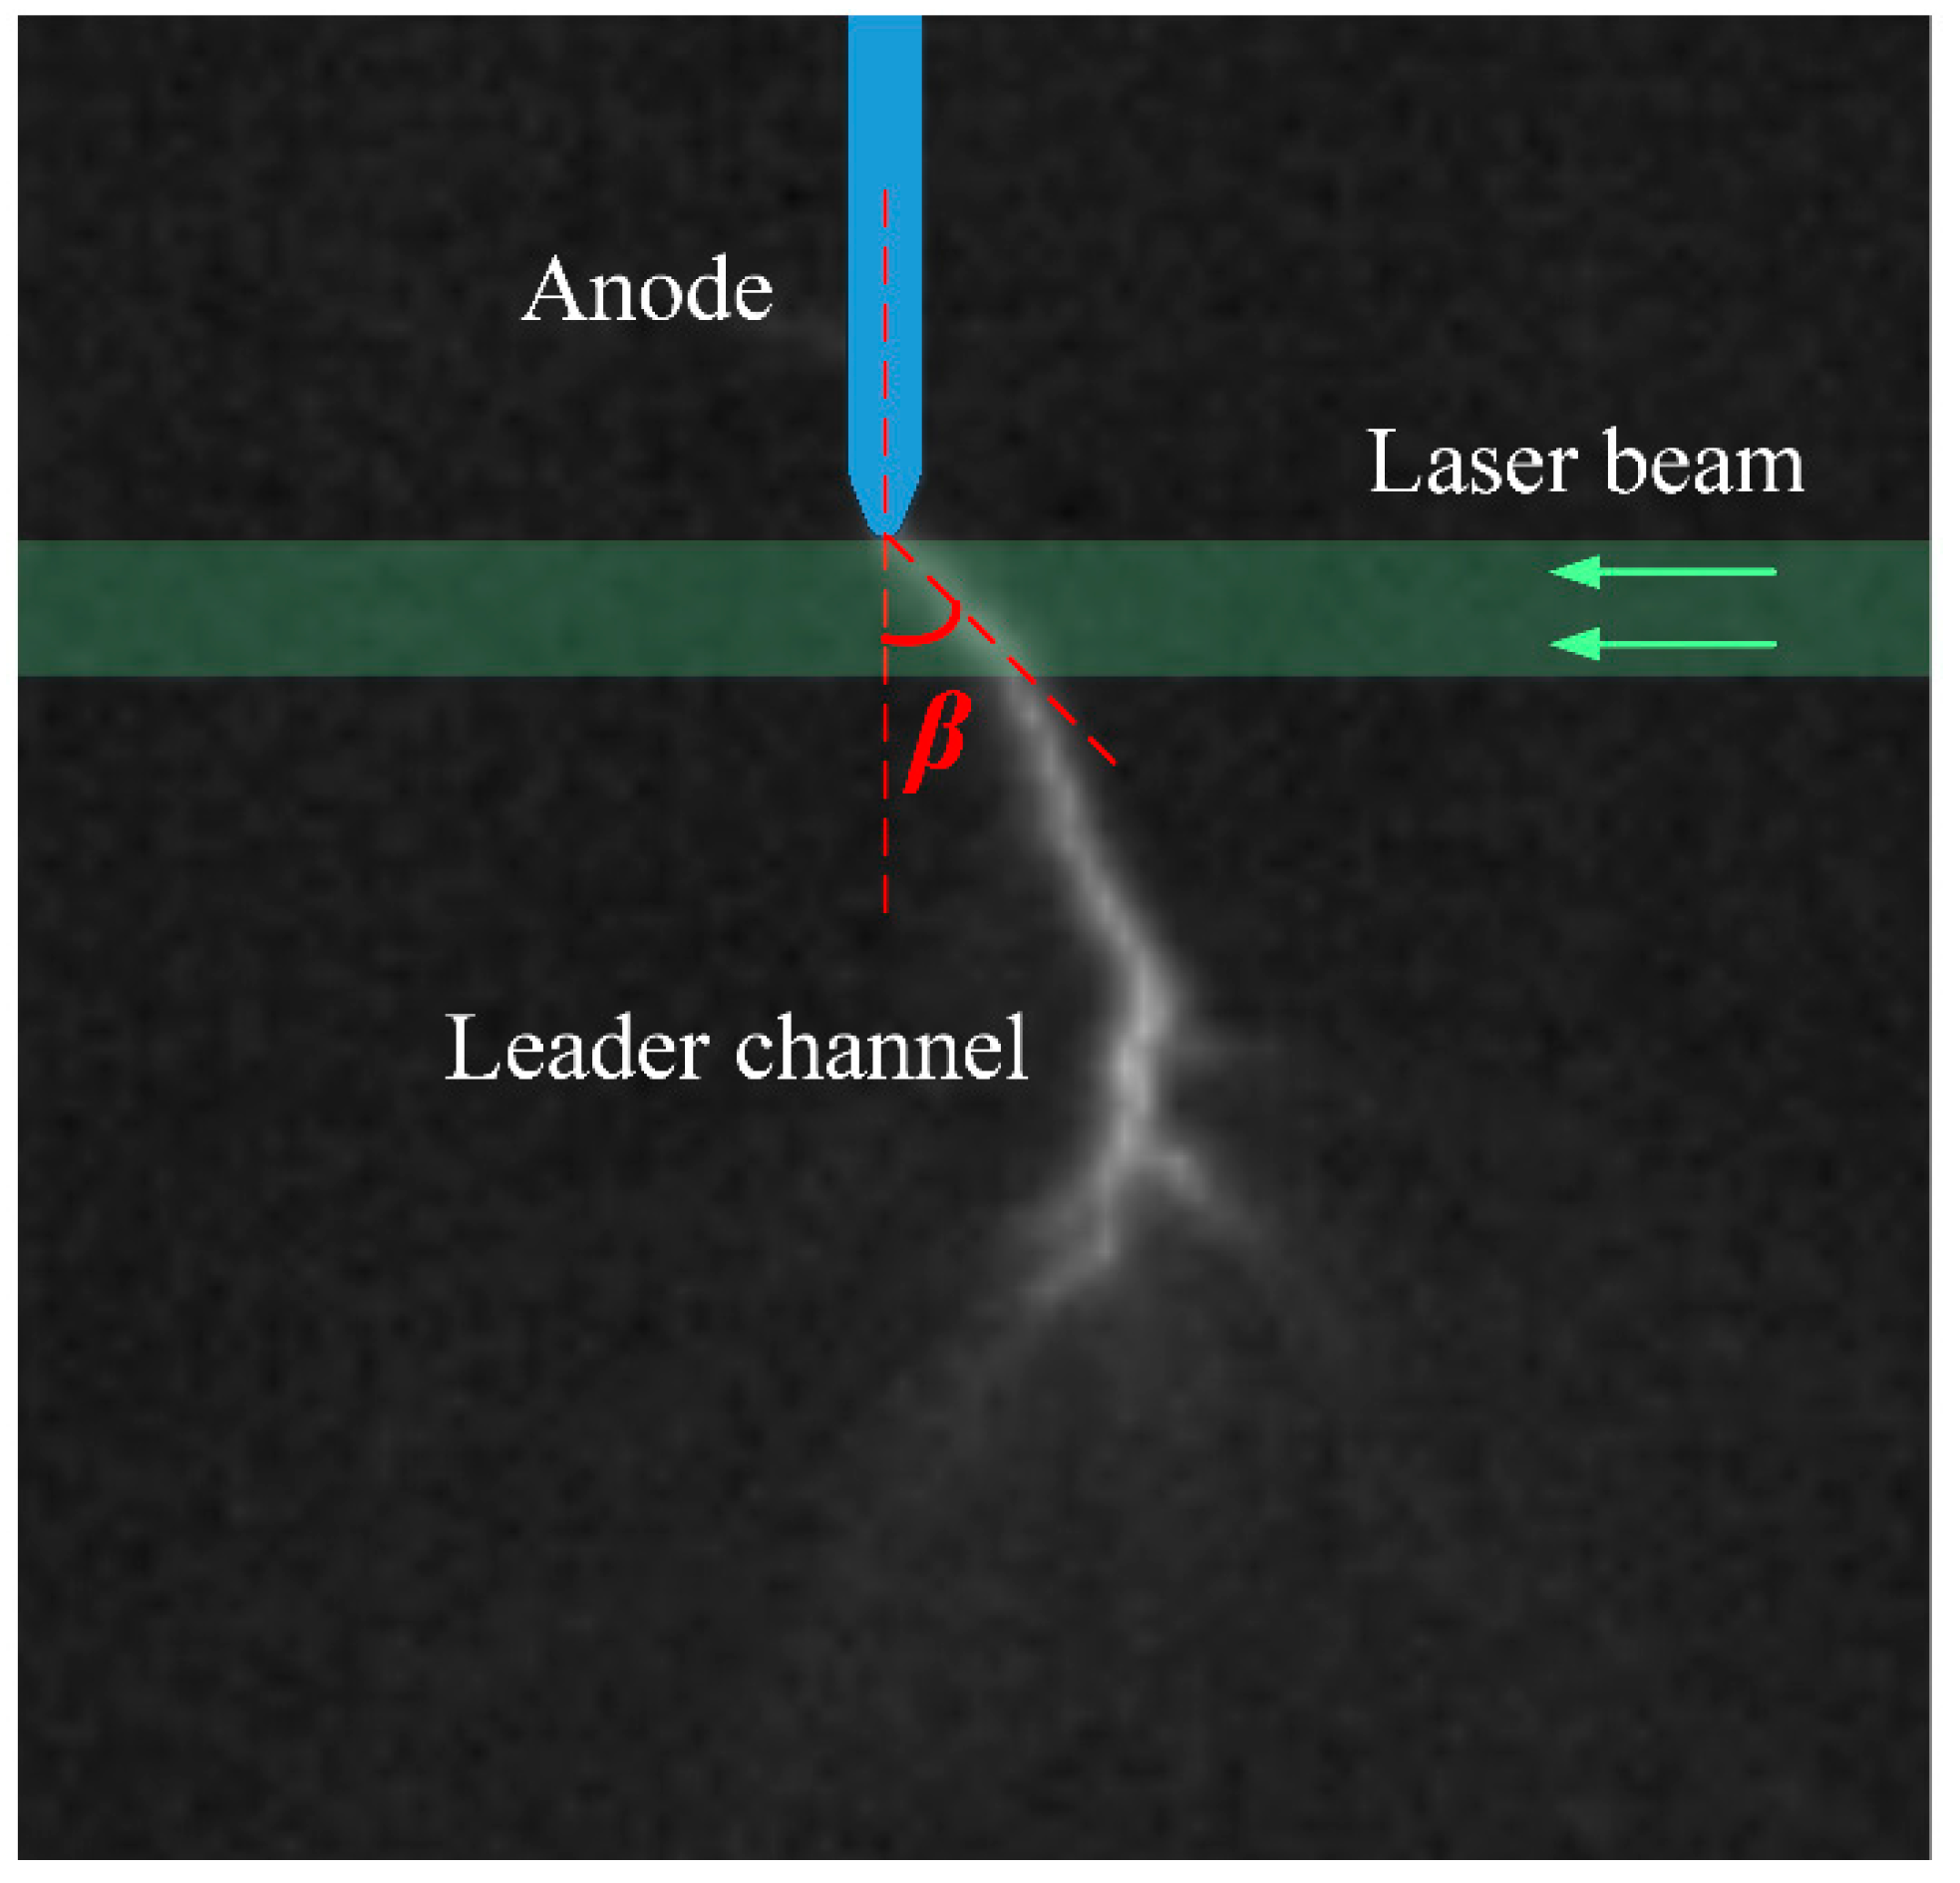
In the interference images, the offset of the fringes is equal to an integration along the optical path. It is assumed that the leader discharge channel is a segmented axisymmetric cylinder and that the parameters of the cross-section in each segment are only functions of the radial position [33,34]. Figure 2 shows a diagram of a leader channel passing across the laser beam in which the blue cylinder represents the leader channel causing the offset of the fringes in the interference images. The X, Y and Z axes constitute a three-dimensional coordinate system in which the Z axis represents the direction of the leader channel. The radial distribution of the refractive index n(r) can be obtained from the displacement of the interference fringes in the X direction via the inverse Abel transformation [23,35], as given in (1). is the laser wavelength, n is the refractive index, n0 = 1.00026 is the refractive index of air without the disturbance and β is the angle between the projection of the leader channel on the Y-Z plane and the vertical direction, which is illustrated in Figure 3.
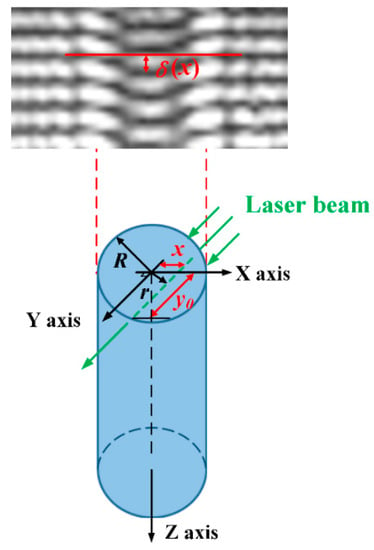
Figure 2.
Diagram of the leader passing across a laser beam.
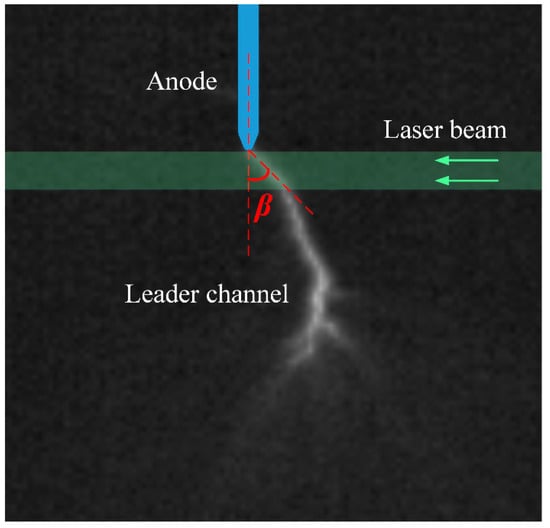
Figure 3.
Diagram of , which is the angle between the leader channel and the vertical axis.
In addition to the above, the leader channel is a partially ionized plasma [36,37] in which the refractive index is dominated by electrons and neutral particles. However, the density of the electrons in the leader channel is far lower than that of the neutral particles so the influence of the electrons can be neglected in this case [38]. Simultaneously, it is also assumed that the composition of the neutral particles does not vary during the leader discharge process. Therefore, the relationship between the gas density in the channel and the refractive index can be expressed using Equation (2), in which Nneu is the density of the neutral particles. For the light source with the wavelength of 532 nm used in this work, γneu = 1.091 × 10⁻²³ cm3; ) is the density of the air in the leader channel and is the density of the undisturbed air.
During the transition from a streamer to a leader, a transient overpressure is present in the channel, but the relaxation time for this overpressure process is much shorter than the leader propagation period [39,40]. Therefore, we can simply assume that the gas pressure in the channel remains constant at 1 atm and that the gas satisfies the ideal gas equation. Thus, the gas temperature distribution T(r) in the channel can be obtained as shown in Equation (3), in which T0 is the temperature of the undisturbed air outside the channel.
3. Experimental Setup and Results
3.1. Experimental Setup
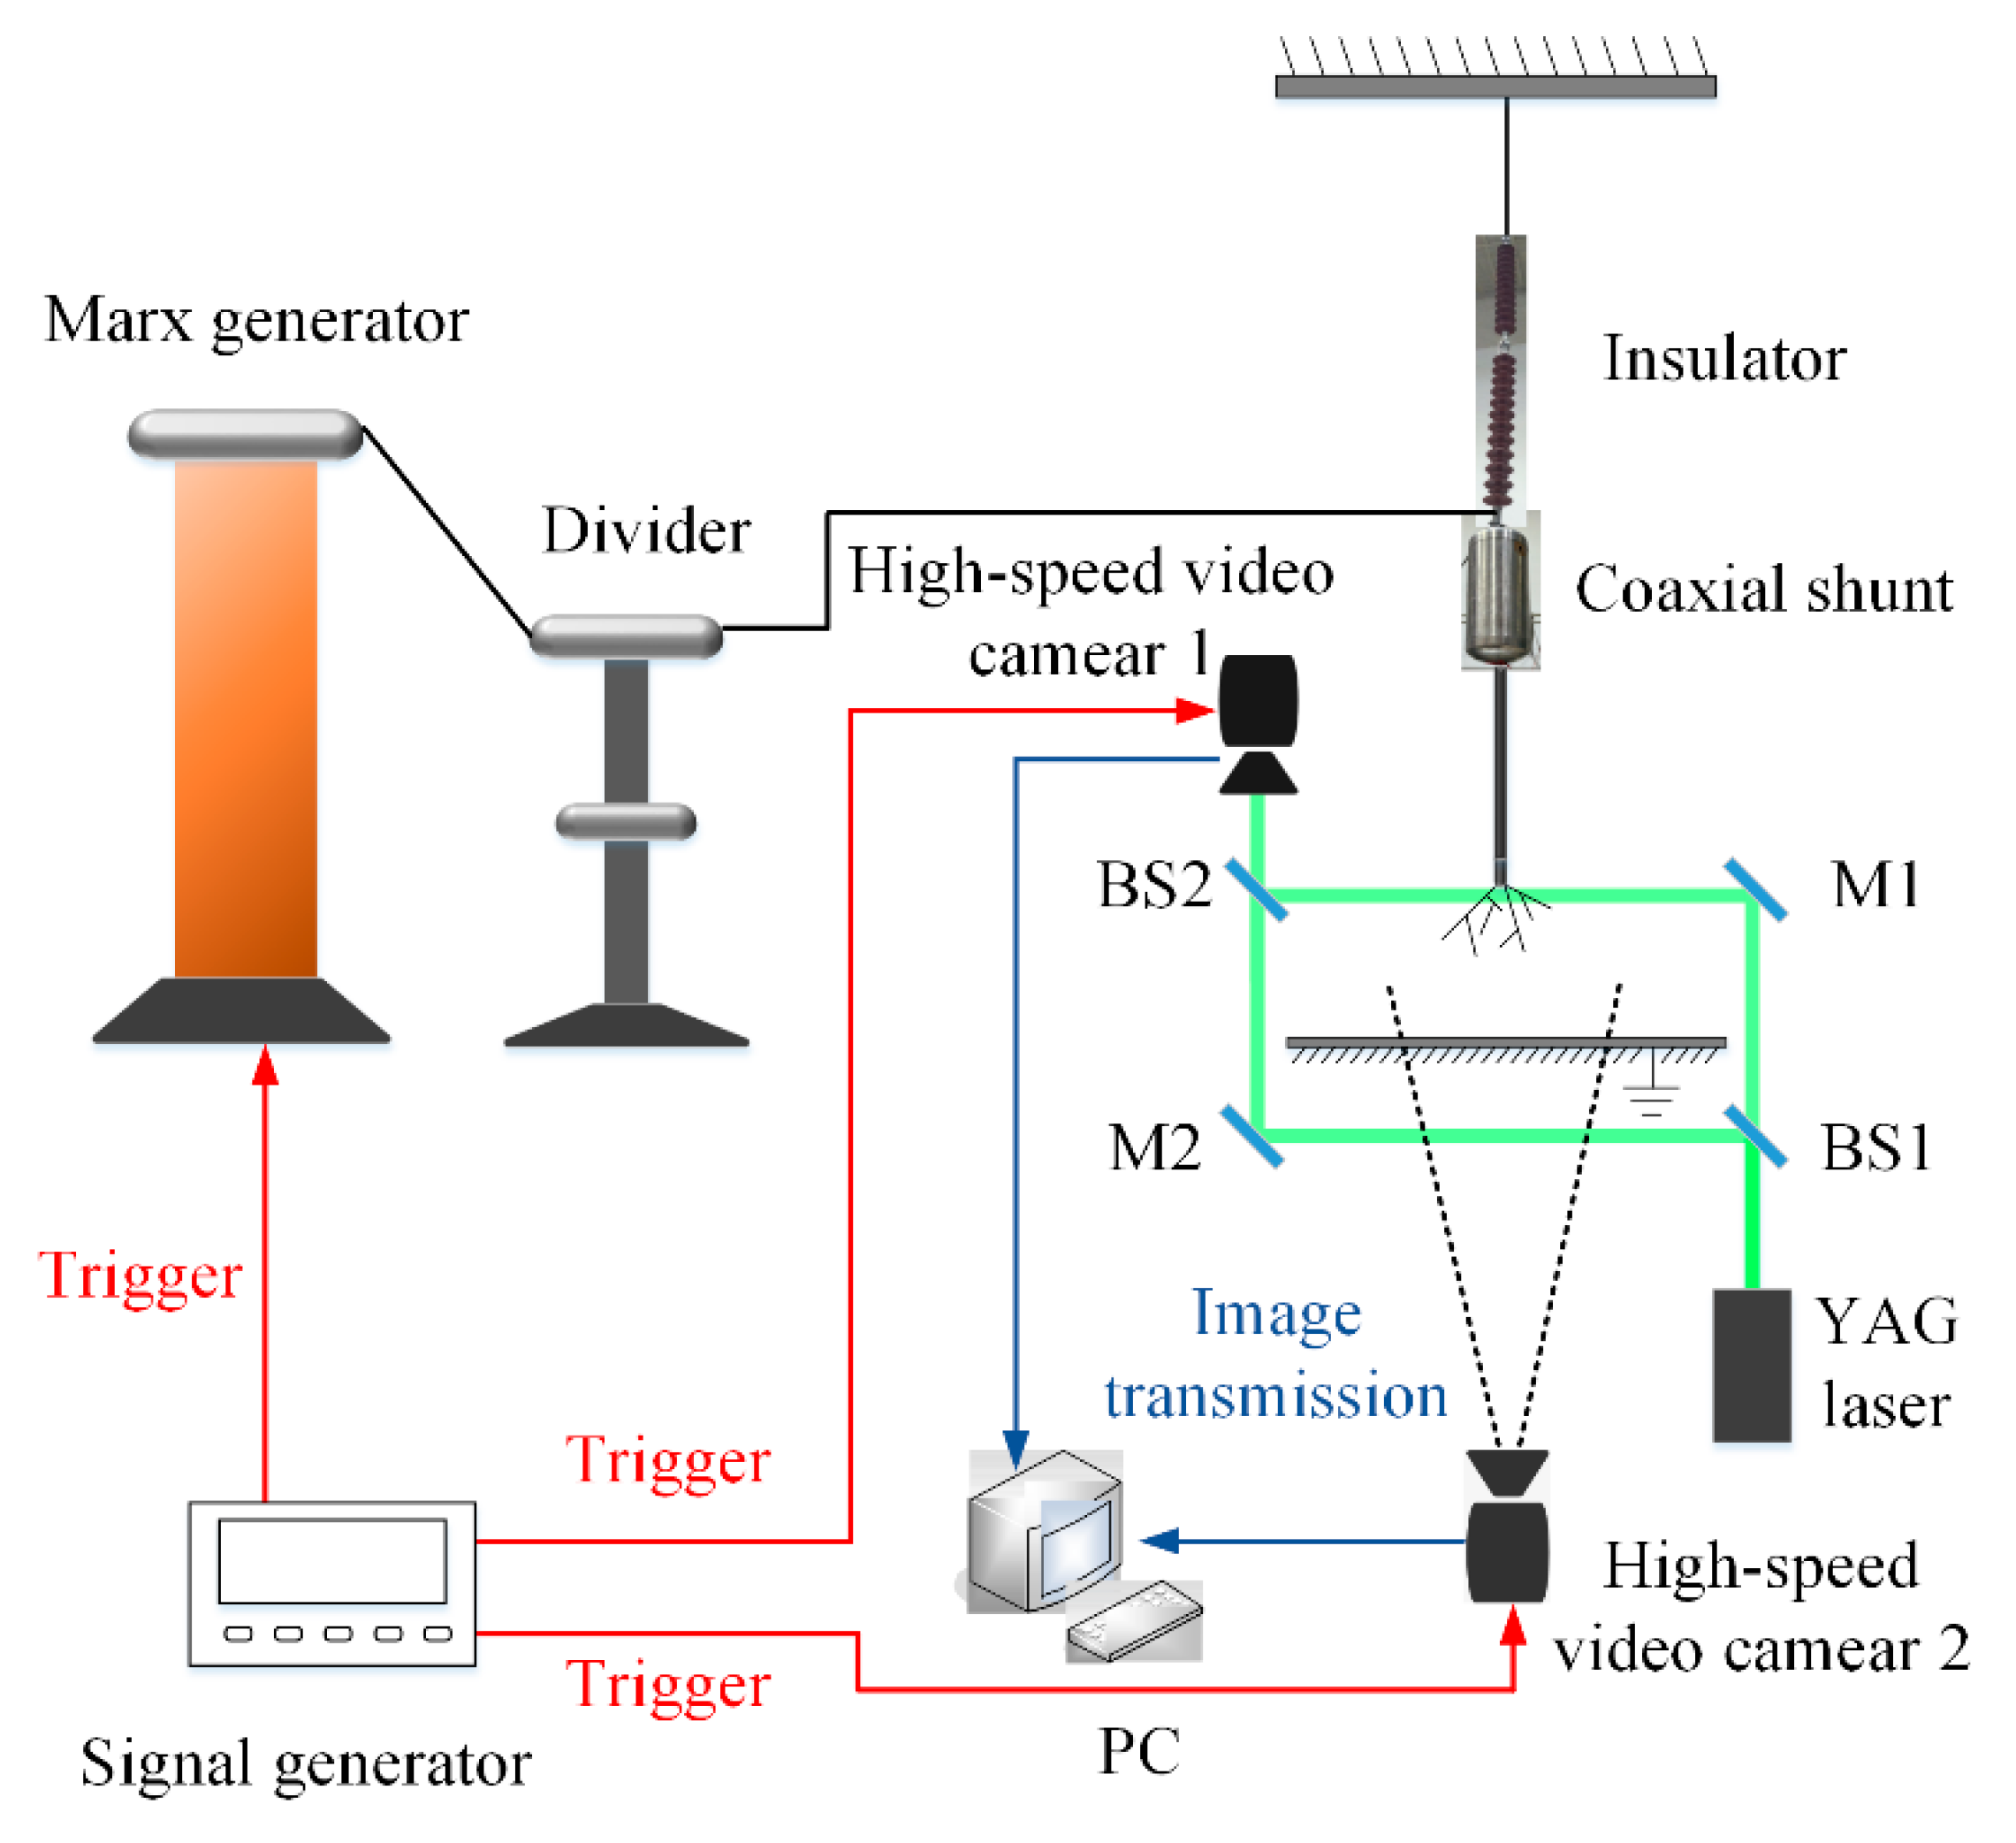
This study focused on 1 m rod-plate air gap discharges and the experimental platform was built, as shown in Figure 4. The Marx generator was used to generate 250 μs/2500 μs, 400 kV switching impulse voltages, which were then applied to the electrode through a coaxial shunt. Here, 250 μs and 2500 μs were the front time and the time to half value of the impulse, respectively; 400 kV was the amplitude of the pulse. A rod electrode with a diameter of 2 cm and a replaceable terminal were suspended above a 2 m × 2 m grounded metal plate. Cone terminals with radii of curvature of 2.5 mm and 5 mm and a spherical terminal with a diameter of 40 mm were selected for the experiments.
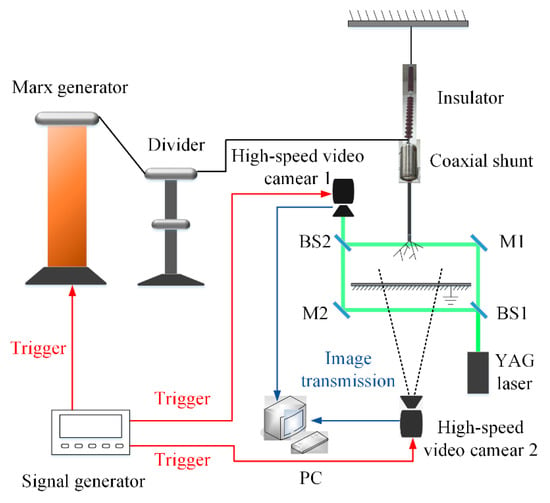
Figure 4.
Diagram of the experimental setup.
BS1, BS2, M1, M2 and the YAG laser constitute the M–Z interferometer structure used to capture the discharge characteristics in the area below the electrode terminal. The laser beam emitted from the YAG laser source was at 532 nm (i.e., frequency doubled) and had a diameter of 5 mm. To broaden the observation range, the laser beam was then expanded to a diameter of 35 mm. A high-speed video camera 1 (Phantom V2012) was used to capture the interference images from the M–Z interferometer and a high-speed video camera 2 (Phantom V12.1) was used to perform the synchronous capture of the morphologic characteristics of the leader to determine the value of β to be used in Equation (1). The two cameras were mutually horizontal. High-speed video camera 1 had an image size of 256 × 256 pixels, a spatial resolution of 0.15 mm/pixel, a frame rate of 180,000 fps, and an exposure time for each frame of 1.1 μs. High-speed video camera 2 also had an image size of 256 × 256 pixels, along with spatial resolution of 2.67 mm/pixel, a frame rate of 67,000 fps, and an exposure time for each frame of 14 μs.
The Marx generator and the two high-speed video cameras were triggered synchronously using a voltage pulse generated by a signal generator. The images acquired by the two cameras were then received by a computer.
3.2. Experimental Results
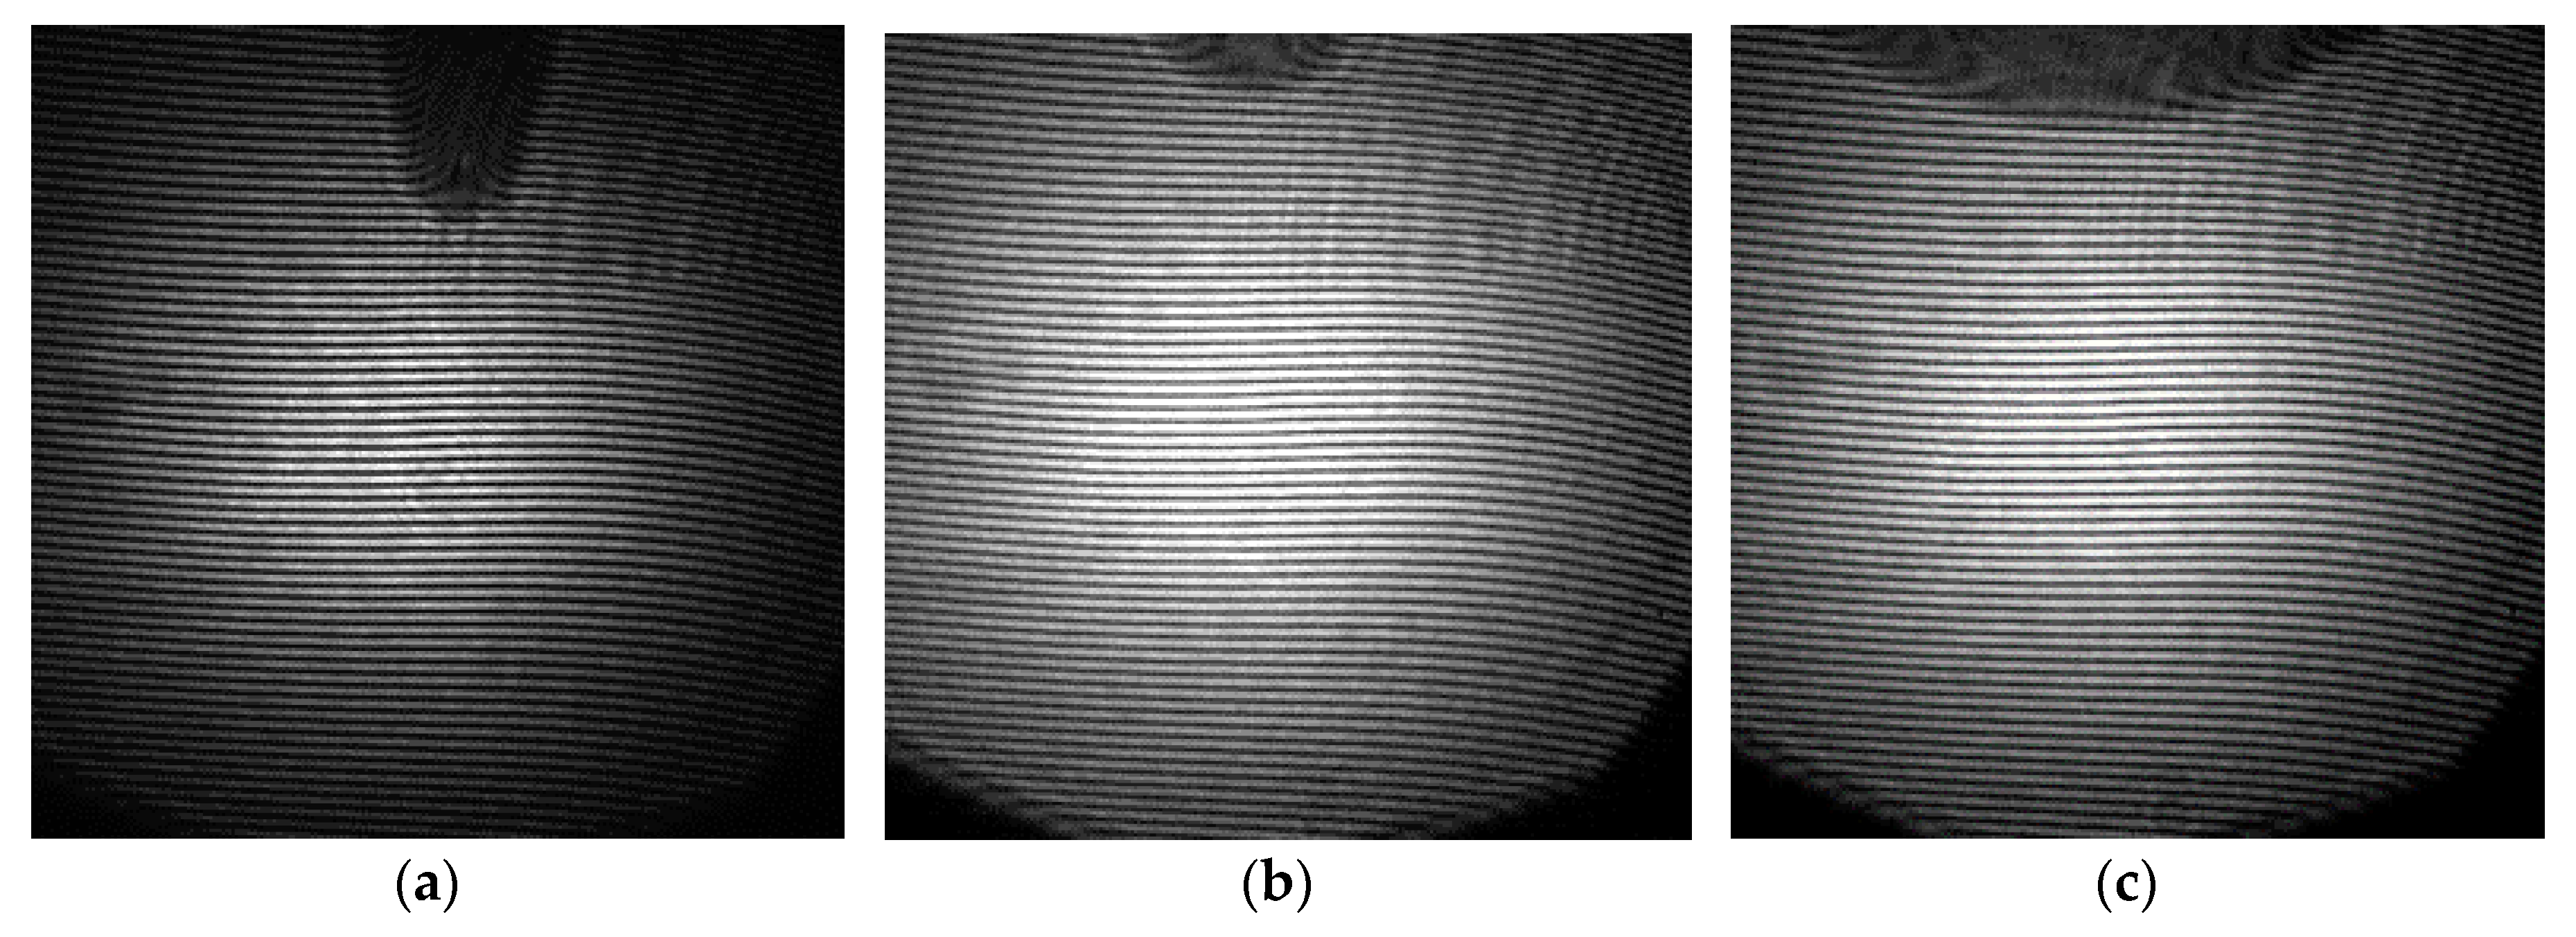
The interference images without distributions (i.e., the background images) are shown in Figure 5, in which the upper dark black areas show part of the electrode terminal in each case. The images show that when there is no disturbance of the optical path, the interference images are horizontal fringes oriented parallel to each other.
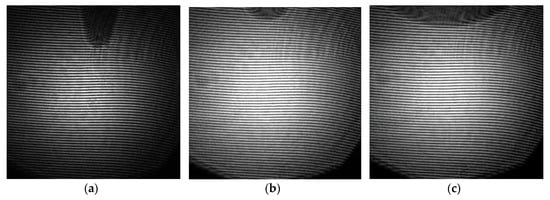
Figure 5.
Interference images without distributions (background images): (a) cone terminal, radius of
curvature = 2.5 mm; (b) cone terminal, radius of curvature = 5 mm; (c) spherical terminal, diameter =
40 mm.
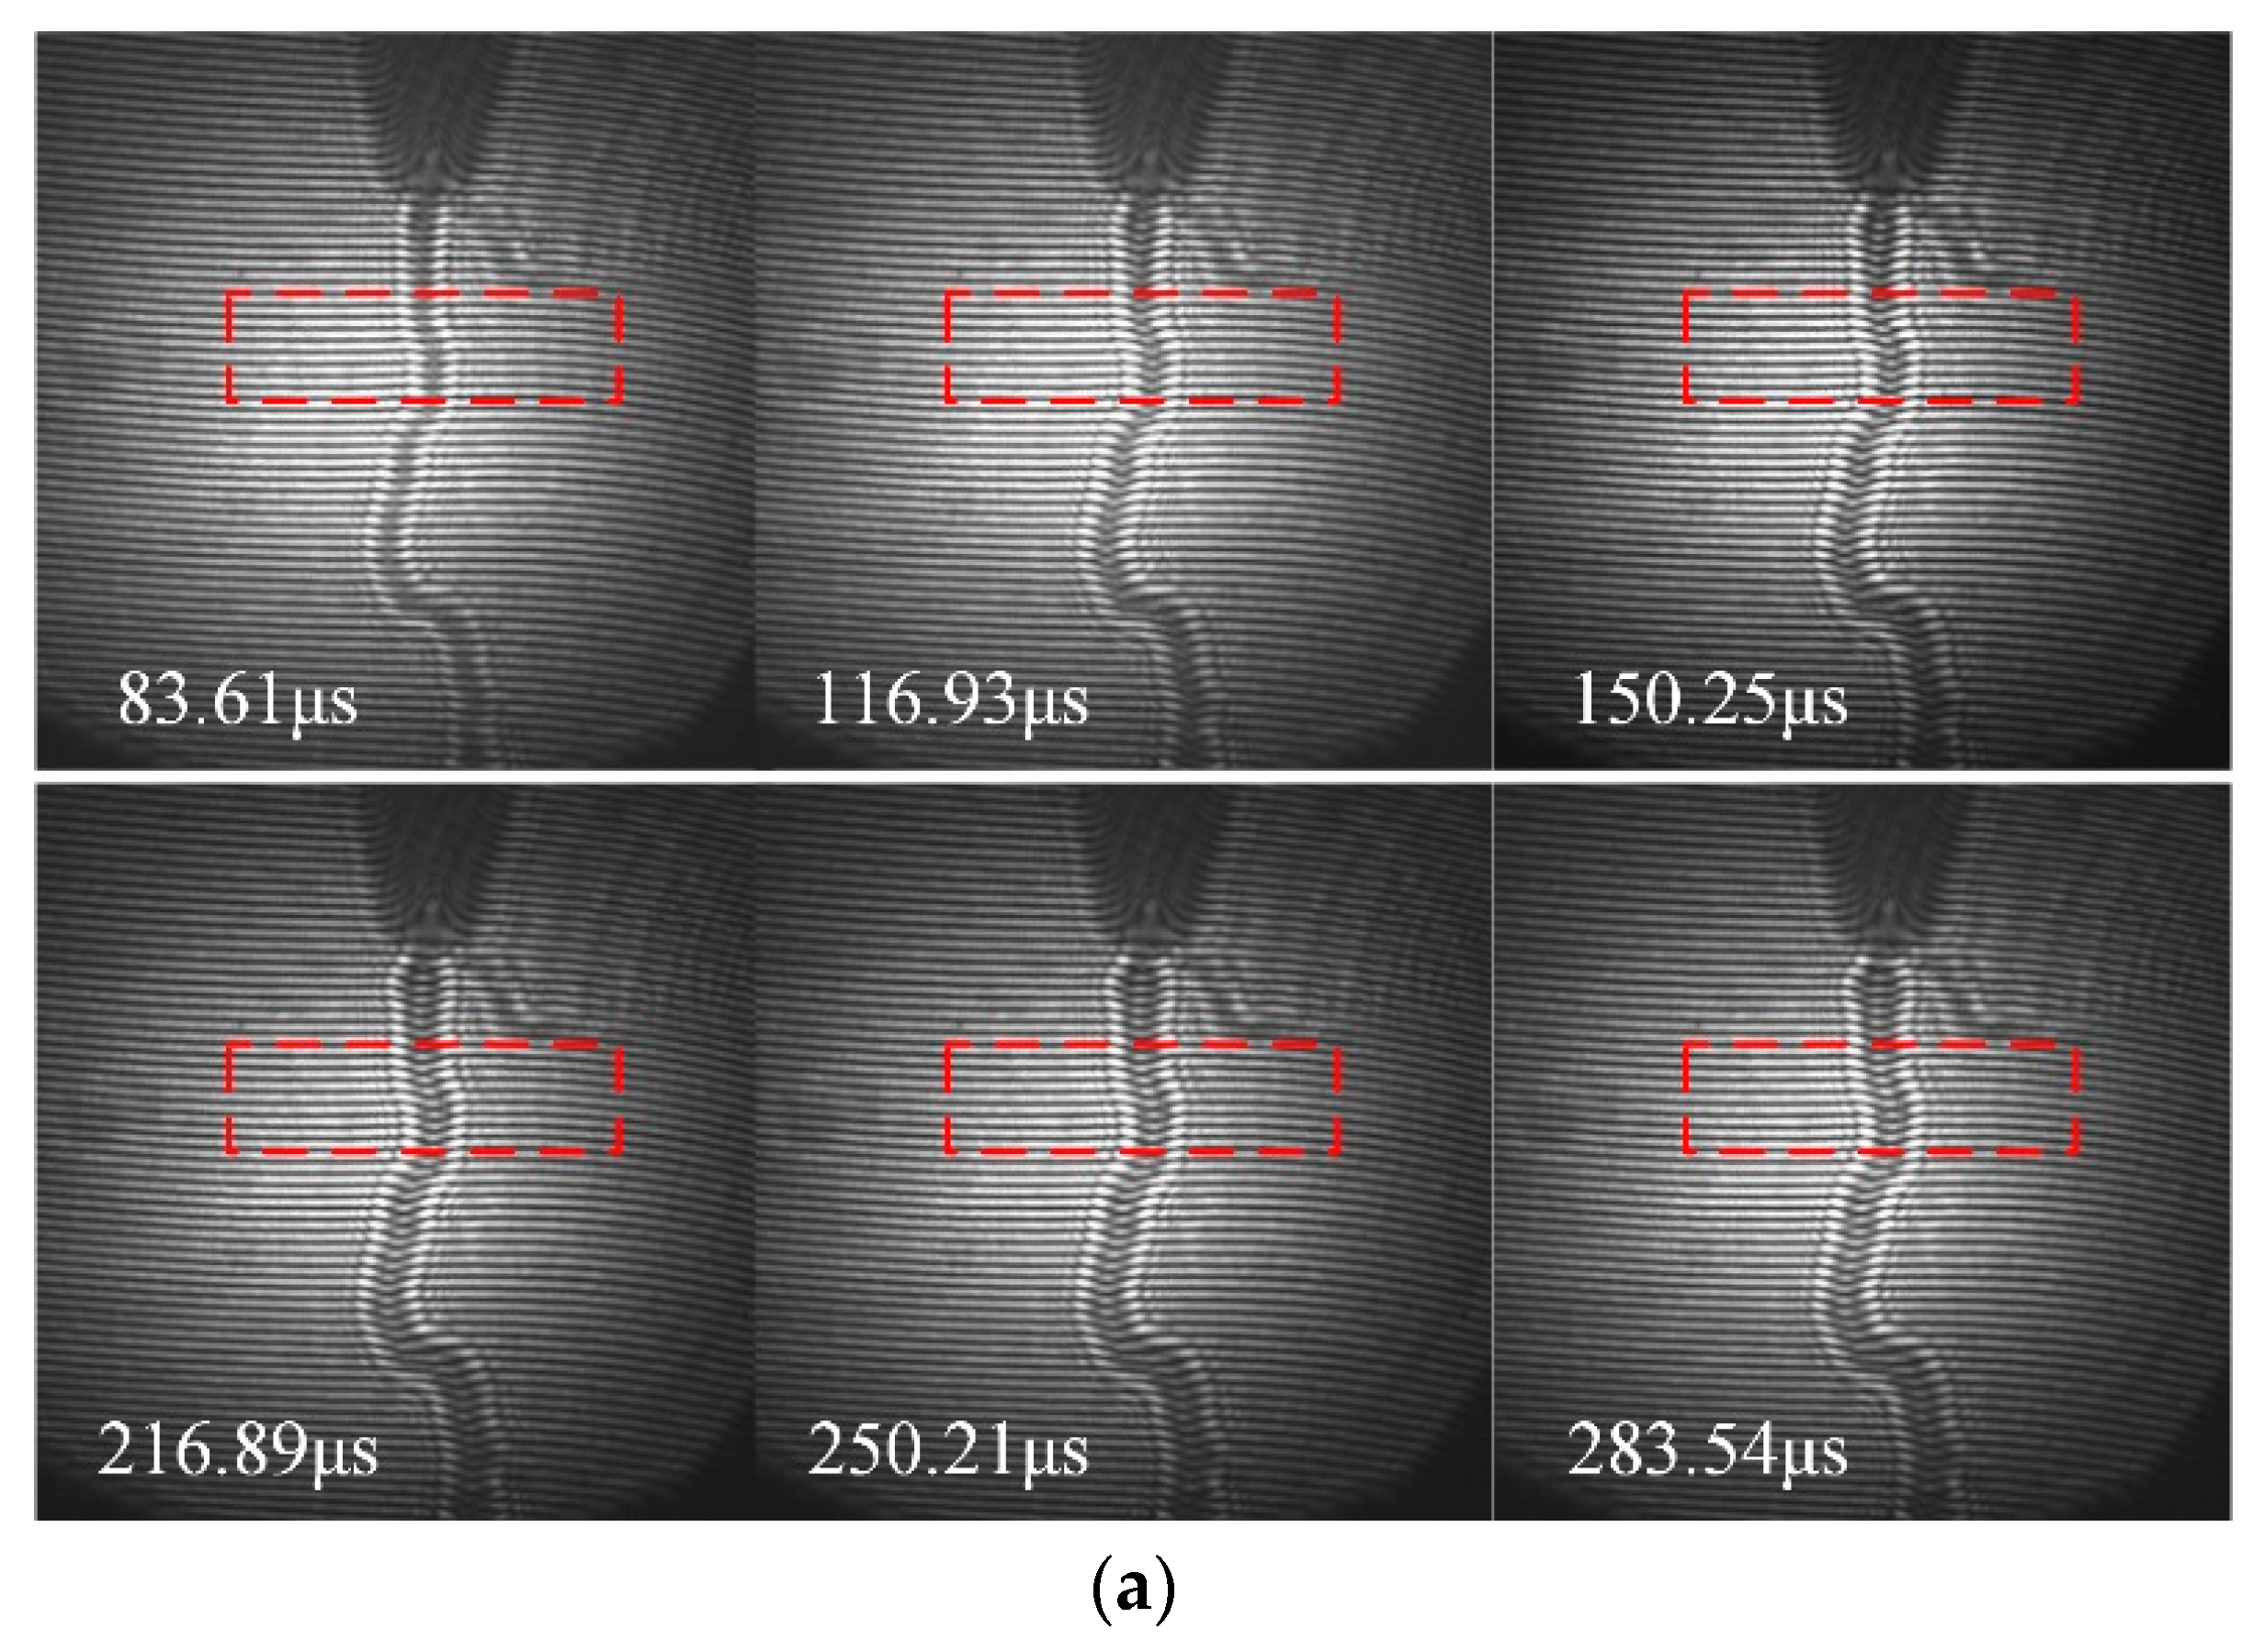
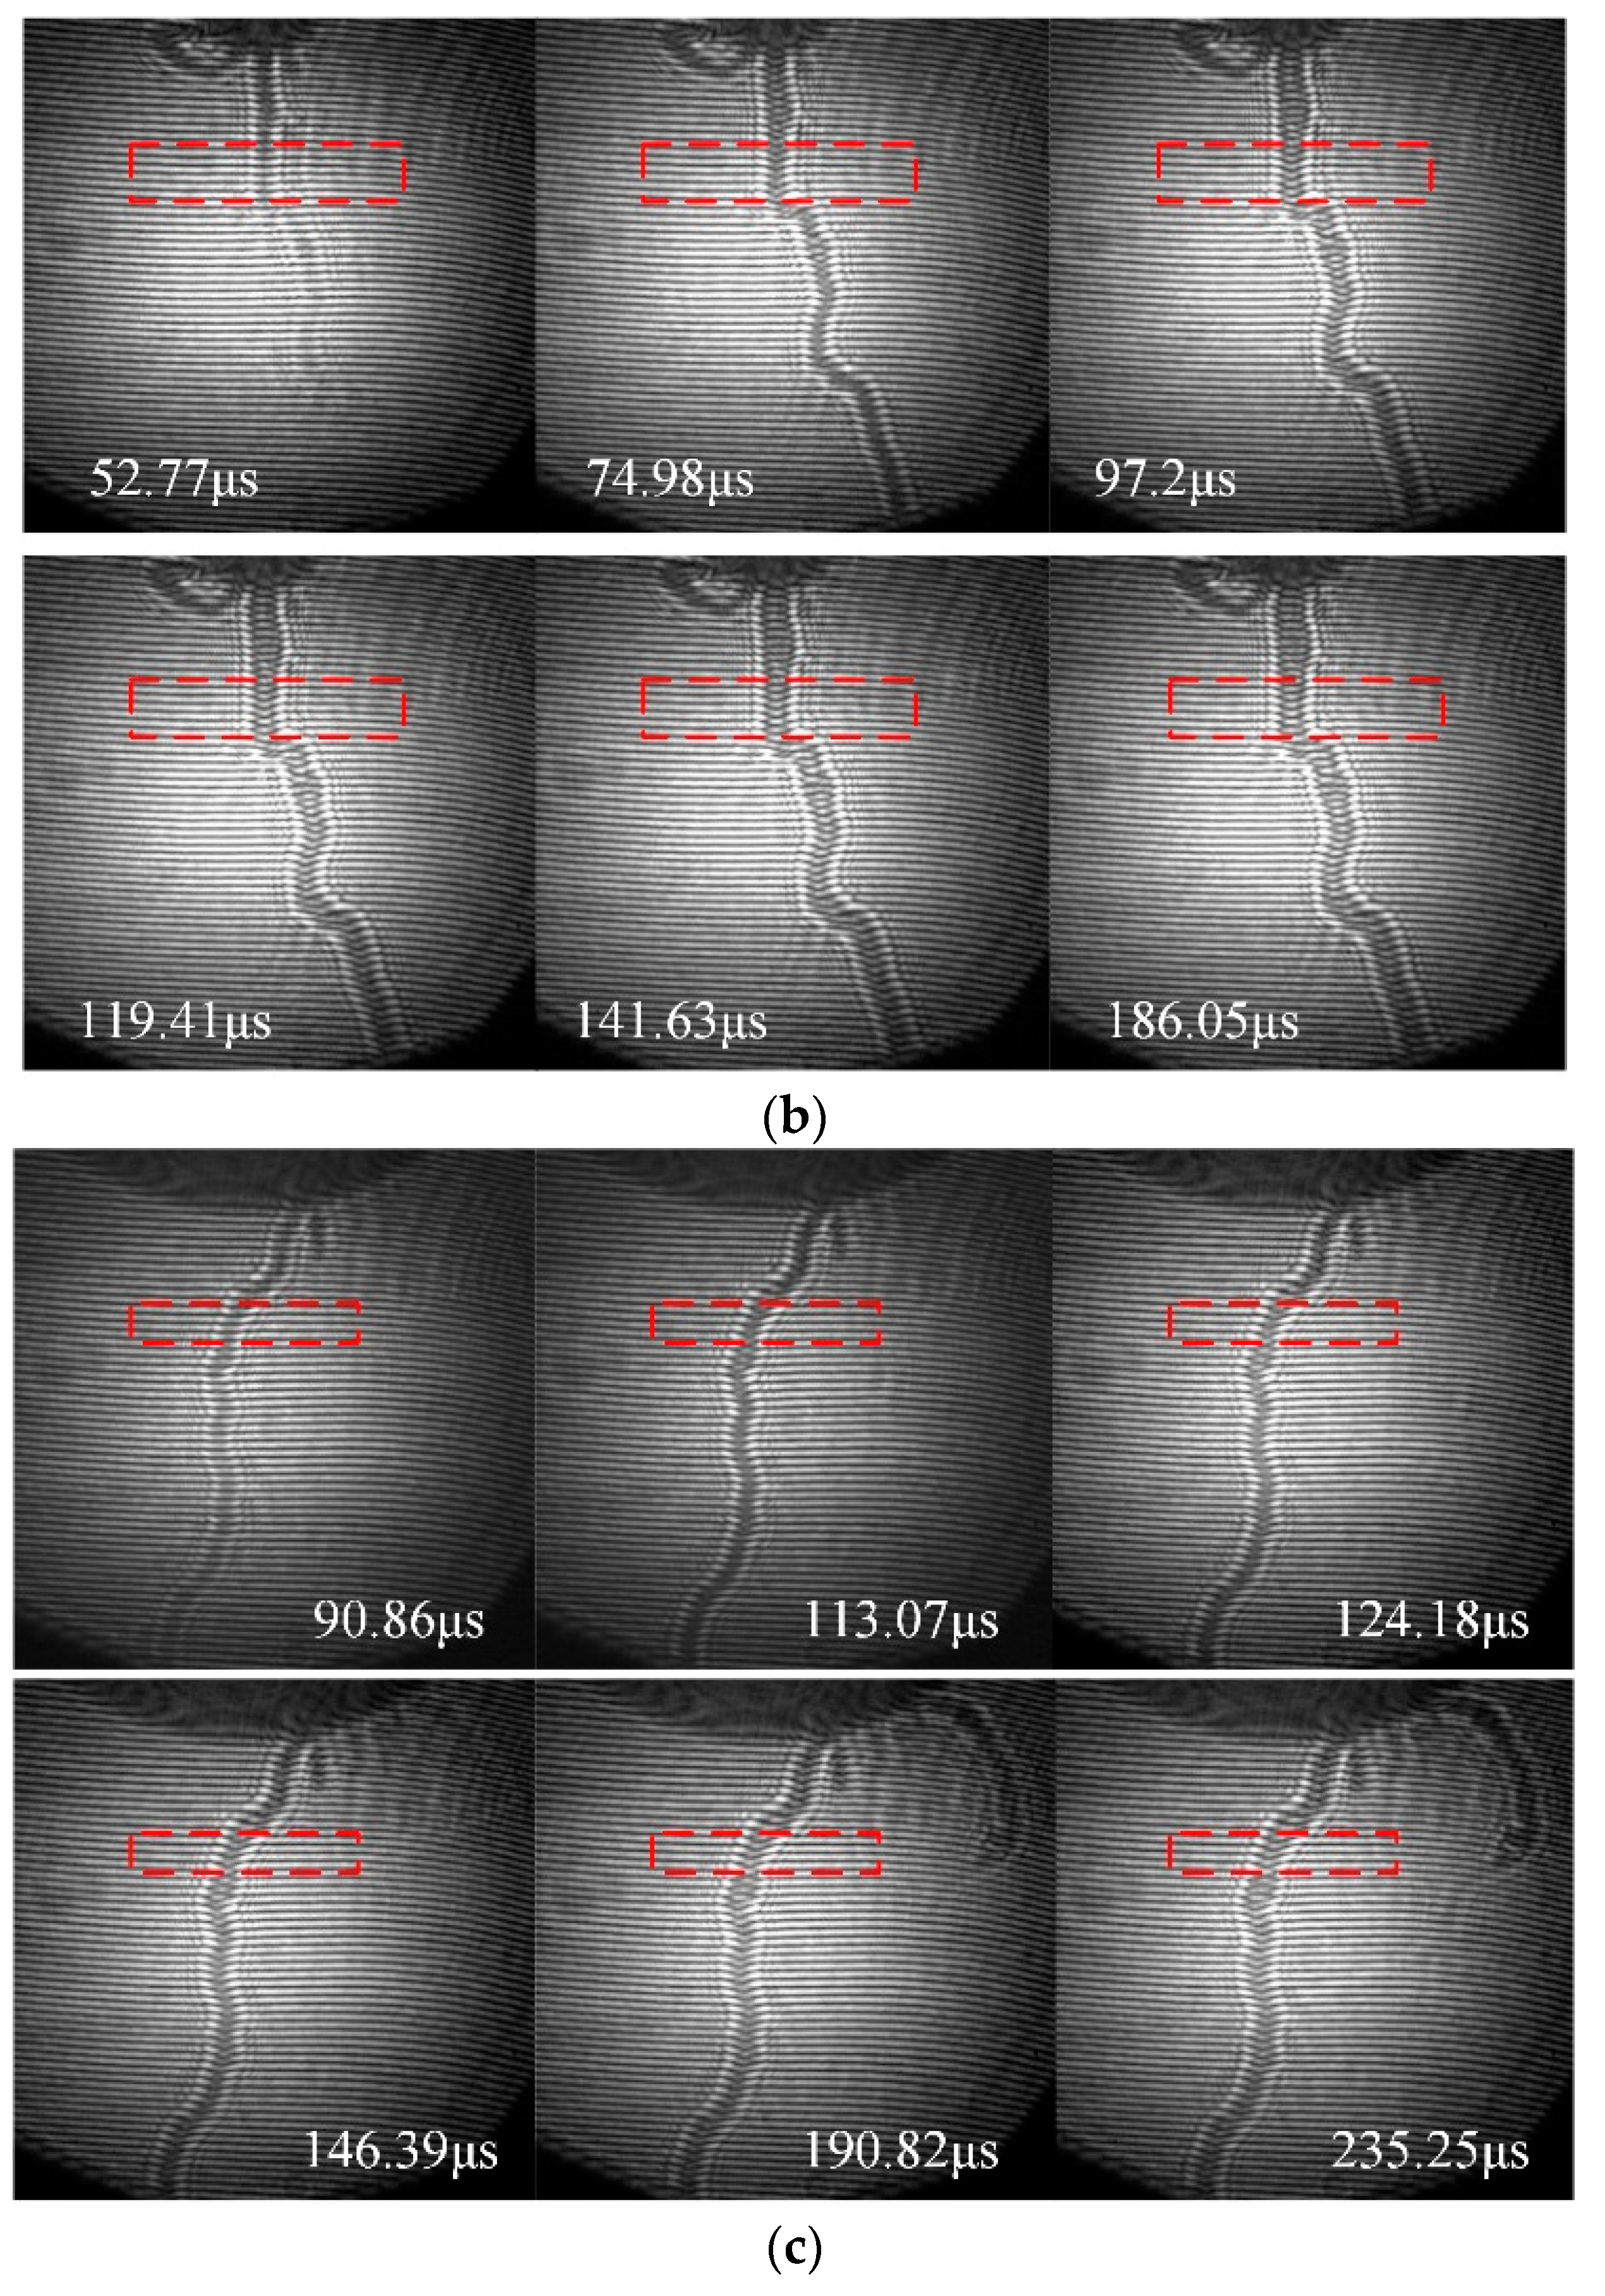
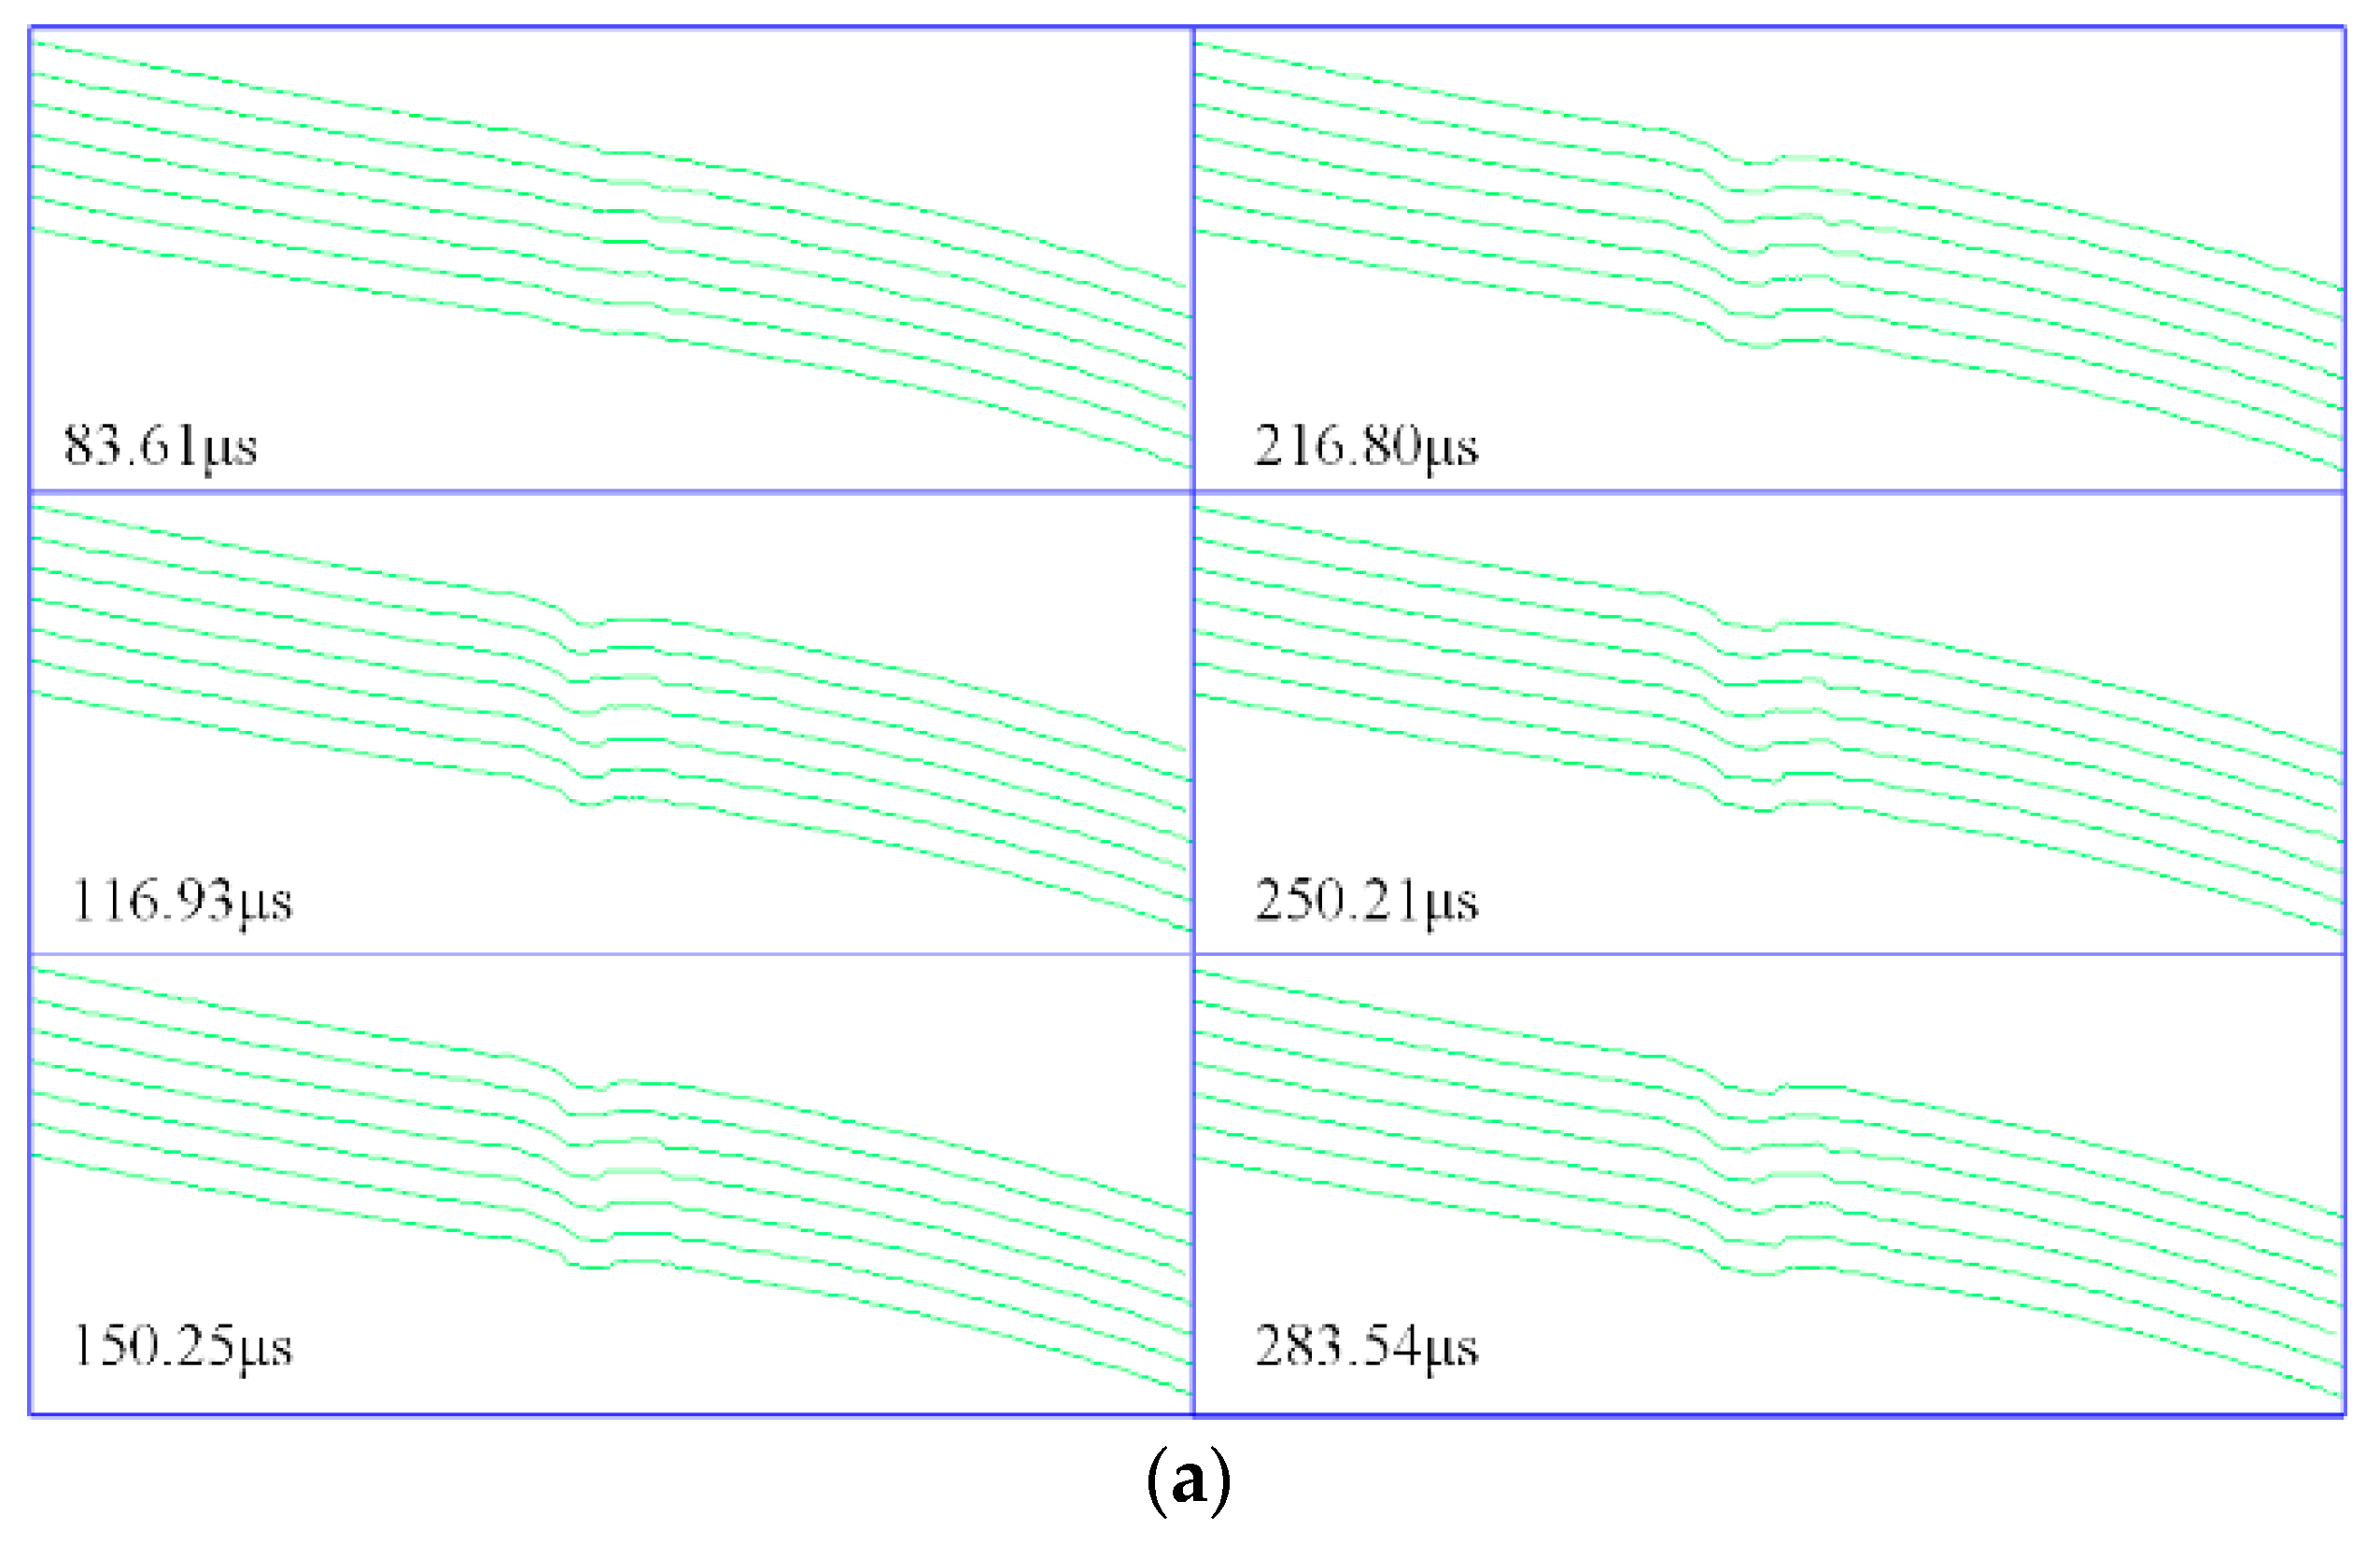
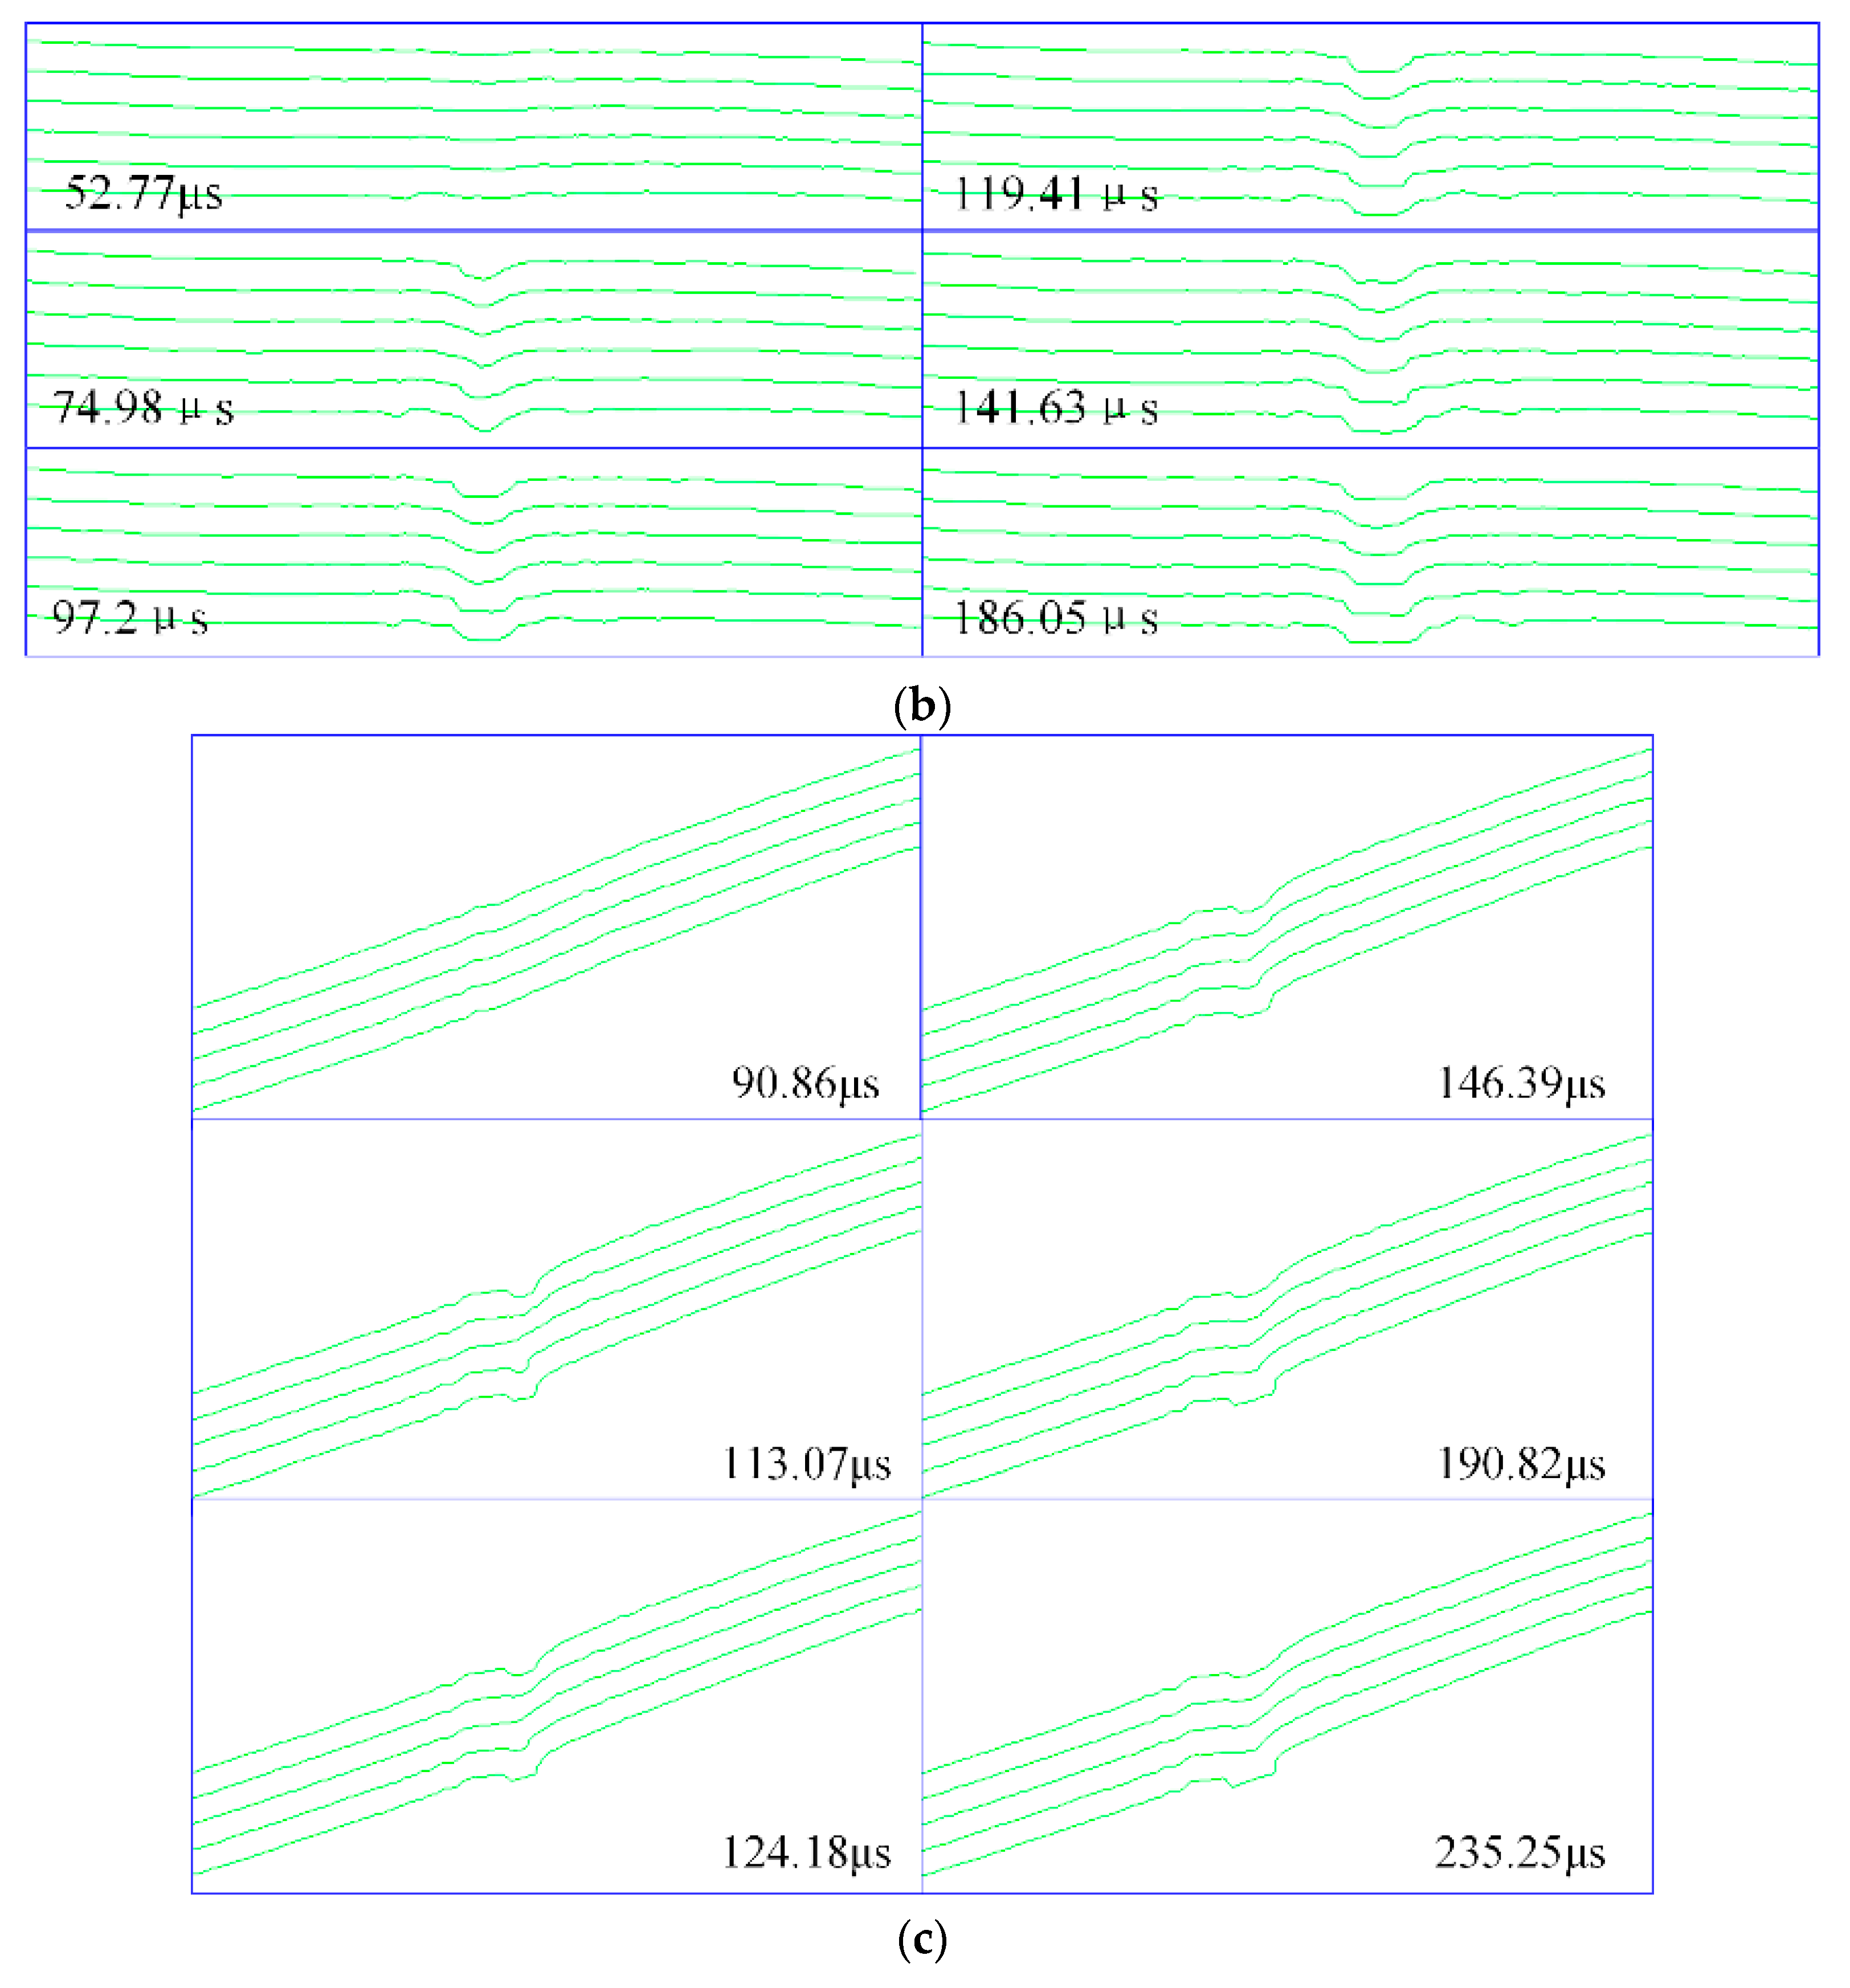
When a discharge occurred, the interference fringes of the leader channel below the terminal were captured using the M–Z interferometer and the high-speed camera, with results as shown in Figure 6. The section within the red dotted frame near the bottom of the terminal in each image was selected as the analysis area. The fringe offsets were obtained as shown in Figure 7. These fringes were then graded and interpolated to obtain the two-dimensional distribution of the fringe gradients in the analysis area. By subtracting this two-dimensional distribution of the analysis area from the corresponding two-dimensional distribution of the background area, the offset of the leader channel represented by can be obtained.
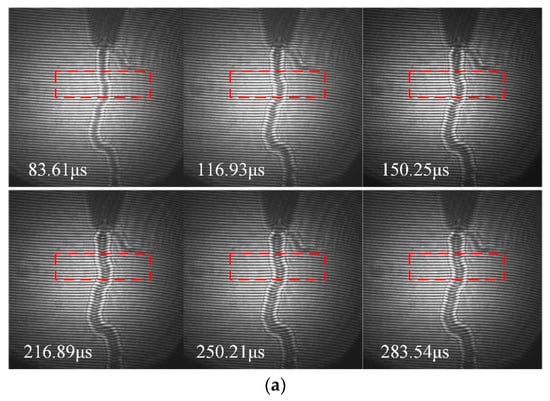
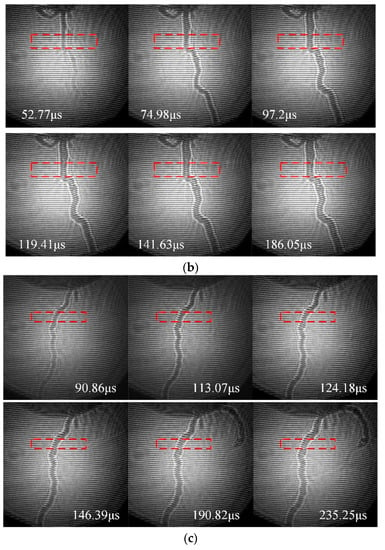
Figure 6.
Interference images: (a) cone terminal, radius of curvature = 2.5 mm; (b) cone terminal, radius of curvature = 5 mm; (c) spherical terminal, diameter = 40 mm.
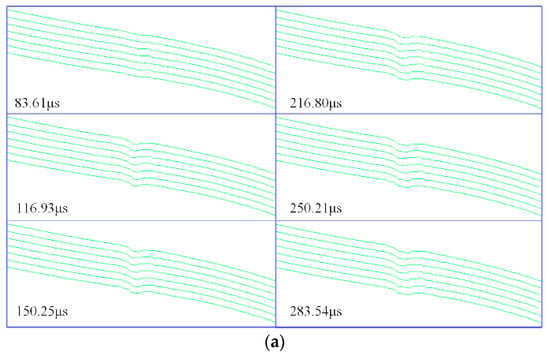
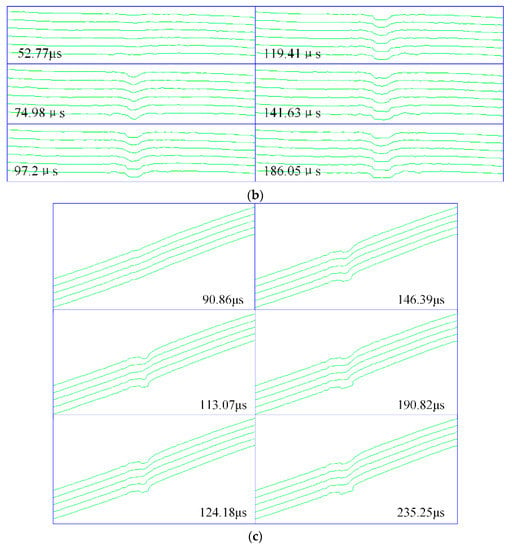
Figure 7.
Interference fringes: (a) cone terminal, radius of curvature = 2.5 mm; (b) cone terminal, radius of curvature = 5 mm; (c) spherical terminal, diameter = 40 mm.
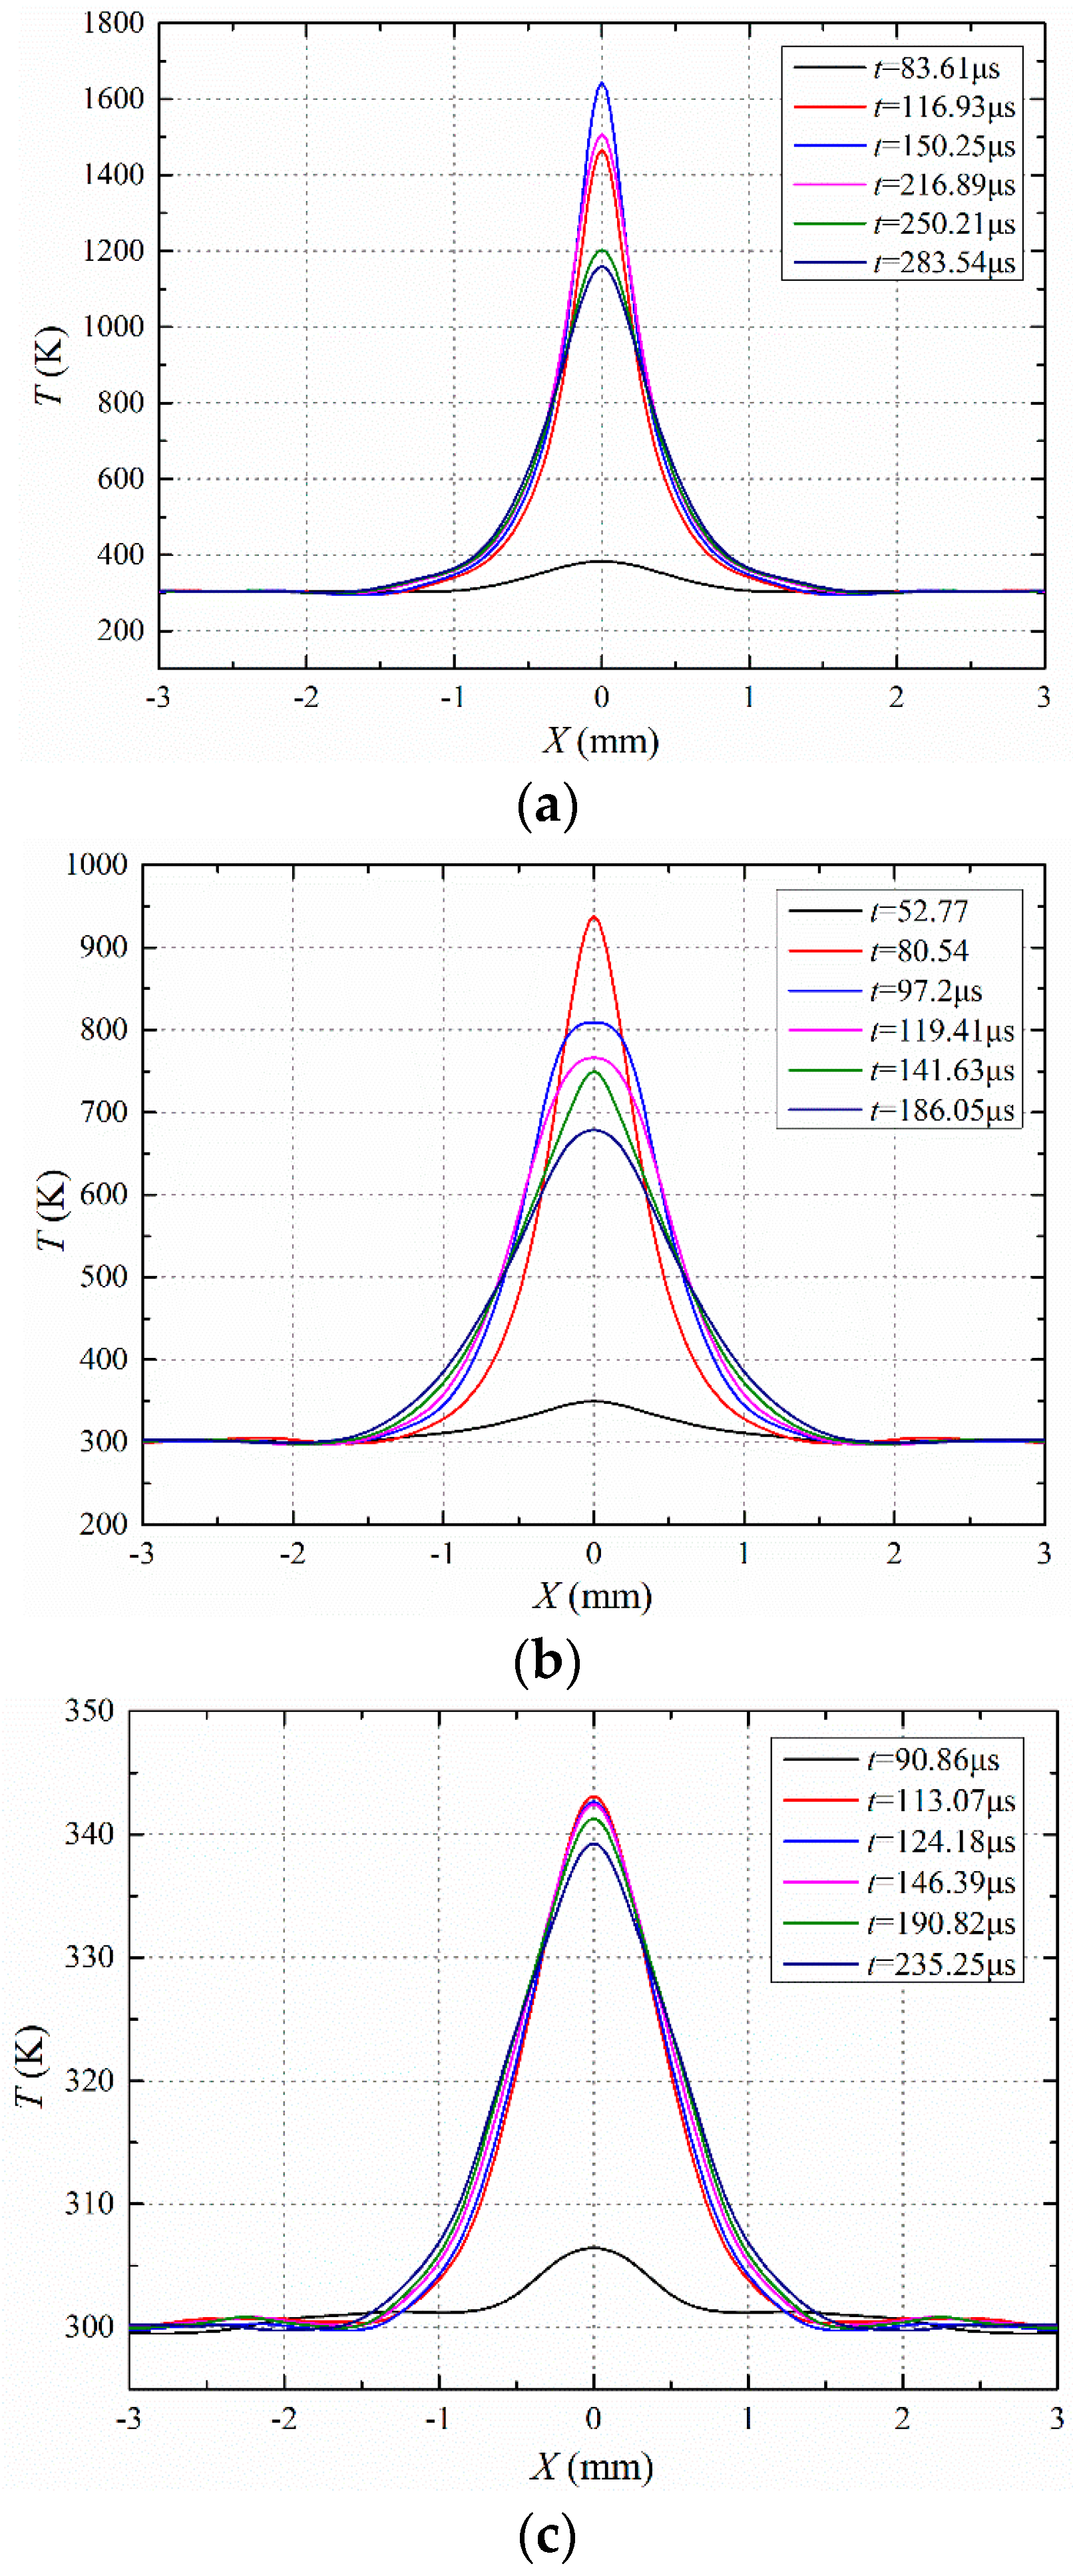
Using the principle described in Section 2, the radial distributions of the gas temperature under the different terminals could be obtained, as shown in Figure 8. To reduce the errors of the different axial sections in the selected area, the temperatures at different radial positions were taken to be the average of all cross-sections within the analysis area. The results show that along with the development of the leader, the central temperature in the channel ross rapidly to a maximum because of rapid Joule heating and then decreased gradually as a result of heat conduction and convection losses. For the cone terminal with the 2.5 mm radius of curvature, the central temperature range of the channel was 380–1644 K. For the cone terminal with the 5 mm radius of curvature, the central temperature range of the channel was 350–940 K. For the spherical terminal with the diameter of 40 mm, the central temperature range of the channel was 306–343 K. This indicates that the gas temperature in the leader channel decreased as the radius of curvature of the electrode terminal increased.
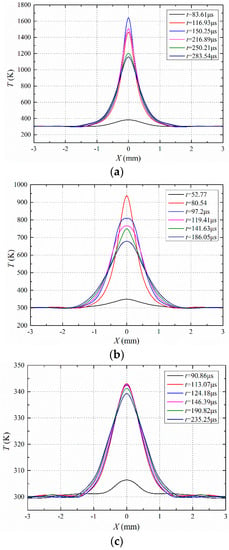
Figure 8.
Temperature distribution: (a) cone terminal, radius of curvature = 2.5 mm; (b) cone terminal, radius of curvature = 5 mm; (c) spherical terminal, diameter = 40 mm.
It should be noted that the change of temperature in the positive leader discharge for the spherical terminal with the diameter of 40 mm is very small. For the spherical terminal, the electric field around it is relatively uniform and smaller than that of the cone terminals, so the discharge is not strong, resulting in a much lower temperature in the discharge channel when compared with the other terminals.
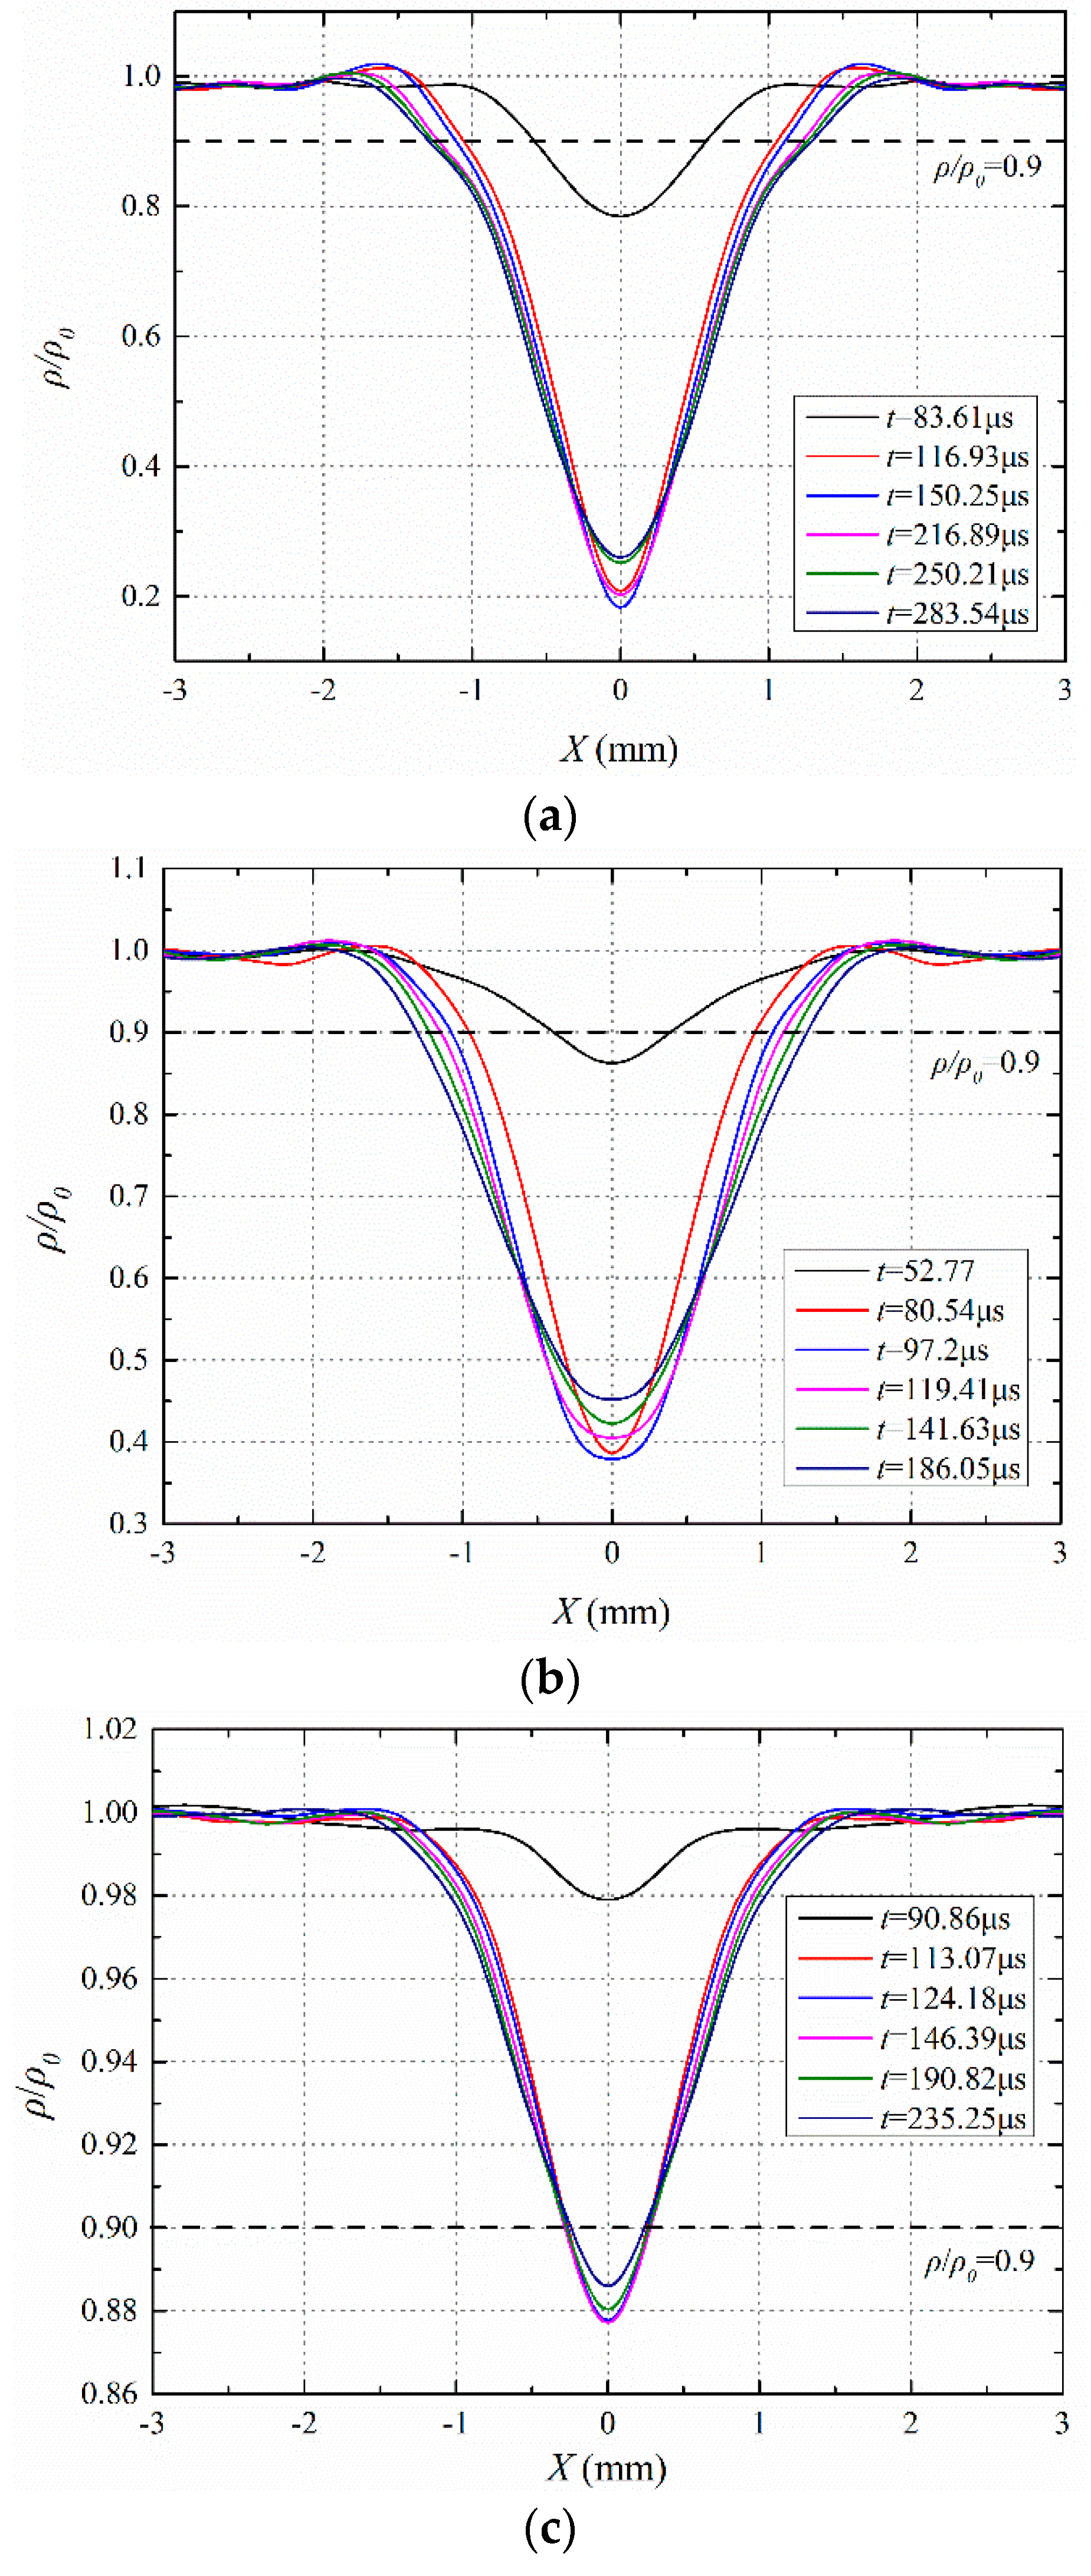
The radial distributions of the gas density in the leader channel with the different electrode terminals are shown in Figure 9. The gas densities at the different radial positions were also taken as the average of all cross-sections in the analysis area. For the cone terminal with a radius of curvature of 2.5 mm, the gas density at the center of the channel ranged from 18% to 78% of the ambient gas. For the cone electrode with a radius of curvature of 5 mm, the gas density at the center of the channel ranged from 38% to 86%. For the spherical electrode with a diameter of 40 mm, the gas density at the center of the channel ranged from 87% to 97% of the ambient gas. Therefore, the gas density in the leader channel decreased as the radius of curvature of the electrode decreased.
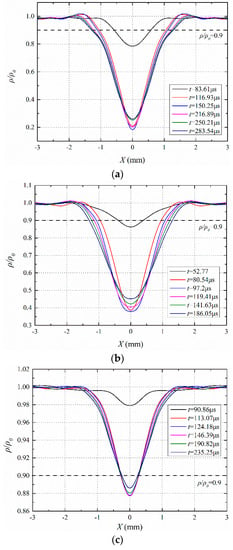
Figure 9.
Density distribution: (a) cone terminal, radius of curvature = 2.5 mm; (b) cone terminal, radius of curvature = 5 mm; (c) spherical terminal, diameter = 40 mm.
The different electrode structures have different electric field distributions [41]. As the radius of curvature of the electrode structure decreased, the electric field intensity increased in tandem [42]. In addition, the current density is proportional to the electric field intensity. Therefore, the energy is more concentrated in the cases where the radius of curvature of the electrode terminal is small. As a result, a smaller radius of curvature at the terminal corresponds to a higher temperature at the center of the leader channel. Simultaneously, an increase in temperature causes the expansion of the air and thus reduces the density. Therefore, as the radius of curvature of the electrode decreases, the gas density in the leader channel also decreases.
In addition, the experimental results also show that the thermal diameter of the channel differed under the different electrode terminals. The thermal diameter of the channel was compared under the condition that the gas density is 90% of that of the ambient gas, as shown in Figure 9. The results show that for the cone terminals, the thermal diameter ranged from 1.2 mm to 2.6 mm under the electrode with a radius of curvature of 2.5 mm and ranged from 0.8 mm to 2.6 mm under the electrode with a radius of curvature of 5 mm; for the spherical terminal with a diameter of 40 mm, the maximum thermal diameter was 0.6 mm. Generally, the thermal diameter is larger under a terminal with a smaller radius of curvature. However, the maximum difference in the thermal diameter under the different terminals used in the experiment was within 2 mm.
4. Conclusions
To study the effects of different electrode terminals on the thermal characteristics of the leader channel in a 1 m long air gap discharge process, an experimental platform using M–Z interferometry and high-speed video cameras was built. The temperature and density characteristics of the leader channel were obtained from the offsets of the interference fringes. This study found that
- the temperature of the gas in the leader channel increases as the radius of curvature of the terminal decreases;
- the gas density in the channel decreases as the radius of curvature of the terminal decreases;
- the thermal diameter of the channel decreases as the radius of curvature of the terminal increases. However, the difference is not obvious in this case; for the cone terminals with radii of curvature of 2.5 mm and 5 mm, and the spherical terminal with the diameter of 40 mm, the maximum difference observed in the experiments was within 2 mm.
The temperature of the leader channel under different electrode terminals is closely related to electric field distribution and current density. In our ongoing and future research, more qualitative analyses will be carried out with the aid of current.
Author Contributions
Guidance of the theoretical analysis and writing, M.D.; Operation of the experiments, analysis and writing of the paper, Y.T., M.L., Y.M., L.L., Q.Z.; optimization and guidance of experiments, J.Z.; modification of manuscript, J.S.
Funding
This research was funded by “the National Key Research and Development Plan [No. 2017YFB0102500]”and “the Tianjin Natural Science Foundation of China [No. 17JCYBJC21300]”.
Acknowledgments
The authors wish to acknowledge CSG for financial support.
Conflicts of Interest
The authors declare no conflict of interest.
References
- Ding, Y.; Zhuang, C.; Yao, X.; Zhou, X.; He, J.; Zeng, R. Influence of front time on switching impulse discharge characteristics of UHVDC tower gaps. Electr. Power Syst. Res. 2019, 172, 32–37. [Google Scholar] [CrossRef]
- Wang, H.; Zeng, R.; Zhuang, C. Thermal variation of electric field sensor bias caused by anisotropy of LiNbO3. Appl. Phys. Lett. 2019, 114, 143501. [Google Scholar] [CrossRef]
- Zhuang, C.; Zeng, R. A local discontinuous Galerkin method for 1.5-dimensional streamer discharge simulations. Appl. Math. Comput. 2013, 219, 9925–9934. [Google Scholar] [CrossRef]
- Zhuang, C.; Zeng, R.; Zhang, B.; He, J. 2-D discontinuous Galerkin method for streamer discharge simulations in Nitrogen. IEEE Trans. Magn. 2013, 49, 1929–1932. [Google Scholar] [CrossRef]
- Zhuang, C.; Zeng, R. A positivity-preserving scheme for the simulation of streamer discharges in non-attaching and attaching gases. Commun. Comput. Phys. 2014, 15, 153–178. [Google Scholar] [CrossRef]
- Zhuang, C.; Zeng, R.; Zhang, B.; He, J. A WENO scheme for simulating streamer discharge with photoionizations. IEEE Trans. Magn. 2014, 50, 7007904. [Google Scholar] [CrossRef]
- Bazelyan, E.M.; Raizer, Y.P. Introduction: Lighting, its destructive effects and protection. In Lightning Physics and Lightning Protection; CRC Press: New York, NY, USA, 2000; pp. 5–8. [Google Scholar]
- Dwyer, J.R.; Uman, M.A. The physics of lightning. Phys. Rep. 2014, 534, 147–241. [Google Scholar] [CrossRef]
- Zhuang, C.; Liu, H.; Zeng, R.; He, J. Adaptive strategies in the leader propagation model for lightning shielding failure evaluation: Implementation and applications. IEEE Trans. Magn. 2016, 52, 9400604. [Google Scholar] [CrossRef]
- Zeng, R.; Zhuang, C.; Zhou, X.; Chen, S.; Wang, Z.; Yu, Z.; He, J. Survey of recent progress on lightning and lightning protection research. High Volt. 2016, 1, 2–10. [Google Scholar] [CrossRef]
- Zeng, R.; Zhuang, C.; Niu, B.; Yu, Z.; He, J. Measurement of transient electric field in air gap discharge by integrated electro-optic sensor. IEEE Trans. Plasma Sci. 2013, 41, 955–960. [Google Scholar] [CrossRef]
- Zeng, R.; Zhuang, C.; Yu, Z.; Li, Z.; Geng, Y. Electric field step in air gap streamer discharge. Appl. Phys. Lett. 2011, 99, 221503. [Google Scholar] [CrossRef]
- Ma, X.; Zhuang, C.; Wang, Z.; Zeng, R. Positive Leader Velocity and Discharge Current Considering Leader Branching Under Different Air Pressures. IEEE Trans. Plasma Sci. 2019, 47, 1939–1943. [Google Scholar] [CrossRef]
- The Renardières Group. Research on long air gap discharges at les renardières. Electra 1972, 23, 53–157. [Google Scholar]
- The Renardières Group. Research on long air gap discharges at les renardières-1973 results. Electra 1974, 35, 49–156. [Google Scholar]
- The Renardières Group. Positive discharges in long air gap discharges at les renardières-1975 results and conclusions. Electra 1977, 53, 31–151. [Google Scholar]
- The Renardières Group. Negative discharges in long air gap discharges at les renardières. Electra 1981, 74, 67–156. [Google Scholar]
- Gallimberti, I.; Bacchiega, G.; Bondiou-Clergerie, A.; Lalande, P. Fundamental processes in long air gap discharges. C. R. Phys. 2002, 3, 1335–1359. [Google Scholar] [CrossRef]
- Gallimberti, I. The mechanism of the long spark formation. J. Phys. Colloq. 1979, 40, 193–250. [Google Scholar] [CrossRef]
- Raizer, Y.P. Spark discharge. In Gas Discharge Physics; CRC Press: New York, NY, USA, 1998. [Google Scholar]
- Vogel, N.; Kolacinski, Z. Spectroscopic measurements of radial temperature distributions in short electric arcs. J. Phys. D Appl. Phys. 1987, 20, 545–547. [Google Scholar] [CrossRef]
- Laux, C.O.; Spence, T.G.; Kruger, C.H.; Zare, R.N. Optical diagnostics of atmospheric pressure air plasmas. Plasma Sources Sci. Technol. 2003, 12, 125–138. [Google Scholar] [CrossRef]
- López, J.; Echeverry, D.; Zambrano, G.; Castro, L.F.; Prieto, P. Gas temperature determination of an AC arc discharge at atmospheric pressure in air using a Mach-Zehnder interferometer. IEEE Trans. Plasma Sci. 2006, 34, 115–120. [Google Scholar] [CrossRef]
- Zhou, X.; Zeng, R.; Zhuang, C. Application of a Mach-Zehnder interferometer to parameters measurements in air arcs. In Proceedings of the XXXI Edition of the International Conference on Phenomena in Ionized Gases (ICPIG), Granada, Spain, 14–19 July 2013. [Google Scholar]
- Stancu, G.D.; Kaddouri, F.; Lacoste, D.A.; Laux, C.O. Atmospheric pressure plasma diagnostics by OES, CRDS and TALIF. J. Phys. D Appl. Phys. 2010, 43, 124002. [Google Scholar] [CrossRef]
- Van Gessel, A.F.H.; Carbone, E.A.D.; Bruggeman, P.J.; Van der Mullen, J.J.A.M. Laser scattering on an atmospheric pressure plasma jet: Disentangling Rayleigh, Raman and Thomson scattering. Plasma Sources Sci. Technol. 2012, 21, 015003. [Google Scholar] [CrossRef]
- Cui, Y.; Zhuang, C.; Zeng, R.; Zhou, X. Shock wave in a long-air-gap leader discharge. AIP Adv. 2019, 9, 065001. [Google Scholar] [CrossRef]
- Cui, Y.; Zhuang, C.; Zhou, X.; Zeng, R. The dynamic expansion of leader discharge channels under positive voltage impulse with different rise times in long air gap: Experimental observation and simulation results. J. Appl. Phys. 2019, 125, 113302. [Google Scholar] [CrossRef]
- Cui, Y.; Zhuang, C.; Zhou, X.; Zeng, R.; He, J. Thermodynamic Properties of Negative Discharge Channels in a 1-m Air Gap Measured by Optical Interferometry. IEEE Trans. Plasma Sci. 2019, 47, 1917–1925. [Google Scholar] [CrossRef]
- Zhao, X.; Liu, L.; Yue, Y.; He, H.; Liu, L.; He, J. On the use of quantitative Schlieren techniques in temperature measurement of leader discharge channels. Plasma Sources Sci. Technol. 2019, 28, 075012. [Google Scholar] [CrossRef]
- Uman, M. Comparison of lightning and a long laboratory spark. Proc. IEEE 1971, 59, 457–466. [Google Scholar] [CrossRef]
- Zhuang, C.; Wang, Z.; Zeng, R.; Liu, L.; Li, T.; Li, M.; Cui, Y.; He, J. Discharge characteristics of different lightning air terminals under composite voltages. Plasma Sci. Technol. 2019, 21, 051001. [Google Scholar] [CrossRef]
- Popov, N.A. Formation and development of a leader channel in air. Plasma Phys. Rep. 2003, 29, 695. [Google Scholar] [CrossRef]
- Silva, C.L.; Pasko, V.P. Dynamics of streamer-to-leader transition at reduced air densities and its implications for propagation of lightning leaders and gigantic jets. J. Geophys. Res. Atmos. 2013, 118, 13. [Google Scholar] [CrossRef]
- Leipold, F.; Stark, R.H.; EI-Habachi, A.; Schoenbach, K.H. Electron density measurements in an atmospheric pressure air plasma by means of infrared heterodyne interferometry. J. Phys. D Appl. Phys. 2000, 33, 2268–2273. [Google Scholar] [CrossRef]
- Liu, L.; Becerra, M. On the critical charge required for positive leader inception in long air gaps. J. Phys. D Appl. Phys. 2018, 51, 035202. [Google Scholar] [CrossRef]
- Liu, L.; Becerra, M. Gas heating dynamics during leader inception in long air gaps at atmospheric. J. Phys. D Appl. Phys. 2017, 50, 345202. [Google Scholar] [CrossRef]
- Zhou, X.; Zeng, R.; Zhuang, C.; Chen, S. Experimental study on thermal characteristics of positive leader discharges using Mach-Zehnder interferometry. Phys. Plasmas 2015, 22, 063508. [Google Scholar] [CrossRef]
- Naidis, G.V. Simulation of streamer-to-spark transition in short non-uniform air gaps. J. Phys. D Appl. Phys. 1999, 32, 2649. [Google Scholar] [CrossRef]
- Naidis, G.V. Dynamics of streamer breakdown of short non-uniform air gaps. J. Phys. D Appl. Phys. 2005, 38, 3889. [Google Scholar] [CrossRef]
- Li, Z.; Zeng, R. Comparison of the Characteristics of Upward Leader Emerging From the Ground Wire and Conductor. IEEE Trans. Power Deliv. 2014, 29, 708–715. [Google Scholar] [CrossRef]
- Wang, Z.; Liao, Z.; Chen, D. Analysis of spatial electric field with point-plate electrodes configuration using finite element method. J. Chongqing Univ. 2010, 33, 41–47. [Google Scholar]
© 2019 by the authors. Licensee MDPI, Basel, Switzerland. This article is an open access article distributed under the terms and conditions of the Creative Commons Attribution (CC BY) license (http://creativecommons.org/licenses/by/4.0/).

