CO2 Adsorption–Desorption Kinetics from the Plane Sheet of Hard Coal and Associated Shrinkage of the Material


Abstract
1. Introduction
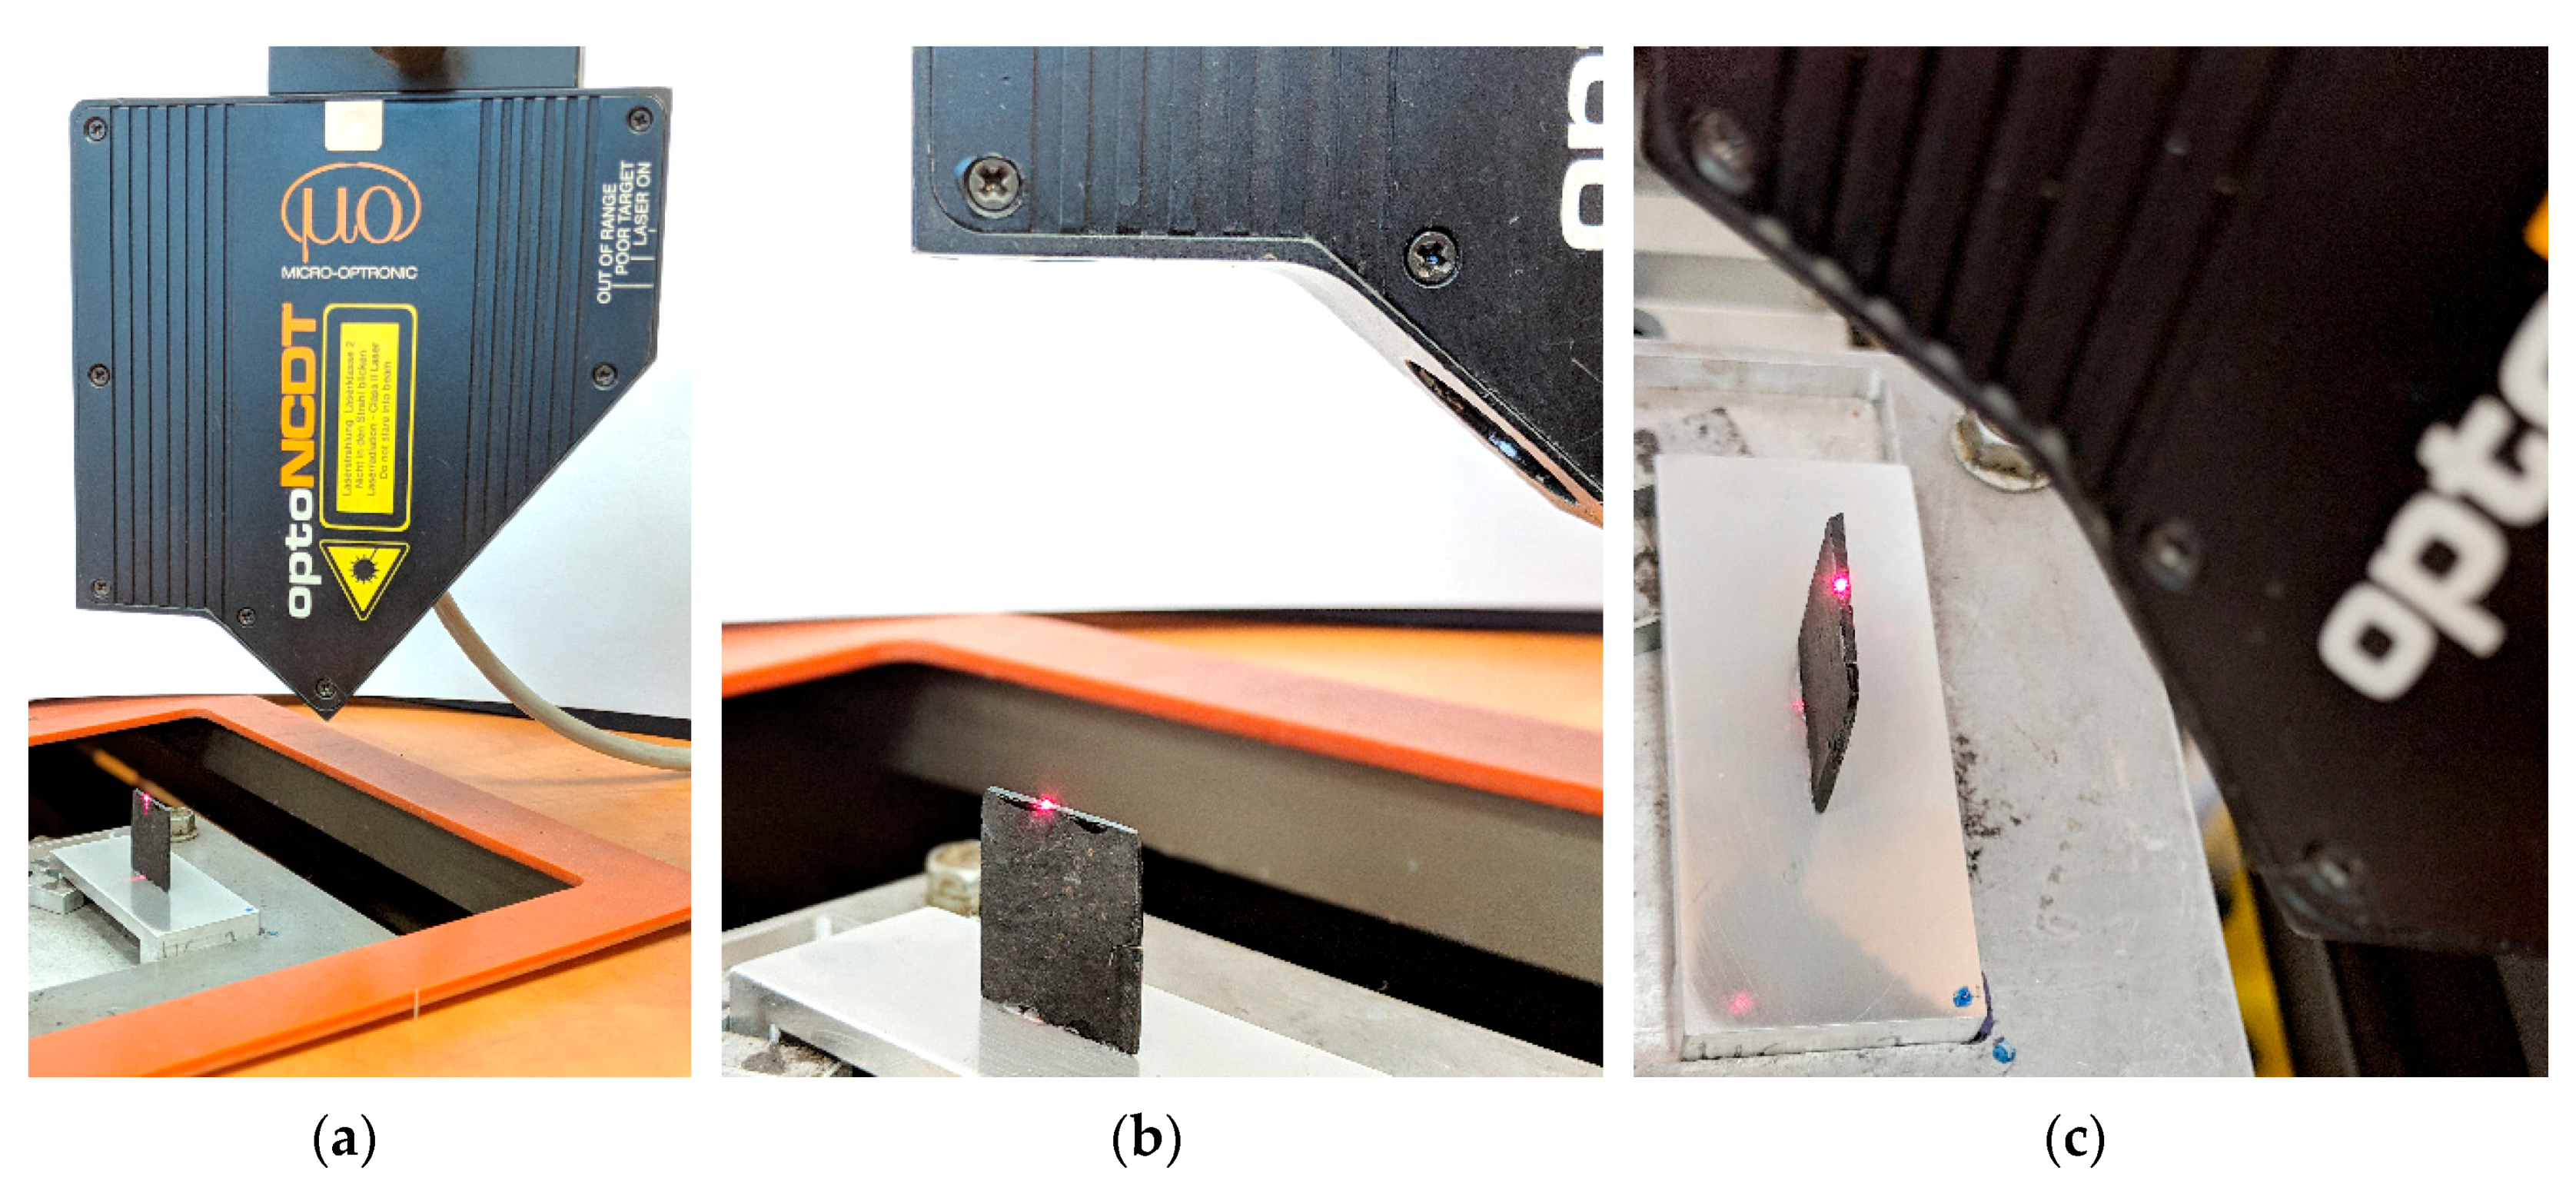
2. Research Methodology
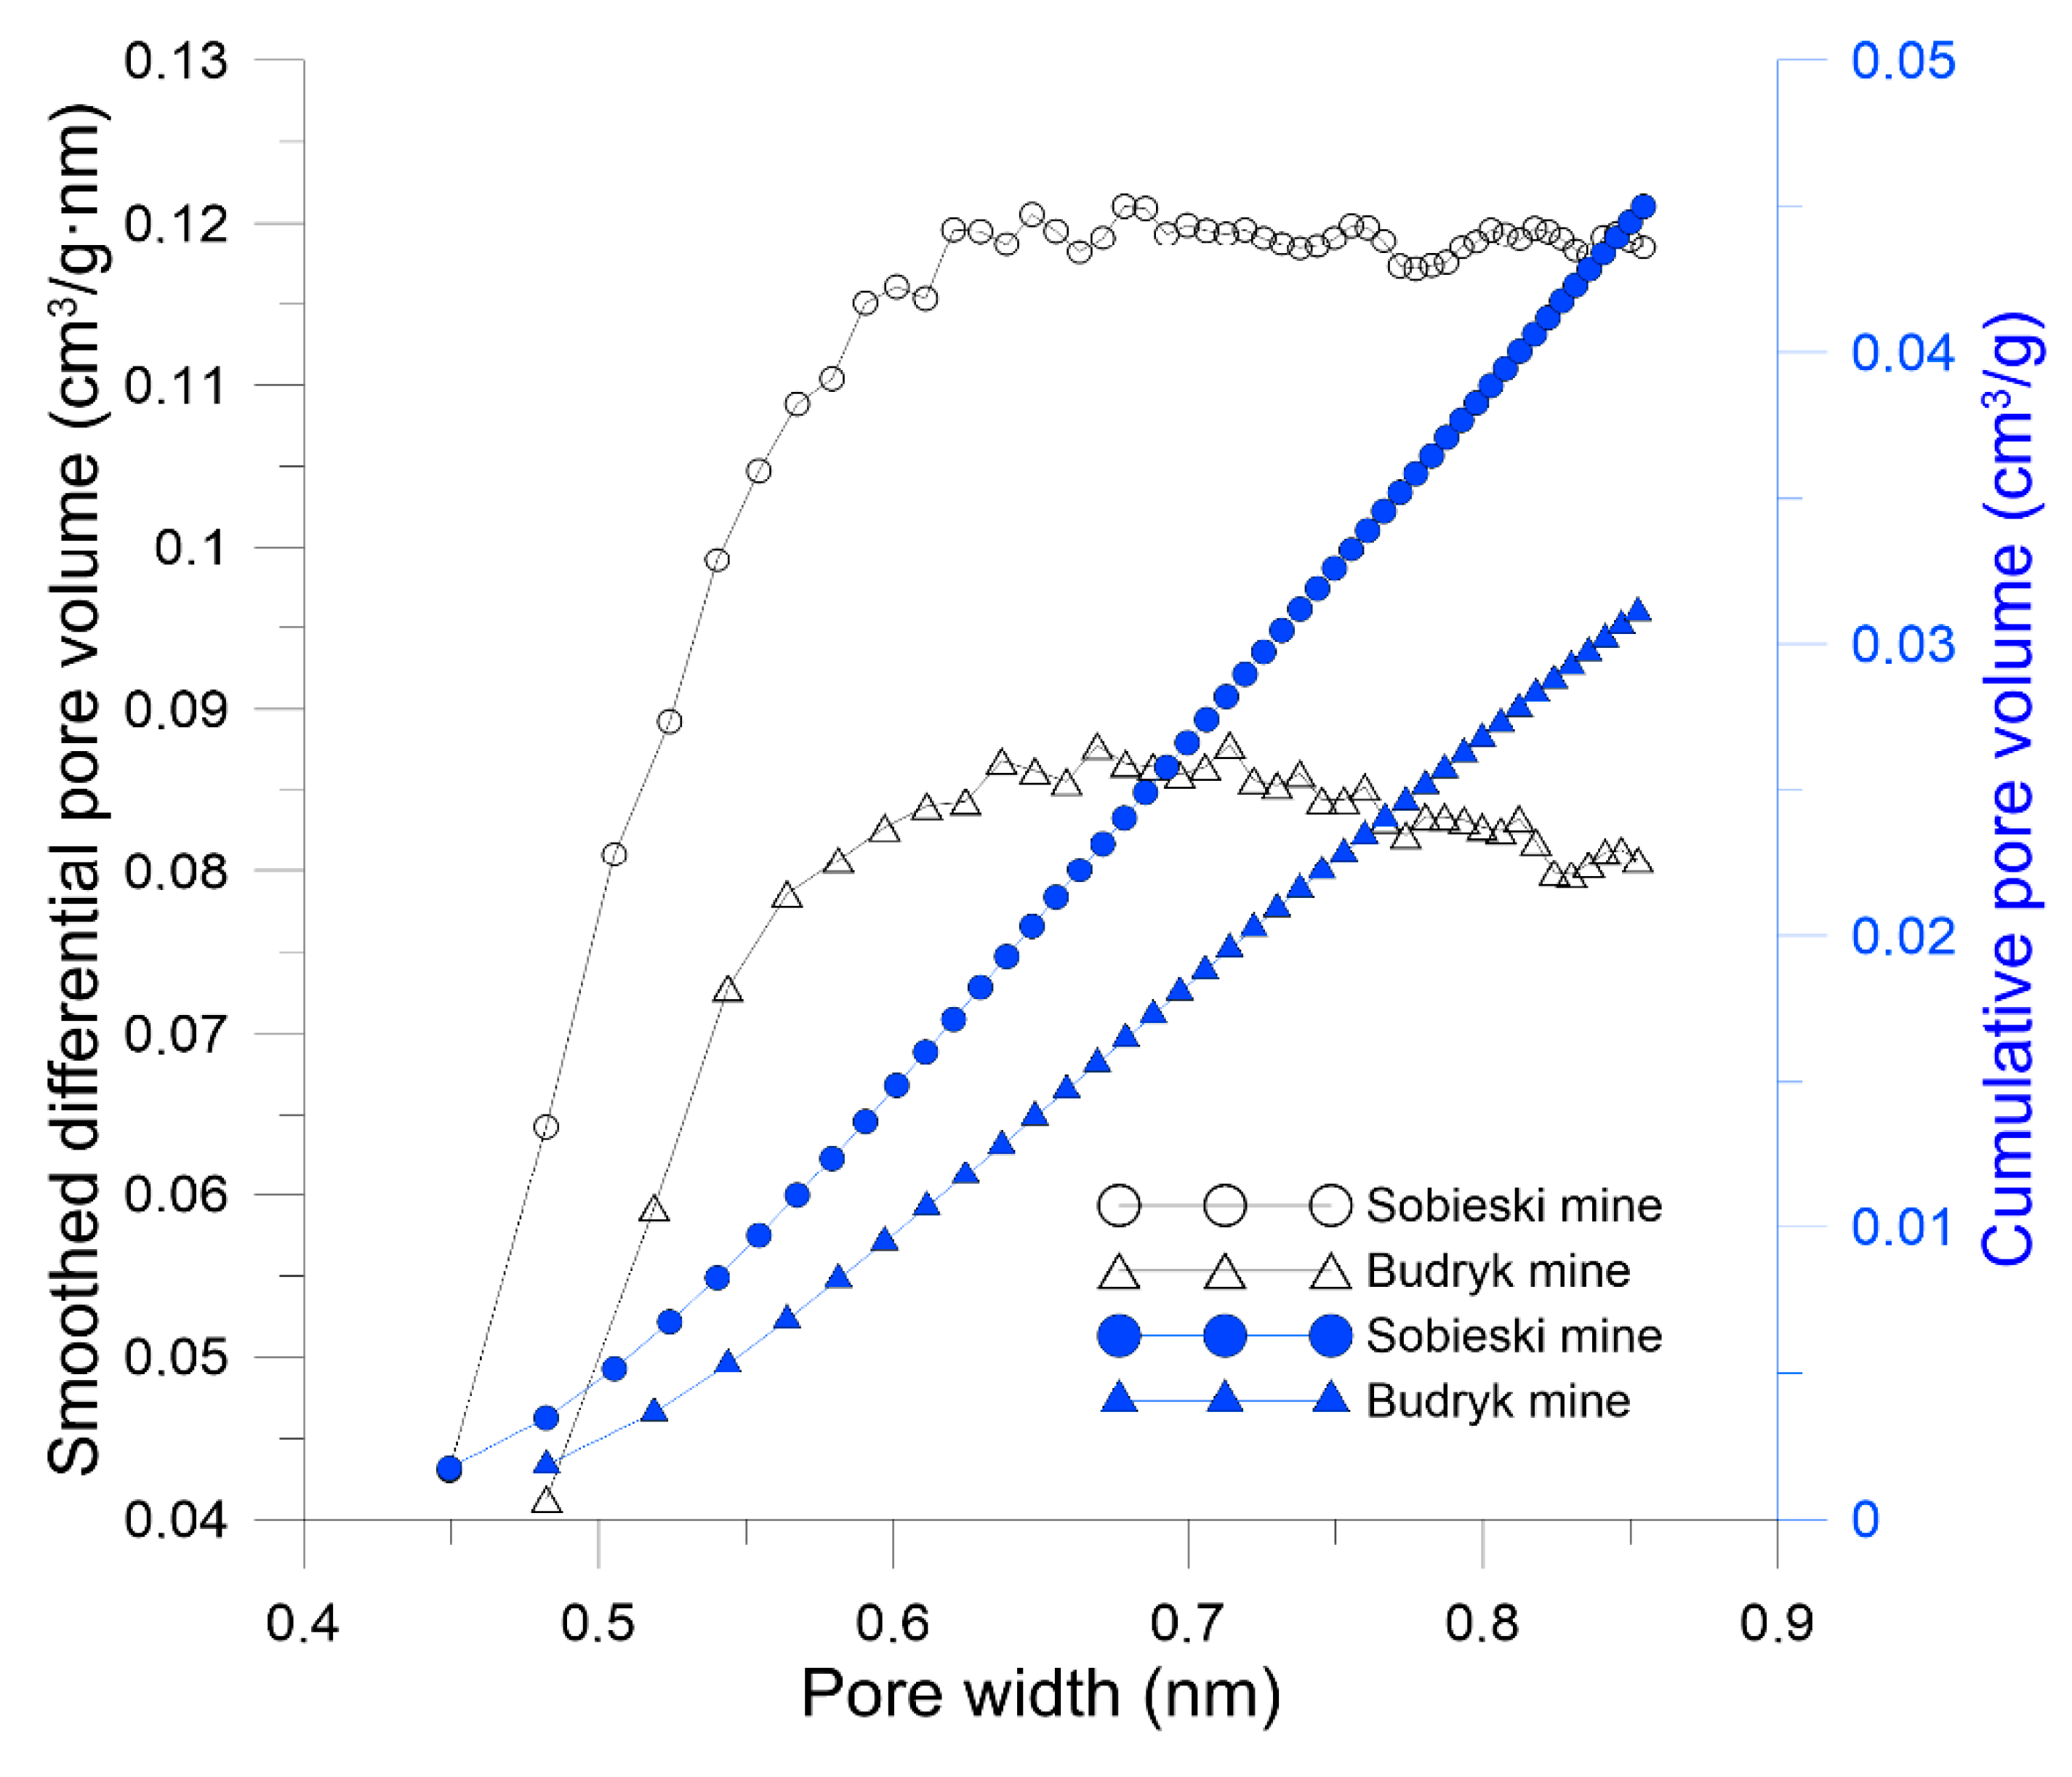
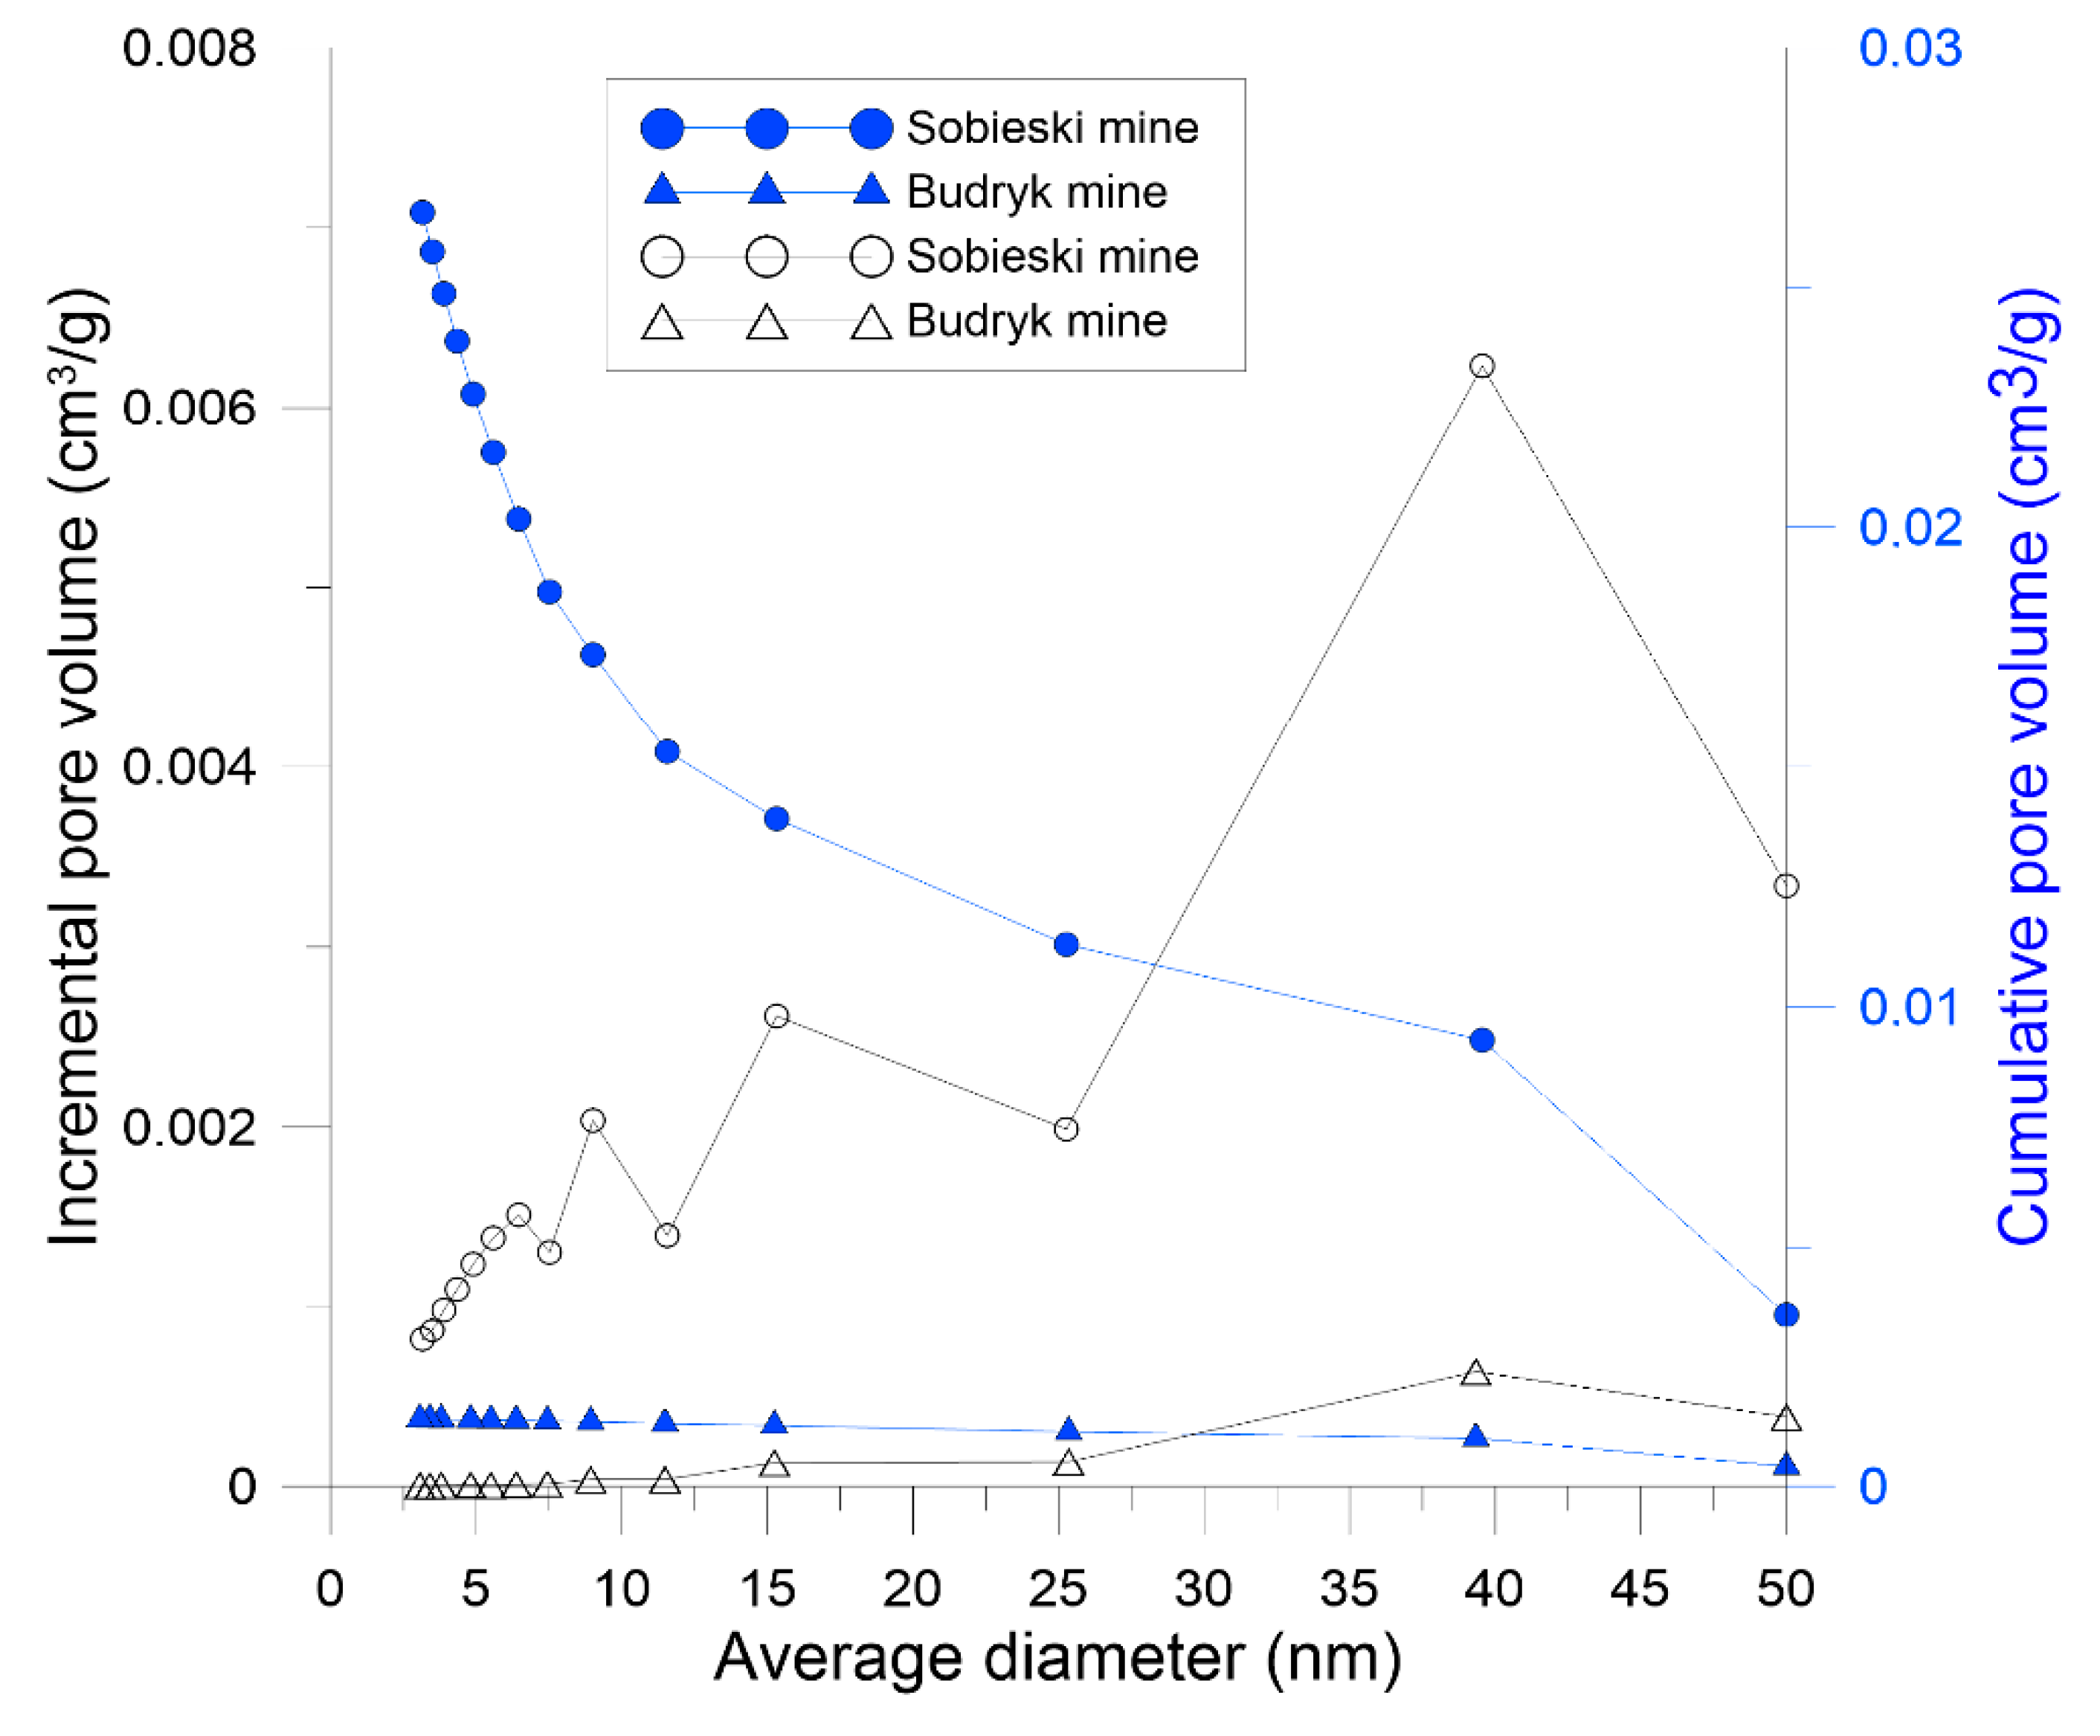
3. Petrographical and Structural Description of Analyzed Coal
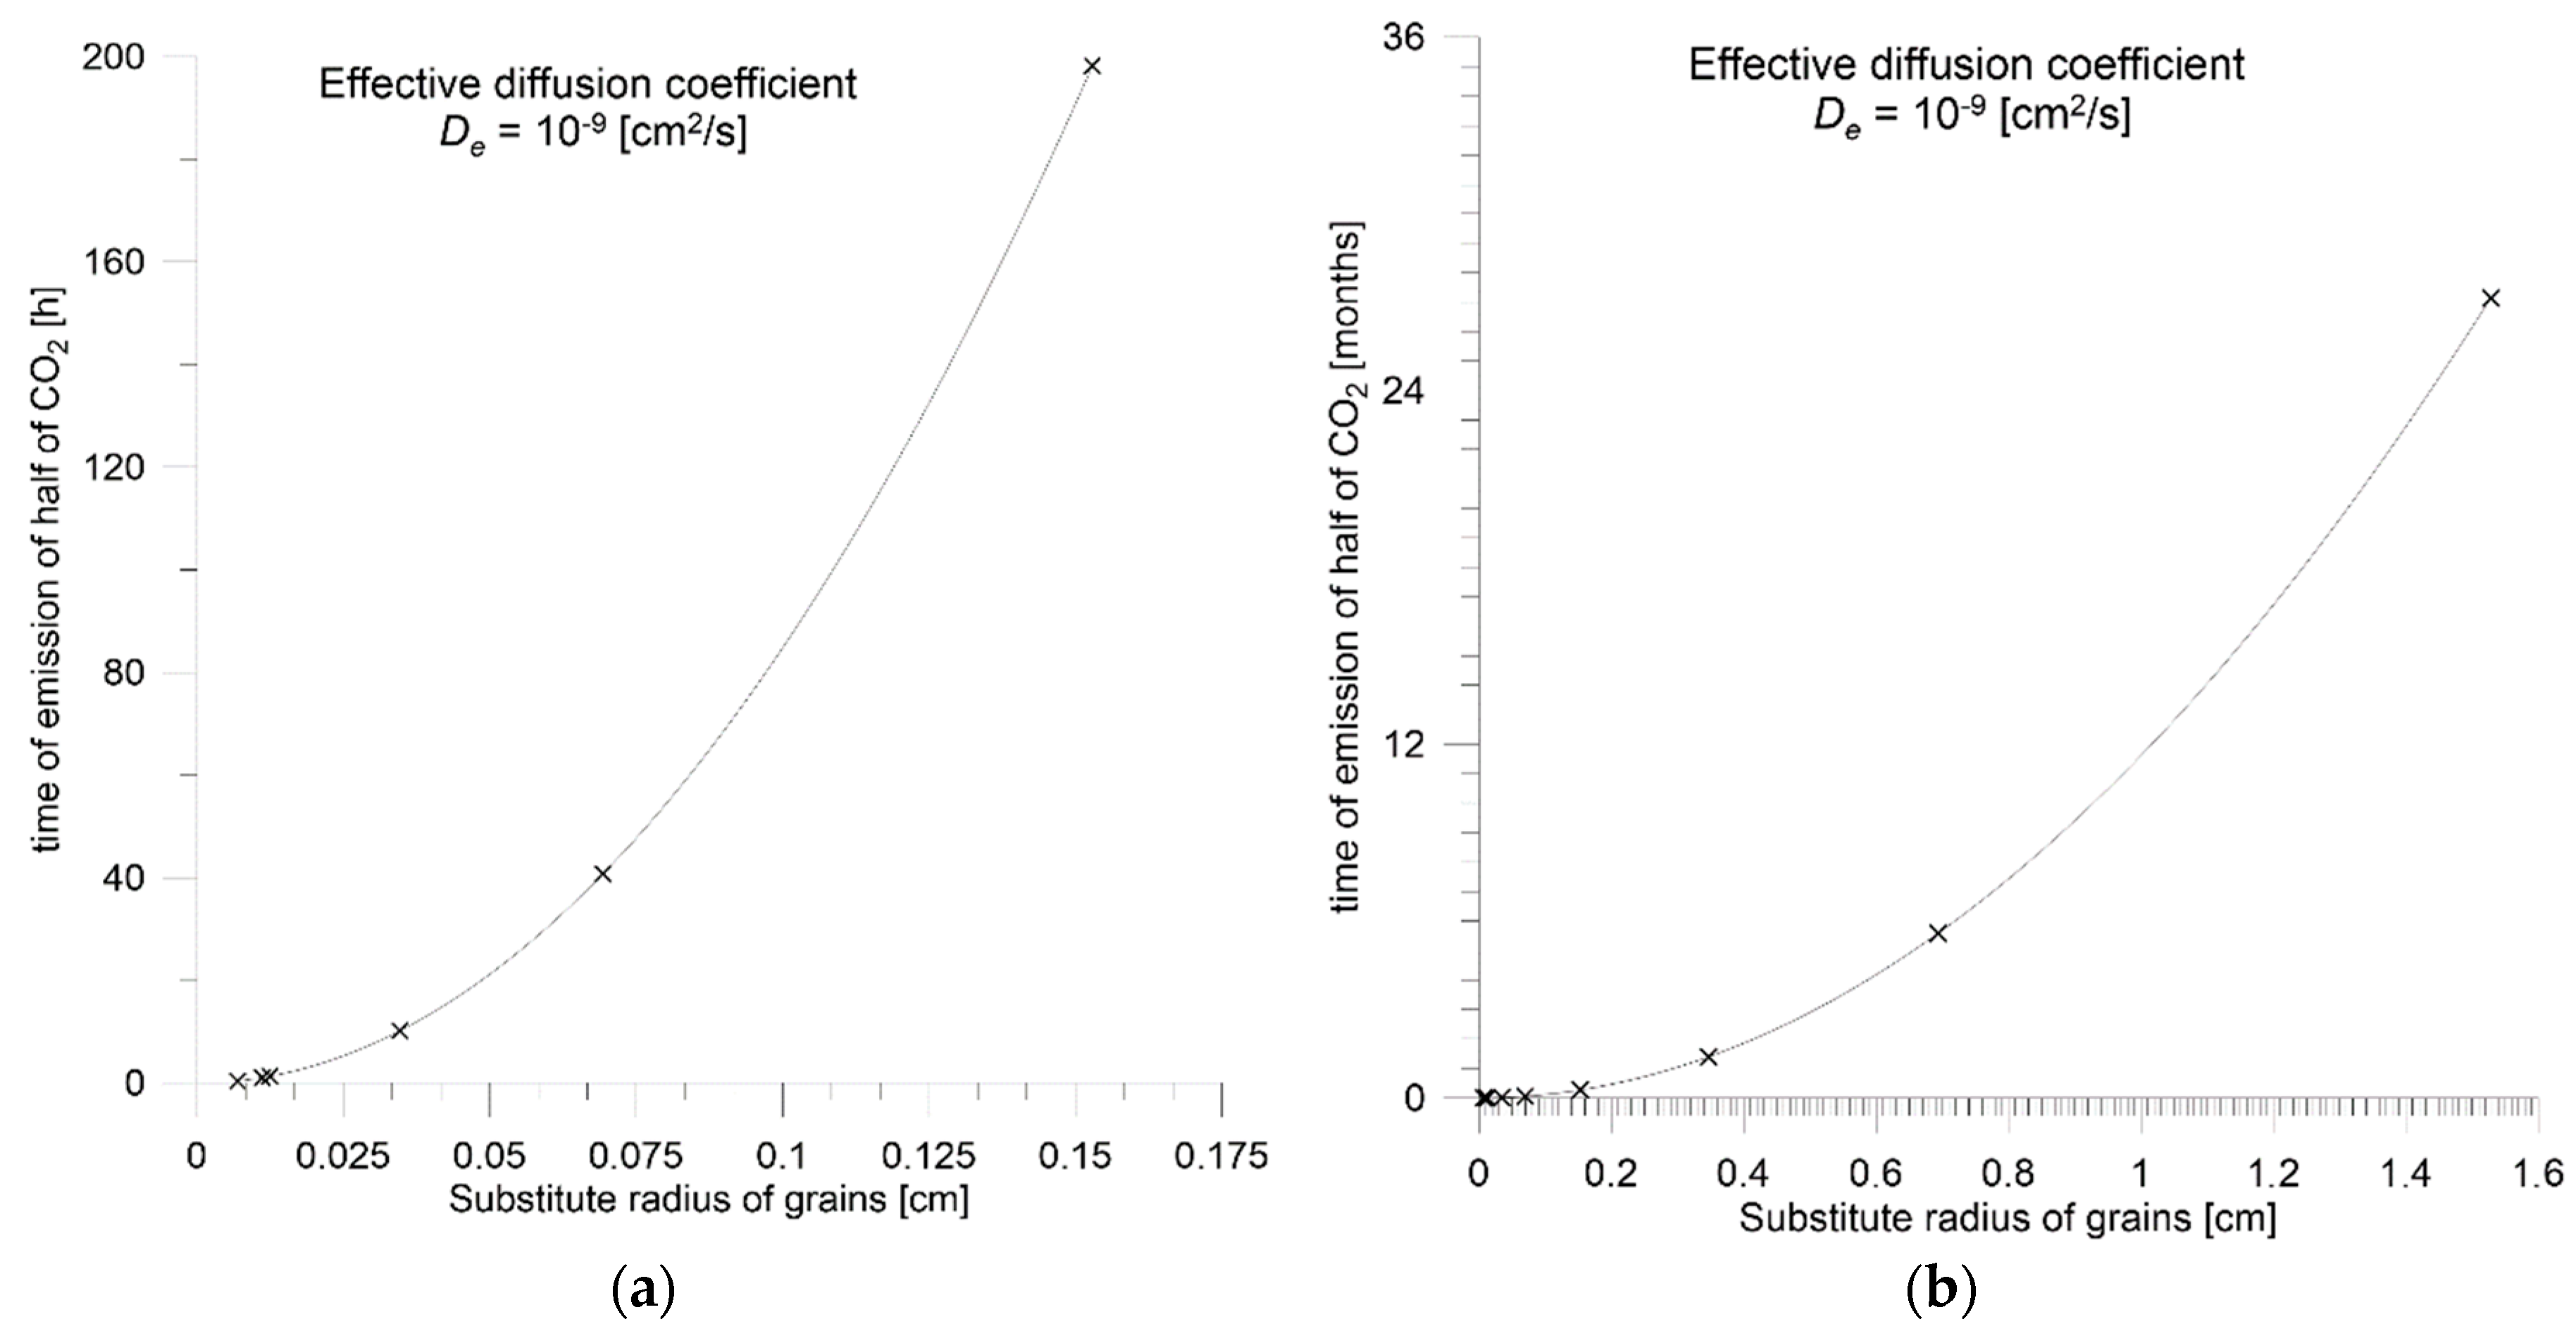
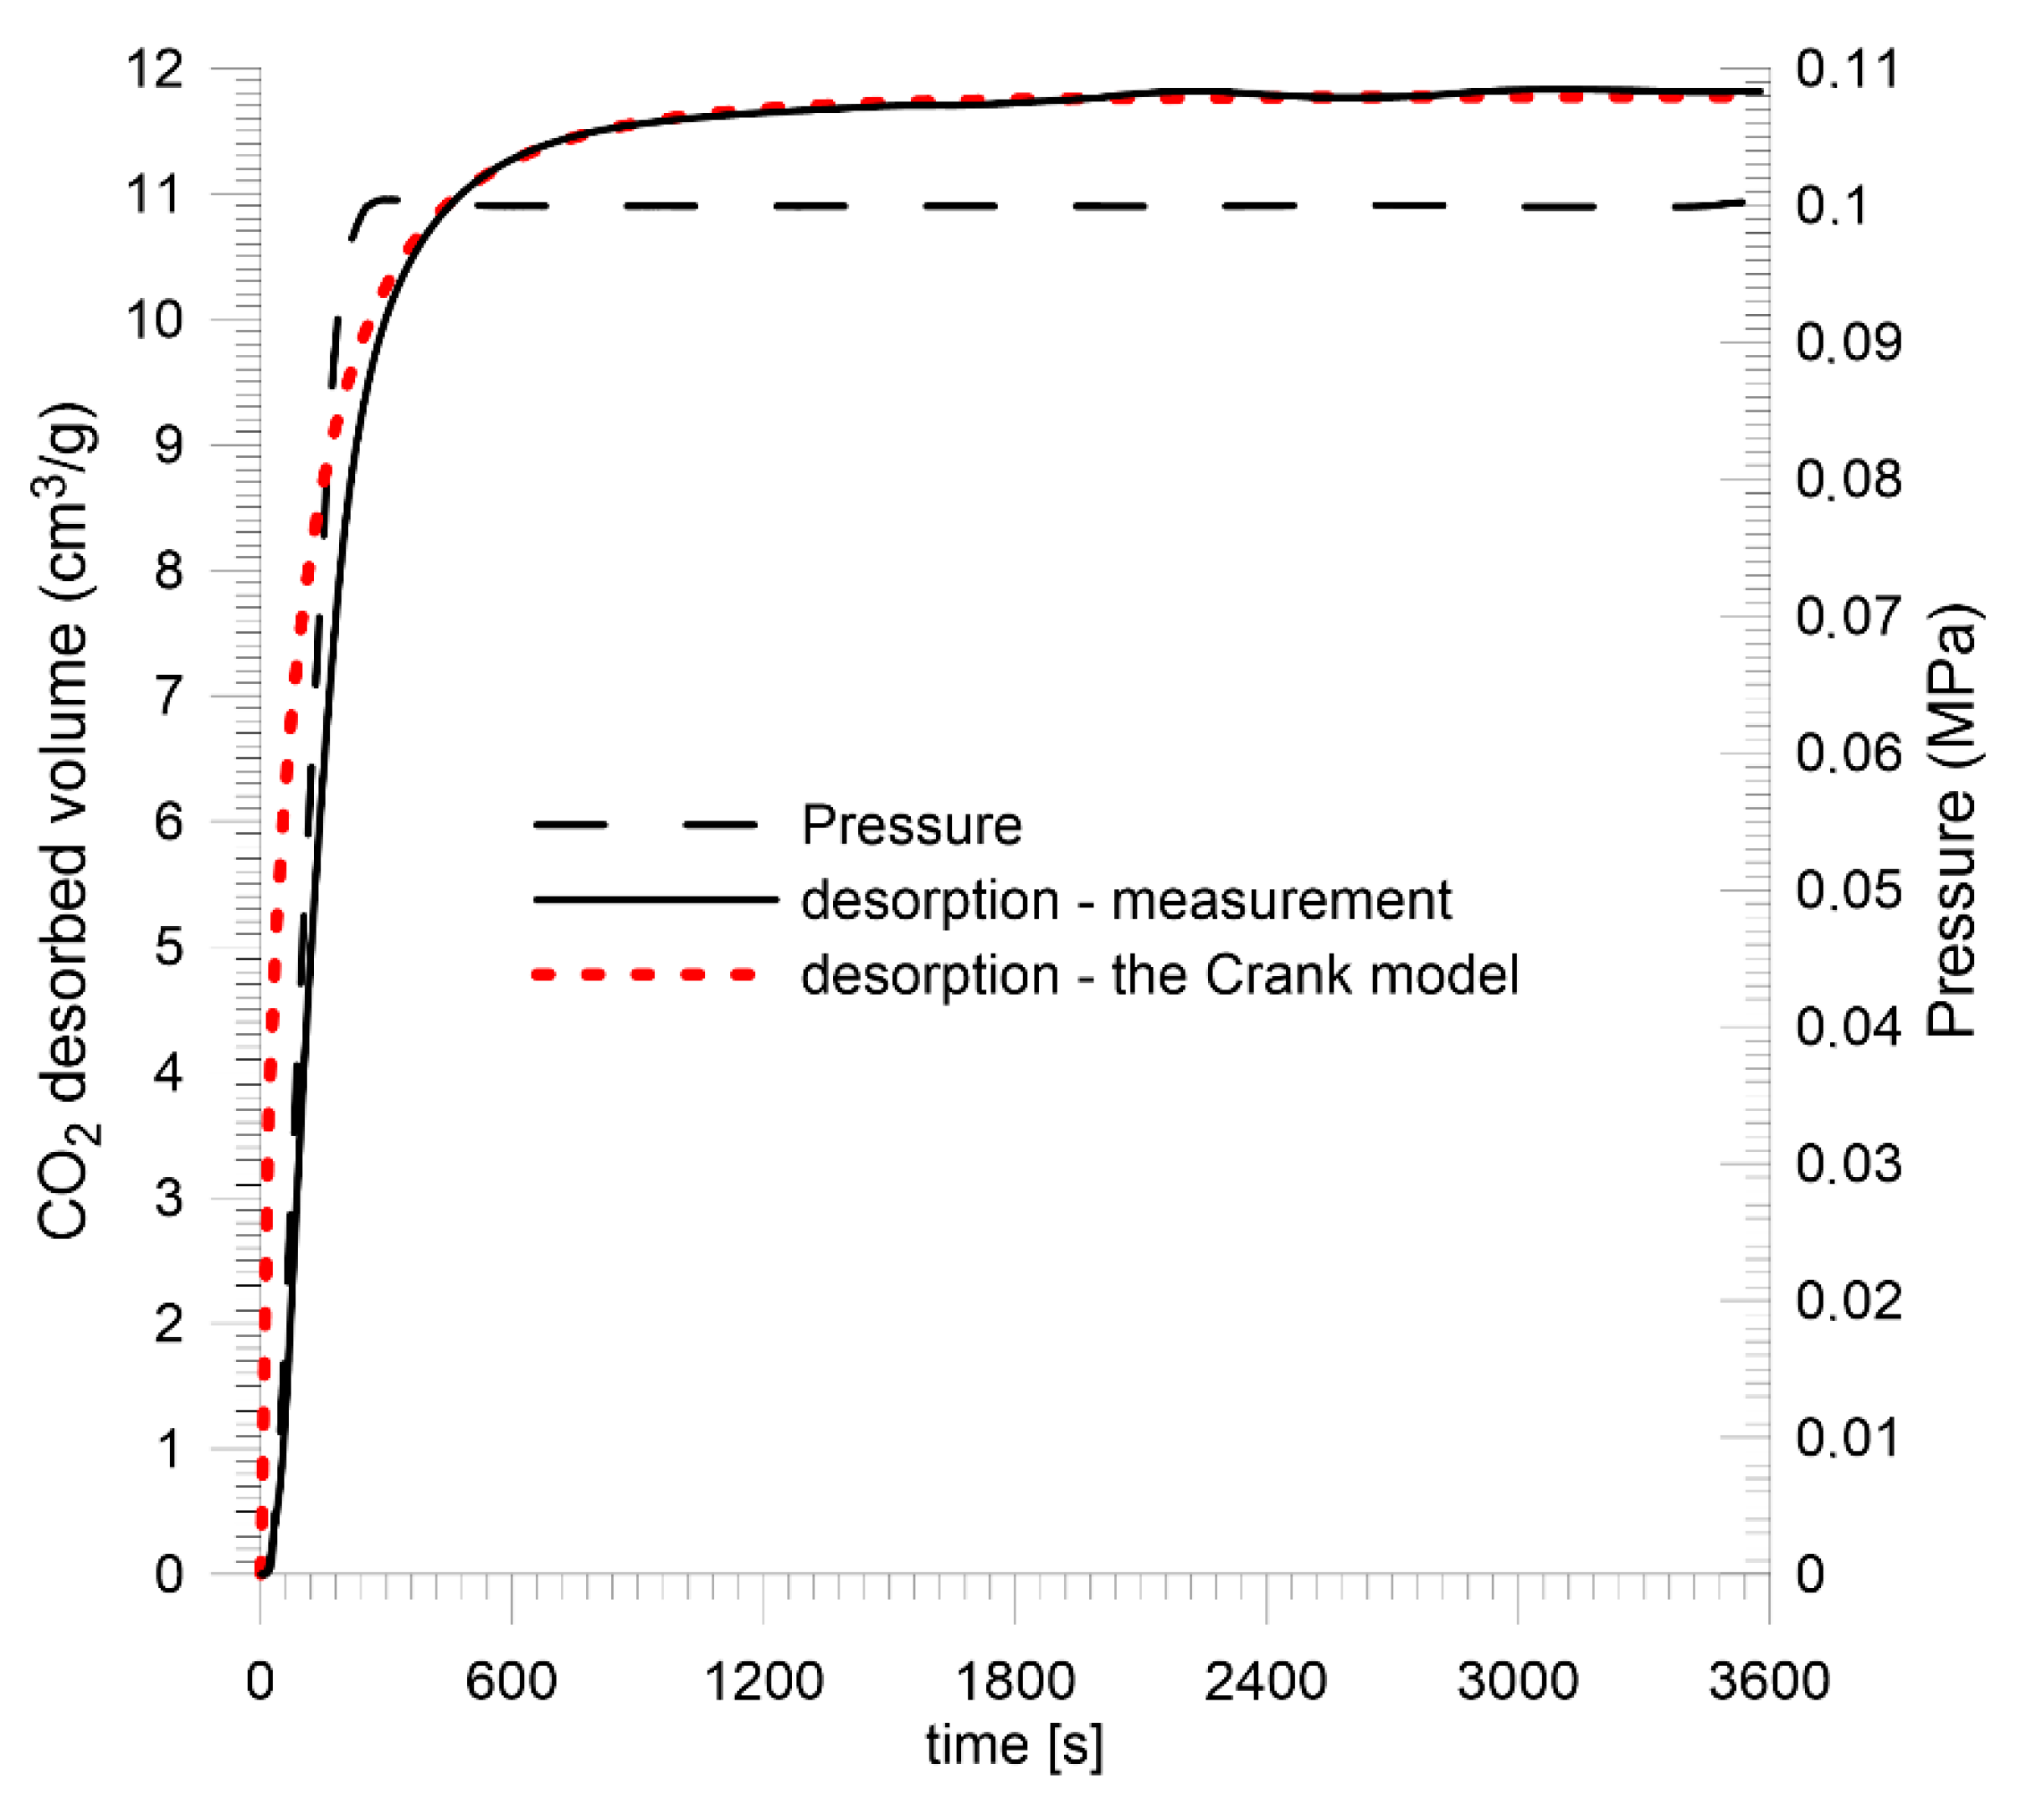
4. Gas Desorption from the Spherical Coal Sample
4.1. Mathematical Model of Desorption
4.2. Laboratory Measurements
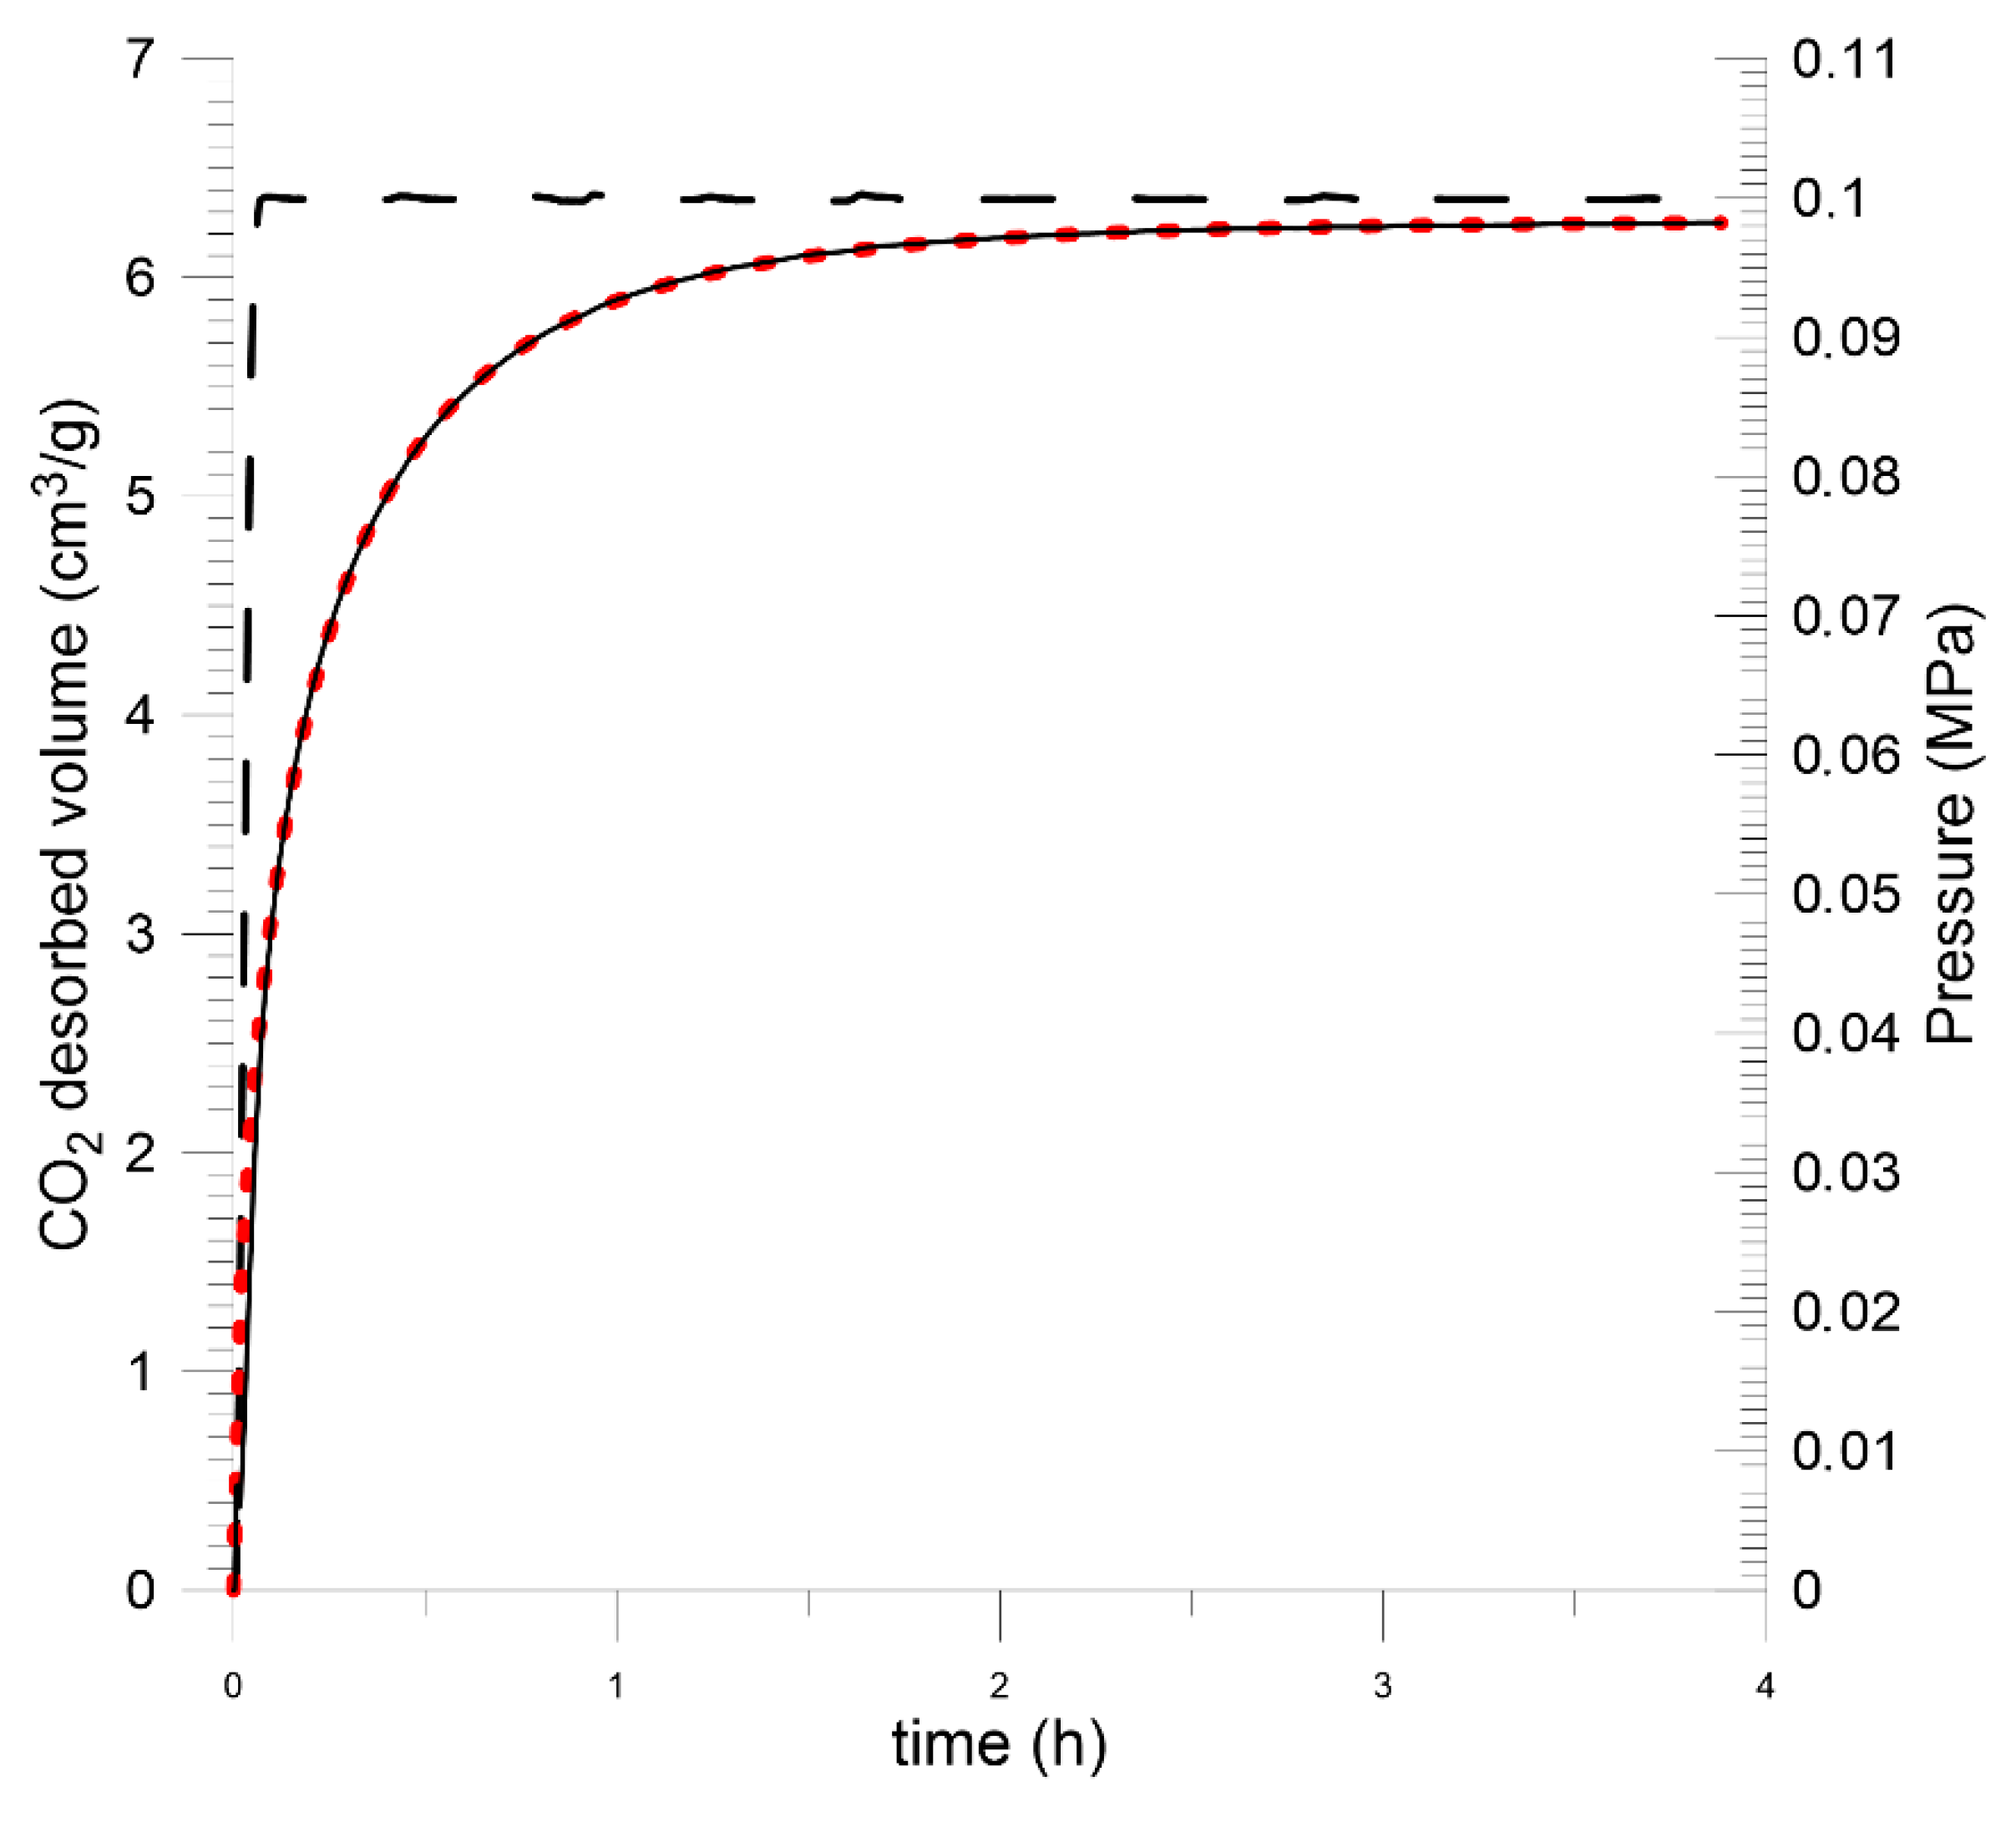
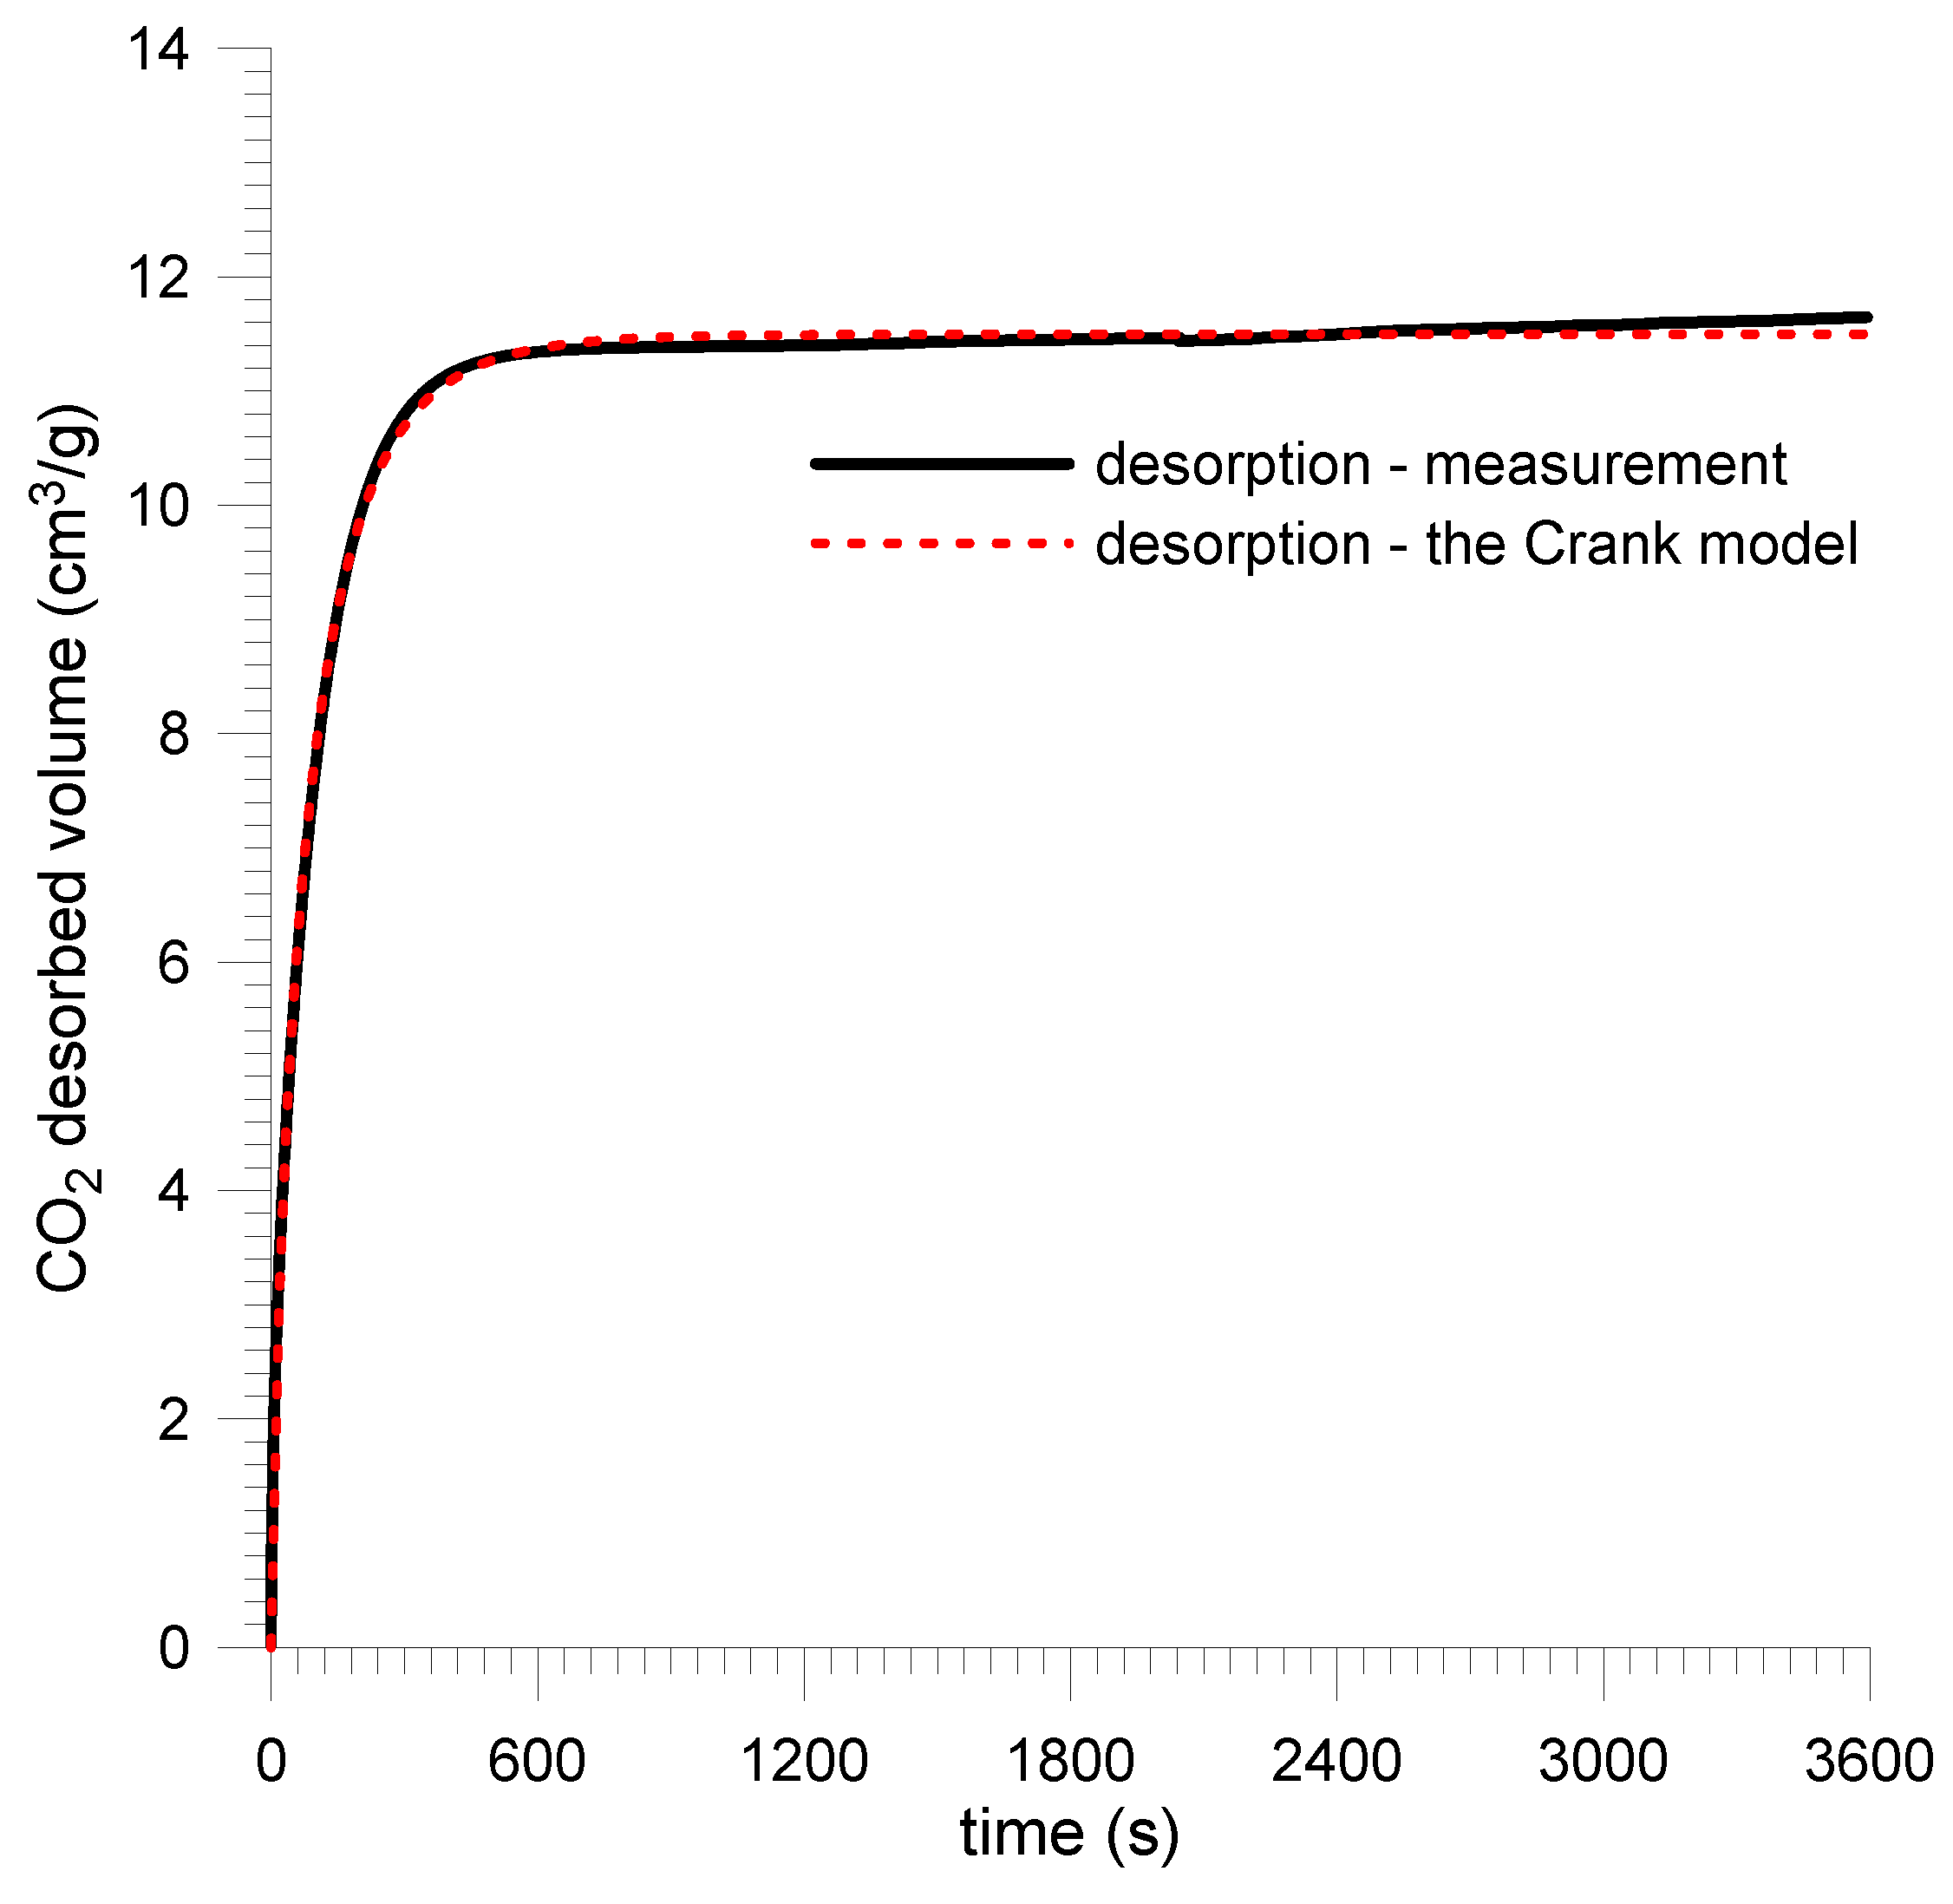
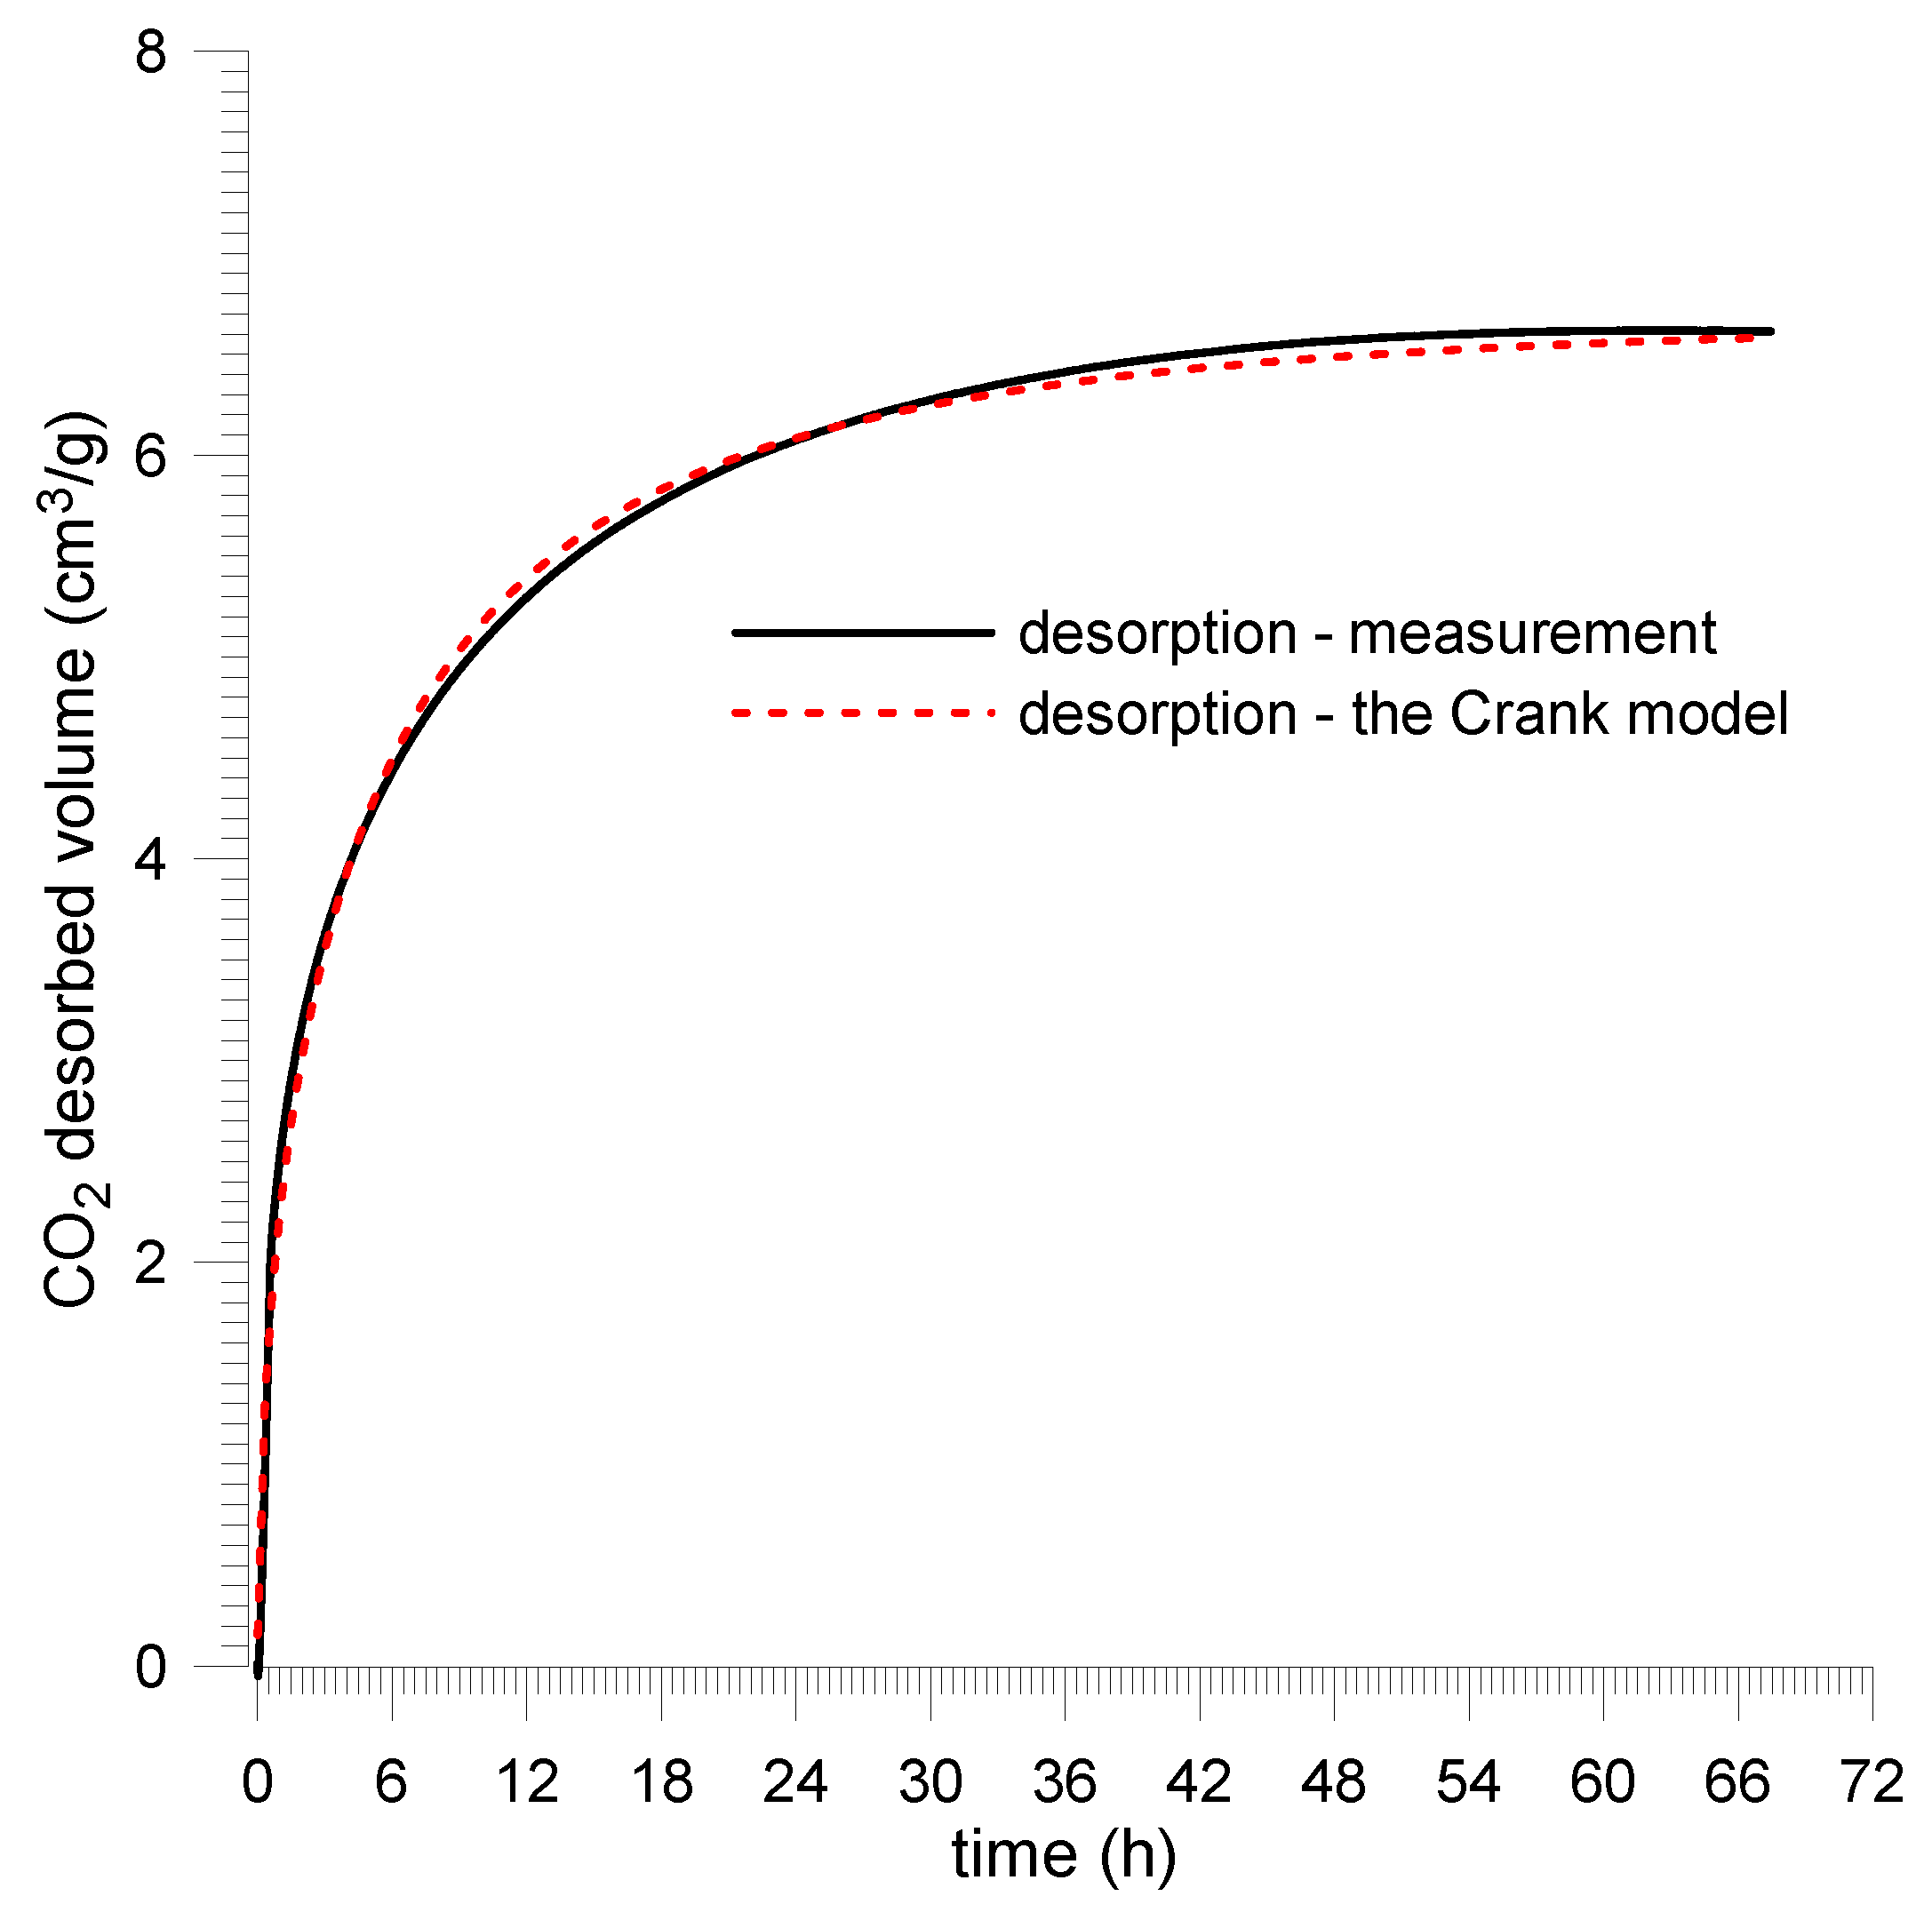
5. Gas Desorption from the Plane Sheet Coal Sample
5.1. Mathematical Model of Desorption
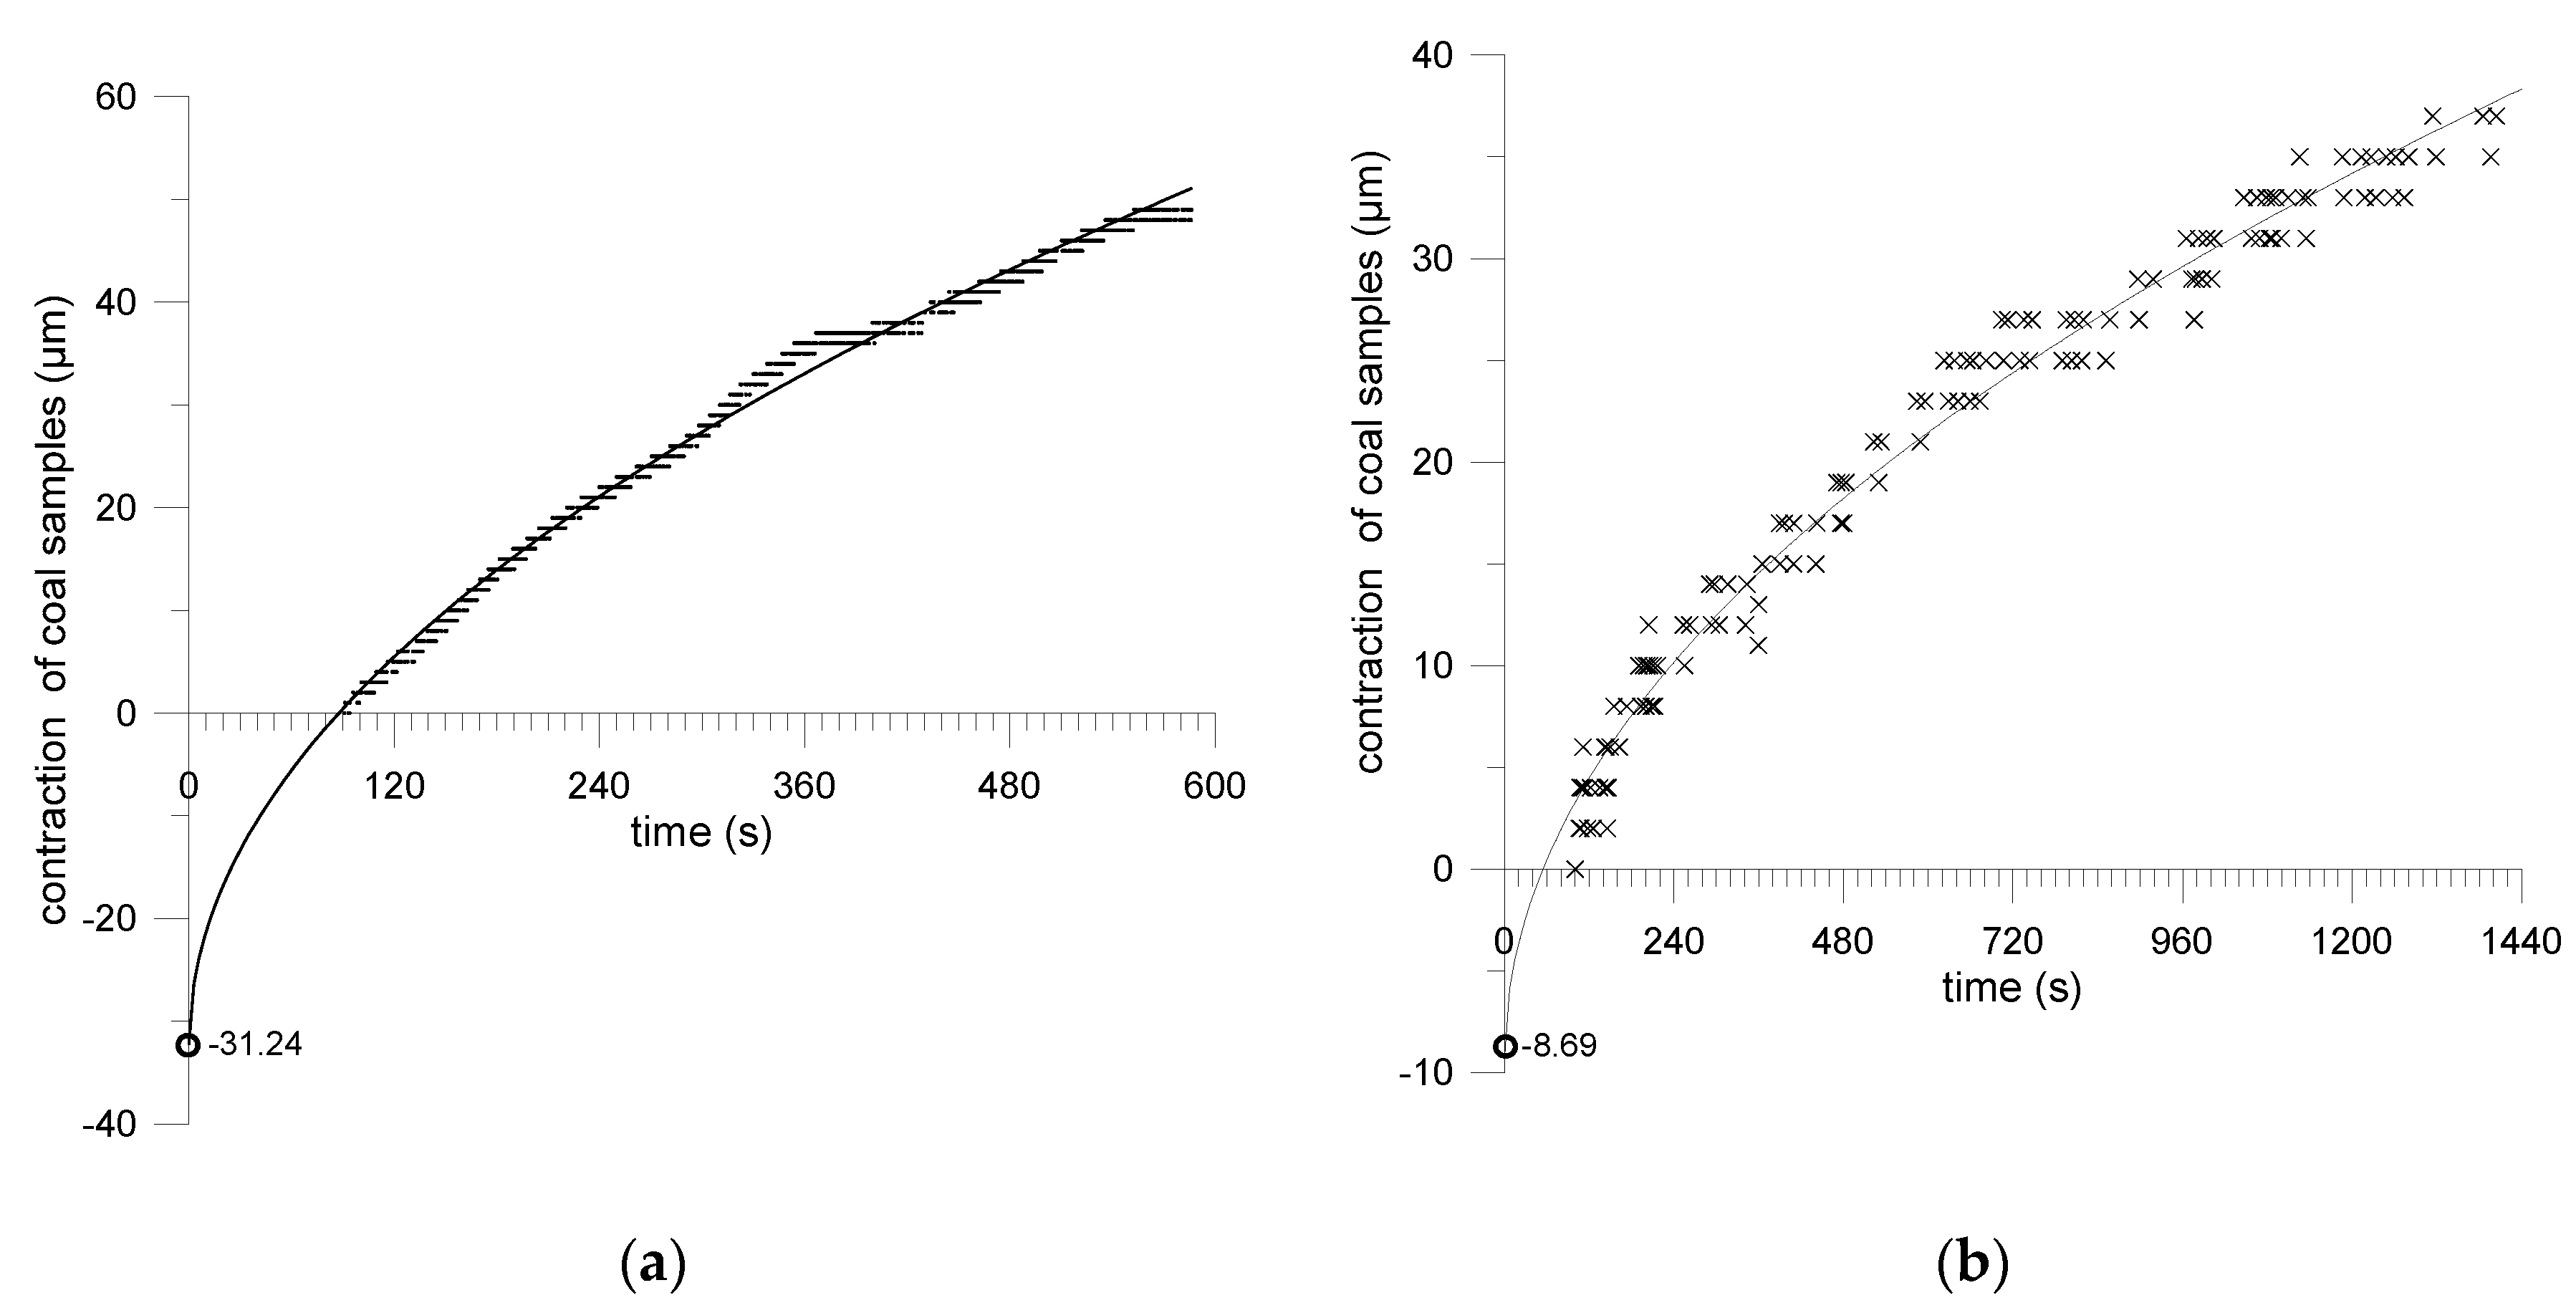
5.2. Laboratory Measurements
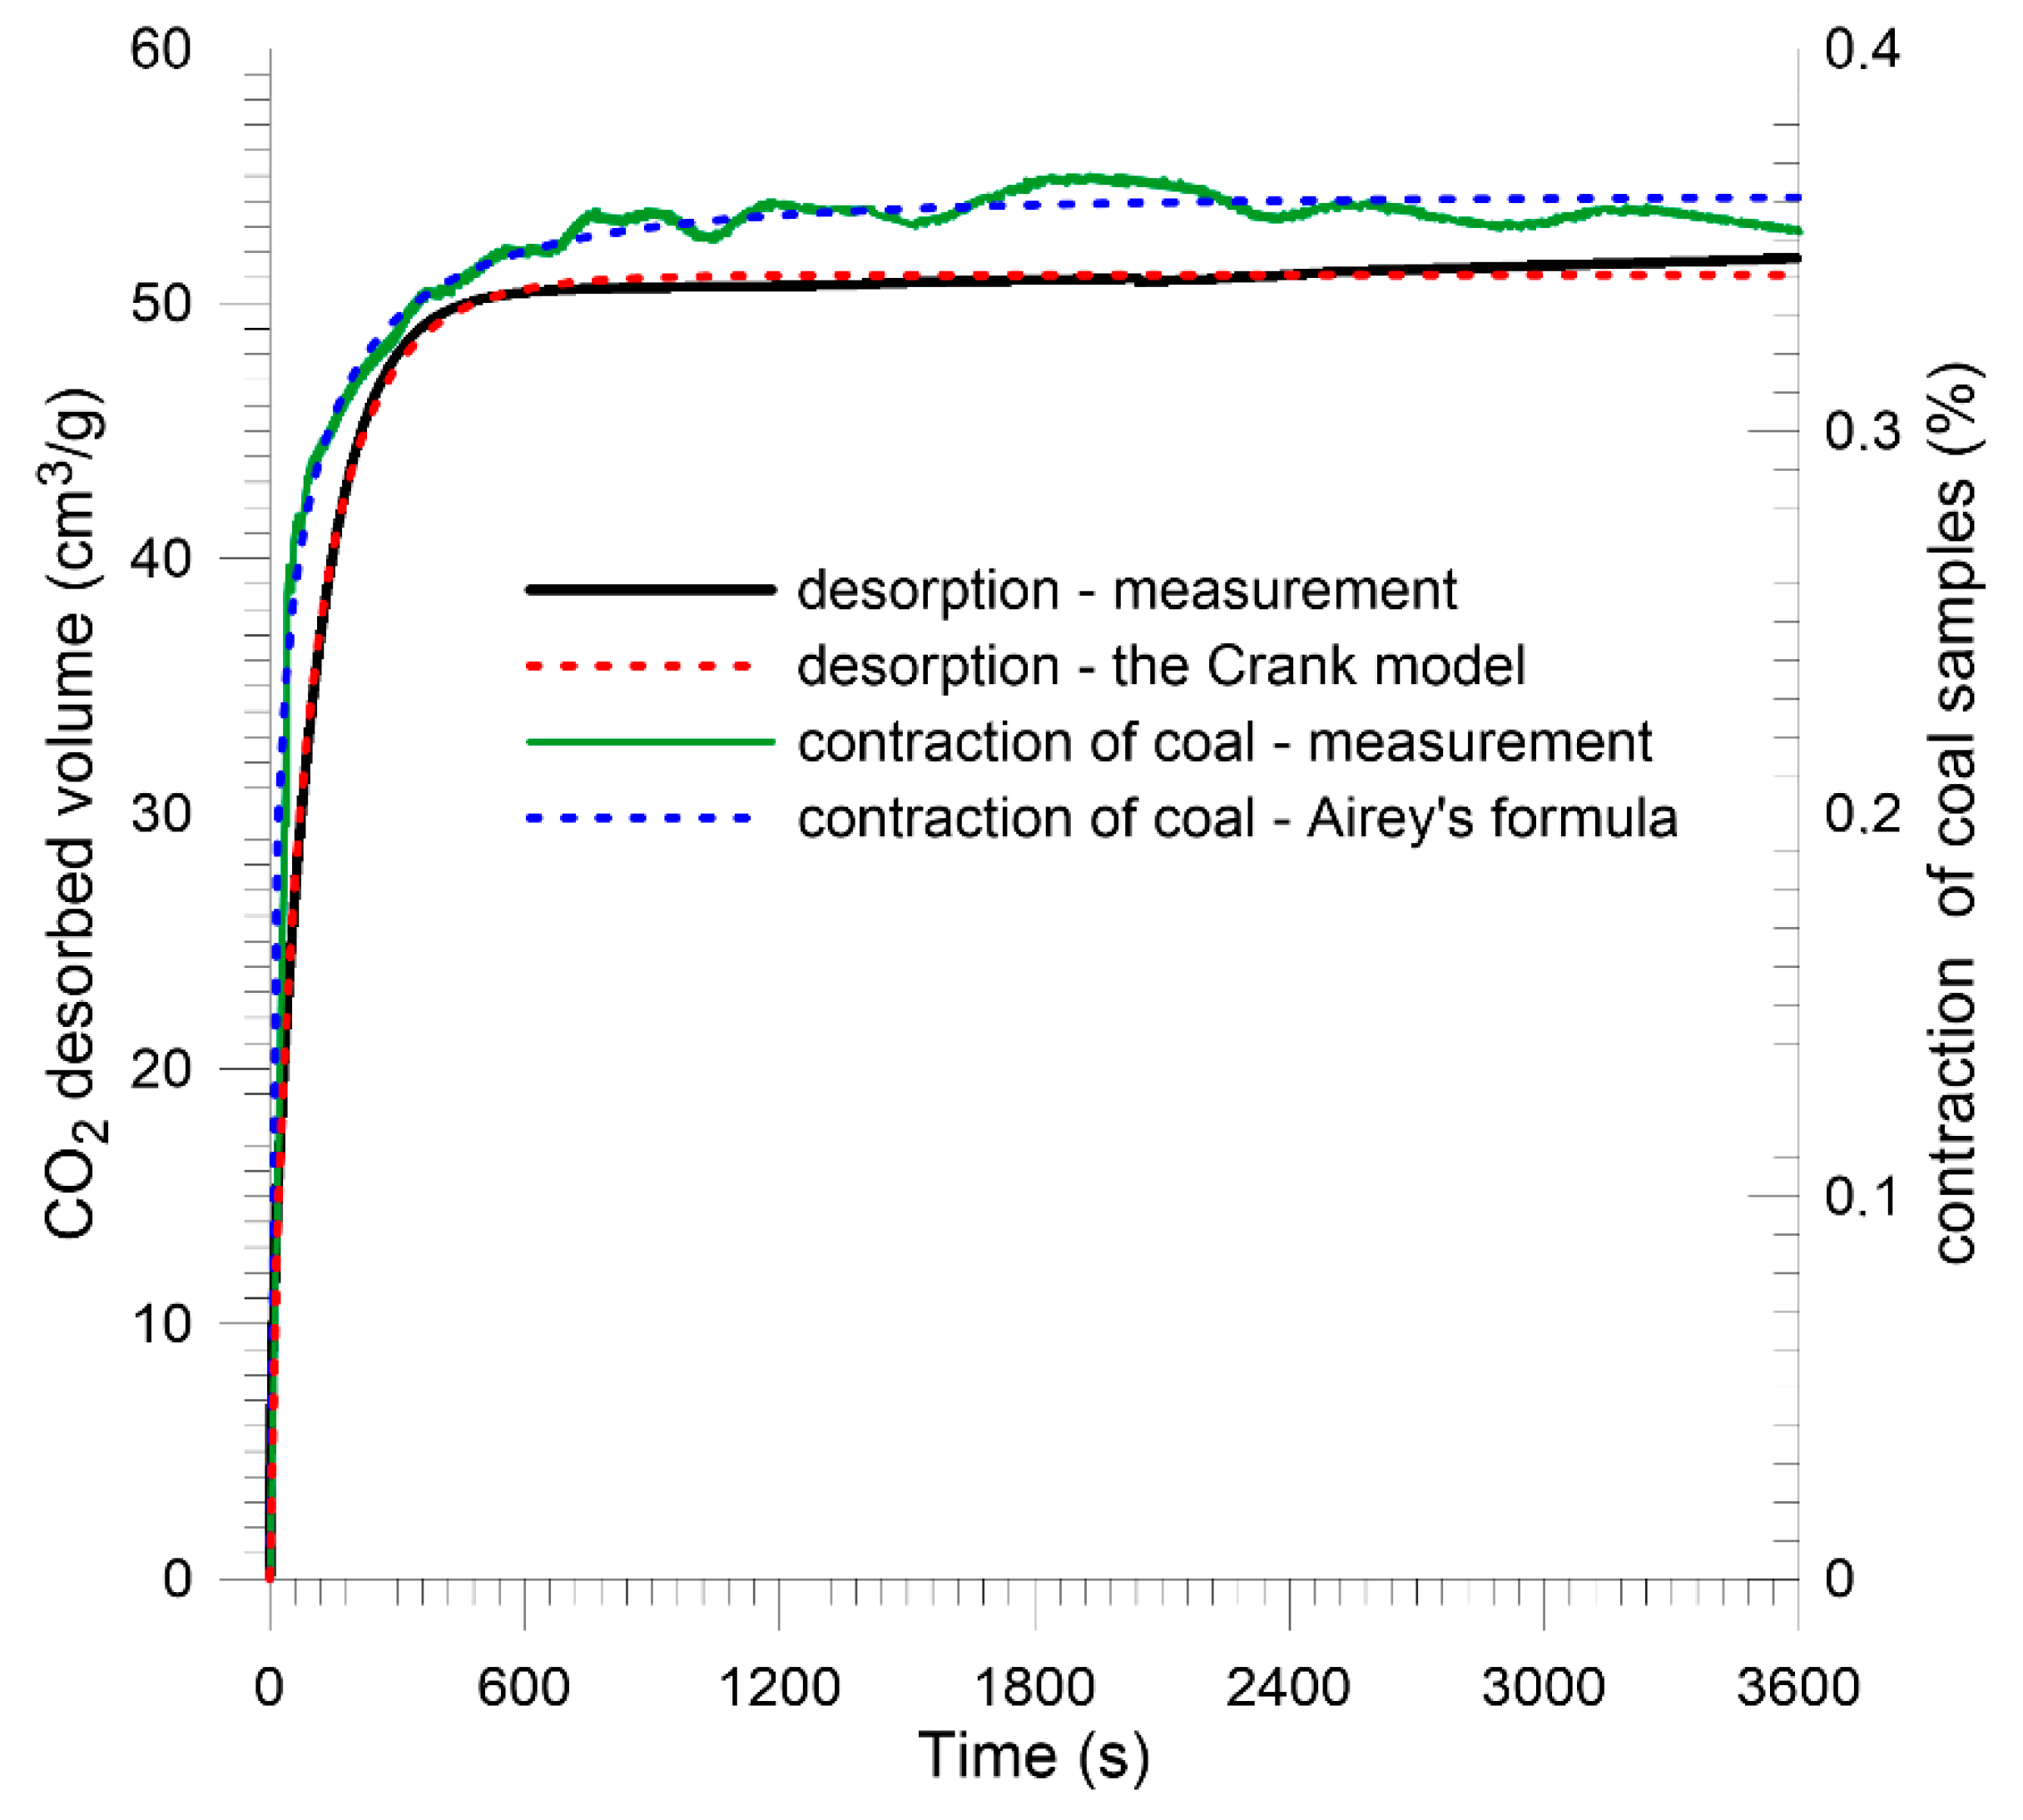
6. Accompanying Coal Shrinkage
7. Conclusions
Author Contributions
Funding
Acknowledgments
Conflicts of Interest
References
- Godyn, K.; Kozusnikova, A. Microhardness of Coal from Near-Fault Zones in Coal Seams Threatened with Gas-Geodynamic Phenomena, Upper Silesian Coal Basin, Poland. Energies 2019, 12, 1756. [Google Scholar] [CrossRef]
- Godyn, K. Structurally altered hard coal in the areas of tectonic disturbances-an initial attempt at classification. Arch. Min. Sci. 2016, 61, 677–694. [Google Scholar]
- IUPAC Physical Chemistry Division Commission on Colloid and Surface Chemistry Subcommittee on Characterization of Porous Solids. Recommendations for The Characterization of Porous Solids (Technical Report). Pure Appl. Chem. 1994, 66, 1739–1758. [Google Scholar] [CrossRef]
- Sing, K.S.W.; Everett, D.H.; Haul, R.A.W.; Moscou, L.; Pierotti, R.A.; Rouquerol, J.; Siemieniewska, T. Reporting Physisorption Data for Gas/Solid Systems with Special Reference to the Determination of Surface Area adn Porosity. Pure Appl. Chem. 1985, 57, 603–619. [Google Scholar] [CrossRef]
- Mahajan, O.P.; Walker, P.L. Porosity of Coal and Coals Products; The Pensylvania State University: Philadelphia, PA, USA, 1978. [Google Scholar]
- Ettinger, J.L. Solubility of Methane Contained in Coal Deposits. Arch. Min. Sci. 1990, 33, 35. [Google Scholar]
- Skiba, M.; Młynarczuk, M. Identification of Macerals of the Inertinite Group Using Neural Classifiers, Based on Selected Textural Features. Arch. Min. Sci. 2018, 63, 827–837. [Google Scholar]
- Wierzbicki, M.; Pajdak, A.; Baran, P.; Zarębska, K. Isosteric heat of sorption of methane on selected hard coals. Przemysl Chemiczny 2019, 98, 625–629. [Google Scholar]
- Pajdak, A. Parameters of N2 and CO2 adsorption onto coal at various temperatures. In Proceedings of the 18th International Multidisciplinary Scientific Geoconference SGEM, Albena, Bulgaria, 30 June–9 July 2018; pp. 633–640. [Google Scholar]
- Kudasik, M.; Skoczylas, N.; Pajdak, A. The repeatability of sorption processes occurring in the coal-methane system during multiple measurement series. Energies 2017, 10, 661. [Google Scholar] [CrossRef]
- Okolo, G.N.; Everson, R.C.; Neomagus, H.W.P.J.; Roberts, M.J.; Sakurovs, R. Comparing the porosity and surface areas of coal as measured by gas adsorption, mercury intrusion and SAXS techniques. Fuel 2015, 141, 293–304. [Google Scholar] [CrossRef]
- Weishauptová, Z.; Sýkorová, I. Dependence of carbon dioxide sorption on the petrographic composition of bituminous coals from the Czech part of the Upper Silesian Basin, Czech Republic. Fuel 2011, 90, 312–323. [Google Scholar] [CrossRef]
- Godyn, K.; Dutka, B. The impact of the degree of coalification on the sorption capacity of coals from the Zofiówka Monocline. Arch. Min. Sci. 2018, 63, 727–746. [Google Scholar]
- Młynarczuk, M.; Skiba, M. The application of artificial intelligence for the identification of the maceral groups and mineral components of coal. Comput. Geosci. 2017, 103, 133–141. [Google Scholar] [CrossRef]
- Billemont, P.; Coasne, B.; De Weireld, G. Adsorption of carbon dioxide, methane, and their mixtures in porous carbons: Effect of surface chemistry, watercontent, and pore disorder. Langmuir 2013, 29, 3328–3338. [Google Scholar] [CrossRef] [PubMed]
- Cai, Y.; Liu, D.; Pan, Z.; Yao, Y.; Li, J.; Qiu, Y. Pore structure and its impact on CH4 adsorption capacity and flow capability of bituminous and subbituminous coals from Northeast China. Fuel 2013, 103, 258–268. [Google Scholar] [CrossRef]
- Pajdak, A.; Kudasik, M.; Skoczylas, N.; Wierzbicki, M.; Teixeira Palla Braga, L. Studies on the competitive sorption of CO2 and CH4 on hard coal. Int. J. Greenh. Gas Control 2019, 90, 102789. [Google Scholar] [CrossRef]
- Pan, Z.J.; Connell, L. A theoretical model for gas adsorption-induced coal swelling. Int. J. Coal Geol. 2007, 69, 243–252. [Google Scholar] [CrossRef]
- Liu, S.M.; Harpalani, S. A new theoretical approach to model sorption-induced coal shrinkage or swelling. AAPG Bull. 2013, 97, 1033–1049. [Google Scholar] [CrossRef]
- Connell, L.; Lu, M.; Pan, Z.J. An analytical coal permeability model for tri-axial strain and stress conditions. Int. J. Coal Geol. 2010, 84, 103–114. [Google Scholar] [CrossRef]
- Durucan, S.; Ahsanb, M.; Shia, J.-Q. Matrix shrinkage and swelling characteristics of European coals. Energy Procedia 2009, 1, 3055–3062. [Google Scholar] [CrossRef]
- Seidle, J.P.; Huitt, L.G. Experimental Measurement of Coal Matrix Shrinkage due to Gas Emission and Implications for Cleat Matrix Increases. SPE Pap. 1995, 181, 30010. [Google Scholar]
- Gawor, M.; Skoczylas, N. Sorption Rate of Carbon Dioxide on Coal. Transp. Porous Media 2014, 101, 269–279. [Google Scholar] [CrossRef]
- Grabowska, K.; Sosnowski, M.; Krzywanski, J.; Sztekler, K.; Kalawa, W.; Żyłka, A.; Nowak, W. The numerical comparison of heat transfer in a coated and fixed bed of an adsorption chiller. J. Therm. Sci. 2018, 27, 421–426. [Google Scholar] [CrossRef]
- Li, X.; Nie, B.; Zhang, R.; Chi, L. Experiment of gas diffusion and its diffusion mechanism in coal. Int. J. Min. Sci. Technol. 2012, 22, 885–889. [Google Scholar]
- Crosdale, P.J.; Beamish, B.B.; Valix, M. Coalbed methane sorption related to coal composition. Int. J. Coal Geol. 1998, 35, 147–158. [Google Scholar] [CrossRef]
- Harpalani, S.; Schraufnagel, R.A. Shrinkage of coal matrix with release of gas and its impact on permeability of coal. Fuel 1990, 69, 551–556. [Google Scholar] [CrossRef]
- King, G.R.; Ertekin, T.M. A Survey of Mathematical Models Related to Methaneproduction from Coal Seams, Part 1. Empirical and Equilibrium Sorption Models. In Proceedings of the 1989 Coalbed Methane Symposium, The University of Alabama, Tuscaloosa, AL, USA, 17–20 April 1989; pp. 125–138. [Google Scholar]
- Sercombea, J.; Vidala, R.; Galléb, C.; Adenota, F. Experimental study of gas diffusion in cement paste. Cem. Concr. Res. 2007, 37, 579–588. [Google Scholar] [CrossRef]
- Staib, G.; Sakurovs, R.; Gray, E.M. Kinetics of coal swelling in gases: Influence of gas pressure, gas type and coal type. Int. J. Coal Geol. 2014, 132, 117–122. [Google Scholar] [CrossRef]
- Day, S.; Fry, R.; Sakurovs, R. Swelling of coal in carbon dioxide, methane and their mixtures. Int. J. Coal Geol. 2012, 93, 40–48. [Google Scholar] [CrossRef]
- Otake, Y.; Suuberg, E.M. Temperature dependence of solvent swelling and diffusion processes in coals. Energy Fuels 1997, 11, 1155–1164. [Google Scholar] [CrossRef]
- Ruckenstein, E.; Vaidyanathan, A.; Youngquist, G. Sorption by solids with bidisperse pore structures. Chem. Eng. Sci. 1971, 26, 1305–1318. [Google Scholar] [CrossRef]
- Berens, A.; Hopfenberg, H. Diffusion and relaxation in glassy polymer powders: 2. Separation of diffusion and relaxation parameters. Polymer 1978, 19, 489–496. [Google Scholar] [CrossRef]
- King, G.; Ertekin, T.; Schwerer, F. Numerical simulation of the transient behavior of coal-seam degasification wells. SPE Form. Eval. 1986, 1, 165–183. [Google Scholar] [CrossRef]
- Busch, A.; Gensterblum, Y.; Krooss, B.; Littke, R. Methane and carbon dioxide adsorption–diffusion experiments on coal: Upscaling and modeling. Int. J. Coal Geol. 2004, 60, 151–168. [Google Scholar] [CrossRef]
- Staib, G.; Sakurovs, R.; Gray, E. Dispersive diffusion of gases in coals. Part I: Model development. Fuel 2015, 143, 612–619. [Google Scholar] [CrossRef]
- Skoczylas, N.; Pajdak, A.; Kozieł, K.; Braga, L. Methane emission during gas and rock outburst on the basis of the unipore model. Energies 2019, 12, 1999. [Google Scholar]
- Crank, J. The Mathematics of Diffusion; Clarendon Press: Oxford, UK, 1975. [Google Scholar]
- Skoczylas, N.; Kudasik, M.; Topolnicki, J.; Oleszko, K.; Młynarczuk, M. Model studies on saturation of a coal sorbent with gas taking into account the geometry of spatial grains. Przemysl Chemiczny 2018, 97, 272–276. [Google Scholar]
- Horvath, G.; Kawazoe, K. Method for the calculation of the effective pore size distribution in molecular sieve carbon. J. Chem. Eng. 1983, 16, 470–475. [Google Scholar] [CrossRef]
- Jagiello, J.; Thommes, M. Comparison of DFT characterization methods based on N2, Ar, CO2, and H2 adsorption applied to carbons with various pore size distributions. Carbon 2004, 42, 1227–1232. [Google Scholar] [CrossRef]
- Dubinin, M.M. Adsorpcja i Porowatość; Wojskowa Akademia Techniczna: Warsaw, Poland, 1975. [Google Scholar]
- Brunauer, S. Physical Adsorption; Princeton University Press: Princeton, NJ, USA, 1945. [Google Scholar]
- Barrett, E.P.; Joyner, L.G.; Halenda, P.P. The determination of pore volume and area distribution in porous substances. I. Computations from nitrogen isotherms. J. Am. Chem. Soc. 1951, 73, 373–380. [Google Scholar] [CrossRef]
- Pillalamarry, M.; Harpalani, S.; Liu, S. Gas diffusion behavior of coal and its impact on production from coalbed methane reservoirs. Int. J. Coal Geol. 2011, 86, 342–348. [Google Scholar] [CrossRef]
- International Classification of In-Seam Coals; UNECE: Geneva, Switzerland; UN: New York, NY, USA, 1998; p. 41.
- Cui, X.; Bustin, R.M.; Dipple, G. Selective transport of CO2, CH4 and N2 in coals: Insights from modeling of experimental gas adsorption data. Fuel 2003, 83, 293–303. [Google Scholar] [CrossRef]
- Airey, E.M. Gas emission from broken coal. An experimental and theoretical investigation. Int. J. Rock Mech. Min. Sci. 1968, 5, 475. [Google Scholar] [CrossRef]
- Skoczylas, N.; Wierzbicki, M.; Murzyn, T. The influence of temperature of the coal-methane system on sorption capacity of coal, taking into account the kinetics of sorption and diffusion processes. Prace Instytutu Mechaniki Górotworu PAN 2013, 15, 75–83. [Google Scholar]


| Coal | R0 | Vitrinite | Inertinite | Liptinite | Vdaf | Ad | Wt | ρsk |
|---|---|---|---|---|---|---|---|---|
| (%) | (%) | (%) | (%) | (%) | (%) | (%) | (g/cm3) | |
| Sobieski mine | 0.71 | 73.7 | 16.8 | 9.5 | 32.35 | 11.54 | 5.35 | 1.44 |
| Budryk mine | 0.85 | 62.6 | 27.0 | 10.4 | 30.98 | 8.40 | 1.22 | 1.37 |
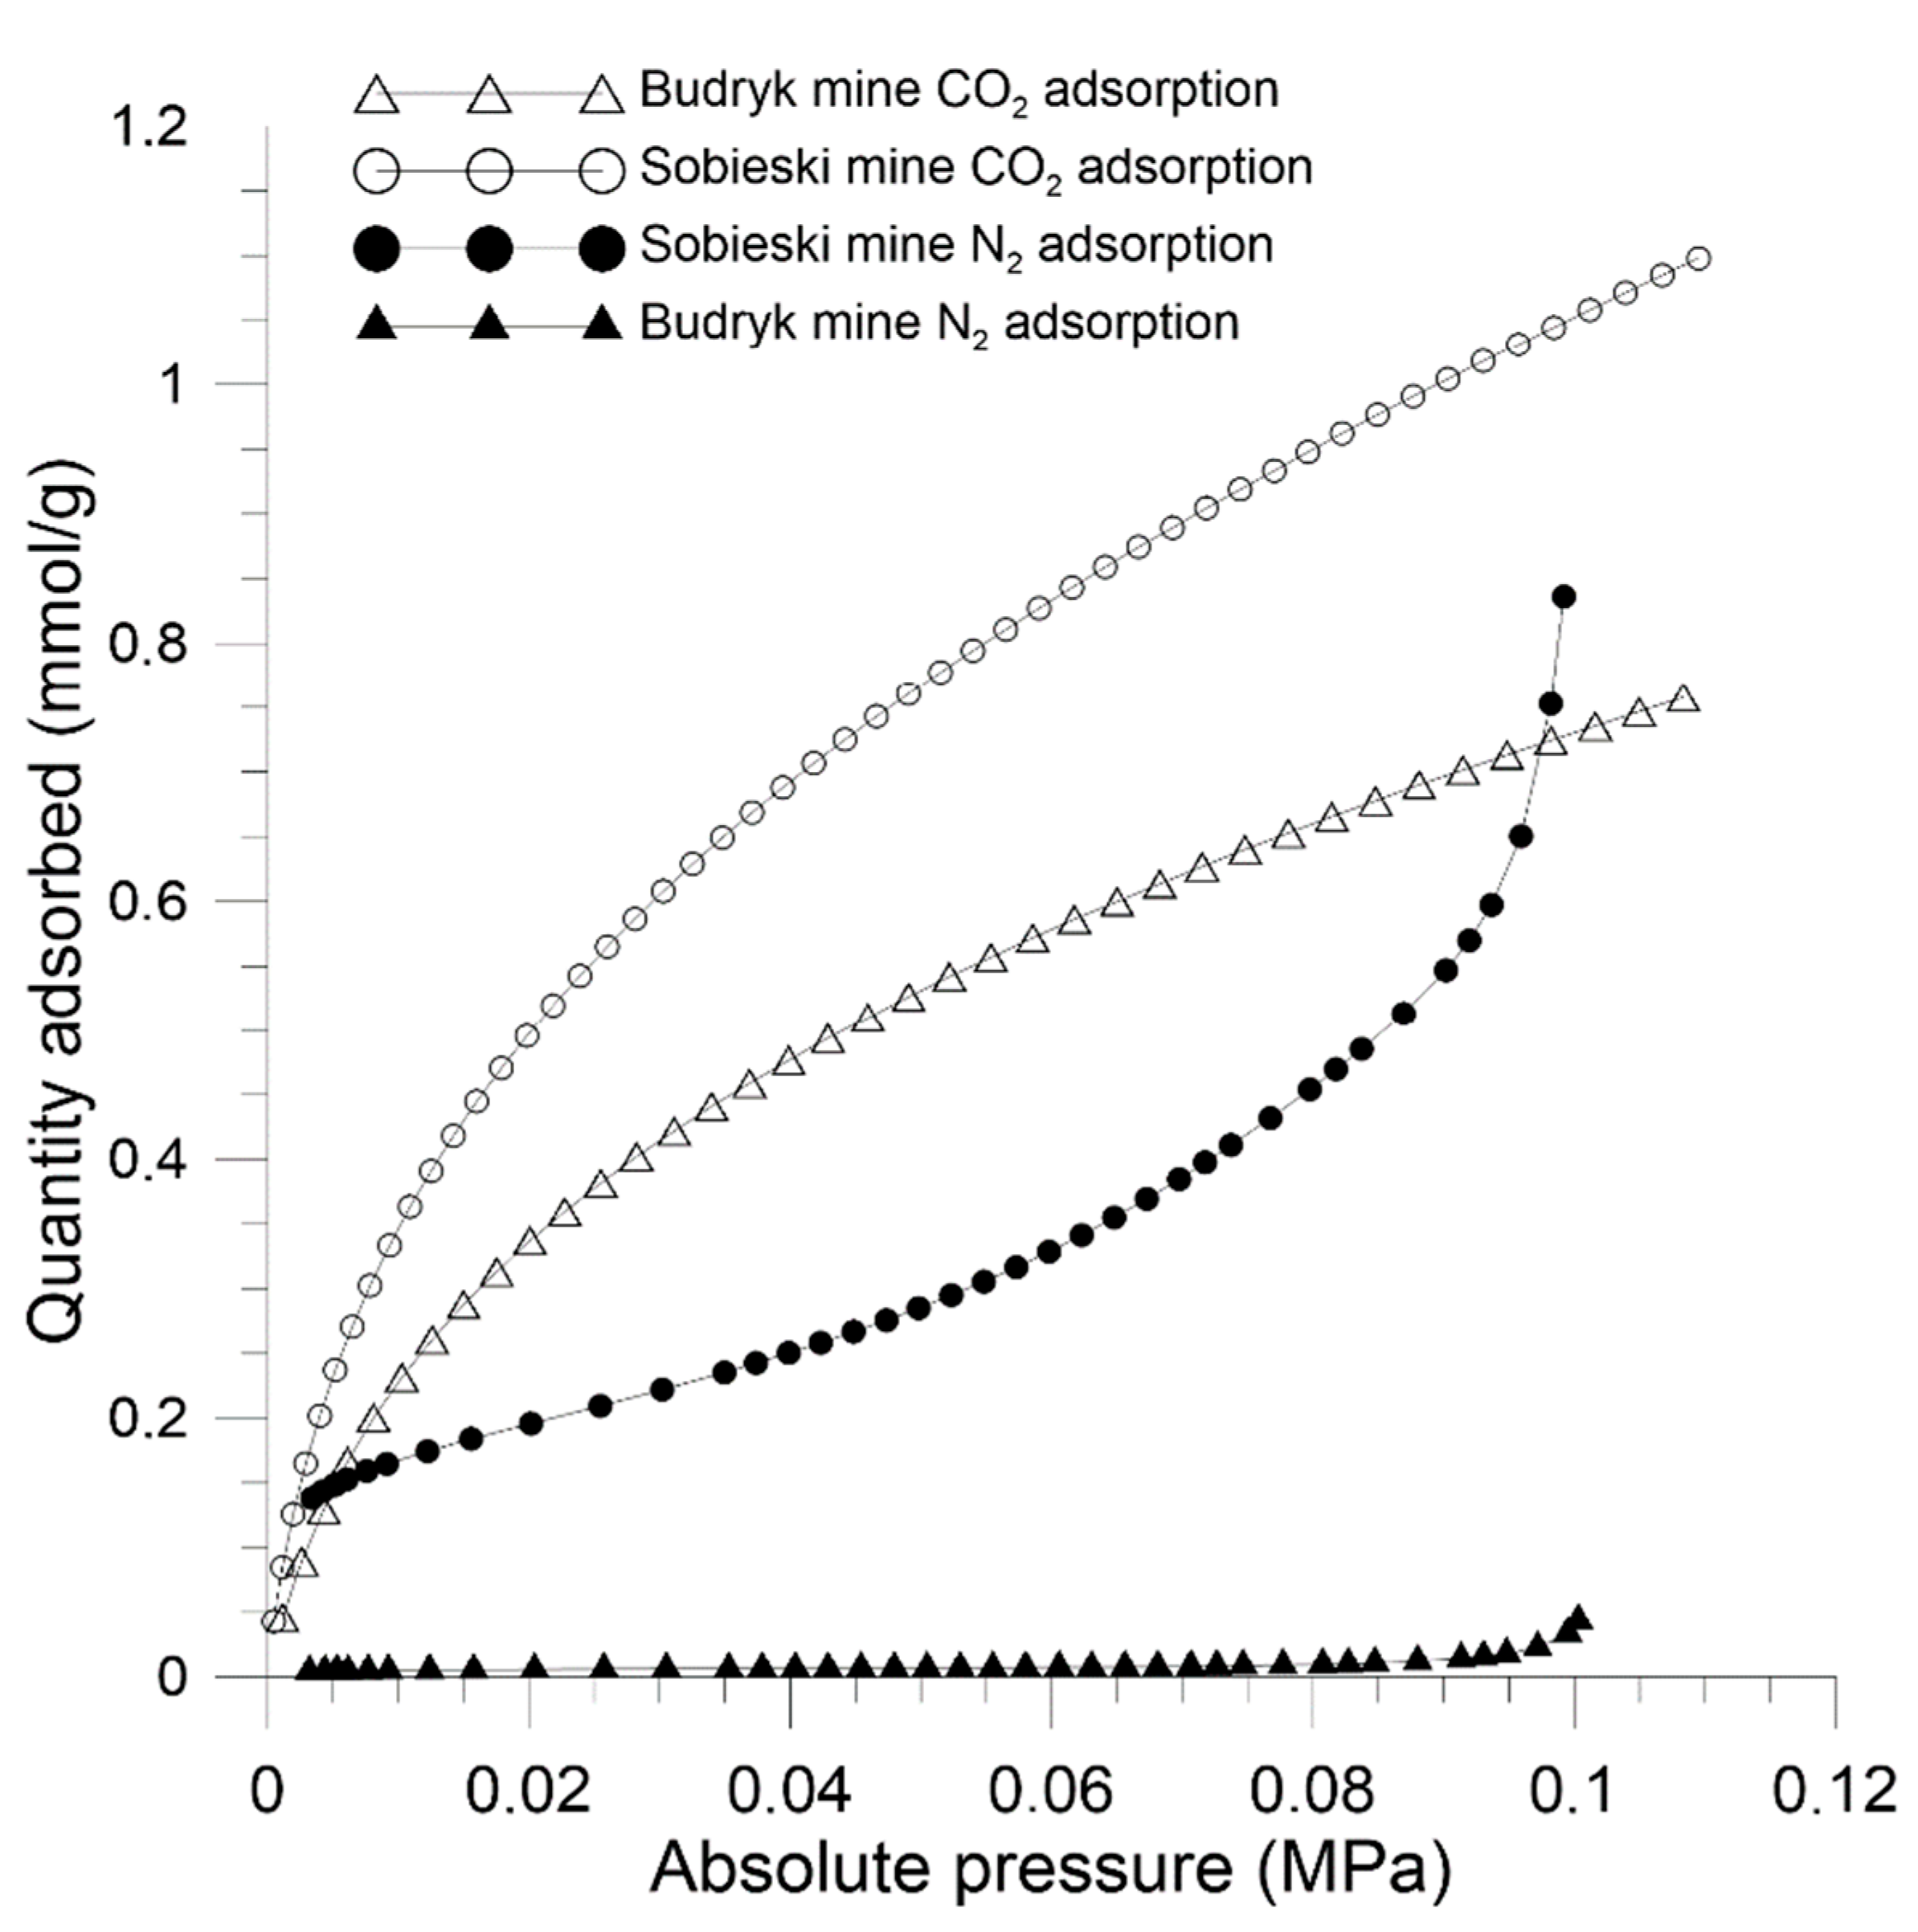
| CO2 Adsorption, 273K | Sobieski Mine | Budryk Mine |
|---|---|---|
| Langmuir total sorption capacity (mmol/g) | 1.554 | 1.117 |
| Langmuir specific surface area (m2/g) | 159.09 | 114.38 |
| HK maximum pore volume (cm³/g) | 0.045 | 0.031 |
| HK average pore width (nm) | 0.665 | 0.668 |
| DFT volume in pores < 0.43 nm, * 10–3 (cm3/g) | 0.96 | 1.80 |
| DFT total pore volume ≤ 1.08 nm, * 10–3 (cm3/g) | 32.77 | 24.71 |
| DFT pore area > 1.08 nm, (m²/g) | 92.28 | 61.51 |
| DFT total pore area ≥ 0.43 nm, (m²/g) | 197.70 | 130.21 |
| DA characterization of adsorption energy, (kJ/mol) | 20.70 | 20.11 |
| DA volume of micropores (cm³/g) | 0.09 | 0.06 |
| DA surface area of micropores (m2/g) | 224.10 | 149.28 |
| N2 Adsorption, 77K | ||
| Sorption capacity (mmol/g) | 0.836 | 0.044 |
| BET specific surface area (m²/g) | 15.42 | 0.43 |
| BJH total pore volume (cm³/g) | 0.027 | 0.001 |
| BJH specific surface area (m²/g) | 10.79 | 0.20 |
| BJH average pore diameter (nm) | 9.85 | 27.56 |
| Coal | Sorption Capacities | Parameters of the Langmuir Isotherm | Effective Diffusion Coefficient | |||
|---|---|---|---|---|---|---|
| a(0.1) | a(0.5) | a(1.5) | A | B | De | |
| (cm3/g) | (cm3/g) | (cm3/g) | (cm3/g) | (1/MPa) | (cm2/s) | |
| Sobieski mine | 11.78 | 39.48 | 61.48 | 86.70 | 1.65 | |
| Budryk mine | 6.24 | 14.18 | 20.89 | 25.46 | 2.76 | |
| Coal | Sorption Capacity | Effective Diffusion Coefficient | ||||||||
|---|---|---|---|---|---|---|---|---|---|---|
| Spherical Samples | Plane Sheet Samples | Percentage Difference | Spherical Samples | Plane Sheet Samples | Percentage Difference | Spherical Samples | Plane Sheet Samples | |||
| a(0.1 MPa), (cm3/g) | (%) | De, (cm2/s) | (%) | RSoS | R2 | RSoS | R2 | |||
| Sobieski mine | 11.55 | 11.78 | 1.95 | −11.68 | 183 | 0.982 | 125 | 0.989 | ||
| Budryk mine | 6.24 | 6.24 | 0 | −10.18 | 167 | 0.088 | 97 | 0.995 | ||
© 2019 by the authors. Licensee MDPI, Basel, Switzerland. This article is an open access article distributed under the terms and conditions of the Creative Commons Attribution (CC BY) license (http://creativecommons.org/licenses/by/4.0/).
Share and Cite
Skoczylas, N.; Pajdak, A.; Młynarczuk, M. CO2 Adsorption–Desorption Kinetics from the Plane Sheet of Hard Coal and Associated Shrinkage of the Material. Energies 2019, 12, 4013. https://doi.org/10.3390/en12204013
Skoczylas N, Pajdak A, Młynarczuk M. CO2 Adsorption–Desorption Kinetics from the Plane Sheet of Hard Coal and Associated Shrinkage of the Material. Energies. 2019; 12(20):4013. https://doi.org/10.3390/en12204013
Chicago/Turabian StyleSkoczylas, Norbert, Anna Pajdak, and Mariusz Młynarczuk. 2019. "CO2 Adsorption–Desorption Kinetics from the Plane Sheet of Hard Coal and Associated Shrinkage of the Material" Energies 12, no. 20: 4013. https://doi.org/10.3390/en12204013
APA StyleSkoczylas, N., Pajdak, A., & Młynarczuk, M. (2019). CO2 Adsorption–Desorption Kinetics from the Plane Sheet of Hard Coal and Associated Shrinkage of the Material. Energies, 12(20), 4013. https://doi.org/10.3390/en12204013