1. Introduction
At present, a large amount of natural gas hydrate (NGH) resources have been explored all over the world. The carbon content of NGH is twice that of other fossil energy, making NGH an important potential energy source [
1,
2]. NGH is a kind of white crystalline solid in porous media that usually forms and remains stable under the favorable conditions of low temperature and high pressure, that is, 2–4 °C and about 20 MPa [
3]. When the temperature increases or the pressure decreases to a certain extent, the hydrate will decompose [
4]. In the process of pressure drop, NGH in sediments begins to decompose rapidly. The gas production rate of NGH increases with the decrease in decomposition pressure. Previous tests have shown that gas production rate also increases with the increase of test temperature [
5]. Because of the metastable behavior of NGH, it is still a challenge to describe the in situ occurrence of NGH via core samples [
6]. To enable modeling of gas hydrate-bearing sediment layers as a natural gas reservoir, and to realize the large-scale exploitation, it is necessary to fully understand its geological structure characteristics under the condition of gas hydrate bearing sediments in situ [
7]. At present, because there is no feasible solution to detect and analyze the gas hydrate in the seabed under the in situ conditions, it is still necessary to investigate the gas hydrate morphology and formation mechanism via x-ray micro-computed tomography in 3D [
8]. In addition, it is still necessary to collect long-column high-pressure gas hydrate cores from the seabed, cut them into small sections, and transfer them under the conditions in which the pressure and temperature are maintained, thus obtaining the analyses of various physical and chemical characteristics in the laboratory [
9].
The NGH exploration mainly contains subsea pressure and temperature core sampling, shipboard core sample pressure-retaining and transferring, and laboratory analysis of core samples. So far, the pressure and temperature sampling technology of core samples has been developed well. After the core samples are drilled from seabed and transferred to shipboard, the pressure-retaining and transfer system is used to perform some subsequent processing on the core sample. There are two mainstream devices that can realize these functions. The pressure core analysis and transfer system (PCATS), developed by Geotek Ltd. (Daventry, UK) in the HYACINTH [
10] program, can realize the following operations at in situ pressure: 1) nondestructively testing the core, 2) cutting the core into sections, 3) transferring the core sections into and out of storage chambers, 4) controlling the core motion for third-party analysis. The pressure core characterization tools (PCCTs) developed by the Georgia Institute of Technology, based on original sample detection system instrument pressure test chamber (IPTC), have more test chambers, such as a direct shear chamber (DSC), bio-reactor chambers (BIO), and a controlled depressurization chamber (CDC), having similar functions to PCAT [
11]. Both PCATS and PCCTs can maintain the NGH core sample at low temperature and in situ pressure; however, these devices depend on a rather passive method that must set the ambient temperature of the operation room to affect the temperature of samples. The method described above not only fails to react quickly and effectively to temperature fluctuations, but also keeps the operating room at a temperature close to 4 °C, making the environment too adverse for the operator to work with for long hours. In addition, there are few papers focusing on temperature control issues in core samples during transfer and analysis.
The first-generation core sample pressure-retaining and transfer device developed by Zhejiang University in 2016 can realize the functions as PCATS [
12]. Based on previous development, this paper considers the PMTCD, a part of new generation NGH core sample pressure-retaining and transfer devices, and analyzes the causes of temperature increase during the pressure maintenance of the sample. By designing a chiller and a thermoelectrical refrigeration device, the seawater flowing into the sample cylinder is cooled separately before and after being pressurized, and the temperature control effect is explored, effectively preventing the decomposition and deterioration of the NGH sample due to temperature increase during the transfer process.
2. Design and Working Process of Pressure Maintenance and Temperature Control Device in the Pressure-Retaining and Transfer System
When the NGH core sample is brought on board the ship, the core drilling tool is docked at the right end of the system, and the manipulator in the sample cylinder pulls and rotates the core sample through the leftmost motors. During the process of pulling back into the sample cylinder, the acoustic wave and CT scanning device completes a preliminary analysis of the core, and the cutting device divides the core sample into sections. Finally, the segmented core sample is pushed into the sub-sample cylinder (not shown in
Figure 1) connected to the right side of the system and transported to the laboratory for further analysis. In addition, all these process in situ conditions realized by PMTCD.
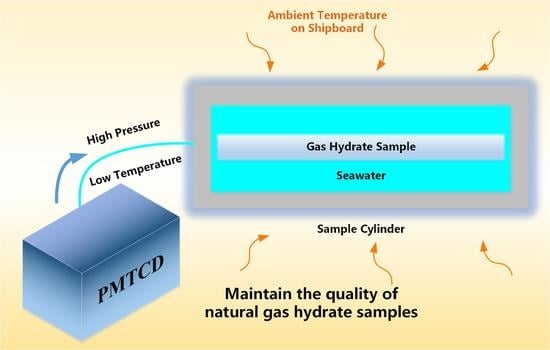
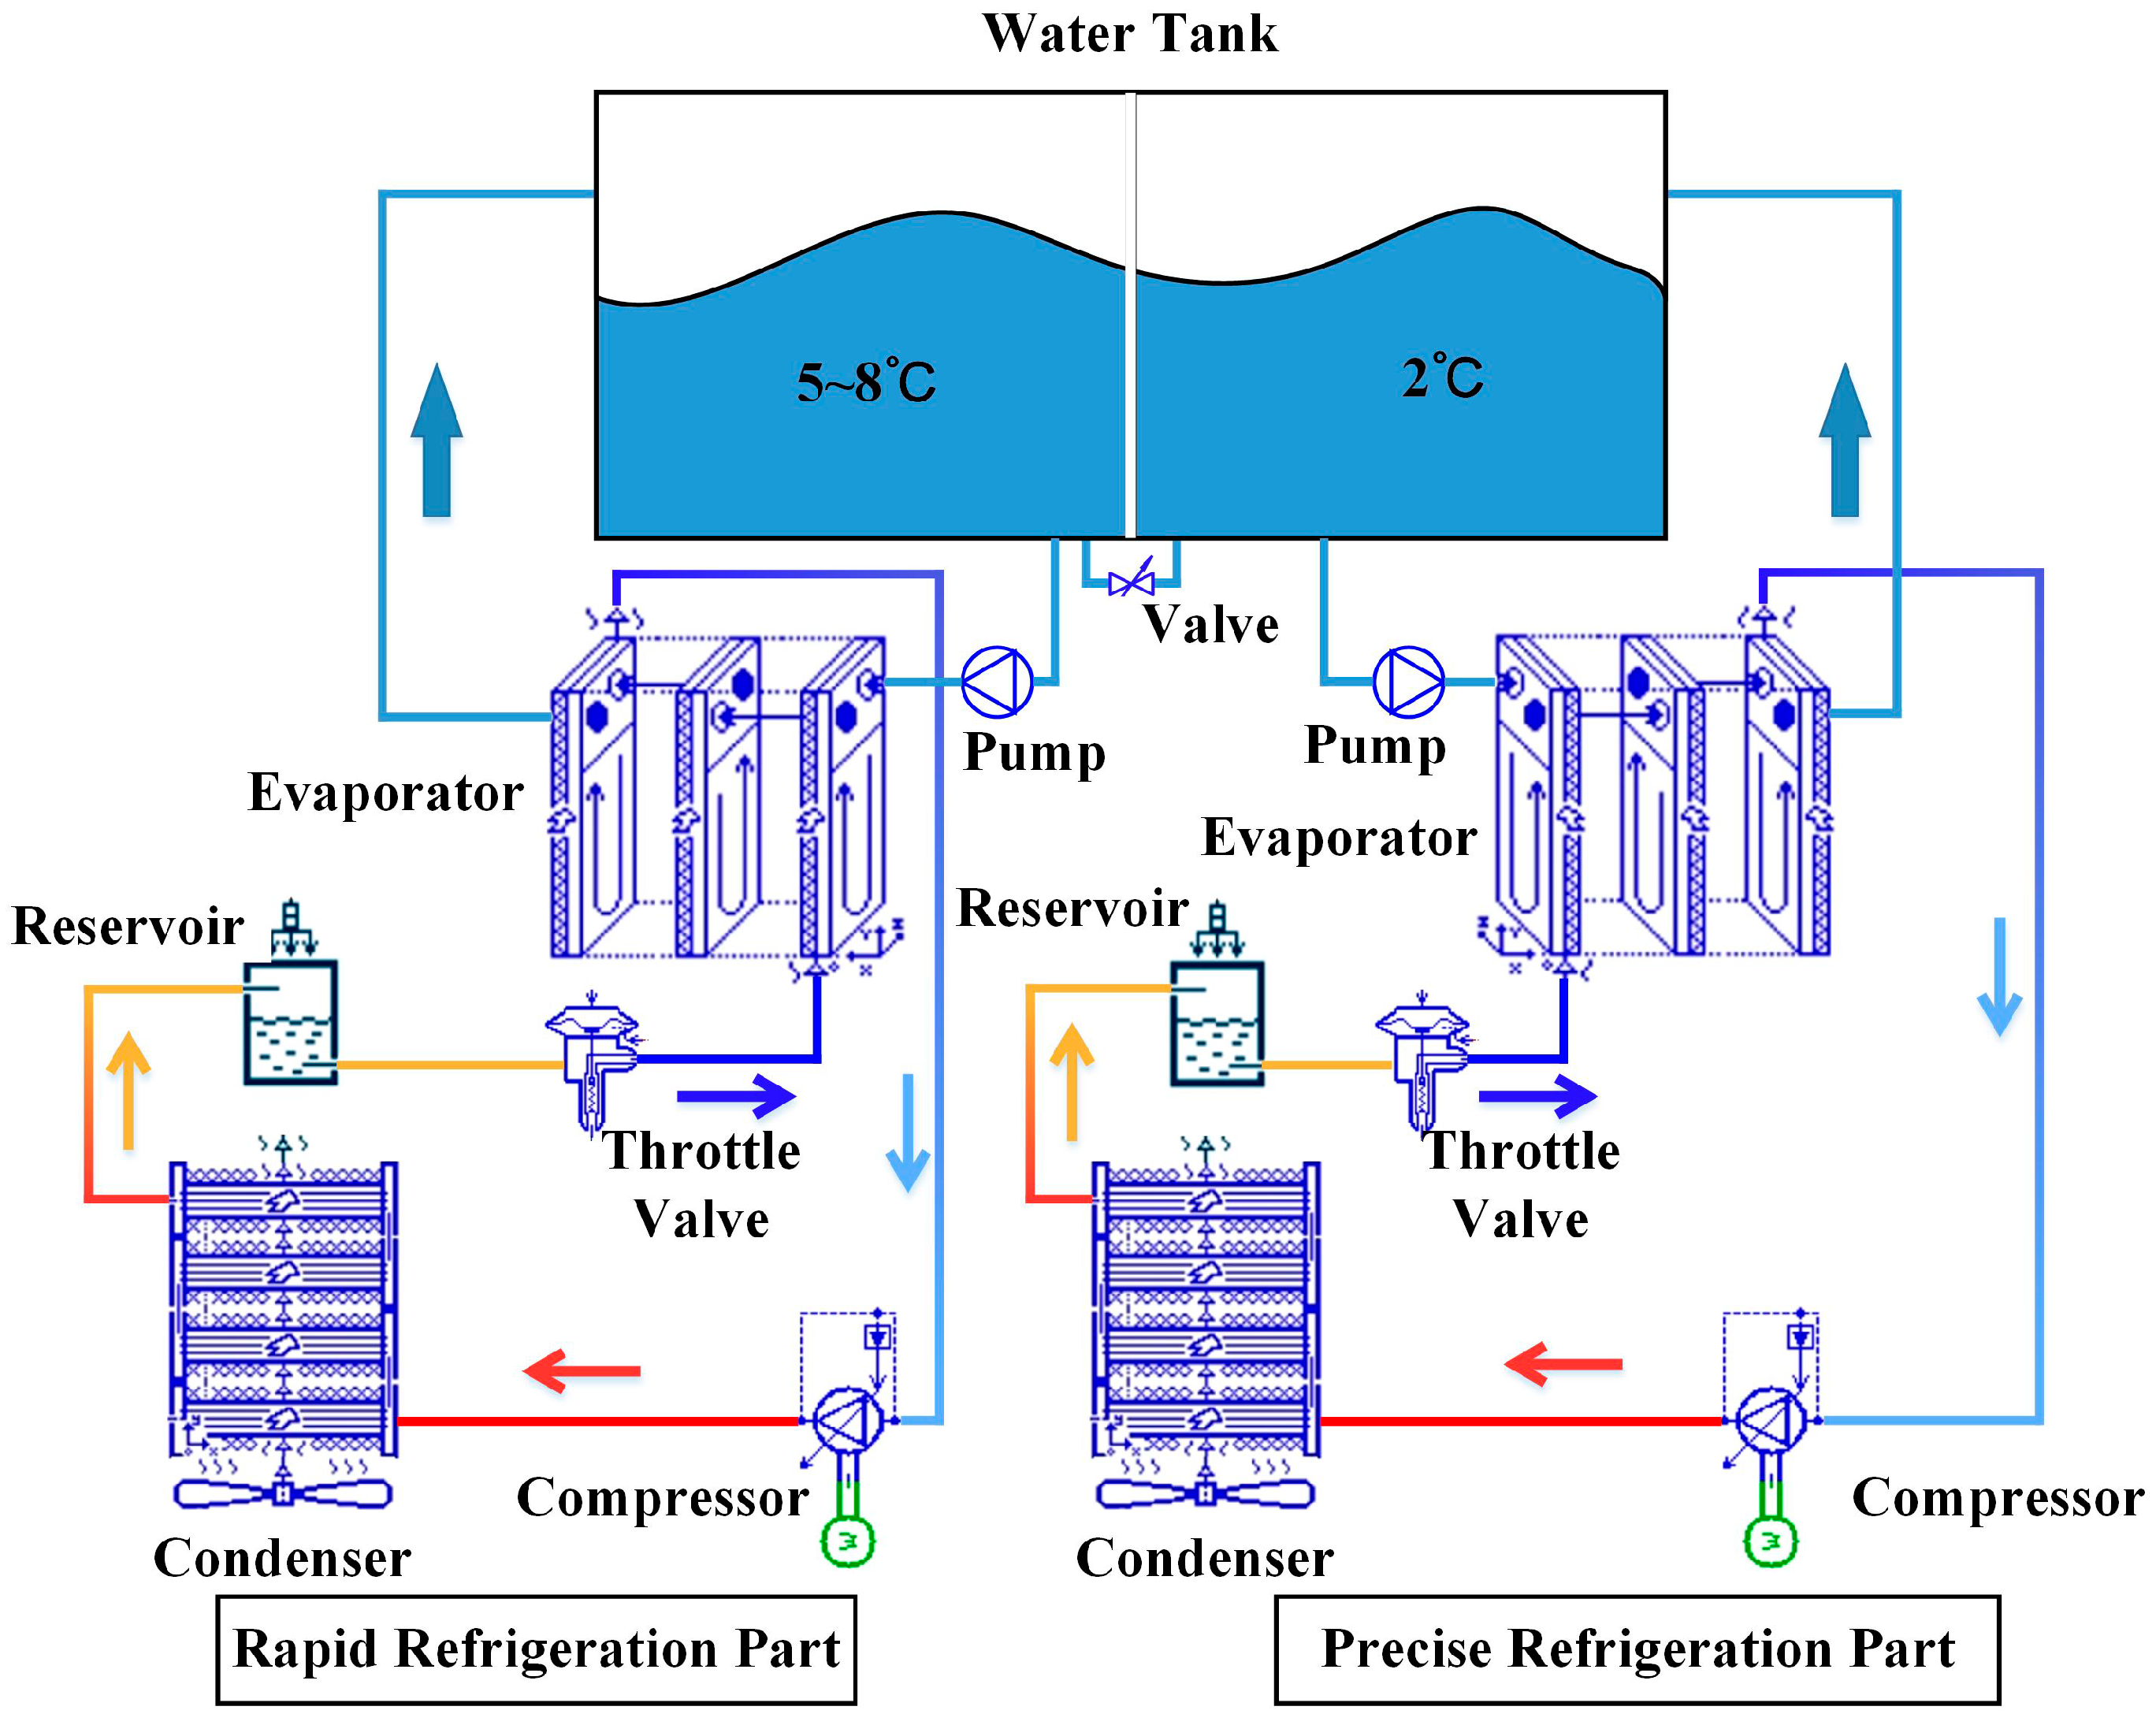
The PMTCD is designed to fill the sample cylinder with low-temperature seawater of 2–4 °C and maintain the pressure inside the sample cylinder at 25 MPa. The device adopts two-stage chillers to refrigerate the seawater to 2 °C [
13]. The plunger pump draws low-temperature seawater from the cold-water tank, then injects seawater into the sample cylinder and other parts of the pressure-retaining and transfer system through hydraulic lines, such as drilling tools and secondary transfer sample cylinders. The temperature of the seawater increases due to heat exchange between the pipeline and the environment. Before the seawater enters the cavity from the hydraulic line, the thermoelectrical refrigeration device compensates for the temperature rise caused by the plunger pump and heat exchange. Then, strict control of seawater pressure and temperature is finally achieved.
Figure 2 shows the PMTCD.
The refrigeration time is shortened to ensure the working efficiency of the chiller. The chiller is divided into two parts. The first part is the rapid refrigerating part, which cools the seawater from the external ambient temperature of about 20–30 °C to 5–8 °C, and the second part, which cools the initial cold water of 5–8 °C to 2 °C, is the precise refrigeration part. Correspondingly, the water tank is separated into two parts.
The thermoelectrical refrigeration device directly contacts and exchanges heat with the high-pressure hydraulic pipe by the semiconductor refrigeration plates to realize the cooling of the seawater in the pipeline, and the cooling effect is adjusted by selecting the power of the semiconductor and the contact area with the hydraulic pipe. A simple PID (Propertion Integral Differential) control schematic for PMTCD is shown in
Figure 3.
3. Principle and Analysis of Temperature Increase of Seawater Hydraulic Pressure Maintenance System
The seawater hydraulic system for the natural gas hydrate pressure-retaining and transfer device includes hydraulic components such as a plunger pump, ball valves, needle valves, tees, crosses, elbows, as well as hydraulic pipes of different diameters. When the system is in operation, the plunger pump pressurizes the seawater, and the high-pressure seawater passes through the hydraulic valve and hydraulic pipeline. The plunger pump, hydraulic valve and pipeline will generate heat, so this section mainly analyzes the influence of these hydraulic parts on the temperature of the whole pressure-retaining and transfer system.
3.1. Thermodynamic Model of the Plunger Pump and Its Heat Analysis
During operation, the plunger pump will draw seawater into the pump body from the water tank. Under the action of the plunger, seawater pressure will increase, thus generating heat through pressurization. The high-pressure seawater flows out from the liquid-distributing plate into the hydraulic line and finally enters the sample cylinder. The inside of the pump casing performs convection exchange with seawater (
Q1), natural convection heat exchange (
Q2), and radiation heat exchange (
Q3) are carried out outside the pump casing with the environment. The various frictions in the rotating part of the pump cause mechanical losses, and the heat generated by the mechanical loss (
Q4) is directly transmitted to the rotating part of the pump. Since the rotating part of the pump is not only in contact with the casing but also surrounded by seawater, the rotating part performs convection heat exchange with seawater(
Q5) and conduction heat exchange with the casing(
Q6). The heat exchange process of plunger pump is shown in
Figure 4.
Since the pressure-retaining and transfer device is in the operating chamber at a constant temperature of 10 °C under actual use conditions, the change of the ambient temperature is excluded when analyzing the thermodynamic model of the plunger pump. The heat exchange of radiation is very small, not belonging to the same order of magnitude as other heat, and the contact area of the pump casing and the rotating part A4 is small, so Q3 and Q6 can be ignored in the calculation. At the same time, factors such as pulsation and cavitation are not considered for model simplification. When the cooled seawater in the water tank passing through the plunger pump, the inlet temperature is Ti and the outlet temperature is To, the rotating part temperature is Tr, the casing temperature is Tc and the ambient temperature is Th.
According to the heat exchange process diagram shown in
Figure 4, the heat exchange of each part of the plunger pump will be gotten.
The heat exchange form between the seawater and the pump casing part is convection heat exchange, the expression is:
where
k1 is the forced convection heat exchange coefficient,
A1 is the heat exchange area of the seawater inside the casing,
Tc is the temperature of the pump casing portion, and
Ti is the initial temperature at which seawater enters the plunger pump.
The convection heat exchange and radiation heat exchange between the pump casing and the environment can be expressed as:
where
k2 is the natural convection heat exchange coefficient,
A2 is the heat exchange area between the outer casing and the environment,
Th is the ambient temperature.
Mechanical heat generation is caused by loss of mechanical energy, which is the resistance torque generated by various resistances on the drive shaft of the pump consumes a part of the input power. The mechanical loss power can be expressed as:
where
k3 is the transfer coefficient of work and heat,
p0 is the pump outlet pressure,
qo is the pump outlet flow, and
ηm is the pump’s mechanical efficiency.
The forced convection heat exchange between the rotating part of the pump and the seawater, and the heat conduction between the rotating part and the case can be expressed as:
where
k4 is the thermal conductivity,
A3 is the heat exchange area between the rotating part and seawater,
A4 is the contact area between the rotating part and the casing, and
Tr is the temperature of the rotating part [
14].
When the pump casing temperature is stable, water and casing heat exchange
Q1 and casing heat exchange with the environment
Q2 should be balanced,
Q1 =
Q2. Similarly, the mechanical heat generated by the pump will be completely transferred to the water in the pump through the rotating part, that is,
Q5 =
Q4. Therefore, the total energy obtained by the seawater passing through the plunger pump and the temperature to which the seawater rises will be expressed as:
To analyze the heat generation of the plunger pump in the PMTCD, the specific parameters of the design are substituted into the above formula for calculation. By substituting specific parameters into Equations (1) and (2), we can obtain Q2 = Q1 = 175.9 J, Tc = 27.94 °C. The mechanical efficiency of the pump ηm = 0.9, p0 = 2.5 × 10⁶ Pa, q0 = 2.5 × 10⁻⁴ m3/s can be substituted into Q4 = 694.4 J. The heat of Q2 and Q4 will increase the temperature of the water passing through the pump head by 0.82 °C.
3.2. Thermodynamic Model and Heat Analysis of Hydraulic Valves and Pipelines
In the seawater hydraulic pressure retention system, components such as needle valves, ball valves and check valves can be regarded as throttling devices for the system [
15]. Turbulence occurs in the throttling components due to both the friction between water and pipe wall and the change of the diameter, so partial pressure loss will occur. The energy lost linked to the pressure drop of water will be converted into heat generated by friction and enter the fluid flow as well as dissipate in the environment through the outer wall of throttling device. According to the law of energy conservation, the energy lost caused by partial pressure drop is:
where Δ
pζ is a partial pressure drop, and
qT is the flow rate of the throttling device [
16].
The forced convection heat exchange between the water and the casing in the throttling components can be expressed as:
where
kT1 is the forced convection heat exchange coefficient of the throttling components,
AT1 is the throttling components and the water heat exchange area,
TTc is the casing temperature of the throttling components, and
ToT is the outlet temperature of throttling components.
The convection heat exchange between the throttling components casing and the environment are:
where
kT2 is the natural convection heat exchange coefficient,
AT2 is the throttling components and the ambient heat exchange area, and
Te is the ambient temperature [
17].
The heat obtained by seawater after flowing through the throttling components is:
Then the relational expression for the change in energy after the seawater passes through the throttling components is:
where
QwT is the energy obtained by seawater after passing through the throttling components, and
TiT is the inlet temperature of throttling components, whose value can be obtained by measurement or calculated by the previous step.
The hydraulic pipeline has the same partial pressure loss as the throttling components, and there is energy loss due to partial pressure drop at the inlet, outlet, elbow and tee is
QPζ. The heat exchange process of hydraulic pipe is shown in
Figure 5.
In the analysis of the thermodynamic model of hydraulic pipeline, in addition to the partial pressure loss of components such as inlets, outlets, elbows and T-junction, more importantly, the energy loss caused by linear pressure loss along the path of pipeline is:
where Δ
pPλ is the linear pressure loss of longer pipeline,
vP is the volume of the hydraulic hard pipe, and
t is the time that seawater flows through the pipeline [
18].
The entire hydraulic pipe also has convection heat exchange between the water and the pipe wall, which is expressed as QP1, and natural convection heat exchange between the pipe wall and the environment, which is expressed as QP2. Considering that their expressions and the meaning of each parameter are similar to throttling components, they are not expanded here.
According to the above expressions, the formula for calculating the energy change after the seawater passes through the hydraulic pipe is:
where
QwP is the energy obtained by the seawater after passing through the hydraulic pipe, and
TiP is the inlet temperature of hydraulic pipe, whose value can be obtained through measurement or calculation of the previous steps [
19].
In the analysis of heat generation of hydraulic valves and hydraulic pipelines, since the heat transfer forms are almost the same, which are divided into pressure loss heat and convection exchange heat, Equations (11) and (13) can be combined for calculation.
After substituting the ambient temperature of 28 °C, the hydraulic pipe length of 3.5 m and the type of hydraulic components, the pressure loss energy was calculated to be QT + QPζ + QPλ = 26.2 J. When convection heat exchange reaches an equilibrium state, QT1 + QP1 = QT2 + QP2, and TPw = TTw = 2.77 °C. Furthermore, it can be obtained that QT2 + QP2 = 629.3 J, QWt + QwP = 655.2 J, that is, the temperature increases by 0.62 °C after water passes through the hydraulic valves and hydraulic pipeline.
4. Principle of the Temperature Control Device and Analysis of Refrigeration Effect
In
Section 3, the heating process of the entire pressure-retaining and transfer device was analyzed and the heat generation was calculated. To control the temperature of the entire hydraulic circuit, active cooling of the seawater in the hydraulic lines is also required. On the one hand, the temperature of the seawater entering the hydraulic system has to be controlled. On the other hand, the seawater in the system still needs to be cooled twice after being pressurized by the plunger pump and heated up by passing the pipeline.
4.1. Design and Refrigeration Analysis of Seawater Chillers
The chiller consists of a compressor, a condenser, a refrigerant reserve, a throttle expansion valve, and an evaporator. The whole device layout and working principle diagram are shown in
Figure 6.
According to the initial temperature of the refrigerated seawater and the target temperature to be reached after cooling, the required refrigerating capacity is:
The refrigerating capacity of the chiller is:
where
C is the specific heat capacity of seawater,
m is the mass of seawater that needs to be cooled,
to and
tt are the initial temperature and the target temperature of the seawater,
A is the coefficient of loss of cooling capacity is generally 0.2, and
T is the total refrigerating time.
The refrigerating capacity of the chiller is related to the gas volumes and input power of the compressor. First, refrigerating capacity per unit mass and work per unit mass of the refrigerant during operation are:
Different compressors have different theoretical gas volumes
Vh. According to the theoretical gas volume and the estimated specific volume
υ1 of the gas after leaving the compressor under the actual working conditions, the gas volume in mass is obtained:
Furthermore, the refrigerating capacity and input power of the compressor is:
where
q0 is the refrigerating capacity per unit mass,
h1 is the enthalpy of the refrigerant at the compressor inlet,
h4 is the enthalpy of the refrigerant entering the evaporator,
wts is the work per unit mass,
h2 is the enthalpy of the refrigerant at the compressor outlet,
qm is the gas volume in mass,
ηv is the volumetric efficiency, and
η is the working efficiency of the compressor.
The heat exchange capacity in the evaporator is mainly related to the heat exchange area, and its expression is:
when the cool-carrying refrigerant is a liquid such as seawater, the heat transfer temperature difference is calculated according to the average logarithmic temperature difference, and the expression is:
where
K is the heat transfer coefficient,
ts is the saturated steam temperature of the refrigerant, and
ti and
to are the seawater temperature flowing into and out of the evaporator.
The calculation of the heat exchange capacity of the condenser is the same as that of the evaporator, and is also related to parameters such as heat exchange area, heat transfer coefficient and heat transfer temperature difference. The design of the chiller meets the requirements, when the refrigerating capacity of key components such as compressors, evaporators, and condensers can meet the refrigerating capacity required for the design [
20].
After calculation, it can be obtained that the refrigeration capacity of the chiller
Qh is 1.3 × 10
4 W, the power consumption of the chiller is 4454 W, and the chiller’s COP = 2.91. The calculated model selection is listed in
Table 1.
4.2. Principle and Design of Thermoelectrical Refrigeration Device
Through the analysis in
Section 3, it can be seen that the temperature of the cooled seawater will increase when pressurized and flowing through the pipeline. Since the seawater in the high-pressure pipeline cannot be reintroduced into the heat exchanger without pressure drop, a thermoelectrical refrigeration device composed of semiconductor refrigeration plates is wrapped directly around the outside of the pipe wall.
Thermoelectrical refrigeration mainly relies on the Peltier effect, that is, the metal temperature difference electric inverse effect. The refrigeration capacity of the entire semiconductor refrigeration plates is determined by the Peltier effect of multiple pairs of thermocouples, the Joule heat of the internal current, and the conduction heat from the hot end to the cold end [
21]. The Peltier heat of the thermocouple, the Joule heat inside the refrigeration plate, and the heat transfer due to the temperature gradient at the hot and cold side are:
Therefore, the total refrigeration capacity of the semiconductor refrigeration plate is:
where
Qπ is Peltier heat,
αp and α
n are the temperature difference electromotive force of the
p-type and
n-type galvanic couple arms,
I is the internal current of the refrigeration plate,
R is the resistance of the refrigeration plate, and
Kp is the total thermal conductivity of the galvanic couple arms.
Qj is Joule heat,
Qk is the conduction heat dissipation from the hot side to the cold side,
Tco is the absolute temperature of the cold side, and
Tho is the absolute temperature of the hot side [
22,
23].
In the design of a thermoelectrical refrigeration device, a scheme in which semiconductor refrigeration plates wrap the hydraulic line is employed, and a square metal tube is used for the refrigeration plates. The inside of the square tube is round, and is tightly attached to the hydraulic pipe, while the outside is tightly attached to the cold side of the refrigeration plates to maximize the efficiency. The square metal tube is made of aluminum alloy with good thermal conductivity.
At the same axial position of the hydraulic pipe, four semiconductor refrigeration plates surrounding the outer wall of the square pipe are connected to the same controller to form a refrigeration control unit. Several refrigeration units are arranged in the axial direction, and the number of refrigeration units opening is adjusted according to the flow rate and velocity in the pipeline. The arrangement is shown in
Figure 7.
The heat exchange between the square tube to which the semiconductor refrigeration plates are attached and the hydraulic pipe is expressed as follows:
where
Qsq is the conduction heat exchange between the refrigeration plates and the hydraulic pipe,
KA is the thermal conductivity of aluminum,
Asf is the heat exchange area of the square tube with a circular inner side,
Tst is the temperature of the outer wall of the square tube, and
Tp is the temperature of the hydraulic pipe.
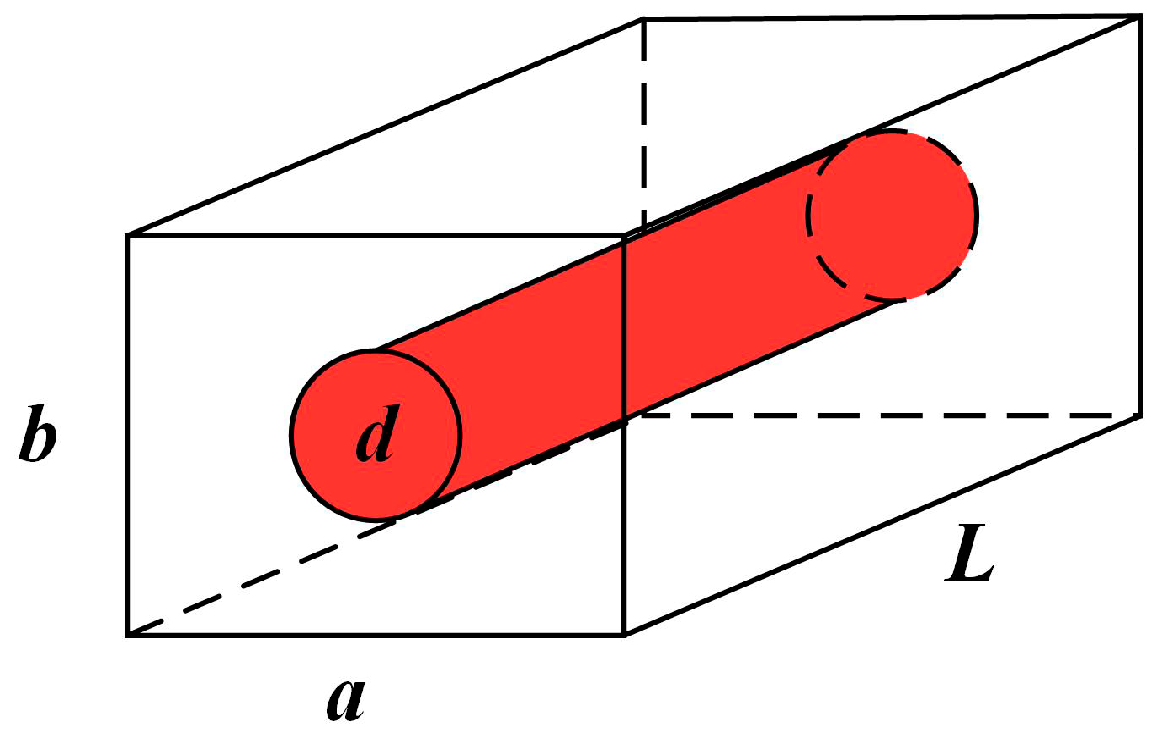
In the above formula, the heat exchange area of the square tube is complicated, and its structure is as shown in the following
Figure 8:
The corresponding calculation formula is:
The meaning of the relevant variables is shown in the
Figure 8 above.
The heat exchange mode between the hydraulic pipe and the seawater in the pipe is convective heat exchange as described in
Section 3.
The temperature at the cold end of the semiconductor refrigeration plate can be reduced to −2 °C at an ambient temperature of 28 °C under operation conditions. Then, the refrigerating capacity Qsq of a group of refrigeration sheets is 154 W, and the seawater through the pipeline can be cooled by 0.15 °C. The total cooling temperature of the four groups of refrigeration plates can reach 0.6 °C.
5. Simulation Analysis of Temperature Increase and Refrigeration Process of Pressure Maintenance and Temperature Control Device
In this paper, LMS Imagine.Lab AMESim (2014, LMS International, Laredo, TX, USA) is used to simulate the cooling time of the chiller, the temperature increase of the plunger pump and the hydraulic circuit, and the cooling effect of the semiconductor refrigeration device, evaluating the working effect of the PMTCD as a whole.
The model is constructed by using air-conditioning refrigeration library, two-phase flow library and thermal-hydraulic library components. The final model design sketch is shown in
Figure 9.
The left side of
Figure 9 is the seawater chiller device. In the actual design, the rapid chiller unit and the precision chiller unit have the same working principle. They are divided into two units, mainly for the purpose of shortening the cooling time. Meanwhile, the rapid chiller also has the purpose of replenishing the water for the whole unit and reserving enough initial cooling seawater in advance for multiple uses, so that the precise chiller can improve its working efficiency [
24,
25]. During the simulation, the seawater is cooled from the ambient temperature of 28 °C to the target temperature of 2 °C, according to the maximum working time of the unit, which is known as the precision chiller.
The main simulation components included in the chillers are compressors, condensers, accumulators, throttle valves, evaporators, circulation pumps, heat exchangers and variable water tanks. The heat exchange part of the hydraulic pipeline and the semiconductor refrigeration part are composed of thermal hydraulic pump, heat exchange pipe, outer wall material, stable heat source, convection heat exchange and radiation heat exchange components [
26]. In addition, the system also includes ordinary water tank, hydraulic pipeline, various signal sources and sensors.
In the simulation process, some important parameters that directly determine the simulation results are shown in
Table 1. The following key data are converted into specific parameters of each element in the simulation model, and the simulation is set and completed.
The
Figure 10 shows the cooling time and temperature curve of seawater in the water tank by the water chiller. It can be seen from the figure that the cooling time of 0.5 m
3 seawater takes 7070 s.
When the water temperature in the water tank reaches 2 °C, the plunger pump for pressure starts to work. According to the basic parameters, the volume of the sample cylinder is about 300 L in the final working condition, and the sample cylinder is filled with for about 1200 s through the plunger pump, thereby increasing the system pressure, which reaches 25 MPa after about 8 s. It can be obtained from the image that, in the first 1200 s, the pump outlet temperature is about 2.61 °C. Because the final requirement is that the temperature increase does not exceed 1 °C, the temperature increase is within the acceptable range. The temperature sensor at the inlet of the sample cylinder measured that the temperature after 3.5 m pipe and environment heat exchange was 3.18 °C. When the pressure increased to 25 MPa, the unloading valve started, and the inlet temperature rose to 3.34 °C, with a temperature rise of 1.34 °C, which achieves the required situation. The temperature change curve is shown in
Figure 11.
The above simulation shows that after the pressurization and flow through the hydraulic pipe, the seawater in the hydraulic pipe reaches a situation in which the temperature increase compensation is required at the inlet of the sample cylinder, that is, the thermoelectrical refrigeration device is used to refrigerate the hydraulic pipe. According to the semiconductor refrigeration plate data listed in the above table and the model building method described in
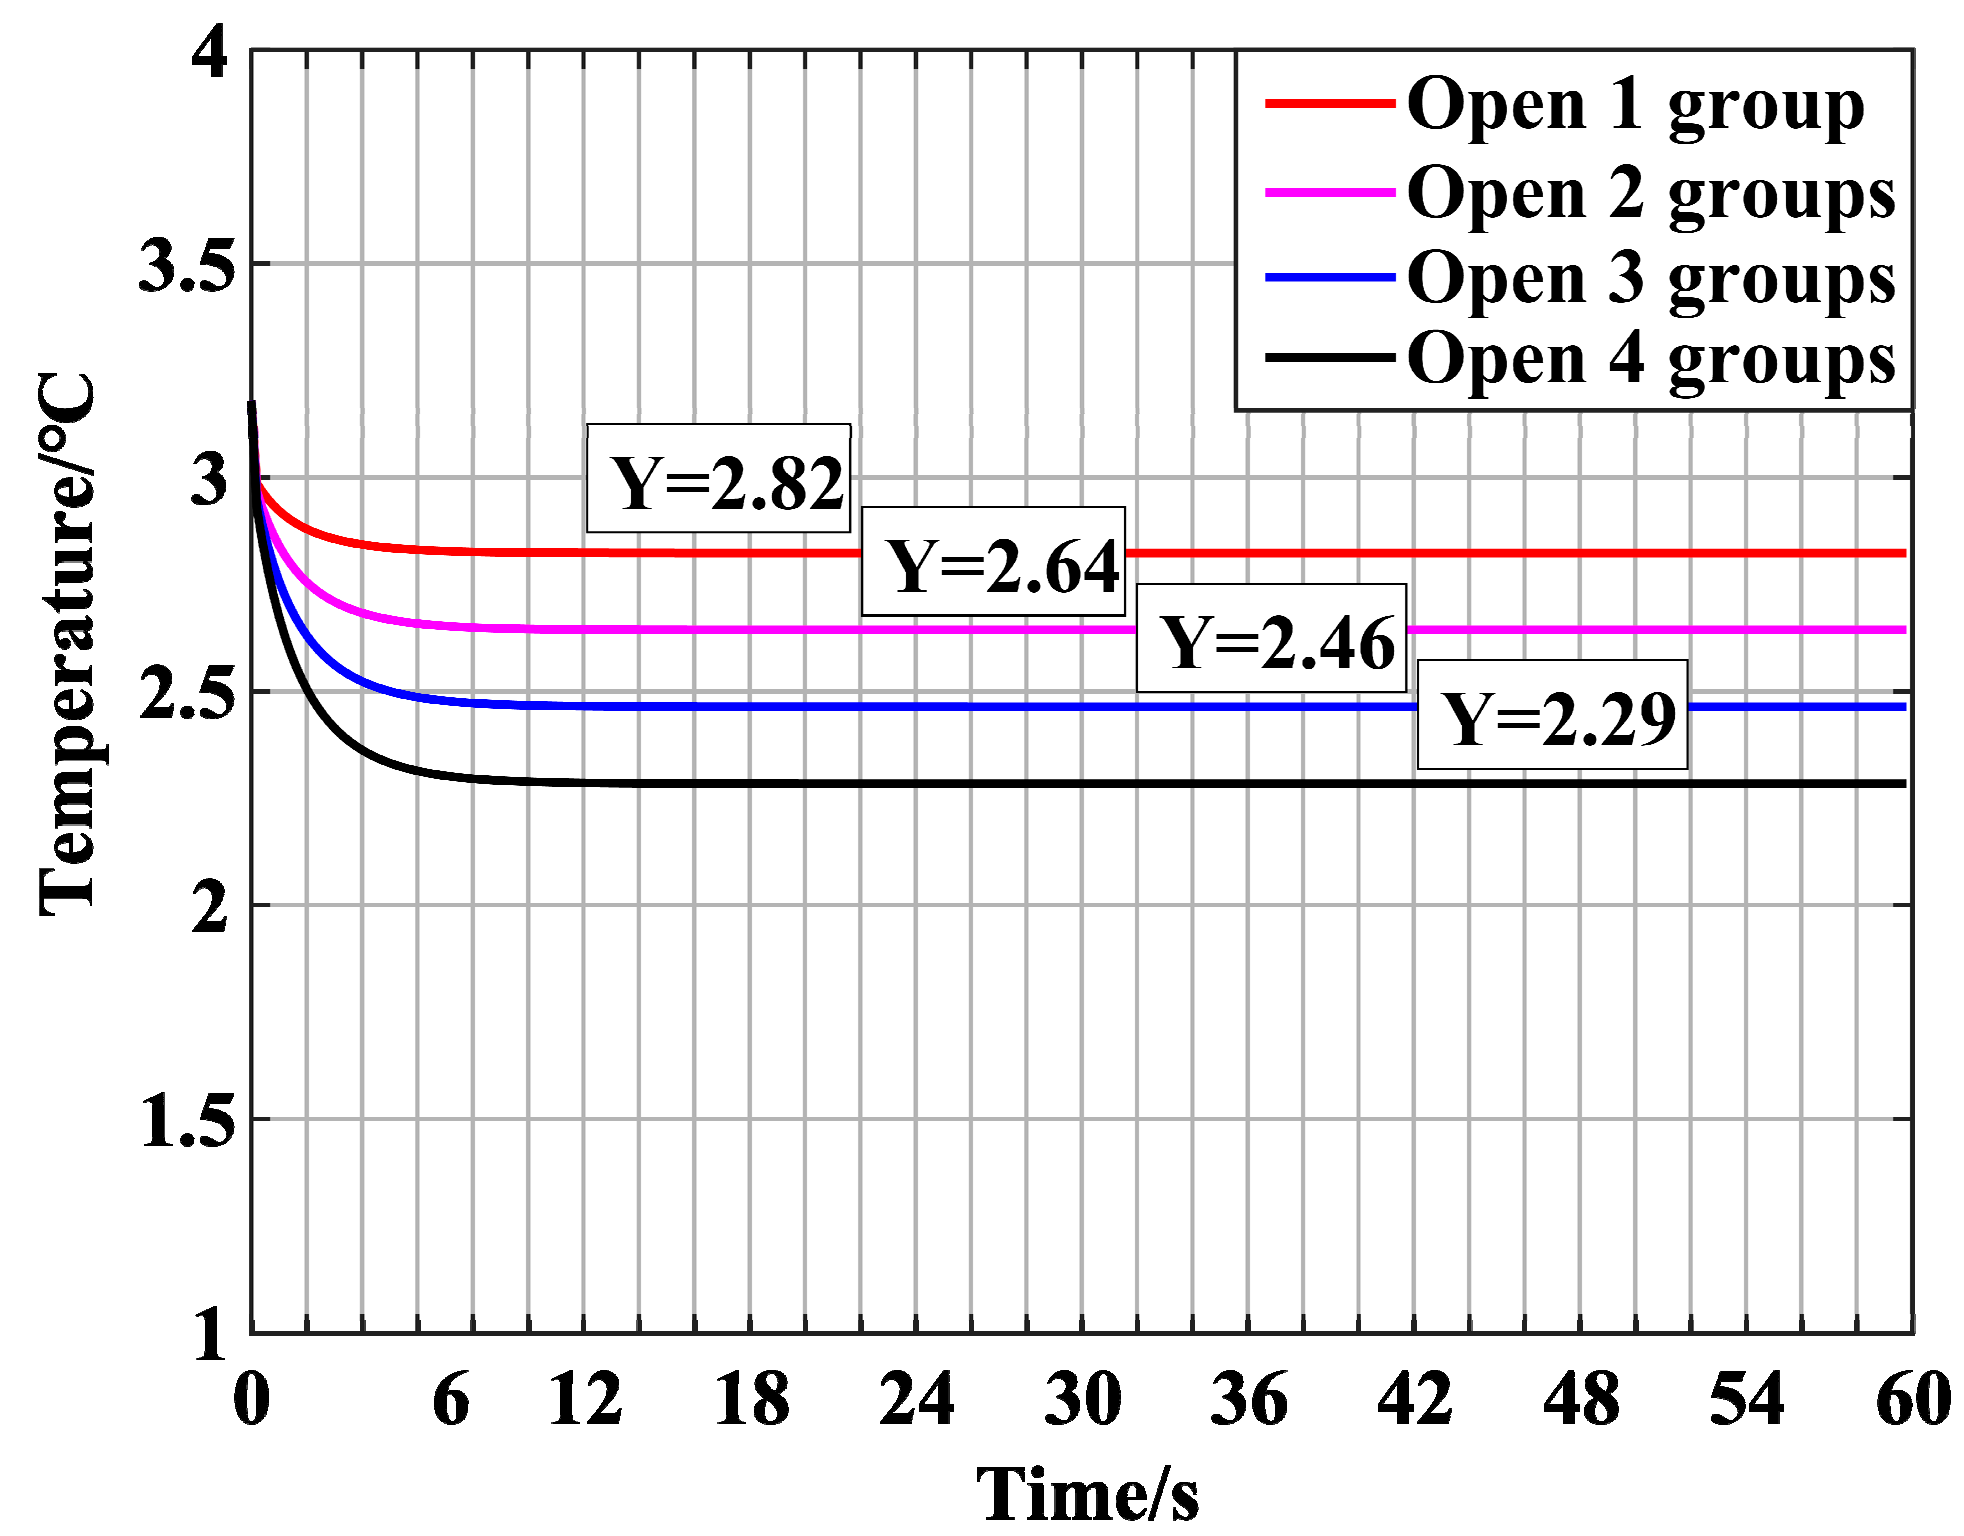
Section 5, the water temperature at the inlet of the thermoelectrical refrigeration device is set to 3.18 °C when the sample cylinder is filling with water, and then the simulation begins. The simulation results are shown in
Figure 12. In
Figure 12, the cooling effect of different groups of refrigeration plates on the hydraulic pipe is shown. The cooling effect is stable for 20–30 s, and the temperature can be reduced to 2.29 °C when the four groups of refrigeration plates are fully open.
Through the simulation of three stages of the whole system, it can be obtained that: at an ambient temperature of 28 °C, 500 L seawater needs about 2 h to be refrigerated to 2 °C. After the plunger pump is pressurized, the seawater temperature rises to 2.77 °C, and then the seawater goes through the 3.5-m-long hydraulic pipe, in which, including the ball valve, needle valve and 90° elbow pipe, the temperature increases to 3.18 °C. At this point, when the thermoelectrical refrigeration device is turned on, it can be seen that only one set of refrigeration plates is turned on, refrigerating the seawater by 0.36 °C. Each additional set can continue to refrigerate the seawater by 0.18 °C. When the four groups are fully open, the temperature can be reduced to 2.28 °C, and the temperature difference with the initial temperature is 0.28 °C, meeting the expected requirements.
6. Test
To further verify the refrigeration and temperature compensation capabilities of the PMTCD, the pressure maintenance and temperature control unit is now used to conduct tests at ambient temperature of 27–28 °C. Since the pressurization process is carried out after the sample cylinder is filled with water, there is only a small amount of water entering the sample cylinder through the pipeline during this process, and the influence of water temperature on the sample is less, the main objective of the experiment is to measure the temperature increase and temperature compensation when the sample cylinder is filled with water by the PMTCD.
When setting up the hydraulic pipeline, in order to get as close as possible to the final practical application condition, in addition to the hydraulic pipeline with 304 material and 12 mm outer diameter and 8 mm inner diameter, the four-way connector, 90° elbow, ball valve, needle valve and the second four-way connector are successively connected in the pipeline.
With respect to the determination of the pipe length, considering the practical application condition by the plunger pump outlet to the hydraulic control panel length is about 3 m, from hydraulic control panel to the sample cylinder of front-end and back-end water filling nozzle length is about 3 m, we chose 3 m as the test pipe length. Because the lengths of valves and joints, and some short pipes are connected for convenience of connection, the final test pipe length was 3.5 m. To realize the continuous circulation of 2 °C cold water, and to ensure the test needs, the cool water will be reconnected to the water tank through the hose after passing through the 3.5 m hard hydraulic pipe. The device connection diagram is shown in
Figure 13.
The first temperature measuring point is set at the outlet of the plunger pump in the pipeline, and the second temperature measuring point is set after the 3.5 m pipeline. The temperature probes at the first and second temperature measuring points are inserted into the hydraulic pipeline through the four-way to be in direct contact with the seawater. A temperature probe is placed in the tank to set a third temperature measuring point. At the same time, pressure measuring points are set at the first and second temperature measuring points. Although pressure changes are not considered in this experiment, the delay of temperature changes determines whether the pressure maintenance device is in its working state by monitoring the presence or absence of pressure signals. The temperature measuring device uses a Pt100 thermocouple with a temperature transmitter of 4–20 mA current output, and the pressure measuring device uses a 4–20 mA diffused silicon pressure transmitter. The temperature probe and pressure transducer used are shown in
Figure 14. The signal is collected and processed through the CompactRIO (National Instruments, Austin, TX, USA) control integrated collection device.
During the test, the precision chiller was turned on to cool the water in the tank. The water tank in the precision cooling part is 1.4 m long and 1 m wide, and the water storage depth is about 380 mm when working. The ambient temperature is 27–28 °C, and the initial temperature of water in the water tank is slightly lower than the air temperature, about 25 °C. After starting the chiller, the temperature dropped to 2 °C after about 2 h and 10 min. The temperature change in the water tank is shown in
Figure 15.
The chiller unit can decrease the water temperature in the water tank to a minimum of 1.5 °C, and restart when the water temperature exceeds 3 °C; in this way, the control of water temperature by the chiller unit is a dynamic process. When the temperature of the water tank drops to about 2 °C, the plunger pump is started. The pressure and temperature changes at the first and second measuring points are shown in
Figure 16. It can be seen from the figure that the temperature at the first measuring point increased by about 0.9 °C compared with that of the water tank after the plunger pump was pressurized, and the temperature at the second measuring point increased by about 1.5 °C after passing through the 3.5 m pipeline, with a relatively obvious increase in temperature. The specific temperatures are shown in
Figure 17.
As described in the previous sections, after the temperature increases, a semiconductor refrigeration device with a length of about 30 cm is installed after the 3.5 m pipeline to compensate. In the original design of the final shipboard pressure-retaining and transfer device, the hot-end heat dissipation of the semiconductor refrigeration plates is in the form of air cooling, because the PMTCD is in a low-temperature operation room of 10 °C. However, since the ambient temperature is room temperature, water cooling is adopted to ensure the refrigeration effect of thermoelectrical refrigeration device in test. The experimental device is shown in
Figure 18.
To facilitate power supply and control, four groups of thermoelectrical refrigeration units (TRU) were combined in pairs to form two units in the test. After thermoelectrical refrigeration, the temperature curves of the first and second temperature measuring points are shown in
Figure 19. It can be seen that the temperature of one set of semiconductor refrigeration plates is reduced by about 0.3 °C, and that of the two groups is reduced by 0.6 °C. The temperature of the whole device is maintained in a temperature range of 1 °C.
Based on the test, the following results can be drawn: (1) In the case of an ambient temperature of about 28 °C, the chiller can refrigerate 500 L of water from 25 °C to 2 °C in about 2 h; (2) the hydraulic system including the plunger pump causes a temperature increase of 1.5 °C for seawater, and if the operating environment is 10 °C, the temperature increase of the hydraulic system will be decreased; (3) four sets of semiconductor refrigerating plates can compensate a temperature rise of 0.6 °C in total, and the length of device is only 24 cm. If the number of refrigerating plates is increased, the temperature increase compensation capability can be enhanced.
7. Conclusions
This paper describes a PMTCD placed on shipboard that can be used in the pressure-retaining and transfer process of natural gas hydrate core samples. This device can rapidly refrigerate seawater extracted from the ocean to 2 °C in 2 h. The plunger pump in the device pressurizes the seawater and then injects it into the sample cylinder through the hydraulic pipeline. The temperature control part of the device is composed of chillers and a thermoelectrical refrigeration device. The chillers are divided into a rapid refrigeration part and a precise refrigeration part, which can step down the temperature of seawater and store enough cold water for the system. The thermoelectrical refrigeration device can compensate the temperature rise of the seawater caused by the plunger pump and the hydraulic pipeline, and effectively control the seawater entering the sample cylinder to be no higher than 3 °C.
The PMTCD creatively solves the problem that core samples can only rely on passive temperature maintenance. Existing pressure-retaining and transfer systems require a long time to cool the operating chamber before processing the core sample to reduce the temperature of the seawater that needs to be injected into the sample cylinder. The new system which contains the PMTCD refrigerates the seawater in tank directly in just 2 h, which greatly shortens the pre-start time of the equipment. The PMTCD can help core samples get rid of temperature fluctuations caused by system leakage or staff activities in the operating room. More importantly, PMTCD gets rid of the dependence on operating room temperature. At present, both PCATS used on shipboard and Mini PCATS used in laboratory need to set the temperature of the operating room to nearly 4 °C, while the onboard equipment requires at least 2 h in one operation and the laboratory equipment will be longer, which is a huge challenge for researchers who have to stay in the operating room for a long time. In general, the development of PMTCD has made breakthroughs in the research of pressure-retaining and transfer systems.
Author Contributions
Conceptualization, P.Z. (Peihao Zhang), J.C. and Q.G.; Data curation, Q.G. and P.Z. (Peng Zhou); Formal analysis, P.Z. (Peihao Zhang); Funding acquisition, J.C.; Methodology, P.Z. (Peihao Zhang), J.C. and Q.G.; Project administration, J.C., B.X. and X.G.; Resources, B.X. and X.G.; Software, P.Z. (Peihao Zhang), and P.Z. (Peng Zhou); Supervision, Q.G., B.X. and X.G.; Validation, J.C.; Visualization, P.Z. (Peng Zhou); Writing—original draft, P.Z. (Peihao Zhang); Writing—review & editing, P.Z. (Peihao Zhang).
Funding
This research was funded by National Key R&D Program of China, grant number 2017YFC0307503 and National Key R&D Program of China, grant number 2018YFC0310601.
Acknowledgments
The work was supported by the project “Research and Application on Subsea Drilling and Shipborne Detection Technology for Natural Gas Hydrate”, which is derived from the “National Key R&D Program of China (grant No.2017YFC0307503)”, and “Construction of Biological Resources Exploration, Acquisition, Cultivation and Preservation Technology System”, which is derived from the “National Key R&D Program of China (grant No.2018YFC0310601)”, supported by the Ministry of Science and Technology of the People’s Republic of China. In addition, thanks also to engineer Zhenjun Jiang for his help in the experimental process.
Conflicts of Interest
The authors declare no conflict of interest.
References
- Jerome, J.R.; Maria, A.B.; Gioia, F. Hydrate Formation: Considering the effects of Pressure, Temperature, Composition and Water. Energy Sci. Technol. 2012, 4, 60–67. [Google Scholar]
- Kvenvolden, K.A.; Lorenson, T.D. The global occurrence of natural gas hydrate. Geophys. Monogr. Ser. 2001, 124, 3–18. [Google Scholar]
- Dhifaf, S.; Khalid, A.; Stefan, I.; Maxim, L.; Ahmed, B. Compressional wave velocity of hydrate-bearing bentheimer sediments with varying pore fillings. Int. J. Hydrogen Energy 2018, 43, 23193–23200. [Google Scholar]
- Xueqiao, G.; Yuxia, S.; Yonglei, Z.; Junbo, L. Pressure-retaining Transfer System of Natural Gas Hydrate. China Resour. Compr. Util. 2017, 35, 123–125. [Google Scholar]
- Zhang, Y.; Cai, J.; Li, X. Dissociation behaviors of methane hydrate in marine sediments from South China Sea under constant pressure. Sci. Sin.-Phys. Mech. Astron. 2019, 49, 034611. [Google Scholar] [CrossRef]
- Dhifaf, J.S. Gas Hydrates Investigation: Flow Assurance for Gas Production and Effects on Hydrate-bearing Sediments. Ph.D. Thesis, Degree of Doctor of Philosophy. Curtin University, Perth, Australia, 2018. [Google Scholar]
- Jin, Y.; Konno, Y.; Nagao, J. Pressurized subsampling system for pressured gas-hydrate-bearing sediment: Microscale imaging using x-ray computed tomography. Rev. Sci. Instrum. 2014, 85, 094502. [Google Scholar] [CrossRef]
- Sadeq, D.; Iglauer, S.; Lebedev, M.; Rahman, T.; Zhang, Y.; Barifcani, A. Experimental pore-scale analysis of carbon dioxide hydrate in sandstone via x-ray micro-computed tomography. Int. J. Greenh. Gas. Control. 2018, 79, 73–82. [Google Scholar] [CrossRef]
- Jiawang, C.; Yonglei, Z.; Yuxia, S. Research on pressure characteristic of pressure-retaining subsampling device of natural gas hydrate. Ocean Eng. 2017, 35, 103–109. [Google Scholar]
- Peter, S.; Melanie, H.; John, R.; Quentin, H.; Matthew, D.; Philip, F. PCATS: Pressure core analysis and transfer system. In Proceedings of the 7th International Conference on Gas Hydrates (ICGH 2011), Edinburgh, UK, 17–21 July 2011. [Google Scholar]
- Santamarina, J.C.; Dai, S.; Jang, J. Pressure Core Characterization Tools for Hydrate-Bearing Sediments. Sci. Drill. 2012, 14, 44–48. [Google Scholar] [CrossRef]
- Jiapin, C.; Yi, Z.; Hailong, R. Research on the Pressure-temperature Core Sampler for Ocean Exploration. Explor. Eng. (Rock Soil Drill. Tunn.) 2016, 43, 60–63. [Google Scholar]
- Zhang, P.; Chen, J.; Liu, H. Design of Pressure Maintenance and Temperature Control System in Gas Hydrate Shipboard Testing Technology. In Proceedings of the OCEANS 2018 MTS/IEEE, Charleston, SC, USA, 22–25 October 2018. [Google Scholar] [CrossRef]
- Han, M.; Cao, K.; Hu, L. Thermal model and simulation on hydraulic piston pump based on amesim. Mach. Tool Hydraul. 2012, 40, 136–138. [Google Scholar]
- Sanbao, X.; Zongxia, J. Temperature simulating calculation and analysis of aircraft hydraulic system. Mach. Tool Hydraul. 2005, 5, 67–69. [Google Scholar]
- Qianli, S.; Yanfeng, Q.; Feng, S. The Effect of Pipeline Pressure Loss on Hydraulic System Reliability. Hydraul. Pneum. Seals 2016, 36, 65–69. [Google Scholar]
- Yanyan, L.; Xinmin, W.; Wenjiao, S. Analysis on effect of hydraulic pipe to system thermal load. Hydraul. Pneum. Seals 2013, 9, 363–369. [Google Scholar]
- Johnston, N. The transmission line method for modelling laminar flow of liquid in pipelines. Proc. Inst. Mech. Eng., Part. I J. Syst. Control Eng. 2012, 226, 586–597. [Google Scholar] [CrossRef]
- Christoph, S.; Gerhard, S. Analysis of refrigerant pipe pressure drop of a CO2 air conditioning unit for vehicles. Int. J. Refrig. 2019. [Google Scholar] [CrossRef]
- Yezheng, W.; Hongqi, L.; Hua, Z. Refrigeration Compressor, 2nd ed.; China Machine Press: Beijing, China, 2010; pp. 94–100. [Google Scholar]
- Yongming, Z.; Fang, F.; Jianyi, X. Research of the principle of semi-conductor refrigerant and its’application. China Meas. Technol. 2006, 32, 49–52. [Google Scholar]
- Desheng, X. Semiconductor Refrigeration and Application Technology; Shanghai Jiao Tong University Press: Shanghai, China, 1992; pp. 1–12. [Google Scholar]
- Jiani, M.; Limei, S.; Aibo, L. Combined influence of thermoelectric refrigerating performance and optimization of thermoelectric cooler. Fluid Mach. 2010, 38, 68–73. [Google Scholar]
- Ge, Z.; Chong, C. Research on the air conditioning system of vehicle variable displacement compressor based on the amesim. J. Minjiang Univ. 2017, 38, 11–19. [Google Scholar]
- Wei, D.; Qiang, S.; Qingchun, X. Simulation technique of amesim and its application in performance study of automotive air conditioning system. Automob. Appl. Technol. 2015, 74–77. [Google Scholar]
- Peng, X.; Jiang, H.; Li, C.; Feng, S.; Liu, W. Dynamic simulation of helicopter airborne evaporative cycle system based on amesim. J. Nav. Aeronaut. Astronaut. Univ. 2018, 33, 452–458. [Google Scholar]
Figure 1.
The entire pressure-retaining and transfer system with PMTCD.
Figure 1.
The entire pressure-retaining and transfer system with PMTCD.
Figure 2.
Pressure maintenance and temperature control device.
Figure 2.
Pressure maintenance and temperature control device.
Figure 3.
The PID control schematic for PMTCD.
Figure 3.
The PID control schematic for PMTCD.
Figure 4.
Schematic diagram of heat exchange process of plunger pump.
Figure 4.
Schematic diagram of heat exchange process of plunger pump.
Figure 5.
Schematic diagram of the heat exchange process of hydraulic pipe.
Figure 5.
Schematic diagram of the heat exchange process of hydraulic pipe.
Figure 6.
Design diagram of seawater chiller.
Figure 6.
Design diagram of seawater chiller.
Figure 7.
Arrangement of semiconductor refrigerating plates.
Figure 7.
Arrangement of semiconductor refrigerating plates.
Figure 8.
Parameters of square tube heat exchange area calculation.
Figure 8.
Parameters of square tube heat exchange area calculation.
Figure 9.
The model design sketch of simulation.
Figure 9.
The model design sketch of simulation.
Figure 10.
Simulation image of temperature curve in water tank.
Figure 10.
Simulation image of temperature curve in water tank.
Figure 11.
Simulation image of system temperature increase and pressure change.
Figure 11.
Simulation image of system temperature increase and pressure change.
Figure 12.
Simulation image of temperature compensation of semiconductor refrigeration plates.
Figure 12.
Simulation image of temperature compensation of semiconductor refrigeration plates.
Figure 13.
Connection diagram of test equipment.
Figure 13.
Connection diagram of test equipment.
Figure 14.
Temperature and pressure monitoring device.
Figure 14.
Temperature and pressure monitoring device.
Figure 15.
Temperature curve of water in tank.
Figure 15.
Temperature curve of water in tank.
Figure 16.
The temperature curve of the system.
Figure 16.
The temperature curve of the system.
Figure 17.
Temperature measurement of the system (signal acquisition software).
Figure 17.
Temperature measurement of the system (signal acquisition software).
Figure 18.
The thermoelectrical refrigeration device connected into hydraulic pipe.
Figure 18.
The thermoelectrical refrigeration device connected into hydraulic pipe.
Figure 19.
Temperature change of opening thermoelectrical refrigeration units.
Figure 19.
Temperature change of opening thermoelectrical refrigeration units.
Table 1.
Key component parameters in system.
Table 1.
Key component parameters in system.
| | Flow Rate | Maximum Operating Pressure | Rev |
|---|
| Compressor | 14.4 m3/h | 3/2 MPa (High/Low) | 2900 r/min |
| | Heat exchange area | Exhaust air rate | Heat power |
| Condenser | 50 m2 | 6000 m3/h | 14 KW |
| | Suction gas superheat | | |
| Expansion Valve | 5 °C | | |
| | Working pressure | Volume | |
| Reservoir | ≤2 MPa | 6 L | |
| | Flow rate | Copper pipe pressure | |
| Evaporator | 3 m3/h | ≤1.4 MPa | |
| | Flow rate | Pipe size | Rev |
| Circulating Pump | 10 m3/h | G1.5 | 2000 r/min |
| | Flow rate | Pressure | Rev |
| Plunger Pump | 15 L/min | 28 MPa | 1465 r/min |
| | Inner diameter | External diameter | Material |
| Hydraulic Pipe | 8 mm | 12mm | AISI 304 |
| | Temperature difference | Refrigerating power | Model |
| Thermoelectrical Refrigeration | 66 °C | 50 W | TEC1-07910 |
© 2019 by the authors. Licensee MDPI, Basel, Switzerland. This article is an open access article distributed under the terms and conditions of the Creative Commons Attribution (CC BY) license (http://creativecommons.org/licenses/by/4.0/).


