Article

Experimental Study on Water Shutoff Technology Using In-Situ Ion Precipitation for Gas Reservoirs

1
School of Petroleum and Natural Gas Engineering, Chongqing University of Science and Technology, Chongqing 401331, China
2
Faculty of Engineering and Applied Science, University of Regina, Regina, SK S4S0A2, Canada
3
School of Petroleum and Natural Gas Engineering, Southwest Petroleum University, Chengdu 610500, China
4
Sichuan Province Academy of Industrial Environmental Monitoring, Chengdu 610045, China
*
Authors to whom correspondence should be addressed.
Energies 2019, 12(20), 3881; https://doi.org/10.3390/en12203881
Submission received: 15 September 2019 / Revised: 7 October 2019 / Accepted: 11 October 2019 / Published: 14 October 2019

Abstract

:
Once a gas well begins to produce water, gas production will be seriously affected. If no effective measures are taken, the gas well will be shut down. Although some methods can be adopted to limit the production of unwanted water in gas reservoirs, they do not radically solve the problem of excessive water production, which may cause gas shutoff and dramatically increase the cost of dealing with disposing of the unwanted water. In this study, water shutoff technology with in-situ ion precipitation was tested for a gas well in southwest China, with results demonstrated through experiments of ion precipitation distribution and core displacement. The results of the ion precipitation distribution experiments show that it can be artificially controlled to produce ion precipitation blocking the water layer. The distribution of ion precipitation depends on influencing factors including injection flow rate, injection height, and ion concentration, which is generally hill-shaped. Dynamic displacement experiments through two types of cores (matrix core and fracture core) show that during the process of injecting gas-field water into the core, the ion precipitation caused by the in-situ reaction constantly blocked the seepage channel, resulting in a significant decrease in the injection rate. After injection of the gas-field water, the permeability of the core decreased, the starting pressure gradient increased, and the effect of water shutoff was remarkable. Given the experimental results, the in-situ ion precipitation water-plugging technology for gas reservoirs can directly solve the problem of water production in gas wells in the water layer because it can block the water layer by using formation water itself. This technology has promise for use in southwest China and can provide technical guidance for other gas reservoirs.

Graphical Abstract

1. Introduction

The southwest region of China is one of the most important natural gas production areas in China, accounting for nearly 30% of the country’s production. Along with the exploitation of natural gas comes the common problem of excessive water production from gas reservoirs. According to previous research [1,2,3,4], excessive water production from gas reservoirs may eventually cause the gas wells to die, as well as significantly increasing environmental damage. It is essential to find an effective method to deal with unwanted water production from gas reservoirs and reduce the negative impact on the environment.
Currently, gas-well deliquification and water shutoff technology dispose of unwanted water production from gas wells. Gas-well deliquification methods mainly carry the liquid loading in the wellbore to the surface by additives or artificial lift, including the application of foam, gas lift, small tube, plunger lift, and electric submersible pump technologies [5,6,7,8,9,10]. Although these drainage measures can alleviate further pollution of the gas reservoir by water invasion and can ensure normal production of the gas well within a certain period, the effluent is not effectively suppressed, and a large amount of discharged formation water requires treatment—which not only increases production cost, but also leads to consequent environmental protection problems [11,12].
To block the flow of water into the wellbore from the formation by injecting an agent, there are two different circumstances for applying the shutoff technology. When the gas and water layers are clearly identified, permanent nonpermeable barriers can be used in the aquifer, such as cement slurry, resin, organogel, superfine cement, etc. However, for the layer containing both gas and water, researchers only choose the chemically selective water-plugging agent, which can reduce the permeability of the water phase more than that of the gas phase to achieve water shutoff. Compared to oil wells, the chemical agents for gas wells start later, mainly including polymer gels, microemulsions, wetting reversal agents, and inorganic salts. Using polymer gels could reduce excessive water production. In 1996, organic gels for gas-well water control were developed by Unocal and applied in three wells in Canada, increasing gas production by 315% and decreasing water production by 65% [13]. A low-molecular-weight polymer, PAtBA, crosslinked with polyethyleneimine (PEI), to block water in gas reservoirs was developed by Halliburton Energy Services and was applied to a horizontal gas well, resulting in 7.7 times more gas production and a 42% reduction in water content [14]. The adsorbed polymer has also proved effective for improving water plugging by using in-situ spreading characteristics. Studied by the French Petroleum Institute, the adsorbed polymer was applied to the VA48 gas well in eastern France, reducing the water–gas ratio and increasing gas production more than two times [15,16,17]. Microemulsion is also a direct approach to increase water plugging. A siloxane emulsion was developed for restricting water production that can alter the wettability of rock [18]. Field tests were carried out in the Algyo gas field in Hungary, with gas production and the gas–water ratio increasing three times. In addition, inorganic salt is an effective agent to improve water plugging. In the Tunu gas field in Indonesia, water production was reduced by 70% after its application [19]. Although the treatments for water production in gas reservoirs have achieved some success, they still encounter many challenges. Currently, polymers and gels are used mainly for water plugging in oil wells. The purpose of water shutoff in oil wells, however, is to improve the sweep efficiency of water, and in gas wells the purpose is to reduce it. Therefore, a risk of permanent damage to the porous medium exists for gas reservoirs when using oil-well treatments to shut off water in gas wells. In addition, a lack of accuracy exists when judging the water-producing layers, leading to the blockage of both gas and water layers. In addition, the high cost and long processing time of chemical agents increase gas production cost, and the extensive use of these agents also causes environmental issues. What we need is a technically feasible, low-water-production, environmentally friendly, low-cost technology to achieve water plugging.
In the exploitation of a gas field in southwest China, a production well, Well-I, was converted to a reinjection well of field water because of a large amount of water production. After reinjecting the water from Well-II for a period of time, Well-I began to produce gas. It was found that because of the chemical reaction between the water produced by the two wells during reinjection, ion precipitation was formed and the water layer was blocked on the spot, resulting in water shutoff and gas production. Based on the above findings, we injected a certain chemical ion solution into the production well to induce a chemical reaction with the formation water and generate ion precipitation in situ in the water layer, which could effectively block the formation water to enhance gas recovery. In this study, we conducted experiments on the distribution of ion precipitation and studied its influencing factors in order to obtain the mechanism of the water shutoff technology with in-situ ion precipitation. Core displacement experiments were carried out to evaluate the effect of water shutoff by ion precipitation in the formation, with results showing a remarkable blocking effect. These experimental results may have good application prospects in southwest China gas fields and could provide technical guidance for the development of other gas reservoirs.

2. Experimental Section

2.1. Materials

(1) Ionic solution
Experiments on the mechanism of ion precipitation distribution were intended to simulate the process of injecting Ba2+ into water containing SO42−, which could enable study of the formation process of BaSO4, the distribution of precipitated particles in the aqueous phase, and influencing factors. For this study, the following solutions were prepared: Na2SO4 with concentrations of 0.01 mol/L, 0.05 mol/L, and 0.1 mol/L, and BaCl2 with concentrations of 0.01 mol/L and 0.1 mol/L.
(2) Formation water
The formation water used in the displacement experiments was taken from Well-I and Well-II wellheads in southwest China. Table 1 shows the formation water ionic content of the two wells.
(3) Cores
In the displacement experiments, the cores from Well-I were used including matrix core (No.1) and fracture core (No. 2). Table 2 shows the properties of the cores.

2.2. Experiments on the Mechanism of Ion Precipitation Distribution

Experiments were carried out under different water injection flow rates, different injection heights (the vertical distance from the water injection point to the bottle mouth (Figure 1)), different ion concentrations, and different gas-field waters to explore the mechanism of ion precipitation distribution.

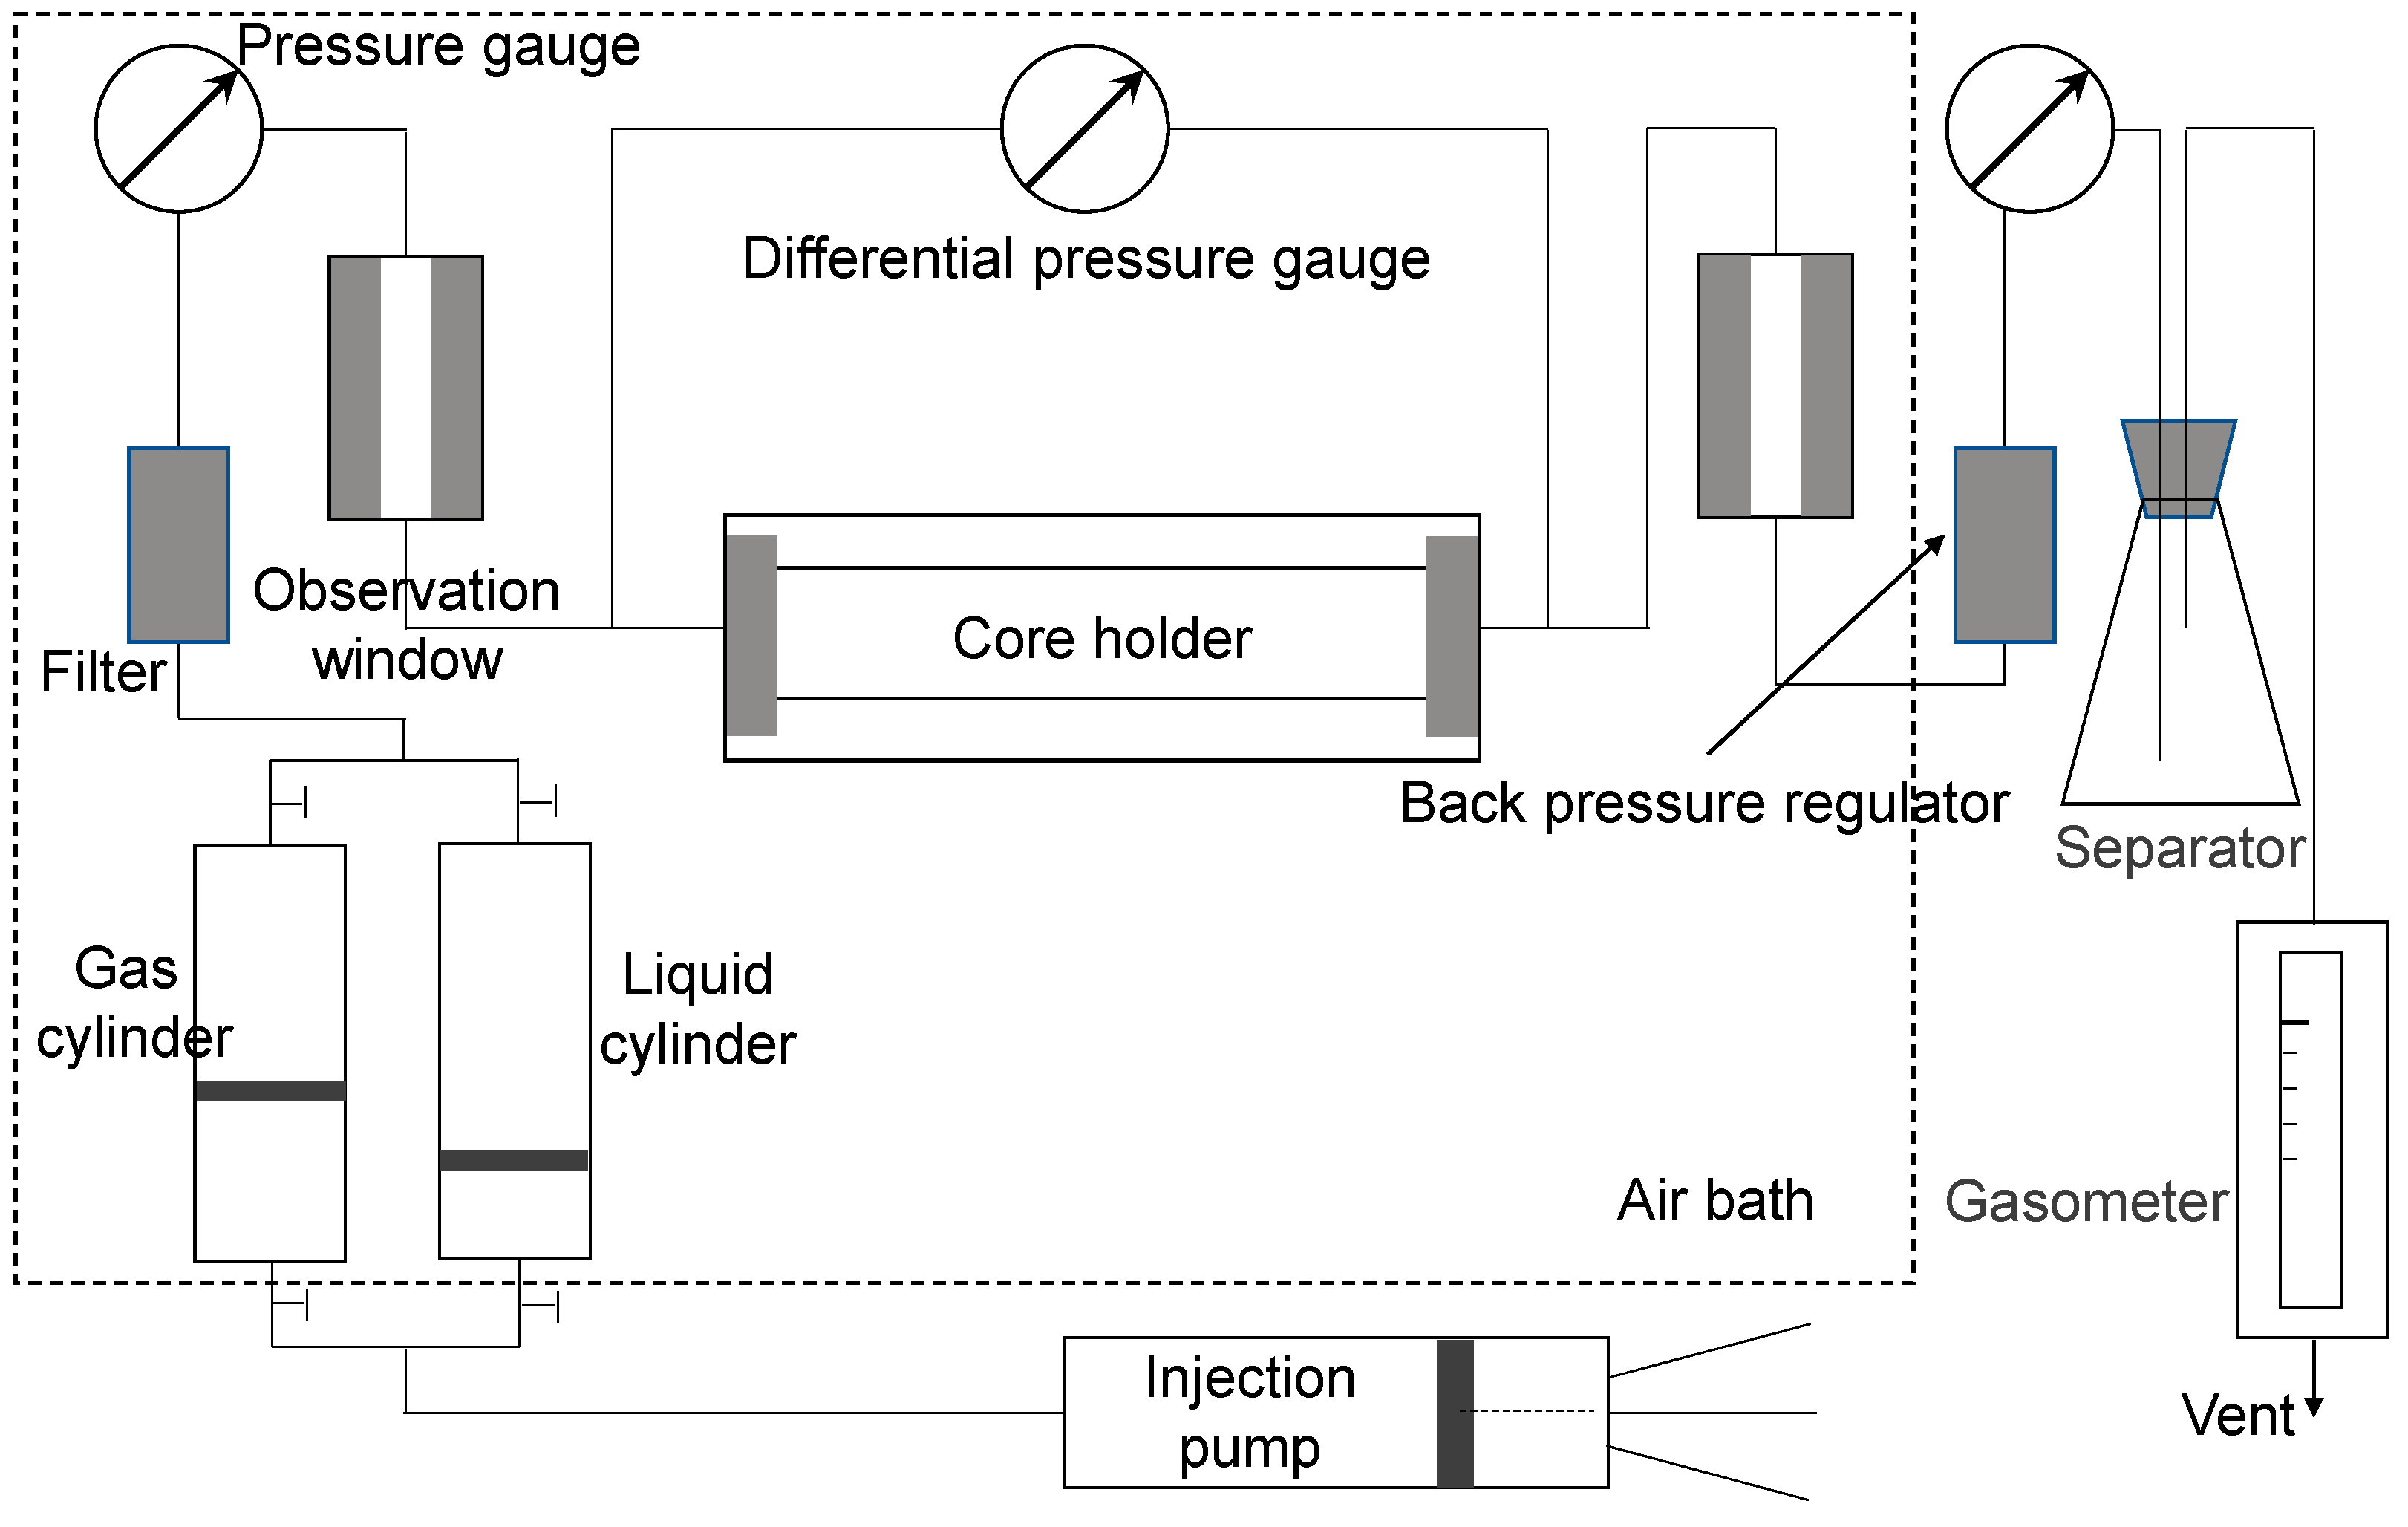
2.2.1. Experimental Setup

The apparatus for measuring the ion precipitation distribution is shown in Figure 1, and included a 17.6-cm × 17.6-cm closed water tank with a water depth of 8.7 cm. At the bottom of the tank, 49 identical open vials (height = 1.9 cm, volume = 6 cm3) were placed to collect the ion precipitate formed after the chemical reaction. Dividing the water injection area into 8 × 8 grids, the vials were placed on the nodes of the grids. The center distance of each vial was 2.2 cm. Using a 2-mm-diameter pipe on the top of the tank, we set the water injection point on the center node of the grid.

2.2.2. Experimental Procedures

During the experiments, BaCl2 with a volume of 4 L was injected into the water tank containing 1-L Na2SO4. The chemical reaction occurred, and the generated ion precipitates spread from the central node to the surroundings. Two hours after completion of the water injection, the mass of the ion precipitate in the 49 vials was measured and converted into a height, and the contour map of the ion precipitation in the water tank region was plotted to reflect the distribution mechanism of the precipitate on the area. The sedimentation height was converted using the following equation:
z = m × p s
where z: height of the precipitate in vials, cm; m: quality of precipitate, g; p: sedimentation volume per unit mass, cm3/g; s: area of bottle mouth, cm2.
The steps to perform the ion precipitation distribution experiments were as follows:
(1) Comparing experiments of different injection flow rates. In order to compare the effects of different injection flow rates on ion precipitation distribution, the 0.1-mol/L BaCl2 solution with a water injection height of 5.7 cm was injected into the tank containing 0.1-mol/L Na2SO4 at different flow rates of 0.1 mL/s, 0.5 mL/s, 1.5 mL/s, and 3 mL/s.
(2) Comparing experiments of different injection heights. In order to compare the impact of different injection heights on ion precipitation distribution, the 0.1-mol/L BaCl2 solution with a flow rate of 0.1 mL/s was injected into the tank containing 0.1-mol/L Na2SO4 at different injection heights of 5.7 cm and 8.7 cm.
(3) Comparing experiments of different solution concentrations. In order to compare the influences of different solution concentrations on ion precipitation distribution, four experiments were carried out according to different concentrations of Ba2+ and SO42− at an injection flow rate of 0.1 mL/s and an injection height of 5.7 cm. ① [Ba2+] = [SO42−] = 0.01 mol/L, ② [Ba2+] = [SO42−] = 0.1 mol/L, ③ [Ba2+] = 0.01 mol/L, [SO42−] = 0.05 mol/L; that is, [Ba2+] / [SO42−] = 1:5, ④ [Ba2+] = 0.01 mol/L, [SO42−] = 0.1 mol/L; that is, [Ba2+] / [SO42−] = 1:10.
(4) Gas-field water experiment. Under the conditions of a water injection height of 5.7 cm and an injection rate of 0.1 mL/s, 1 L of gas-field water from Well-I was injected into 4 L of gas-field water from Well-II (Table 1) to investigate the distribution of ion precipitation after the reaction.

2.3. Core Displacement Experiments

To investigate whether the ion precipitation water shutoff treatment is effective in the actual production process of gas wells, two types of displacement experiments (matrix core and fracture core) were carried out using cores obtained in southwest China (Table 2).

2.3.1. Experimental Setup

The core displacement experiments were performed on the Hycal displacement device (Figure 2), which consists of a core holder, an injection pump system, a back-pressure regulator, a differential pressure gauge, and a temperature control system. Detailed information about the experimental instruments are as follows.
(1) The key part of the core displacement device is the core holder, which consists of a core outer tube, a rubber sleeve, and an axial connector. The pressure test range is 0 to 70 MPa, and the temperature range is 0 to 200 °C.
(2) The injection pump system uses a Ruska automatic pump with a working pressure of 0 to 70 MPa and a speed accuracy of 0.001 mL/s.
(3) The back-pressure regulator controls the outlet pressure, and the working pressure is 0 to 70.00 MPa.
(4) The differential pressure gauge measures the pressure difference between the two ends of the core, and the maximum working pressure difference is 34 MPa.
(5) The temperature control system is a closed thermostat with an operating temperature of 0 to 200 °C and a temperature control accuracy of 0.1 °C.

2.3.2. Experimental Procedures

The displacement experiments were carried out using two types of cores (matrix core and fracture core). During the experiments, the fluid was injected by the automatic pump, the output was measured at the outlet end, and the pressure change during the experiment was monitored. By comparing the changes of core permeability and starting pressure before and after water injection, the shutoff effect of ion precipitation on the water in the formation was evaluated. At the beginning of the experiment, the core was saturated with Well-I formation water. After reaching the equilibrium state, we changed the injection pressure and recorded the corresponding flow rate. Using these data, we calculated the initial permeability and starting pressure of the core. Next, Well-II formation water was injected to test the relationship between core permeability and time. We continued to change the injection pressure of the formation water from Well-II, and we then measured the starting pressure of the core and recorded the results of the core permeability and starting pressure after ion precipitation. The specific experimental procedures were as follows:
(1) Flooding experiments at constant pressure. Well-II formation water was injected into the core containing the Well-I formation water at a constant injection pressure of 32 MPa. The relationship between the injection velocity and time was recorded to reflect the dynamic change process of the core infiltration channel.
(2) Comparing experiments of permeability. By testing the relationship between the pressure difference of the fluid flowing through the core and the production before and after the injection of Well-II formation water, we obtained the permeability of the core before and after blockage by ion precipitation, and we evaluated the shutoff effect.
(3) Comparing experiments of starting pressure. By testing the relationship between the flow rate and the pressure gradient of the fluid flowing through the core before and after the injection of Well-II formation water, we obtained the starting pressure of the core before and after blockage by ion precipitation, and we evaluated the shutoff effect.

3. Results and Discussion

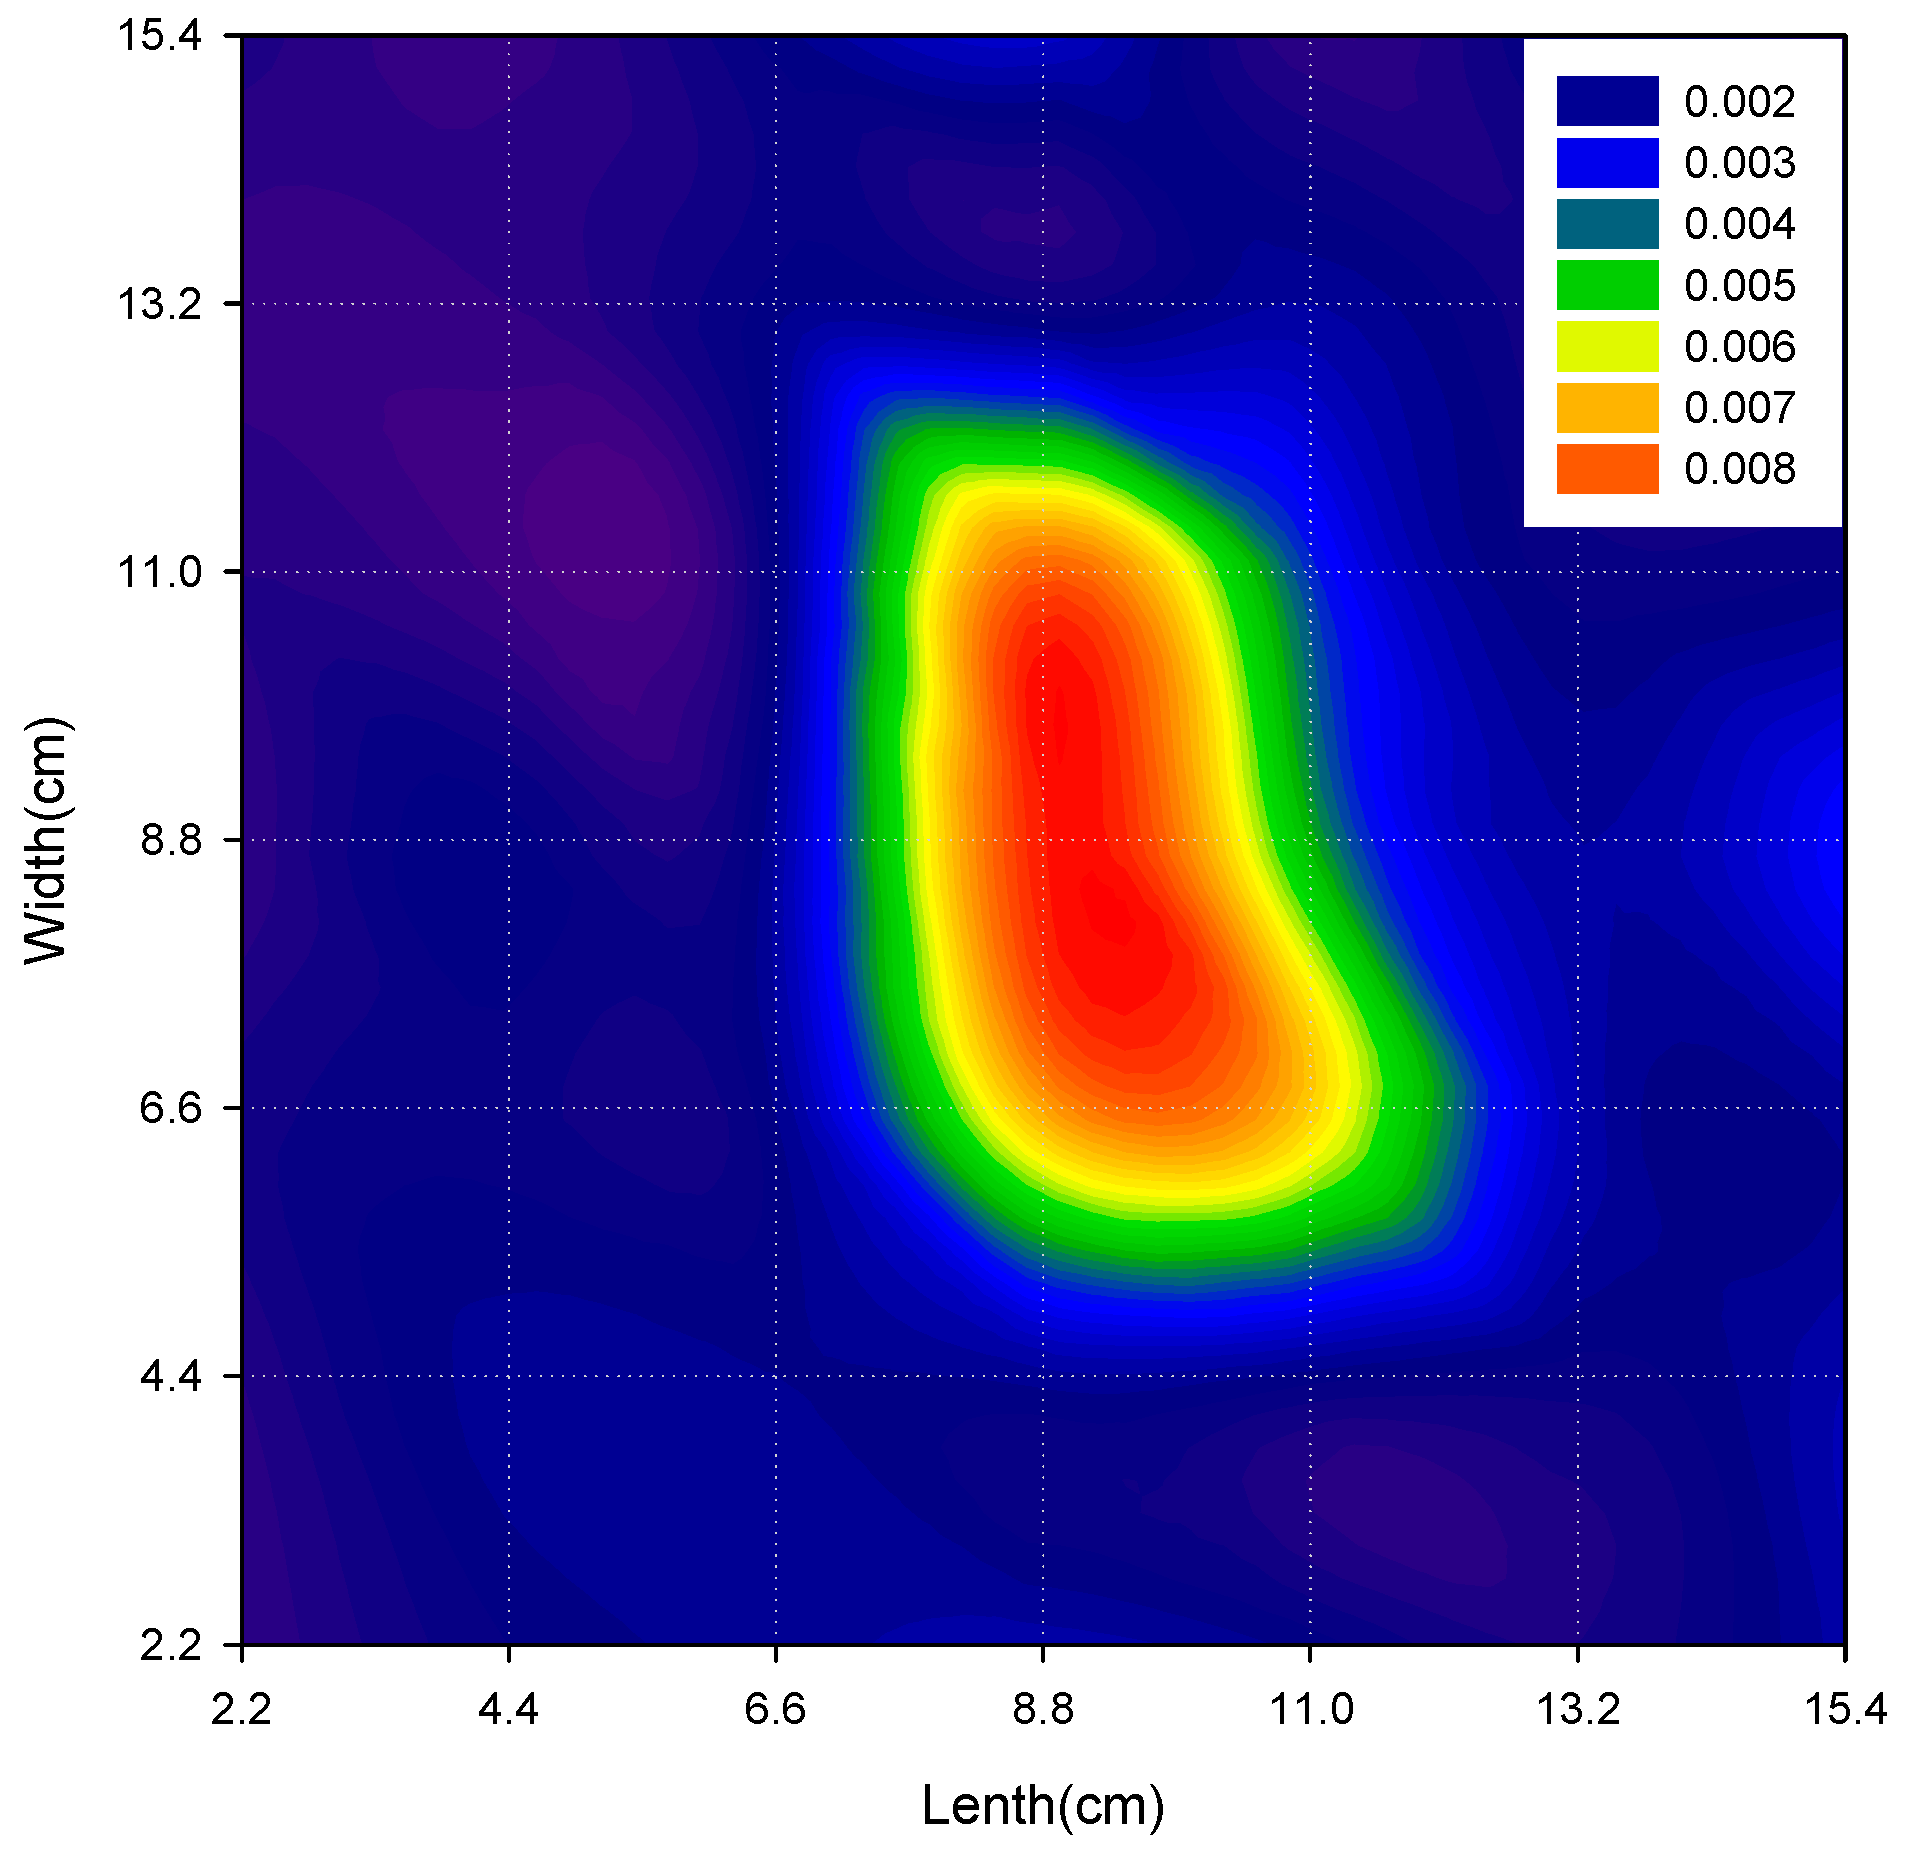
3.1. Experiments on the Mechanism of Ion Precipitation Distribution

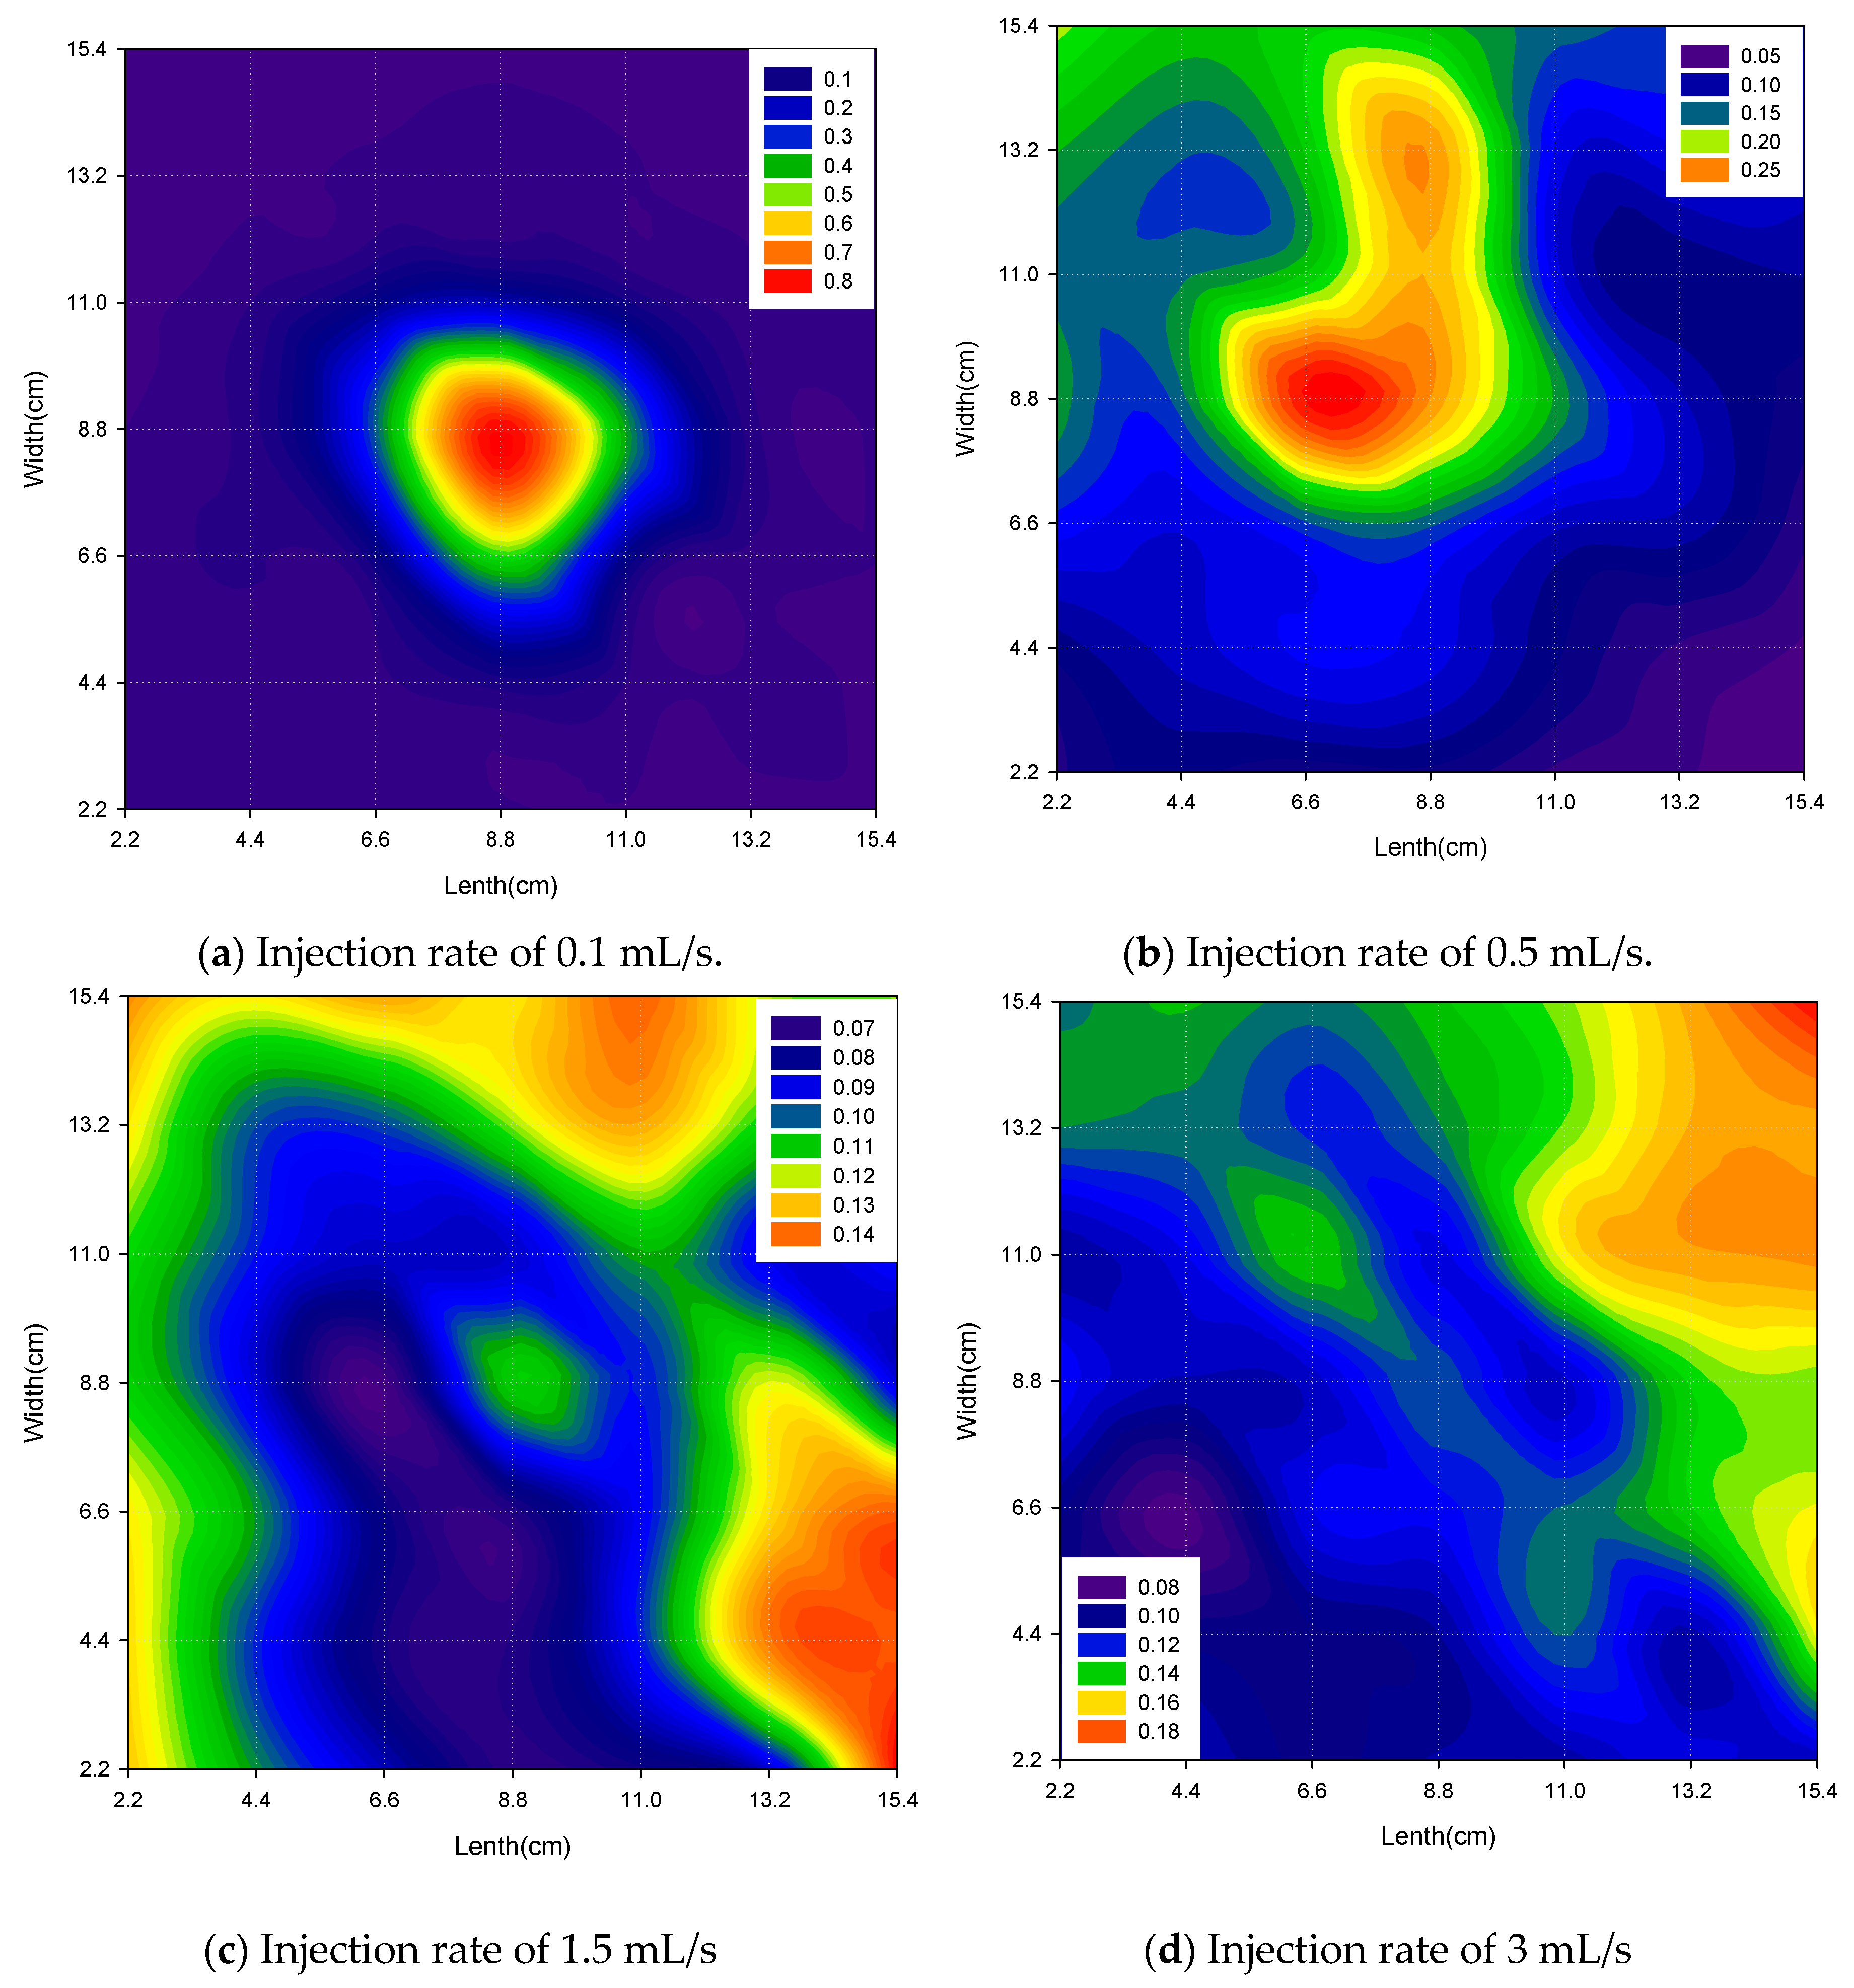
3.1.1. Effect of Injection Flow Rates

Through four experiments with different injection flow rates of 0.1 mL/s, 0.5 mL/s, 1.5 mL/s, and 3mL/s, the precipitate data in the vials were collected, and the precipitation contour distribution was found (as shown in Figure 3). The following can be concluded:
As shown in Figure 3a,b, it was found that the sediment at the center of the pool was the thickest when the flow rate was low and that the sediment thickness decreased as the distance increased from the center of the pool. As the injection flow rate increased, the sediment drifted farther away because the injected ions reacted rapidly near the injection point where the ions were most consumed and gradually diffused, such that the precipitation distribution was generally hill-shaped.
However, when the injection flow rate was higher, more than 0.5 mL/s (Figure 3c,d), the distribution of the precipitate became random. The sediment height at the flow rate of 1.5 mL/s was lower at the injection point than at the boundary of the injection region. Meanwhile, the sediment height was lowest at the transition region between the center and the boundary. However, the distribution of the precipitate at the flow rate of 3 mL/s was higher at the end of the water injection boundary than on the other side, possibly because the turbulence of the water flow caused random drift of the sediment around the injection point, and the continuous flushing of the water pushed the sediment generated at the injection point to the surroundings. In addition, due to the excessive flow rate of water injection, the precipitate accumulated around the injection water point randomly drifted toward the other end, and the boundary blocked the drift of the sediment and caused it to deposit at the boundary.
In summary, the injection flow rate determines the pressure gradient distribution of the water injection system, and the presence of the pressure gradient causes the flow of water, which in turn causes the drift of the precipitate. The higher the injection flow rate, the larger the pressure difference between the injection point and the surrounding area; the precipitated particles drift faster with water, resulting in a larger range of sedimentation. If the pressure distribution in the water layer can be accurately described, the condition of the water flow can be simulated so that the drift range of the particles before sedimentation can be predicted.

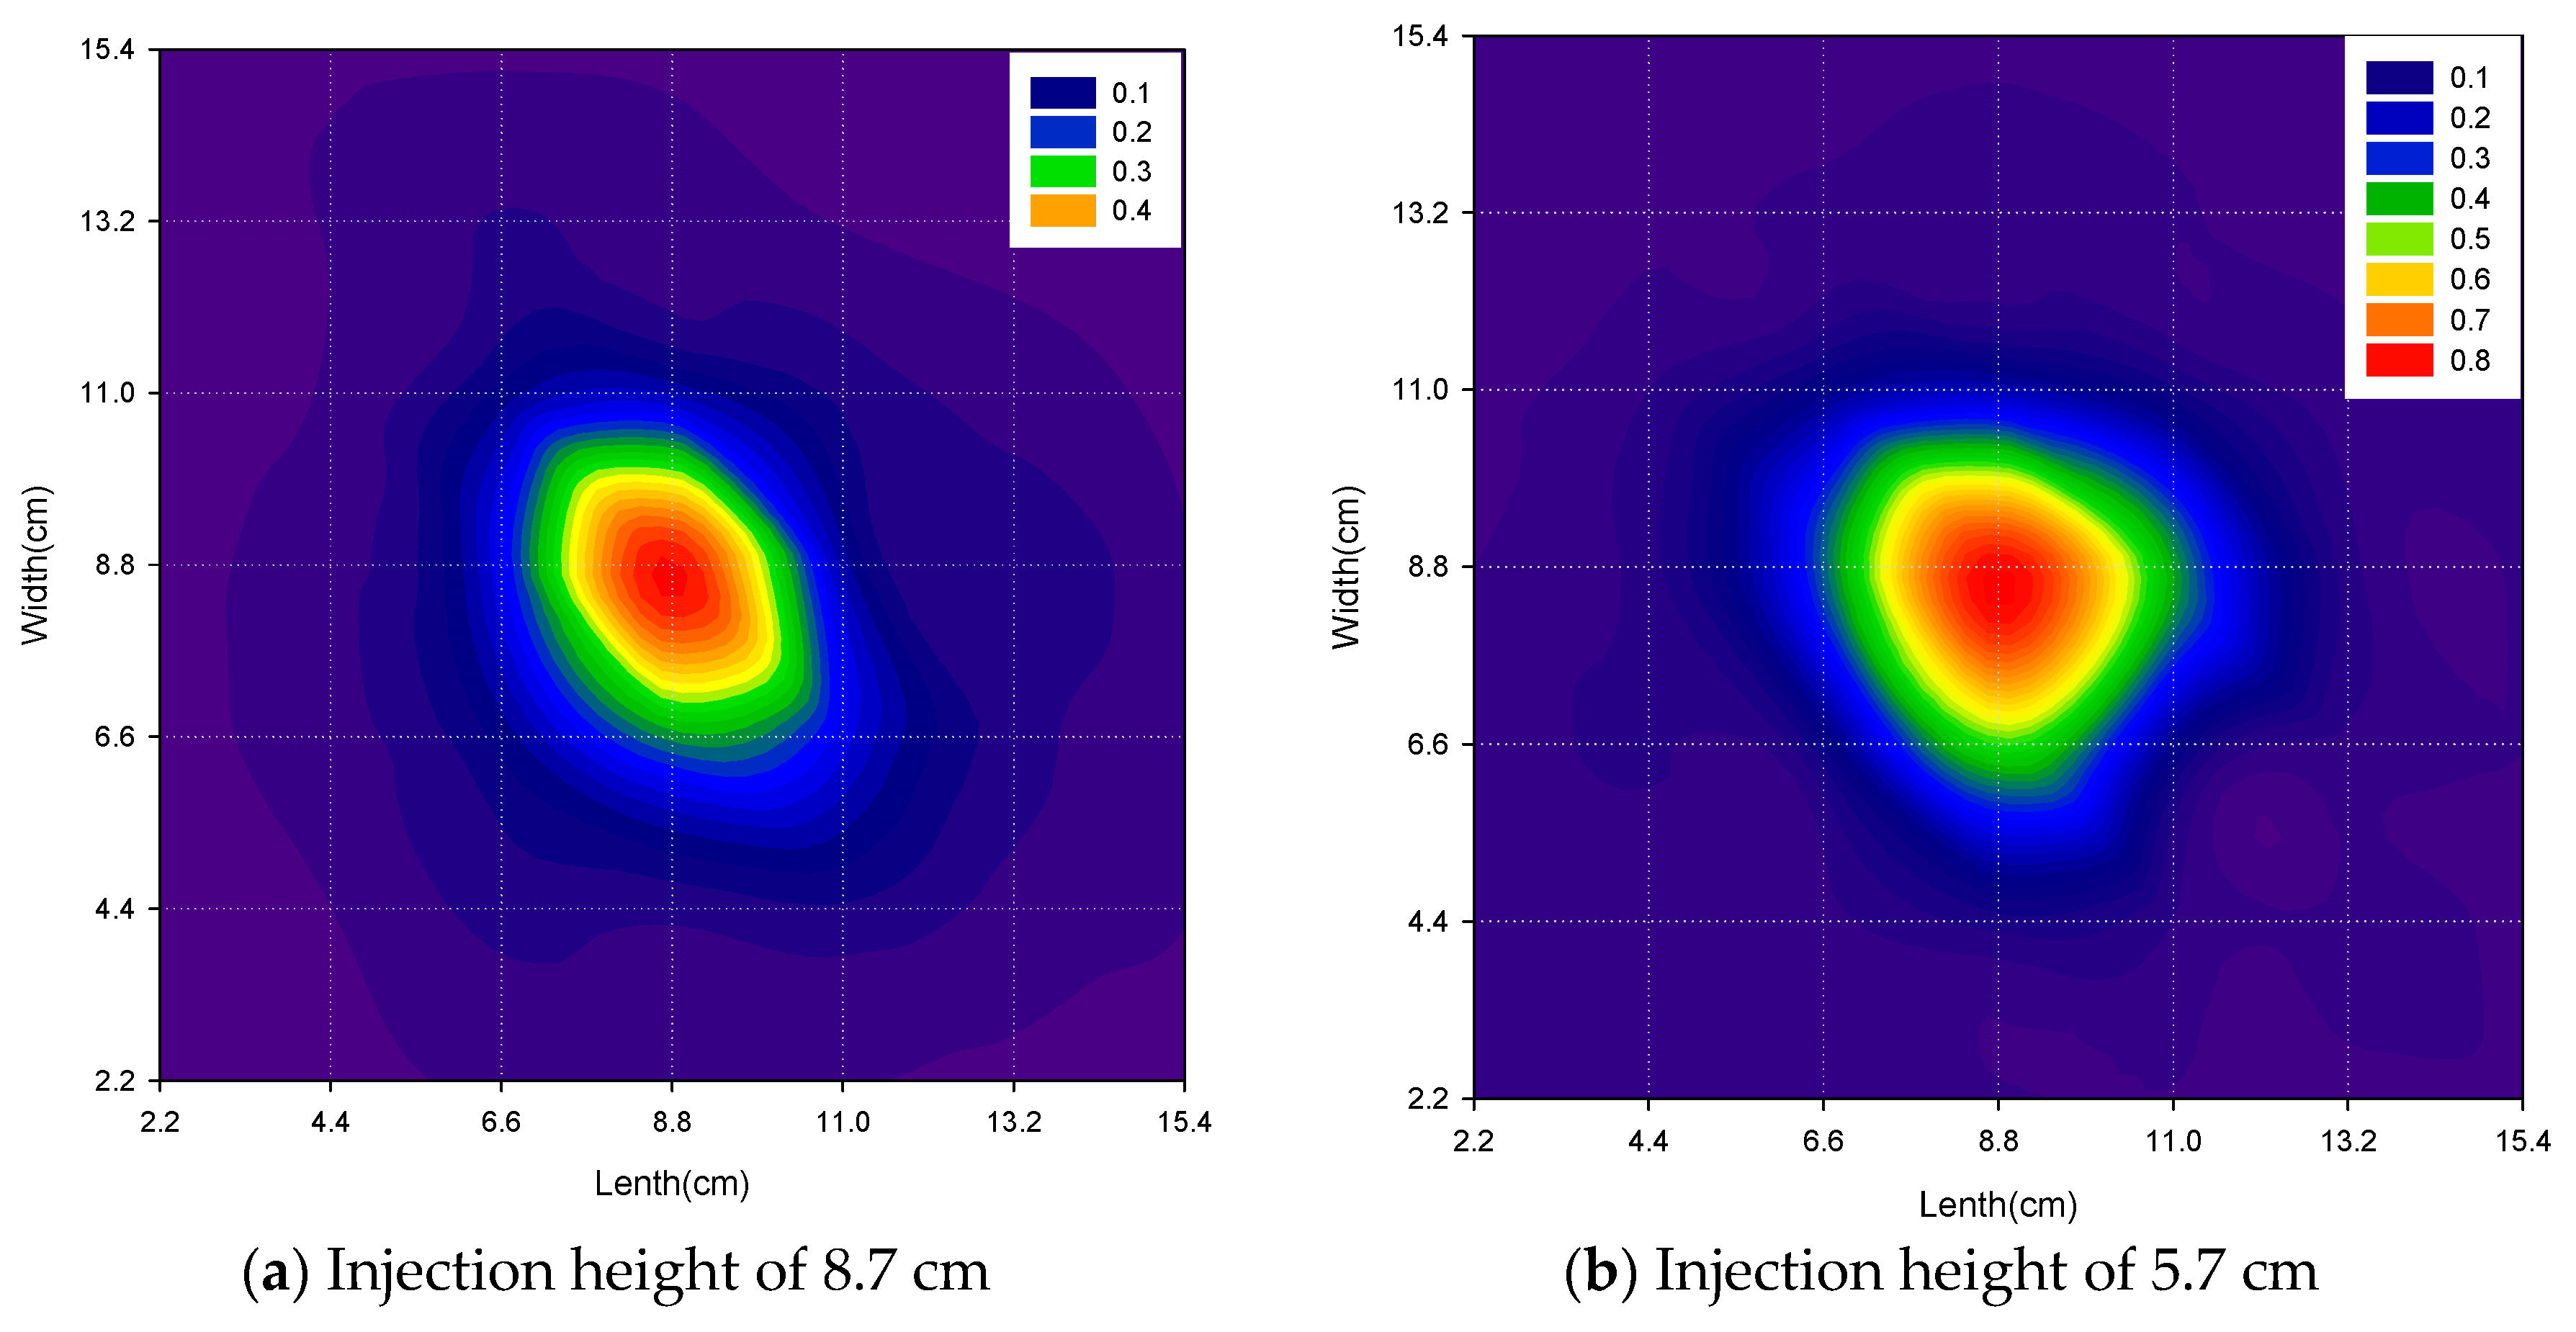
3.1.2. Effect of Injection Heights

As can be seen from Figure 4, the distribution of the precipitation with the injection height of 8.7 cm was more dispersed than at the height of 5.7 cm, and its sedimentation height at the same distance from the injection point was lower. The vertical sedimentation distance of the precipitated particles in the water increased with increasing injection height, leading to increases in sedimentation and drift time. Therefore, the range of sedimentation expanded. However, at the same flow rate, the distribution trend of the sediment did not change with increasing injection height.

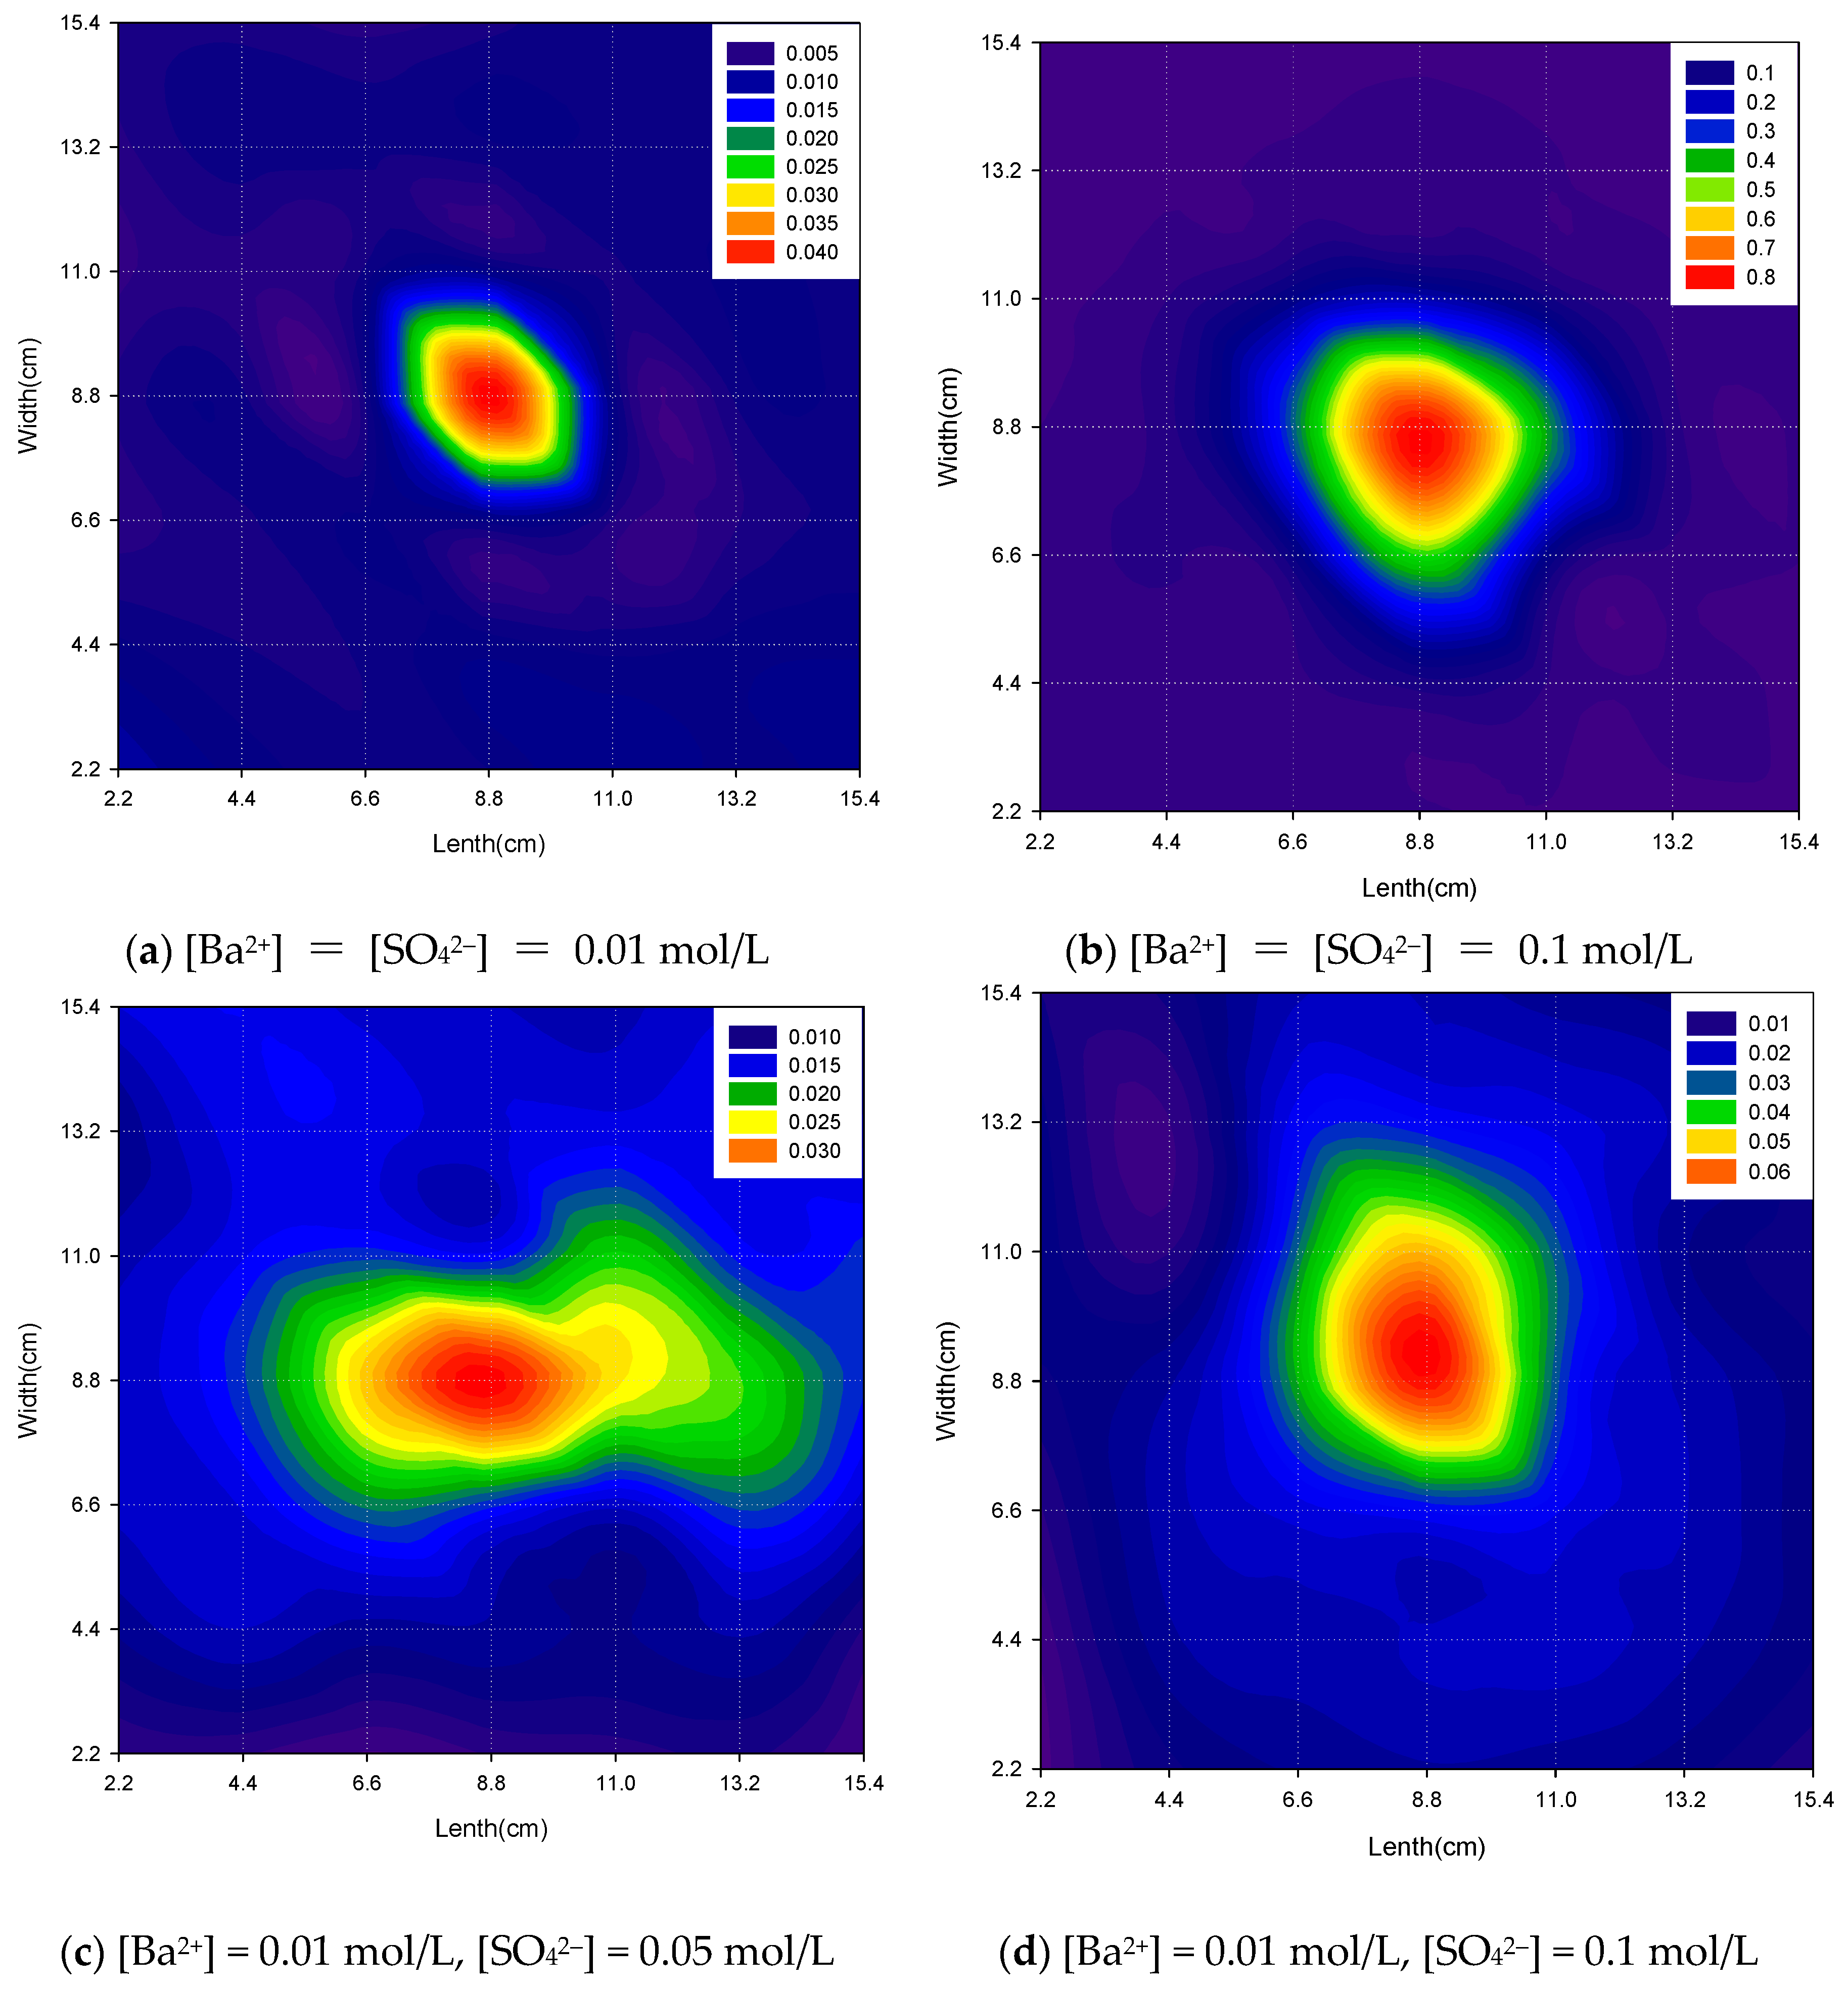
3.1.3. Effect of Solution Concentrations

Figure 5 shows the relationship between precipitation distribution and different ion concentrations containing Ba2+ and SO42−. When the ion concentration containing Ba2+ and SO42− was between 0.1 mol/L and 0.01 mol/L (Figure 5a,b), the distribution pattern of the precipitate was basically the same as that at 0.1 mol/L, which was hill-shaped. It mainly accumulated near the injection point, but the distribution range was smaller, and the deposition height was also reduced by more than 10 times because the concentration of Ba2+ and SO42− in the solution was different, resulting in a difference in the rate of crystal generated after the reaction, affecting the amount of precipitated particles. It can be seen that the higher the concentration, the more precipitated particle generation, such that the extent and height of sedimentation will be better.
After adjusting the Ba2+ and SO42− ratio from 1:1 to 1:5 and 1:10 (Figure 5c,d), the precipitation distribution at 1:5 and 1:10 under the same injection conditions showed much more dispersion than that at a 1:1 ion concentration ratio, and the degree of random drift of the precipitate in water was larger compared to the distribution at 1:1. The results indicate that the difference in concentration between Ba2+ and SO42− affects the size of precipitated particles. The larger the concentration difference, the smaller the generation of precipitated particles, which tend to drift with water, so the range of sedimentation is wider.

3.1.4. Gas-Field Water Experiment

As can be seen from Figure 6, after injection of the gas-field water, the generated precipitate was thicker in the center and gradually spread to the periphery. The sedimentation distribution was generally hill-shaped with certain regularity. However, because of the lower ion concentration, the total amount of precipitation was less. Therefore, it is essential to utilize water produced from the gas field properly and to set up a proper ion concentration, leading to ion precipitation generated by the reaction so that the water can be blocked in situ to achieve gas production.

3.2. Core Displacement Experiments

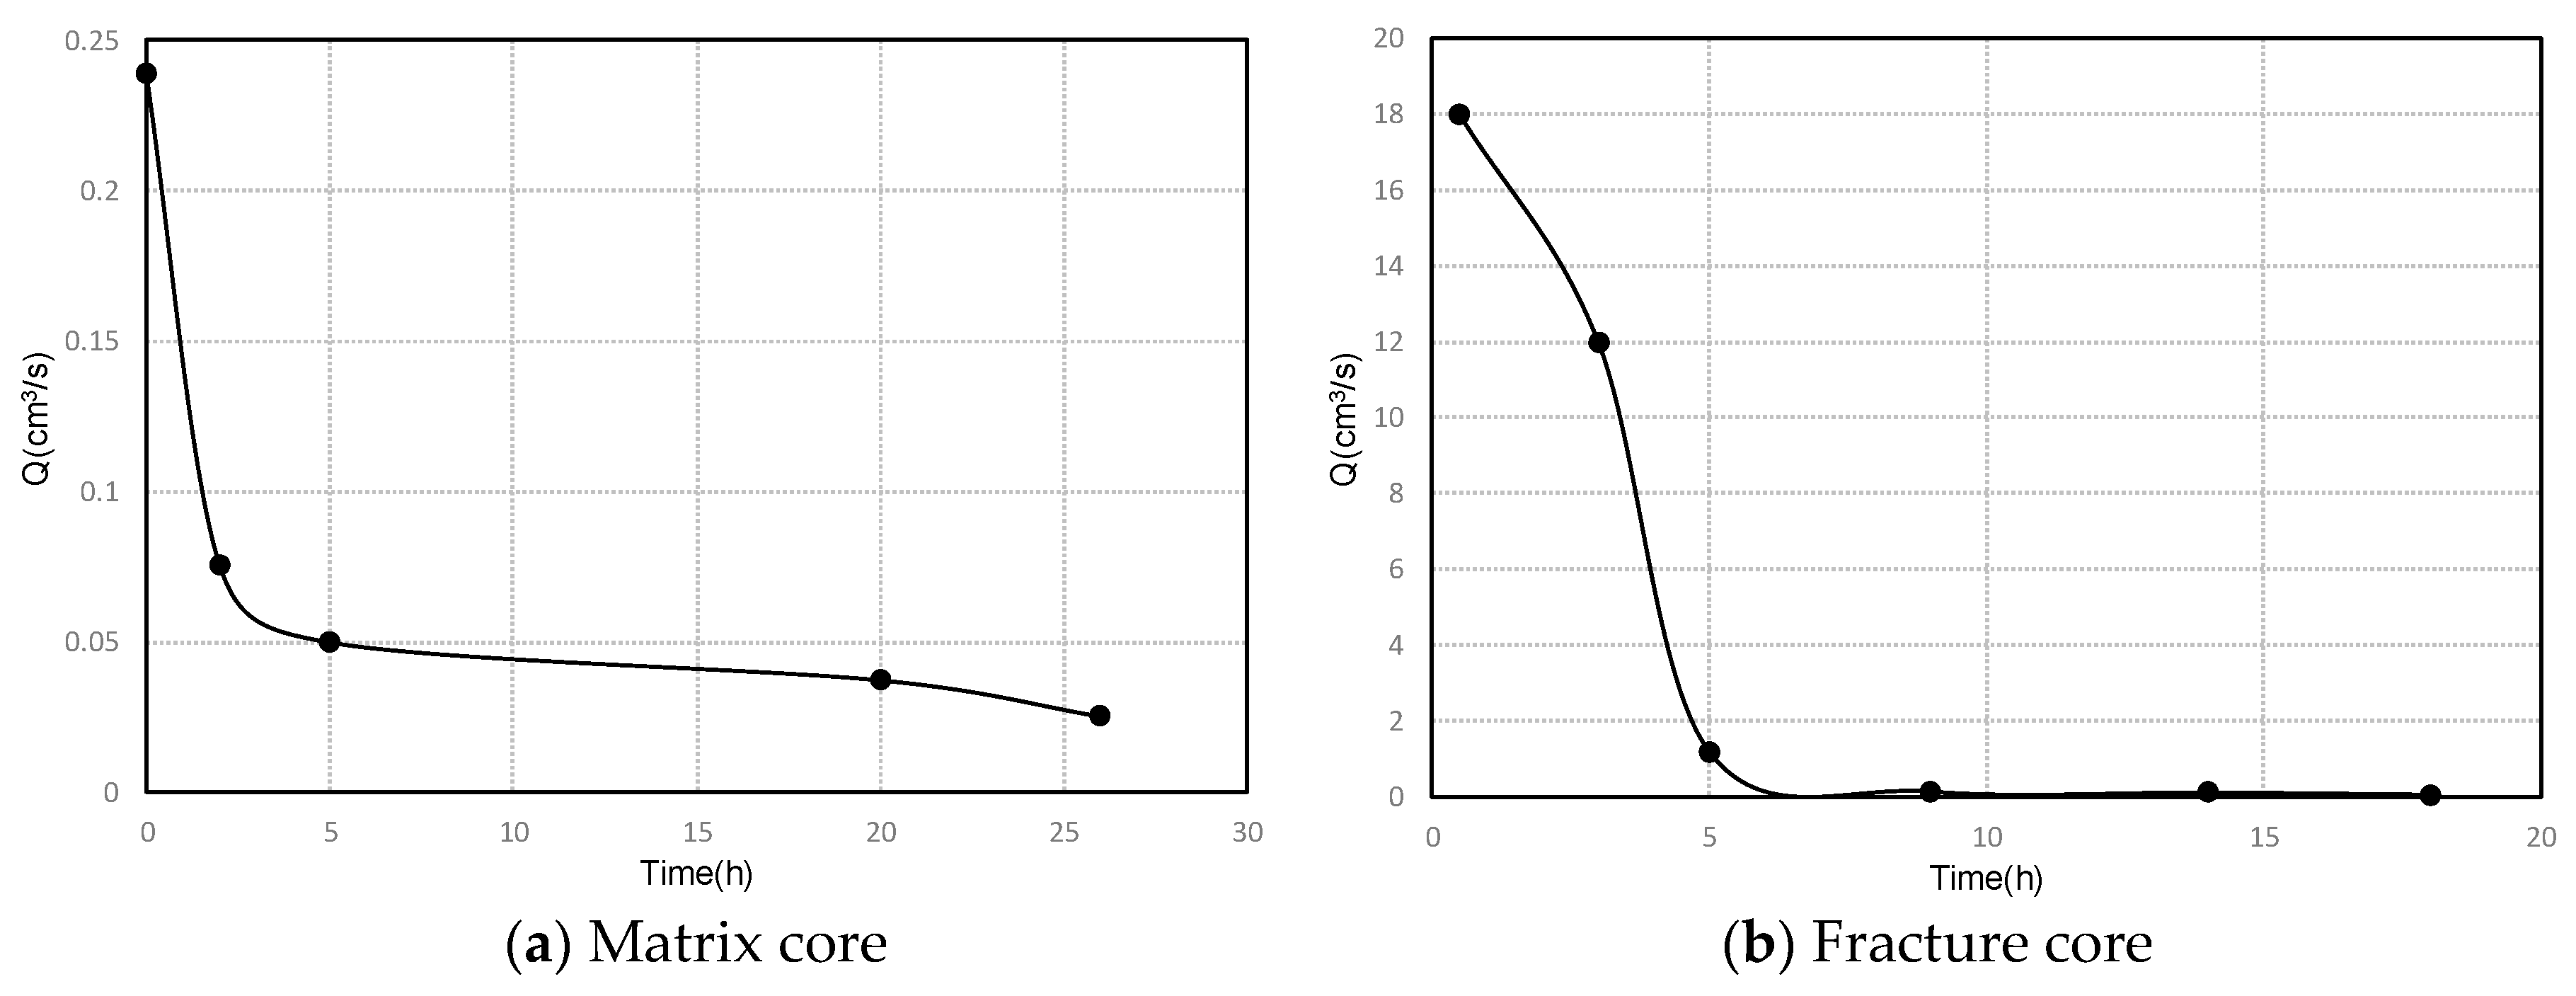
3.2.1. Flooding Experiments at Constant Pressure

The flow rate change of the fluid injected into the core at constant pressure is shown in Figure 7; the injection fluid rate was greatly reduced as the injection time increased. In the initial stage, the injection speed decreased rapidly. As the injection time increased, the decreasing trend tended to be flat and basically stable, indicating that the accumulation of ion precipitation achieved saturation. Figure 7a displays the relationship between the injection flow rate of the matrix core and time at 31.8 MPa. As can be seen in this figure, after 5 hours of water injection, the injection rate decreased from 0.2388 cm3/s to 0.0498 cm3/s, a reduction of 79%. For the fracture core (Figure 7b), the injection rate decreased from 18 cm3/s to 1.2 cm3/s after 5 hours of water injection, a decrease of 93.3%. These findings reflect the changing process of ion precipitation on the dynamic blocking of the core infiltration channel. When the two different types of gas-field water are in contact, a chemical reaction occurs and generates ion precipitation that blocks the core infiltration channels and increases the injection resistance, resulting in a significant decrease in the injection rate. In addition, compared to the matrix core, the fracture core with better permeability has faster fluid injection, so the reactive ions are more easily contacted, and the number of contacts is large, resulting in increased reaction intensity, more ion precipitation, and a remarkable blocking effect.

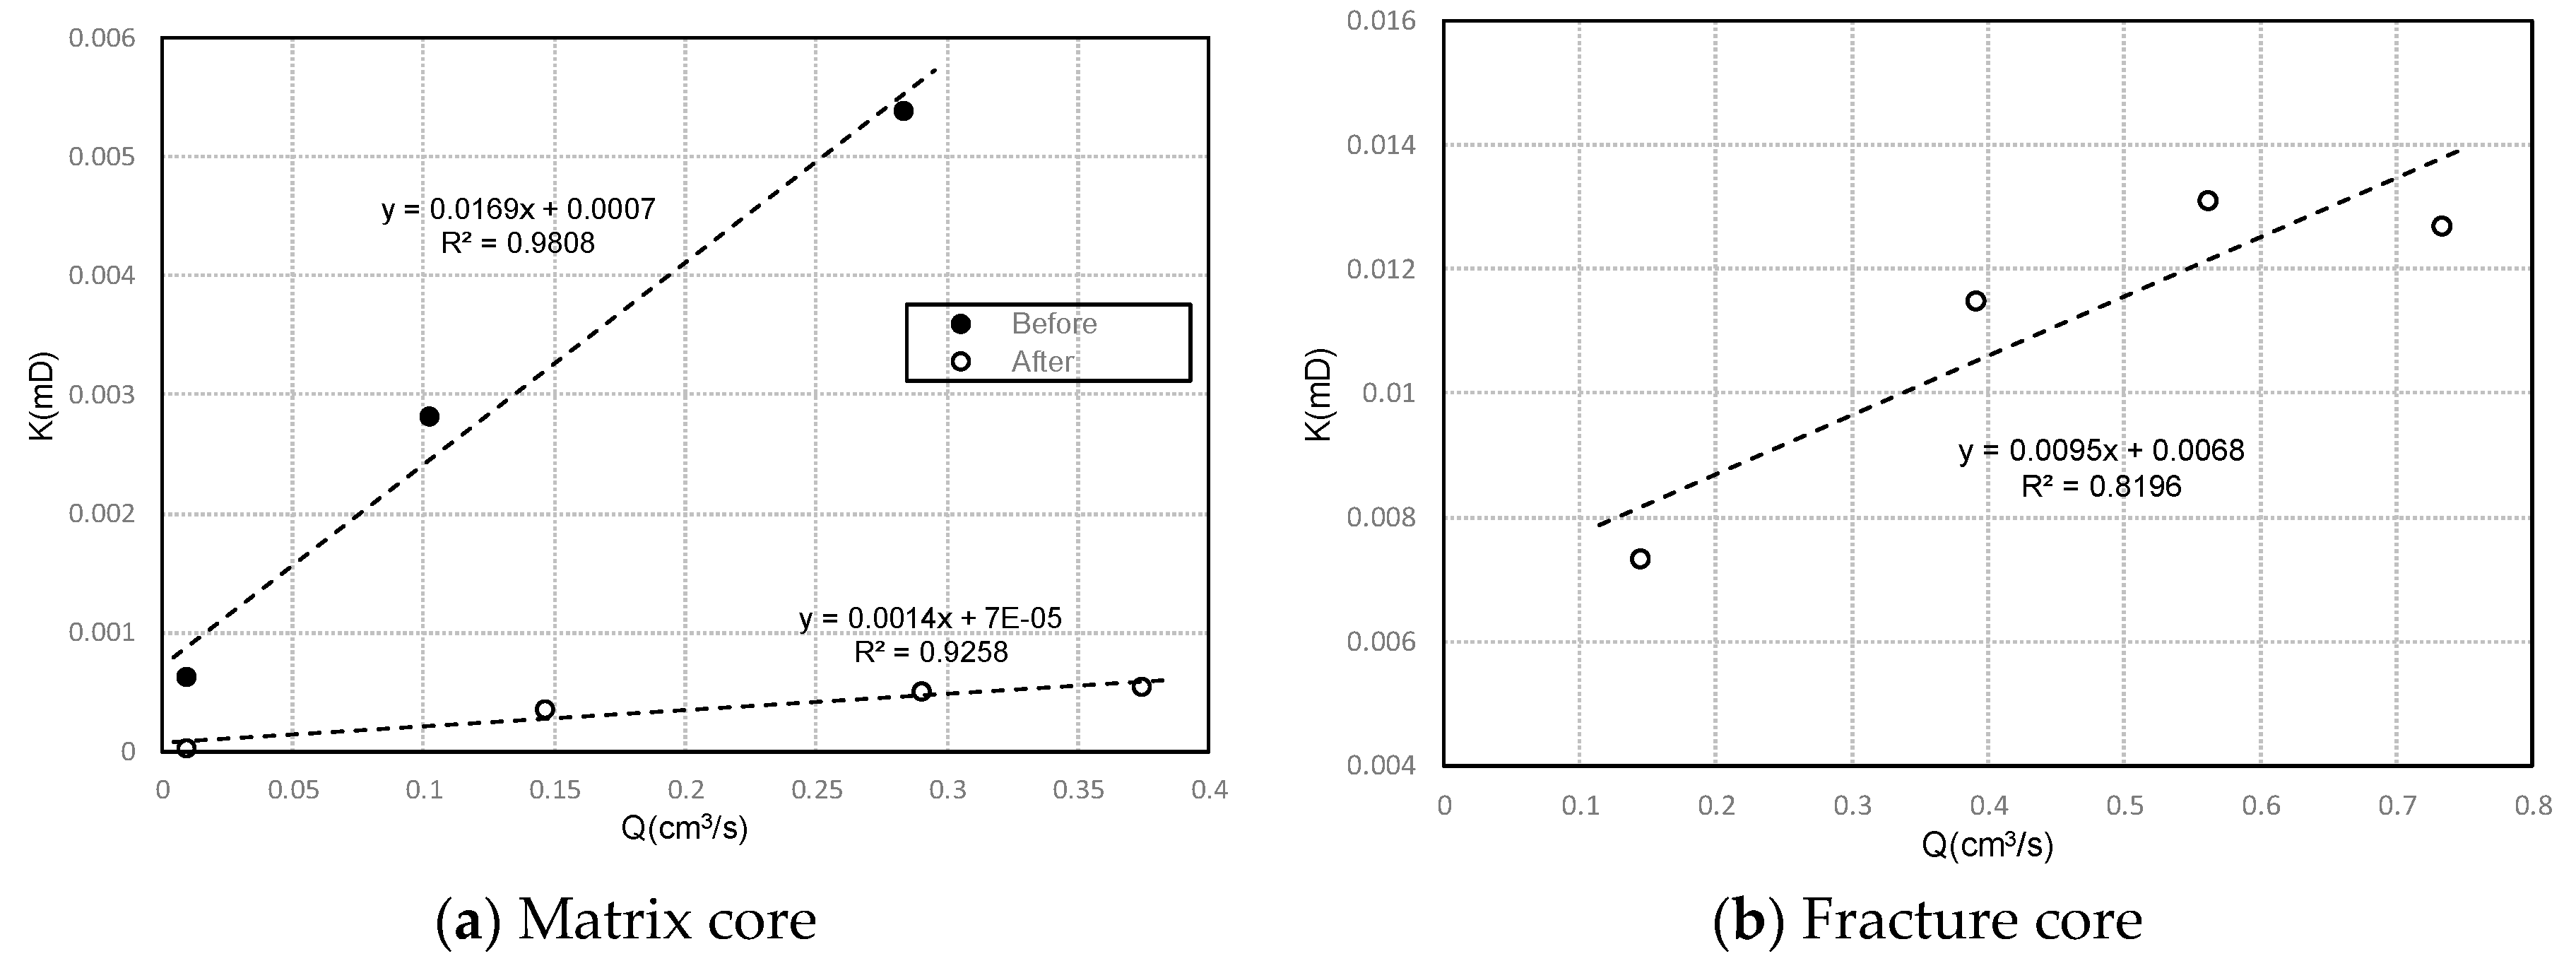
3.2.2. Effect of Ion Precipitation on Permeability

It can be seen from the displacement results (Figure 8) that the core permeability changed significantly after water injection compared with before water injection. For the matrix core (Figure 8a), the core permeability was measured to be 0.0007 mD before water injection, and it was reduced to 0.00007 mD after water injection, a reduction of 10 times. For the fracture core (Figure 8b), the permeability was considered to be infinite compared to the matrix core before water injection. After water injection, it was reduced to 0.0068 mD. It is precisely because of the chemical reaction between the two solutions after the water injection that the generated ion precipitate blocks the permeation channel of the porous medium—and the blocking effect of the ion precipitation is obvious whether it is the matrix core or the fracture core.

3.2.3. Comparing Experiments of Starting Pressure

Compared with the core starting pressure before gas-field water injection, it can be seen from the results of water flooding that the core starting pressure changed significantly after water injection (Figure 9). For the matrix core (Figure 9a), the starting pressure gradient of the core was 1.2308 MPa/cm before water injection, and it rose to 3.6791 MPa/cm after water injection, an increase of 2.9 times. For the fracture core (Figure 9b), the starting pressure before water injection is negligible compared to the matrix core. After the water injection, the pressure gradient increased to 0.196 MPa/cm, and the starting pressure increased significantly. Because of the chemical reaction between the two solutions after gas-field water injection, the generated ion precipitate blocks the permeation channel of the porous medium, leading to an increase in the seepage resistance of the fluid in the matrix and the crack, causing an increase in the starting pressure. Thus, ion precipitation has a significant effect on the blocking of the porous medium.

4. Conclusions

In this study, water shutoff technology using in-situ ion precipitations was investigated by experimental study. The following five conclusions can be drawn from this study:
(1) Water shutoff technologies are important treatments for gas-field development. At present, most applications use chemical methods such as polymer gels and adsorbed polymers. Although certain positive effects have been obtained, water shutoff also causes blocking of the gas layer, and the high cost of chemical agents limits the application of such technologies.
(2) From the development of a gas field in southwest China, this paper proposes a water shutoff technology with in-situ ion precipitation for gas reservoirs that can use formation water to block the water layer in situ. This method not only reduces the gas production cost, but also prevents the environmental problems caused by the disposal of excessive unwanted formation water.
(3) According to the mechanism of ion precipitation distribution, it was observed that the precipitate is usually thicker at the center of the injection, and as the distance increases, it gradually decreases. The precipitation distribution is related to the injection flow rate, injection height, and ion concentration. The lower the injection flow rate, the closer the settlement to the injection point; and the higher the injection height, the more dispersed the distribution. In addition, the larger the difference in ion concentration, the smaller the generation of precipitated particles and the wider the range of sedimentation.
(4) The core displacement experiment showed that during the water injection process, the ion precipitate generated by the ion reaction constantly blocks the seepage channel, resulting in a significant decrease in the injection rate. After water injection, the permeability of the matrix core decreased by 10 times and the starting pressure gradient increased by 2.9 times. The permeability of the fracture core decreased to 0.0068 mD, and the starting pressure gradient increased to 0.196 MPa/cm. Ion precipitation has a significant effect on the blocking effect of both the matrix and the fracture core.
(5) From the experimental results, the water shutoff technology with in-situ ion precipitation proposed in this paper is feasible in southwest China and can provide technical guidance for the development of other reservoirs. It is recommended to conduct field experiments to obtain more technical support.

Author Contributions

Conceptualization, X.Z. and W.L.; Methodology, L.Y. and X.Z.; Validation, P.Y.; Formal Analysis, P.Y.; Investigation, X.Z. and P.Y.; Resources, X.Z.; Data Curation, W.L.; Writing—Original Draft Preparation, X.Z.; Writing—Review & Editing, X.Z. and P.Y.

Funding

The authors would like to acknowledge the Scientific and Technological Research Program of Chongqing Municipal Education Commission (Grant No. KJ1501335) for its technical and financial support.

Acknowledgments

This work was supported by the Scientific and Technological Research Program of Chongqing Municipal Education Commission (Grant No. KJ1501335) for its technical and financial support.

Conflicts of Interest

The authors declare no conflict of interest.

References

  1. Lea, J.F.; Nickens, H.V. Solving Gas-Well Liquid-Loading Problems. J. Pet. Technol. 2004, 56, 30–36. [Google Scholar] [CrossRef]
  2. Coleman, S.B.; Clay, H.B.; McCurdy, D.G.; Norris, L.H. A New Look at Predicting Gas-Well Load-Up. J. Pet. Technol. 1991, 43, 329–333. [Google Scholar] [CrossRef]
  3. Guo, B.; Ghalambor, A.; Xu, C. A Systematic Approach to Predicting Liquid Loading in Gas Wells. SPE Prod. Oper. 2005, 21, 81–88. [Google Scholar]
  4. Yusuf, R.; Group, S.P.T.; Veeken, K.; Hu, B. Investigation of Gas Well Liquid Loading with a Transient Multiphase Flow Model. In Proceedings of the SPE Oil and Gas India Conference and Exhibition, Mumbai, India, 20–22 January 2010. [Google Scholar]
  5. Lea, J.F., Jr.; Tighe, R.E. Gas Well Operation with Liquid Production. In Proceedings of the SPE Production Operations Symposium, Oklahoma City, OK, USA, 27 February–1 March 1983. [Google Scholar] [CrossRef]
  6. Oyewole, P.O.; Lea, J.F.; Llc, P.L.T.; Swabing, W.; Ejector, D.E. Artificial Lift Selection Strategy for the Life of a Gas Well with some Liquid Production. In Proceedings of the SPE Annual Technical Conference and Exhibition, Denver, CO, USA, 21–24 September 2008. [Google Scholar] [CrossRef]
  7. Boswell, J.T.; Hacksma, J.D. Controlling Liquid Load-Up With “Continuous Gas Circulation”. In Proceedings of the SPE Production Operations Symposium, Oklahoma City, OK, USA, 9–11 March 1997; pp. 325–332. [Google Scholar] [CrossRef]
  8. Willis, M.J.; Horsup, D.I.; Nguyen, D.T. Chemical Foamers for Gas Well Deliquification. In Proceedings of the SPE Asia Pacific Oil and Gas Conference and Exhibition, Perth, Australia, 20–22 October 2008. [Google Scholar] [CrossRef]
  9. Tang, Y.; Liang, Z. A New Method of Plunger Lift Dynamic Analysis and Optimal Design for Gas Well Deliquification. In Proceedings of the SPE Annual Technical Conference and Exhibition, Denver, CO, USA, 21–24 September 2008. [Google Scholar] [CrossRef]
  10. Tang, Y. Plunger Lift Dynamic Characteristics in Single Well and Network System for Tight Gas Well Deliquification. In Proceedings of the SPE Annual Technical Conference and Exhibition, New Orleans, LA, USA, 4–7 October 2009. [Google Scholar] [CrossRef]
  11. Gilbert, W. Flowing and gas-lift well performance. In Proceedings of the Drilling and Production Practice, New York, NY, USA, 1 January 1954; pp. 126–157. [Google Scholar]
  12. Hearn, W. Gas Well Deliquification Application Overview. In Proceedings of the Abu Dhabi International Petroleum Exhibition and Conference, Abu Dhabi, UAE, 1–4 November 2010. [Google Scholar] [CrossRef]
  13. Hutchins, R.D.; Dovan, H.T.; Sandiford, B.B. Field Applications of High Temperature Organic Gels for Water Control. In Proceedings of the SPE/DOE Improved Oil Recovery Symposium, Tulsa, OK, USA, 21–24 April 1996. [Google Scholar] [CrossRef]
  14. Al-Muntasheri, G.A.; Sierra, L.; Garzon, F.O.; Lynn, J.D.; Izquierdo, G.A. Water Shut-off With Polymer Gels in a High Temperature Horizontal Gas Well: A Success Story. In Proceedings of the SPE Improved Oil Recovery Symposium, Tulsa, OK, USA, 24–28 April 2010. [Google Scholar] [CrossRef]
  15. Zaitoun, A.; Kohler, N.; Marrast, J.; Guerrini, Y. On the use of polymers to reduce water production from gas wells. In Situ 1990, 14, 133–146. [Google Scholar]
  16. Avery, M.R.; Wells, T.A.; Chang, P.W.; Millican, J.D. Field Evaluation of a New Gelant for Water Control in Production Wells. In Proceedings of the SPE Annual Technical Conference and Exhibition, Houston, TX, USA, 2–5 October 1988. [Google Scholar] [CrossRef]
  17. Zaitoun, A.; Kohler, N. Two-Phase Flow Through Porous Media: Effect of an Adsorbed Polymer Layer. In Proceedings of the SPE Annual Technical Conference and Exhibition, Houston, TX, USA, 2–5 October 1988. [Google Scholar] [CrossRef]
  18. Lakatos, I.; Tóth, J.; Kosztin, B. Application of Silicone Microemulsion for Restriction of Water Production in Gas Wells. In Proceedings of the European Petroleum Conference, Aberdeen, UK, 29–31 October 2002. [Google Scholar] [CrossRef]
  19. Chaabouni, H.; Enkababian, P.G.; Chan, K.S.; Cheneviere, P.; Falxa, P.; Urbanczyk, C. Successful Innovative Water Shutoff Operations in Low-Permeability Gas Wells. In Proceedings of the SPE Middle East Oil and Gas Show and Conference, Manama, Bahrain, 11–14 March 2007. [Google Scholar] [CrossRef]
Figure 1. Ion precipitation distribution test device diagram.
Energies 12 03881 g001
Figure 2. Schematic diagram of the core displacement device.
Energies 12 03881 g002
Figure 3. Ion precipitation contour distribution at different injection rates.
Energies 12 03881 g003
Figure 4. Ion precipitation contour distribution at different injection heights.
Energies 12 03881 g004
Figure 5. Ion precipitation contour distribution at different ion concentrations.
Energies 12 03881 g005
Figure 6. Ion precipitation contour distribution of southwest China gas-field water, cm.
Energies 12 03881 g006
Figure 7. The relationship between injection flow rate and time, pressure = 3.8 MPa.
Energies 12 03881 g007
Figure 8. Comparison of core permeability before and after water injection.
Energies 12 03881 g008
Figure 9. Comparison of starting pressure before and after water injection.
Energies 12 03881 g009
Table 1. Ion content of formation water from southwest China, mg/L.
WellNa+ + K+Ca2+Mg2+Ba2+ClSO42−HCO3CO32−OHPH
Well-I273891619455879475560385006.56
Well-II3331823261586059693347260006.38
Table 2. Characteristics of cores.
Core No.Length (cm)Diameter (cm)Porosity (%)Permeability (mD)Crack Volume (cm3)
15.3462.452.360.0007-
252.45--1.12

