Article

Product Characteristics of Torrefied Wood Sawdust in Normal and Vacuum Environments

1
Department of Aeronautics and Astronautics, National Cheng Kung University, Tainan 701, Taiwan
2
Department of Mechanical Engineering, National Chin-Yi University of Technology, Taichung 411, Taiwan
3
Research Center for Energy Technology and Strategy, National Cheng Kung University, Tainan 701, Taiwan
4
Department of Mechanical Engineering, Faculty of Engineering, University of Malaya, Kuala Lumpur 50603, Malaysia
5
Department of Chemical and Environmental Engineering, Faculty of Engineering, University of Nottingham Malaysia Campus, Jalan, Broga, Semenyih 43500, Selangor Darul Ehsan, Malaysia
*
Author to whom correspondence should be addressed.
Energies 2019, 12(20), 3844; https://doi.org/10.3390/en12203844
Submission received: 1 September 2019 / Revised: 3 October 2019 / Accepted: 4 October 2019 / Published: 11 October 2019
(This article belongs to the Special Issue Biomass Processing for Biofuels, Bioenergy and Chemicals)

Abstract

:
To investigate the efficacy of torrefaction in a vacuum environment, wood sawdust was torrefied at various temperatures (200–300 °C) in different atmospheres (nitrogen and vacuum) with different residence times (30 and 60 min). It was found that the amount of biochar reduced at the same rate—regardless of atmosphere type—throughout the torrefaction process. In terms of energy density, the vacuum system produced biochar with better higher heating value (HHV, MJ/kg) than the nitrogen system below 250 °C. This was the case because the moisture and the high volatility compounds such as aldehydes diffused more easily in a vacuum. Over 250 °C, however, a greater amount of low volatility compounds evaded from the vacuum system, resulting in lower higher heating value in the biochar. Despite the mixed results with the solid products, the vacuum system increased the higher heating value of its liquid products more significantly than did the nitrogen system regardless of torrefaction temperature. It was found that 23% of the total energy output came from the liquid products in the vacuum system; the corresponding ratio was 19% in the nitrogen system. With liquid products contributing to a larger share of the total energy output, the vacuum system outperformed the nitrogen system in terms of energy density.

Graphical Abstract

1. Introduction

Anthropogenic carbon dioxide emissions have a notable impact on both human society and the ecosystem [1,2,3]. As part of an ongoing effort to mitigate carbon dioxide emissions worldwide, bioenergy has achieved wide applicability [4,5]. Compared to other sources of renewable energy, bioenergy has major advantages in storage and applications because biomass can be stored and extracted in different phases [6]. In the solid phase, biomass can be processed into powder, pellets, blocks, and briquettes through thermal decomposition [7]. In the liquid phase, on the other hand, it can be processed into biodiesel, bioethanol, and bio-oil through thermal decomposition or liquefaction [8,9,10]. All of these products have wide industrial applicability [11,12,13].
Torrefaction is a type of pyrolysis, where biomass is thermally degraded in an inert system under atmospheric conditions at temperatures of 200–300 °C. The final product is called torrefied biomass (i.e., biochar) [14]. The process can be categorized into light, mild, and severe types according to the temperature ranges of 200–235 °C, 235–275 °C, and 275–300 °C, respectively [13]. It is also used as a method of pretreatment aimed at improving the physical, chemical, and biochemical characteristics of raw biomass [15]. Through torrefaction, raw biomass is upgraded to biochar, which exhibits better hydrophobicity, lower moisture content, better grinding property, and better higher heating value (HHV) [16]. Biochars are also easier to handle and store and more suitable for combustion and gasification than raw biomass. According to Santos et al. [17], biochars produced at high torrefaction temperature have an energy density comparable to low-rank coal, which is better than raw biomass. These biochars have less toxicity associated with emissions from combustion, more homogeneous combustion behavior, higher grinding ability, and lower hygroscopicity [18]. The said characteristics make biochar an ideal alternative to coal and solid fuels [19,20]. Thus, biochars have been dubbed as “solid fuels” [21,22].
Aside from solid biochars, torrefaction also generates liquid and gaseous products [23,24]. During torrefaction, the release and thermal decomposition of high volatility compounds from biomass produce non-condensable gases such as CO, CO2, and H2 in addition to small amounts of CH4 [25,26], toluene, benzene, and low molecular weight hydrocarbons [27]. Depending on the torrefaction temperature, brown or black-colored liquid products are generated, consisting of condensable components such as water, acetic acid, alcohols, aldehydes, and ketones. Elliott’s [28] analysis of the liquid products from gas chromatography-mass spectrometry (GC–MS) suggests that the main components in the liquid are monoaromatics.
The vacuum—also known as “low pressure”—technology has been used for the manufacturing of semiconductors, flat-panel displays, solar power panels, and scientific instrumentation. In the food and pharmaceutical industries, several manufacturing processes require gas pressure well below the atmospheric pressure. However, such a technology has yet to be applied to torrefaction. Only a few studies have tackled torrefaction in a vacuum. Lin et al. [29] investigated the thermal degradation of various wood species under vacuum and reported how different lignocellulosic components behave under different temperature conditions (200–230 °C, 0.2 °C min−1, 200 hPa). Garcia-Perez et al. [30] used softwood and hardwood species in a vacuum pyrolysis pilot plant and characterized the resulting products. Murwanayashka et al. [31] carried out vacuum pyrolysis (8–15 kpa, 500 °C, 12 °C min−1) of birch derived biomass and observed the evolution of phenols during the process. They reported that vacuum minimized the extent of secondary reactions during pyrolysis (1.3 kPa, 450 °C), facilitating a more uniform product. Pakdel and Roy [32] used vacuum pyrolysis to extract steroids from common lignocellulosic materials during thermal treatment, facilitating an easier extraction and further modification of steroids.
Although torrefaction has been performed conventionally in a nitrogen environment as a medium of convection for torrefied compounds, this study sets out to explore the potential advantages of torrefaction in a vacuum environment. One of the objectives is to assess whether a vacuum environment is able to increase the energy density of torrefied materials through diffusion rather than atmosphere-based convection.

2. Materials and Methods

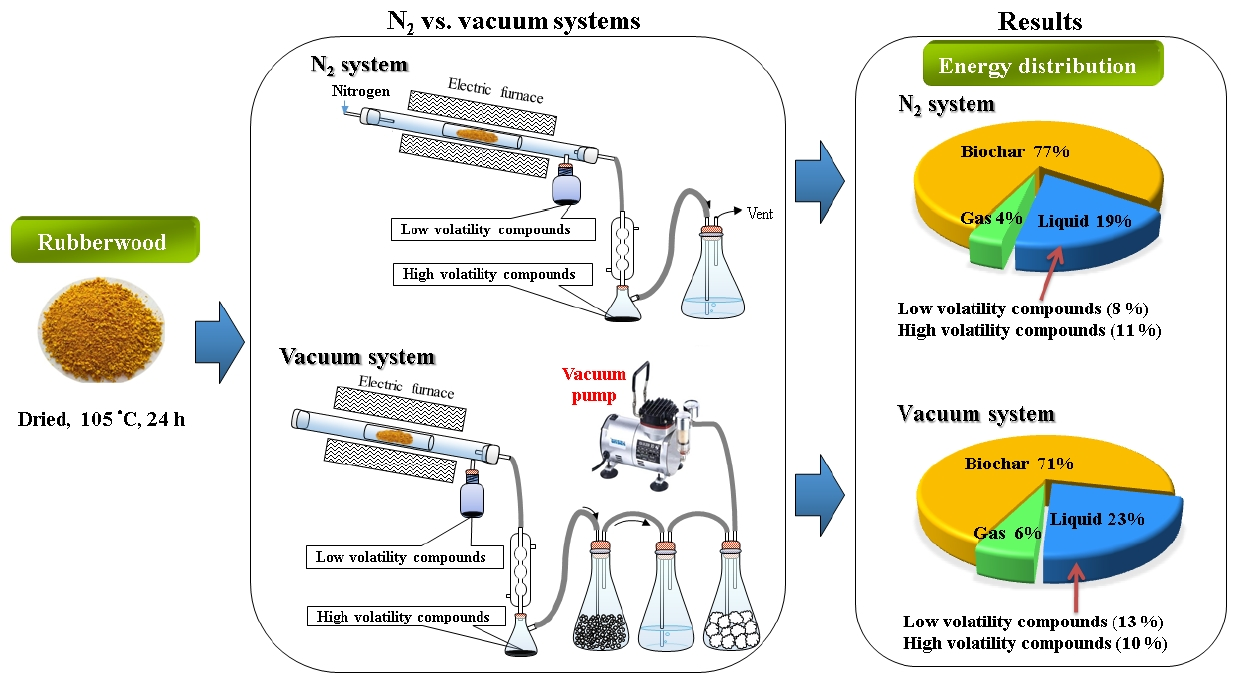
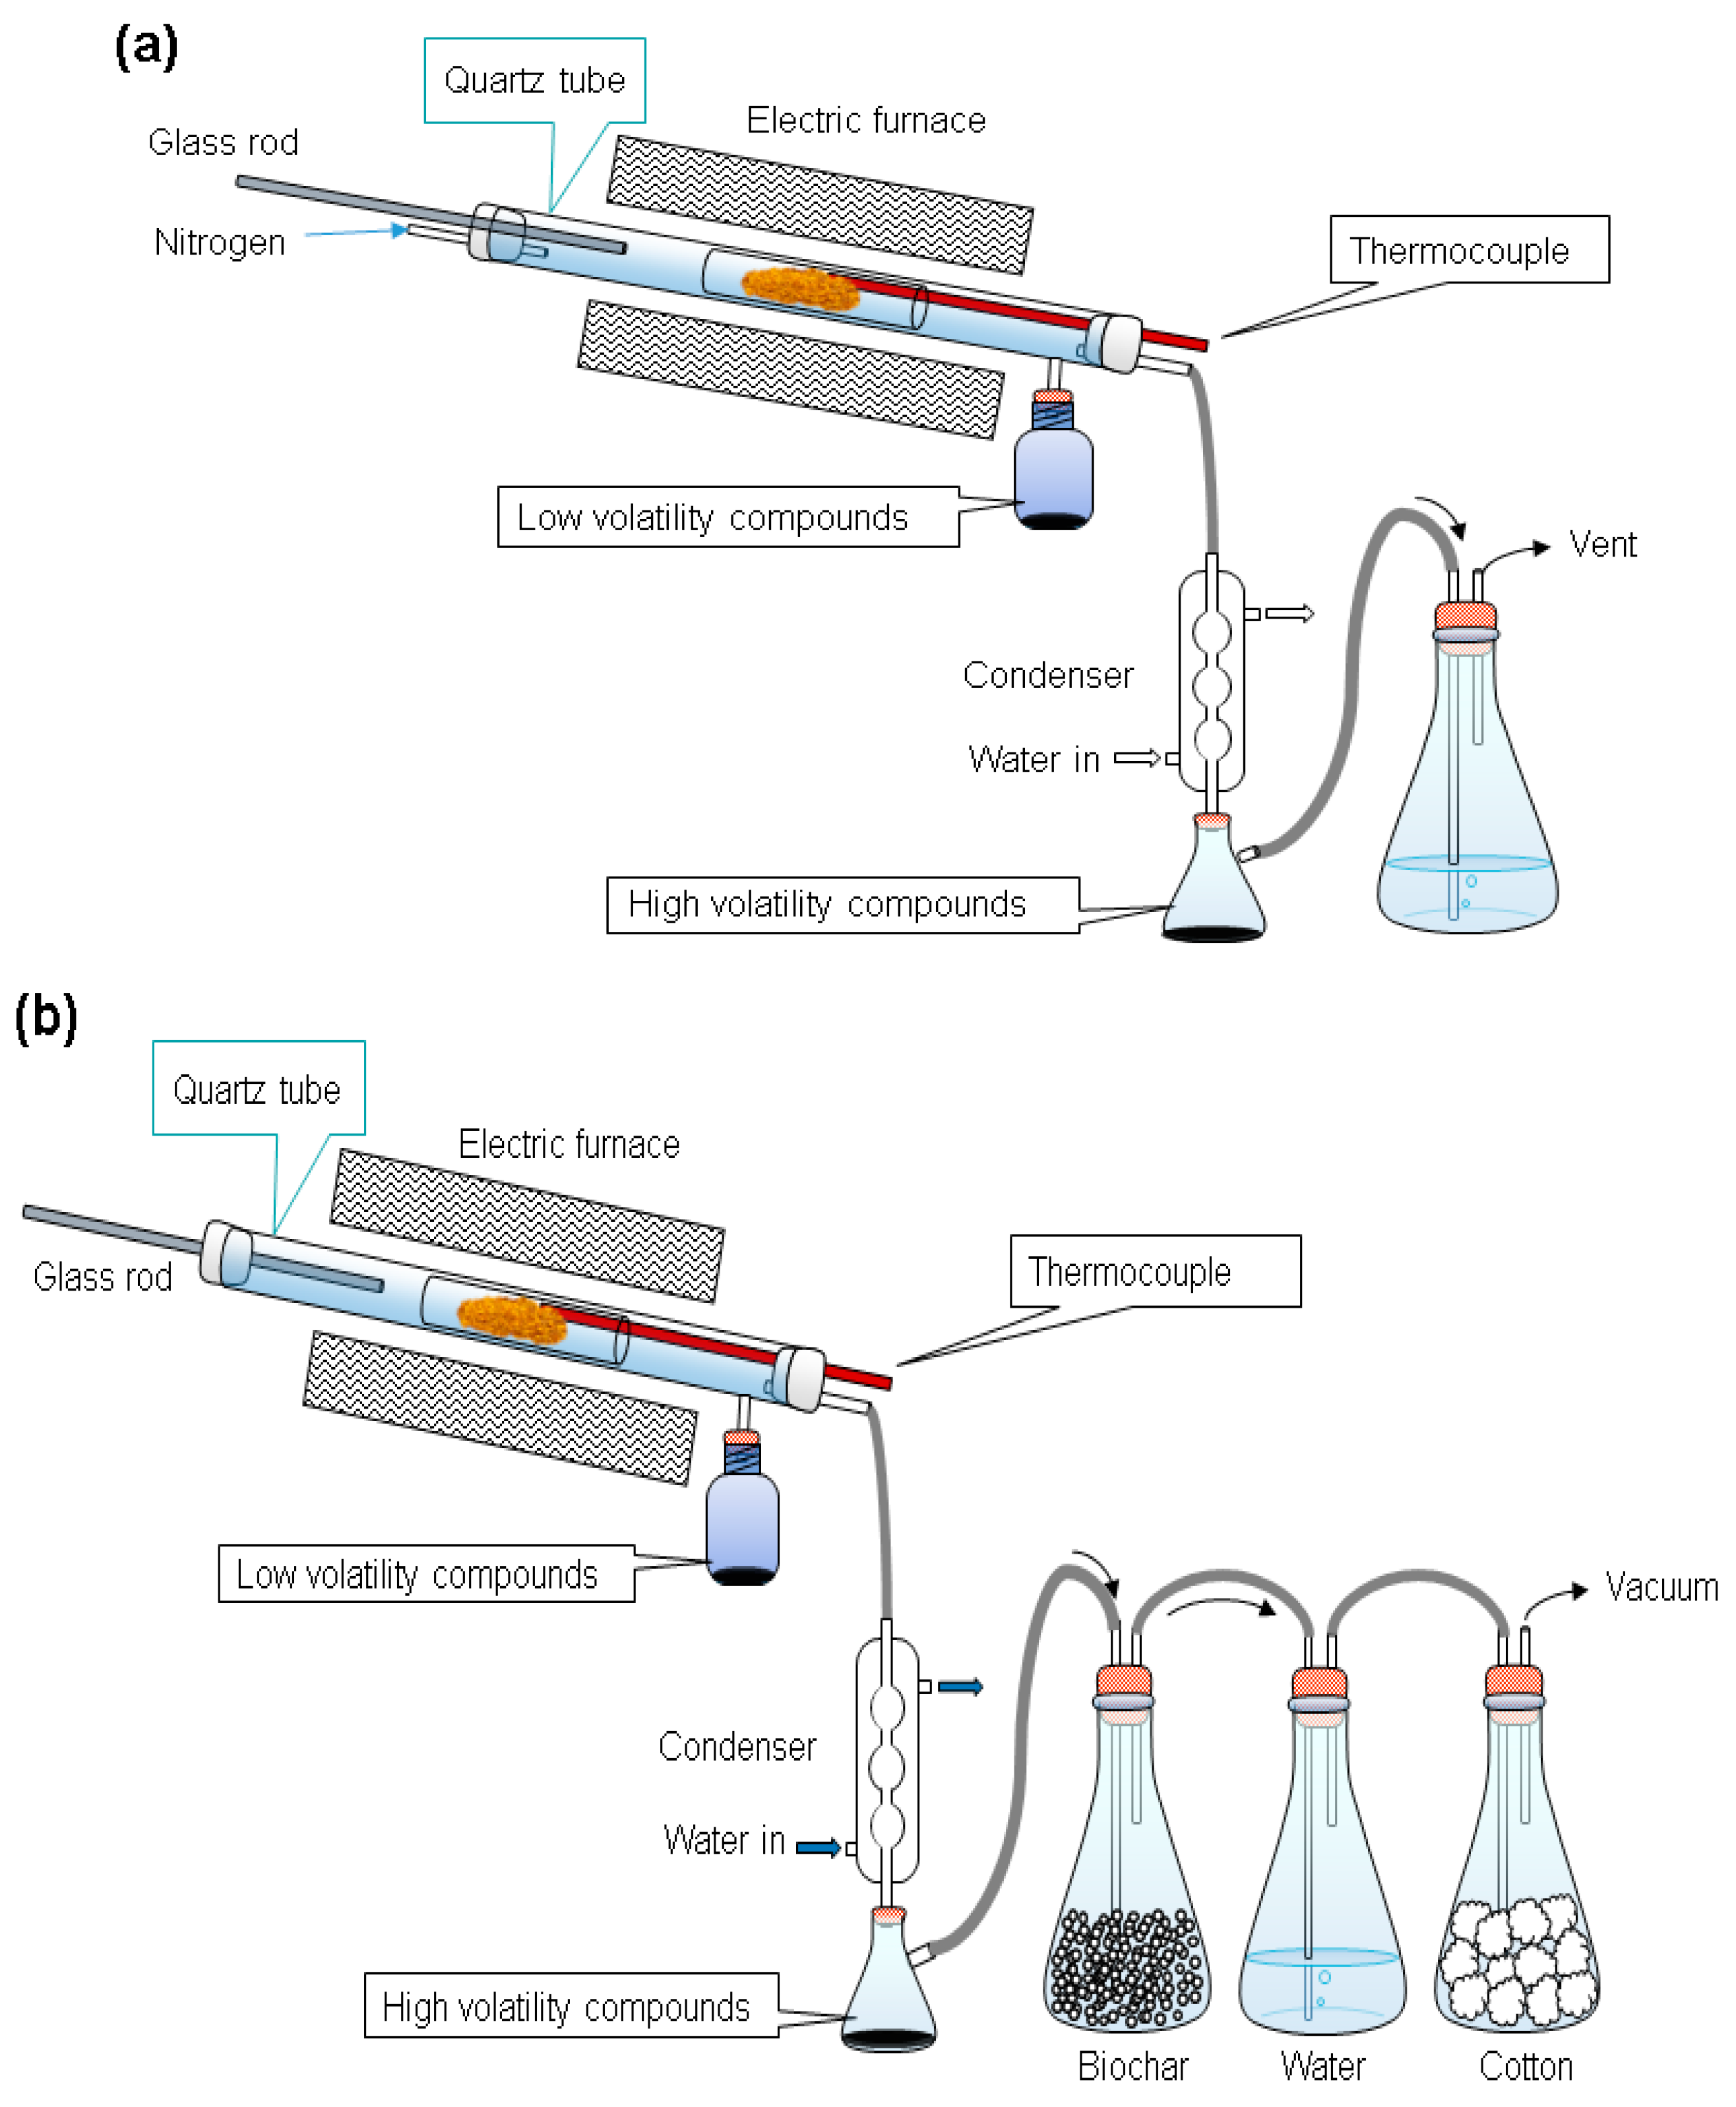
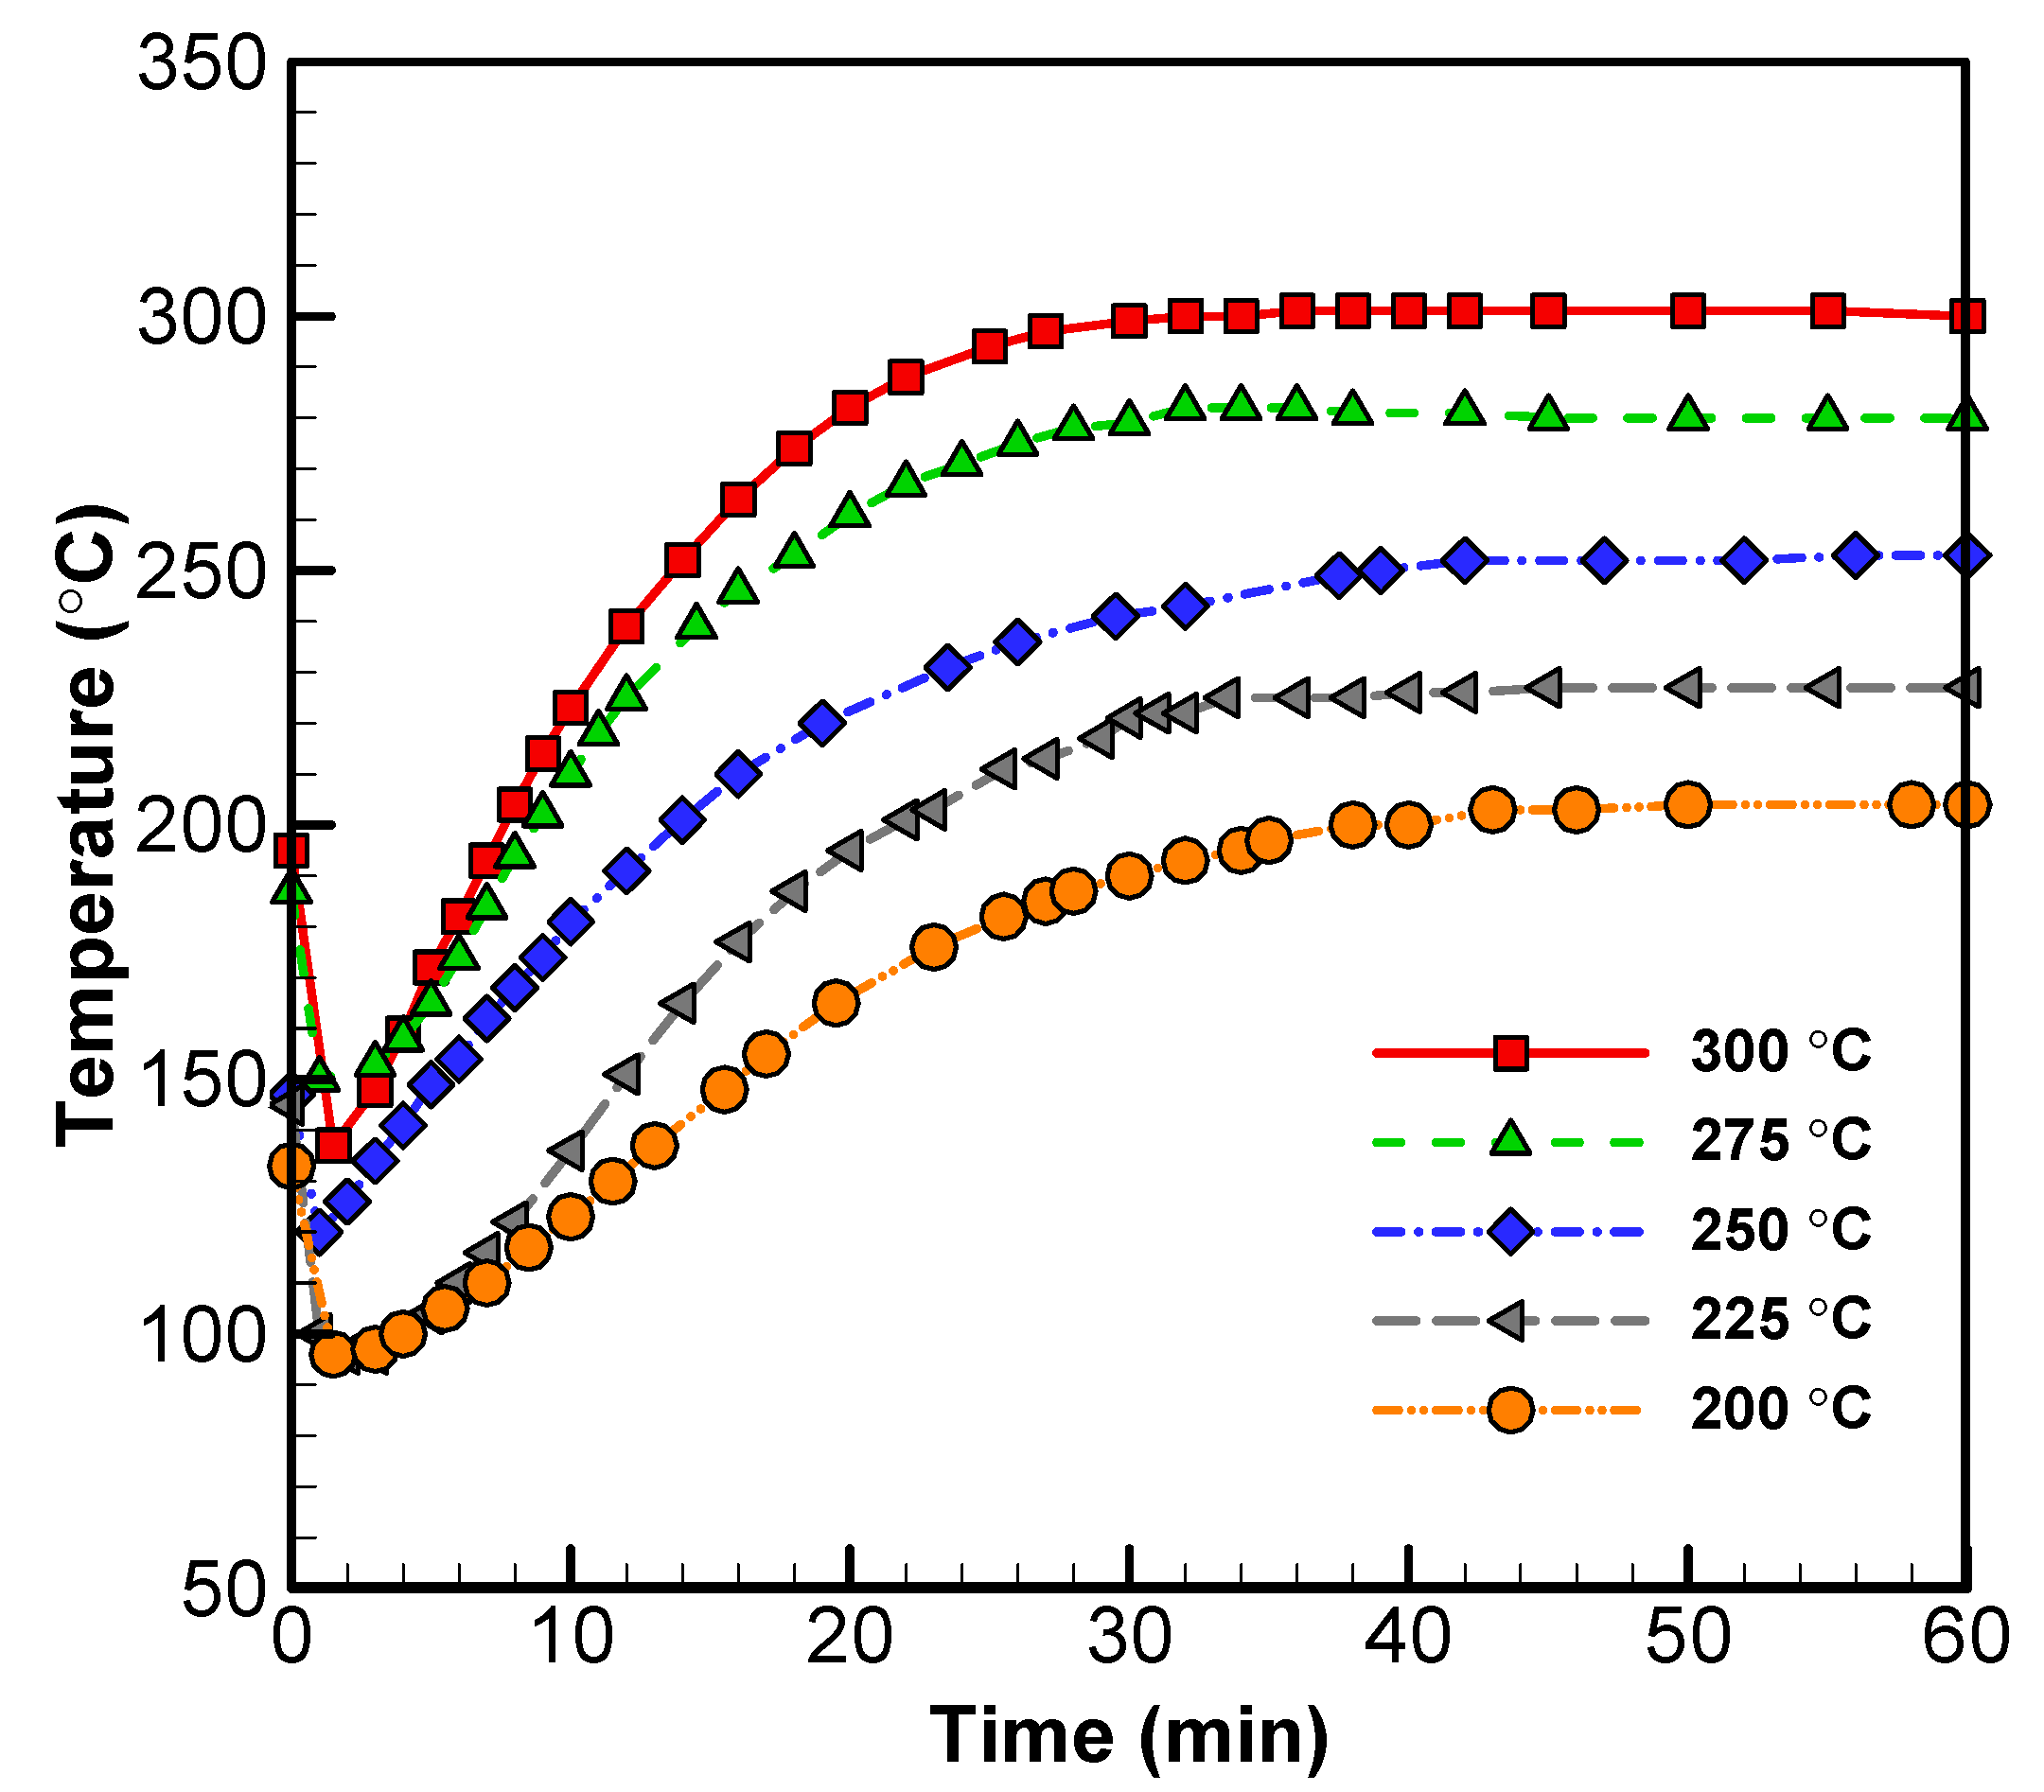
2.1. Parameters for Torrefaction with a Vacuum and a Nitrogen System

The biomass used in this study was rubber wood obtained from Chinese Petroleum Corporation (CPC) in Taiwan. Every batch of the wood sawdust used in our experiments was ground by a crusher and shredded in a 100 mesh. After shredding and sieving, the raw material was dried in a convection oven at 105 °C for 24 h to eliminate the moisture and provide an experimental basis. This drying process was aimed at minimizing experimental error. The dried material was then kept in air-tight plastic sample boxes to prevent moisture absorption before samples were taken and used in experiments on the same day. A sample weight (30 g) of wood sawdust was placed in a sample glass tube mounted to the reactor. The furnace was preheated to the torrefaction temperature (200–300 °C), then the sample glass tube was rapidly pushed into the reactor using a glass rod [33]. The wood sawdust was torrefied at 200, 225, 250, 275, and 300 °C for periods of 0.5 or 1 h in the nitrogen (N2) and the vacuum systems, respectively, as shown in Figure A1 (in Appendix A). Nitrogen gas was blown through the reactor at a flow rate of 0.1 L/min, as shown in Figure 1a. The vacuum pressure was controlled at −590 torrs (0.22 atm) in vacuum systems, as shown in Figure 1b. The temperature of the sample in the reactor was recorded at the end of each torrefaction period. Then the furnace was opened to cool the reactor for further sample analysis.
During torrefaction, liquid compounds were released from the samples. The lower volatility compounds moved into a glass bottle, while the higher volatility compounds into an Erlenmeyer flask. Non-condensable gases were released into an exhaust ventilation system. The product left in the sample bottles after torrefaction was collected and stored at −4 °C for further analyses.

2.2. Sample Analysis

In this study, wood sawdust was torrefied at various temperatures (200–300 °C), under atmospheric condition (~1 atm) and vacuum for two residence times (30 and 60 min). The resulting products were characterized by proximate and elemental analysis, HHV and GC/MS methodologies.
The proximate, elemental, fiber and calorific analyses of the biomass materials were performed to figure out their basic properties [34]. The weight percentages of C, H, and N for biochar and for the low and the high volatility compounds were measured by an elemental analyzer. The proximate analysis of biomass was carried out in accordance with standard procedures of American Society for Testing and Materials (ASTM).
The weight percentages of C, H, and N in the biomass were measured by an elemental analyzer (PerkinElmer 2400 Series II CHNS/O Elemental Analyzer). The weight percentage of O was obtained by difference, that is, O (wt%) = 100 – C–H–N-Ash. The hemicellulose, cellulose, and lignin contents of biomass were analyzed following the fiber analysis in a previous study. The HHVs of the samples were measured by a bomb calorimeter (IKAC5000). The definitions of product yield and energy yield were used as follows:
Product   yield ( % ) = Weight product Weight raw × 100
Energy   yield ( % ) = Weight product × HHV product Weight raw × HHV raw × 100
Gas   energy   yield ( % ) = 100 solid   energy   yield - liquid   energy   yield ( % )
The subscripts “raw” and “product” represent raw and torrefied biomass, respectively.
The condensed low and high volatility compounds were measured using a gas chromatography-mass spectrophotometer (GC 6890N, MS 5973N, Autosample 7683B, GC–MS). GC column and solvent are GSBP 0125-3001HT (length 30 m, inner diameter 0.25 mm, film thickness 0.1 um) and hexane/acetone. The oven temperature was set as follows: (1) 50 °C for 2 min; (2) from 50 to 270 °C at a heating rate of 9 °C min−1; and (3) the capillary column was maintained at 270 °C for about 5 min; (4) from 270 to 320 °C at a heating rate of 13 °C min−1; and (5) the capillary column was maintained at 320 °C for about 2.5 min; (6) from 320 to 350 °C at a heating rate of 10 °C min−1; and (7) the capillary column was maintained at 350 °C for about 2.5 min. High-purity helium at a flow rate of 1.0 mL min−1 was used as the carrier gas and sent into the reaction system. In the GC/MS, the mass-to-charge range used for the mass selective detector was between 40 and 550 m/z. For the purpose of this research, the existence of a volatile product was confirmed if it showed a qualification percentage of 60% or higher according to the MS database. The calibration curves as well as limit of detection and limit of quantification values were programmed in the MS instrument.
As for the Karl Fisher device, the water content of the low and high volatility compounds was measured by Karl Fischer titration (TitroLine® 7500 KF) method using the standard procedure of the American Society for Testing and Materials (ASTM D1744) [35]. This method uses Karl Fischer reagent, which reacts quantitatively and selectively with water, to measure moisture content. Karl Fischer reagent consists of iodine, sulfur dioxide, a base, and a solvent such as alcohol. The fundamental principle behind it is based on the Bunsen Reaction between iodine and sulfur dioxide in an aqueous medium [36]. The measurement quality of the GC/MS and Karl Fischer titration systems was reliable since the instruments had been calibrated periodically. It should be noted that the data presented in the tables and figures were average figures derived from multiple tests wherein the differences were found to be smaller than 5%.

3. Results and Discussion

3.1. Proximate Analysis for Wood Sawdust

The proximate analysis (dry ash-free) of raw and torrefied wood sawdust is shown in Table 1. Cellulose was the major component in the biomass contributing 46.32 wt%, followed by hemicellulose (27.58 wt%) and lignin (8.17 wt%). The raw wood sawdust contained moisture, VM, fixed carbon (FC), and ash in portions of 7.72 wt%, 74.57 wt%, 16.41 wt%, and 1.30 wt%, respectively. The C, H, N, and O contents in the raw wood sawdust were found to be 47.07 wt%, 6.10 wt%, 0.43 wt%, and 46.40 wt%, respectively. The HHV of the biomass was 17.68 MJ kg−1.

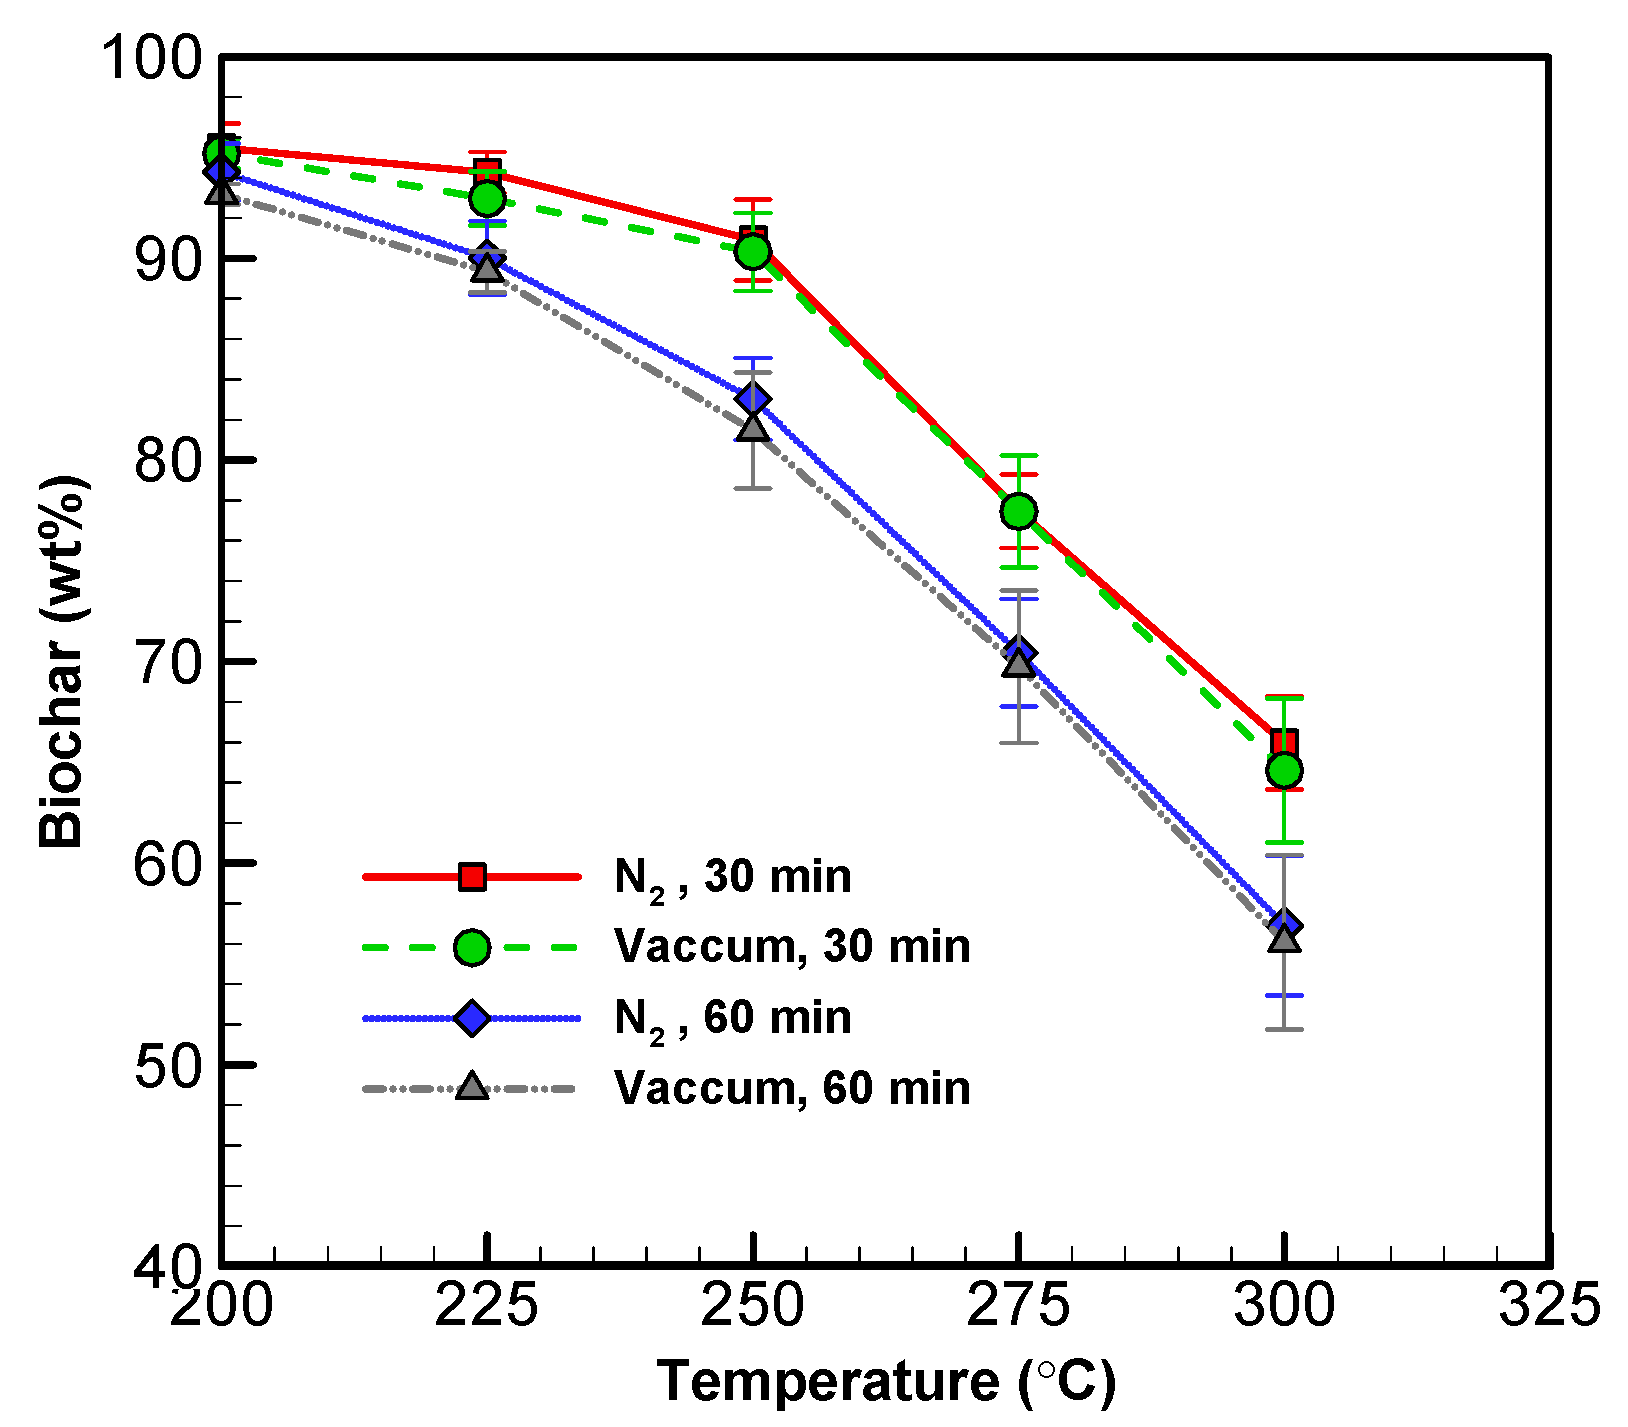
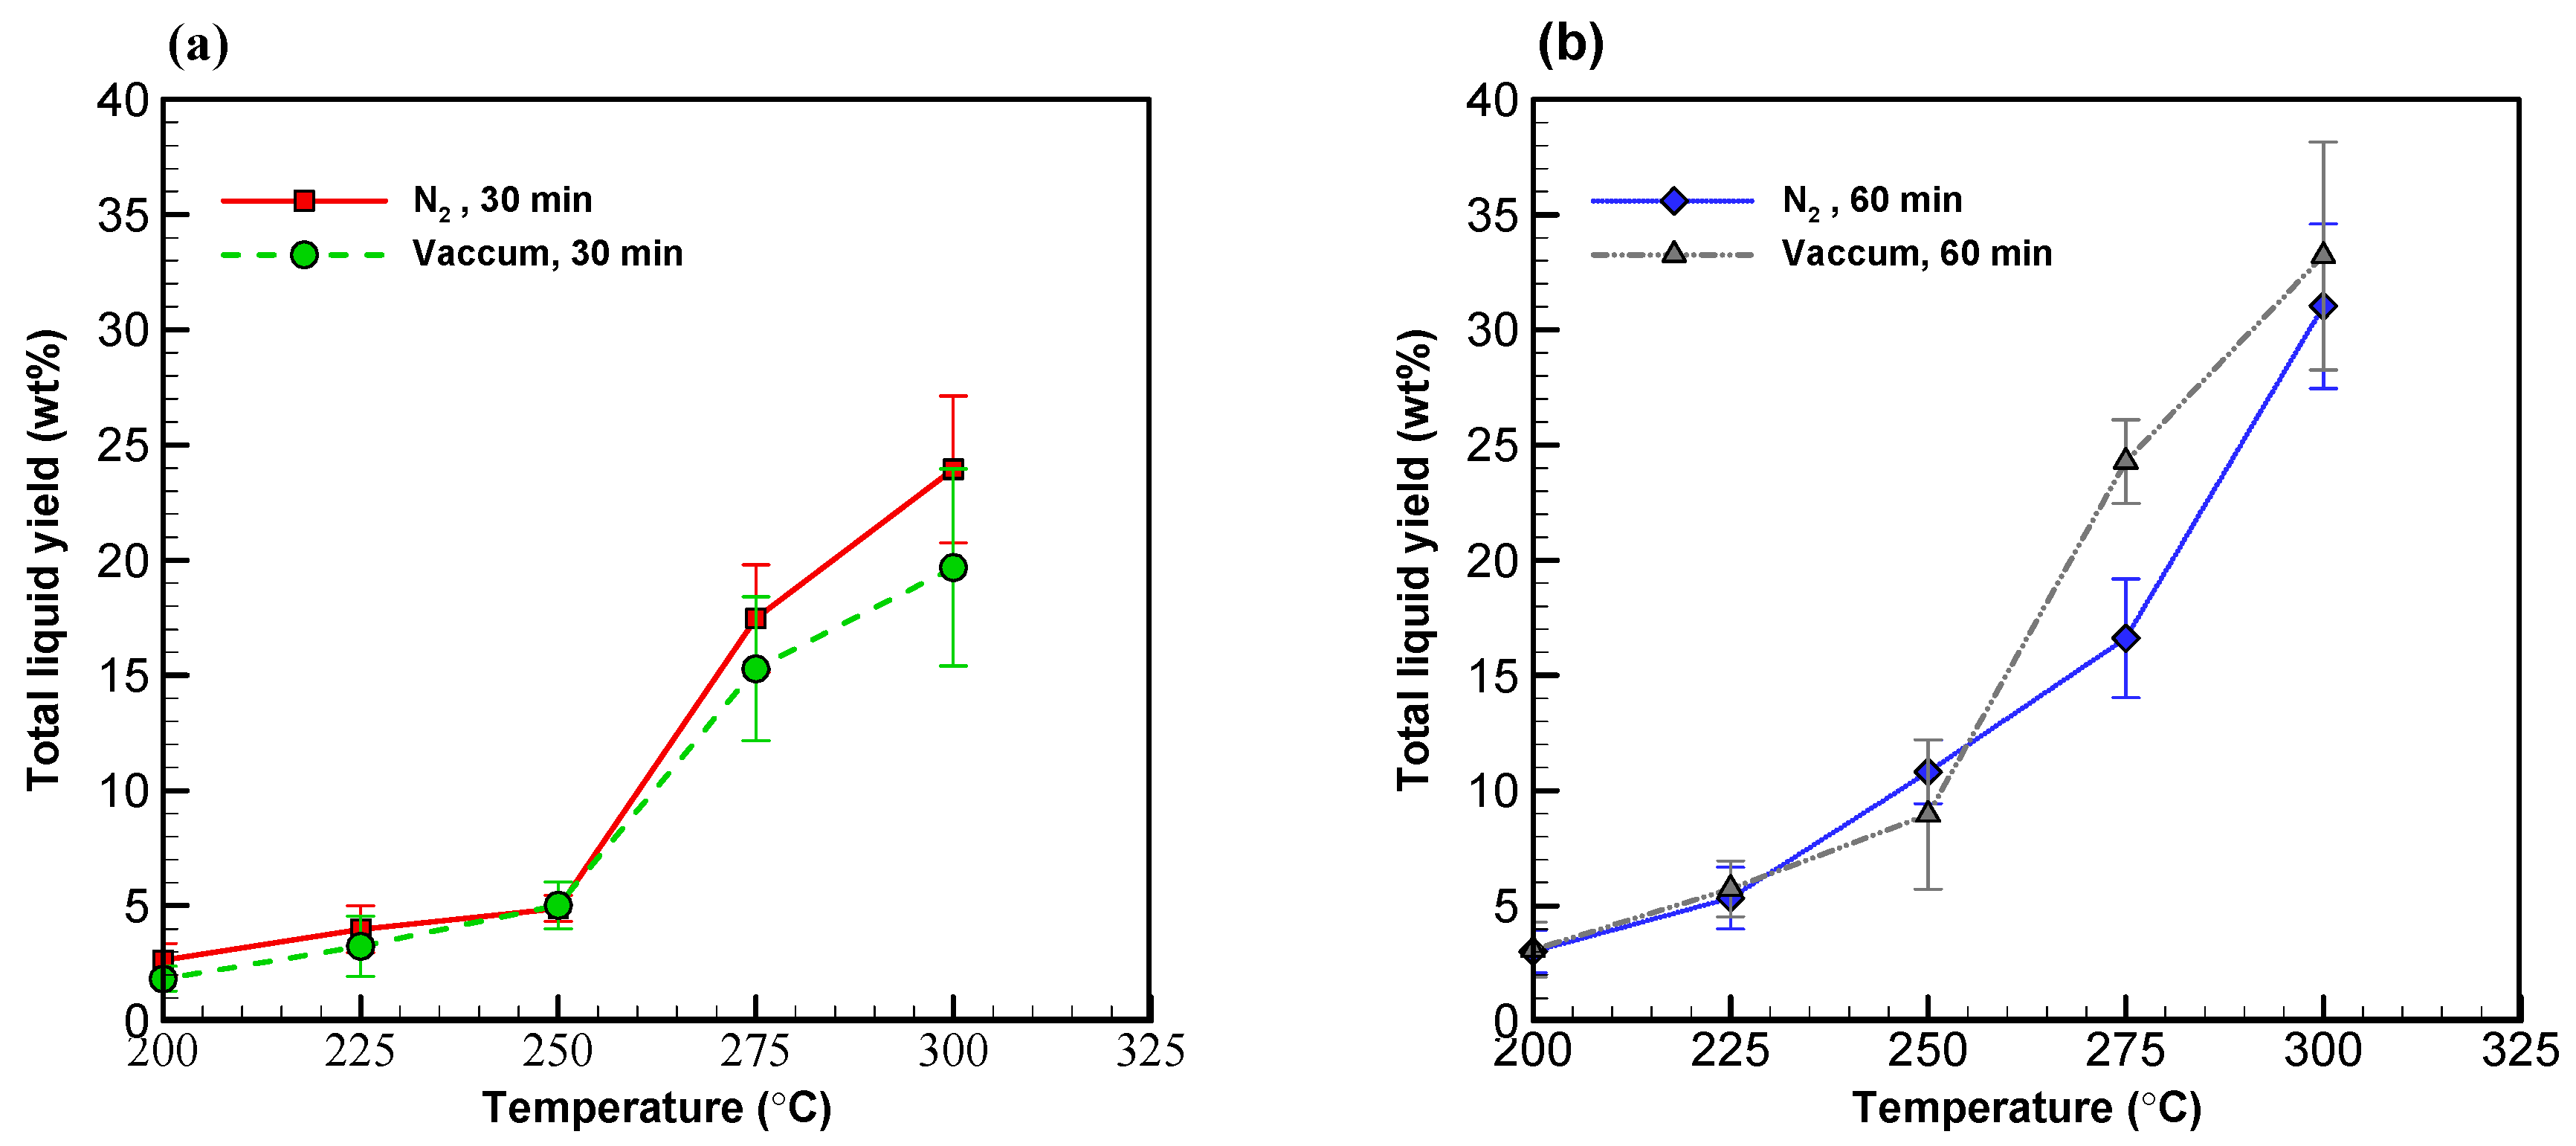
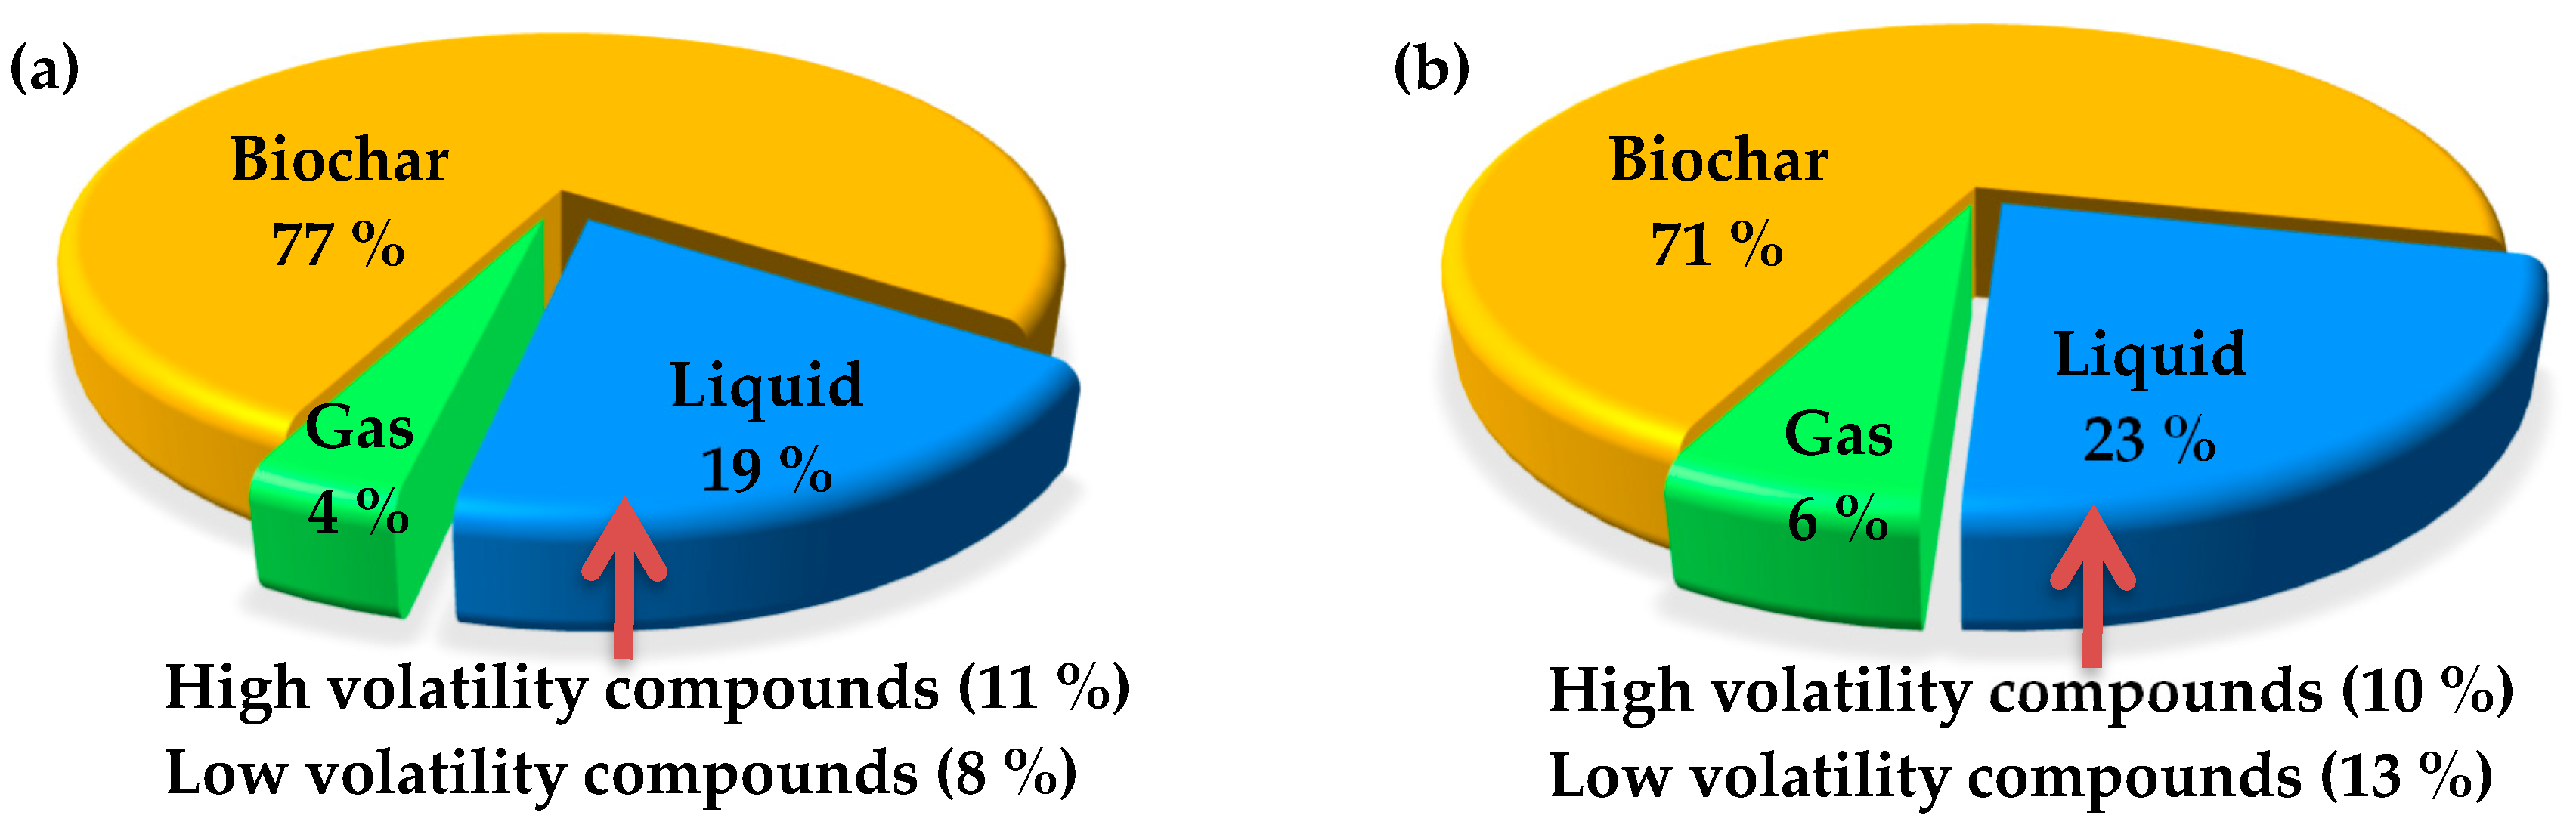
3.2. The Effect of Vacuum on Product Yields

The yield of solid and liquid products at various operating conditions is displayed in Figure 2 and Figure 3. The solid yield decreased with torrefaction temperature between 200 and 300 °C for both systems (see Figure 2). Between 200 and 300 °C for 60 min, the biochar yield decreased from 93.19 to 56.08 wt% in the vacuum system, while it decreased from 94.29 to 56.91 wt% in the nitrogen system [30,37]. This demonstrates that the vacuum approach can produce a similar amount of biochar in comparison to the conventional approach.
Besides the solid products, liquid yields from both systems were both found to be around 5 wt% at 250 °C with a torrefaction time of 30 min (see Figure 3a,b). According to the law of thermal decomposition, as torrefaction temperature increases, the formation of liquid products also increases. As anticipated, the effect of temperature picked up at 275 °C for both systems alike, where the liquid yield reached 15 wt%. With a torrefaction time of 60 min, liquid yield became 9–10 wt% below 250 °C and went above 30 wt% at 300 °C in both systems (see Figure 3b). The fact that the samples did not reached the target temperature of 300 °C during much of the 30 min torrefaction time provides a plausible explanation for the result that the vacuum system yielded less liquid than the nitrogen system. With a longer torrefaction time of 60 min, however, the advantage of the vacuum system was fully realized while a lot of volatile compounds were released from the solid components at 300 °C.
Table 2 shows the overall solid and liquid yields formed at various temperatures in both systems. The yields of low and high volatility liquid compounds are also available in the table. Overall, the total liquid yield increased from 2 to 33 wt% while temperature increased in both systems alike. It is noteworthy, nonetheless, that the vacuum system surpassed the nitrogen system in yielding liquid products with a peak liquid yield rate of 33.21 wt% at 300 °C with a torrefaction time of 60 min.
In further analysis breaking down liquid yields into low and high volatility compounds, low molecular weight (i.e., high volatility) products were absent at lower temperatures (i.e., below 250 °C) in the vacuum system. This was because—in a vacuum—most of the low molecular weight products diffused to the Erlenmeyer flask and left a considerably smaller amount of such products in the glass bottle [38,39]. By subtracting the weight percentage of the solid and the liquid yields from the total weight percentage of the original sample (i.e., 100%), the mass of losses in gaseous products can be obtained. In the nitrogen system, 2%–10% of the gaseous compounds and moisture were lost, while 3%–15% of such were lost in the vacuum system between 200 and 300 °C.

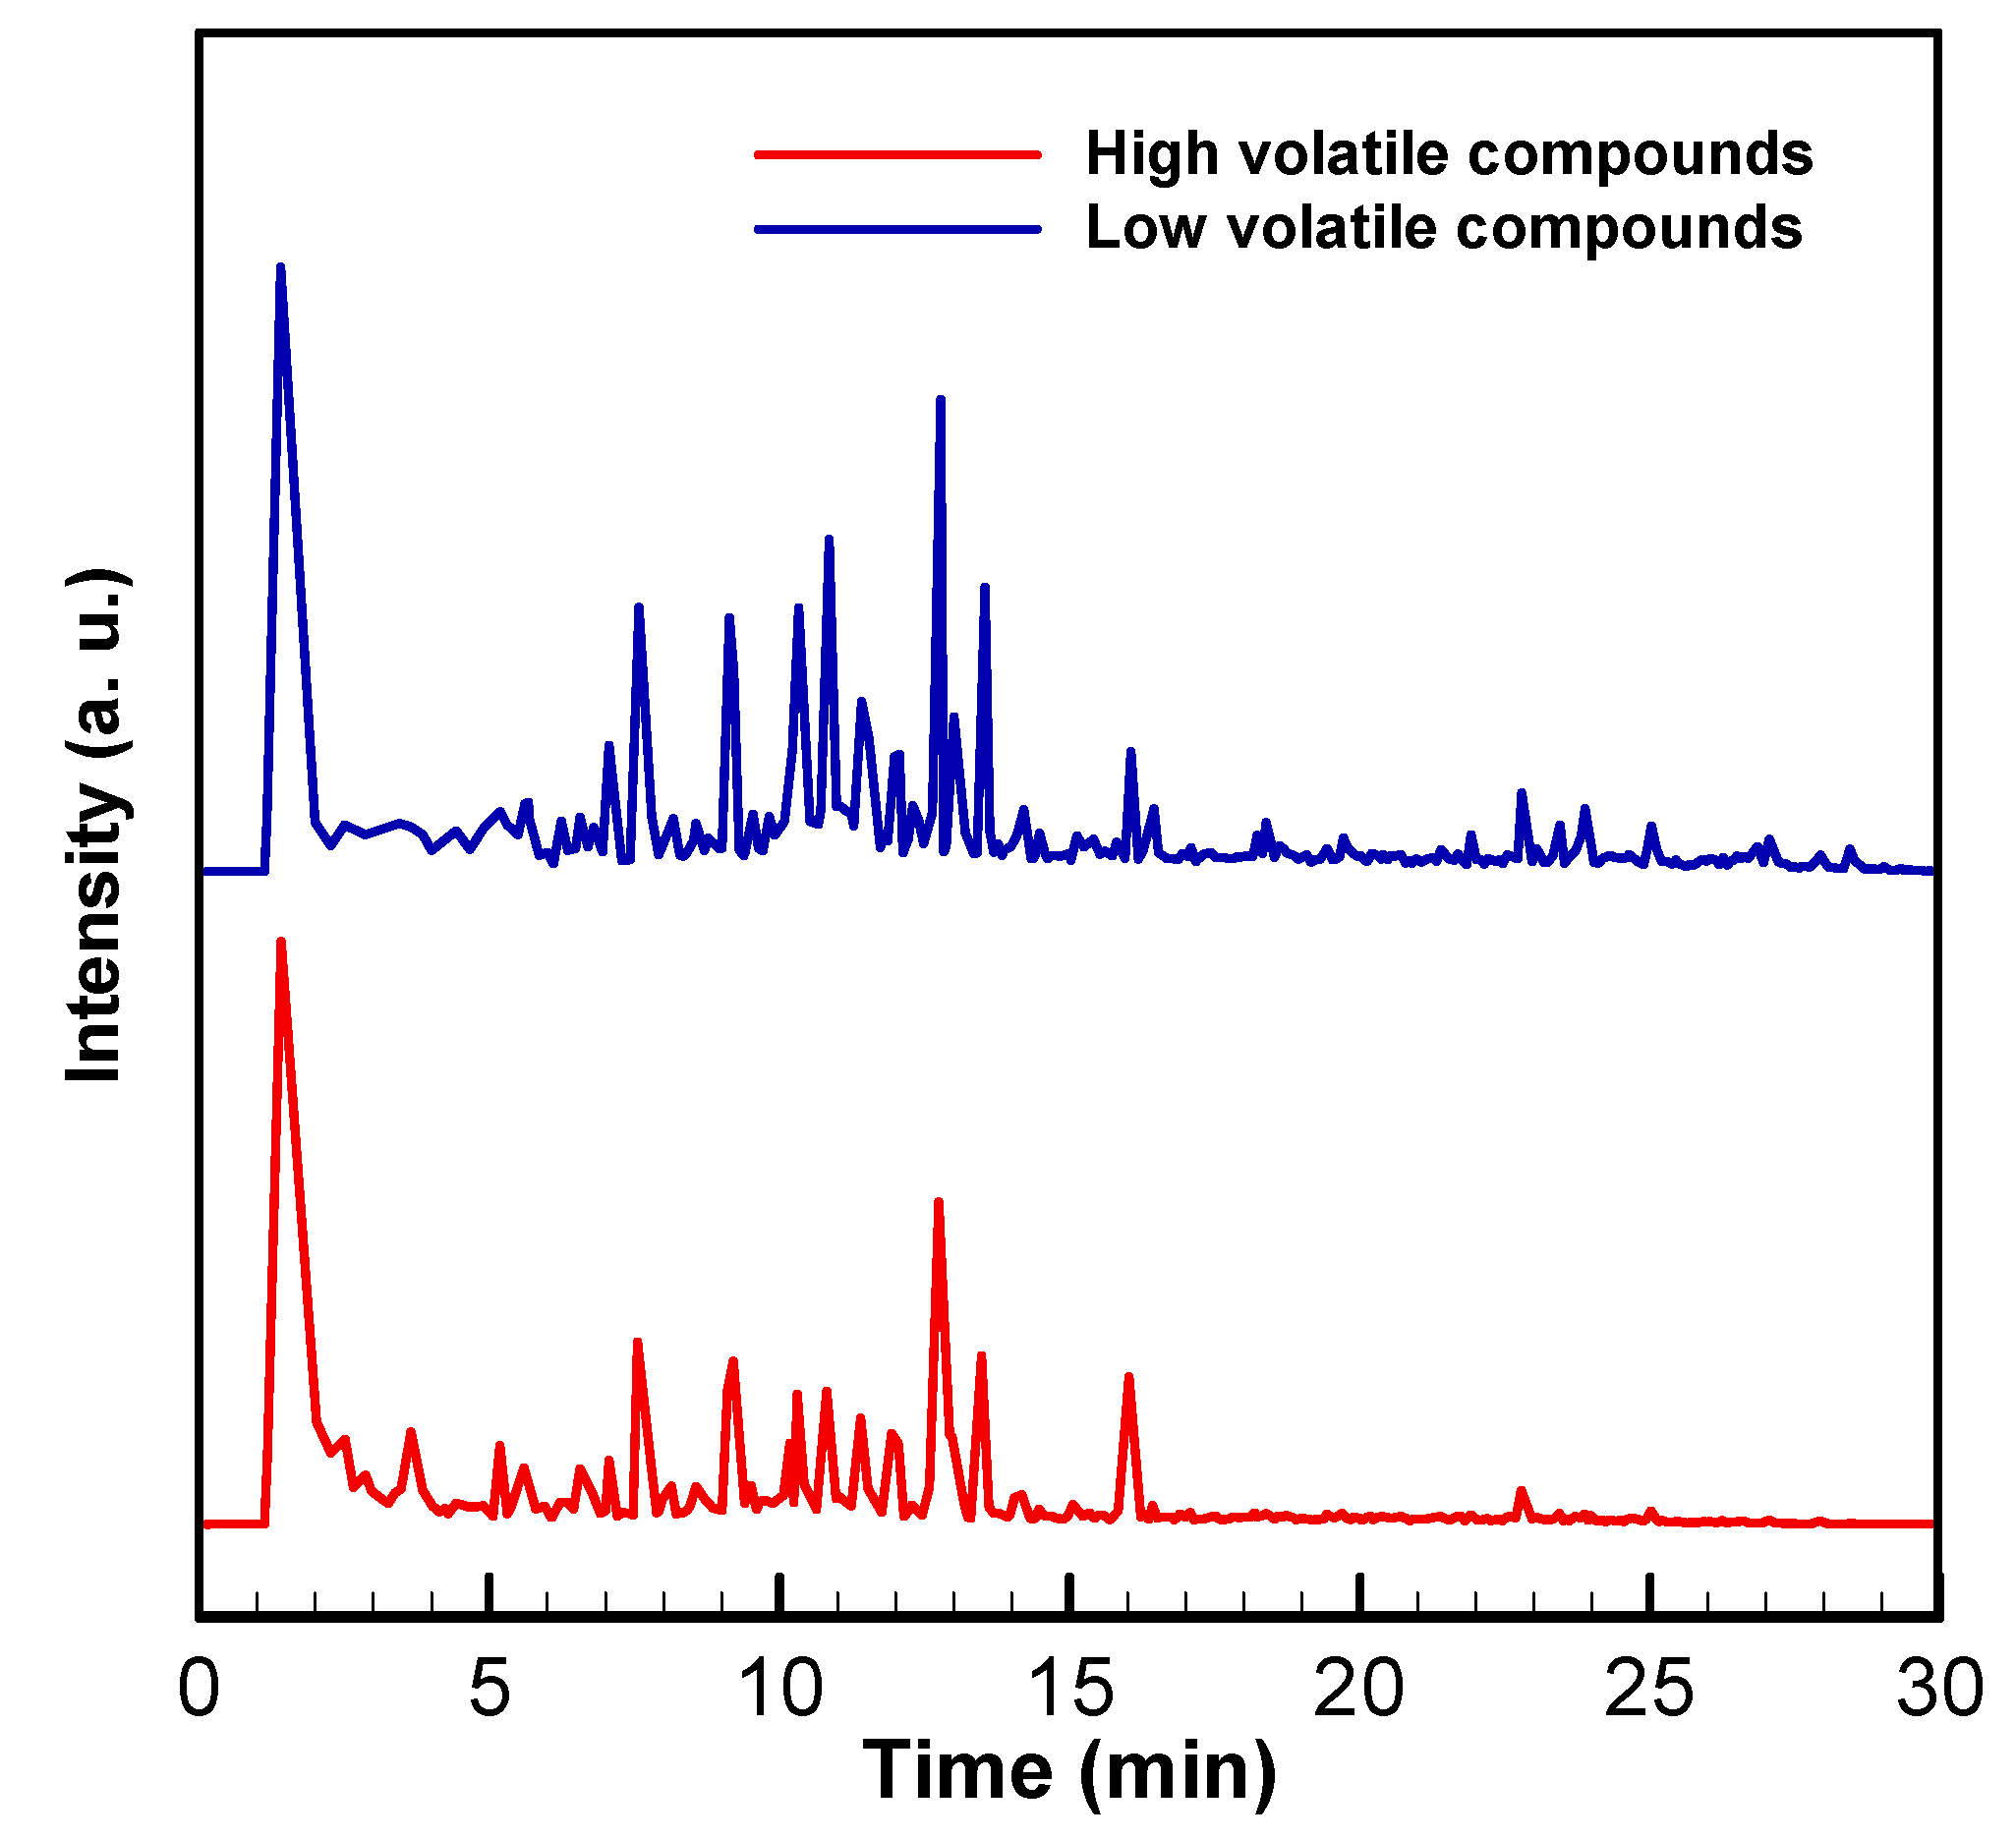
3.3. GC/MS Analysis of Liquid Compounds

Gas chromatography-mass spectrometry (GC/MS) is an instrumental technique consisting of a gas chromatograph (GC) coupled with a mass spectrometer (MS). It allows complex mixtures of chemicals to be separated, identified, and quantified and is thus ideal for the analysis of low molecular weight compounds (LMC). Recently, GC/MS has been employed for the in-depth analysis of thermal decomposition and the products of pyrolysis from biomass [40,41,42]. Table 3 and Figure A2 (in Appendix A) show the relative mass contents of sawdust torrefied in the vacuum and the nitrogen systems at 300 °C for 60 min. The liquid products were largely composed of condensable components such as phenols, acids, alcohols, aldehydes, and ketones (see Table 3) [43,44,45]. All of the results reported in Table 3 are mutually comparable because they were obtained under the same operating conditions as programed in the MS instrument.
Table 3 shows that—in the nitrogen system—low molecular weight compounds (LMC) and high molecular weight compounds (HMC) can be found in both the glass bottle (where low volatility compounds concentrated) and the Erlenmeyer flask (where high volatility compounds concentrated). Compared to torrefaction performed in nitrogen, torrefaction conducted in vacuum drastically reduced the furfural, 2-furancarboxaldehyde, and 2,6-dimethoxy-phenol in the products. Apparently, torrefaction in vacuum altered the ratio between LMC and HMC. In a vacuum, most of the LMC, especially furfural, were removed from both the glass bottle and the erlenmeyer flask. The LMC evaporated and mixed in the gas stream, which vented out of the system. On the other hand, HMC could only be found in the erlenmeyer flask in the vacuum system [46,47]. It is clear that the moving of torrefied liquid compounds through diffusion played a major role in creating such a diverged pattern [48,49]. These findings suggest that a vacuum environment is better able to stratify liquid compounds by their molecular weight.

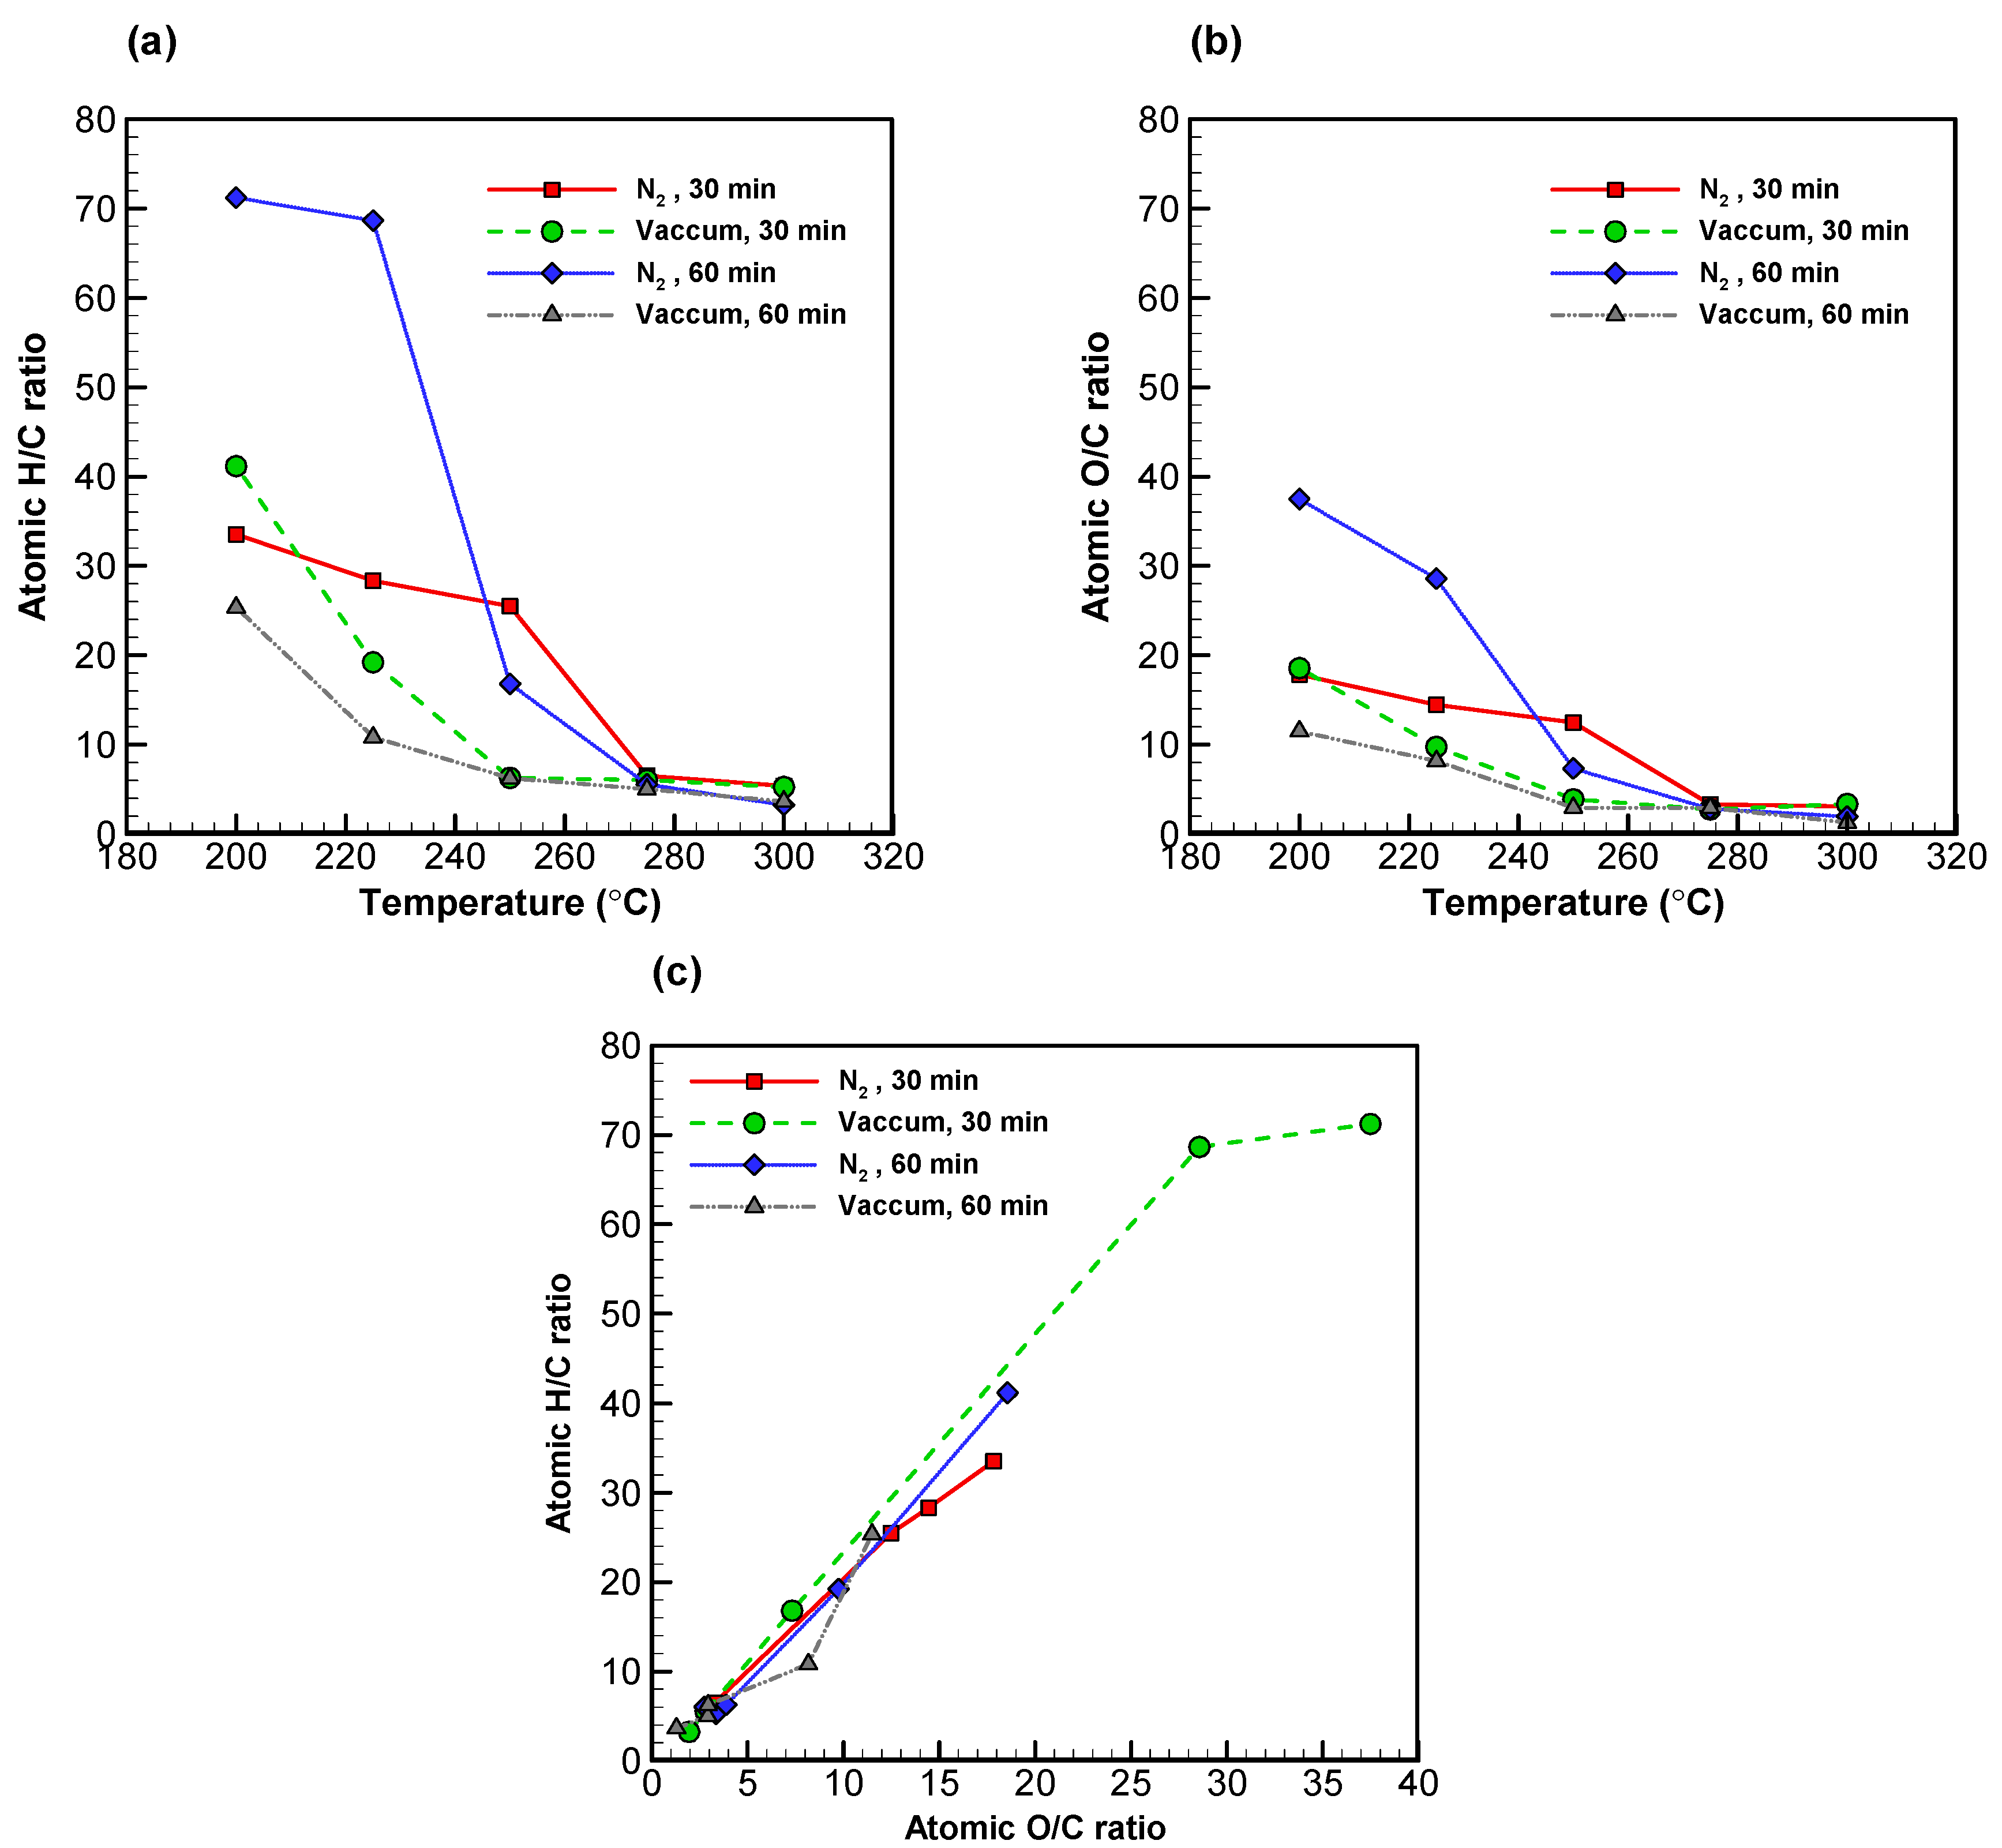
3.4. Elemental Analysis of Solid and Liquid Products

Atomic H/C and O/C ratios as well as HHV are important indices for a material used as a source of energy [22,50]. The atomic H/C and O/C ratios for the solid and liquid products are reported in Table 4.
With regards to the liquid products, Figure 4a shows the H/C ratios for the low volatility compounds in both systems, which dropped along with torrefaction temperature by a similar pattern. At 275 °C and higher, the same figures came down to below 10%. In much the same way, Figure 4b shows uniformly low O/C ratios across the board [51]. However, it is noteworthy that higher torrefaction temperature (i.e., carbonization) appeared to have affected hydrogen to a greater extent than it did oxygen [26,52,53].
The covariation of the H/C and the O/C ratios is presented in a van Krevelen diagram (see Figure 4c). Both ratios decreased as torrefaction temperature increased, resulting in the shift of data points from the upper right to the bottom left corner. The H/C and O/C ratios of the sample torrefied at 200 °C for 60 min in vacuum were 25.36 and 11.49; such figures decreased to 3.64 and 1.29, respectively, when the sample was torrefied at 300 °C.
The outcome of the elemental analysis, as well as atomic H/C and O/C ratios for biochar, low volatility, and high volatility compounds in both systems, is reported in Table 4. The atomic H/C and O/C ratios for biochar were in the intervals 1.0–1.6 and 0.5–0.75 in vacuum and nitrogen, respectively. For the liquid products, data for high volatility compounds were unavailable for the vacuum system at lower torrefaction temperatures. Such compounds presumably had molecular weights that were too small to be captured in the process of diffusion. In other words, high volatility compounds could only be collected in the erlenmeyer flask at lower torrefaction temperatures in vacuum.
In contrast, in the nitrogen system, the atomic H/C and O/C ratios for low volatility compounds fell in the intervals 38.0–1.7 and 21.0–0.6, respectively. This indicated that both high and low volatility compounds were condensed into the glass bottle, resulting in mixed components therein.
With respect to high volatility compounds with a torrefaction time of 30 min in a vacuum, the C content increased from 1.75 to 25.4% while torrefaction temperature increased from 200 to 300 °C. At the same time, the H and O contents reduced from 6.25 to 5.92% and from 40.37 to 37.68%, respectively. With a torrefaction time of 60 min in a vacuum, the C content increased from 5.39 to 32.66% while temperature went from 200 °C to 300 °C. Meanwhile, the H and O contents reduced from 11.47 to 9.97% and from 82.49 to 55.99%, respectively. Similar patterns were found on the high volatility compounds in nitrogen. In fact, the atomic H/C and O/C ratios for high volatility compounds in vacuum with a torrefaction time of 60 min were lower than those in the nitrogen system. This indicated that—at a temperature of 275 °C or above—the H and O elements in the liquid compounds resulting from the vacuum system reduced by the same rate as they did in nitrogen.

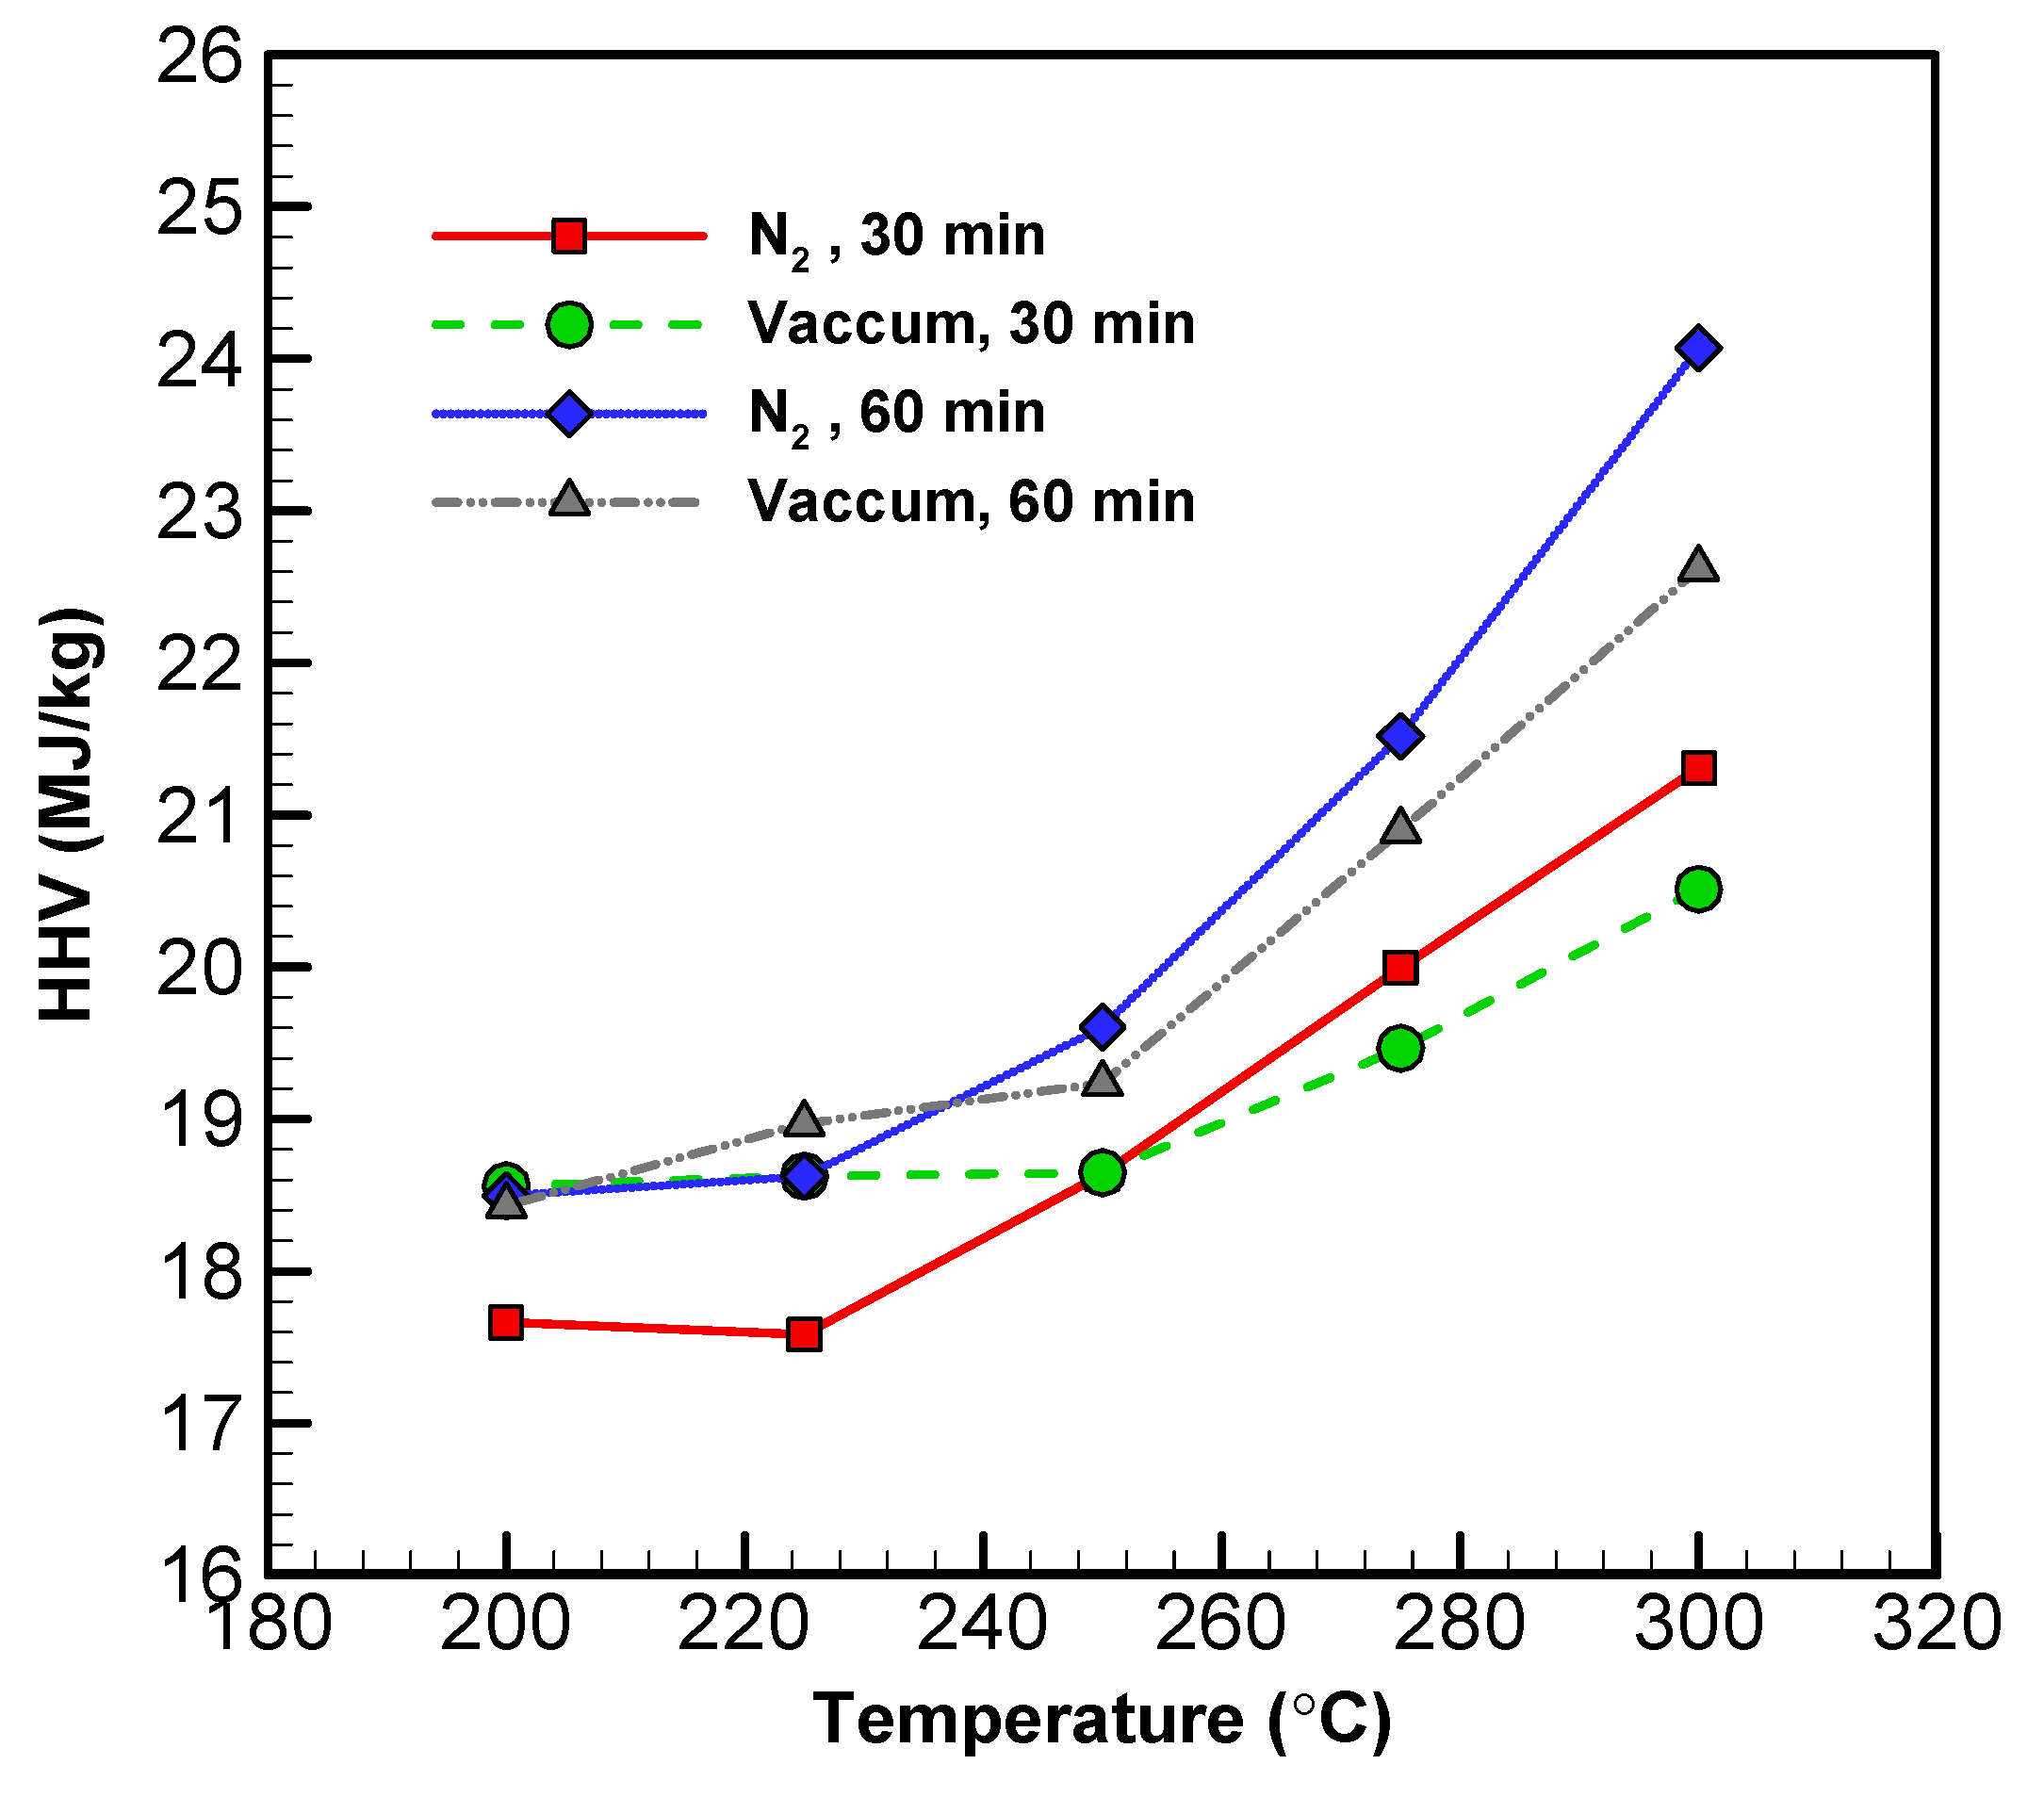
3.5. Higher Heating Value Analysis

The HHV of torrefied products is a function of temperature [54]. All HHV and temperature figures from the experiments can be found in Figure 5 and Table 5. Across all materials, HHV increased along with the temperature. The increase in HHV was positively associated with temperature and residence time. This is due to an increase in the carbon content of the torrefied materials as a result of reduced H and O. With increased temperature, the total mass of the solid decreased, while the HHV increased. The HHVs of the solid materials from both systems were 27–35%, which were higher than that of the original biomass.
As for the liquid products, the HHV of low volatility compounds from the vacuum system did not go up until temperature reached 275 °C [55]. In contrast, the HHV of the low volatility compounds from the nitrogen system only started to pick up above 300 °C. Overall, the HHV of the high volatility compounds from both systems were lower—to a similar degree—than that of their respective solid compounds (17.68 MJ kg−1). However, the high volatility compounds from the vacuum system exhibited higher HHVs than those from the nitrogen system. These findings suggest that torrefaction in vacuum improves the energy density of biomass more significantly than does a nitrogen system. Thus, the application of the vacuum technique to torrefaction has the potential for improving combustion efficiency.

3.6. Biomass Energy Conversion

In converting raw biomass into various forms of energy such as heat, solid, liquid, and gaseous fuels, there are four approaches: direct combustion, physical conversion, biochemical, and thermochemical conversions [56,57]. Energy yield, which stands for the ratio of total energies between processed and raw biomass samples, is a measure of preserved energy in the processed materials, corresponding to their solid, liquid, and gaseous states [58].
Torrefaction, a method of thermochemical conversion, registers a high energy yield of 90% for solid products when performed at 250 °C or below. While higher torrefaction temperature increases the energy density of the resultant biochar, it does so at the expense of reduced solid yield. When this is the case, lower energy yield means energy transfer from the solid product to liquid or gaseous products [59]. Figure 6a shows the percentage of energy yield for the solid, liquid, and gaseous products in a nitrogen system with a torrefaction time of 60 min at 300 °C. The resulting portions are 77%, 19%, and 4%, respectively. In comparison, the energy yield for the solid, liquid, and gaseous products from a vacuum system under the same conditions become 71%, 23%, and 6%, respectively. These suggest a 6% energy transfer from the solid biochar to the liquid and gaseous products in a vacuum environment.
In addition, the moisture content was evaluated. The moisture contents in the liquid products at the different torrefaction temperatures in vacuum and nitrogen with different torrefaction times are presented in Table A1 (in Appendix A). In both systems, the moisture contents exceeded 85 wt% at 200 °C. The moisture content decreased along with temperature [26]. At 300 °C, the moisture contents of low and high volatility compounds were around 15% and 45%, respectively, in the vacuum system. At the same temperature, the moisture content of the low volatility compounds in the nitrogen system was 25% after 60 min of torrefaction and 49% after 30 min, while the high volatility compounds exhibited a consistent level of moisture content around 62% regardless of torrefaction time. In contrast, the moisture contents of the low volatility products from the vacuum system at 300 °C were between 14% and 16% after 60 and 30 min, respectively, while the high volatility compounds hovered around 44% and 46% regardless of time. In sum, the moisture contents of the liquid products from the vacuum system are lower than those of the nitrogen-system products across the board. It is thus clear that torrefaction in vacuum serves to improve the HHV of liquid products by bringing down their moisture level, making liquid and gaseous products of torrefaction qualified as fuels and other functional materials [58].

4. Conclusions

With the vacuum technique applied to torrefaction, it was found that the amount of biochar (solid products) resulting from the vacuum system was reduced at the same rate as the nitrogen system. In terms of the energy density, the vacuum system was able to produce biochar with considerably higher HHV than did the nitrogen system below 250 °C. This is because the moisture and the high volatility compounds (i.e., aldehydes) dispersed more smoothly in a vacuum. At a temperature higher than 250 °C, however, most of the low volatility compounds evaporated, resulting in lower HHV in the biochar produced in the vacuum.
Despite such mixed results with the solid products, the vacuum system increased the HHV of its liquid products more significantly than did the nitrogen system regardless of torrefaction temperature. As the GC/MS analysis revealed, the vacuum system separated a greater amount of smaller molecules (such as water) from bigger ones and thus produced high-volatility compounds that contained considerably less moisture. Another proof of reduced moisture in the liquid products of the vacuum system was a Van Krevelen plot of the H/C and O/C ratios, which demonstrated a linear relationship between torrefaction temperature and the hydrophobic property of the liquid products.
In light of the above, the vacuum system outperformed the nitrogen system in terms of the HHV, owing largely to the former’s less moist liquid products. Unlike the case with the solid products, this pattern exhibited by the liquid products was unaffected by torrefaction temperature. Since the vacuum system converted more energy from solid biomass to liquid products, it was able to enhance the total energy output of torrefaction.

Author Contributions

Y.-K.C. performed the experiments, analyzed data, and wrote the paper. W.-H.C. created the research concept, organized the work, designed the experiments, analyzed data, and provided facilities and instruments for the research. H.C.O. analyzed data and wrote the paper. P.L.S. analyzed data and wrote the paper.

Funding

This research was funded by the Ministry of Science and Technology, Taiwan, R.O.C., under the contracts MOST 106-2923-E-006-002-MY3 and MOST 108-3116-F-006-007-CC1. This research was also funded in part by Higher Education Sprout Project, Ministry of Education to the Headquarters of University Advancement at NCKU.

Acknowledgments

The authors acknowledge the financial support of the Ministry of Science and Technology, Taiwan, R.O.C., under the contracts MOST 106-2923-E-006-002-MY3 and MOST 108-3116-F-006-007-CC1 for this research. This research is also supported in part by Higher Education Sprout Project, Ministry of Education to the Headquarters of University Advancement at NCKU.

Conflicts of Interest

The authors declare no conflict of interest.

Appendix A

Table A1. The moisture content of high and low volatility compounds at various operating conditions.
Operating ConditionsTemp. (°C)Low Volatility CompoundsHigh Volatility Compounds
60 min30 min60 min30 min
N220095.0385.5597.9495.11
30024.649.1262.0661.32
Vacuum200--98.6589.54
225--82.3491.91
30014.315.6845.3344.28
Figure A1. Temperature vs. time plots for the center sample in reactor trials (vacuum and nitrogen systems) for wood sawdust.
Energies 12 03844 g0a1
Figure A2. GC/MS spectra of high and low volatility compounds at 300 °C in vacuum systems.
Energies 12 03844 g0a2

References

  1. Zachos, J.; Pagani, M.; Sloan, L.; Thomas, E.; Billups, K. Trends, Rhythms, and Aberrations in Global Climate 65 Ma to Present. Science 2001, 292, 686. [Google Scholar] [CrossRef]
  2. Hansen, J.; Ruedy, R.; Sato, M.; Lo, K. Global surface temperature change. Rev. Geophys. 2010, 48. [Google Scholar] [CrossRef]
  3. Dai, A. Increasing drought under global warming in observations and models. Nat. Clim. Chang. 2012, 3, 52. [Google Scholar] [CrossRef]
  4. John, R.P.; Anisha, G.S.; Nampoothiri, K.M.; Pandey, A. Micro and macroalgal biomass: A renewable source for bioethanol. Bioresour. Technol. 2011, 102, 186–193. [Google Scholar] [CrossRef]
  5. Parikka, M. Global biomass fuel resources. Biomass Bioenergy 2004, 27, 613–620. [Google Scholar] [CrossRef]
  6. Long, H.; Li, X.; Wang, H.; Jia, J. Biomass resources and their bioenergy potential estimation: A review. Renew. Sustain. Energy Rev. 2013, 26, 344–352. [Google Scholar] [CrossRef]
  7. Prins, M.J.; Ptasinski, K.J.; Janssen, F.J.J.G. Torrefaction of wood. Part 2. Analysis of products. J. Anal. Appl. Pyrolysis 2006, 77, 35–40. [Google Scholar] [CrossRef]
  8. Grilc, M.; Likozar, B.; Levec, J. Kinetic model of homogeneous lignocellulosic biomass solvolysis in glycerol and imidazolium-based ionic liquids with subsequent heterogeneous hydrodeoxygenation over NiMo/Al2O3 catalyst. Catal. Today 2015, 256, 302–314. [Google Scholar] [CrossRef]
  9. Grilc, M.; Likozar, B.; Levec, J. Simultaneous liquefaction and hydrodeoxygenation of lignocellulosic biomass over NiMo/Al2O3, Pd/Al2O3, and Zeolite Y catalysts in hydrogen donor solvents. ChemCatChem 2016, 8, 180–191. [Google Scholar] [CrossRef]
  10. Grilc, M.; Likozar, B.; Levec, J. Hydrotreatment of solvolytically liquefied lignocellulosic biomass over NiMo/Al2O3 catalyst: Reaction mechanism, hydrodeoxygenation kinetics and mass transfer model based on FTIR. Biomass Bioenergy 2014, 63, 300–312. [Google Scholar] [CrossRef]
  11. Chen, W.-H.; Hsu, H.-J.; Kumar, G.; Budzianowski, W.M.; Ong, H.C. Predictions of biochar production and torrefaction performance from sugarcane bagasse using interpolation and regression analysis. Bioresour. Technol. 2017, 246, 12–19. [Google Scholar] [CrossRef]
  12. Song, X.; Yang, Y.; Zhang, M.; Zhang, K.; Wang, D. Ultrasonic pelleting of torrefied lignocellulosic biomass for bioenergy production. Renew. Energy 2018, 129, 56–62. [Google Scholar] [CrossRef]
  13. Chen, W.-H.; Zhuang, Y.-Q.; Liu, S.-H.; Juang, T.-T.; Tsai, C.-M. Product characteristics from the torrefaction of oil palm fiber pellets in inert and oxidative atmospheres. Bioresour. Technol. 2016, 199, 367–374. [Google Scholar] [CrossRef]
  14. Lu, J.-J.; Chen, W.-H. Product yields and characteristics of corncob waste under various torrefaction Atmospheres. Energies 2014, 7, 13. [Google Scholar] [CrossRef]
  15. Chen, W.-H.; Cheng, W.-Y.; Lu, K.-M.; Huang, Y.-P. An evaluation on improvement of pulverized biomass property for solid fuel through torrefaction. Appl. Energy 2011, 88, 3636–3644. [Google Scholar] [CrossRef]
  16. Xing, X.; Fan, F.; Jiang, W. Characteristics of biochar pellets from corn straw under different pyrolysis temperatures. R. Soc. Open Sci. 2018, 5. [Google Scholar] [CrossRef]
  17. Santos, L.B.; Striebeck, M.V.; Crespi, M.S.; Capela, J.M.V.; Ribeiro, C.A.; De Julio, M. Energy evaluation of biochar obtained from the pyrolysis of pine pellets. J. Therm. Anal. Calorim. 2016, 126, 1879–1887. [Google Scholar] [CrossRef] [Green Version]
  18. Wang, Z.; Dunn, J.B.; Han, J.; Wang, M.Q. Effects of co-produced biochar on life cycle greenhouse gas emissions of pyrolysis-derived renewable fuels. Biofuels Bioprod. Biorefining 2014, 8, 189–204. [Google Scholar] [CrossRef]
  19. Sajdak, M.; Muzyka, R.; Hrabak, J.; Różycki, G. Biomass, biochar and hard coal: Data mining application to elemental composition and high heating values prediction. J. Anal. Appl. Pyrolysis 2013, 104, 153–160. [Google Scholar] [CrossRef]
  20. Bridgeman, T.G.; Jones, J.M.; Shield, I.; Williams, P.T. Torrefaction of reed canary grass, wheat straw and willow to enhance solid fuel qualities and combustion properties. Fuel 2008, 87, 844–856. [Google Scholar] [CrossRef]
  21. Sun, J.; He, F.; Pan, Y.; Zhang, Z. Effects of pyrolysis temperature and residence time on physicochemical properties of different biochar types. Acta Agric. Scand. Sect. B Soil Plant Sci. 2017, 67, 12–22. [Google Scholar] [CrossRef]
  22. Bach, Q.-V.; Chen, W.-H.; Chu, Y.-S.; Skreiberg, Ø. Predictions of biochar yield and elemental composition during torrefaction of forest residues. Bioresour. Technol. 2016, 215, 239–246. [Google Scholar] [CrossRef]
  23. Chen, W.-H.; Chu, Y.-S.; Lee, W.-J. Influence of bio-solution pretreatment on the structure, reactivity and torrefaction of bamboo. Energy Convers. Manag. 2017, 141, 244–253. [Google Scholar] [CrossRef]
  24. Couhert, C.; Salvador, S.; Commandré, J.M. Impact of torrefaction on syngas production from wood. Fuel 2009, 88, 2286–2290. [Google Scholar] [CrossRef] [Green Version]
  25. Dhanavath, K.N.; Bankupalli, S.; Bhargava, S.K.; Parthasarathy, R. An experimental study to investigate the effect of torrefaction temperature on the kinetics of gas generation. J. Environ. Chem. Eng. 2018, 6, 3332–3341. [Google Scholar] [CrossRef]
  26. Chen, D.; Gao, A.; Ma, Z.; Fei, D.; Chang, Y.; Shen, C. In-depth study of rice husk torrefaction: Characterization of solid, liquid and gaseous products, oxygen migration and energy yield. Bioresour. Technol. 2018, 253, 148–153. [Google Scholar] [CrossRef]
  27. Fisher, T.; Hajaligol, M.; Waymack, B.; Kellogg, D. Pyrolysis behavior and kinetics of biomass derived materials. J. Anal. Appl. Pyrolysis 2002, 62, 331–349. [Google Scholar] [CrossRef]
  28. Elliott, D.C. Historical developments in hydroprocessing bio-oils. Energy Fuels 2007, 21, 1792–1815. [Google Scholar] [CrossRef]
  29. Lin, B.-J.; Colin, B.; Chen, W.-H.; Pétrissans, A.; Rousset, P.; Pétrissans, M. Thermal degradation and compositional changes of wood treated in a semi-industrial scale reactor in vacuum. J. Anal. Appl. Pyrolysis 2018, 130, 8–18. [Google Scholar] [CrossRef]
  30. Garcìa-Pérez, M.; Chaala, A.; Pakdel, H.; Kretschmer, D.; Roy, C. Vacuum pyrolysis of softwood and hardwood biomass: Comparison between product yields and bio-oil properties. J. Anal. Appl. Pyrolysis 2007, 78, 104–116. [Google Scholar] [CrossRef]
  31. Murwanashyaka, J.N.; Pakdel, H.; Roy, C. Step-wise and one-step vacuum pyrolysis of birch-derived biomass to monitor the evolution of phenols. J. Anal. Appl. Pyrolysis 2001, 60, 219–231. [Google Scholar] [CrossRef]
  32. Pakdel, H.; Roy, C. Separation and characterization of steroids in biomass vacuum pyrolysis oils. Bioresour. Technol. 1996, 58, 83–88. [Google Scholar] [CrossRef]
  33. Chen, W.-H.; Kuo, P.-C. Torrefaction and co-torrefaction characterization of hemicellulose, cellulose and lignin as well as torrefaction of some basic constituents in biomass. Energy 2011, 36, 803–811. [Google Scholar] [CrossRef]
  34. Chen, W.-H.; Tu, Y.-J.; Sheen, H.-K. Impact of dilute acid pretreatment on the structure of bagasse for bioethanol production. Int. J. Energy Res. 2010, 34, 265–274. [Google Scholar] [CrossRef]
  35. ASTM D 1744-13—Standard Test Method for Determination of Water in Liquid Petroleum Products by Karl Fischer Reagent (Withdrawn 2016); ASTM International: West Conshohocken, PA, USA, 2013. [CrossRef]
  36. Scholz, E. Karl Fischer titration: determination of water. In Springer Science & Business Media; Springer: Berlin/Heidelberg, Germany, 2012; ISBN 978-3-642-69991-7. [Google Scholar]
  37. Islam, M.A.; Asif, M.; Hameed, B.H. Pyrolysis kinetics of raw and hydrothermally carbonized Karanj (Pongamia pinnata) fruit hulls via thermogravimetric analysis. Bioresour. Technol. 2015, 179, 227–233. [Google Scholar] [CrossRef]
  38. Konopel’ko, N.A.; Shakhov, E.M.J.F.D. Rarefied gas flow into a vacuum from a plane long channel closed at one end. Fluid Dyn. 2016, 51, 552–560. [Google Scholar] [CrossRef]
  39. ElhusseinŞahin, S.J.H.; Transfer, M. Drying behaviour, effective diffusivity and energy of activation of olive leaves dried by microwave, vacuum and oven drying methods. Heat Mass Transf. 2018, 54, 1901–1911. [Google Scholar] [CrossRef]
  40. González Martínez, M.; Dupont, C.; Thiéry, S.; Meyer, X.-M.; Gourdon, C. Impact of biomass diversity on torrefaction: Study of solid conversion and volatile species formation through an innovative TGA-GC/MS apparatus. Biomass Bioenergy 2018, 119, 43–53. [Google Scholar] [CrossRef] [Green Version]
  41. Zhang, L.; Li, K.; Zhu, X. Study on two-step pyrolysis of soybean stalk by TG-FTIR and Py-GC/MS. J. Anal. Appl. Pyrolysis 2017, 127, 91–98. [Google Scholar] [CrossRef]
  42. Xin, X.; Pang, S.; de Miguel Mercader, F.; Torr, K.M. The effect of biomass pretreatment on catalytic pyrolysis products of pine wood by Py-GC/MS and principal component analysis. J. Anal. Appl. Pyrolysis 2019, 138, 145–153. [Google Scholar] [CrossRef]
  43. Kim, J.-Y.; Hwang, H.; Park, J.; Oh, S.; Choi, J.W. Predicting structural change of lignin macromolecules before and after heat treatment using the pyrolysis-GC/MS technique. J. Anal. Appl. Pyrolysis 2014, 110, 305–312. [Google Scholar] [CrossRef]
  44. Chen, W.-H.; Wang, C.-W.; Kumar, G.; Rousset, P.; Hsieh, T.-H. Effect of torrefaction pretreatment on the pyrolysis of rubber wood sawdust analyzed by Py-GC/MS. Bioresour. Technol. 2018, 259, 469–473. [Google Scholar] [CrossRef]
  45. Cai, W.; Fivga, A.; Kaario, O.; Liu, R. Effects of Torrefaction on the Physicochemical Characteristics of Sawdust and Rice Husk and Their Pyrolysis Behavior by Thermogravimetric Analysis and Pyrolysis–Gas Chromatography/Mass Spectrometry. Energy Fuels 2017, 31, 1544–1554. [Google Scholar] [CrossRef]
  46. Apicella, B.; Tregrossi, A.; Popa, C.; Mennella, V.; Ciajolo, A.; Russo, C. Study on the separation and thin film deposition of tarry aromatics mixtures (soot extract and naphthalene pitch) by high-vacuum heating. Fuel 2017, 209, 795–801. [Google Scholar] [CrossRef]
  47. Horike, S.; Ayano, M.; Tsuno, M.; Fukushima, T.; Koshiba, Y.; Misaki, M.; Ishida, K. Thermodynamics of ionic liquid evaporation under vacuum. Phys. Chem. Chem. Phys. 2018, 20, 21262–21268. [Google Scholar] [CrossRef]
  48. Yao, M.; Woo, Y.C.; Tijing, L.D.; Choi, J.-S.; Shon, H.K. Effects of volatile organic compounds on water recovery from produced water via vacuum membrane distillation. Desalination 2018, 440, 146–155. [Google Scholar] [CrossRef] [Green Version]
  49. Rahman, S.; Helleur, R.; MacQuarrie, S.; Papari, S.; Hawboldt, K. Upgrading and isolation of low molecular weight compounds from bark and softwood bio-oils through vacuum distillation. Sep. Purif. Technol. 2018, 194, 123–129. [Google Scholar] [CrossRef]
  50. Nsaful, F.; Collard, F.-X.; Görgens, J.F. Lignocellulose thermal pretreatment and its effect on fuel properties and composition of the condensable products (tar precursors) from char devolatilization for coal substitution in gasification application. Fuel Process. Technol. 2018, 179, 334–343. [Google Scholar] [CrossRef]
  51. Tumuluru, J.S.; Boardman, R.D.; Wright, C.T. Response surface analysis of elemental composition and energy properties of corn stover during torrefaction. J. Biobased Mater. Bioenergy 2012, 6, 25–35. [Google Scholar] [CrossRef]
  52. Pimchuai, A.; Dutta, A.; Basu, P. Torrefaction of agriculture residue to enhance combustible properties. Energy Fuels 2010, 24, 4638–4645. [Google Scholar] [CrossRef]
  53. Chew, J.J.; Doshi, V. Recent advances in biomass pretreatment—Torrefaction fundamentals and technology. Renew. Sustain. Energy Rev. 2011, 15, 4212–4222. [Google Scholar] [CrossRef]
  54. Martín-Lara, M.A.; Ronda, A.; Zamora, M.C.; Calero, M. Torrefaction of olive tree pruning: Effect of operating conditions on solid product properties. Fuel 2017, 202, 109–117. [Google Scholar] [CrossRef]
  55. Chen, W.-H.; Liu, S.-H.; Juang, T.-T.; Tsai, C.-M.; Zhuang, Y.-Q. Characterization of solid and liquid products from bamboo torrefaction. Appl. Energy 2015, 160, 829–835. [Google Scholar] [CrossRef]
  56. Adams, P.; Bridgwater, T.; Lea-Langton, A.; Ross, A.; Watson, I. Chapter 8—Biomass conversion technologies. In Greenhouse Gases Balances of Bioenergy Systems; Academic Press: Cambridge, MA, USA, 2018; pp. 107–139. ISBN 9780081010365. [Google Scholar] [CrossRef]
  57. Roddy, D.J. Biomass in a petrochemical world. Interface Focus 2013, 3, 20120038. [Google Scholar] [CrossRef] [PubMed] [Green Version]
  58. Popa, V.I. 1-Biomass for fuels and biomaterials. In Biomass as Renewable Raw Material to Obtain Bioproducts of High-Tech Value; Elsevier: Amsterdam, The Netherlands, 2018; pp. 1–37. [Google Scholar] [CrossRef]
  59. Chen, D.; Gao, A.; Cen, K.; Zhang, J.; Cao, X.; Ma, Z. Investigation of biomass torrefaction based on three major components: Hemicellulose, cellulose, and lignin. Energy Convers. Manag. 2018, 169, 228–237. [Google Scholar] [CrossRef]
Figure 1. The experimental setups for the (a) nitrogen and the (b) vacuum systems.
Energies 12 03844 g001
Figure 2. Profiles of solid (biochar) yield from wood sawdust torrefaction.
Energies 12 03844 g002
Figure 3. Profiles of liquid yields from wood sawdust torrefaction for (a) 30 min and (b) 60 min.
Energies 12 03844 g003
Figure 4. Profiles of (a) atomic H/C ratio versus temperature, (b) atomic O/C ratio versus temperature, and (c) van Krevelen diagram. All of the data presented were of low volatility compounds.
Energies 12 03844 g004
Figure 5. Profiles of the HHV of torrefied wood sawdust in vacuum and nitrogen systems with different temperatures and times.
Energies 12 03844 g005
Figure 6. Energy distribution of biomass sources torrefied at 300 °C for 60 min in (a) nitrogen and (b) vacuum.
Energies 12 03844 g006
Table 1. Proximate, fiber, elemental, and calorific analyses of raw wood sawdust.
Wood Sawdust
Proximate Analysis (wt%)
Volatility matter (VM)74.57 ± 3.89
Fixed carbon (FC)16.41 ± 3.51
Moisture7.72 ± 1.25
Ash1.30 ± 0.73
Fiber Analysis (wt%)
Hemicellulose27.58 ± 4.72
Cellulose46.32 ± 4.10
Lignin8.17 ± 2.33
Other16.71 ± 3.47
Elemental Analysis (wt%, Dry-Ash-Free)
C47.07 ± 2.55
H6.10 ± 1.82
N0.43 ± 0.21
O (by difference)46.40 ± 4.44
HHV (MJ kg−1, dry basis)17.68 ± 1.35
Table 2. Profiles of liquid and solid products from wood sawdust torrefaction.
Operating ConditionsDuration (min)Temp. (°C)Solid YieldLiquid Yield
Biochar (wt%)Low Volatility Compounds (wt%)High Volatility Compounds (wt%)Total (wt%)
N2 (0.1 L/min)3020095.47 ± 1.221.92 ± 0.210.72 ± 0.322.64 ± 0.72
22594.26 ± 1.012.34 ± 0.241.64 ± 0.433.98 ± 1.02
25090.92 ± 2.112.50 ± 0.352.37 ± 0.154.88 ± 0.57
27577.46 ± 1.826.11 ± 1.6111.36 ± 1.2517.48 ± 2.32
30065.97 ± 2.318.01 ± 2.3715.93 ± 2.5223.94 ± 3.19
N2 (0.1 L/min)6020094.29 ± 1.420.32±0.382.69 ± 0.423.01 ± 0.93
22590.02 ± 1.832.92 ± 0.822.41 ± 0.455.33 ± 1.34
25083.03 ± 2.033.26 ± 0.877.55 ± 0.6410.81 ± 1.38
27570.44 ± 2.673.82 ± 1.3212.79 ± 2.2116.61 ± 2.58
30056.91 ± 3.479.65 ± 2.5321.38 ± 3.5231.03 ± 3.57
Vacuum3020095.20 ± 0.73-1.83 ± 0.541.83 ± 0.54
22592.97 ± 1.34-3.24 ± 1.323.24 ± 1.32
25090.33 ± 1.930.54 ± 0.924.48 ± 0.745.02 ± 1.02
27577.45 ± 2.781.65 ± 0.7213.63 ± 1.8415.28 ± 3.13
30064.61 ± 3.674.98 ± 2.7714.70 ± 3.5219.68 ± 4.28
Vacuum6020093.19 ± 0.50-3.09 ± 1.193.09 ± 1.19
22589.34 ± 1.02-5.74 ± 1.215.74 ± 1.21
25081.47 ± 3.880.65 ± 0.218.32 ± 3.318.97 ± 3.25
27569.76 ± 3.785.11 ± 0.9219.17 ± 0.5824.28 ± 1.82
30056.08 ± 4.338.61 ± 3.5324.61 ± 3.8233.21 ± 4.95
Table 3. Relative peak area distribution of the main products for biomass in GC/MS with vacuum and nitrogen systems.
Bio-Low Volatility Compounds FractionFormulaN2 (300 °C, 60 min)Vacuum (300 °C, 60 min)
Low Volatility CompoundsHigh Volatility CompoundsLow Volatility CompoundsHigh Volatility Compounds
RT%RT%RT%RT%
FurfuraC5H4O21.6991.381.6129.32----
2-FurancarboxaldehydeC5H4O22.2761.082.2743.13--2.2722.18
1,2-CyclopentanedioneC5H6O22.9081.652.8721.642.8591.002.8751.17
2-methoxy-PhenolC7H8O23.6742.033.6502.703.6490.743.6502.06
MaltolC6H6O33.9031.043.8580.813.8560.553.8560.71
CreosolC8H10O25.2191.125.1851.785.1860.725.1831.43
1,2-BenzenediolC6H6O26.4071.386.1590.636.2360.676.2150.42
4-ethyl-2-methoxy-PhenolC9H12O26.6040.976.5651.096.5640.516.5630.63
2-Methoxy-4-vinylphenolC9H10O27.1061.107.0590.767.0661.287.0610.82
2,6-dimethoxy-phenolC8H10O37.7194.487.5593.05----
EugenolC10H12O27.8470.527.7920.567.7980.677.7910.69
2-methoxy-4-propyl-phenolC10H14O28.0280.557.9880.43----
VanillinC8H8O38.3541.098.1330.438.1720.838.1370.55
trans-isoeugenolC10H12O28.6000.568.5640.478.5660.538.5630.52
3,5-Dimethoxy-4-hydroxytolueneC9H12O39.2533.839.1021.749.1361.979.1041.30
2-methoxy-4-(1-propenyl)-PhenolC10H12O29.2951.559.2011.319.2171.289.2041.36
ApocyninC9H10O39.7241.129.5030.449.5470.649.5110.53
2,6-dimethoxy-4-(2-propenyl)-PhenolC11H14O3--11.3890.6911.4131.2211.3950.83
4-hydroxy-3,5-dimethoxy-BenzaldehydeC9H10O4--11.9110.7111.9851.1711.9361.17
2,6-Dimethoxy-4-(prop-1-en-1-yl)phenolC11H14O312.8934.7212.7272.2912.7813.3212.7442.99
4-Hydroxy-2-methoxycinnamaldehydeC10H10O3--12.9010.24--12.9351.21
2,9-Dimethyl-2,3,4,5,6,7-hexahydro-1H-2-benzazonineC14H21N15.8770.33--15.8170.32--
3,5-Dimethoxy-4-hydroxycinnamaldehydeC11H12O416.1810.8515.9660.5016.0581.27--
gamma-phenyl-carbonic acidC10H10O2--16.4240.17----
n-Hexadecanoic acidC16H32O216.5220.65--16.4520.51--
4,4’-(1-methylethylidene)bisphenolC15H16O2--18.1660.0518.2350.37--
Oleic AcidC18H34O218.4460.54--18.3850.49--
Octadecanoic acidC19H36O218.7270.1418.6870.1018.6950.13--
Dehydroabietic acidC20H28O220.9980.06--20.9810.14--
Table 4. Elemental analysis of raw and torrefied samples (dry-ash-free) in vacuum and nitrogen systems.
ConditionDuration (min)Temp. (°C)SolidLiquid
Biochar(wt%, Dry Basis)Low Volatility Compounds (wt%)High Volatility Compounds (wt%)
C (%)H (%)O (%)H/C Atom RatioO/C Atom RatioC (%)H (%)O (%)H/C Atom RatioO/C Atom RatioC (%)H (%)O (%)H/C Atom RatioO/C Atom Ratio
Raw--47.706.1945.671.540.71----------
N2
(1 L/min)
3020047.676.6046.171.650.733.069.4486.6436.7521.253.6010.1385.4833.5317.83
22547.96.4845.581.610.716.569.0783.6516.479.574.3910.4484.4828.3414.45
25050.716.5343.541.530.647.558.0883.4012.758.295.0310.7683.6625.4912.49
27553.755.8139.411.290.5527.968.5861.853.651.6616.769.1473.426.503.29
30053.755.4840.251.210.5634.168.4955.912.961.2217.697.9873.015.383.10
N2
(1 L/min)
6020050.016.2743.171.490.643.5011.3584.2238.6418.063.4111.7884.3141.1618.56
22549.485.9244.021.420.667.589.9581.7715.648.106.3710.2782.7419.219.75
25049.065.6644.791.370.6830.628.2259.943.201.4714.817.8076.476.283.88
27555.225.5938.521.200.5249.907.7940.541.860.6119.239.7370.536.032.75
30052.204.9042.191.110.6050.397.4540.841.760.6116.847.4475.165.263.35
Vacuum3020048.676.3744.461.560.69-----1.7510.4687.3971.2237.48
22548.246.4845.161.600.70-----2.2212.7984.4968.6528.57
25048.216.0445.371.490.71-----8.1811.5379.7616.807.32
27554.216.3638.921.400.5452.147.2139.161.640.5618.888.8170.875.562.81
30054.455.7539.341.260.5453.837.4137.241.640.5125.737.0067.053.241.95
Vacuum6020047.365.7846.241.450.73-----5.3911.4782.4925.3611.49
22549.875.9543.651.420.66-----7.717.0183.8910.838.17
25051.655.7642.221.330.6155.517.1234.871.530.4718.149.5071.066.242.94
27554.305.4239.721.190.5552.537.0039.121.590.5618.627.8472.535.022.92
30056.355.1538.001.090.5153.097.0138.281.570.5432.669.9755.993.641.29
Table 5. HHVs of untreated and torrefied biomasses.
ConditionTime (min)Temp. (°C)SolidLiquid
Biochar HHV (Dry Basis) (MJ/kg)Low Volatility Compounds HHV (MJ/kg)High Volatility Compounds HHV (MJ/kg)
Raw--17.687--
N2
(0.1 L/min)
3020017.6622.9021.160
22517.5834.4031.653
25018.6374.9784.429
27519.99510.7216.628
30021.30813.7626.839
N2
(0.1 L/min)
6020018.4963.5331.021
22518.6245.1971.026
25019.6059.6445.499
27521.51817.6856.425
30024.07119.2056.816
Vacuum3020018.561-1.455
22518.624-1.533
25018.64715.6001.776
27519.46519.0346.724
30020.51219.1019.131
Vacuum6020018.431-2.801
22518.970-5.047
25019.235-5.804
27521.69819.7266.921
30022.52119.4509.333

