Abstract
Green products, clean energy, energy union, green buildings, eco-innovations, environment-related, and similar initiatives and policies have become very popular and widely applied all over the world. A pleasant built environment (parks, flowerbeds, beautiful buildings) and a repulsive environment (noise, polluted surroundings) influence a buyer’s outlook on an advertisement differently. An aesthetic, comfortable, and clean built environment evokes positive emotional states, not only at the time of housing selection and purchase but during the building’s life cycle as well. Potential housing buyers always feel comfortable in certain built environments, and they are inclined to spend more time there. The issues needing answers are how to measure the segmentation/physiological indicators (crowd composition by gender and age groups), as well as the emotional (happy, sad, angry, valence) and physiological (heart rate) states of potential homebuyers realistically, to produce an integrated evaluation of such data and offer buyers rational, green, and energy efficient housing alternatives. To achieve this purpose, the Multisensory, green and energy efficient housing neuromarketing method was developed to generate the necessary conditions. Here, around 200 million multisensory data recordings (emotional and physiological states) were accumulated, and the environmental air pollution (CO, NO2, PM10, volatile organic compounds) and noise pollution were investigated. Specific green and energy efficient building case studies appear in this article to demonstrate the developed method clearly. The obtained research results are in line with those from previous and current studies, which state that the interrelation of environmental responsiveness and age forms an inverse U and that an interest in green and energy efficient housing depends on age.
1. Introduction
Energy, climate change, and energy poverty are issues causing tremendous challenges to the building sector due to their consumption of environmental factors [1]. Combined, buildings and the building construction sector consume around 36% of the total global energy. These sectors also cause nearly 40% of the total direct and indirect CO2 emissions. Meanwhile, the continual (almost 3% annually) rise in the energy demand from buildings and building construction is due to developing countries improving their access to energy, the increased use of energy-consuming devices, and the rapid growth in the floor areas of global buildings [2].
A number of scholars have analyzed the reasons behind increasing the energy efficiency in buildings, as matters of economy, comfort, behavior, aesthetics, history, culture, and emotions, among others [3,4,5,6,7,8]. Corrado and Ballarini [3] noted the very complex issues are involved in the refurbishment of building energy including economic, aesthetic, historical, cultural and emotional aspects. These factors generally overwhelm concerns about comfort and energy efficiency improvements. The latest studies alone note behavioral or psychological factors to have greater importance when it comes to encouraging the establishment of energy-efficient buildings. Decision-making, from a psychological perspective thus becomes an irreplaceable foundation for developing and implementing effective interventions in addition to marketing strategies and communication campaigns to foster interest in energy-efficient housing [4]. Klockner et al. [5] examined psychological and structural facilitators along with barriers that interfere with implementing energy upgrades in privately owned buildings. Elements of importance to residents include the development of better living conditions that include comfort at levels higher than initially expected, lowered costs for energy, and a greater selling price. Residents need to understand that the current standards in buildings are simply a waste of energy. Energy efficiency upgrades are of greater interest among people with limited economic resources. Wilson et al. [6] studied people’s emotional and symbolic connections with their current homes to see how these perspectives affect their expectations of comfort and the ensuing renovations in which they engage. An innovative policy regarding reduced energy demands was the result of an analysis by Reimann et al. [9] on the relationship between building energy efficiency, aesthetic features, and marketability. After comparing both the utilitarian and hedonic motivations that motivate the acquisition of a housing unit, it was found that the hedonic stimuli predominate in marketing strategies, since these motivations prompt the tendency and willingness to pay higher prices, which are crucial positive reactions among buyers. With hedonic stimuli, buyers find higher emotional value in a proposed home and find it irresistible, making them want to quickly move into the home [9].
Numerous researchers have shown that, when wanting to assure effective efficiencies in the life cycle of a building, it is essential to consider the social, emotional, and other determinants of potential buyers [4,10,11,12,13,14]. For example, Picon et al. [11] believe that, although the end uses of energy in a building are seemingly decent forecasters of a building’s energy consumption, these elements fail to consider certain important points related to human behavior. Such models must take into account socio-psychological aspects, including perception, memory, planning, cognition, emotions, and decision-making when talking about human behavior. These aspects are rarely integrated within the scope of energy usage in buildings, because modeling these aspects is quite complex [11]. Schaffner et al. [4] outlined the social and emotional aspects that come into play when making a decision to move into an energy-efficient home. Empirical research has shown the influence of emotions on pro-environmental behavior; however, this result is relatively novel and is only rarely adopted in practice. Evidence indicates that simple information about attitudes is nowhere near as effective as marketing strategies pinpointing emotions, e.g., the guilt a person feels for not living in an energy-efficient home, or addressing positive feelings, e.g., the pride that comes with living in a low-energy home. Baginski and Weber [12] indicate the implications of refurbishment, which measures a high cognitive as well as emotional involvement. An analysis of passive house energy use, comfort, microclimate, quality of life, and aesthetics, as well as a home’s technical, economic, legal/regulatory, educational, and innovative aspects requires the use of simulation tools. Meanwhile the existence of a passive house involves the impact of social, cultural, ethical, psychological, emotional, religious, and ethnic aspects over its entire life. However, these aspects generally receive minimal attention. All these mentioned aspects require an integrated analysis during the life cycle of a passive house [10]. Great difficulty lies with people who feel incapable of performing or commissioning a refurbishment for energy efficiency and those who do not perceive a sufficient personal benefit from such a project. Motivating these people into action is unlikely until their own personal emotions move them. An evaluative method for assessing actions against personal goals and an individual’s capabilities should involve emotions [13]. Schaffner et al. [4] are of the opinion that benefits beyond financial gains are even more important for a decision to renovate. Such benefits include emotional factors, aesthetics, and ambiance. Economic and emotional factors blend when people act on a decision to purchase property, while considerations about energy savings and financial gains are more rare. Aune [15] believes that emotional connections to the home also intrinsically relate to energy efficient renovations and, more generally, to the use of energy. Different members in a household are likely to ascribe different characteristics to their homes when they consider making physical changes to their home (such as “home is a haven” and “home is an arena for activities”) [15].
The somatic marker hypothesis, framed by Damasio [16], suggests that emotional developments guide behavior and decision-making. Since feelings are related to bodily sensations, Damasio [16] termed this phenomenon a somatic state (“soma” means body in Greek). Damasio [16] named this state a marker, because it “marks” an image. Damasio applied the term somatic in the broadest sense of relating to the body. His mention of somatic markers includes both visceral and non-visceral sensations. He believes that emotions play a fateful role, even when making the simplest everyday decisions. For example, whenever an individual receives a somatic marker that links to a positive result, he/she might feel happy and, thus, might be inspired to follow that same behavior. When the somatic marker received links to a negative consequence, the individual could feel sad. This acts as an internal alarm to warn the person away from avoid engaging in that action [16]. This study applies the somatic marker hypothesis.
Potter et al. [17] analyzed the integration of self-reporting (interviews, surveys) and nonconscious (brain waves, skin conductance, heart rate, muscle movement, etc.) measures. They developed three wide-ranging self-report measures that can be effectively integrated with biometrics. Lennox et al. [18] positively analyzed the need, feasibility, and validity of integrating two biometric and three self-report measures of substance use for marijuana, cocaine, opioids, alcohol, and other drugs.
Traditionally, demographic segmentation splits up potential buyers according to variables such as gender, age, and education. Many current biometric systems analogously collect ancillary data like gender, age and other biometric characteristics [19,20,21]. “Soft” biometric traits like gender, height, weight, age, and ethnicity can complement the identity information provided by primary biometric identifiers, and Jain et al. [19] proposed precisely such a utilization. Another example is the gathering of biometric information, such as identity, gender, ethnicity, and age, from the walking patterns of people, known as Biometric gait analysis [20]. The positioning of the present research is as a marketing study. Therefore, the indicators of crowd composition considered for this study are segmentation indicators, rather than physiological states. This is the basis for eliminating misinterpretations of marketing terminology in this research. It is also necessary to ensure the accuracy of the physiological and demographic markers that have been measured. A number of researchers [22,23,24,25,26,27,28,29,30,31] have analyzed various green marketing variables.
The academics named above have considered the marketing of green and energy efficient buildings along with the diverse variables influencing buildings and their interdependencies. Nevertheless, these scholars have not jointly examined the segmentation/physiological indicators (crowd composition by gender and age groups) and emotional (happy, sad, angry, valence) and physiological (heart rate) states of the individuals under analysis, alongside the built environment surrounding them and the air pollution and noise pollution the environment contains.
This paper is structured as follows: Section 2 presents the multisensory, green, and energy efficient housing neuromarketing method; Section 3 assesses the accuracy of physiological and demographic markers; Section 4 provide two case studies on green and energy efficient buildings, Section 5 delivers a correlational analysis of the dependent variables of heart rate, and discussion and conclusions appear in Section 6.
2. A Multisensory, Green, and Energy Efficient Housing Neuromarketing Method
The VINERS Method is an integrated composite consisting of the Somatic Marker Hypothesis by Damasio [16], biometric and physiological, methods [32]. This method offers a spatial multiple criteria analysis of categorical data using neuromarketing analytical methods, such as generating human affective attitudes maps along with maps of emotional and physiological states [33], applying a combinatorial method to develop various neuro-advertisement combinations, and engaging in statistical analysis (LOGIT, KNN, MBP, RBP) and multiple criteria analysis methods [32]. The stages of the multisensory, green, and energy efficient housing neuromarketing method appear below.
Stage 1. Preparation of the neuro decision-making matrix and initial data for the correlation analysis, taking into account the emotional–physiological state of different age groups and genders. This matrix consists of three criteria groups:
- ▪
- Criteria defining green and energy efficient dwelling projects (see Section 4.1.1);
- ▪
- Criteria defining local pollutants, including CO, NO2, PM10, volatile organic compounds, and noise (see Section 4.1.2, Table 1);
 Table 1. Data on the air and noise pollution measurements at the six Vilnius city locations.
 - ▪
- Criteria defining the depersonalized emotional–physiological states of passers-by at six sites, including happiness, sadness and, anger, as well as valence and heart rate (see Section 4.1.3).
The six selected locations in Vilnius City, Lithuania, were sites projected to be used for advertising and the brokerage of green and energy efficient housing. Of these, four were selected for a multicriteria analysis in the green and energy efficient residence project. Data from all six sites were used to compare the results of similar studies conducted by the authors of this study and others worldwide. Here, measurements were conducted on pollution, as well as on segmentation/physiological indicators (crowd composition by gender and age groups), emotional (happy, sad, angry, and valence), and the physiological (heart rate) states of passers-by by applying biometric techniques and technologies from 2017 November until 2019 June. The equipment subsystem for emotional and physiological states includes a FaceReader 7.1 with an additional remote photoplethysmography module, an X4M200 respiration sensor, an infrared camera FLIR A35SC, and a H.264 indoor mini dome IP camera. The gathering of the aforementioned data took place every second. We used the technology (Noldus Information Technology [34] and XeThru technology [35]) and techniques of the devices mentioned during the research. For example, a technique called the Viola Jones cascaded classifier algorithm was used to discover the position of a face in an image. Thus, this algorithm was developed to locate faces within images [36]. The Active Appearance Model, a model-based face modeling method was used [37]. This model synthesizes an artificial face model by describing the sites of 500 key facial points along with the facial texture of the area that these points entangle. Additionally, we employed the Method for Automatic Facial Expression Recognition [38], the Facial Action Coding System (a technique for measuring facial movements [39]), and the Participant and Continuous calibration methods found in FaceReader [34].
Each set of equipment has certain requirements:
- ▪
- High-speed Internet access with a 600 MB/s minimum is required. The access to the Internet may be by cable or by two wireless 300 MB/s networks. There is a 50 GB/s upload speed required. An unlimited amount of data is also required each month for the equipment subsystem. Meanwhile, the signal strength quality should not be <4/5. Furthermore, there must be a static external IP address.
- ▪
- A grid connection must be included.
- ▪
- An identification of all optimal sites under analysis is required. The depersonalized, emotional–physiological states of anonymous passers-by at six sites must be taken from a distance of 20 m.
The multisensory, green, and energy efficient housing neuromarketing method was used to process the obtained data and present the analysis and the results (see Figure 1).
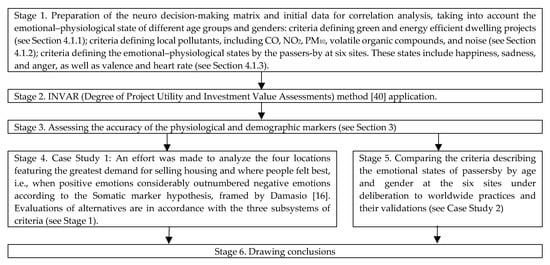
Figure 1.
General layout of the multisensory, green, and energy efficient housing neuromarketing method.
The same research methods listed above were applied to all the depersonalized segments of the passersby according to their age groups (children and adults). Table 2 presents the sizes of the research groups.
Table 2.
Human emotion measurements.
As of 25 May 2018, the General Data Protection Regulation (GDPR) is applicable to all EU member states. Due to the GDPR requirements and the laws of Lithuania, a data protection and impact assessment for the equipment subsystem was performed to gather the aforementioned data. This Data Protection Impact Assessment enabled us to gather the needed depersonalized data described above for this research.
An effort was made to establish the groups of passersby who felt happiest and had the least negative emotions at the named locations. The plan was to conduct an advertising campaign for selling green and energy efficient dwellings aimed at the happiest groups of passersby. This plan corresponded to the Somatic marker hypothesis proposed by Damasio [16]. This hypothesis states that, when a somatic marker linked with a positive result is received, an individual might feel happy and thus become inspired to follow that same behavior. When a somatic marker linked with a negative consequence is received, the individual could feel sad, which then acts as an internal alarm to warn the person to avoid engaging in that action [16].
Stage 2. Applying the INVAR (Degree of Project Utility and Investment Value Assessments) method. The goal in conducting multiple criteria analyses at the selected locations was to establish rational and emotional market segments by geographic criteria (air and noise pollution present at four Vilnius intersections), demographic criteria (males and females aged 21–30 years and 31–40 years), and psychographic and consumer behavior criteria (happy, sad, and angry, along with valence and heart rate). The multicriteria analysis was performed by applying the INVAR Method [40]:
- Step 1. Calculating the weighted, normalized decision matrix (D);
- Step 2. Calculating the sums of beneficial attributes (S+j) and non-beneficial attributes (S−j);
- Step 3. Determining the relative significances or priorities of alternatives based on positive and negative aspects of the alternative characteristics;
- Step 4. Determining the rank of an alternative;
- Step 5. Calculating the utility degree of each alternative;
- Step 6. Determining if the integrated value x1j (cycle e) of the alternative aj can be accomplished by means of e approximations;
- Step 7. Optimizing the xij that is possible for any criterion over e approximations;
- Step 8. Presenting indicator xij of quantitative recommendation iij showing the percentage of a possible improvement in the value of indicator xij for it to become equal to the best value xi max of criterion Xi among the potential alternatives;
- Step 9. Calculating indicator xij of the quantitative recommendation rij showing the percentage of the possible improvement of utility Uj of the alternative aj upon presenting xij = xi max;
- Step 10. Calculating the approximation e cycles needed for the value of xij (cycle e) to make alternative aj become the best of all potential alternatives;
- Step 11. Verifying and Validating different research from earlier studies [41,42] and presenting detailed calculations performed using the INVAR method.
Stage 3. We present an assessment of the accuracy of the physiological and demographic markers in Section 3.
Stage 4. The goal of Case Study 1 was to analyze the multiple criteria of housing alternatives. The goal was to analyze the four locations with the greatest demand for selling housing and where people felt best, i.e., when positive emotions considerably outnumbered negative emotions according to the Somatic marker hypothesis, framed by Damasio [16].
Stage 5. Comparing the criteria describing the emotional states of passersby by age and by gender at the six sites under deliberation to worldwide practices and their validations (see Case Study 2).
Stage 6. Drawing conclusions. Upon performance of the analysis, the market is segmented by geographic criteria (air and noise pollution levels at six Vilnius intersections), demographic criteria (males and females aged 21–30 years and 31–40 years), and psychographic and consumer behavior criteria (happy, sad, and angry, along with valence and heart rate). In this way, the segment of greatest demand for brokering green and energy efficient dwellings was established.
3. Assessing the Accuracy of the Physiological and Demographic Markers
The accuracy of physiological (heart rate, etc.) and demographic (age and gender) markers is of particular importance in this and other similar studies. We measured the values of the physiological (heart rate) and demographic (age and gender) markers with FaceReader 7.1 using an additional remote photoplethysmography module.
Loijens et al. [43] believe that FaceReader, which ensures an accuracy of 90%, is an efficient analysis tool for emotions. Significant similarities were noticed between self-reports, FaceReader outputs, and the researchers’ observations [44]. In terms of ethnicity, FaceReader did best when reading the emotions of Dutch people (91%), followed by Caucasians (88%). The worst performance (86%) was for people of Turkish–Moroccan origin [45]. To validate FaceReader, Lewinski et al. [45] looked at facial expression recognition accuracy by using two publicly available and objective datasets of basic human emotions. Matching scores of 89% were reported for FaceReader in 2005. They tested Version 6.0 and discovered that FaceReader recognized 88% of the target human emotion labels in the Amsterdam Dynamic Facial Expression Set (ADFES) and Warsaw Set of Emotional Facial Expression Pictures (WSEFEP). For both datasets, the FACS index of agreement averaged 0.69—indicating a recognition accuracy of 85%. They also calculated the recognition accuracy for each dataset separately and determined that it was 82% for WSEFEP and 87% for ADFES. Lewinski et al. [45] believe that FaceReader has proven its potential over the past decade and is a reliable tool for basic emotion reading from facial expressions; with FACS coding, FaceReader may become similarly robust. Researchers have reported a general FaceReader 6.0 accuracy of 88% for basic emotions. For specific emotions, they use a value of 1. For FACS accuracy, the FaceReader index of agreement is 0.69. Similar results for FaceReader’s validity and accuracy have been reported by other researchers [43,46], whose views on Noldus Information Technology, the manufacturer of the equipment, are similar.
By means of remote photoplethysmography (RPPG), FaceReader can estimate a subject’s heart rate when the person is in front of the camera. This method relies on the fact that the changes in blood volume caused by pressure pulses create minor changes in the skin’s reflectance. Before estimating, FaceReader needs a 10 s calibration period to sample and process the signal of the skin colour for a reliable measurement. The system calibrates at the start of analysis and then every time when it locks on the participant’s face again after the face leaves the field of view for some time. The pulses over the previous ten seconds for each time step are used to calculate the heart rate. With proper face illumination, FaceReader, by means of a remote PPG Module, can detect the changes in blood volume caused by the pressure pulse. In charts tracking reflectance over time, each cardiac cycle appears as a peak. The heart rate average and variability can be determined based on this information. Tasli et al. [47] summarized the accuracy of this estimated heart rate. Tasli et al. [47,48] confirmed that the heart rate estimated by FaceReader is accurate. The key drawback of this method is its poor performance when lighting is bad. FaceReader compensates for most head movements, but with poor lighting, the performance of the proposed technique may decrease (Tasli et al. 2014b). Our locations were lit throughout the dark hours.
FaceReader was better at recognising emotions in female faces with an accuracy of 89%, compared to 86% for males [49]. Instant FaceReader measurements were compared with the gender emotions estimated by the researchers. Statistical analysis of the two genders’ emotions (disgusted and angry) revealed differences between the results produced by the FaceReader and those determined by the researchers. However, significant agreement was also observed between the results determined by FaceReader and the researchers after their analysis of the various emotional states displayed by each gender [49]. To determine whether there were differences in the accuracy scores between humans and FaceReader, an independent samples t-test was run. For humans, the accuracy scores were lower (M = 0.59, SD = 0.23) compared to those of FaceReader (M = 0.90, SD = 0.14), and the difference was statistically significant (M = −0.31, 95% CI (−0.37, −0.26)), (t (167.96) = 11.62, p < 0.0005). Out of 100 neutral images, FaceReader, on average, recognized 90 images as neutral and outperformed humans—who recognized only 59 images as neutral—by 31%, i.e., it accurately recognized 31 more images than humans recognized [50].
Heart rate depends on the air temperature, circadian rhythm, age (averaging up to 100 beats per minute for toddlers up to the age of 2 years, 95 beats per minute for children aged 3–7, 80 for children aged 8–14, 70–75 for adults, and 70–73 for elderly people), physical activity, various diseases and certain medications, fever (it adds up to 8–10 beats per minute), sex (women have higher heart rates than men), intense emotions (stress, anger, and fear), energising products (tea, cigarettes, and coffee), external environment, and other factors. At rest, most adults have a heart rate between 60 and 100 beats per minute.
Many studies around the world have measured heart rate in a natural environment. Generally, these studies also do not provide alternative explanations for variations in heart rate, but they have determined very accurate heart rate trends and correlations in specific areas, such as the air temperature, age, physical activity, air pollution, wind, atmospheric pressure, various diseases and certain medications, fever, sex, intense emotions, arousal, energising products, circadian rhythm, external environment, and other factors. An overview of several of the studies follows in the next sections.
4. Case Studies
4.1. Compilation of a Neuro Decision-Making Matrix
The results of worldwide research [16,51,52,53] indicate that people would like to live where they feel best—where positive emotions considerably exceed the negative emotions. The objective of this Case Study was to establish the most rational market segments by geographic criteria (four green and energy efficient housing units at the intersections under analysis along with the respective levels of air and noise pollution within them), demographic criteria (21–30 and 31–40-year-old males and females), and psychographic and consumer behavior criteria (happiness, sadness, anger, valence, and heart rate). The basis for this segmentation is the Somatic marker hypothesis, which Damasio [16] framed, as well as the Multisensory, green, and energy efficient housing neuromarketing method (see Section 2). A neuro decision-making matrix was compiled to accomplish this objective. This matrix consists of three criteria groups:
- ▪
- Criteria defining green and energy efficient dwelling projects (see Section 4.1.1);
- ▪
- Criteria defining local pollutants including CO, NO2, PM10, volatile organic compounds, and noise (see Section 4.1.2);
- ▪
- Criteria defining the depersonalized emotional–physiological states by passers-by of six sites including happiness, sadness, and anger, as well as valence and heart rate (see Section 4.1.3).
Descriptions of these criteria groups are as follows.
4.1.1. Green and Energy Efficient Dwelling Projects under Analysis
Criteria for the four green and energy efficient dwelling projects are further analyzed (see Figure 2 and Table 3). There were four housing unit development projects selected at the intersections under analysis. An energy class A residential building with modern recuperators, plastic windows with dual-pane packets and selective glass, a nearly doubly insulated roof, and an arranged green area was analyzed at the Kareivių, Kalvarijų, and Ozo Sts. intersection. Class A buildings utilize approximately 20 kWh/m2 over one heating season. Modern recuperators help to achieve this kind of effectiveness. The window frames in Class A buildings have as much as 30% better thermal performance due to the help of plastic windows with two-chamber glass units and specially selected glass. The walls of these buildings are also thicker, which contributes to their better thermal performance that the graphite in their composition would otherwise provide. The building roofs are nearly doubly insulated and contain nearly 42 cm of insulation materials. Ventilation equipment (recuperation systems) will be installed in the dwelling units, which will retain some of the warmth in conjunction with the fresh air being supplied (see Figure 2a and Table 3).
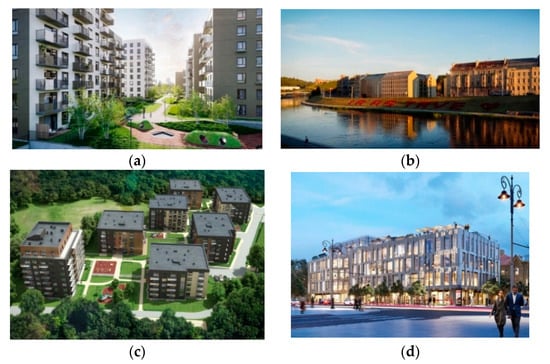
Figure 2.
Four dwelling projects at the intersections under analysis: (a) Linkmenų Lakes residential complex at the Kareivių, Kalvarijų, and Ozo Sts. Intersection; (b) new Žygimantų dwelling units in the Old Town at the Žygimantų and T. Vrublevskio Sts. Intersection; (c) Veikmė Park building at the Santariškių and Baublio Sts. Intersection; (d) live Square at the Pamėnkalnio, Jogailos, Islandijos, and Pylimo Sts. Intersection.
Table 3.
Neuro decision matrix of 24 Vilnius City market segments for green and energy efficient residential projects.
The residential building under analysis at the Žygimantų and T. Vrublevskio Sts. intersection has an A+ class energy utility status with wooden windows. Žygimantų 12 offers new dwelling units in Old Town. The two corpuses comprising this building are named Upė (River) and Bokštai (Towers). This is a Class A+ project in terms of its energy benefits and was developed with modern stylistic traditions, the highest quality materials, the latest in construction technologies, sustainable materials and processes, functionality, and comfort (see Figure 2b and Table 3).
The third housing unit has an A+ class of energy utility with geothermal heating and a smart regulating system for heat. It is located at the Santariškių and Baublio Sts. intersection near a green relaxation zone. The A energy class building under analysis at the Pamėnkalnio, Jogailos, Islandijos, and Pylimo Sts. intersection contains a facade with a glass–aluminum construction system, wooden window frames, and a planted rooftop. The House of the Veikmė Park complex consists of six five-story and one eight-story building. The expectation for this square is for it to contain 250 dwelling units with sizes ranging from 40 to 105 m2 each. Units consisting of two and three rooms (with areas ranging from approximately 50 to 70 m2) will predominate (see Figure 2c and Table 3).
Live square: this is a sphere in the center of Vilnius, which is pulsating with life and innovativeness, and filled with the lives of modern-day city dwellers and culture. This sphere helps to awaken the Gedimino Prospect and opens it to active life, work, and existence in the here and now. Greenery covers the rooftops of the buildings, allowing people to use them as terraces that open up into the panorama of the city’s center (see Figure 2d and Table 3).
4.1.2. Intersections under Analysis with Their Levels of Air and Noise Pollution
Measurements of the air and noise pollution involved testing for the presence of CO, NO2, PM10, volatile organic compounds, and noise at the six Vilnius street intersections: (1) the Kareivių, Kalvarijų, and Ozo Sts. intersection, (2) the Žygimantų and T. Vrublevskio Sts. intersection, (3) the Santariškių and Baublio Sts. intersection, (4) the Šventaragio and Pilies Sts. intersection, (5) the Šventaragio St. and Gedimino Pr. intersection, and (6) the Pamėnkalnio, Jogailos, Islandijos, and Pylimo Sts. Intersection (Table 1).
Table 1 presents the criteria according to which the measurements are to be performed, their units of measurement, and their allowable values, as defined by regulations. The analysis of human emotions was performed with the FaceReader 7.1 software. Table 1 displays the six locations in Vilnius City earmarked for measurements of air and noise pollution.
An analysis of the measurement results of particulate matter shows that the norms were not exceeded. There is an especially huge concentration of pollutants at intersections. Pollution consisting of particulate matter reaches up to 0.08 mg/m3 at intersections. Conversely, the measurements of NO2 and CO indicated that the concentration of nitrogen dioxide considerably exceeds the highest level of allowable pollutants at intersections (0.07 mg/m3). Meanwhile the concentration of CO in the air of the environment exceeds the permissible level for street intersections, since it reached 7.02 mg/m3. Volatile organic compounds consist of gasses of any sort that are exuded by oil and gasoline products. The greatest permissible concentration in the air of a residential environment is 5 mg/m3, according to Lithuania’s hygiene norm HN 35:2007 [54], while the greatest concentration of pollutants in a one-day period is 1.5 mg/m3. Studies have shown that these norms are exceeded at street intersections with intense traffic. An analysis of noise measurement data revealed that noise levels decrease the further one moves away from the streets. Experiments have established that, once noise decreases by 10 dB, the human ear understands this as a two-times greater decrease in noise. Therefore, as one moves a further distance from the streets, the level of noise decreases several times.
To determine the correlations between the attributes of the above-named pollutants (see Table 1), the Pearson correlation coefficient (PCC) was calculated for each pair of attributes, e.g., CO-noise, CO-NO2, etc. The obtained values for all attribute pairs are distributed in intervals (0.75; 0.95), which shows a strong correlation between the attributes under investigation. Such a strong correlation can be explained by the fact that the source of air pollution is the same—road transport.
4.1.3. Criteria Describing the Depersonalized Emotional–Physiological States of Local Passersby
For the analysis of human emotions, the parameters of the happy, sad, and angry states along with the valence and heart rate parameters of the passersby were measured at six intersections of Vilnius streets (see Table 1). The passersby were categorized by gender (male or female) and age groups. Age groups were defined as those aged 10–20, 21–30, 31–40, 41–50, and 51–60 years.
The above-mentioned six selected locations also became the sites used to measure the happiness, sadness, and anger of passersby, along with their valence and heart rate. Around 200 million data were accumulated for the emotional and physiological states, valence, and arousal of passersby. Table 2 displays the aggregated results of these measurements. Data on the depersonalized emotional–physiological states of passersby were subdivided by sex and age groups (ages 10–20, 21–30, 31–40, 41–50, and 51–60 years). Happy, sad, and angry states were measured by points ranging from 0 to 1. The higher the rating, the more dominant the respective emotion. For example, the analysis conducted on the data consisting of measurements taken at the Šventaragio and Pilies Sts. intersection of females aged 31–40 years established sadness as the dominant emotion (0.16). Conversely, the analysis of measurements taken at the Kareivių, Kalvarijų, Ozo Sts. intersection for males aged 51–60 years showed happines to be the predominate emotion (0.22). On the other hand, valence portrays the strength of either positive or negative emotions. The size of valence fluctuates from −1 (maximally negative emotions predominating) to +1 (greatest positive emotions predominating). The analysis of the emotions among males and females aged 31–40 years at the Šventaragio and Pilies Sts. intersection showed a predominantly negative valence (respectively, −0.09 and −0.10). Heart rates were also measured.
The basis for compiling the neuro decision-making matrix for alternative, green, and energy efficient dwelling projects consisted of the data presented above. Table 3 presents the 24 (3 × 4 × 2 = 24) alternatives compiled by differentiating the three groups of potential buyers (male, female, and families) of two age groups (ages 21–30 and 31–40 years) and four dwelling projects (A1–A3 and A6). The data on pollution at the four locations under deliberation were taken from Table 1. The emotional–physiological indicators of the two age groups of the three potential buyer groups were taken from Table 2. Meanwhile Capital, a real estate agency, submitted data on the four green and energy efficient residential projects.
4.2. Case Study 1: Multiple Neuro Criteria Analysis of Four Green and Energy Efficient Residential Projects
The objective of this Case Study was to establish the most rational market segments. This segmentation is done according to geographical criteria (four green and energy efficient residential buildings at the intersections under analysis, along with their respective air and noise pollution levels), demographic criteria (21–30 and 31–40-year old males and females), and psychographic and consumer behavior criteria (happiness, sadness, and anger, as well as valence and heart rate). The basis for this segmentation is the Somatic marker hypothesis, framed by Damasio [16], and the Multisensory neuromarketing method for green and energy efficient housing (see Section 2).
These segmentation criteria served as the basis for compiling a neuro decision matrix (see Table 3). The criteria weights were determined by expert assessment. The results of the multicriteria evaluation appear in Table 4.
Table 4.
Multicriteria evaluation results of the 24 Vilnius City market segments for green and energy efficient residential projects.
Performance of a multicriteria evaluation established Site 3 as being in the greatest demand among males in the age group of 21–30 years (N5 = 100%). Site 3 also took second place for the best demand among females in the 21–30-years age group (N13 = 96.83%). Site 3 also indicated the highest demand upon analyzing the families (third place) in the 31–40-year age group (N22 = 96.32%).
The results obtained from the multicriteria analysis corresponded with those of studies conducted worldwide [57]. An inverse U shape forms a relationship between environmental awareness and age. The reason for this result is that increasing age corresponds with increasing awareness. Such awareness peaks in early to late-middle age and then declines among the oldest age groups. The greatest likelihood to understand the environmental impact of purchased products tends to be found among middle-aged consumers, who are most likely to appreciate the importance of the environmental consequences of their purchases. Furthermore these people are most likely to support ecolabeling and the mandatory labeling of carbon footprints [57]. The groups that would agree to pay more for eco-friendly products consist of 22–35-year old Millennials (61%) and 36–54-year old Generation X respondents (55%) [58]. Of these groups, 51% of the Millennials and 25% of the Generation X respondents would pay more for sustainable products [59]. For example, Table 4 shows that the utility degree and the level of priority of the green and energy efficient residential projects under deliberation are greater for the group of 21–30-year old potential buyers (who rated 7 of the 12 projects as the best in terms of their priorities and rated their average utility degree at 82.29%). These data were compared to those for the 31–40-year old age group, who rated 5 of the 12 projects as the best in terms of their priorities and gave an average utility degree of 76.67%.
INVAR, a new multiple decision factors analysis method that assists with assessing the degree of project utility and the investment value and offers recommendations [40], was applied in this research. The following example will show the value x24 cycle e that would make the dwelling project “Live square” (a24) competitive for families in the age group 31–40 for Sites 1, 2, and 3 (a18, a20, a22), when all positive and negative features are considered. The INVAR method allows us to optimize any criterion or its elements. The score of Site 6 will be optimized next as an example (see Table 5).
Table 5.
The integrated hedonic–utilitarian value x24 cycle e that would make the dwelling project “Live square” (a24) as competitive for families in the age group 31–40 as the other alternatives (a18, a20, a22).
Table 5 shows that, up to Cycle 1850, the inequality is not satisfied. In every cycle, the score x24 is decreased (from x24 cycle 0 = 2950) by one unit until the inequality is satisfied (x24 cycle 1950 = 1000). The scores x24 cycle e (respectively, 2950, … and 1000) are then placed in the bold cell of the decision matrix to check their accuracy related to partnership a4. These calculations suggest that the integrated hedonic–utilitarian value of the dwelling project “Live square” must be 2.95 times lower for families in the age group 31–40 to prefer this housing option over other options, when all positive and negative features are considered.
This method offers digital tips on ways to improve certain scores, so users can learn how the new scores would affect their human emotions, energy efficiency, and cumulative pollution rankings. The tips are presented as a matrix (see Table 6). Table 3 shows that, among the options compared, Site 1 (a1 and a2) has the lowest recuperation effectiveness (x10 1 = x10 2 = 65%), while the lowest recuperation effectiveness for Site 2 is 80%. If our aim is to make the recuperation effectiveness of Site 1 equal to that of Site 2, the effectiveness must be improved by 23.08%. Various means can be used for this purpose. Once this aim is achieved, the alternative will improve overall by 0.1757%.
Table 6.
A sample of digital recommendations on ways to improve the attractiveness of housing at the four sites in Vilnius.
The four residential projects under analysis are the Linkmenų Lakes residential complex at the Kareivių, Kalvarijų, and Ozo Sts. intersection (A1); the new Žygimantų dwelling units in Old Town at the Žygimantų and T. Vrublevskio Sts. intersection (A2); the Veikmė Park building at the Santariškių and Baublio Sts. intersection (A3); and the Live Square at the Pamėnkalnio, Jogailos, Islandijos, and Pylimo Sts. intersection (A4).
The INVAR method also allows us to optimize the value of any indicator we select. Values for Site 2 are calculated to establish the level of smart heating control that would make the site as attractive to females aged 21–30 (a11) as it is to males in the same age group (a3). The multiple criteria evaluation ranks this alternative 11th for males aged 21–30. Table 7 shows that when the smart heating control achieves a score of 0.5, the utility degree of Site 2 for females aged 21–30 becomes close to the utility degree of Site 2 for males aged 21–30 (the difference is only 2.4 percentage points). Another point illustrated by Table 7 is that after 50 approximation cycles, the inequality is not yet satisfied (x12 11 cycle 50 = 0.5 |−2.4%| > 0.18%). After 90 approximation cycles, however, the score of the hypothetical smart heating control for females (a11) increases to 0.9, and the utility degree of Site 2 for females becomes equal to that of males (a3), with x12 11 cycle 90 = 0.9 |−0.18%| = 0.18%.
Table 7.
Indicator optimization.
The INVAR method can also determine the weights of hypothetical indicators. We want to determine what hypothetical score of geothermal heating would make females aged 21–30 rank Site 1 in the Top 7 among the alternatives being compared.
We need, then, to keep increasing the value of X13 9 until Site 1 becomes one of the seven best alternatives for females aged 21–30. Table 8 shows the related calculations. Table 3 and Table 4 show that females aged 21–30 (a9) ranked Site 1 (with a geothermal heating score (X13) equal to 0 (x13 11 (cycle 0) = 0) and a utility degree of N9 (cycle 0) = 69.17%) tenth among the alternatives. After 100 approximation cycles, Site 1 increases by two positions and, for females aged 21–30, finishes in 8th place, with its geothermal heating score equal to 0.1 (x13 9 (cycle 100) = 0.1) and a utility degree of N9 (cycle 100) = 69.64%. As the aim is not yet achieved, we must keep increasing X13 9. The calculations show that after 130 cycles, Site 1 achieves a geothermal heating score of x13 9 (cycle 130) = 0.13 and a utility degree of N9 (cycle 130) = 69.8% and finally becomes the 7th best alternative for females aged 21–30 (see Table 8).
Table 8.
The hypothetical CO that would make Site 1 the 7th best alternative for females aged 21–30.
4.3. Case Study 2: Comparison of the Criteria Describing the Emotional–Physiological States of Passersby at the Sites under Deliberation with Worldwide Practice and Its Validation
Table 3 illustrates the depersonalized emotional–physiological states of passersby according to the genders and families of the two age groups, which were analyzed in conjunction with the multicriteria analysis conducted on the four green and energy efficient residential projects. The goal in this subsection was to analyze whether the depersonalized emotional–physiological states of passersby correspond with worldwide research claiming that a person’s emotional state depends on age. This case study shows, for example, the correlational dependencies between happiness and heart rate, obtained by the authors of this article, and that between happiness and sadness, obtained by other scholars, according to various age groups (see Table 9).
Table 9.
Correlations between the data on happiness and heart rate obtained by these authors, and those between happiness and sadness obtained by others, according to various age groups.
The signs of correlation provided in Table 9 correspond with research conducted worldwide [60,61,62,63]. For example, numerous studies indicate that sadness decreases as happiness increases [64,65,66]. Meanwhile, as sadness increases, heart rate increases, as well [62]. The dependency between happiness and heart rate can be dualistic in nature. Some studies show that heart rate increases as happiness increases [62,63]. Meanwhile, other studies show that heart rate decreases as happiness increases [60].
For example, the correlation between the happiness among males and females measured at Intersection 1 and its level among males and females obtained by Buchanan et al. [67] equals 0.83659666 (see Figure 3).
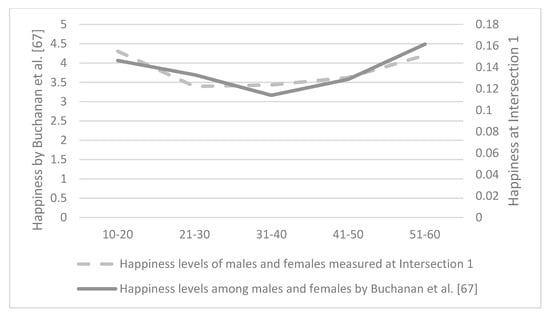
Figure 3.
Correlation between the happiness levels among males and females measured at Intersection 1 and those by Buchanan et al. [67] (equals 0.84).
Numerous studies worldwide indicate that age and happiness have a U-shaped connection, meaning that individuals are happier when they are younger and older [69,70,71,72,73,74,75,76,77]. The results of the research presented here confirm such a tendency (see Figure 3).
Steptoe et al. [73] analyzed life satisfaction and noticed that the shape of the age trend curve is not clear-cut in every respect, but, at least in rich English-speaking countries, a U-shaped curve predominates, with satisfaction hitting its lowest point in the late 40s to mid-50s [77]. The shape of these curves, however, usually recalls those of the letter U, where the periods of relative happiness experienced by younger and older people cause the curve to bend upwards and the less happy period when people reach middle age pushes the curve down. Another finding that stands out is that people reach the bottom of the U-shaped curve more or less in their early 50s, and their level of happiness is, at that point, far below the levels during youth. This difference is similar to the drop in the sense of well-being when people get divorced or lose a job [74]. The sense of well-being of people in their 60s and older is generally higher than that of younger people. In developed countries, a U-shaped pattern is the usual result in surveys of happiness, with the greatest satisfaction recorded at each end of the curve [76]. The U-shaped pattern of happiness levels means that young people are particularly happy [78]. Gana et al. [79] write about the “paradox of wellbeing”, where older people consider their lives better than those of younger people, showing the highest contrast when compared with middle-aged people.
The levels of happiness among males and females (both those measured at Intersection 1 and those by Buchanan et al. [67]) are U-shaped (Figure 4). We multiplied the happiness measurements at Intersection 1 by 30 to unify the scales. Buchanan et al. [67] used a happiness level between 3 and 5, while our measurement at Intersection 1 was between 0 to 1. Meanwhile the levels of worry among males and females found by Newport and Pelham [68] are inversely U-shaped. The results of the analysis of sadness obtained by this study correspond with those obtained by other scholars [80,81].
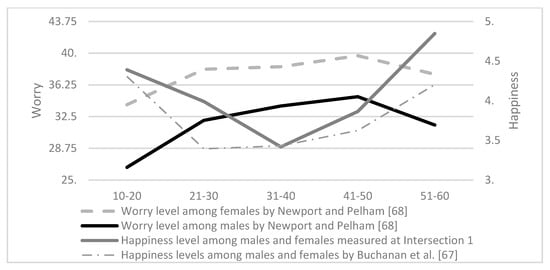
Figure 4.
U-shaped happiness levels among males and females measured at Intersection 1 and by Buchanan et al. [67]. Inversely U-shaped worry levels among males and females by Newport and Pelham [68].
In the case of sadness and worry, the U shape is reversed, and this pattern is consistent across datasets and waves. In early adulthood, the levels of sadness are low and then peak around midlife. Then, they start declining, and continue to do so, in later life [80,81]. Stone et al. [80] state that the age profile of sadness and worry is essentially inverse that of enjoyment and happiness, and this negative experience shows modest variation with age, with a clear U-shape. Positive affect, surprise, serenity, and joviality showed a U-shaped pattern; the patterns of negative affect and sadness were also a U-shaped curve, except reversed [82]. Graham and Pozuelo [81] also noticed that in almost as many countries, the levels of experienced stress follow a U-shaped reverse curve. Their results suggest that the stress curve is a reverse U-pattern around the world, with stress levels increasing, peaking at a certain point, and then declining, with overall levels of stress gradually becoming lower as we age.
Stone et al. [80] also point out that sadness and worry levels are arranged along an inverted U-shaped curve over time. Compared with men, levels of stress, worry, and sadness are considerably higher for women (in all age groups). Figure 4 also shows that sadness levels are significantly higher for women (e.g., 39.7 for 41–50-year olds) compared with men (e.g., 34.85 for 41–50-year olds). Age-related group-level quadratic (inverted-U shaped) trajectories were the best way to explain the response of the left hippocampus during the sad condition [83]. Significant inverted U-shaped patterns were recorded for negative affect and sadness, with (late) middle-aged adults reporting higher values than younger and older adults [82]. Blanchflower [84] points out that the pattern of unhappiness is an inverted U-shape. Young people feel less unhappy than older people [78]. Resting heart rate increases with age, and our research results (see Figure 5) confirm previous findings [85,86,87,88,89]. In people aged 35 and 45, a higher heart rate was associated with higher blood pressure, a higher mortality rate, a higher BMI, leisure-time physical activity, occupational class, smoking, and antihypertensive treatment [88]. Khalfa et al. [61] point out that lower heart rates have been reported in cases of happiness. Yeragani et al. [86] found that, with age, ratios for the sympathovagal modulation of heart rate variability show a significant increase. Polar [89] noticed that when people get older, their resting heart rates usually increase. In the sample group, young people have a lower mean arterial blood pressure at rest than old people [85]. This means that, as people age, their pulse pressure increases dramatically [87].
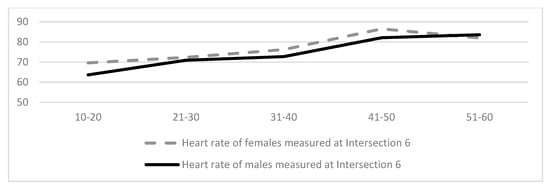
Figure 5.
Heart rate increases with age, as shown by studies conducted by us.
Different studies show a direct dependency between heart rate and sadness and worry [60,90,91,107]. The results obtained by this study also confirm this (see Figure 6).
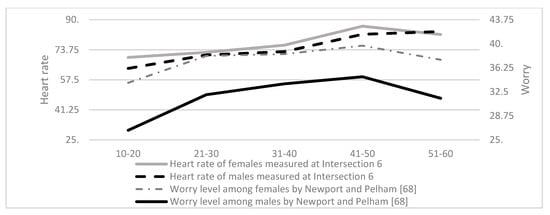
Figure 6.
A direct dependency between heart rate and worry.
Research conducted worldwide [78,81,82] indicates an inverse-U-shape displaying stress, unhappiness, and anger by different age groups, which the results of this study also confirm. As seen in Figure 7, there is less anger in the 51–60 years age group. Males show greater levels of anger, especially in the 41–50 years age group.
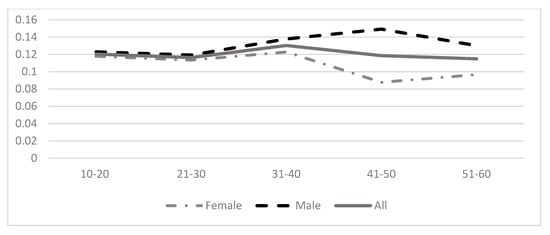
Figure 7.
Studies at six Vilnius sites measured anger among males, females, and overall. These studies indicate a more or less inverse U-shape for anger by age groups.
Numerous studies have also explored well-being differences among sexes. Their findings suggest that, in terms of subjective well-being, women tend to report slightly higher values than men [69,92]. Our observations show that anger levels measured at specific locations in Vilnius (Lithuania) confirm the above studies (see Figure 7). Women who subjectively perceive their environment as more positive are less angry.
Upon analyzing the depersonalized emotional–physiological states of passersby according to the different ages and genders obtained by this study (and by other scholars for this subsection), the results from this study appear to correspond with worldwide research, which claims that a person’s emotional–physiological state depends on age. Thus, the data employed for the multicriteria analysis were reliable (conducted on the depersonalized emotional–physiological states of passersby according to different ages and genders, as presented in Table 3, for the four green and energy efficient residential projects).
5. Heart Rate and a Correlational Analysis of Dependent Variables with IBM SPSS Software Assistance
This subsection briefly describes the determination of heart rate dependencies on variables that correlate with statistical significance. This analysis was performed with the help of IBM SPSS software. The results of the correlational analysis appear in Table 10.
Table 10.
Correlational analysis results.
A conclusion can be drawn, based on the performance of the correlational analysis, that there is a statistically significant correlation between heart rate and all the variables under analysis, except for the nitrogen dioxide concentration, breathing rate, valence, sadness, and fear. The strongest relationships were found between heart rate and disgust (rs = 0.909, p < 0.01), anger (rs = 0.886, p < 0.01), and KD2.5 particle concentration (rs = 0.835, p < 0.01). The weakest relationships were determined between heart rate and KD10 particle concentration (rs = 0.1892, p < 0.01) and Ozon concentration (rs = 0.242, p < 0.01). The statistically significant relationships between heart rate and carbon monoxide (rs = −0.157, p < 0.05), and between heart rate and surprise (rs = −0.346, p < 0.01), are negative. The implication here is that heart rate increases as the concentration of carbon monoxide decreases, and also decreases as the surprise index decreases. The opposite also holds true. A regression model was compiled (1) to help determine the dependence of heart rate with variables that have a significant correlation with the variable heart rate:
Upon performing a multiple regression test for the suitability of the model on Heart rate and its dependent variables, the model was deemed suitable for deliberation, because p < 0.001 (see Table 11).
Table 11.
Correlation analysis results for heart rate and its dependent variables.
The coefficient of determination (R2) indicates that the independent variables in the model under analysis (e.g., indicators of atmospheric pollution and personal psychological state) explain 85.7% of the dispersion of the dependent variable (heart rate) weights.
We obtained the following regression equation:
Upon calculating the direct regression coefficients (see Table 11), a conclusion can be drawn that the independent variables that have a significant impact on the dependent variable (heart rate) occur when p < 0.05: sulfur dioxide concentration, KD10 particle concentration, arousal, and interest. Thus, the significance of the alternative comprises the sulfur dioxide concentration (β = 0.221), KD2.5 particle concentration (β = 0.408), arousal (β = 0.315), and interest (β = 0.140). Meanwhile, the indicators of atmospheric pollutants and individual emotional states, such as KD10 particle concentration, carbon monoxide concentration, ozone concentration, magnetic storm, surprise, and happiness may impact heart rate. However, this influence is not significant.
The above data analysis by IBM SPSS software illustrates the necessity of using variables like affective attitudes, emotional and physiological states, valence, and interest in neuro decision matrices and neuromarketing.
6. Discussion and Conclusions
The coded emotions fit within all of the green and energy efficient building advertisements. Therefore, when seeking to elicit the most effective emotions in a green and energy efficient building advertisement, it is important to understand what reaction the ad will evoke in people with differing life experiences, character features, and ages. Positive emotions lessen the critical attitudes of a person and increase trust. Conversely, trust decreases, and critical attitudes increase when experiencing negative emotions. Intuition and emotions appear at the beginning of the green and energy efficient housing purchasing process and subjectively predict the result of purchase satisfaction in advance. Thus, a subjective evaluation of the product being purchased occurs just prior to the actual purchase. A pleasant built environment for a purchase evokes positive emotions and improves the evaluation of a green and energy efficient housing advertisement. Conversely, a repulsive atmosphere surrounding a purchase will elicit negative emotions and reduce the advertisement’s influence. An aesthetic built environment generates positive emotions, not only during the stages of selection and purchase but also during the stage of actual consumption. In the area of green marketing, special attention must be given to the emotions and affective states of potential house buyers, which can serve as a basis (e.g., happiness) for determining the needs and priorities of consumers in their purchases.
The idea of the three key aspects of the consumption experience, known as the “three Fs” (fantasies (unconscious desires, imagination, dreams), feelings (emotions such as anger, hate, love, joy, fear, sorrow), and fun (hedonic pleasure as a result of aesthetic enjoyment or playful activities)), was born in the early 1980s [93,94,95,96]. These aspects are still heavily studied. The abundance of studies examining these aspects shows that this area of research is popular, and its theoretical aspects have been thoroughly examined.
Numerous researchers in marketing have studied green and energy efficient building marketing and the different variables affecting it, along with their interdependencies (see Introduction). However, these researchers have not analyzed, in an integrated manner, the segmentation/physiological indicators (crowd composition by gender and age groups), emotional (happy, sad, angry, and valence), and physiological (heart rate) states of the people under study, their surrounding environment (along with environmental air pollution (CO, NO2, PM10, volatile organic compounds)), and noise pollution. Furthermore, there has not been an integrated analysis of similar dependencies obtained by other scholars. The Multisensory, green, and energy efficient housing neuromarketing method is recommended to perform such an integrated analysis. The studies described in the Introduction have also been used.
The analysis of home buyer and seller generational trends is a common practice around the world, with extensive generational home buyer and seller trend reports produced as a result [54,55,56]. Based on the findings of these and other reports, as well as reports on the air pollution values and the emotional and physiological parameters of passers-by from various age groups tracked by the authors of this research, potential homebuyers can be shown rational ads for green and energy efficient homes.
An integration of Damasio’s Somatic Marker Hypothesis [16], biometric, and physiological methods [32], categorical data using neuromarketing analysis methods by means of a spatial multiple criteria analysis (e.g., evoking human affective attitudes and compiling maps of emotional and physiological states [33]), developing neuro-advertisement variant combinations by applying a combinatorial method, employing a statistical analysis (LOGIT, KNN, MBP, and RBP) and incorporating multiple criteria analysis methods [32] comprises the VINERS Method.
The results of worldwide studies [16,97,98,99,100] indicate that people want to live where they feel the best—where positive emotions considerably exceed negative ones. Case Study 1 involved the establishment of rational and emotional market segments by geographic criteria (six Vilnius City intersections along with the air and noise pollution therein), demographic criteria (males and females aged 21–30 and 31–40 years), and psychographic and consumer behavior criteria (happiness, sadness, anger, as well as valence and heart rate). When applying a multisensory, green, and energy efficient housing neuromarketing method to such criteria, it becomes possible to make a rational offer when brokering green and energy efficient housing. A benefit of this multisensory, green, and energy efficient housing neuromarketing method is that it can assist in determining a project’s integrated hedonic–utilitarian value and offer digital tips on ways to improve the project. Another benefit of this method is that it can optimize any selected criterion to make a particular project as competitive in the market as the other projects being compared. The INVAR Method allows us to determine the value that would make a particular project the best among a certain group of projects.
Case Study 2, “Comparison of criteria describing the depersonalized emotional–physiological states of passersby at the sites under deliberation with worldwide practice and its validation”, contains deliberations of correlational dependencies and trends (e.g., the levels of happiness among people by age appears in a U form, whereas sadness and anger appear in an inverse U form. Meanwhile heart rate increases with age. Heart rate also depends on the level of emotions, because there is a direct correlation between heart rate and sadness, as well as other emotions). This discussion involves data on age groups obtained by the authors of this article, as well as data that were validated by other scholars.
Studies conducted throughout the world have shown that the relationship between environmental awareness and age acquires an inverse U shape and that the emotional state of a person depends on age. Case Studies 1 and 2, herein, illustrate how the calculations performed according to the multisensory, green, and energy efficient housing neuromarketing method confirm the same.
The accuracy of physiological (heart rate, etc.) and demographic (age and gender) markers was also analyzed in this research (see Section 3). However, there is a scarcity of research connected to physiological and demographic markers and neuromarketing. The results of our study indicate that further research is needed on the effects of physiological and demographic markers related to neuromarketing.
The multisensory, green, and energy efficient housing neuromarketing method proposed in this study is expected to be applied to decision-making processes relevant to various neuromarketing tasks. The main difference between the decision-making relevant to these various neuromarketing tasks involves a compilation of the relevant neuro decision-making matrix. Meanwhile the mathematical method remains the same. The future application of this multisensory, green, and energy efficient housing neuromarketing method will involve the development of a video neuroadvertising recommendation system (VINERS1 and VINERS2).
Video advertising recordings with VINERS1 could be personalized, thus making them relevant to each unique viewer or to a specific audience according to its behaviorial traits, likes and dislikes, and demographics, as well as other indicators. The main goal of VINERS1 is to explain, based on data, the state of a viewer at each point in the purchasing process. Future efforts should also establish what attracts viewers and supply visual marketing decisions that can stimulate the emotions of viewers during the entire process of product or service advertising and purchasing. An advertisement must be adapted for the goals of different viewers and companies. Furthermore, an unlimited number of alternative ads could be provided, including variable content. The recordings of video ads could be improved by using different content for each viewer, thereby personalizing all the aspects of a video recording. This would also allow one to monitor the effect that the content of an ad has on viewers.
The emotional, personalizing, and interactive (VINERS2) subsystem of an ad under development will allow an evaluation of the ad’s effectiveness during each stage of its development, thereby establishing the strengths and weaknesses of an ad and the pertinent improvements to make it as attractive as possible to a viewer. Use of the VINERS2 subsystem will make it possible to coordinate various interactive personalized elements and introduce them (via video recordings, texts, sound recordings, augmented reality, and related visualizations). In this way, individual elements can be inserted into each video recording, including photographs, data, and media from databases, as well as internet service and social networks. Thus it will be possible to create video ad recordings dynamically by coordinating the content of different ad segments according to the specific parameters of an audience and adapt those contents to the psychographic profiles of consumers, thereby developing differing stories according to the viewer’s preferences, actions, and metadata.
Future research will involve linking together the self-reporting interviews and surveys with a biometric measurement of emotional states like happiness, sadness, anger, surprise, fear, disgust, or a neutral state, as well as valence and arousal, affective attitudes like boredom, interest, and confusion, and physiological states like the average crowd’s facial temperature, heart rates, and breathing rates. This will facilitate a comparison between self-reported and biometric data, thus enabling one to determine their interdependencies and trends. Such an integrated analysis of self-reporting and biometric measures would assist in achieving results that are more accurate, as unreliable results frequently occur due to, for example, using only one biometric parameter, like heart rate.
Many studies around the world have determined very good heart rate trends and correlations in specific areas, such as the air temperature, age [85,86,87,88,89], physical activity [88], air pollution [101,102,103,104], wind [105], atmospheric pressure [106], various diseases and medications, fever, sex, intense emotions (happiness [61,62,63,64], sadness and worry [60,62,63,90,91,107], anxiety [107], disgust [108], pleasure, pride, relief, suspense, surprise, anger, joy [61]), arousal [64], energizing products (tea, cigarettes, and coffee), circadian rhythm, body mass index, leisure-time physical activities, their own occupational class, and smoking [88]. In the future, we will try to integrate the results of these studies with our results described in this research.
Author Contributions
A.K. was in charge of the conceptualization; A.K., I.L., I.U., V.M., A.V., R.G., R.B. and A.N contributed to the formal analysis; A.K., D.K., I.L., I.U., A.V., P.V., I.V. (Irina Vinogradova), V.M., I.V. (Ingrida Vetloviene), R.G., R.B. and A.N. together, designed the research and wrote original manuscript.
Funding
This project has received funding from European Regional Development Fund (project No 01.2.2-LMT-K-718-01-0073) under grant agreement with the Research Council of Lithuania (LMTLT).
Acknowledgments
The authors thank the referees for their valuable comments and suggestions, which helped to improve this paper considerably. The authors of the article are grateful to the project executers D. Raupys, L. Tupenaite, and V. Kutut for their valuable contributions.
Conflicts of Interest
The authors declare no conflict of interest. The founding sponsor had no role in the design of the study or in the collection, analyses, or interpretation of data. There was no conflicting participation in the writing of the manuscript or in the decision to publish the results.
References
- Santamouris, M. Innovating to zero the building sector in Europe: Minimising the energy consumption, eradication of the energy poverty and mitigating the local climate change. Sol. Energy 2016, 128, 61–94. [Google Scholar] [CrossRef]
- Energy Efficiency: Buildings. The Global Exchange for Energy Efficiency Policies, Data and Analysis. 2018. Available online: https://www.iea.org/topics/energyefficiency/buildings/ (accessed on 10 June 2019).
- Corrado, V.; Ballarini, I. Refurbishment trends of the residential building stock: Analysis of a regional pilot case in Italy. Energy Build. 2016, 132, 91–106. [Google Scholar] [CrossRef]
- Schaffner, D.; Ohnmacht, T.; Weibel, C.; Mahrer, M. Moving into energy-efficient homes: A dynamic approach to understanding residents’ decision-making. Build. Environ. 2017, 123, 211–222. [Google Scholar] [CrossRef]
- Klockner, C.A.; Nayum, A. Psychological and structural facilitators and barriers to energy upgrades of the privately owned building stock. Energy 2017, 140, 1005–1017. [Google Scholar] [CrossRef]
- Wilson, C.; Crane, L.; Chryssochoidis, G. Why Do People Decide To Renovate Their Homes To Improve Energy Efficiency? Tyndall Centre for Climate Change Research: Norwich, UK, 2014; Available online: https://tyndall.ac.uk/sites/default/files/publications/twp160.pdf (accessed on 10 June 2019).
- Kamari, A.; Jensen, S.; Corrao, R.; Kirkegaard, P. A holistic multi-methodology for sustainable renovation. Int. J. Strateg. Prop. Manag. 2019, 23, 50–64. [Google Scholar] [CrossRef]
- Lai, J.; Man, C. Developing a performance evaluation scheme for engineering facilities in commercial buildings: State-of-the-art review. Int. J. Strateg. Prop. Manag. 2017, 21, 41–57. [Google Scholar] [CrossRef]
- Reimann, M.; Zaichkowsky, J.; Neuhaus, C.; Bender, T.; Weber, B. Aesthetic package design: A behavioral, neural, and psychological investigation. J. Consum. Psychol. 2010, 20, 431–441. [Google Scholar] [CrossRef]
- Kaklauskas, A.; Rute, J.; Zavadskas, E.K.; Daniunas, A.; Pruskus, V.; Bivainis, J.; Gudauskas, R.; Plakys, V. Passive House model for quantitative and qualitative analyses and its intelligent system. Energy Build. 2012, 50, 7–18. [Google Scholar] [CrossRef]
- Picon, L.; Yannou, B.; Zaraket, T.; Minel, S.; Bertoluci, G.; Cluzel, F.; Farel, R. Use-phase memory: A tool for the sustainable construction and renovation of residential buildings. Autom. Constr. 2013, 36, 53–70. [Google Scholar] [CrossRef]
- Baginski, J.P.; Weber, C. A Consumer Decision-Making Process? Unfolding Energy Efficiency Decisions of German Owner-Occupiers; HEMF Working Paper No. 08/2017; Elsevier: Amsterdam, The Netherlands, 2017. [Google Scholar] [CrossRef][Green Version]
- Organ, S.; Proverbs, D.; Squires, G. Motivations for energy efficiency refurbishment in owner-occupied housing. Struct. Surv. 2013, 31, 101–120. [Google Scholar] [CrossRef]
- Tupėnaitė, L.; Kaklauskas, A.; Voitov, I.; Trinkūnas, V.; Siniak, N.; Gudauskas, R.; Naimavičienė, J.; Kanapeckienė, L. Multiple criteria assessment of apartment building performance for refurbishment purposes. Int. J. Strateg. Prop. Manag. 2018, 22, 236–251. [Google Scholar] [CrossRef]
- Aune, M. Energy comes home. Energy Policy 2007, 35, 5457–5465. [Google Scholar] [CrossRef]
- Damasio, A.R. Descartes’ Error: Emotion, Reason, and the Human Brain; Grosset/Putnam: New York, NY, USA, 1994. [Google Scholar]
- Potter, R.F.; Bolls, P. Psychophysiological Measurement and Meaning: Cognitive and Emotional Processing of Media; Routledge: London, UK, 2012. [Google Scholar]
- Lennox, R.; Dennis, M.L.; Scott, C.K.; Funk, R. Combining psychometric and biometric measures of substance use. Drug Alcohol Depend. 2006, 83, 95–103. [Google Scholar] [CrossRef] [PubMed]
- Jain, A.K.; Dass, S.C.; Nandakumar, K. Soft biometric traits for personal recognition systems. In Biometric Authentication, Proceedings of the ICBA 2004, Hong Kong, China, 15–17 July 2004; Zhang, D., Jain, A.K., Eds.; Lecture Notes in Computer Science; Springer: Berlin/Heidelberg, Germany, 2004; Volume 3072. [Google Scholar] [CrossRef]
- Zhang, Z.; Hu, M.; Wang, Y. A survey of advances in biometric gait recognition. In Biometric Recognition, Proceedings of the CCBR 2011, Beijing, China, 3–4 December 2011; Sun, Z., Lai, J., Chen, X., Tan, T., Eds.; Lecture Notes in Computer Science; Springer: Berlin/Heidelberg, Germany, 2011; Volume 7098. [Google Scholar] [CrossRef]
- Idrus, S.Z.S.; Cherrier, E.; Rosenberger, C.; Bours, P. Soft biometrics database: A benchmark for keystroke dynamics biometric systems. In Proceedings of the 2013 International Conference of the BIOSIG Special Interest Group (BIOSIG), Darmstadt, Germany, 5–6 September 2013; pp. 1–8. [Google Scholar]
- Jamal, A.; Sharifuddin, J. Perceived value and perceived usefulness of halal labeling: The role of religion and culture. J. Bus. Res. 2015, 68, 933–941. [Google Scholar] [CrossRef]
- Dangelico, R.M.; Vocalelli, D. “Green Marketing”: An analysis of definitions, strategy steps, and tools through a systematic review of the literature. J. Clean. Prod. 2017, 165, 1263–1279. [Google Scholar] [CrossRef]
- Luchs, M.G.; Naylor, R.W.; Irwin, J.R.; Raghunathan, R. The sustainability liability: Potential negative effects of ethicality on product preference. J. Mark. 2010, 74, 18–31. [Google Scholar] [CrossRef]
- Sánchez-Fernández, R.; Iniesta-Bonillo, M.Á. Consumer perception of value: Literature review and a new conceptual framework. J. Consum. Satisf. Dissatisfaction Complain. Behav. 2006, 19, 40. [Google Scholar]
- Zainuddin, N. Value creation in social marketing for the continued use of wellness services. In Proceedings of the Australian and New Zealand Marketing Academy Conference 2011, Perth, Australia, 28–30 November 2011; pp. 1–8. [Google Scholar]
- Mehmood, K.; Hanaysha, J. The strategic role of hedonic value and utilitarian value in building brand loyalty: Mediating effect of customer satisfaction. Pak. J. Soc. Sci. 2015, 35, 1025–1036. [Google Scholar]
- Jones, M.A.; Reynolds, K.E.; Arnold, M.J. Hedonic and utilitarian shopping value: Investigating differential effects on retail outcomes. J. Bus. Res. 2006, 59, 974–981. [Google Scholar] [CrossRef]
- Klein, K.; Melnyk, V. Speaking to the mind or the heart: Effects of matching hedonic versus utilitarian arguments and products. Mark. Lett. 2016, 27, 131–142. [Google Scholar] [CrossRef]
- Geng, Y.; Ji, W.; Wang, X.; Lin, B.; Zhu, Y. A review of operating performance in green buildings: Energy use, indoor environmental quality and occupant satisfaction. Energy Build. 2019, 183, 500–514. [Google Scholar] [CrossRef]
- Zhan, D.; Kwan, M.P.; Zhang, W.; Fan, J.; Dang, Y. Assessment and determinants of satisfaction with urban livability in China. Cities 2018, 79, 92–101. [Google Scholar] [CrossRef]
- Kaklauskas, A. Biometric and Intelligent Decision Making Support; Springer: Heidelberg, Germany, 2015. [Google Scholar] [CrossRef]
- Kaklauskas, A.; Jokubauskas, D.; Čerkauskas, J.; Dzemyda, G.; Ubartė, I.; Skirmantas, D.; Podviezko, A.; Šimkutė, I. Affective analytics of demonstration sites. Eng. Appl. Artif. Intell. 2019, 81, 346–372. [Google Scholar] [CrossRef]
- FaceReader. Reference Manual Version 7. Tool for Automatic Analysis of Facial Expressions, Noldus Information Technology. Available online: http://sslab.nwpu.edu.cn/uploads/1500604789-5971697563f64.pdf (accessed on 28 July 2019).
- Novelda, A.S. X4M200 Datasheet. Available online: https://www.codico.com/shop/media/datasheets/Novelda_X4M200_respiration_sensor_rev_c_preliminary.pdf (accessed on 28 July 2019).
- Viola, P.; Jones, M.J. Robust real-time face detection. Int. J. Comput. Vis. 2004, 57, 137–154. [Google Scholar] [CrossRef]
- Cootes, T.F.; Taylor, C.J. Statistical Models of Appearance for Computer Vision; Technical Report; Wolfson Image Analysis Unit, Imaging Science and Biomedical Engineering, University of Manchester: Manchester, UK, 2004; Available online: http://www.face-rec.org/algorithms/AAM/app_models.pdf (accessed on 28 July 2019).
- Van Kuilenburg, H.; Wiering, M.; Den Uyl, M. A model based method for automatic facial expression recognition. In Machine Learning: ECML 2005, Proceedings of the 16th European Conference on Machine Learning, Porto, Portugal, 3–7 October 2005; Lecture Notes in Computer Science; Springer: Berlin/Heidelberg, Germany, 2005; Volume 3720, pp. 194–205. [Google Scholar] [CrossRef]
- Friesen, E.; Ekman, P. Facial Action Coding System: A Technique for The Measurement of Facial Movement; Consulting Psychologists Press: Palo Alto, CA, USA, 1978. [Google Scholar]
- Kaklauskas, A. Degree of project utility and investment value assessments. Int. J. Comput. Commun. Control 2016, 11, 666–683. [Google Scholar] [CrossRef]
- Kaklauskas, A.; Zavadskas, E.K.; Radzeviciene, A.; Ubarte, I.; Podviezko, A.; Podvezko, V.; Kuzminske, A.; Banaitis, A.; Binkyte, A.; Bucinskas, V. Quality of city life multiple criteria analysis. Cities 2018, 72, 82–93. [Google Scholar] [CrossRef]
- Kaklauskas, A.; Herrera-Viedma, E.; Echenique, V.; Zavadskas, E.K.; Ubarte, I.; Mostert, A.; Podvezko, V.; Binkyte, A.; Podviezko, A. Multiple criteria analysis of environmental sustainability and quality of life in post-Soviet states. Ecol. Indic. 2018, 89, 781–807. [Google Scholar] [CrossRef]
- Loijens, L.; Krips, O. Facereader Methodology; Noldus Information Technology: Wageningen, The Netherlands, 2013. [Google Scholar]
- Zaman, B.; Shrimpton-Smith, T. The Facereader: Measuring instant fun of use. In Proceedings of the 4th Nordic Conference on Human-Computer Interaction: Changing Roles, Oslo, Norway, 14–18 October 2006; pp. 457–460. [Google Scholar] [CrossRef][Green Version]
- Lewinski, P.; den Uyl, T.M.; Butler, C. Automated facial coding: Validation of basic emotions and FACS AUs in FaceReader. J. Neurosci. Psychol. Econ. 2014, 7, 227–236. [Google Scholar] [CrossRef]
- Gudi, A.; Ivan, P. Validation Action Unit Module. Noldus Information Technology: Wageningen, The Netherlands, 2015. [Google Scholar] [CrossRef]
- Tasli, H.E.; Gudi, A.; den Uyl, M. Remote PPG based vital sign measurement using adaptive facial regions. In Proceedings of the 2014 IEEE International Conference on Image Processing (ICIP), Paris, France, 27–30 October 2014; pp. 1410–1414. [Google Scholar] [CrossRef]
- Tasli, H.E.; Gudi, A.; den Uyl, M. A Method for Stabilizing Vital Sign Measurements Using Parametric Facial Appearance Models via Remote Sensors. Patent EP2960862B1, 22 March 2017. [Google Scholar]
- Terzis, V.; Moridis, C.N.; Economides, A.A. Measuring instant emotions based on facial expressions during computer-based assessment. Pers. Ubiquitous Comput. 2013, 17, 43–52. [Google Scholar] [CrossRef]
- Lewinski, P. Automated facial coding software outperforms people in recognizing neutral faces as neutral from standardized datasets. Front. Psychol. 2015, 6, 1386. [Google Scholar] [CrossRef]
- Sandberg, L.; Rönnblom, M. Planning the new city-emotional reaction and positions. Emot. Space Soc. 2016, 21, 50–57. [Google Scholar] [CrossRef]
- Mouratidis, K. Built environment and social well-being: How does urban form affect social life and personal relationships? Cities 2018, 74, 7–20. [Google Scholar] [CrossRef]
- Schertz, K.E.; Sachdeva, S.; Kardan, O.; Kotabe, H.P.; Berman, M.G. A thought in the park: The influence of naturalness and low-level visual features on expressed thoughts. Cognition 2018, 174, 82–93. [Google Scholar] [CrossRef] [PubMed]
- Lithuania’s Hygiene Norm HN 35:2007. Available online: https://e-seimas.lrs.lt/portal/legalAct/lt/TAD/TAIS.297779?positionInSearchResults=2andsearchModelUUID=3aa0ebb5-9be9-4c21-a9b2-962586548c5d (accessed on 10 June 2019).
- Environmental Protection Agency 2018. Available online: http://oras.gamta.lt/cms/index?rubricId=260ccbe8-5401-4f3b-adb1-b4ab1b9aa2b5 (accessed on 10 June 2019).
- Lithuanian Hygiene Standards HN 33:2011. Available online: https://e-seimas.lrs.lt/portal/legalAct/lt/TAD/TAIS.402074/RyjlQsiUhe (accessed on 10 June 2019).
- Morrison, P.S.; Beer, B. Consumption and environmental awareness: Demographics of the European Experience. In Socioeconomic Environmental Policies and Evaluations in Regional Science; Shibusawa, H. Sakurai, Mizunoya, T., Uchida, S., Eds.; New Frontiers in Regional Science: Asian Perspectives; Springer: Singapore, 2017; Volume 24. [Google Scholar] [CrossRef]
- Buckle, C. Trends 19. The Trends to Know for 2019. Available online: https://www.globalwebindex.com/hubfs/Downloads/Trends-19-report.pdf (accessed on 10 June 2019).
- Grow. Like Peas and Carrots: Millennials and Sustainability. 2016. Available online: https://medium.com/grow-investing/like-peas-and-carrots-millennials-and-sustainability-f04d28185a1c (accessed on 10 June 2019).
- Kreibig, S.D. Autonomic nervous system activity in emotion: A review. Biol. Psychol. 2010, 84, 394–421. [Google Scholar] [CrossRef] [PubMed]
- Khalfa, S.; Roy, M.; Rainville, P.; Dalla Bella, S.; Peretz, I. Role of tempo entrainment in psychophysiological differentiation of happy and sad music? Int. J. Psychophysiol. 2008, 68, 17–26. [Google Scholar] [CrossRef] [PubMed]
- Li, F.; Yang, L.; Shi, H.; Liu, C. Differences in photoplethysmography morphological features and feature time series between two opposite emotions: Happiness and sadness. Artery Res. 2017, 18, 7–13. [Google Scholar] [CrossRef]
- Yang, Z.; Jia, W.; Liu, G.; Sun, M. Quantifying mental arousal levels in daily living using additional heart rate. Biomed. Signal Process. Control 2017, 33, 368–378. [Google Scholar] [CrossRef]
- Chen, C.; Liu, C.; Chen, R.; Wang, W.; Li, W.; Kan, H.; Fu, C. Ambient air pollution and daily hospital admissions for mental disorders in Shanghai, China. Sci. Total Environ. 2018, 613, 324–330. [Google Scholar] [CrossRef]
- An, S.; Han, X.; Wu, B.; Shi, Z.; Marks, M.; Wang, S.; Wu, X.; Han, S. Neural activation in response to the two sides of emotion. Neurosci. Lett. 2018, 684, 140–144. [Google Scholar] [CrossRef]
- Kamila, S.; Hasanuzzaman, M.; Ekbal, A.; Bhattacharyya, P. Resolution of grammatical tense into actual time, and its application in Time Perspective study in the tweet space. PLoS ONE 2019, 14, e0211872. [Google Scholar] [CrossRef]
- Buchanan, T.W.; Bibas, D.; Adolphs, R. Associations between feeling and judging the emotions of happiness and fear: Findings from a large-scale field experiment. PLoS ONE 2010, 5, e10640. [Google Scholar] [CrossRef] [PubMed][Green Version]
- Newport, F.; Pelham, B. Don’t Worry, Be 80: Worry and Stress Decline With Age Worry, Stress Lowest for Those in Their 80s, 90s. Available online: https://news.gallup.com/poll/124655/dont-worry-be-80-worry-stress-decline-age.aspx (accessed on 10 June 2019).
- Gerdtham, U.G.; Johannesson, M. The relationship between happiness, health and socio-economic factors: Results based on Swedish micro data. J. Socio-Econ. 2001, 30, 553–557. [Google Scholar] [CrossRef]
- Clark, A. Unemployment as a social norm: Psychological evidence from panel data. J. Labor Econ. 2003, 21, 324–351. [Google Scholar] [CrossRef]
- Ferrer-i-Carbonell, A.; Gowdy, J.M. Environmental degradation and happiness. Ecol. Econ. 2007, 60, 509–516. [Google Scholar] [CrossRef]
- Blanchflower, D.G.; Oswald, A. Is well-being U-shaped over the life cycle? Soc. Sci. Med. 2008, 66, 1733–1749. [Google Scholar] [CrossRef] [PubMed]
- Steptoe, A.; Deaton, A.; Stone, A.A. Subjective wellbeing, health, and ageing. Lancet 2015, 385, 640–648. [Google Scholar] [CrossRef]
- Ingraham, C. This Chart Predicts the Age at Which You’ll be Happiest. Available online: https://www.weforum.org/agenda/2017/08/youll-probably-have-a-midlife-happiness-crisis-heres-why. (accessed on 10 June 2019).
- Lebowitz, S.; Kiersz, A. Your Happiness Might Keep Dropping All the Way into Your 50s—Before A Midlife Crisis Turns It Around. Available online: https://www.businessinsider.com/midlife-crisis-controversial-study-2017-9 (accessed on 10 June 2019).
- Larson, E.B. Who’s Happier—People in Their 40s or 80s? Available online: https://wa-health.kaiserpermanente.org/whos-happier-people-in-their-40s-or-80s/ (accessed on 10 June 2019).
- Stone, A.A.; Schneider, S.; Krueger, A.; Schwartz, J.E.; Deaton, A. Experiential wellbeing data from the American time use survey: Comparisons with other methods and analytic illustrations with age and income. Soc. Indic. Res. 2018, 136, 359–378. [Google Scholar] [CrossRef]
- Blanchflower, D.G. The well-being of the young. Br. J. Ind. Relat. 2010. Available online: https://www.dartmouth.edu/~blnchflr/papers/bjir%20youth%20attitudes%20draft.pdf (accessed on 10 June 2019).
- Gana, K.; Bailly, N.; Saada, Y.; Joulain, M.; Alaphilippe, D. Does life satisfaction change in old age: Results from an 8-year longitudinal study. J. Gerontol. Ser. B Psychol. Sci. Soc. Sci. 2013, 68, 540–552. [Google Scholar] [CrossRef]
- Stone, A.A.; Schwartz, J.E.; Broderick, J.E.; Deaton, A. A snapshot of the age distribution of psychological well-being in the United States. Proc. Natl. Acad. Sci. USA 2010, 107, 9985–9990. [Google Scholar] [CrossRef]
- Graham, C.; Pozuelo, J.R. Happiness, stress, and age: How the U curve varies across people and places. J. Popul. Econ. 2017, 30, 225–264. [Google Scholar] [CrossRef]
- Grühn, D.; Kotter-Grühn, D.; Röcke, C. Discrete affects across the adult lifespan: Evidence for multidimensionality and multidirectionality of affective experiences in young, middle-aged and older adults. J. Res. Personal. 2010, 44, 492–500. [Google Scholar] [CrossRef]
- Vijayakumar, N.; Pfeifer, J.H.; Flournoy, J.C.; Hernandez, L.M.; Dapretto, M. Affective reactivity during adolescence: Associations with age, puberty and testosterone. bioRxiv 2019, 524033. [Google Scholar] [CrossRef] [PubMed]
- Blanchflower, D.G. International evidence on well-being. In Measuring the Subjective Well-Being of Nations: National Accounts of Time Use and Well-Being; University of Chicago Press: Chicago, IL, USA, 2009; pp. 155–226. [Google Scholar]
- Palmer, G.J.; Ziegler, M.G.; Lake, C.R. Response of norepinephrine and blood pressure to stress increases with age. J. Gerontol. 1978, 33, 482–487. [Google Scholar] [CrossRef]
- Yeragani, V.K.; Pohl, R.; Berger, R.; Balon, R.; Srinivasan, K. Relationship between age and heart rate variability in supine and standing postures: A study of spectral analysis of heart rate. Pediatri. Cardiol. 1994, 15, 14–20. [Google Scholar] [CrossRef] [PubMed]
- Lakatta, E.G. Age-associated cardiovascular changes in health: Impact on cardiovascular disease in older persons. Heart Fail. Rev. 2002, 7, 29–49. [Google Scholar] [CrossRef]
- Hartaigh, B.Ó.; Gill, T.M.; Shah, I.; Hughes, A.D.; Deanfield, J.E.; Kuh, D.; Hardy, R. Association between resting heart rate across the life course and all-cause mortality: Longitudinal findings from the Medical Research Council (MRC) National Survey of Health and Development (NSHD). J. Epidemiol. Community Health 2014, 68, 883–889. [Google Scholar] [CrossRef]
- Polar. Your Resting Heart Rate is Telling You Something—So Listen. Available online: https://www.polar.com/blog/resting-heart-rate/ (accessed on 10 June 2019).
- Stoffels, M.; Nijs, M.; Spinhoven, P.; Mesbah, R.; Hagenaars, M.A. Emotion avoidance and fear bradycardia in patients with borderline personality disorder and healthy controls. J. Behav. Ther. Exp. Psychiatry 2017, 57, 6–13. [Google Scholar] [CrossRef]
- Ribeiro, F.S.; Santos, F.H.; Albuquerque, P.B.; Oliveira-Silva, P. Emotional induction through music: Measuring cardiac and electrodermal responses of emotional states and their persistence. Front. Psychol. 2019, 10, 451. [Google Scholar] [CrossRef]
- Frey, B.S.; Stutzer, A. What can economists learn from happiness research? J. Econ. Lit. 2002, 40, 402–435. [Google Scholar] [CrossRef]
- Hirschman, E.C.; Holbrook, M.B. Hedonic consumption: Emerging concepts, methods and propositions. J. Mark. 1982, 46, 92–101. [Google Scholar] [CrossRef]
- Holbrook, M.B.; Hirschman, E.C. The experiential aspects of consumption: Consumer fantasies, feelings and fun. J. Consum. Res. 1982, 9, 132–140. [Google Scholar] [CrossRef]
- Holbrook, M.B. The consumption experience—Something new, something old, something borrowed, something sold: Part 1. J. Macromark. 2006, 26, 259–266. [Google Scholar] [CrossRef]
- Holbrook, M.B. The consumption experience—Something new, something old, something borrowed, something sold: Part 2. J. Macromark. 2006, 27, 86–96. [Google Scholar] [CrossRef]
- Ballas, D. What makes a ‘happy city’? Cities 2013, 32, s39–s50. [Google Scholar] [CrossRef]
- Ansaloni, F.; Tedeschi, M. Understanding space ethically through affect and emotion: From uneasiness to fear and rage in the city. Emot. Space Soc. 2016, 21, 15–22. [Google Scholar] [CrossRef]
- Benita, F.; Bansal, G.; Tunçer, B. Public spaces and happiness: Evidence from a large-scale field experiment. Health Place 2019, 56, 9–18. [Google Scholar] [CrossRef]
- Rossetti, T.; Lobel, H.; Rocco, V.; Hurtubia, R. Explaining subjective perceptions of public spaces as a function of the built environment: A massive data approach. Landsc. Urban Plan. 2019, 181, 169–178. [Google Scholar] [CrossRef]
- Brook, R.D. Cardiovascular effects of air pollution. Clin Sci. 2008, 115, 175–187. [Google Scholar] [CrossRef]
- Mills, N.L.; Donaldson, K.; Hadoke, P.W.; Boon, N.A.; MacNee, W.; Cassee, F.R.; Sandström, T.; Blomberg, A.; Newby, D.E. Adverse cardiovascular effects of air pollution. Nat. Clin. Pract. Cardiovasc. Med. 2009, 6, 36–44. [Google Scholar] [CrossRef]
- Simkhovich, B.Z.; Kleinman, M.T.; Kloner, R.A. Air pollution and cardiovascular injury epidemiology, toxicology, and mechanisms. J. Am. Coll. Cardiol. 2008, 52, 719–726. [Google Scholar] [CrossRef]
- Gold, D.R.; Litonjua, A.; Schwartz, J.; Lovett, E.; Larson, A.; Nearing, B.; Allen, G.; Verrier, M.; Cherry, R.; Verrier, R. Ambient pollution and heart rate variability. Circulation 2000, 101, 1267–1273. [Google Scholar] [CrossRef] [PubMed]
- LeBlanc, J.; Blais, B.; Barabe, B.; Cote, J. Effects of temperature and wind on facial temperature, heart rate, and sensation. J. Appl. Physiol. 2017, 40, 127–131. [Google Scholar] [CrossRef] [PubMed]
- Delyukov, A.A.; Didyk, L. The effects of extra-low-frequency atmospheric pressure oscillations on human mental activity. Int. J. Biometeorol. 1999, 43, 31–37. [Google Scholar] [CrossRef] [PubMed]
- Randler, C.; Desch, I.H.; im Kampe, V.O.; Wüst-Ackermann, P.; Wilde, M.; Prokop, P. Anxiety, disgust and negative emotions influence food intake in humans. Int. J. Gastron. Food Sci. 2017, 7, 11–15. [Google Scholar] [CrossRef][Green Version]
- Gilchrist, P.T.; Vrinceanu, T.; Béland, S.; Bacon, S.L.; Ditto, B. Disgust stimuli reduce heart rate but do not contribute to vasovagal symptoms. J. Behav. Ther. Exp. Psychiatry 2016, 51, 116–122. [Google Scholar] [CrossRef] [PubMed]
© 2019 by the authors. Licensee MDPI, Basel, Switzerland. This article is an open access article distributed under the terms and conditions of the Creative Commons Attribution (CC BY) license (http://creativecommons.org/licenses/by/4.0/).