Article

Analysis of Different Strategies for Lowering the Operation Temperature in Existing District Heating Networks

1
Department of Energy, Politecnico di Torino, c.so Duca degli Abruzzi 24, 10129 Torino, Italy
2
Fondazione Eni Enrico Mattei, c.so Magenta 63, 20123 Milano, Italy
3
United Technologies Research Center, Penrose Wharf Business Centre, 4th floor, T23 XN53 Cork City, Ireland
*
Author to whom correspondence should be addressed.
Energies 2019, 12(2), 321; https://doi.org/10.3390/en12020321
Submission received: 12 December 2018 / Revised: 9 January 2019 / Accepted: 18 January 2019 / Published: 21 January 2019
(This article belongs to the Special Issue District Heating and Cooling Networks)

Abstract

:
District heating systems have an important role in increasing the efficiency of the heating and cooling sector, especially when coupled to combined heat and power plants. However, in the transition towards decarbonization, current systems show some challenges for the integration of Renewable Energy Sources and Waste Heat. In particular, a crucial aspect is represented by the operating temperatures of the network. This paper analyzes two different approaches for the decrease of operation temperatures of existing networks, which are often supplying old buildings with a low degree of insulation. A simulation model was applied to some case studies to evaluate how a low-temperature operation of an existing district heating system performs compared to the standard operation, by considering two different approaches: (1) a different control strategy involving nighttime operation to avoid the morning peak demand; and (2) the partial insulation of the buildings to decrease operation temperatures without the need of modifying the heating system of the users. Different temperatures were considered to evaluate a threshold based on the characteristics of the buildings supplied by the network. The results highlight an interesting potential for optimization of existing systems by tuning the control strategies and performing some energy efficiency operation. The network temperature can be decreased with a continuous operation of the system, or with energy efficiency intervention in buildings, and distributed heat pumps used as integration could provide significant advantages. Each solution has its own limitations and critical parameters, which are discussed in detail.

1. Introduction

District heating (DH) systems are a mature technology that shows multiple advantages for the heating and cooling sector in cities. The heating network can be connected to multiple generation units, including combined heat and power (CHP) plants and waste heat recovery (WHR) from industries, increasing the efficiency of the whole system. Moreover, DH has allowed in multiple cases the integration of renewable energy sources (RES) such as wood biomass and municipal solid waste (whose organic fraction is often considered renewable) to support the decarbonization of heating and cooling in large cities. Indeed, the possibility of operating large plants allows a better control of the local pollutants with respect to distributed generation.
Nowadays, the big challenge faced by fourth-generation DH [1] is the need of lowering the operational temperature of DH systems to foster the integration of additional technologies including solar energy [2], heat pumps and low-temperature waste heat [3]. This is a crucial aspect in the transition towards more sustainable heating systems, which should decrease the dependency on fossil fuels, which are currently the main source for DH systems in many countries. An additional driver is the major transition in electricity generation at country level: the large increase of the RES share is affecting the economic profitability of large CHP plants, which are often coupled to DH systems in Northern Europe [4].
The potential for low-temperature DH has already been evaluated in the literature [5], and a number of networks already operate at low or very low temperatures, especially in Northern Europe [6,7]. Existing low-temperature DH systems generally have a small size, the connected buildings have significant insulation, and often the heating system of each building has no hydraulic separation from the primary network. Traditional DH systems in large cities have no such characteristics, and therefore alternative approaches are needed to support an effective transition of existing systems to low-temperature solutions.
Some research works have focused on the benefits that can be reached by decreasing the network supply and return temperatures [8], indicating the heat demand density in the area as a key parameter for the evaluation of the competitiveness of the DH. An additional threat to the economic sustainability of future DH systems is an excessive insulation of buildings, which can lead to excessive payback times for the required infrastructure [9]. In some practical experiences, the importance of a proper monitoring and control of the actual operating parameters in the users’ heating systems has been found to be a crucial aspect for the optimization of the DH network [10]. The use of simulation models can be an important support in evaluating the benefits that can be reached in existing systems [11], and different approaches have been used in modeling DH systems, including simplified RC models [12] and more complex models based on machine learning techniques [13]. More detailed models are generally applied to single buildings, as the simulation of complex algorithms over multiple buildings with different parameters generally leads to unacceptable time for model set-up and computation. In the sector of DH systems, few works have focused on the actual comparison of the operation of a given system at different temperature levels and with different operational logics.
This paper compares, by means of a dedicated simulation model, two different approaches for a low-temperature operation of an existing DH network. The first approach considers a 24-h operation instead of the traditional night set-back control (i.e., the heating system is shut down at night), while the second is based on a partial insulation of the buildings in order to operate the existing users’ heating systems with a lower nominal temperature.

2. Methodology

A simulation model of a DH system was defined to evaluate the impact of decreasing, under different conditions, the water temperature of its distribution network. The model is composed by the final user and the distribution network of a DH central thermal plant, while the three separate use cases compare: (i) the current condition of the third-generation of DH system; (ii) a low-temperature network with continuous operations during the night; and (iii) a low-temperature network with energy efficient buildings.

2.1. Simulation Model
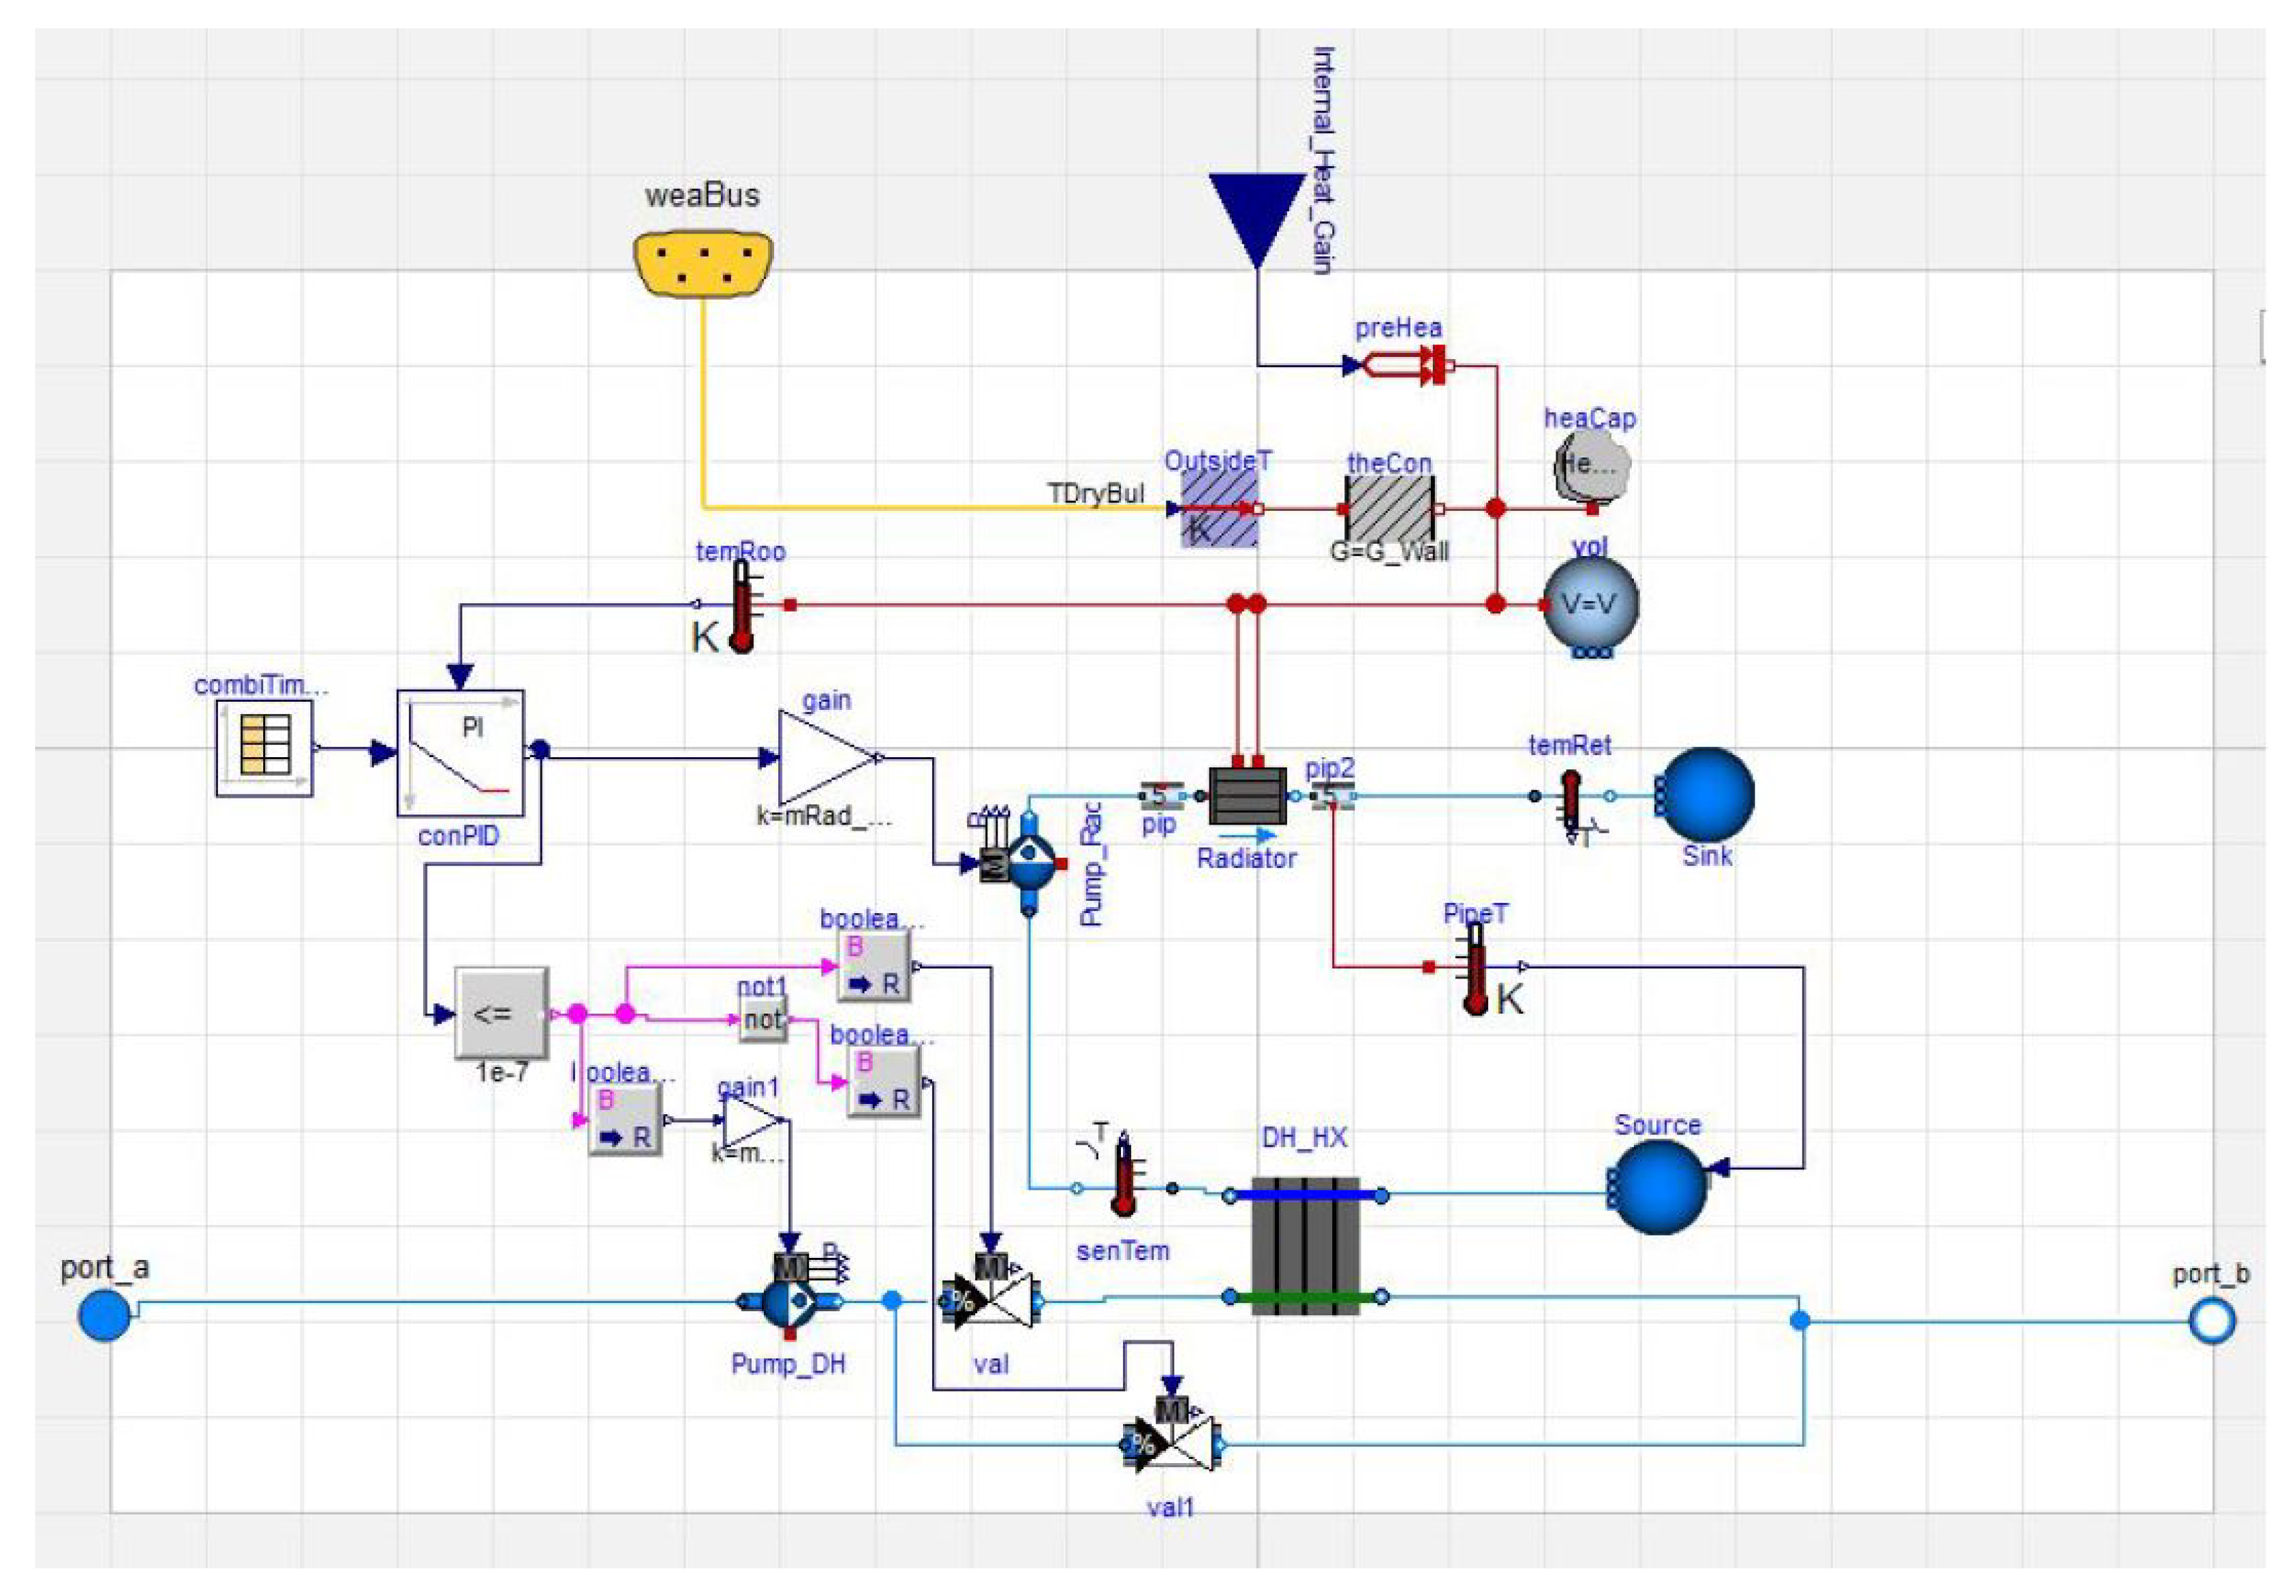
The simulation model was developed in Modelica using the Dymola programming environment [14]. The model was based on the library developed by IEA Annex 60 [15], an open source Modelica library that serves as the core of other Modelica libraries, and on the library “Buildings”, developed by Lawrence Berkeley National Laboratory, for dynamic simulation of the energetic behavior of single rooms, buildings and whole districts [16].
The two main parts of the simulation model are the final users and the network model. The simulation model assumptions and components are explained in detail in the following sub-sections.

2.1.1. Final Users

The final users were simulated by a model of a building with its heating system connected to the DH heat exchanger as shown in Figure 1 by the Modelica–Dymola scheme.
The building is modeled by a volume of air with a specific heat capacity and it is connected to a thermal conductor representing the walls of the building, with a radiator used as heat source. The building volume is represented by the block vol, an instantaneously mixed volume, that has as main parameters the total volume and the nominal air mass flow rate. It can exchange heat through its heatport. The heat flows in the model are represented by preHea and the heat flow from the radiator by Radiator. The block heaCap is used to model the heat capacity of the building, assumed independent of the temperature and any specific geometry. This component changes the heat capacity value of the air to include the effect of energy storage in walls and furnitures. The overall dispersion of the building is modeled by using a single thermal conductor represented by theCon which takes as parameter the thermal conductance, assumed to be constant during the simulation. The block is connected, on one side, to the ambient temperature of the volume vol and, on the other side, to the outside temperature through the component OutsideT. This reproduces a variable temperature boundary condition derived from the weather data provided by WeaBus component (discussed in Section 2.1.2). Moreover, free gains are taken into account by means of the component preHea, which allows injecting or subtracting a specified amount of heat into the system. These free gains represent the passive heating by indirect heat sources (people, lights, appliances, solar, etc.) that are generally considered in buildings demand simulations. Summarizing, the volume of the building vol is connected to: (1) the thermal conductance to simulate the heat losses with the environment; (2) the heat capacity that approximate energy storage in furniture and building; (3) the radiator that is the main heat source; and (4) the free gain block.
The building heating system is modeled as a circuit between the Radiator and the DH heat exchanger DH_HX. The Radiator parameters consist of the data typically available from manufacturers compliant with the European Norm EN 442-2, including the nominal mass flow rate, the nominal inlet temperature and temperature difference, and the heating power. Furthermore, compared to the other components, the Radiator has two heat port connections with the building representing the convective heat flow rate and the radiative heat flow rate. For simplicity, it was assumed that the air and radiative temperature of the building are equal. Thus, there is no difference, in the calculation of the heat exchanged, between the radiative and the convective temperature. The transferred heat is modeled as follows. For each element i = 1 , , N , where N denotes the number of elements used to discretize the radiator model, the convective and radiative heat transfer, Q c and Q r , are calculated as:
Q ˙ c = s i g n ( T i T a ) ( 1 f r ) U A N T i T a n
Q ˙ r = s i g n ( T i T r ) ( f r ) U A N T i T r n
where T i is the water temperature of the element, T a is the temperature of the room air, T r is the radiative temperature, f r is the fraction of radiant to total heat transfer, U A is the UA-value of the radiator and n is an exponent for the heat transfer. The sign function is used to give a direction to the heat flow: positive for heating. The model computes the UA-value solving the above equations with nominal values. Because the building is modeled as a single volume with homogeneous properties, a single radiator is used to minimize the computational time. The DH_HX is a model of a discretized coil made of two flow paths which are in opposite direction to model a counter-flow heat exchanger. The main parameters are the nominal mass flow rate of the two fluids (kg/s) and the thermal conductance at nominal flow (W/K). The water mass flow rate is controlled by a variable speed pump Pump_rad whose detailed description can be found in [17]. The nominal value of the mass flow rate is used to compute a default pressure curve (if no experimental pressure curve has been specified) that gives the electrical power consumption and the pump efficiency as function of the flow rate and the speed. The model computes the motor power consumption P e l e , the hydraulic power input W h y d , the flow work W f l o and the heat dissipated Q. Based on the first law, the flow work is
W f l o = V ˙ Δ P
where V ˙ is the volume flow rate and Δ P is the pressure rise. The efficiencies are computed as
η = W f l o / P e l e = η h y d η m o t
η h y d = W f l o / W h y d
η m o t = W h y d / P e l e
where η h y d and η m o t are, respectively, the hydraulic and motor efficiency. A PI controller conPID is used to track the temperature set point inside the building volume by controlling the mass flow rate, that can vary within 0–100% to simulate the thermostatic valves of the radiator. The water mass flow rate of the DH distribution network is considered to be constant. When the building heating system is switched off, the DH flow bypasses the heat exchanger thanks to the two valves Val_01 and Val_02.

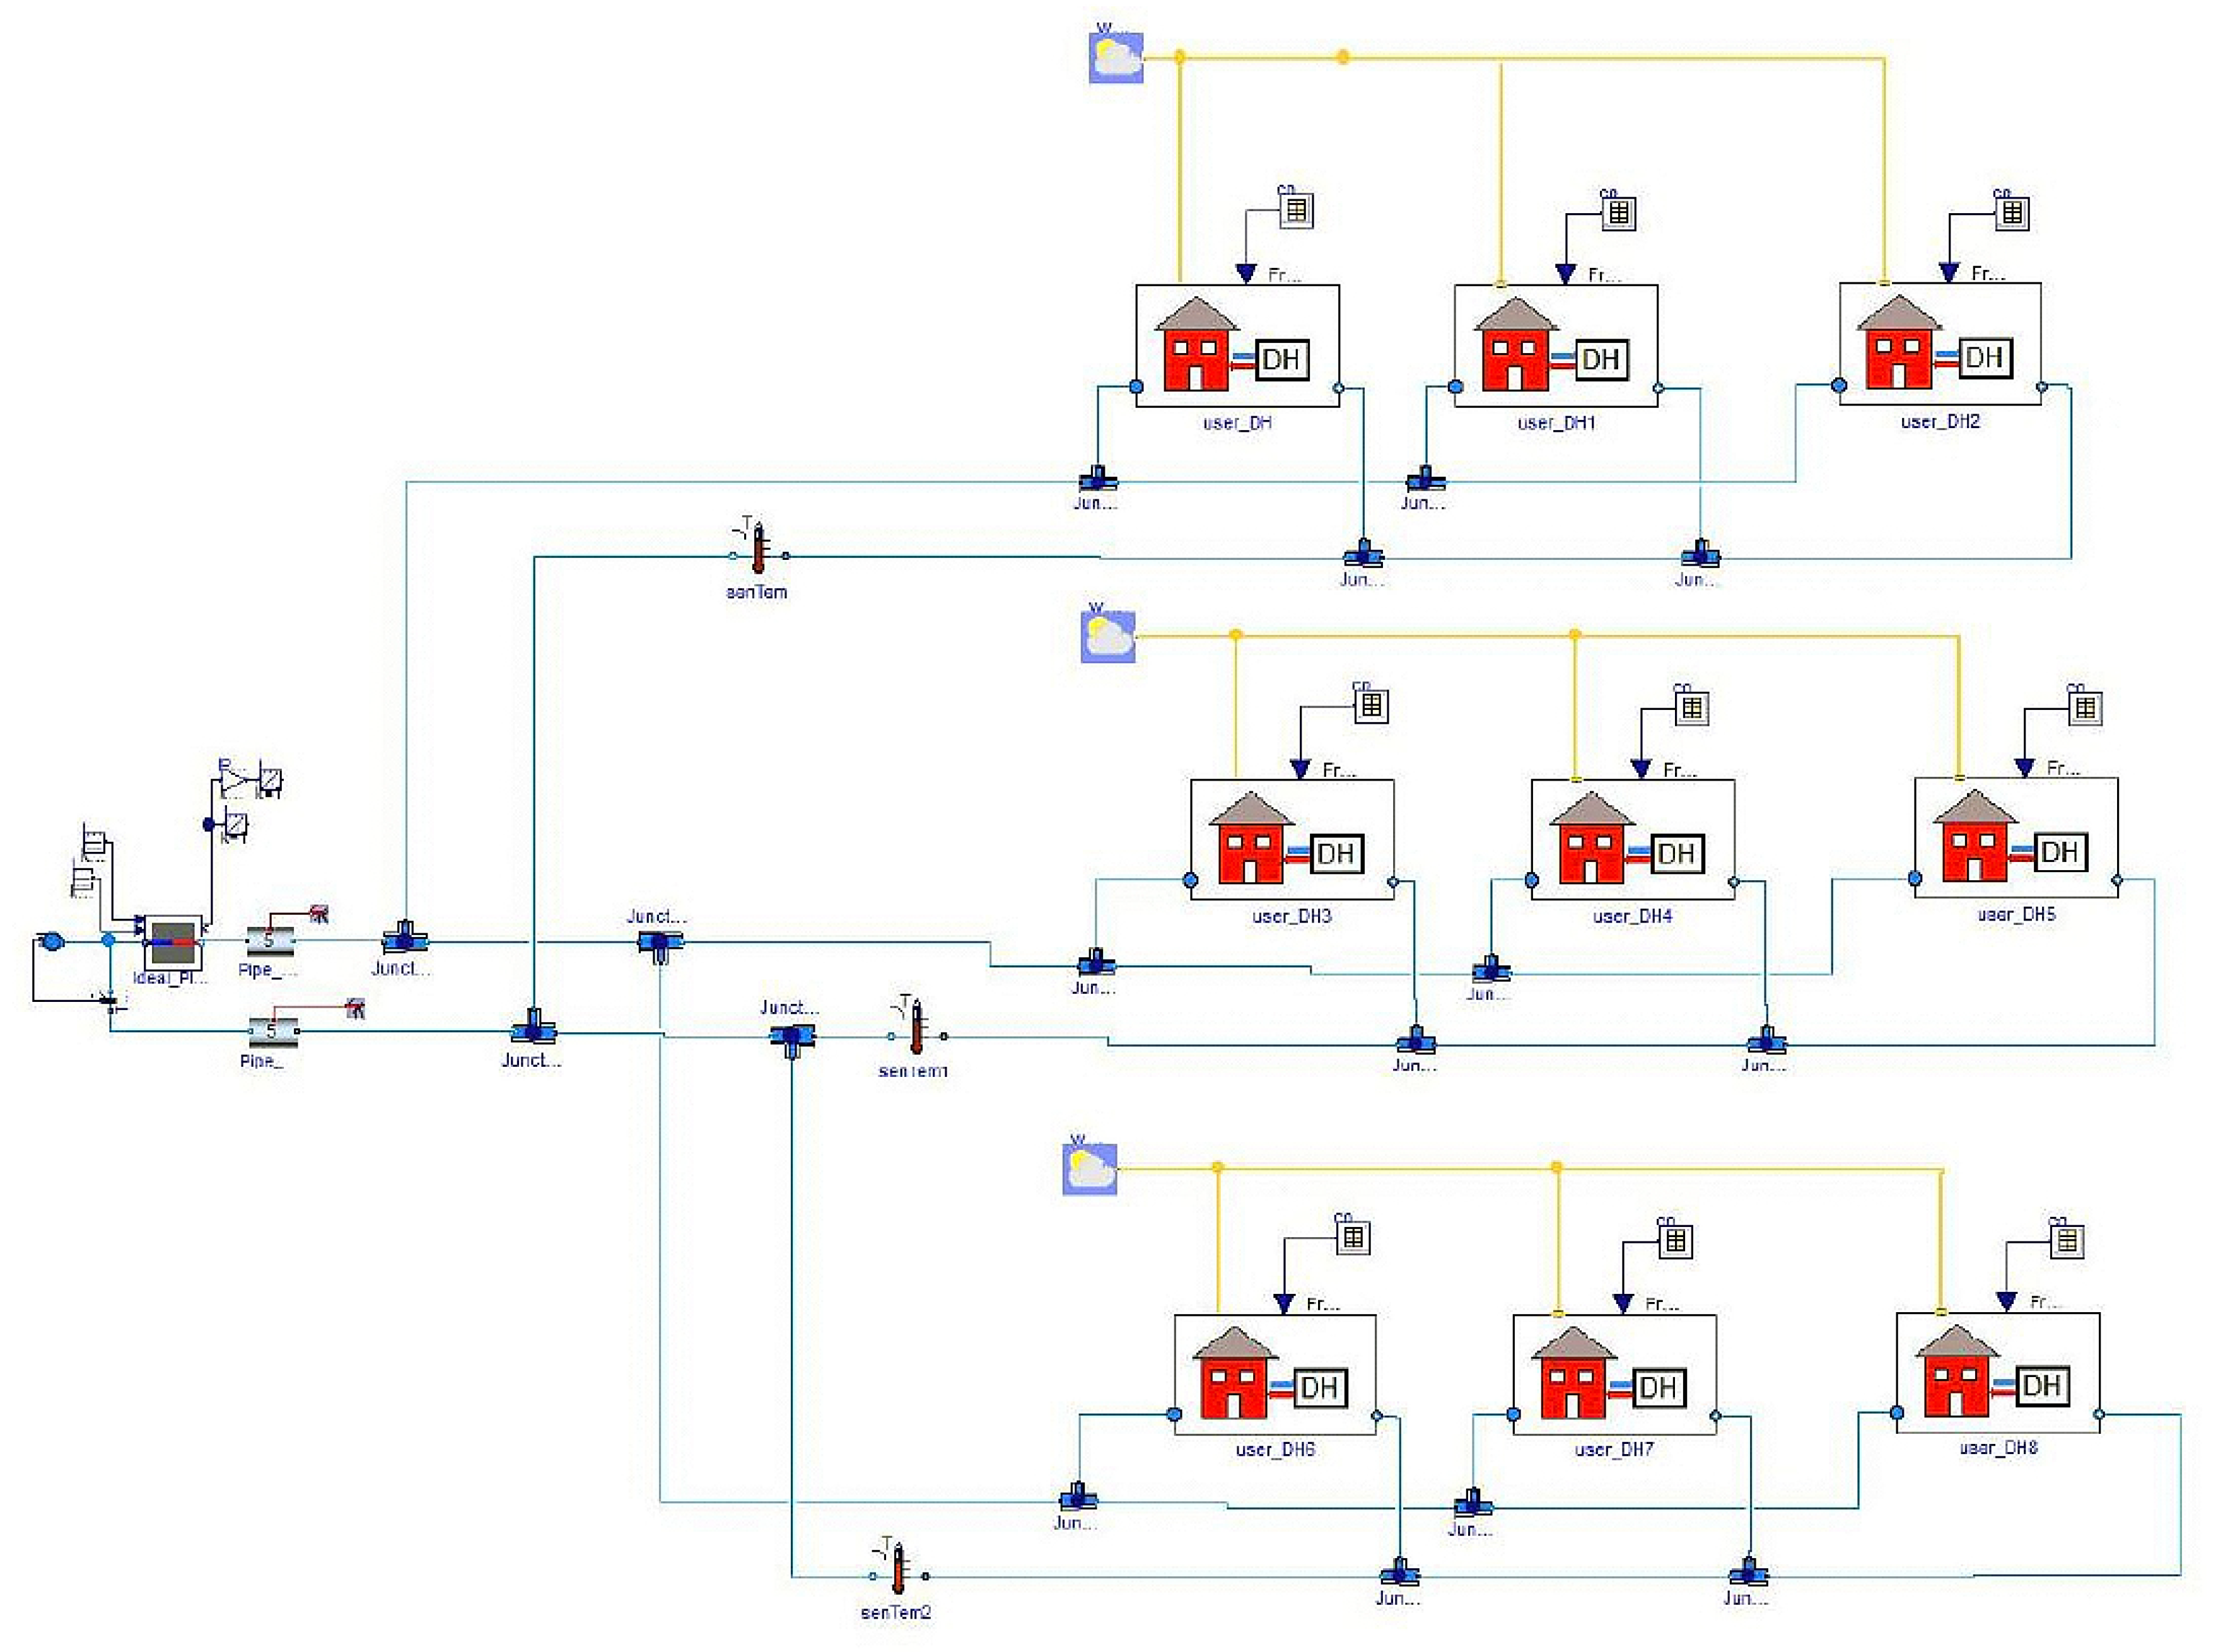
2.1.2. District Heating Network

The Dymola model of the DH network is represented in Figure 2. A detailed topological simulation of the flow distributions in the piping layout was beyond the scope of this work. Such simulations are usually performed in large networks where large distances may lead to complex flow distributions, especially in networks with looped circuits. In this model, the central plant is modeled as a simple block IdealPlant_IP that heats up the fluid to the set point temperature and calculates the transferred power: its parameters are the set point of water temperature supply, the nominal mass flow rate and the nominal pressure drop. The DH load is composed by nine users (user_DH) described in Section 2.1.1: each user can represent either a single building or an aggregate load by simply changing the design parameters. Each load is connected to the DH network in parallel by means of junctions Junc that takes as parameter the nominal mass flow rate per each branch and the relative pressure drop calculated as:
m ˙ = K Δ P
where m ˙ is the mass flow rate, Δ P is the pressure drop and K is a constant that is calculated at the nominal values of the previous variables, namely m ˙ n o m i n a l and Δ P n o m i n a l . No thermal losses are taken into account in this component. Right after the plant there are two pipe components for the supply and return water flows, namely Pipe_Main_Flow and Pipe_Main_Return that take as parameters the length, the insulation thickness and its thermal conductivity, the nominal mass flow rate and the velocity of the fluid. The diameter of the pipe can be arbitrary specified or automatically determined by the component according to the following equation:
d = 4 m ˙ ρ π v
Unlike junctions, the pipe component takes into account thermal losses, based on the available geometric data and the outside temperature, while pressure drops are calculated as described in Equation (8).
The weather data component WeaDat reads Typical Meteorological Year (TMY) data, a statistical collection of weather data for a given location, listing hourly values of meteorological elements for a one-year period. TMY represents annual averages and it is used in buildings simulation to evaluate costs and expected energy consumption. However, TMY is not suited to design worst-case conditions, as an average reference year is considered for the analysis. In the current model, TMY data were obtained from the EnergyPlus web site [18].

2.2. Case Studies

To evaluate the performance of the DH system in different conditions and the impact of lowering the operation temperature of the district, three case studies were studied and compared in the analysis. No case studies took into account domestic hot water production but only space heating.

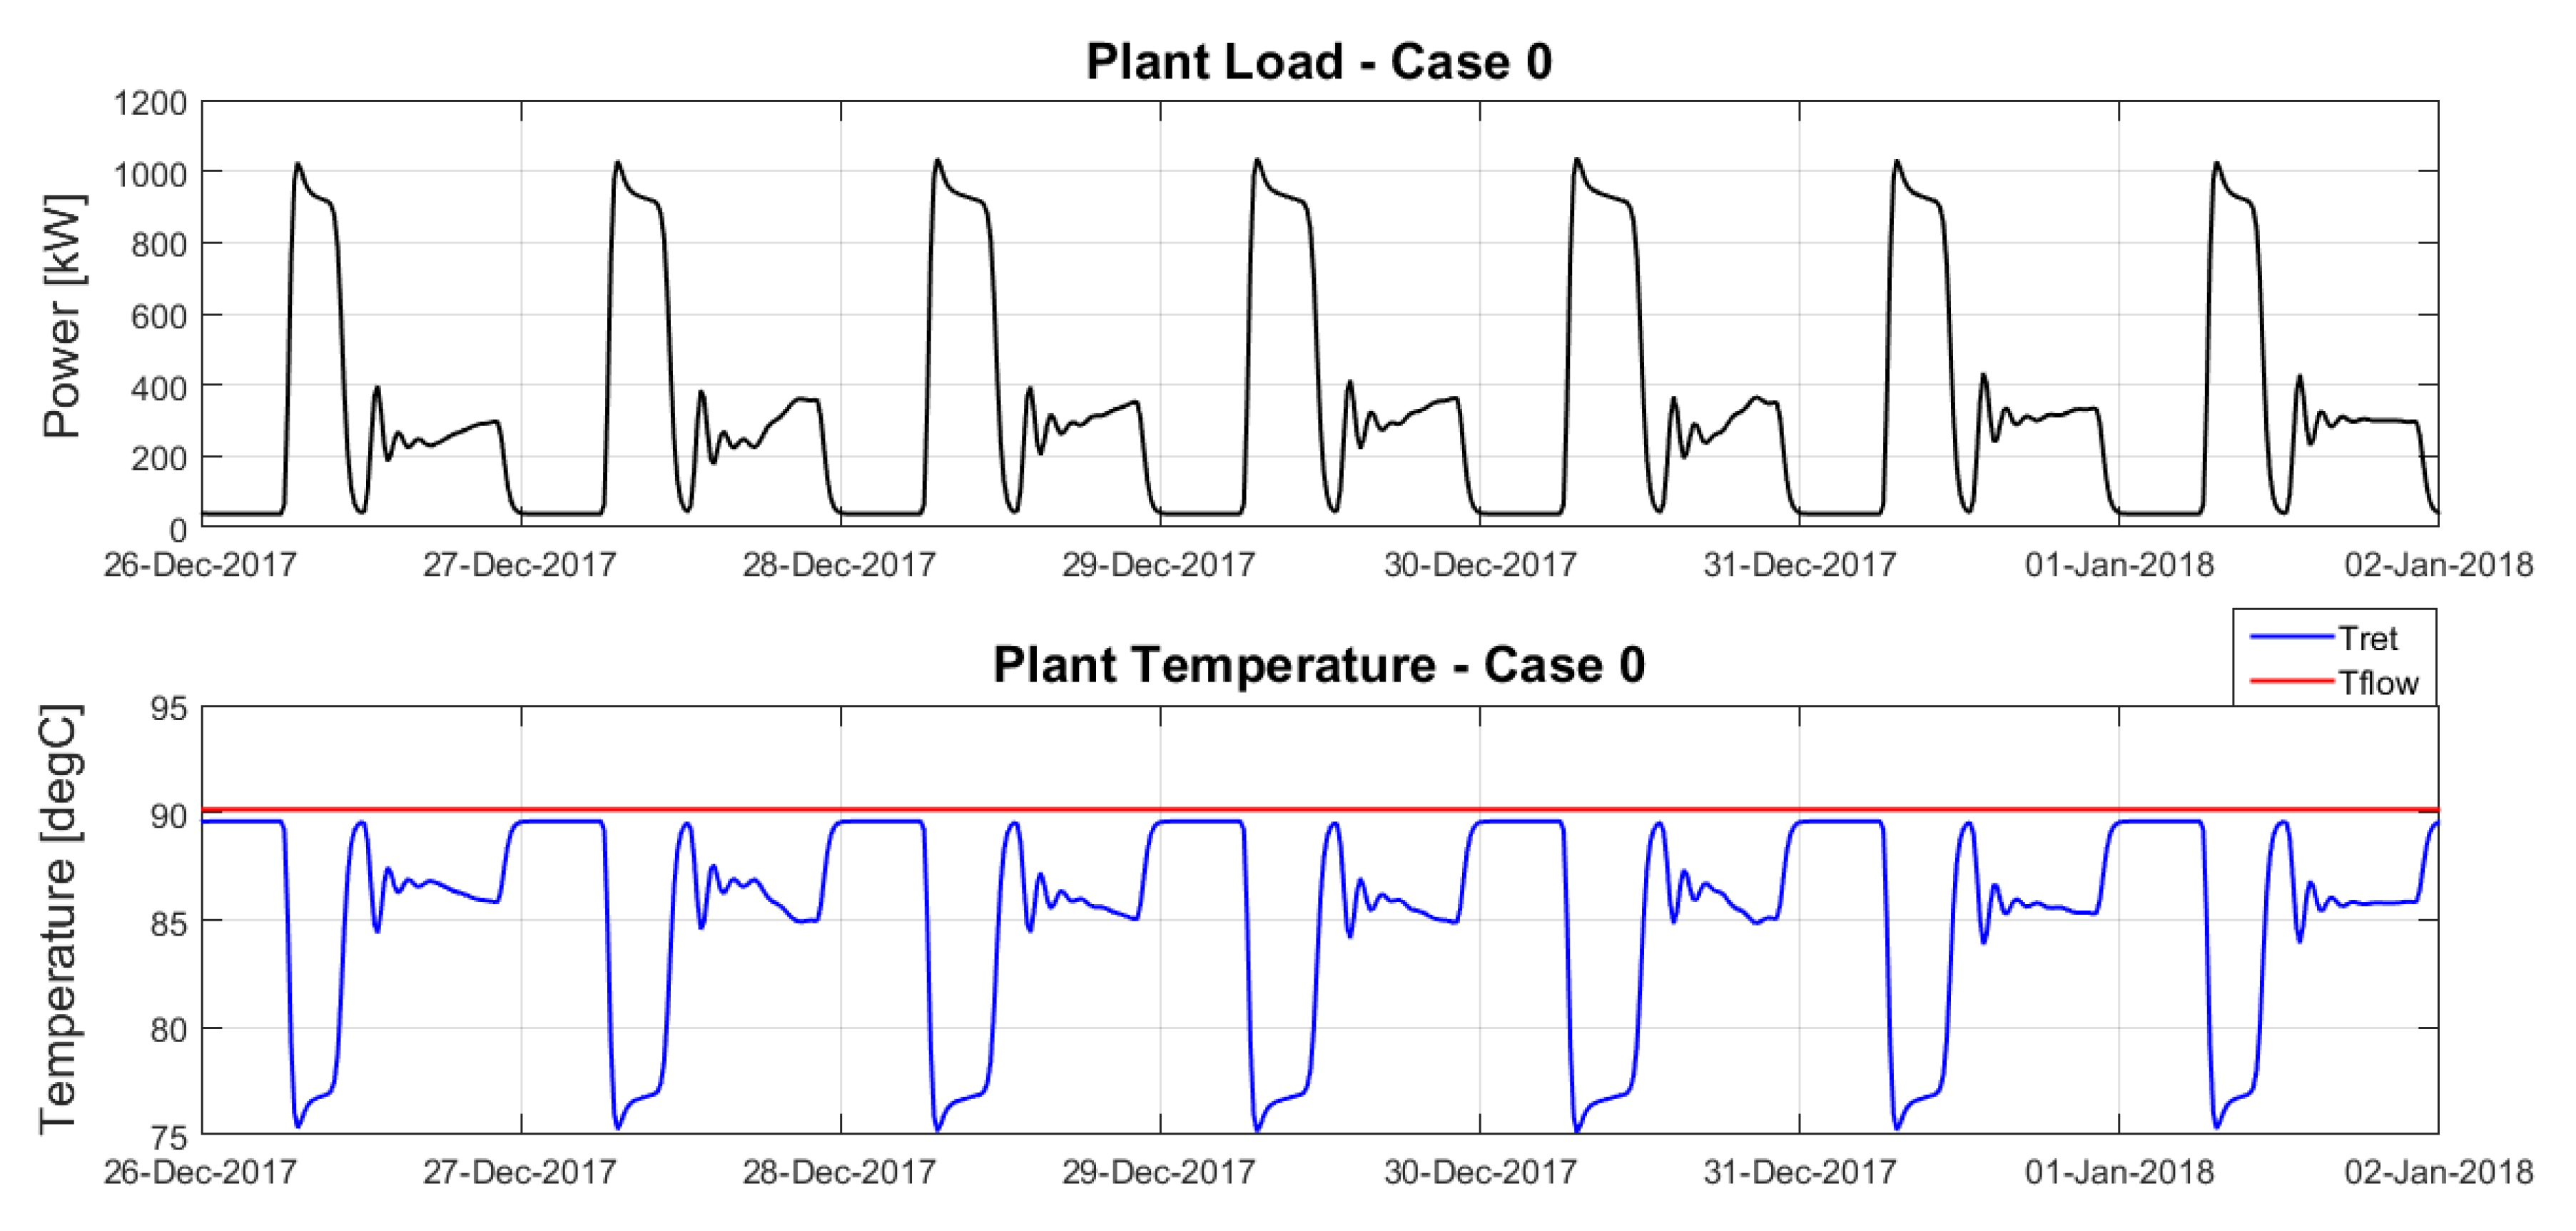
2.2.1. Case 0: Current Conditions

This case represents a third-generation DH system and it was chosen as reference case. The network is operated with a nominal supply temperature of 90 °C, as typical for traditional DH systems. The users represent old residential buildings characterized by poor insulation, high energy demand and with the heating system sized for the worst case scenario (e.g., for the city of Turin, Italy, an outside temperature of 8 C is usually considered). Users’ heating systems are turned on during the day and shut down at night (night set-back control). In Italy, buildings are usually not heated during night in line with the Italian national regulation that limits the heating hours per day [19]. This operation produces a significant morning peak in the load profile, necessitating oversizing the capacity of the DH heat generators or installing a proper heat storage system.
The simulator was tuned using design parameters from the city of Turin. Users are sized to represent blocks of flats with the volumes 3 × 1800 m 3 , 3 × 2400 m 3 , and 3 × 3000 m 3 for a total heated volume of 21,600 m 3 allocated to nine users. The radiators were sized by considering the usual design conditions for Turin, where old buildings’ heating systems have an average installed nominal heat output of 30–40 W/m 3 . The nominal power of radiators, which is usually defined by considering reference values of inlet temperature of 75 C and outlet of 65 C, was therefore calculated for each building as
Q ˙ r a d = 40 × V
being V the volume of the building. Using these design data, the nominal mass flow rate m ˙ could be calculated, for each radiator, by using the equation
m ˙ = Q ˙ r a d / ( c p W × Δ T r a d )
where Q r a d is the nominal power, c p w (J/(kg K)) is the specific heat of water and Δ T r a d is the temperature difference between the inlet and the outlet of the radiator. Moving to the building parameters, free gains were set to zero as conservative hypothesis in order to investigate only the impact of the heating system parameters variation. The thermal conductance of the building, which is required by the simulation model, was calculated from the following equation:
U t h e C o n = f c o r r × Q ˙ r a d / Δ T w o r s t
where Q ˙ r a d is the nominal power of the radiator and Δ T w o r s t is the design delta temperature between the inside and the outside equal to 28 C in Turin (given an outside temperature of 8 C). f c o r r is an empirical correction factor that is needed to correlate the nominal power of the heating systems with the real performance of the units when they are required to heat up the buildings in the morning in the worst conditions. In this study, this factor has been adjusted to a value of 0.5 in accordance with an acceptable transitory duration during the morning peak. The heat capacity of the building was chosen in order to have a temperature during the night around 16 C. This empirical approach was chosen to be consistent and general enough with respect to the real operation of the heating systems, disregarding the unknown multitude of aspects that would affect the definition of the average building heat capacity, including the geometry, the materials of the walls and the furniture. Finally, as described in Section 2.1.1, the building temperature is controlled by a PI controller varying the radiator mass flow rate.

2.2.2. Case 1: Continuous Operation Without Night Set-Back Control

Lowering the network temperature is among the most important actions that has to be done in order to unlock the potentialities of the fourth-generation DH, e.g., RES integration and increasing the overall system efficiency. Nevertheless, in existing systems, a simple decrease of operational temperatures would not guarantee the comfort conditions for the users. In this case, a different schedule of the operations has to be considered to avoid the need of modifying the building or its heating system.
The aim of 1 was studying and understanding possible issues in lowering the temperature of the network, and which components of the building and its heating system might be affected. In particular, a continuous operation during day and night was analyzed as a viable way to decrease the network supply temperature by trying to avoid the morning peak request from the radiators. Moreover, daily load variations in DH systems, such as the morning and late afternoon peaks, lead to higher operational costs and higher losses, decreasing the overall efficiency of the system, as explained in [20,21]. In these two papers, the authors suggested different strategies to exploit heat storage systems to make the load profile flatter for the generation units, but they did not mention the possibility to modify the schedule of the operation of the users, as done in this study. The supply water temperature is then decreased from 90 C to 50 C and the building heating system is operated 24 h per day. To fairly compare the two different cases, the same heating system is used, with the same design parameters of Case 0. Thus, the temperature values of the heating systems of the buildings were calculated by the simulation model by operating the radiators in off-design conditions based on the nominal values of their design parameters.
The building temperature set point was constantly equal to 20 C. Moreover the controller was changed: instead of a PI, a simple on/off controller is used, working within 20 C ± 0.5 C. This is due to difficulties on calibrating the PI controller for this specific case.

2.2.3. Case 2: Energy Efficiency Intervention in Buildings

An alternative approach for lowering the network temperature can be the partial insulation of buildings without the need for modifying the heating system operations. In this case, the aim was to understand if a partial insulation of the building allows meeting the comfort condition while keeping the same heating system day/night operation of Case 0. Indeed, due to the lower heat losses of the building, the radiators can be operated at a lower temperature, leading to a lower heat demand and consequently to the possibility of operating the radiators at a lower temperature.
The values of the design parameter for this case are the same as Case 1, except for the thermal conductance of the users that was reduced by 40% while maintaining the same heat capacity. The new conductance values were 0.78, 1.02, and 1.26 kW/K, respectively, for 1800, 2400, and 3000 m 3 users.
The reduction rate of the thermal conductance was set by considering a reasonable target obtained through energy efficiency measures (including the substitution of the windows and the insulation of the walls) performed on existing residential buildings in the context of Turin, based on the experience of the authors from real refurbishment interventions in the city. Due to the focus of this research work, a more detailed simulation of the building was not performed, leading to some approximations. For the same reason, the heat capacity was not varied accordingly, due to missing information of the specific characteristics of the buildings and the consequent need of an arbitrary new value. This approximation appeared to be acceptable in the context of the present work, and could be further analyzed in a future application with a more detailed definition of the features of each building.

2.3. Additional Analyses

Based on the results of the previous case studies, two additional analyses were performed: (1) a sensitivity analysis on different DH network temperatures; and (2) a further scenario with distributed Heat Pumps (HPs) to integrate the low temperature network and guarantee a better users’ comfort.

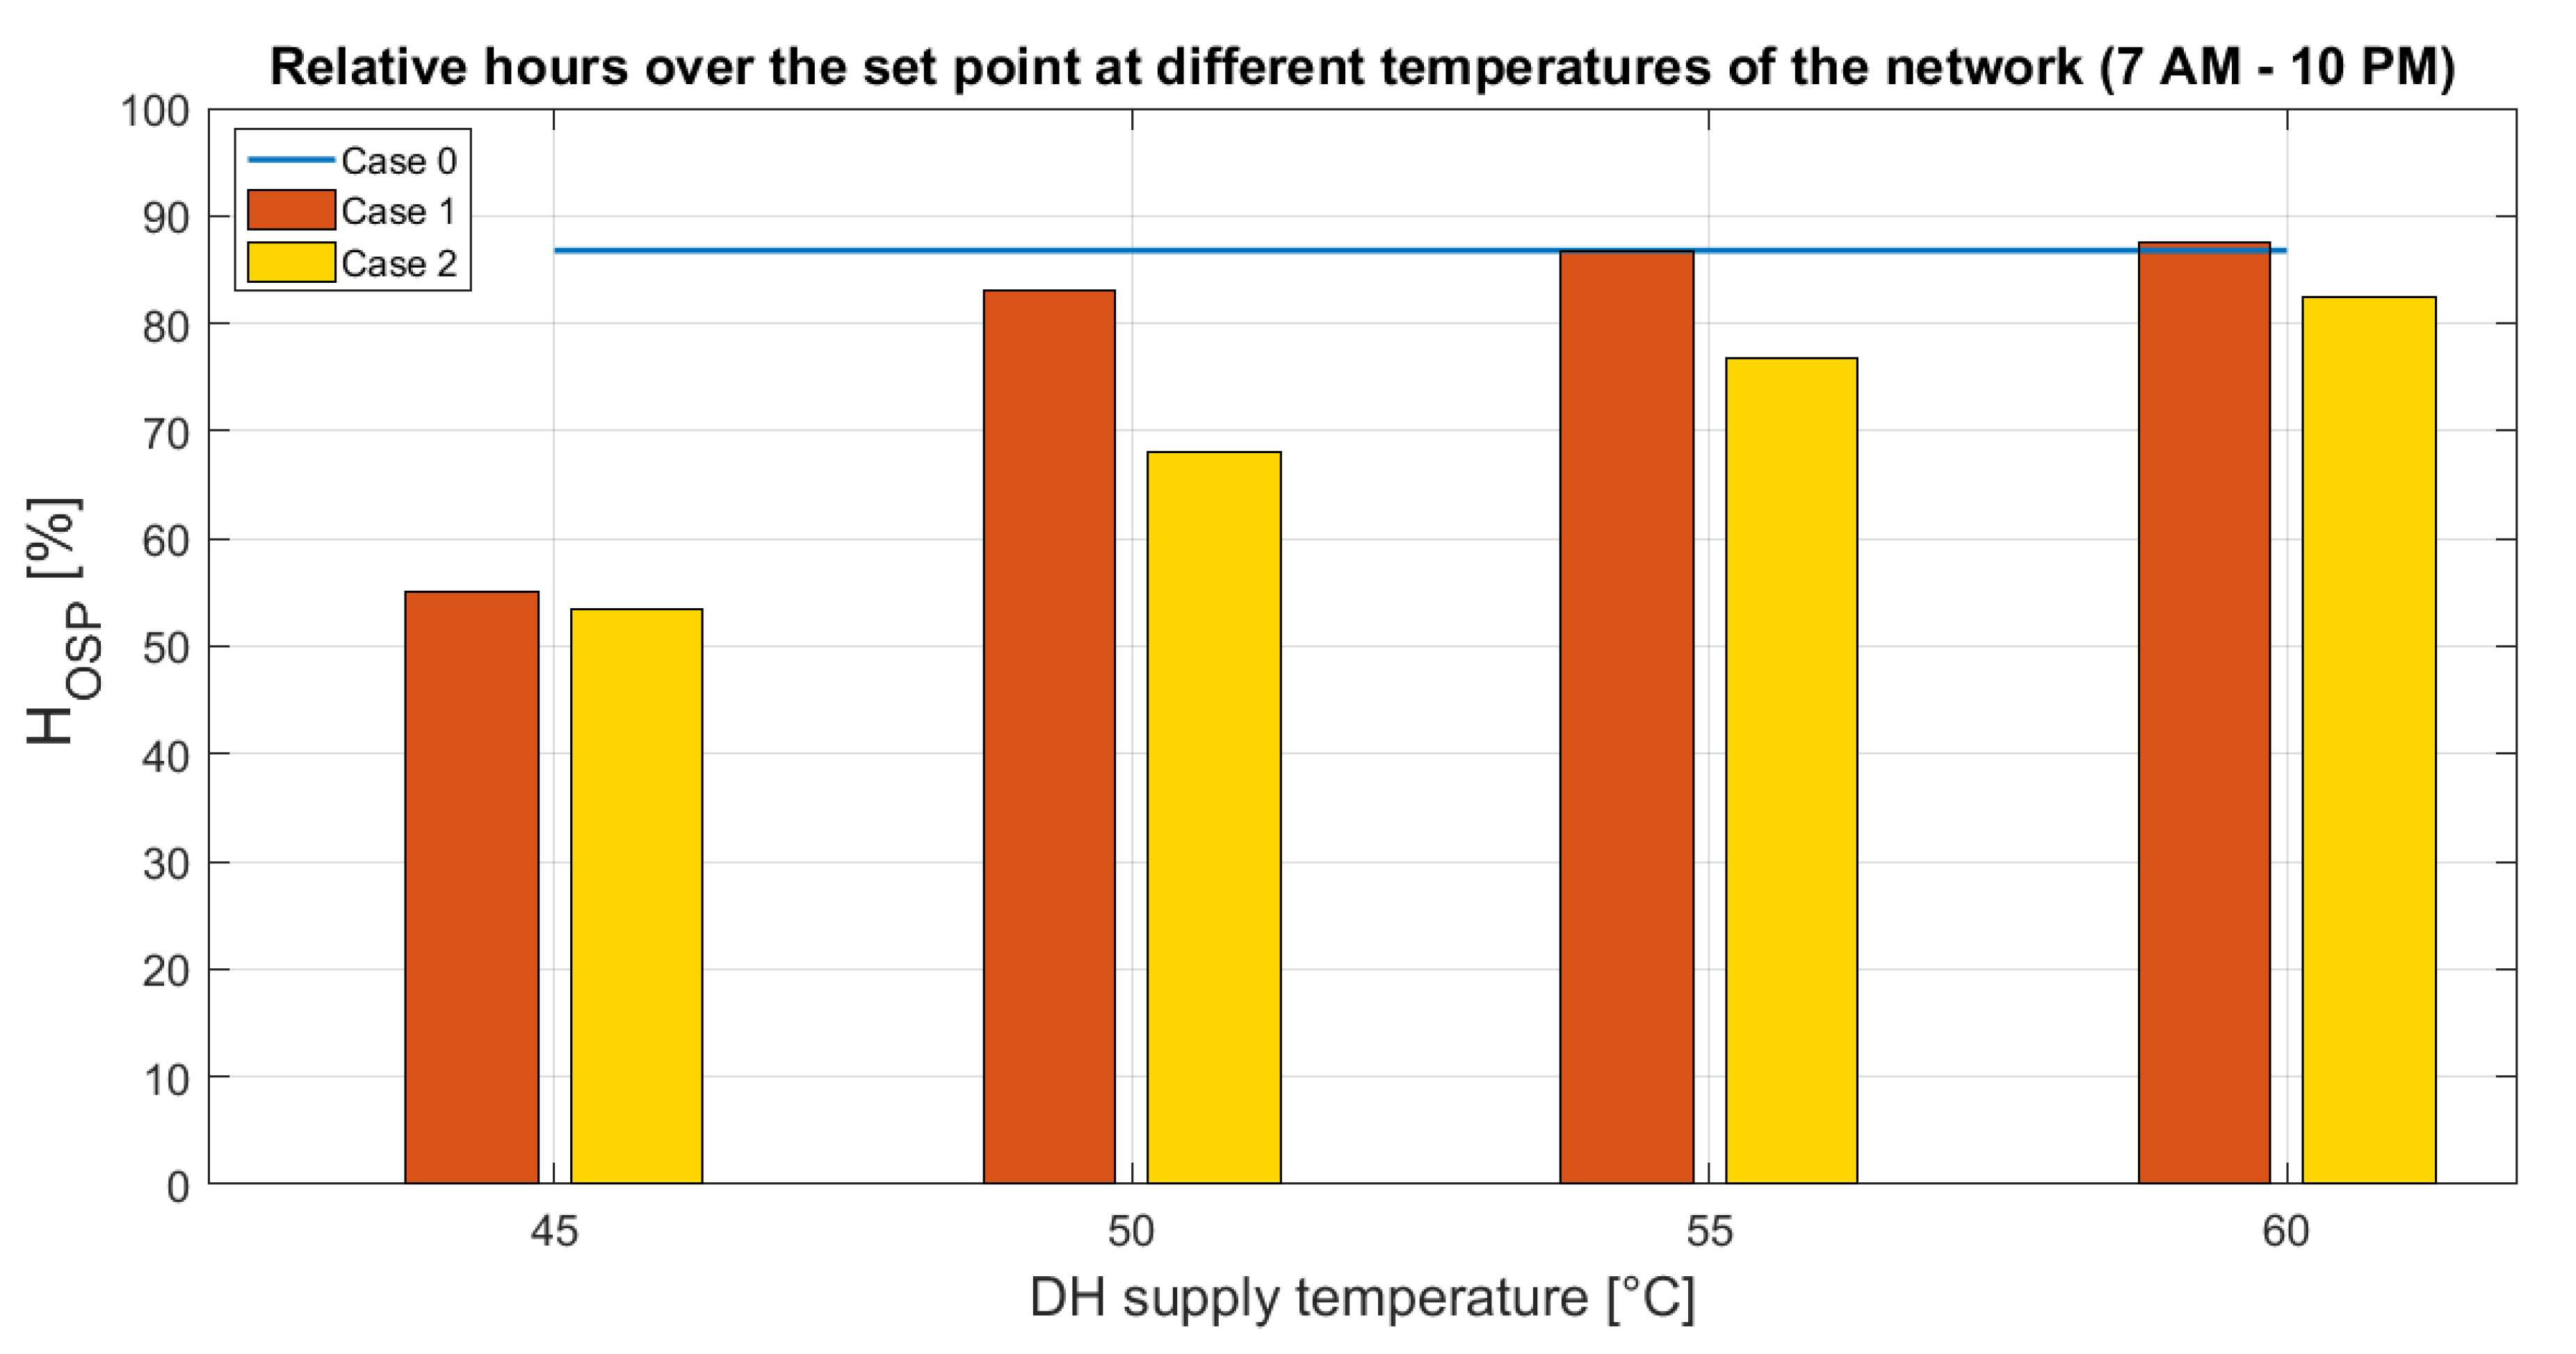
2.3.1. Sensitivity Analysis for Supply Temperature

The previous cases were simulated with boundary temperatures in the network: 90 C for Case 0 and 50 C for Case 1 and Case 2. To better understand the impact of lowering the network temperatures, a sensitivity analysis was performed by considering three additional temperature levels: 45 C, 55 C and 60 C. Moreover, to run a proper comparison, a “Comfort Factor” quantity to calculate the amount of hours in which the indoor temperature is in the comfort range from 20 C to 21 C was defined as
C F = h O S P h h e a t i n g D a y
where h O S P is the number of hours that the indoor temperature is in the comfort range and h h e a t i n g D a y is the number of hours where the heating system is on, namely between 7:00 and 22:00. It is important to notice that, even in Case 1, only the day hours were considered for the calculation, since the night operation had to be seen as an extra benefit.

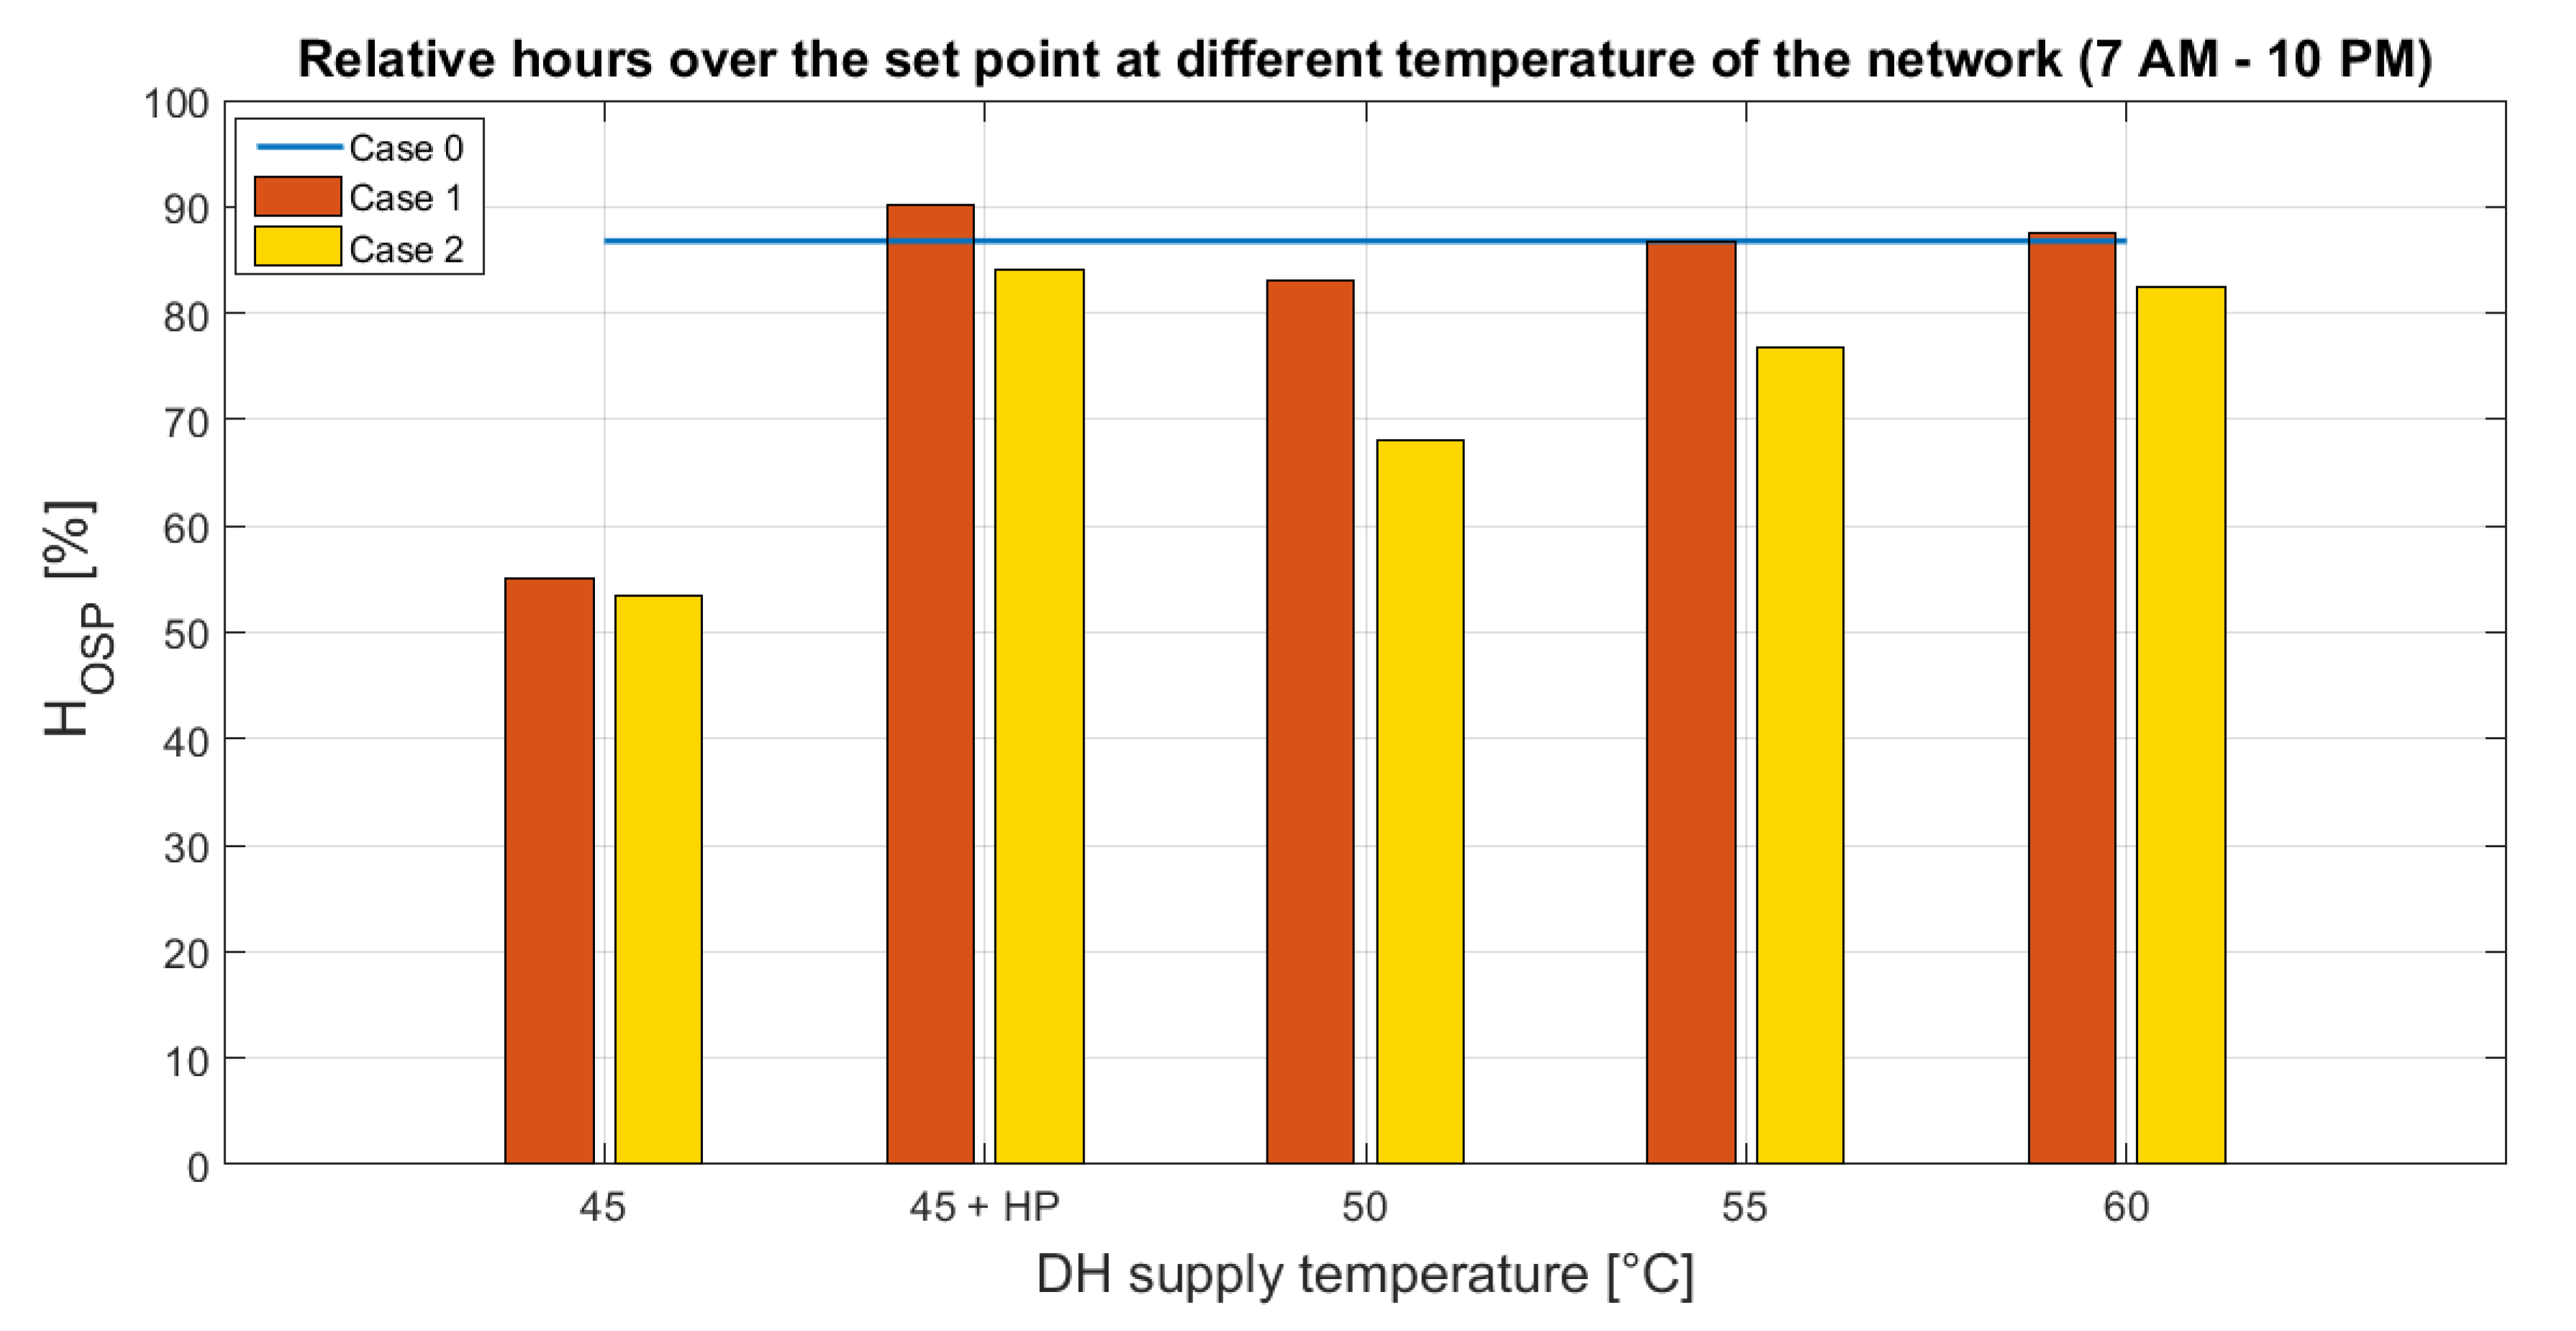
2.3.2. Distributed Heat Pumps

The idea of this additional analysis was to substitute the heat exchanger between the network and the user with a heat pump to boost the temperature for space heating only where it is needed. The rationale here is that, even if in the near future most users live in high energy performance buildings, still some cities areas, e.g., protected historical buildings, would not be able to improve their energy performances by using low temperature heat sources. HPs use district heating water at the evaporator side to heat the user’s heating system water (see Figure 3). Thanks to this configuration, it is possible to keep the network temperature at lower values, increasing the potential RES and WHR shares, and increase the temperature locally only for the users for which the temperature decrease is not a viable option.
The heat pump component, which is included into the Buildings library [16], represents a vapor compression HP that takes as main parameters the nominal mass flow rate, the nominal heat flow rate, the nominal temperature difference and the pressure drop at both evaporator and condenser sides. The condenser leaving water temperature represents a control inputs for the block and its COP is calculated as given by the following equations:
C O P = η c a n o t , 0 C O P c a r n o t η P L
C O P c a n o t = T c o n d e n s e r T c o n d e n s e r T e v a p o r a t o r
η p l = a 1 + a 2 y P L + a 3 y P L 2 +
where η c a n o t , 0 is the Carnot Effectiveness, C O P c a r n o t is the Carnot efficiency, η P L is a polynomial expression to take into account partial load operation and y P L is the partial load ratio. The Carnot Effectiveness coefficient can be set manually or it can be calculated as
η c a n o t , 0 = C O P 0 C O P c a r n o t , 0
where C O P 0 is the efficiency value in nominal conditions and C O P c a r n o t , 0 is the Carnot efficiency in nominal conditions. Since no accurate data were available, η c a r n o t , 0 was set equal to 0.4 and η P L equal to 1. Consequently, the COP was calculated as
C O P = η c a n o t , 0 C O P c a r n o t
In this scenario, the district heating heat exchanger was replaced by a heat pump with a condenser outlet temperature at 60 C. The control logic of user is the same as in the previous cases.
Since the use of distributed heat pumps involves a significant electricity consumption, a proper comparison with the previous cases should be performed by considering the primary energy consumption, since heat and electricity cannot be simply summed up. In this comparison, the crucial aspect becomes the RES share in the power grid, which can vary from country to country but also shows a significant variability over time [22]. In this work, reference Primary Energy Factors for Italy was considered: 1.05 for natural gas and 2.42 for electricity. The DH heat was considered as produced by a natural gas boiler with a 90% efficiency (conservative approach).

3. Results

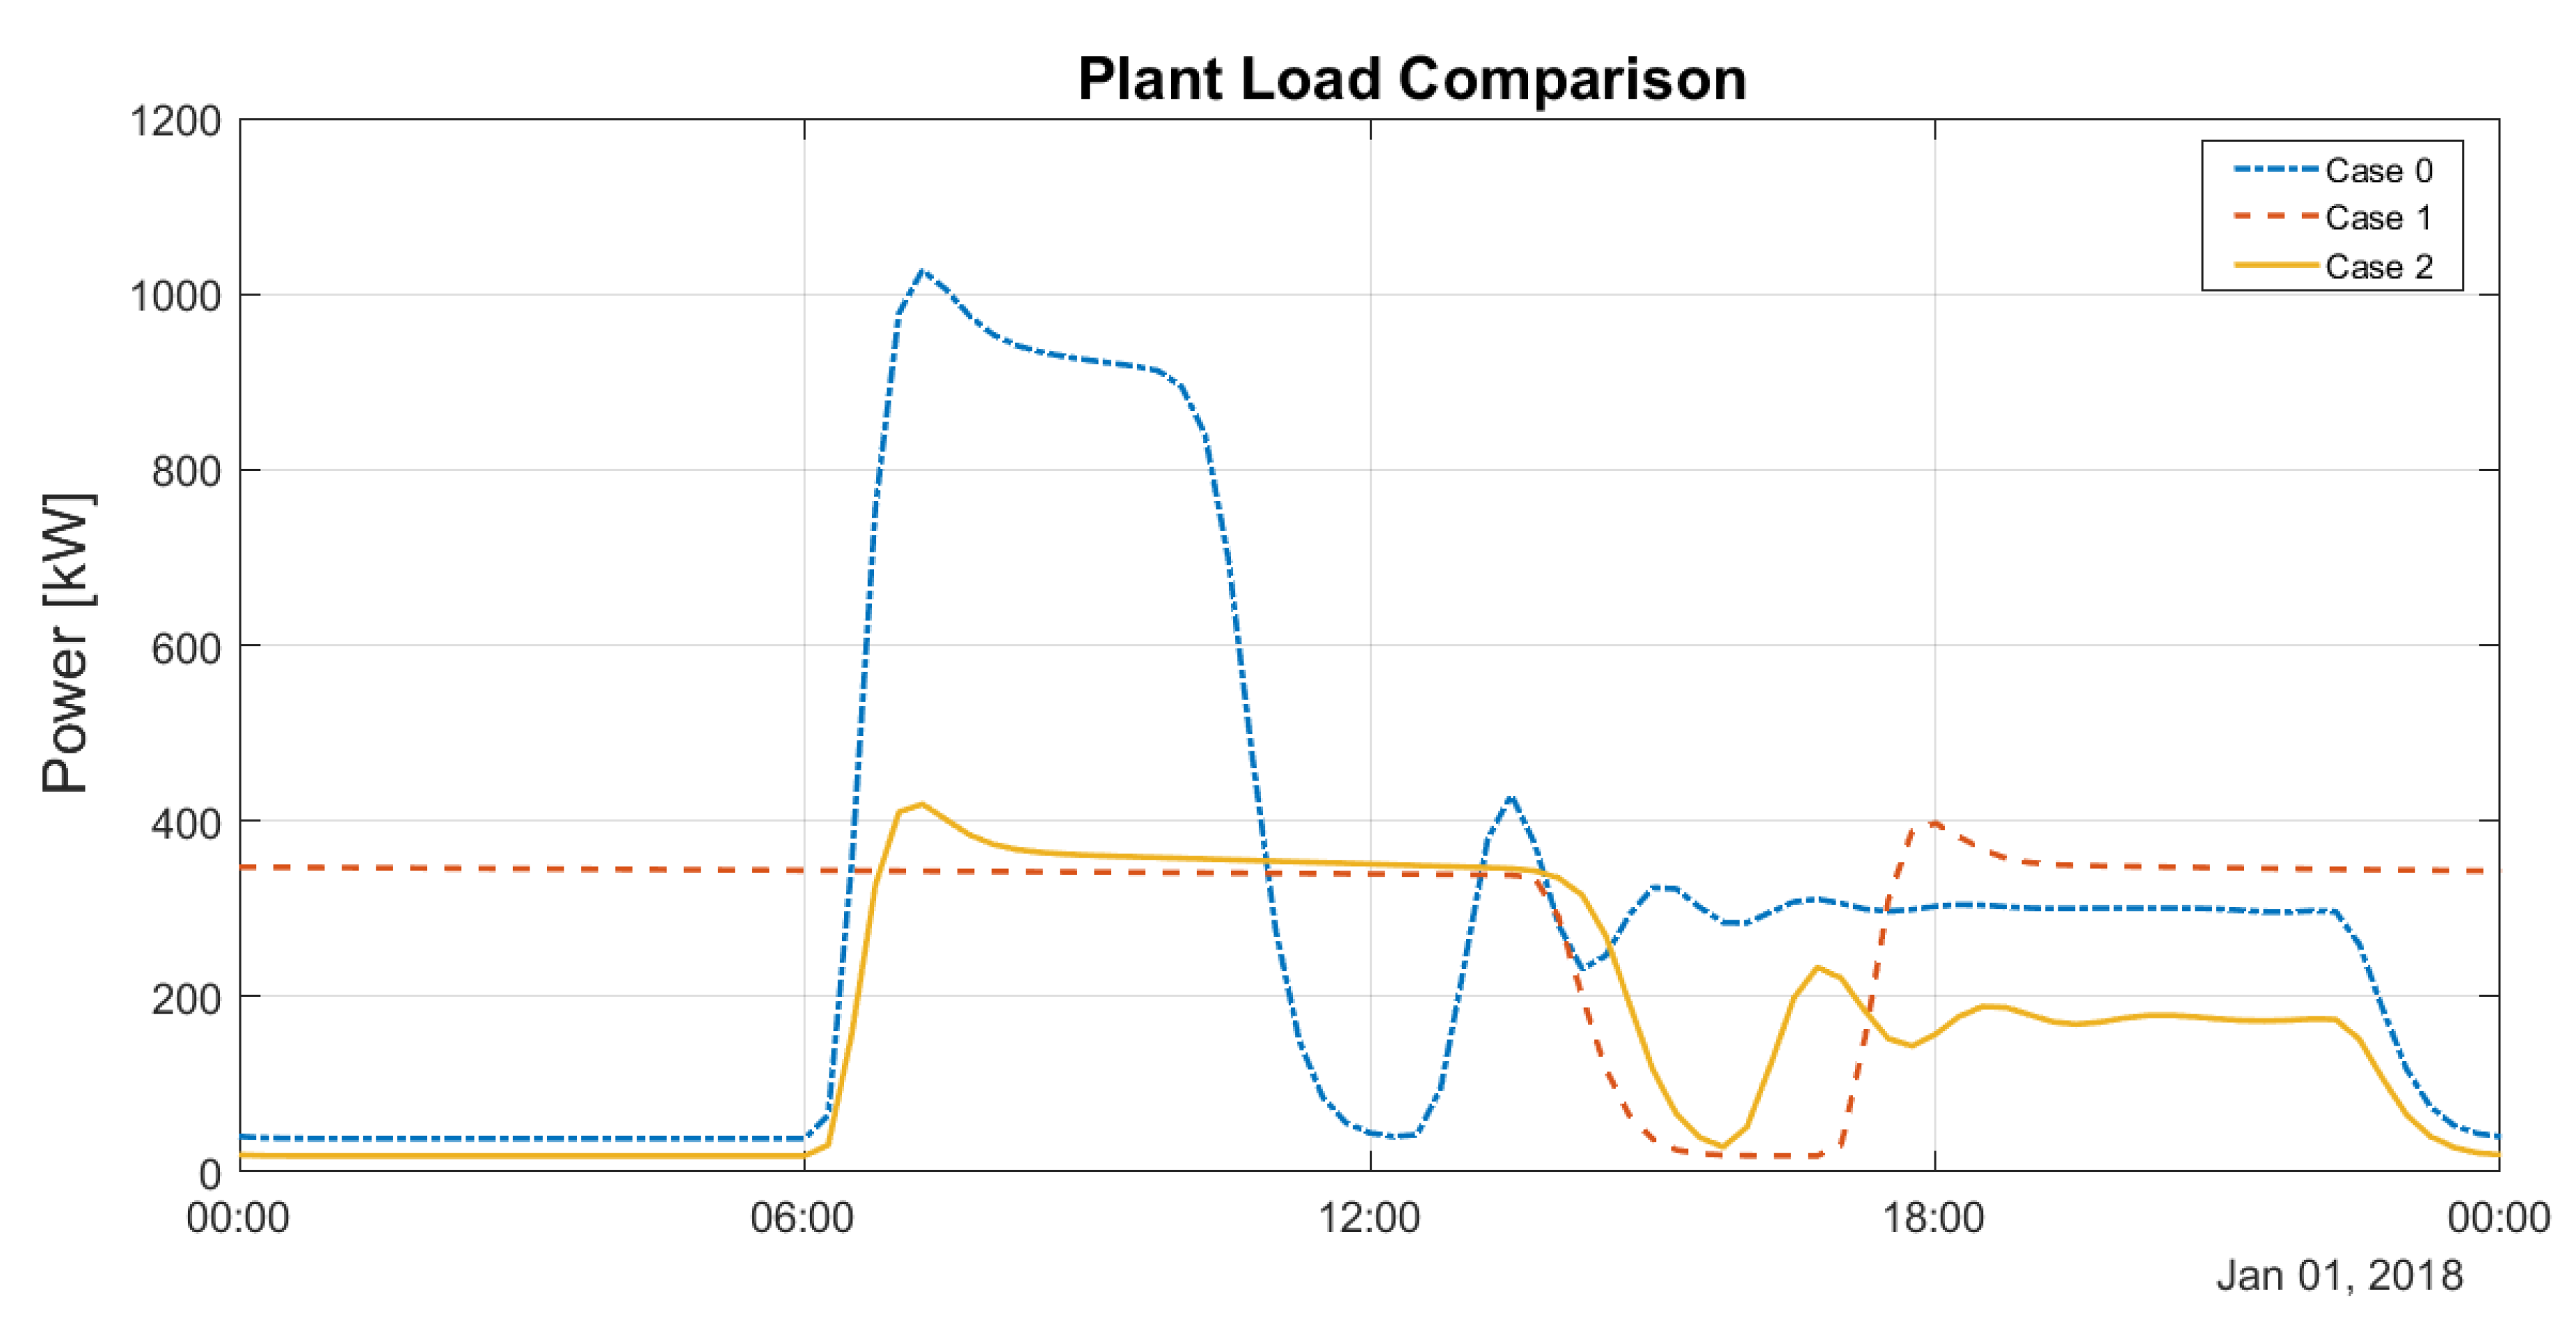
3.1. Simulation Results

Figure 4 shows the heat and temperature loads resulting from the model simulation for Case 0. The DH load profile is consistent with multiple examples of daily loads in many DH systems [23,24,25]. This aspect ensures a first qualitative validation of the proposed model, in the absence of reliable operation data of the case study under analysis. In particular, the reader can observe a morning peak (1 MW) that is 2–3 times higher than the stationary load in the afternoon (around 400 kW). This is a very well know problem that forces the heat providers to oversize thermal plants or to provide the network with large volumes of heat storage. The network temperature in the morning, where there is the highest energy request, has a temperature drop that is more or less equal to the design value of 15 C (see bottom plot). During the rest of the day, the temperature drop is smaller due to the fact that the heating system’s pump decreased the mass flow rate and so also the energy exchange rate with the grid drops.
Figure 5 and Figure 6 compare the heat demand and temperature profiles of the three cases for a given day (1 January). The major difference is related with the morning peak, while some minor variances can be noticed throughout the day. Both Cases 1 and 2 allow significantly reducing the morning peak, approximately from 1 MW to 350–400 kW. This goal can therefore be reached with both approaches, although, without building insulation, the building needs to be heated also during the night. In particular, the controller lowers the room temperature in the afternoon in the alternative scenarios leading to a sharp decrease in heating demand. The deep drop is due to the fact that all the simulated users have been set with the same behavior. This is not compliant with the real world where multiple users have generally different behaviors. It is reasonable to think that, in such a situation, load and temperature profiles would be more stable, with small fluctuations around the rated power. This is a limit for the current simulator, but in future developments this model can be corrected by considering real data for different buildings.
While, to ease the discussion, the previous figures were limited to a single day simulation, Table 1 summarizes the performance of the system for the entire year. With respect to the reference case, Case 1 (continuous operation) leads to a slightly higher energy demand by the user, which is however compensated by lower network losses (due to the lower operation temperatures), thus resulting in a lower heat generation from the entire DH system. On the other hand, in Case 2, the user shows a substantial decrease of energy consumption due to the insulation, and the network losses are comparable to Case 1 (but obviously with a higher relative share).
The analysis thus far focused on comparing the three different cases from the DH operation point of view. However, to draw a fair comparison and gain more insight about the different configurations, the users’s comfort has to be taken into account and discussed with a sensitivity analysis as done in the following sections.

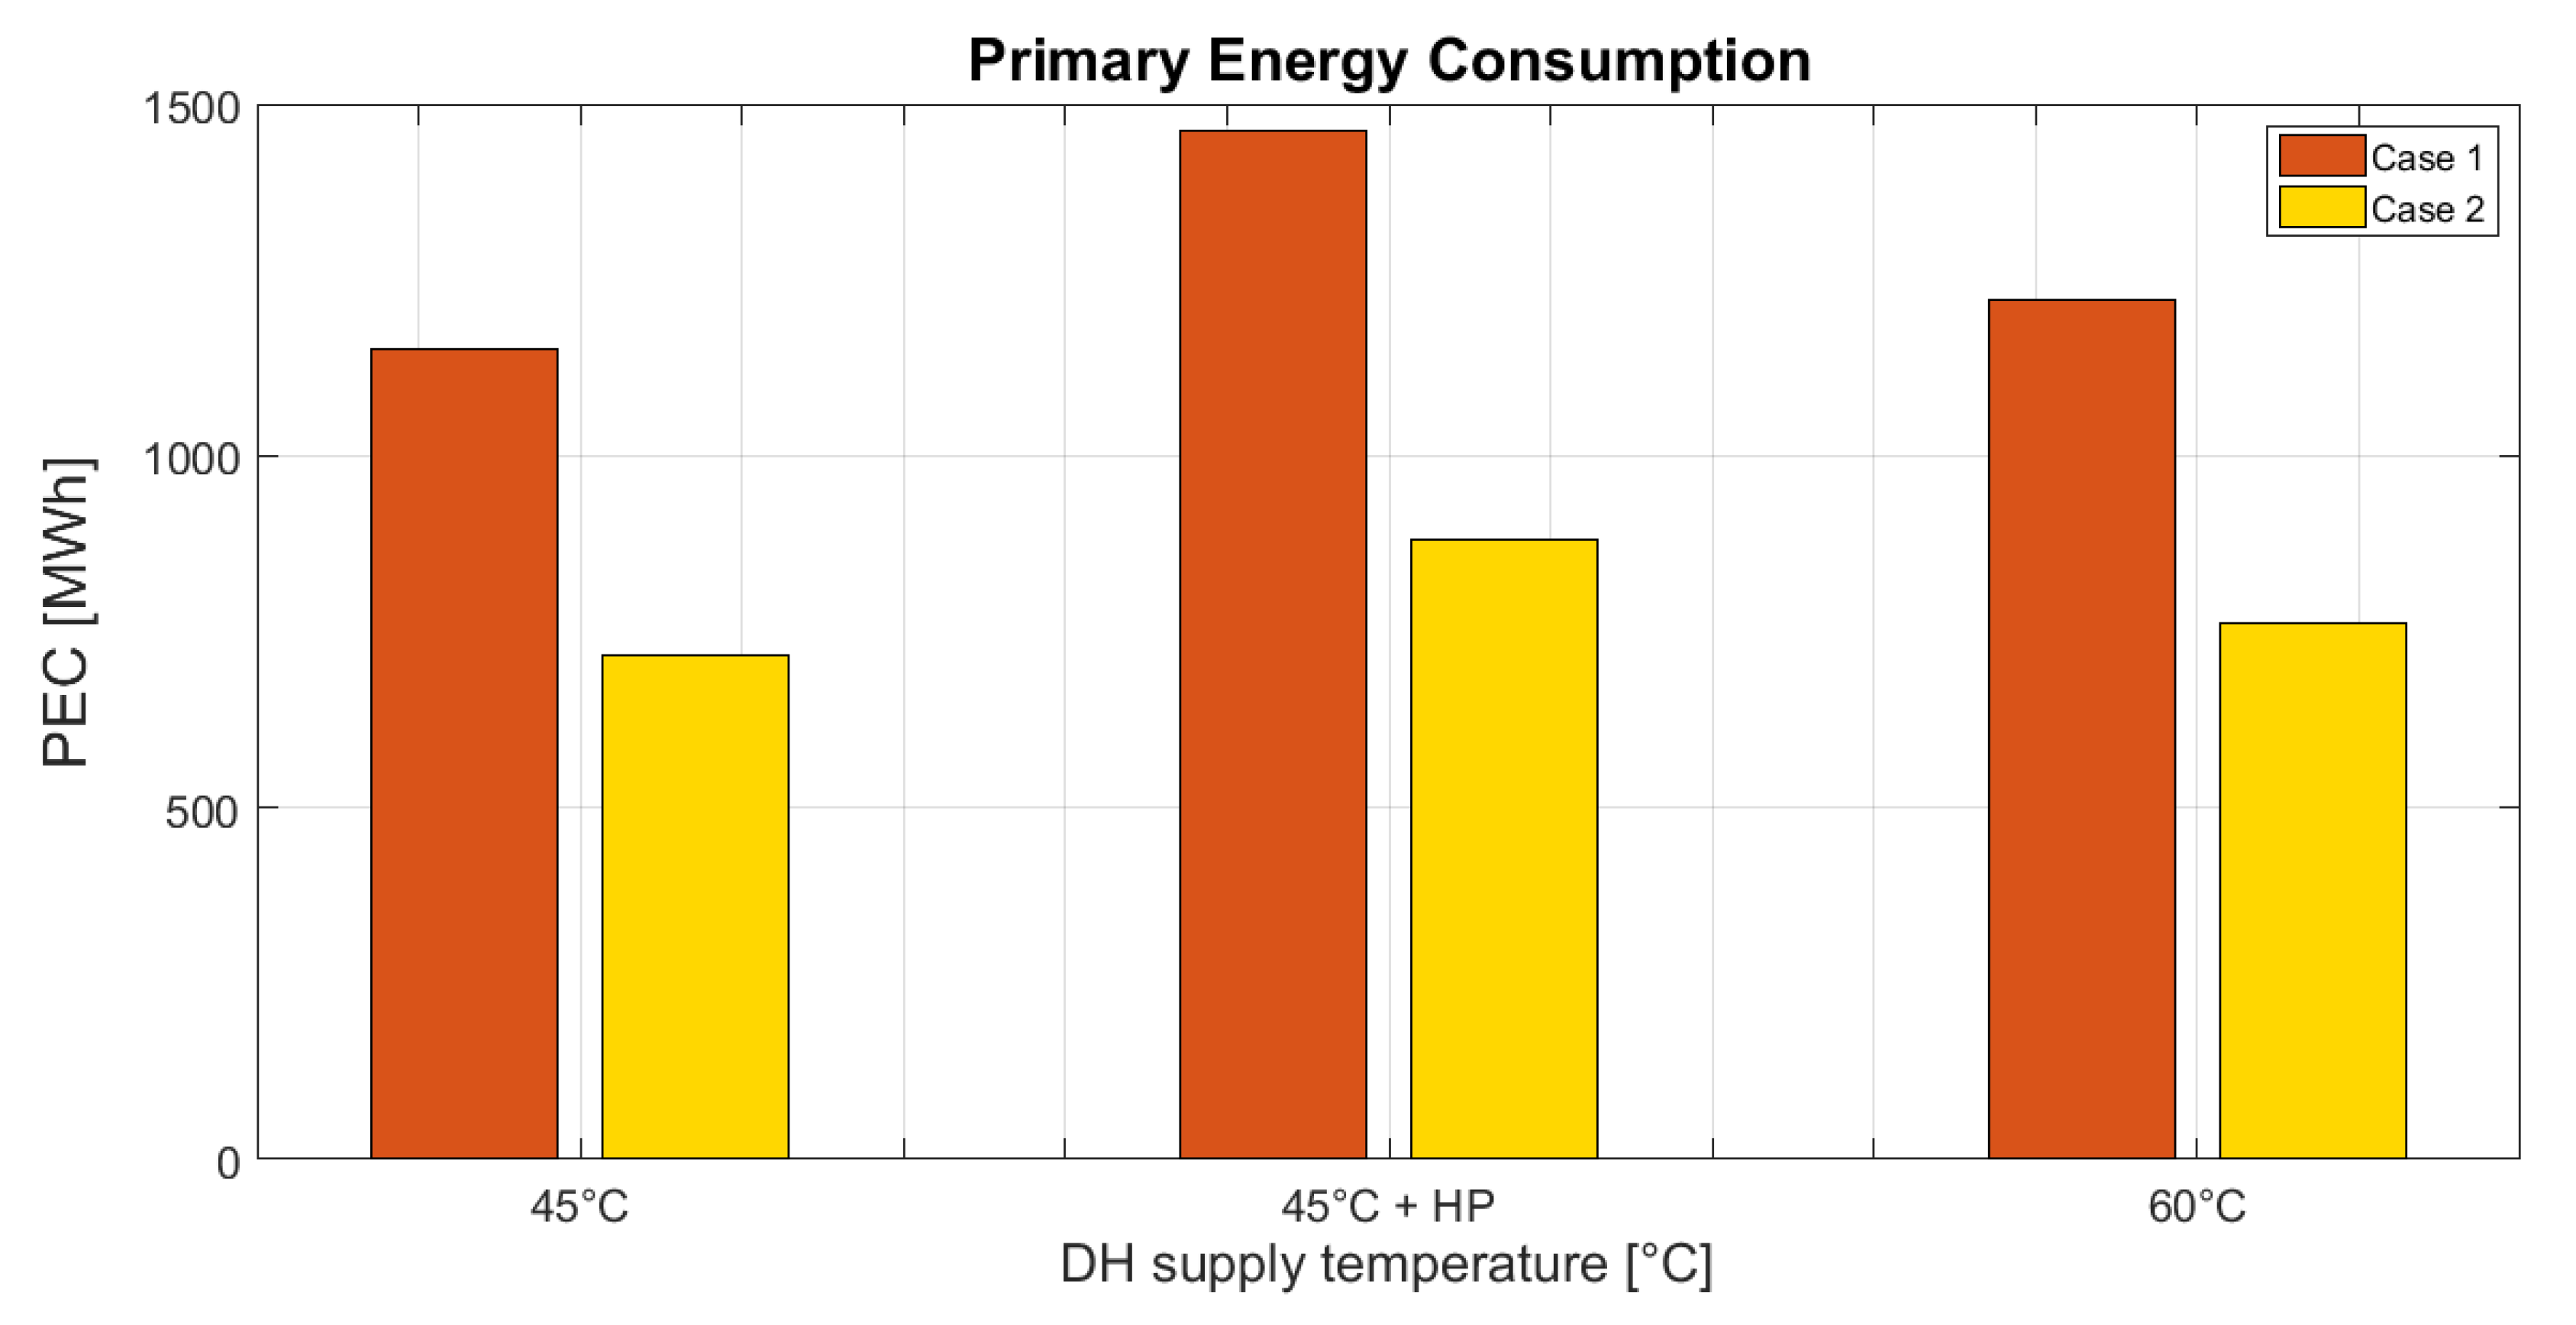
3.2. Effect of the Supply Temperature

The sensitivity analysis on the effect of having different water supply temperatures is performed by considering as performance indicator ( h O S P ) the share of hours in which the room temperature is equal to or higher than the set point (in the time frame 7:00–22:00, which is usually the time range in which heating systems are activated in Italy). The results are summarized in Figure 7, where Cases 1 and 2 were simulated for different supply temperatures and compared against Case 0.
The sensitivity analysis showed some interesting aspects. Firstly, it is important to notice that, in comparison with the other scenarios, not even Case 0 can guarantee a comfort factor of 100%, mainly due to the temperature transient in the morning towards the set point of 20 C. Keeping in mind this aspect, Case 1 ensures an acceptable performance for a DH supply temperature as low as 50 C, while a further decrease to 45 C involves a drop of the Comfort Factor. The numerical analysis therefore suggest that such a low temperature requires some further actions in order to meet a reasonable comfort level, such as the installation of radiators with higher surface or the insulation of the building.
On the other hand, Case 2 appears to have a lower performance across all the analyzed temperatures, and for this reason cannot be considered a proper alternative to Case 0, even at medium temperatures of 55 C or 60 C. In this case, possible solutions can be found in a continuous operation similar to Case 1, or in the increase of radiators surface. Alternatively, to compensate for the network temperature decrease, distributed “booster” Heat Pumps can be exploited, as proposed in Section 2.3.2 and analyzed hereafter.

3.3. Alternative Layout: Distributed Heat Pumps

In this last simulation, the solution of distributed HPs was evaluated as an integrative solution for Case 2 and, more generally, as a viable option in networks that could be operated at low temperature but with specific users who require a high-temperature heat supply.
Figure 8 clearly illustrates the the HPs integration enables the network to operate at 45 C and achieve an acceptable comfort for the users (Case 1 even outperforms Case 0). However, the HPs operation requires a significant power consumption, which cannot be ignored in a systemic analysis.
The comparison of primary energy consumption in different cases is reported in Figure 9. With the assumptions made in this work, the HPs have a larger impact than other solutions in terms of total primary energy consumption, although further considerations may be done on the distinction between fossil primary energy and renewable primary energy. Since the primary energy consumption variation is quite low, it is expected that different assumptions might lead to opposite results.
For the sake of clarity, it is important to highlight that the focus of this work was on the energy analysis, and costs were not taken into account. From the economic point of view, a heat exchanger is much cheaper than a heat pump, both for investment costs and for maintenance. Moreover, in some countries, high electricity tariffs may hinder the use of HPs for space heating. On the contrary, this solution could be suitable for small areas in the city where energy efficiency actions are not possible for various reasons (e.g., historical buildings).

4. Discussion

The results of this study highlight the potential of optimizing the current heat generation logics in high-temperature DH systems. In particular, a common issue lays in the morning peak demand needed to heat up the buildings that have been cooled during the night, due to the shut down of the heat generation system. A continuous operation of the existing heating system could support a decrease of the network supply temperature, as the buildings would require a much lower heat rate that could be matched with existing radiators operating at a lower temperature.
The slight increase of energy demand of the users would be highly compensated by a reduction of the network losses, thanks to a lower average network temperature. This aspect should however be carefully evaluated when defining heat tariffs, as without proper actions this new operation strategy would increase the bills of the final users and lower the costs for the DH network operator. Proper regulation rules are required to support this transition by sharing the potential benefits among the final users and the DH system operators.
The refurbishment of buildings can lead to significant energy savings, but it not necessarily guarantee a shift towards a low-temperature DH operation. A critical parameter would be the amount of energy savings that are obtained, as without changing the existing radiators their heat supply is strictly related to their operation temperature. In this perspective, a buildings insulation strategy should be tailored on the features of the existing heating systems, unless a total substitution is included in the refurbishment intervention.
The analysis of the HPs behavior leads to a more complex model, as multiple parameters have an impact on their operation and different indicators can be chosen to evaluate their contribution. In particular, the shift towards low-temperature DH networks coupled to booster HPs is a promising solution where the integration of RES is of primary interest. On the other hand, if the DH generation plant remains fossil-based (considering a simple natural gas boiler), with the current Italian electricity mix, HPs do not lead to a decrease of the total primary energy consumption of the system. As already discussed, total primary energy consumption is just one of the possible indicators for evaluating the energy and environmental performance of a given technology: further research activities can underline the main parameters affecting these results.

Policy Indications

While this paper has been mostly focused on technical and operational aspects, energy policies are at the basis of the development of low-temperature DH systems. In particular, a well-designed policy support could foster a temperature decrease in existing systems, often without the need of economic-intensive actions.
DH systems are an effective and reliable solution for the heat supply in urban contexts, with a significant potential of integrating RES in heating and cooling. However, in many countries, there is a lack of specific regulations and targets to support this important transition, which involves the decrease of temperatures in existing networks. In some cases, DH systems would be compatible with low-temperature operation [10], but there is no interest for DH operators to reach lower temperatures and integrate RES with generally high investment costs.
However, some business models are already demonstrating that solar energy and centralized heat pumps for waste heat recovery are competitive solutions for RES integration in existing systems, although with generally higher payback times than usual industry applications. Specific targets set by regulators, with dedicated incentives, could support a wider diffusion of these technologies in countries that are showing a high unexploited potential.

5. Conclusions and Future Work

This work has presented a comparison of alternative strategies to decrease district heating network temperatures with the aim of improving the efficiency of DH systems and increase the potential RES integration. The main conclusions of this research work are the following:
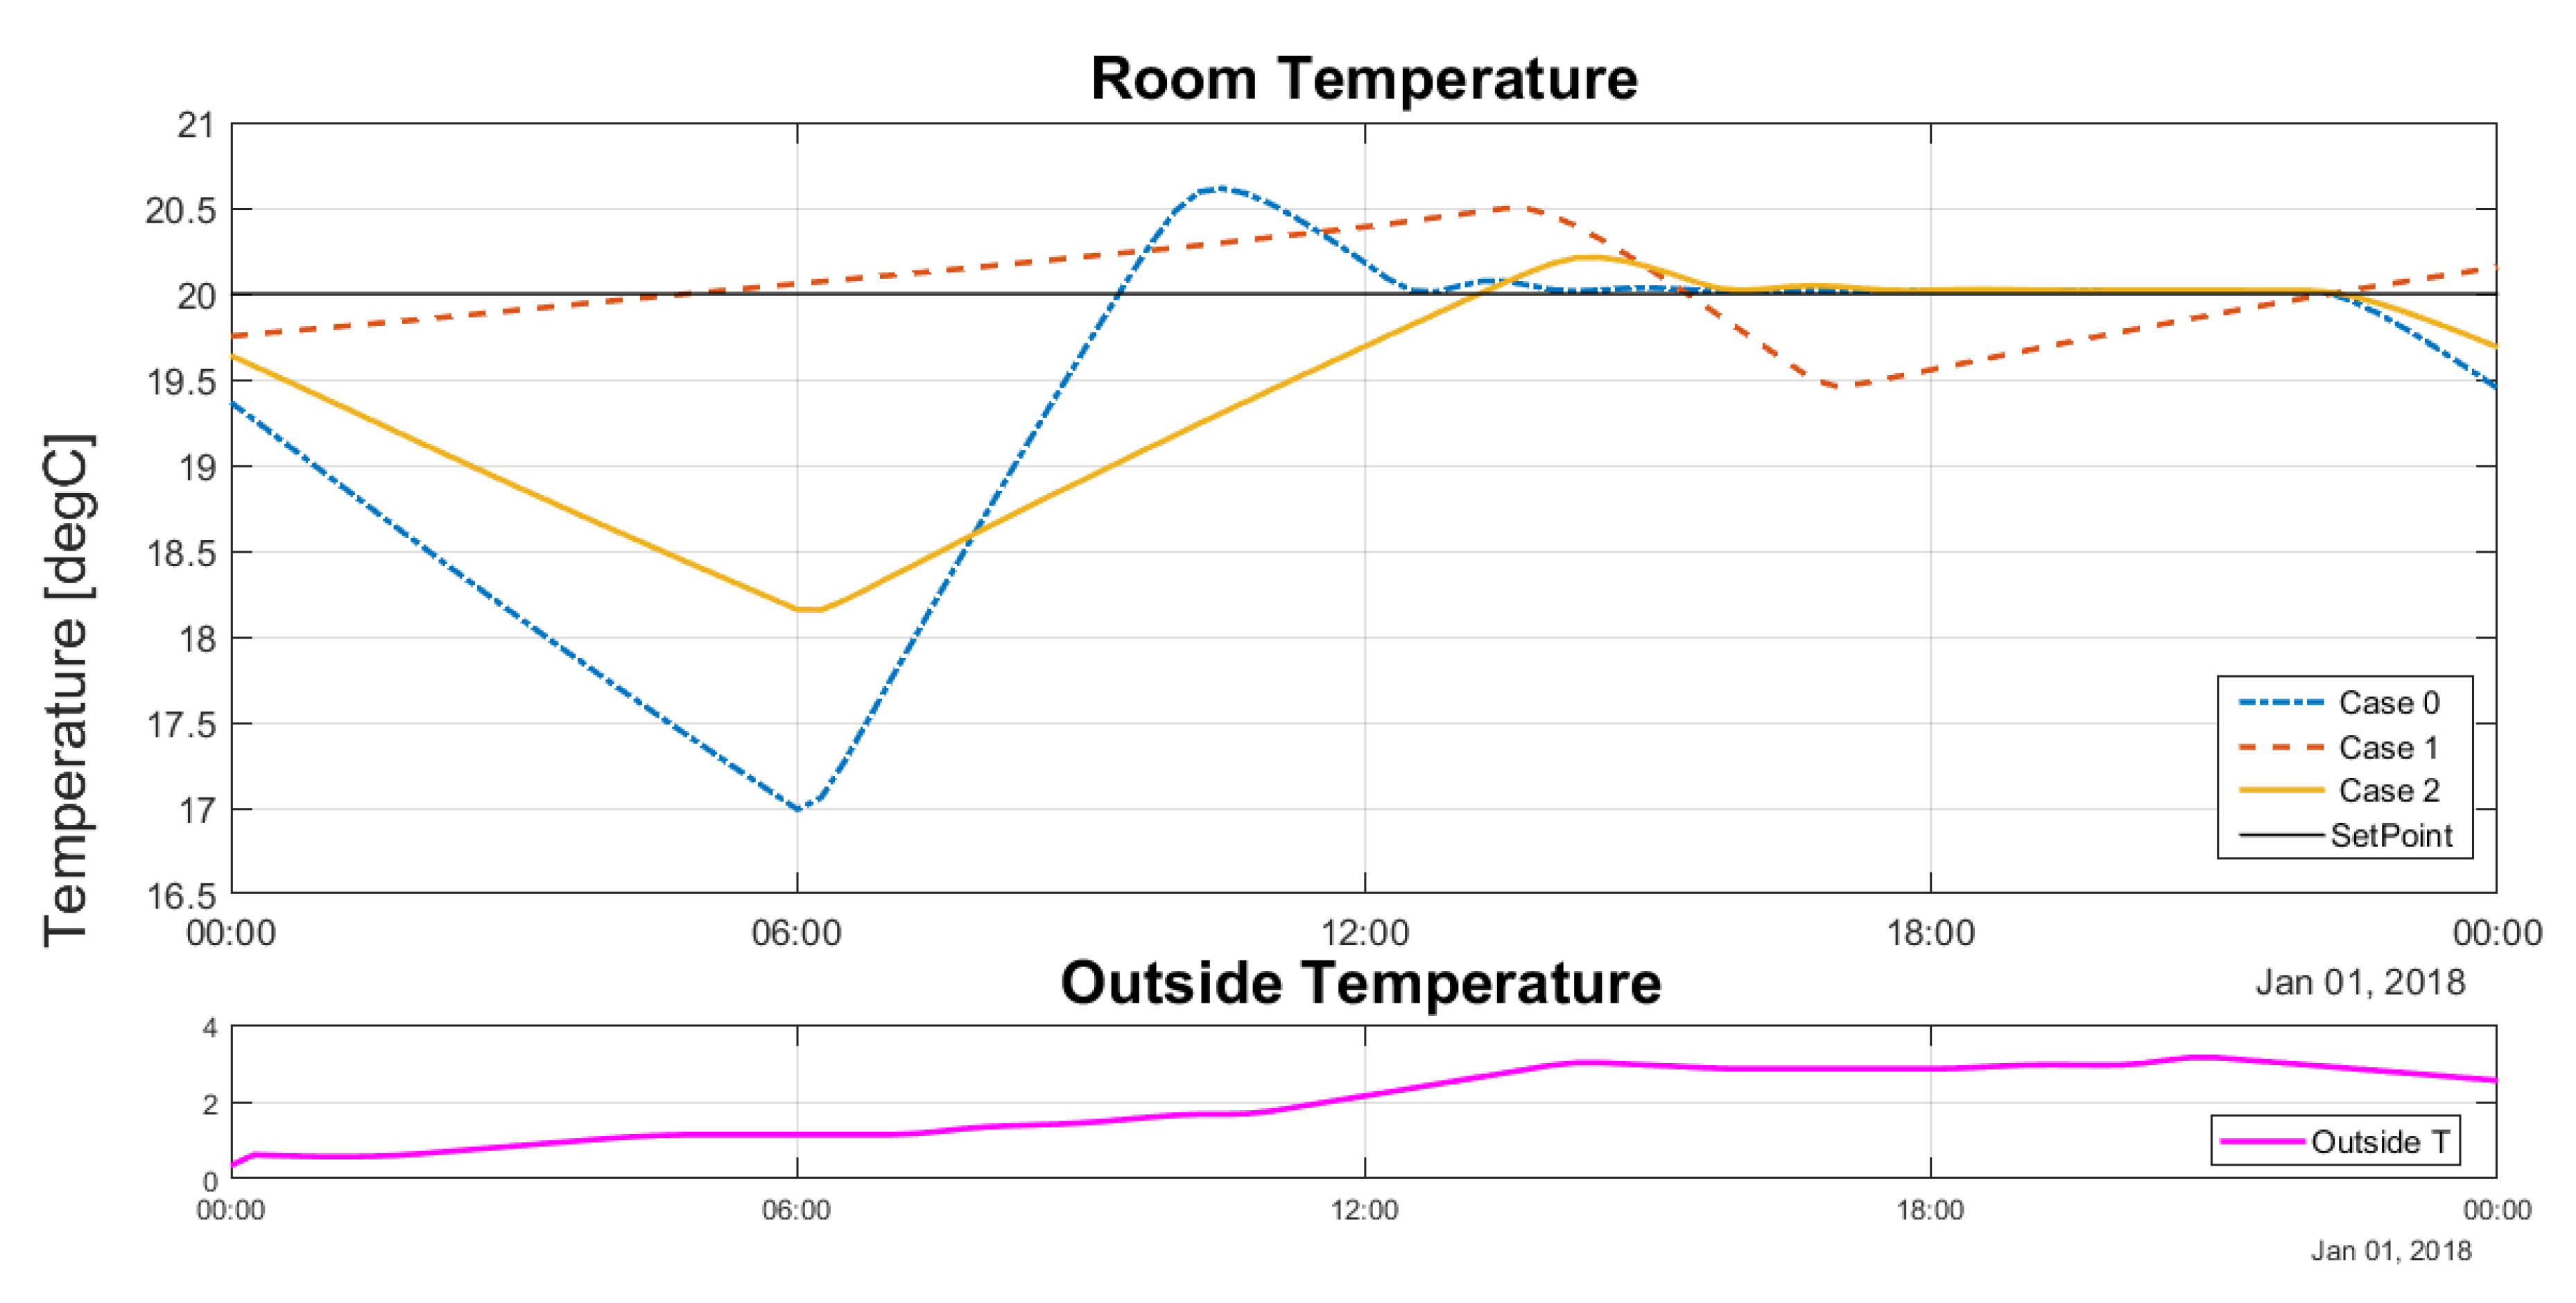
  • A continuous operation of the buildings’ heating systems (Case 1) allows decreasing the network temperature without compromising the comfort until 50–60 C, even without any action on building insulation or heating system configuration. Such a management logic is able to provide comfort levels that are comparable to traditional high-temperature operation of the network. However, temperatures below 50 C do not guarantee an acceptable comfort level. On the other hand, the users energy consumption increases due to the continuous operation of the heating system by 3.5% with respect to the reference case, although the network losses are decreased.
  • The results from Case 2 (buildings’ insulation) confirm the great benefits of energy efficiency interventions in buildings. The energy consumption is much lower with respect to the other cases, the fluctuations of the indoor temperature are smaller, and day and night operation could be used instead of continuous operation. However, unlike the previous case, the network temperature must be at least 60 C to guarantee an acceptable comfort level under the hypotheses of this study. The cause is the lower temperature difference between the heating system’s water and the indoor temperature, which makes the morning transient longer with respect to the reference case.
  • The combination of heat pumps and district heating systems seems to have a noteworthy potential, although some parameters are critical for their success. In fact, booster HPs can lower the energy demand from the DH network (and the supply temperature as well) but at the expense of a non-negligible local electricity consumption. Their environmental benefit is therefore strictly dependent on the source of these electricity, with reference to its renewable share and C O 2 emission factor. HPs are very efficient devices, if well designed, but they are more expensive and fragile than simple heat exchangers. Nevertheless, the simulation highlights the potential advantages of this combination that have to be evaluated through a detailed business and management plan.
These findings highlight that, from the technical point of view, alternative strategies exist for the evolution of current DH systems to low-temperature DH systems. Moreover, in some cases, a simple modification of the heat supply schedule could allow reducing the network temperatures without the need for further actions. Distributed heat pumps used as temperature boosters can be a technical solution for specific users who do not accept a decrease of their temperature supply.

Future Developments

This work can be the basis for the future development of a more detailed model of both user and DH systems. Design data were used to characterize the different components but, most of them, accept real data as input. This features could be interesting, for example, for a comparison between large HPs on the return line of the DH plant or small distributed HPs near the users (as considered in this work). Real COP data, pump consumption curves and thermal load data can be used to further develop this model by considering different real case studies. Moreover, the present study used average building features obtained from real cases, but without a detailed modeling of each building. As a result, some approximations were made due to some missing information. A specific building simulation model would be needed to increase the reliability of the results, which in turn leads to a more complicated model with higher computational resources. In addition, future work will include detailed piping of the network and increasing size of the DH system to demonstrate DH network balance for both temperature and flow.
Moreover, the possibilities to simulate multi physics systems can be useful to address pro and cons for high penetration of electrical and thermal grids. Thanks to the “encapsulation of knowledge” property, it is possible to develop and validate single-physics systems (PV plants, wind plants, buildings, etc.) and to combine the different blocks together to study the interactions between components and to find the optimum scheme to increase energy efficiency and RES utilization.

Author Contributions

Conceptualization, M.N. and F.N.; methodology, F.N., G.M. and M.N.; simulation, F.N. and G.M.; writing—original draft preparation, F.N. and M.N.; writing—review and editing, G.M., M.N. and S.R.; supervision, M.N. and S.R.; and project administration, S.R.

Funding

The authors gracefully acknowledge financial support by the European Commission project E2DISTRICT under grant number 696009.

Conflicts of Interest

The authors declare no conflict of interest.

Abbreviations

The following abbreviations are used in this manuscript:
CHPCombined Heat and Power
COPCoefficient Of Performance
DHDistrict Heating
HPHeat Pump
PECPrimary Energy Consumption
PIProportional Integral
RESRenewable Energy Sources
TMYTypical Meteorological Year
WHRWaste Heat Recovery
Aarea (m 2 )
CFcomfort factor (-)
COPCoefficient Of Performance (-)
ddiameter (m)
f c o r r empirical correction factor (-)
f r fraction of radiant heat (-)
h O S P comfort factor (-)
m ˙ mass flow rate (kg/s)
Δ P pressure difference (Pa)
Q ˙ thermal power (W)
Ttemperature (K)
Utransmittance (W/(m 2 K))
Vvolume (m 3 )
V ˙ volume flow rate (m 3 / s )
vvelocity (m/s)
Wpower (W)
ρ density (kg/m 3 )
η efficiency (-)

References

  1. Lund, H.; Werner, S.; Wiltshire, R.; Svendsen, S.; Thorsen, J.E.; Hvelplund, F.; Mathiesen, B.V. 4th Generation District Heating (4GDH): Integrating smart thermal grids into future sustainable energy systems. Energy 2014, 68, 1–11. [Google Scholar] [CrossRef]
  2. Reiter, P.; Poier, H.; Holter, C. BIG Solar Graz: Solar District Heating in Graz—500,000 m2 for 20% Solar Fraction. Energy Procedia 2016, 91, 578–584. [Google Scholar] [CrossRef]
  3. Wahlroos, M.; Pärssinen, M.; Manner, J.; Syri, S. Utilizing data center waste heat in district heating—Impacts on energy efficiency and prospects for low-temperature district heating networks. Energy 2017, 140, 1228–1238. [Google Scholar] [CrossRef]
  4. Helin, K.; Zakeri, B.; Syri, S. Is District Heating Combined Heat and Power at Risk in the Nordic Area?—An Electricity Market Perspective. Energies 2018, 11, 1256. [Google Scholar] [CrossRef]
  5. Schmidt, D.; Kallert, A.; Blesl, M.; Svendsen, S.; Li, H.; Nord, N.; Sipilä, K. Low Temperature District Heating for Future Energy Systems. Energy Procedia 2017, 116, 26–38. [Google Scholar] [CrossRef] [Green Version]
  6. Yang, X.; Svendsen, S. Ultra-low temperature district heating system with central heat pump and local boosters for low-heat-density area: Analyses on a real case in Denmark. Energy 2018, 159, 243–251. [Google Scholar] [CrossRef]
  7. Vetterli, N.; Sulzer, M.; Menti, U.P. Energy monitoring of a low temperature heating and cooling district network. Energy Procedia 2017, 122, 62–67. [Google Scholar] [CrossRef]
  8. Nord, N.; Løve Nielsen, E.K.; Kauko, H.; Tereshchenko, T. Challenges and potentials for low-temperature district heating implementation in Norway. Energy 2018, 151, 889–902. [Google Scholar] [CrossRef]
  9. Nielsen, S.; Grundahl, L. District Heating Expansion Potential with Low-Temperature and End-Use Heat Savings. Energies 2018, 11, 277. [Google Scholar] [CrossRef]
  10. Østergaard, D.S.; Svendsen, S. Experience from a practical test of low-temperature district heating for space heating in five Danish single-family houses from the 1930s. Energy 2018, 159, 569–578. [Google Scholar] [CrossRef]
  11. Schweiger, G.; Larsson, P.O.; Magnusson, F.; Lauenburg, P.; Velut, S. District heating and cooling systems—Framework for Modelica-based simulation and dynamic optimization. Energy 2017, 137, 566–578. [Google Scholar] [CrossRef]
  12. Ogunsola, O.T.; Song, L.; Wang, G. Development and validation of a time-series model for real-time thermal load estimation. Energy Build. 2014, 76, 440–449. [Google Scholar] [CrossRef]
  13. Idowu, S.; Saguna, S.; Åhlund, C.; Schelén, O. Applied machine learning: Forecasting heat load in district heating system. Energy Build. 2016, 133, 478–488. [Google Scholar] [CrossRef]
  14. DassaultSystem. Dymola. Available online: https://www.3ds.com/products-services/catia/products/dymola/ (accessed on 1 September 2018).
  15. IEA. New Generation Computational Tools for Building and Community Energy Systems; International Energy Agency: Paris, France, 2017; p. 60. [Google Scholar]
  16. Lawrence Berkeley National Laboratory. Buildings Library. Available online: http://simulationresearch.lbl.gov/modelica/ (accessed on 1 September 2018).
  17. Wetter, M. Fan and pump model that has a unique solution for any pressure boundary condition and control signal. In Proceedings of the 13th Conference of International Building Performance Simulation Association, Chambery, France, 26–28 August 2013; pp. 3505–3512. [Google Scholar]
  18. EnergyPlus. Weather Data. Available online: http://energyplus.net/weather (accessed on 15 September 2018).
  19. Legislatura. Decreto Del Presidente Della Repubblica 26 Agosto 1993, n. 412. Available online: http://www.gazzettaufficiale.it/eli/id/1993/10/14/093G0451/sg (accessed on 30 September 2018).
  20. Verda, V.; Colella, F. Primary energy savings through thermal storage in district heating networks. Energy 2011, 36, 4278–4286. [Google Scholar] [CrossRef]
  21. Gadd, H.; Werner, S. Daily heat load variations in Swedish district heating systems. Appl. Energy 2013, 106, 47–55. [Google Scholar] [CrossRef] [Green Version]
  22. Noussan, M.; Roberto, R.; Nastasi, B. Performance indicators of electricity generation at country level— The case of Italy. Energies 2018, 11, 650. [Google Scholar] [CrossRef]
  23. Weissmann, C.; Hong, T.; Graubner, C.A. Analysis of heating load diversity in German residential districts and implications for the application in district heating systems. Energy Build. 2017, 139, 302–313. [Google Scholar] [CrossRef] [Green Version]
  24. Dahl, M.; Brun, A.; Kirsebom, O.S.; Andresen, G.B. Improving Short-Term Heat Load Forecasts with Calendar and Holiday Data. Energies 2018, 11, 1678. [Google Scholar] [CrossRef]
  25. Noussan, M.; Jarre, M.; Poggio, A. Real operation data analysis on district heating load patterns. Energy 2017, 129, 70–78. [Google Scholar] [CrossRef]
Figure 1. Simulation model for the final user, software: Modelica–Dymola [14].
Energies 12 00321 g001
Figure 2. The simulation model for the district heating system, developed in Modelica–Dymola [14].
Energies 12 00321 g002
Figure 3. Distributed Heat Pump scheme.
Energies 12 00321 g003
Figure 4. Baseline heat profiles of the heat supplied to the network.
Energies 12 00321 g004
Figure 5. Comparison of heat profiles (1 January).
Energies 12 00321 g005
Figure 6. Comparison of temperature profiles (1 January).
Energies 12 00321 g006
Figure 7. Comparison of annual performance for different supply temperatures.
Energies 12 00321 g007
Figure 8. Comparison of annual performance of HP and different supply temperatures.
Energies 12 00321 g008
Figure 9. Comparison of annual primary energy consumption.
Energies 12 00321 g009
Table 1. Annual energy performance of the different cases.
CaseUser Demand (MWh)DH Supply (MWh)Network Losses (-)
Case 0910107518.0%
Case 194110198.3%
Case 254862814.5%

