1. Introduction
The wind power capacity installed in the last years has been showing an increase and, consequently, the requirement for bigger rotor wind turbines is becoming increasingly more necessary. This growth in size and weight of the wind turbines results in longer rotor blades which cannot be controlled as they were some years ago. Large wind turbines are exposed to severe structural and fatigue loads that must be reduced by means of the use of new flexible-soft materials and with novel load control techniques. Johnson et al. [
1] gathered most of the main flow control devices with potential to be applied in wind turbines, assuring a better efficiency and a safe operation under a variety of adverse atmospheric conditions.
Flow control devices were first researched and developed for the aeronautical field with promising results; see the study of Taylor [
2]. Then, the aim was to introduce and optimize them for their implementation in wind turbines to improve rotor blades’ aerodynamic performance as well as to reduce fatigue loads. Wood [
3] developed a scheme to classify the different concepts involved in all flow control devices such as their location, operation principle or working conditions. Aramendia et al. [
4] provided an overview of how these devices are classified into passive and active, depending on their operating principle. Active flow control devices need a secondary power source for their activation, while passive flow control devices, as the Gurney flaps (GFs) of the current study, do not require external energy consumption. Other passive devices such as the vortex generators (VGs) have also been studied extensively. Fernandez-Gamiz et al. [
5,
6] performed numerical simulations to study the characteristics of the primary vortex downstream of a rectangular VG along with a prediction model.
Due to their low cost, simplicity and reliable performance, GFs are being taken into consideration within passive flow control devices, showing promising results to extend the lifetime of future wind turbines [
7]. A GF consists of a small tab placed normal to the airfoil surface and close to the trailing edge, either in the upper or in the lower side. The size of these GFs, measured with respect to the airfoil chord length (
c), usually varies from 0.1%
c and 3%
c. They were first used in 1971 by Daniel Gurney, a race car driver who noticed improvements in cornering speeds and in the stability of his vehicle as a consequence of an increase in the downforce. Liebeck [
8] discussed first this application and, subsequently, several experiments were carried out by Jeffrey et al. [
9] on a NACA 0012 airfoil to investigate the effects of GFs and how they provide a lift improvement and a drag reduction once properly sized. They have been more widely researched for lift enhancement in aeronautics, where their advantages and applications were extensively studied by Wang et al. [
10] Additionally, Pastrikakis et al. [
11] compared the performance of a helicopter rotor with GFs at low and high forward flight speeds. Tang et al. [
12], working with a NACA 0012 airfoil as well, studied a fixed and an oscillating trailing edge GF with the aim of evaluating the aerodynamics loadings by means of an incompressible Navier-Stokes code. Lee et al. [
13] also studied the aerodynamic characteristics and the impact of GFs installed in a NACA 0015 along with a trailing edge flap. Different GFs heights and perforations were analyzed using particle image velocimetry (PIV) to measure the development of the tip vortex generated. According to Shukla et al. [
14], the implementation of GFs in NACA0012 and NACA0015 symmetrical airfoils results in an improvement in the lift coefficient and lift force. Cole et al. [
15] showed with different GF heights the importance of the airfoil shape in the aerodynamic performance of the airfoil. The influence of passive devices such as VGs and GFs was also studied by Fernandez-Gamiz et al. [
16]. This work evaluated the improvement of a 5 MW wind turbine in terms of power output. Multiple device configurations and wind speed realizations were studied with the results showing an overall increase on the average power output of the wind turbine. Astolfi et al. [
17] presented three test cases to evaluate the wind turbine power curve upgrades under different possible scenarios through operational data. In addition, a multivariate linear method for selecting the most appropriate input for modeling a given output was proposed by Terzi et al. [
18] and applied to a multi-megawatt wind turbine with different passive flow control devices installed.
GFs have also been studied as active flow control devices, as shown in the work of Camocardi et al. [
19], where the characteristics and structures of the flow pattern downstream the airfoil in the near wake were experimentally investigated. Recently, Han et al. [
20] analyzed the influence of fixed and retractable GFs in the performance of variable speed helicopter rotors. Their results showed that both fixed and retractable GFs enhanced the performance of the rotor and expanded the flight envelope. However, the retractable one led to a better behavior in rotor power savings. In the wind turbine research field, the goal of this type of devices is to increase the lift on the rotor blades and, therefore, to increase the mechanical torque applied by the wind in the rotor. A lift enhancement of nearly 15% was observed in the study of Storms et al. [
21] with a GF length of 0.5%
c on a NACA 4412. Similarly, in the work of Mohammadi et al. [
22], lift improvements were achieved with different GF shapes when compared to the clean DU91W(2)250 airfoil. Numerical methods have been developed and improved over the last years to study, as shown in the work of Gebhardt et al. [
23], to study the behavior of large horizontal-axis wind turbines. Computational Fluid Dynamic (CFD) techniques are also frequently used to study the advantages and limitations of different flow control devices [
24]. Recently, Woodgate et al. [
25] used an in-house CFD solver to evaluate the implementation of GFs on wings and rotors. Different methods of modeling a GF were discussed and 2D cases were simulated to compare thick and infinitely thin GFs. Furthermore, they tested the solver also with 3D cases including rotors in hover and forward flight. In the study of Fernandez-Gamiz et al. [
26], CFD simulations were made to find the optimal position of a microtab to improve the power output of a 5 MW wind turbine. Additionally, Fernandez-Gamiz et al. [
27] carried out a parametric study to find the most favorable dimension of a GF on a S810 airfoil by means of Proper Orthogonal Decomposition (POD) methods.
A parametric study is presented in the present work to analyze the effect of the GF length on the aerodynamic performance in a widely used DU91W(2)250 airfoil in multi-megawatt Horizontal Axis Wind Turbines (HAWT). In order to achieve this purpose, numerical RANS based simulations have been made and validated with the wind tunnel experimental data provided by Timmer et al. [
28]. In addition, an Artificial Neural Network (ANN)-based model is presented to predict the effects of GFs on the aerodynamic efficiency in the DU91W(2)250 airfoil.
2. Numerical Setup
The behavior of the implementation of GFs was studied by means of Computational Fluid Dynamic (CFD) tools. In the current work, the commercial code STAR CCM+ v.11.02 [
29] has been chosen to simulate the behavior of different GF lengths on a DU91W(2)250 airfoil.
The UpWind algorithm was employed for the pressure-velocity coupling and a linear upwind second order scheme was used to discretize the mesh. The numerical simulations were performed in steady state and ran fully turbulent using Reynolds Averaged Navier-Stokes (RANS) equations. Specifically, the Menter [
30] k-ω SST shear stress turbulence model was used since it leads to a significant improvement in handling non-equilibrium boundary layer regions such as those close to separation, as addressed, as addressed by Kral [
31] and Gatski [
32]. This turbulent model combines both the standard k-ε model and k-ω model, retaining the properties of k-ω close to the wall and gradually blending into the standard k-ε model away from the wall. Mayda et al. [
33] presented different tab configurations applying RANS calculations with the SST turbulence model. An O-mesh domain was defined for the numerical simulations, where the size of the computational domain was set to be 42 times the airfoil chord length
c, R = 42
c, according to the recommendation of Sørensen et al. [
34].
All the simulations were performed with a Reynolds number of Re = 2 × 10
6. The generation of an optimized grid represents the most important step before running the numerical solution in order to achieve reliable results. The grid domain consists of 65348 structured elements, where the height of the first cell normalized by the airfoil chord length was determined to be
Δz/c of 1.35 × 10
−6. The stretching in both normal and chord-wise direction is achieved by
tanh functions based on Vinokur [
35]. With the aim of resolving the viscous sublayer inside the turbulent boundary layer, the mesh was designed to achieve a dimensionless wall distance
y+ at the first node adjacent to the airfoil wall less than 1 (
y+ < 1).
Figure 1 shows the cell distribution close to the trailing edge of the airfoil and around the GF, where the mesh refinement plays a major role due to the high velocity gradients expected in this region.
The walls of the airfoil and the GFs were set as non-slip boundary type. The validation of the numerical simulations without the implementation of the GF on the DU91W(2)250 airfoil was carried out with the wind tunnel results obtained by Timmer [
28].
A mesh dependency study was made by means of the Richardson’s extrapolation to verify that the solution obtained numerically is not dependent on the mesh size, following the procedure carried out by Fernandez-Gamiz et al. [
27]. Three different grids were created with a mesh refinement ratio of 2. A fine, medium and coarse mesh of 65348, 32674 and 16337 cells have been designed, respectively. The results are summarized in
Table 1, where RE indicates Richardson’s extrapolation solution, p defines the order of accuracy and R the ratio of error. R values less than 1 were obtained, indicating that we are within the asymptotic range of convergence for all angles of attack.
Figure 2 illustrates the lift-to-drag ratios achieved with each mesh level. The fine mesh provided the best results compared with the experimental wind tunnel results of Timmer et al. [
28]. Thus, the fine mesh was used in the numerical simulations presented in the current work.
Both lift and drag dimensionless coefficients were calculated with the Equations (1) and (2), respectively:
An air density value of ρ = 1.204 kg/m3 was set, the dynamic viscosity was defined by µ = 1.855 × 10⁻⁵ Pa·s and the free stream velocity corresponds to U∞ = 30 m/s. The airfoil chord length is c = 1 m. Since the numerical simulations have been performed in two-dimensions, the parameters L and D represent the lift and drag forces per unit of area.
Gurney Flap Layout
The position and size of the GF is displayed in
Figure 3. The dimension
c represents the airfoil chord length and the dimension
y the GF length. Twelve cases have been considered depending on the GF length, which is expressed as a percentage of the airfoil chord length, as shown in
Table 2. Each case has been studied for fifteen different angles of attack, from −6° to 8°. The combination of all these GF positions for each angle of attack gives 195 different cases to study. All these cases have been designed following the procedure of previous studies carried out by Fernandez-Gamiz et al. [
26,
27]. The airfoil without any flow control device was also taken into account and simulated in order to compare the influence of the GFs on the airfoil aerodynamic performance.
3. Results
The influence of the GF length was evaluated with the lift-to-drag ratio C
L/C
D for every angle of attack α studied, as illustrated in
Figure 4. For each AoA, the evolution of the lift-to-drag ratio C
L/C
D with the GF length was compared with the clean airfoil case, i.e., no GF implementation. With regard to negative AoAs, from −6° to −4°, as the GF length increases the lift-to-drag ratio increases as well. In all these cases the effect of the GF enhances the aerodynamic efficiency of the airfoil, except for the case of −6° with a GF length of 0.25%
c. However, in the range of AoAs from −3° to −1°, a peak value of C
L/C
D is achieved before the maximum GF length of 3%
c. For −3° of AoA, a C
L/C
D ratio of 18.99 was obtained with a GF length of 2%
c. Similarly, the peak values of C
L/C
D for −2° and −1° of AoA correspond to GF lengths of 1.5%
c and 1%
c, respectively.
On the other hand, a different behavior is observed for positive angles of attack. From 0° to 3°, the influence of the GF length on the CL/CD ratio follows the same pattern. With 0° of AoA, a maximum CL/CD value of 61.75 is obtained corresponding to a GF length of 1% c. Furthermore, the optimal GF length for 1° of AoA corresponds to 0.75% c with a CL/CD ratio of 78.91. As the angle of attack increases larger CL/CD maximum values are obtained, 92.37 and 102.65 for 2° and 3° of AoA, respectively. As can be seen from the plots at 2° and 3° of AoA, the effect of the GF is not favorable for all lengths. For 2° of AoA, GFs with lengths of 2.75% c and 3% c do not provide an increase in the CL/CD ratio compared with the clean airfoil. Similarly, in the case of 3° of AoA, GF lengths larger than 2% c do not present beneficial effects in the aerodynamic performance of the airfoil.
From 4° to 7° a different trend is observed in the evolution of the influence with the GF lengths studied. A GF length of 0.25% c presents the best CL/CD ratio, with a slightly improvement compared with the clean airfoil. However, from 5° to 7°, the CL/CD difference obtained with respect to the clean airfoil at these AoAs varies only between 0.29 and 1.25. At these AoAs, GFs larger than 0.25% c do not contribute to enhance the aerodynamic performance of the airfoil.
At 8° of AoA, any of the GF lengths studied in the current work presents a better performance in the C
L/C
D ratio than the clean airfoil. At this AoA, as the GF length increases no improvement in the airfoil aerodynamic performance is found.
Table 3 represents the best GF length for each AoA in terms of maximum lift-to-drag ratio: C
L/C
D max. Fourth column of
Table 3 represents the C
L/C
D with no GF and the last column represents the variation with respect to the airfoil with no GF implemented: Δ C
L/C
D. The largest value of lift-to-drag C
L/C
D 115.68 is achieved at an AoA of 5° and corresponds to a GF length of 0.25% of the airfoil chord length
c.
For negative AoAs, the maximum increment in the CL/CD ratio is obtained with −4° of AoA with a peak value of 28.19. On the other hand, for positive AoAs, a GF length of 0.5% c achieves the largest difference in CL/CD ratio compared with the clean airfoil, with a value of 21.41 at 2° of AoA.
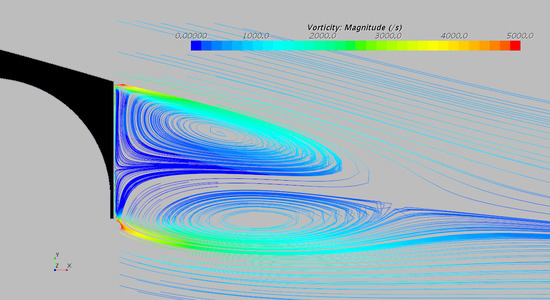
Figure 5 shows the streamwise velocity distribution around the GF for the lengths which provided the best cases in terms of C
L/C
D ratio. The presence of the GF changes the trailing edge flow pattern and, therefore, modifies the effective camber of the airfoil resulting in a lift enhance. As the GF size increases, the presence of the two vortices behind the GF is more visible. The GF jets the flow in the boundary layer away from the airfoil surface and, thus, the circulation in the region behind the GF is enhanced.
Figure 6 shows the pressure distributions on the surface of the clean airfoil DU91W(2)250 and the airfoil with GFs of 0.25%
c, 0.50%
c, 0.75%
c and 1%
c which have been considered that provide the best aerodynamic performance in terms to C
L/C
D ratio. The airfoil geometry, with a continuous black line, is illustrated as well. In the cases with the GF implemented, the aft loading of the airfoil increases and a positive gap with respect to the clean airfoil is visible at all AoAs.
ANN-Based Predicition Model
Artificial Neural Networks (ANNs) represent an exceptional tool in the modeling of different type of systems due to their several advantages and outstanding properties. One of them is related with the capability of learning, as they can learn complex non-linear black box models with an appropriate selection of the training algorithm and the input/output values. If neural networks are properly trained, i.e., the training patterns are carefully chosen, their response in new situations (new inputs) will be suitable with high probability, which means that will have the so-called generalization property. Lastly, as neural networks have an inherent parallel internal structure, their response after they have been trained is very fast, providing them real time capabilities to develop prediction models with large datasets, see Lopez-Guede et al. [
36]. All these properties make ANNs a method of major importance in a wide number of applications.
Once studied the influence of different GF lengths and angles of attack in the airfoil aerodynamic performance by means of CFD techniques, a prediction model has been developed with an artificial neural network (ANN). The aim of this model is to predict the aerodynamic efficiency (C
L/C
D ratio) of the airfoil following the strategy based on the study by Lopez-Guede et al. [
37]. In the current study, a multi-layer model with two hidden layers has been used. The C
L/C
D ratio is obtained by Equation (3), whereas the outputs of each hidden neuron follow a sigmoid function as defined in Equation (4). All these parameters represent a typical configuration of Multilayer Perceptron with Backpropagation (BP-MLP) neural networks. The postsinaptical
hi of each
i neuron is calculated using a linear combination by means of Equation (5), where
ωi denotes the output layer weights and
ωij the input (hidden) layer weights:
Matrices 6–9 contain the synaptic weights obtained by the neural network for the prediction of the C
L/C
D ratio:
The ANN has two input neurons corresponding to the two real valued inputs (AoA and GF length) and one unique output neuron for the valued target (CL/CD ratio), as shown in
Figure 7. The datasheet has been partitioned, i.e, 70% for training the ANN, 20% for validation and 10% for testing the quality of learned model.
Figure 8 shows the ANN results for all GF lengths and all AoAs studied in the present work. The colored surface illustrates the C
L/C
D values calculated by the proposed ANN and the CFD results are represented by black asterisks. The neural network predicts accurately the lift-to-drag ratios obtained by the numerical computations.
The correlation coefficients (R-value) are shown in
Figure 9. The regression line (highlighted in red) is drawn over expected C
L/C
D ratio and its neural prediction. The horizontal axis shows the expected C
L/C
D ratio and the vertical axis the C
L/C
D ratio prediction given by the neural network. The correlation coefficient value was determined as 0.99671 which indicates a good correlation between the results given by the ANN and the followed target. This result for the simulated GF lengths allows the algorithm to calculate and predict the C
L/C
D ratio for any GF length in the conditions studied of Reynolds number Re = 2 × 10
6.
4. Conclusions
The current work presents a parametric study to evaluate the influence of different GF lengths in the aerodynamic performance of a DU91W(2)250 airfoil. Two-dimensional CFD simulations have been carried out, using RANS equations at Reynolds number of Re = 2 × 10⁶. Firstly, a clean airfoil without any flow control device implemented has been simulated and the results in terms of lift-to-drag ratio have been validated with experimental data. Then, simulations have been performed with GFs from 0.25% c to 3% c at angles of attack from −6° to 8° to investigate the airfoil aerodynamic performance. The results showed that, for positive angles of attack, peak values are obtained with GF lengths between 0.25% c and 0.75% c. Specifically, an increase of 21.57 in CL/CD ratio has been obtained with a GF length of 0.5% c at 2° of AoA. The influence of GFs decreased at AoAs larger than 5°, where only a GF length of 0.25% c provides a slight improvement in terms of CL/CD ratio enhancement.
Secondly, the streamwise velocity distribution around the GF has been addressed with those GF lengths that provided the best aerodynamic performance in terms of CL/CD ratio. As expected, two counter-rotating vortices are formed in the near wake behind the flow control device. As the GF length increases the size of the vortices increases, especially the one on the lower region. Moreover, the pressure distribution has been studied at all AoAs, resulting in a clearly visible increment in the cp due to the GF implementation for all the length cases.
The optimal GF length varies at different angles of attack, which means that a fixed GF length would not reach the optimal CL/CD ratio at all the AoAs. Therefore, this result suggests that a careful analysis of the GF length is needed to yield an efficient flow control system and to consider the study of GFs as active flow control devices. In that case, the GF length would change along the AoA to achieve the best CL/CD ratio depending on the working conditions.
To that end, an ANN has been developed and trained to predict the aerodynamic efficiency of the airfoil in terms of CL/CD ratio. This tool allows to obtain an accurate prediction model of the aerodynamic behavior of the airfoil, which can be a suitable method to optimize the GF lengths for different wind and /or rotor blade airfoil geometry scenarios and its implications in the wind turbine control system.

 ,
, 


