Article

Performance Evaluation and Prediction of BIPV Systems under Partial Shading Conditions Using Normalized Efficiency

1
Future Agricultural Division, Rural Research Institute, Gyeonggi-do 15634, Korea
2
Department of Architectural Engineering, Hanbat National University, Daejeon 34158, Korea
*
Author to whom correspondence should be addressed.
Energies 2019, 12(19), 3777; https://doi.org/10.3390/en12193777
Submission received: 29 August 2019 / Revised: 23 September 2019 / Accepted: 27 September 2019 / Published: 4 October 2019
(This article belongs to the Section A2: Solar Energy and Photovoltaic Systems)

Abstract

:
The performance of the Operable Building Integrated Photovoltaic (OBIPV) system applied to the building envelope to reduce the building energy consumption varies significantly depending on the operation method and influence of the surrounding environment. Therefore, optimization through performance monitoring is necessary to maximize power generation of the system. This study used temperature-corrected normalized efficiency (NE*) to evaluate the power generation performance of the operation methods and predict that of the OBIPV system based upon the measured data. It was confirmed that power generation performance decreased when the photovoltaic (PV) operation angle changed, the system remaining the same. A decrease in power generation performance due to partial shading from an overhang was also observed. As a result of the power generation prediction for two months using NE*, the error of the measured values was found to be less than 3%. In addition, with or without any partial shading of the OBIPV system, its performance degradation was predicted with an annual electricity generation decrease by 36 kWh/yr (6.5%). Therefore, NE* can be used as an indicator for evaluating the power generation performance of PV systems, and to predict generation performance considering partial shading.

1. Introduction

According to the International Energy Agency (IEA), the energy consumption of buildings is approximately 45% higher now than it was in 1990. The energy consumption of the building sector has decreased by 1.3% per year since 2010, but electricity consumption has increased by 2.5% per year [1]. In order to reduce energy consumption in the building sector, great efforts are being made to develop and realize zero energy building (ZEB) [2,3]. In particular, building an integrated photovoltaic (BIPV) system is most commonly used to implement ZEB and reduce increasing electric energy consumption [4,5]. Electrical energy generation using BIPV in buildings is known to be more efficient and economical than other renewable energy systems [6,7].
In order to maximize the performance of the power generation of BIPV systems installed in buildings, the optimal design, sizing and operational performance analysis of photovoltaic (PV) systems, are essential [8]. The performances of PV systems can be predicted based on the performance of power generation and temperature characteristics, which are the test results of standard test conditions (STC), and the system’s specifications in the catalog [9,10].
The basic performance of the power generation of PV depends on irradiance, solar spectrum, module temperature and the electrical performance of the PV cell [11].
By measuring the power generation of the PV system, considering the installation method and operating environment of the BIPV system through monitoring and evaluating the performance of power generation, problem diagnosis [12] as well as design defect [13] or malfunction [14] can be identified, and can maximize power generation. In order to identify the factors that degrade the performance of power generation during installation and operation, and to maximize power generation, optimization through performance monitoring every hour (minute or second) is necessary.
In particular, operable BIPV (Operable Building Integrated Photovoltaic (OBIPV)) systems applied to buildings vary greatly, depending on the system configuration [13], operation method [15], and partial shading [16,17], as well as the basic power generation performance of the PV. Therefore, performance monitoring is essential for the optimal operation of the OBIPV system. The most widely used indicator for evaluating the performance of power generation in PV systems is the Performance Ratio (PR) [18], which is represented as the ratio of the actual performance of power generation to the performance of power generation under standard test conditions (STC). Therefore, when performance indicators such as PR are used for the performance of power generation monitoring, it is possible to intuitively determine whether operational problems have occurred, or performance has degraded based on partial information, such as irradiance and power generation.
This study introduced PR-based temperature-corrected normalized efficiency (NE*) [19] as a new performance indicator that can perform optimal operation by evaluating the performance of power generation by the operation method of the BIPV system. By analyzing NE* with temperature characteristics removed, which are inherent to PV modules or systems, the performance of PV array systems can be checked and compared in real time. For instance, by analyzing the NE*, it is possible to find the optimal operation method by comparing the performance of each operation method of the OBIPV system, and to spot problems such as partial shading, and then to take appropriate action. The temperature correction coefficient for calculating NE* can be calculated using very short monitoring data, and the performance analysis and comparison can be extended, not only to modules, but also to the PV array system considering the performance of the system configuration. This approach uses monitoring information from the PV system, thus reducing the cost of purchasing sensors or devices for the performance evaluation of the BIPV system. That is, NE* alone can be used to evaluate and compare performance without having to measure the performance of PV systems such as IV-curves. NE* calculated from the measured data can also be used to predict power generation as a function of irradiance.
This study evaluated the performance of the OBIPV system in actual operation depending on operation methods using NE*, and verified the effectiveness of normalized efficiency through performance prediction considering partial shading. This paper is organized as follows: Section 2 introduces the PR-based NE* calculation method, and compares and evaluates the performance of power generation by an operating method of an operable BIPV system through the calculation of measured data-based NE*. In Section 3, we introduce the performance prediction method using NE* through the data-driven approach, and the performance of the power generation of an operable BIPV system with partial shading was evaluated and compared with the measured data. In Section 4, NE* is used to predict and compare annual energy performance with and without any partial shading of the OBIPV system.

2. Performance Comparison of the OBIPV System by Operation Method Using NE*

2.1. Calculation of Temperature-Corrected Normalized Efficiency

The most basic method of evaluating performance by monitoring is to evaluate the power generation using only the measured current and voltage data of DC or AC. The most commonly used indicator for such evaluation is the Performance Ratio (PR).
According to IEC 61724 [20], PR is calculated as the ratio of final yield (Yf) to reference yield (Yr), and indicates the power generation loss of a PV system as a ratio of actual PV system performance to the ideal performance under STC. The calculation method of PR is as follows:
PR =   Y f / Y r =   ( P / P S T C ) / ( G / G S T C )
where P represents the measured power generation, P S T C is the power generation under STC, G is the measured POA (plane-of-array) irradiance, and G S T C is the irradiance under STC (1000 W/m2). The temperature-corrected performance ratio reflecting the performance deterioration from the temperature rise can be calculated as follows (the symbol * indicates that the temperature is corrected):
P R * S T C = ( P / C k P S T C ) / ( G / G S T C )
with
C k = 1 + γ   × (   T c e l l   T S T C )
where C k corrects the temperature difference between the actual temperature and the temperature under STC, the standard condition. For the calculation of P R * S T C the T S T C value is 25 °C, and γ is relative maximum-power temperature coefficient, and is usually a negative value.
The calculation method of NE ( η N ( t ) ) is similar to that of PR, and it is calculated by the ratio of measured power generation, to power generation under STC conditions, divided by the ratio of measured irradiance to irradiance under STC:
η N ( t ) = 1 P S T C   ·   P ( t ) 1 G S T C   ·   G ( t )
The decrease in power generation of the module depending on the temperature can be corrected by applying a temperature coefficient of power ( γ ). The γ value of the general crystal system module is in the range of −0.3%/°C–−0.5%/°C, and the measured data can be calculated and applied.
The power generation at a specific temperature ( P ( T c e l l ) ) can be calculated as follows:
P ( T c e l l ) = P S T C   ( 1 +   γ   ·   ( T c e l l   T S T C ) ) =   P S T C   (   1 +   γ   ·   Δ T S T C )
and here, T S T C is 25 °C.
The values of temperature-corrected power P* are calculated by the method of Deirf et al. [21] and Nordmann et al. [22] as follows:
P * = P ( T c e l l ) 1 + γ · Δ T S T C
Therefore, the temperature-corrected normalized efficiency (NE*, η * N ( t ) ) can be calculated as follows:
η * N ( t ) = 1 P S T C · P * ( t ) 1 G S T C · G ( t )
Using NE*, the temperature-corrected real-time power generation ( P * ( t ) ) can be calculated as follows:
P * ( t ) = η * N ( t ) · P S T C · G ( t ) G S T C
That is, if we know the value of NE*, the power generation ( P * ( t ) ) can be calculated simply as a function of the performance of power generation ( P S T C ) on the catalog and irradiance ( G ( t ) ).

2.2. Performance Comparison of Operable BIPV System by Operation Method

Essentially, the PV should be installed to produce a maximum performance of power generation. However, the BIPV system applied to a building cannot be installed at a direction and angle that can always obtain the maximum power generation due to the installation location, and is affected by the surrounding environment.
In particular, when partial shading occurs on some modules due to adjacent buildings, trees, or the shielding of buildings themselves, the performance of power generation of the entire array is reduced. Figure 1 shows the modules connected in series, and the current (Imp) is constant when a bypass is applied for PV with partial shading (compare Curve 1 and Curve 2). If this bypass is not applied under the partial shading conditions, the system decreases in both the current (Imp) and the voltage (Vmp) (see Curve 3). In addition, if the tilt angle of some PV modules in the same array is different, the irradiance on the PV modules are also different, resulting in the degradation of the performance of power generation.
In this study, the performance of power generation by the operation method of the OBIPV system installed in the vent window of the double skin façade (DSF) (Figure 2) was compared using NE*. The DSF was installed in two rooms on the south side of the building, and the eight OBIPV modules were grouped into an array. The vent window to which OBIPV is installed can be controlled at different angles (Figure 2), depending on the operation of the occupants in each room. The OBIPV was installed in Daejeon (Latitude 36.3°, Longitude 127.6°), South Korea, and was installed on the south side of the building (Figure 3). The irradiance and PV temperature were measured for the performance evaluation of the OBIPV system depending on the operation methods. The sensors and equipment used for the measurement are shown in Table 1. For the experiment, PV power (DC), module temperature, and solar radiation (90 degrees, 45 degrees) were measured in minutes. Data collection was performed for about three months (October to December).
Figure 4 shows the power generation depending on PV temperature when the OBIPV system is operated at the same angle for one day. The marker color level of power output (circle) and NE (Square) shows the PV temperature difference, and the X-axis shows the irradiance level. Even with the same irradiance, the power output and NE are lower when the temperature is high. The difference in the power output and the NE even in the same irradiance is due to the PV temperature. In general, since the PV temperature rise by irradiance is small in the morning, the morning PV temperature is lower than the afternoon PV temperature. Therefore, the difference in power output at the same irradiance level is caused by the PV temperature difference between morning and afternoon.
The degradation of the power output depending on temperature is characteristic of PV modules, and thus it must be excluded to accurately compare the performance of power generation depending on the PV operating angle. Therefore, in order to have the same power output and NE ( η N ) regardless of the PV temperature, the temperature characteristics of the PV module should be corrected.
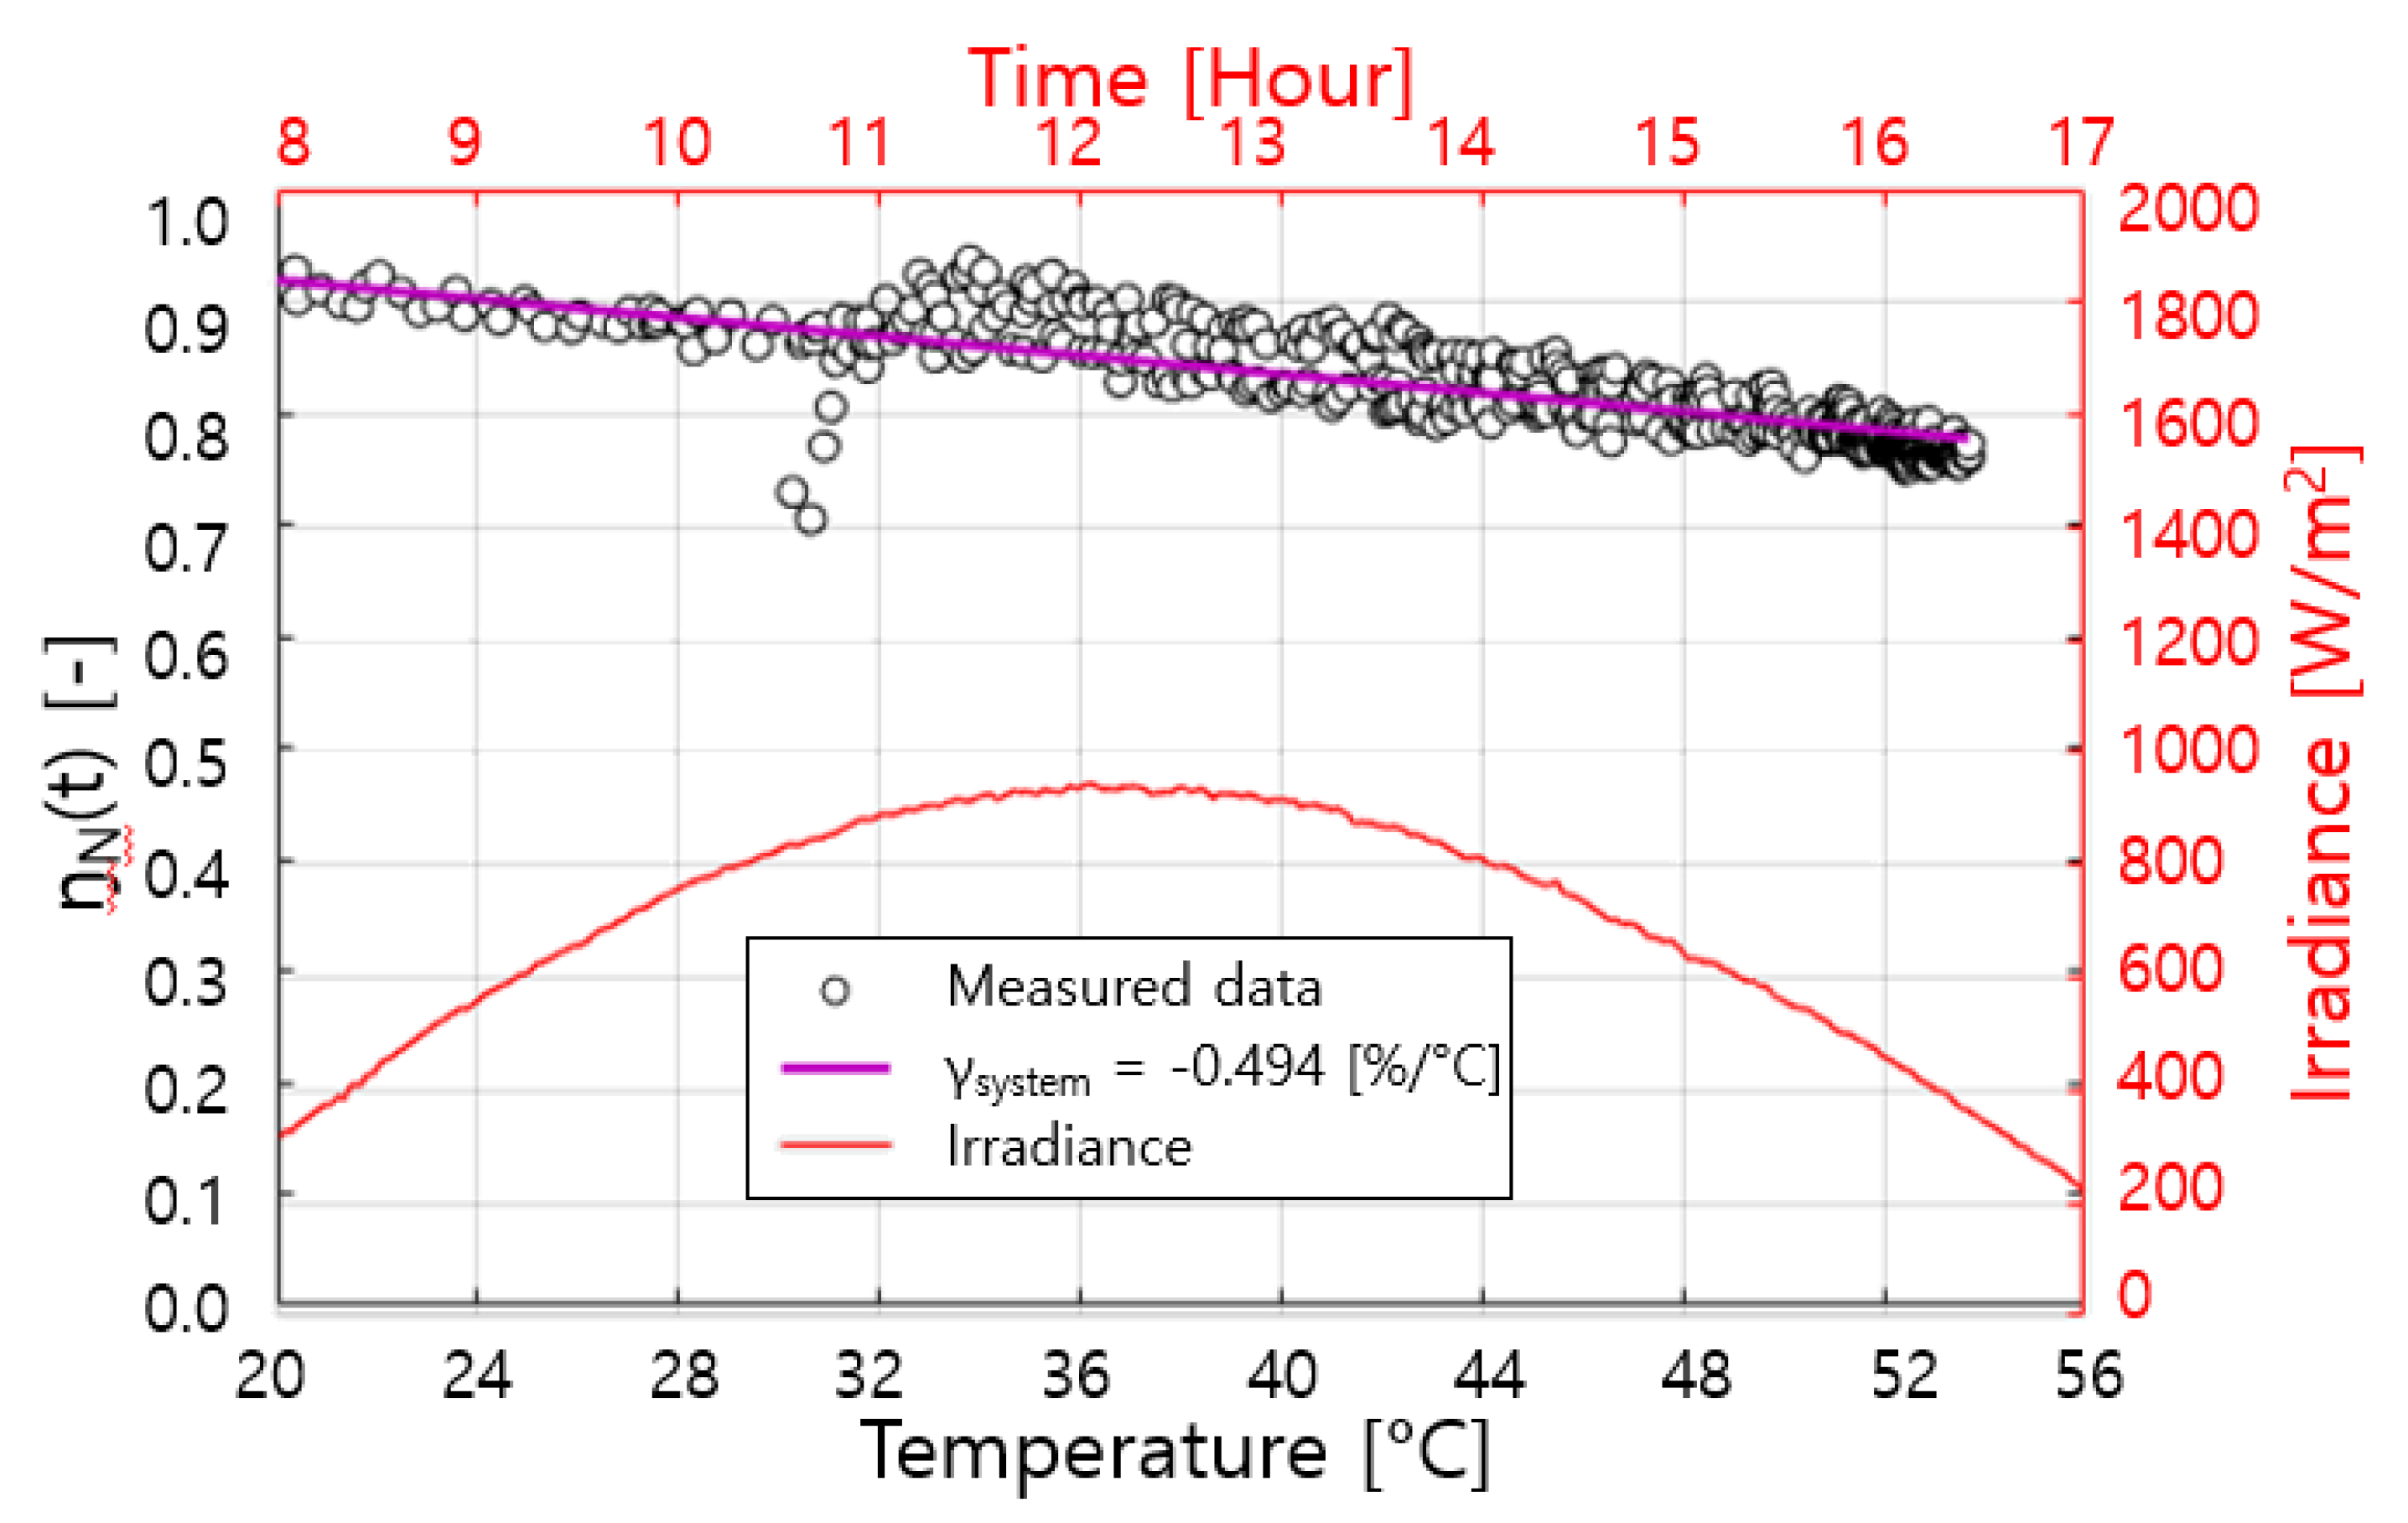
The performance degradation of power generation depending on the temperature of the PV module can be corrected by using the temperature coefficient ( γ ) e. In this study, γ was calculated by using power generation data measured on the day with excellent irradiance (Figure 5). The power generation characteristics of PV arrays depend not only on the module, but also on the system configuration and the performance of the inverter, and hence, it is possible to more accurately correct for changes in the performance of power generation of the system over temperature when calculating the temperature coefficient ( γ ) using the measured data. In this study, the temperature coefficient of the BIPV system was calculated by least-squares regression using measured irradiance, module temperature and power generation. The calculation showed that the temperature coefficient of the OBIPV system (Figure 1) was −0.494%/°C.
The temperature coefficient calculated here is not the temperature drop of PV alone, but the performance degradation of the entire OBIPV system with temperature.
The corrected temperature coefficient and Equations (4)–(6) were used to calculate NE* ( η * N ( t ) ), depending on the operating method of the BIPV system. As NE* is the ratio of actual power generation to power generation in STC conditions, the closer the normal efficiency is to 1, the higher will be the power generation performance. This indicates that the system is well installed and operated.
The study calculated NE* for one case of all eight modules operating at the same angle (90°) (all 90), and another case in which half of the modules were operating at 90°, and the other half at 45° (half90 + half45). The irradiance was measured for both 90° and 45°, and the irradiance was applied in proportion to the area of each angle when calculating NE*.
In addition, low iron glass was applied to the front side of the PV cell, so the irradiance applied to the actual power generation and the irradiance measured using a pyranometer (Kipp & Zonen CMP11, Second Class) differed, depending on the incident angle. The optical property of the glass surface was reflected using the incident angle modifier (IAM) [24], and therefore, the irradiance applied to the calculation of NE* was the amount of irradiation, taking into account the IAM.
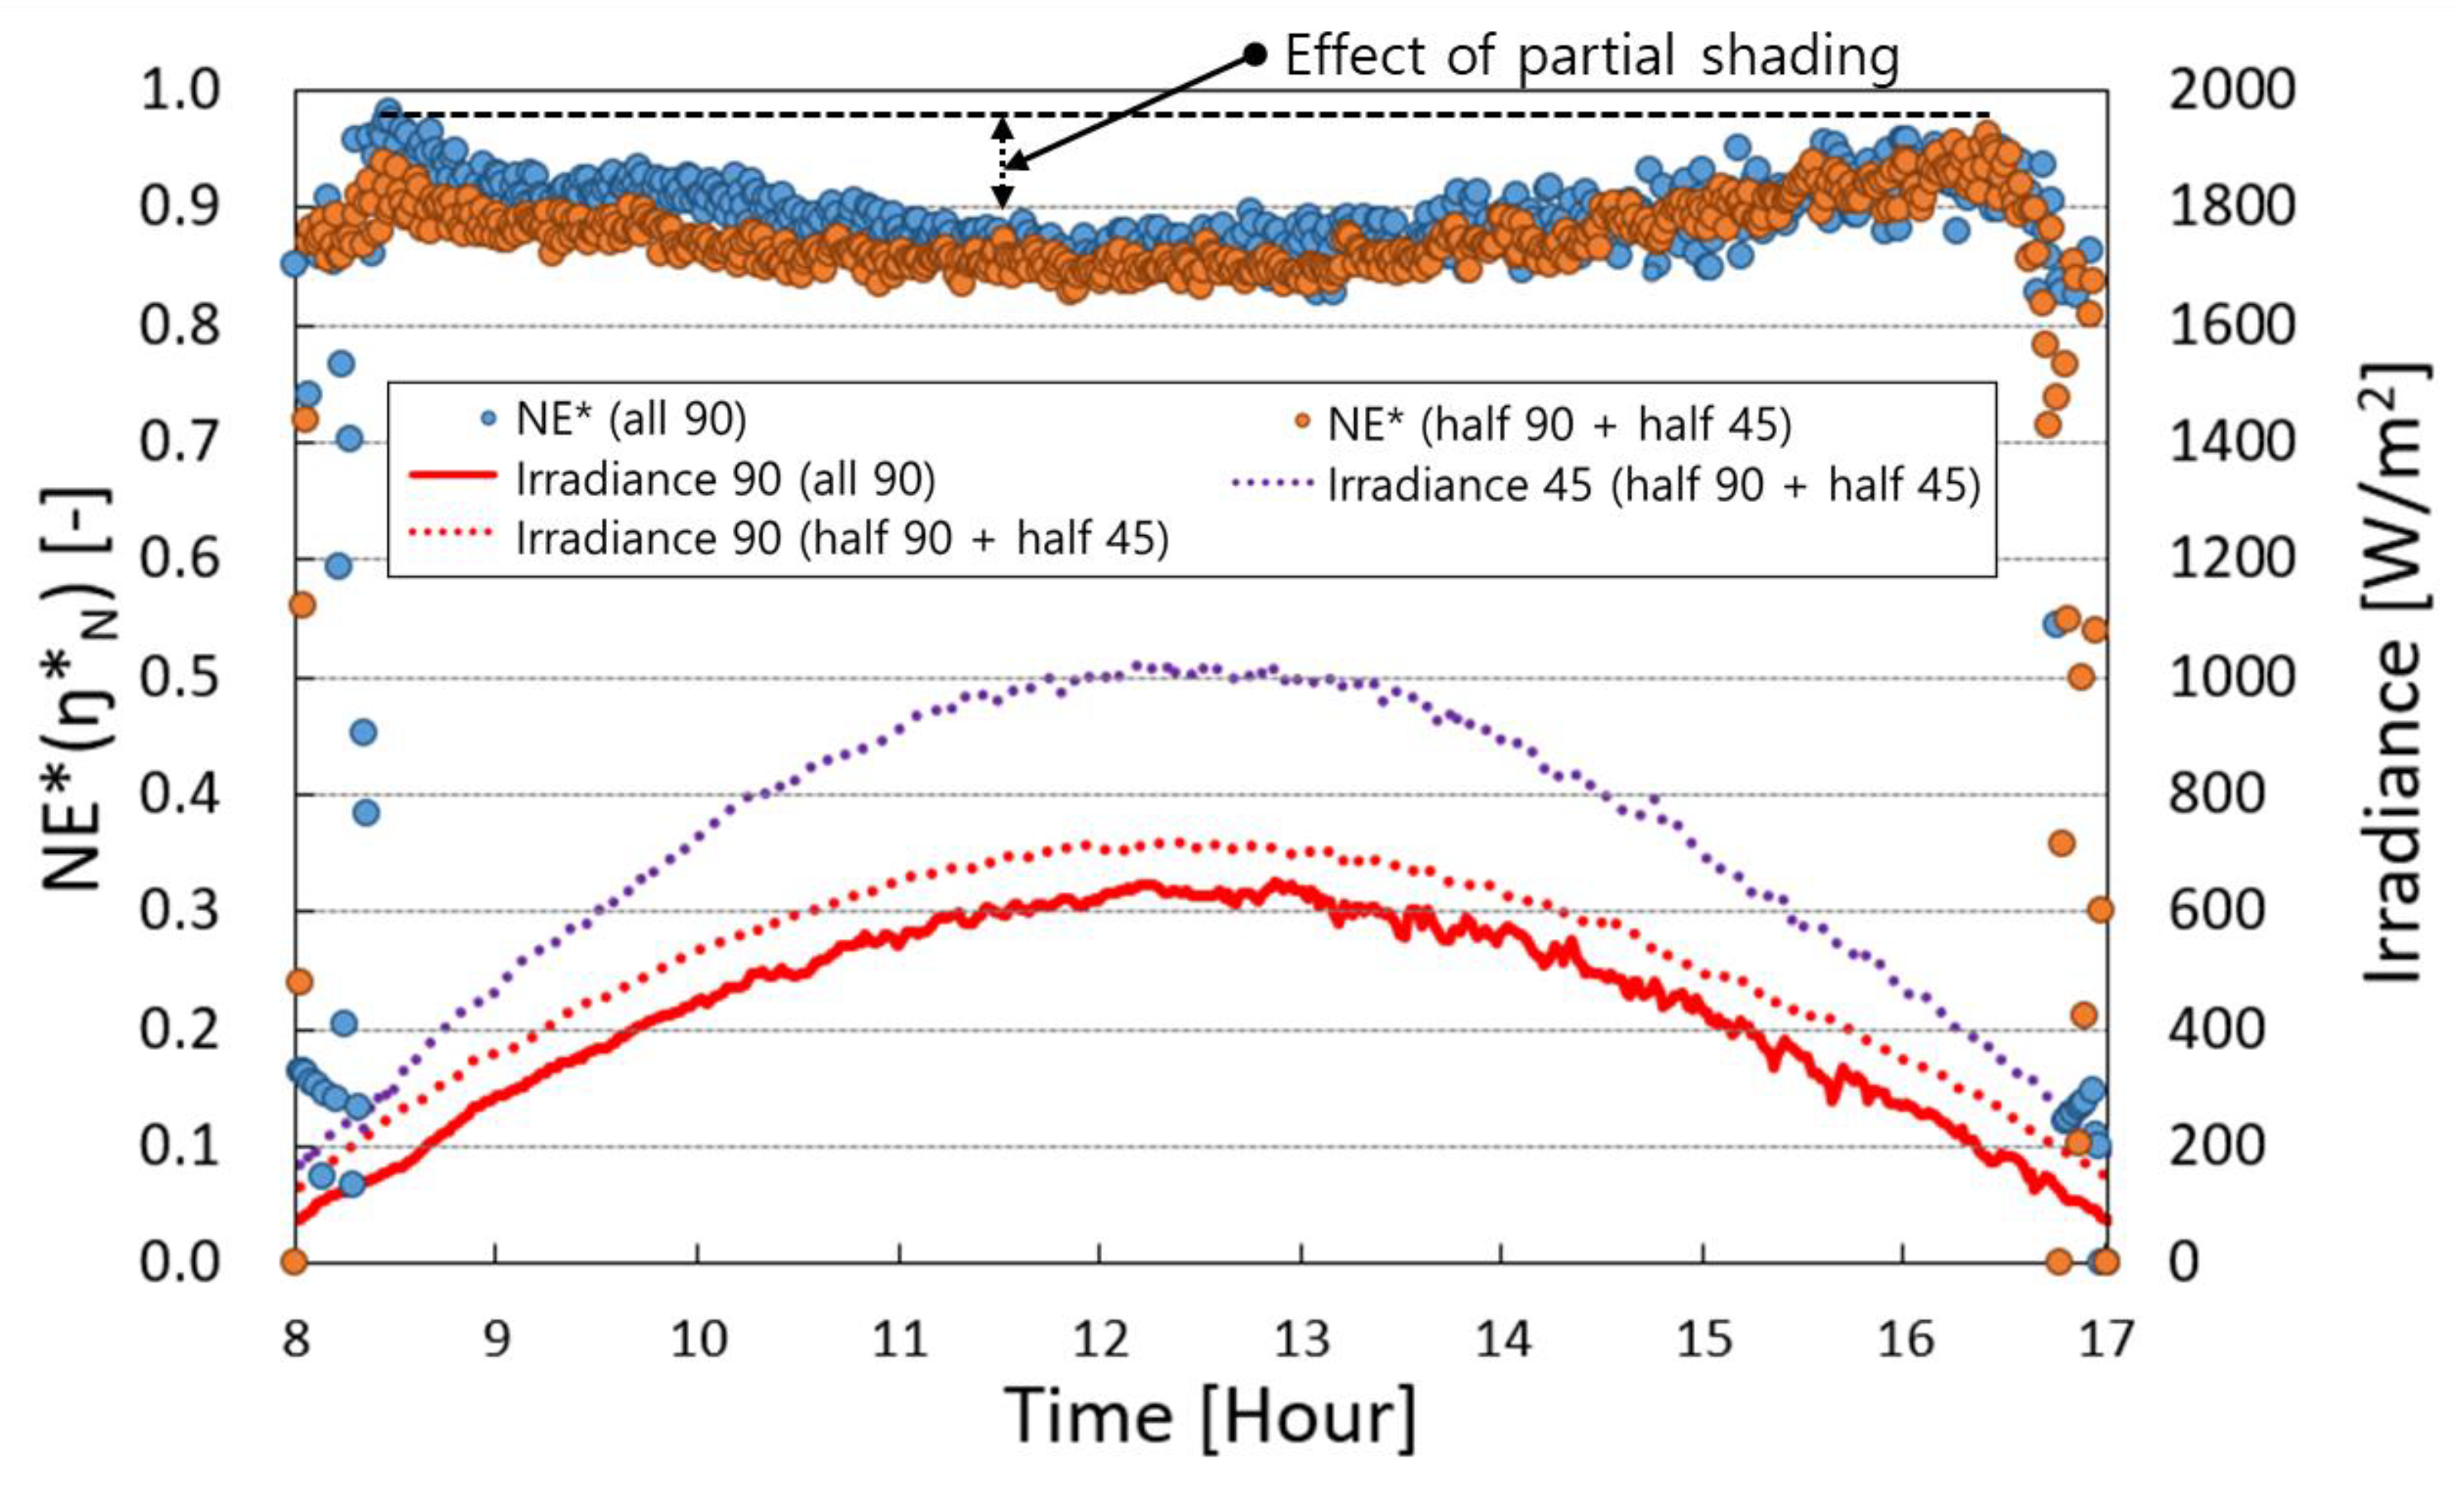
When analyzing the NE* of the OBIPV system, it was found that the double skin façade design shown in Figure 1 has a large effect on PV power generation. When designing the double skin façade, part of the upper part was overhung for design purposes, which unintentionally produced a shading effect (Figure 6). Partial shading occurred due to the overhang of the upper part of the OBIPV, and it can be seen that NE* was lowered during the daytime due to this effect (Figure 7). This means that NE* continued to decrease until noon, when the sun’s altitude increased, making this partial shading large, and then increased as the solar altitude decreased thereafter. Therefore, the effect of partial shading varies, depending on the solar altitude angle.
With the data measured in minutes, the NE* for one day is shown in Figure 7. The NE* of “all 90” was higher than that of “half90 + half45” throughout the day. Since NE* during the daytime reflects the effect of not only the operating method, but also partial shading, it is not suitable to compare the difference in NE* with the whole day’s data. Therefore, difference of NE* depending on the operation method was compared at sunrise, with no effect of partial shading. The average NE* around 8:30 AM was 0.98 for “all 90” and 0.91 for “half90 + half45”. Therefore, when the operating angle of the adjustable BIPV system was different, the NE* was 7% lower, which means that the system was not operated under optimal power generation conditions. The reason for the low performance of “half90 + half45” is that the voltage of the module decreased as the irradiance of some modules in the OBIPV system connected to the same array decreased, and eventually the power generation performance of the entire array (Figure 1) decreased. It was confirmed from the results of the NE* calculation that when the angle of the BIPV module was controlled differently, not only was the power generation performance of the OBIPV system reduced, but also the power generation performance caused by the partial shading occurred.
By calculating the NE* according to the operation method of the OBIPV system that changes in real time using the irradiance and power generation data, we confirmed that the power generation efficiency of the entire system was reduced, and if necessary, by investigating when the problem occurred, appropriate measures can be taken. In addition, the calculation of NE* enabled the confirmation of degradation in power generation performance caused by the partial shading, module defects or system errors, as well as the operating angle that changes in real time. Therefore, NE* prompts the intuitive determination of the performance degradation, which is very useful as a performance evaluation indicator of the BIPV system through monitoring in real time, the performance of power generation.

2.3. The Effect of Partial Shading on the Performance of Power Generation

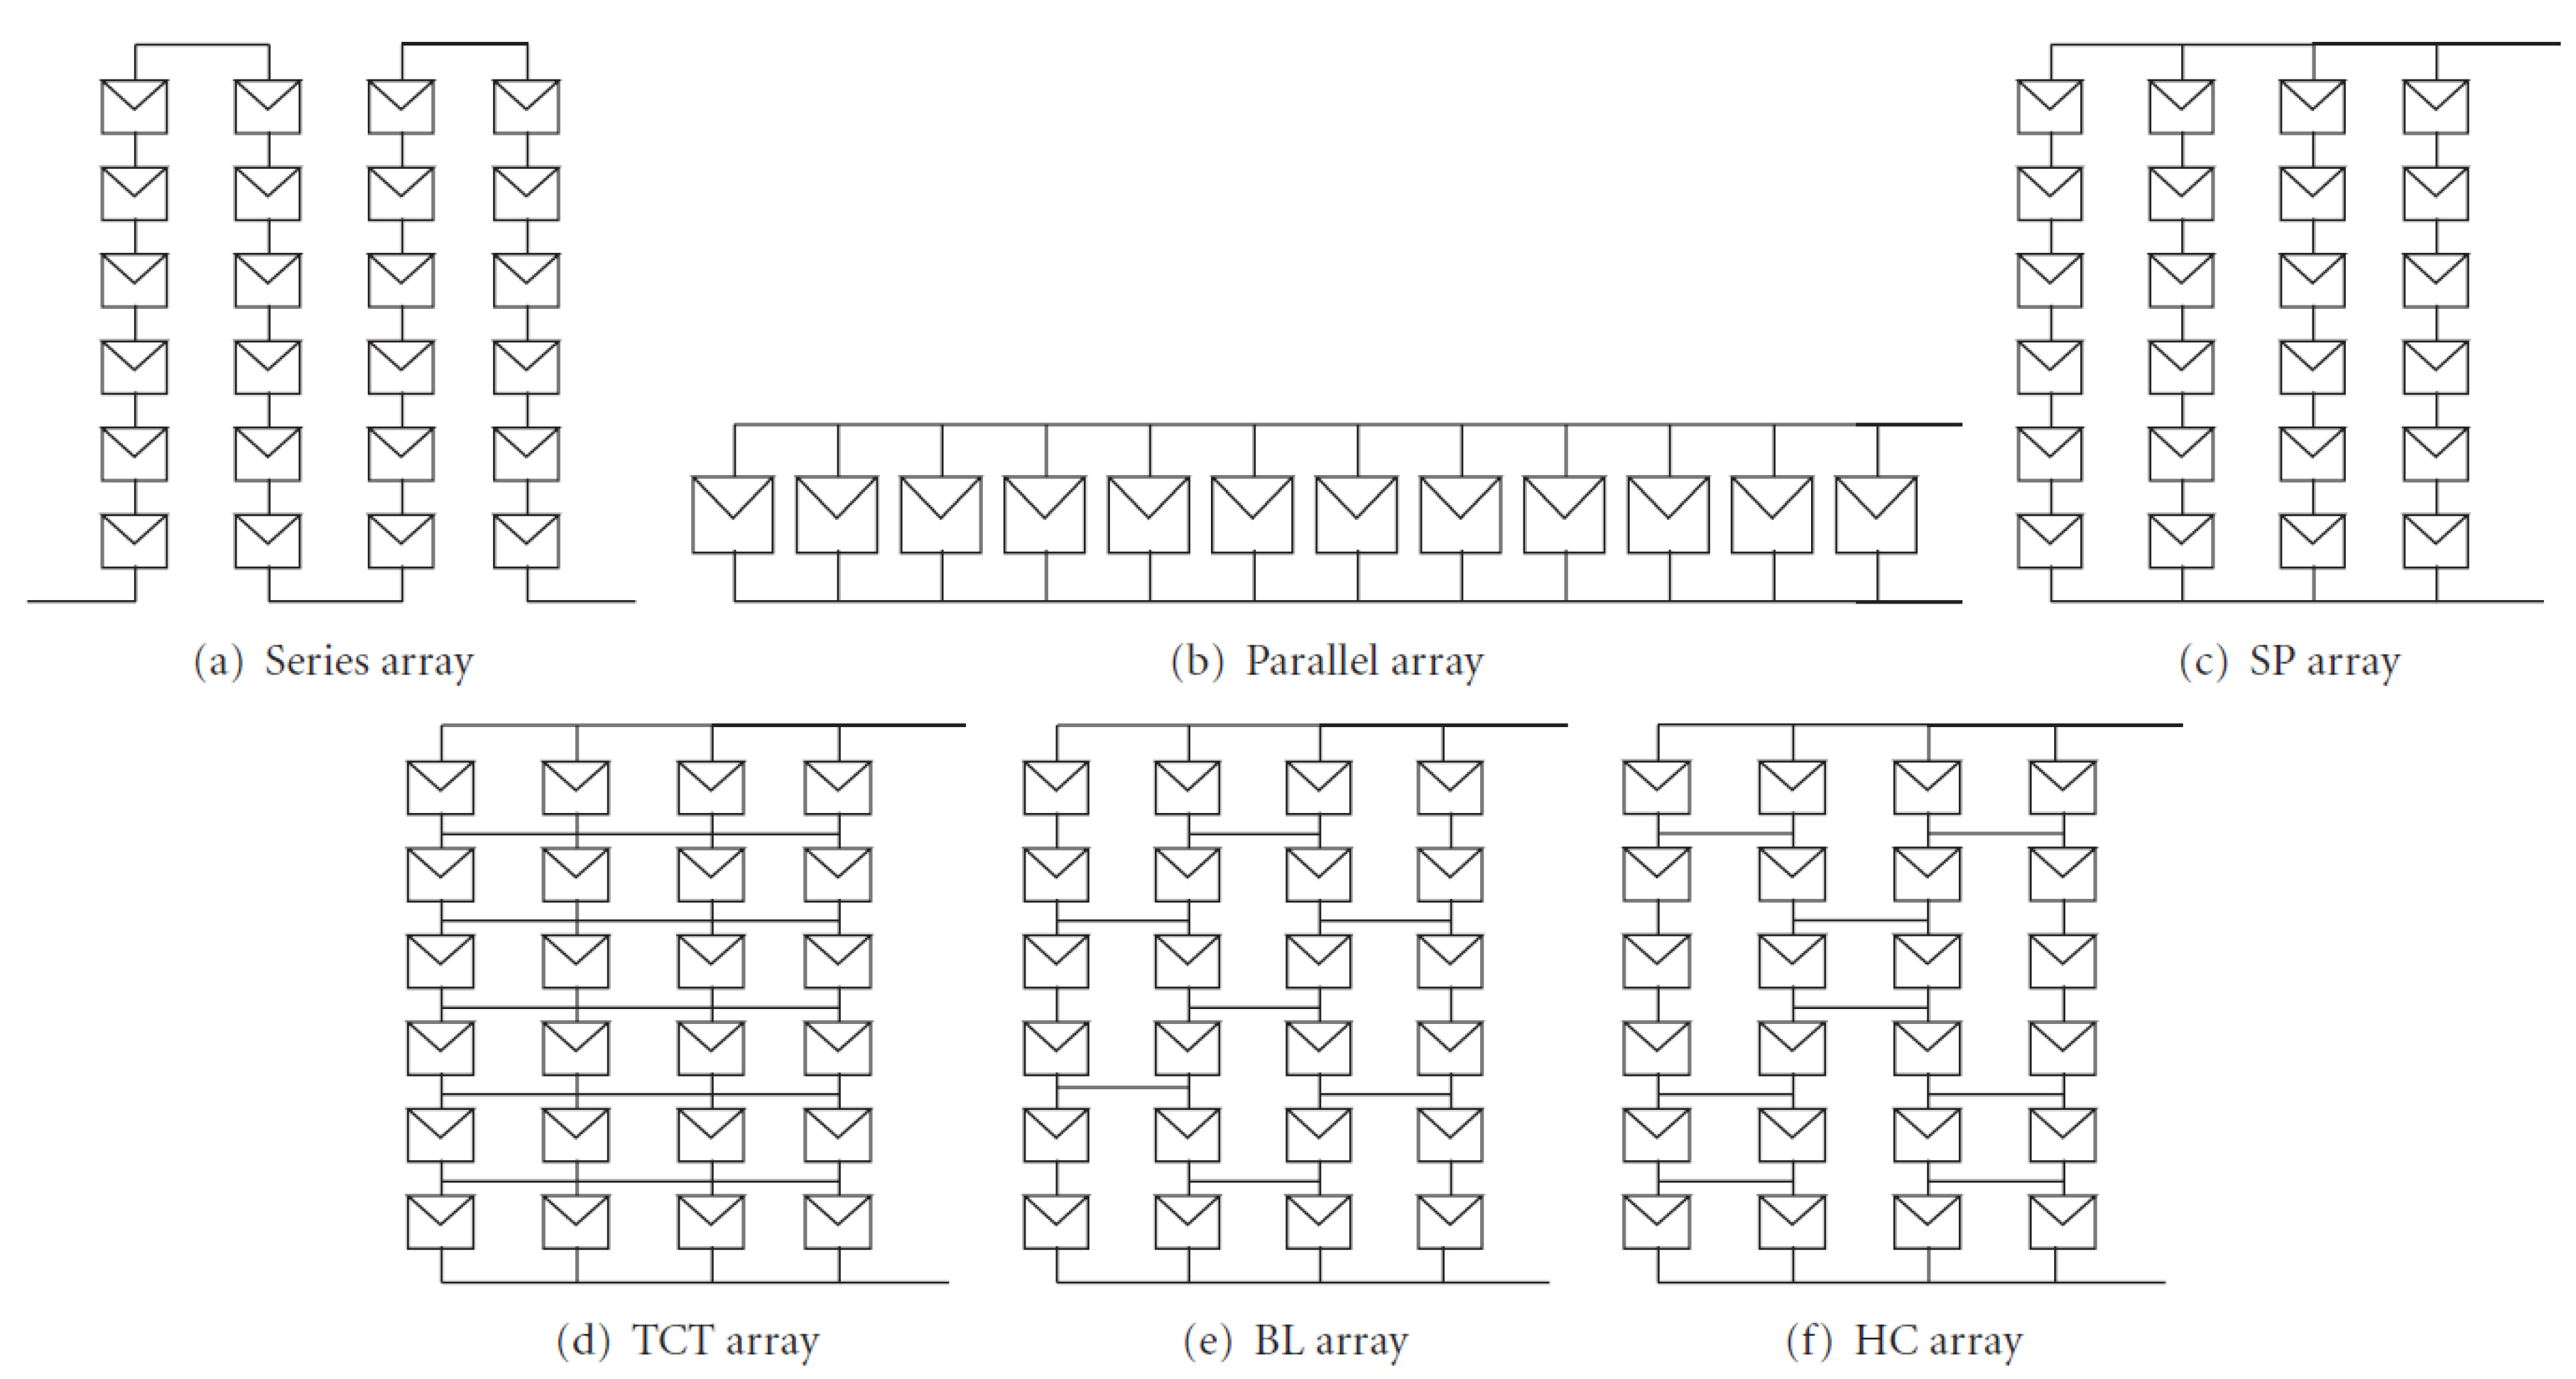
The partial shading is highly dependent on types of PV array configuration. As shown in the following Figure 8, there are various PV array configuration methods. Of these configurations, the OBIPV system in this study is a series array.
If the operating angle was controlled at the same angle, and there was no partial shading, the NE* of PV is approximately 0.98 based on 16:00, when there is no shading (Figure 6). Hence, the power generation loss of the entire OBIPV system is 2%, and if partial shading does not occur, the NE* of the PV will remain at 0.98 during the daytime.
Based on these findings, on the 21st of October, when the irradiance was excellent, this study predicted and comparatively analyzed the power generation performance in the case of no partial shading using the monitoring results. The performance of power generation using NE* can be calculated using power generation and irradiance in STC by Equation (7).
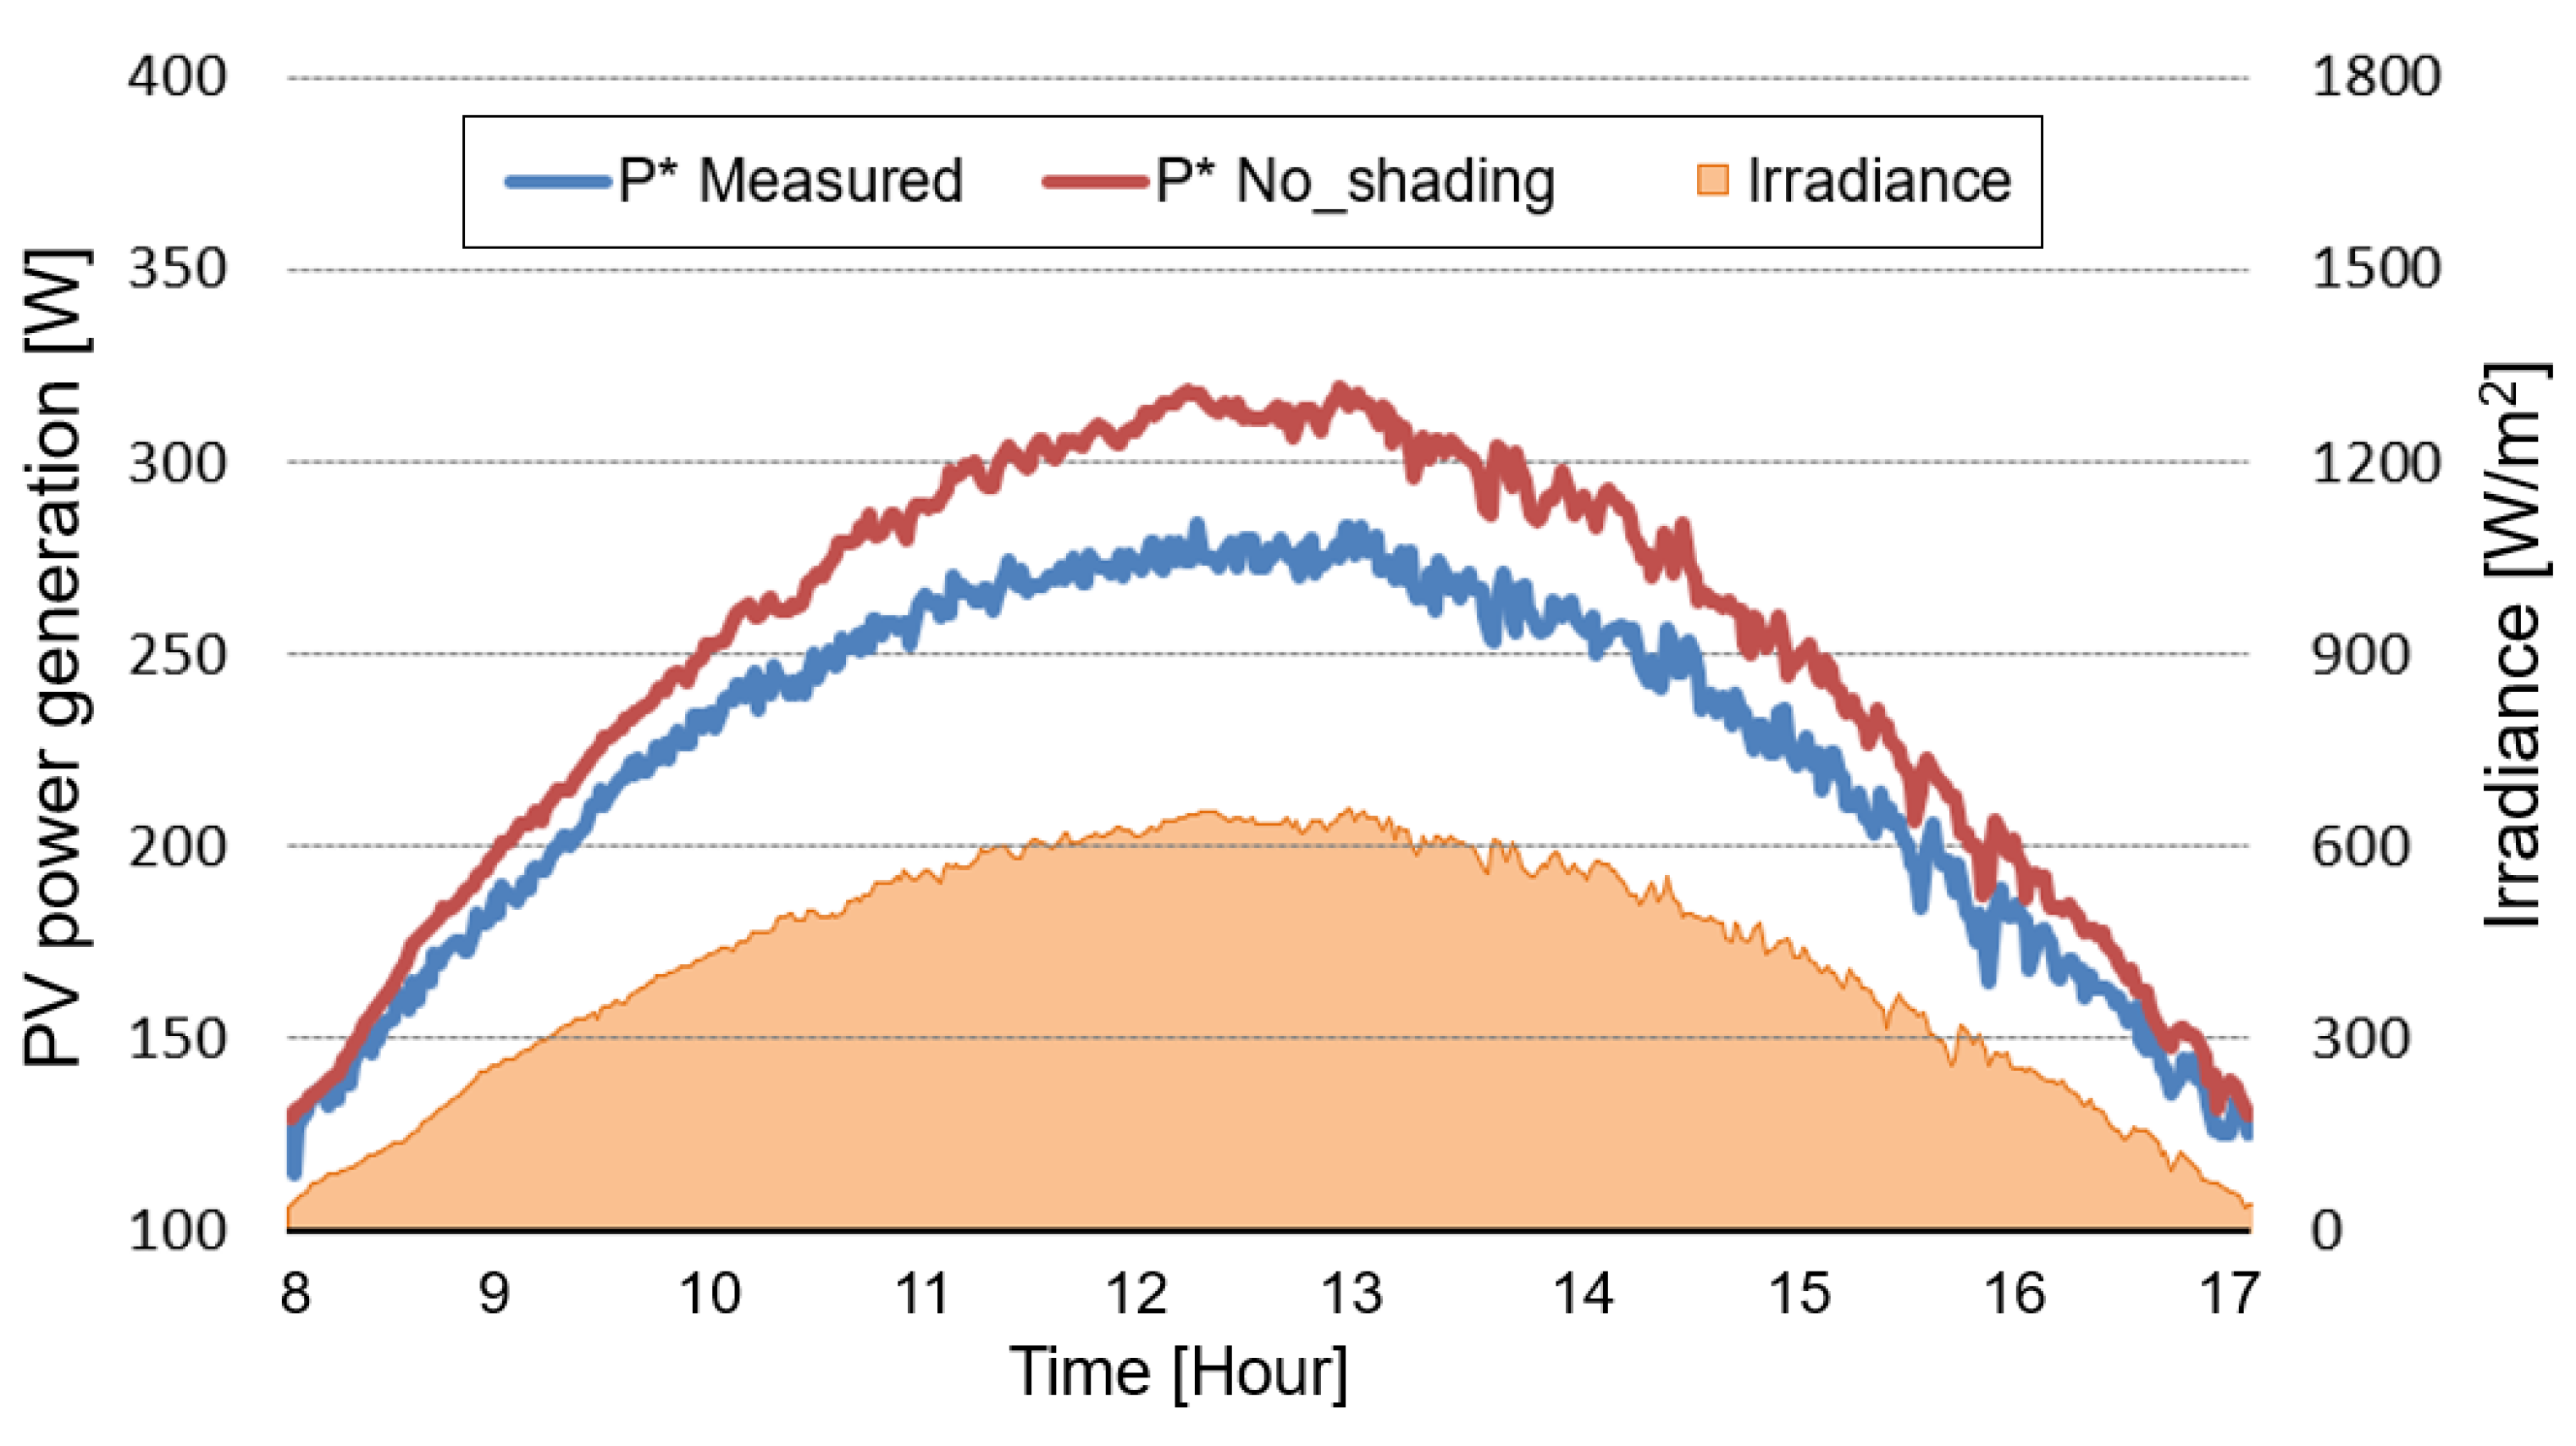
Based on the measured irradiation, the difference between the case when NE is 0.98 and actual power generation with partial shading is shown in Figure 9. At approximately 12 o’clock, when the solar altitude reached its peak, the decrease in power generation due to partial shading was the greatest, and the power generation capacity reduced by partial shading was up to 47 W. The data analysis using the measured results showed that the power generation was approximately 1.7 kWh during one day, and in the case of no shading, the power generation calculated using NE* was approximately 1.9 kWh. Therefore, the partial shading reduced power generation by approximately 12% (0.2 kWh) during one day.

3. Prediction of PV Power Generation Using Normalized Efficiency

3.1. Method of Prediction of PV System Performance of Power Generation Using Normalized Efficiency

NE ( η N ( t ) ) is calculated as a function of power generation and irradiance as in Equation (3), and Herteleer et al. [20] introduced a method of calculating NE as a function of irradiance using only the measured data.
According to the method reported by Huid et al. [26,27] and Herteleer et al. [20], NE can be calculated as follows:
η N ( G G S T C , Δ T S T C ) = 1 + k 1 · ln ( G G S T C ) + k 2   ·   [ ln ( G G S T C ) ] 2
+   Δ T S T C   · { k 3 + k 4 · ln ( G G S T C ) + k 5 · [ ln ( G G S T C ) ] 2 } + k 6 · ( Δ T S T C ) 2
When the effect from the temperature is excluded, Δ T S T C is removed and the temperature-corrected NE* ( η * N ( t ) ) can be calculated as follows as a function of irradiance G :
η * N ( t ) = 1 + k 1 · ln ( G ( t ) G S T C ) + k 2   ·   [ ln ( G ( t ) G S T C ) ] 2
where power generation P * ( t ) can be calculated using Equation (7), and when it is combined with Equation (9), it can be represented as follows:
P * ( t ) = ( 1 + k 1 · ln ( G ( t ) G S T C ) + k 2 · [ ln ( G ( t ) G S T C ) ] 2 )   · P S T C · G ( t ) G S T C
The power generation P ( t ) , reflecting the performance of the power generation of the PV system depending on the temperature, can be calculated using Equations (5) and (10) as follows:
P ( t ) =   { ( 1 + k 1 · ln ( G ( t ) G S T C ) + k 2 · [ ln ( G ( t ) G S T C ) ] 2 )   · P S T C · G ( t ) G S T C } · ( 1 + γ · Δ T S T C ( t ) )
where k 1 and k 2 are the values of the coefficient of the prediction equation with the least error with the measured value of the power generation.
There are several methods for evaluating prediction accuracy, and this study used the Coefficient of Variation of the Root Mean Squared Error (CV-RMSE) and the Mean Bias Error (MBE) to calculate the prediction error. CV (RMSE) is an indicator of precision, and the method of calculating the error between the predicted value and the measured value:
CV ( RMSE ) =   [ i = 1 n ( y ^ i y i ) 2 ( n p ) ] 1 2 / y   ¯ · 100  
where y i is simulated data using equations, and y ^ i is monitored data, n is the number of observations, y ¯ is the average of the monitored data, p is the number of adjustable model parameters, used for calibration purposes, and the value is typically 0 [28]. MBE is an average forecast error that indicates whether the prediction model is underestimated or overestimated.
MBE = 1 n i = 1 n ( y ^ i y i )  

3.2. Impact of Partial Shading Depending on Solar Altitude Angle

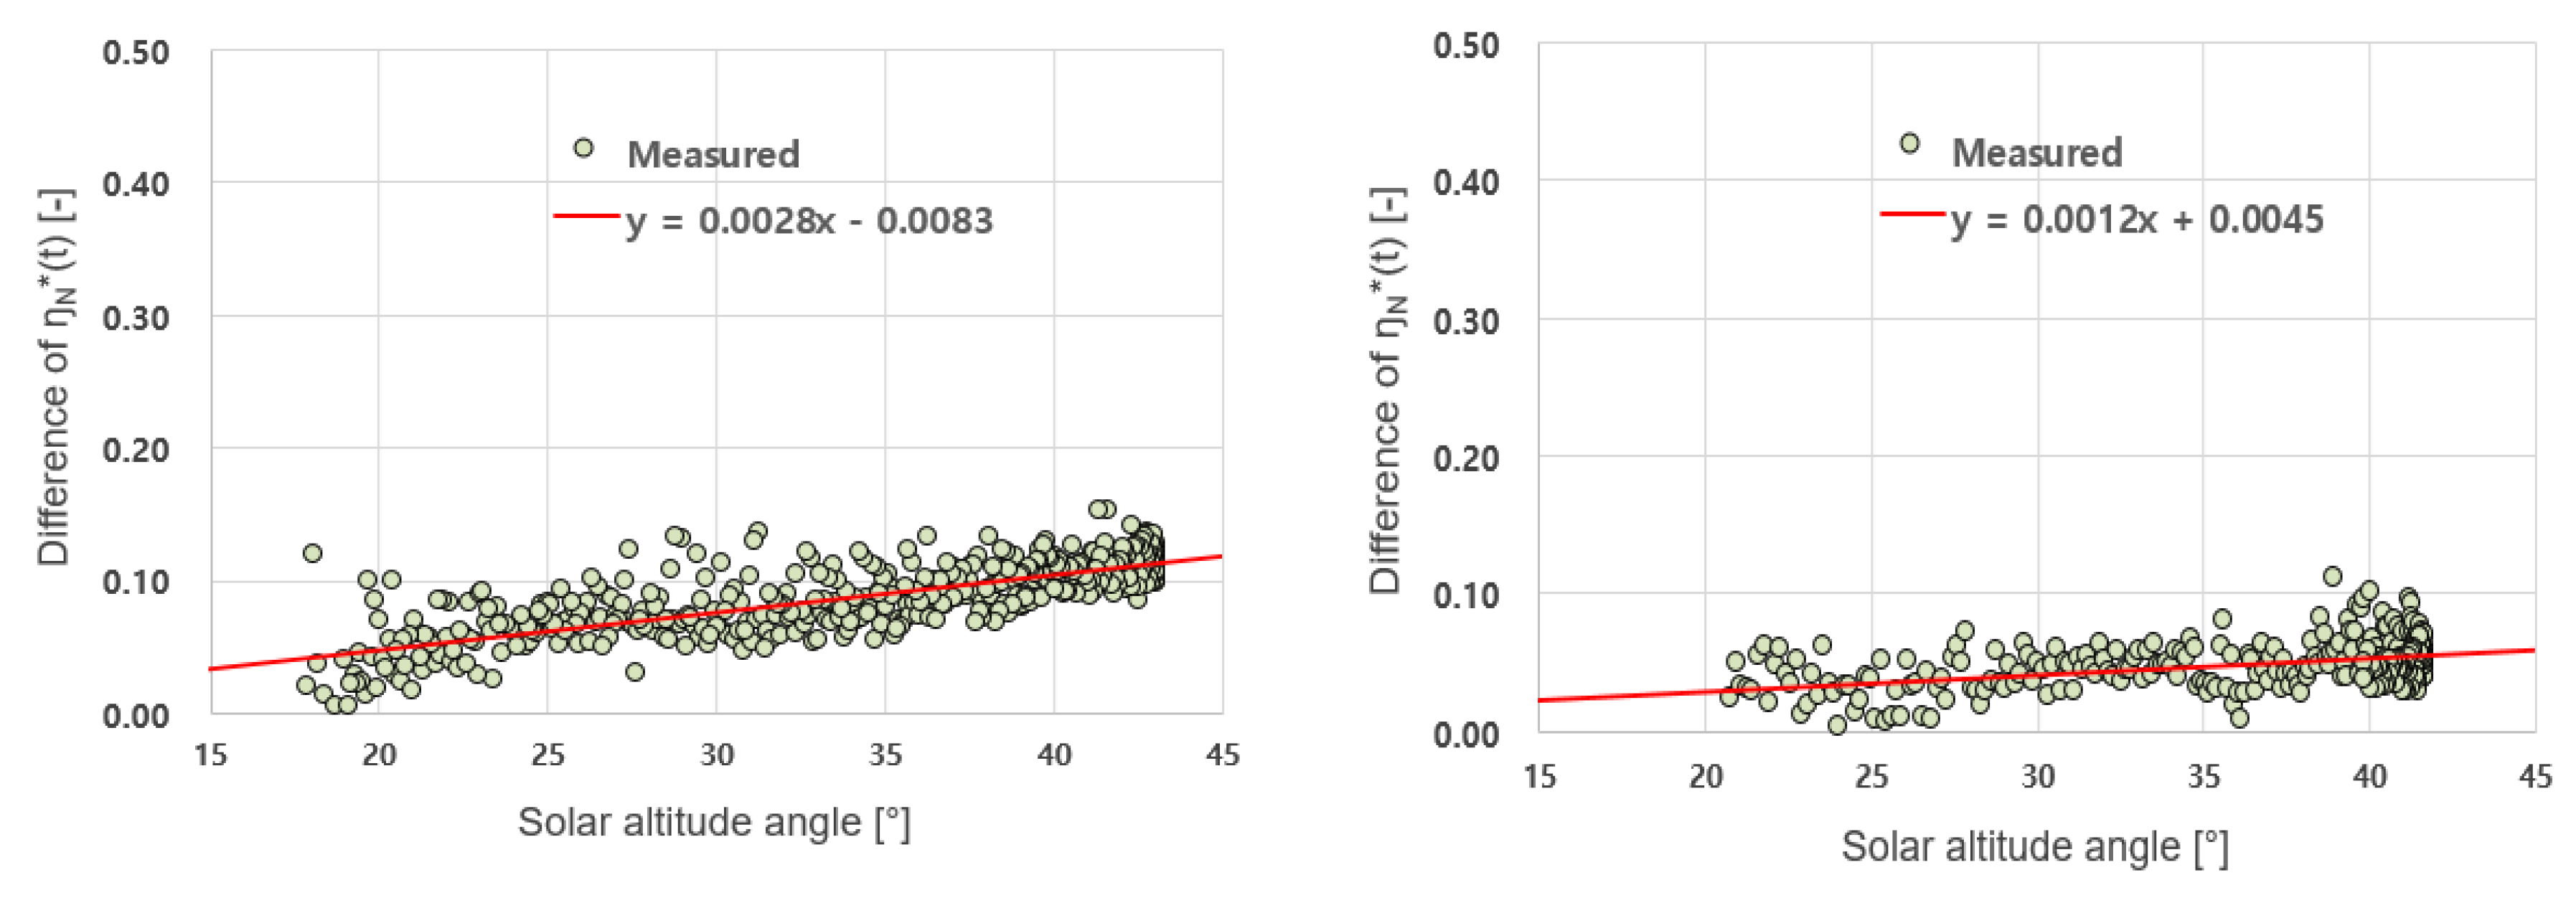
We can see that the decrease in NE* due to partial shading changes with solar position (Figure 7). Partial shading on a PV module in Figure 6 is like being shaded by a horizontal shading device. As a result, the magnitude of the shade changes according to the altitude of the sun, and eventually affects the amount of power generation. For example, partial shading occurring at the upper part of the PV is minimal in the morning when solar altitude is low, and is maximal at noon when solar altitude is at its highest. As this solar altitude increases, the NE* and the performance of the power generation of PV decrease proportionally. Figure 10 shows the difference of NE* depending on the solar altitude angle of the OBIPV system under the partial shading condition. The NE* of the partial shading condition was calculated from results based on the measured values at the operating angles of 90 and 45 degrees. The effects of partial shading were greater when the operating angle was 90 degrees. The reason was when the operating angle was 45 degrees, the PV is overhung forward, reducing the size of the partial shading compared to the case of an operating angle of 90 degrees.
As a result, the partial shading of the OBIPV system depends on the solar altitude, so the change in NE* depending on the solar altitude can be predicted by a regression analysis. The change in power generation at 90 and 45 degrees of operation angle depending on partial shading by regression analysis (Figure 8) is calculated as follows, according to the solar altitude angle ( α ):
P * 90 = { ( C + k 1 · ln ( G G S T C ) + k 2 · [ ln ( G G S T C ) ] 2 ) ( 0.0028 α 0.0083 ) }   · P S T C · G ( t ) G S T C
P * 45 = { ( C + k 1 · ln ( G G S T C ) + k 2 · [ ln ( G G S T C ) ] 2 ) ( 0.0012 α + 0.0045 ) }   · P S T C · G ( t ) G S T C
where, based on the measured power generation and irradiation, two coefficients k 1 and k 2 can be estimated. Both coefficients apply the values where the CV (RMSE) between the measured power generation and the predicted power generation, calculated by substituting a random number from −1 to 1, becomes the minimum. As k 1 and k 2 vary to some extent depending on the solar altitude angle ( α ), it is more appropriate to calculate using Equation (10), which does not take into account the partial shading.
To calculate k 1 and k 2 , Equation (11) was coded using Python, a high-level programming language, and a formula to find the input value with the lowest CV (RMSE) between the predicted and measured values was coded. The calculation method was conducted by applying the values that are equal division of 1,000 between −1 and 1 to both coefficients, and the value with the smallest CV (RMSE) was found. Therefore, the total number of calculations was 106 (one million), and the calculation time was approximately 1 min and 30 s based on a computer with a CPU of 3.4GHz. As we aimed for the accurate prediction of the power generation performance of the PV, the power generation measured when the irradiation was small, with values of less than 100 W/m2 with uneven NE*, was excluded from the estimation of CV(RMSE).
Therefore, in order to predict more accurate power generation, data measured at low irradiation should be excluded because it increases the error value CV (RMSE) when calculating k 1 and k 2 , and does not affect power generation significantly. According to the calculation result, the k 1 value of the OBIPV system was 0.07014, the k 2 value was 0.05010. The CV (RMSE) was 1.9% and MBE was 0.059. Therefore, CV (RMSE) and MBE, which are prediction errors, are very low, and it is confirmed that NE can be used to accurately predict the performance of power generation of the OBIPV system.

4. Performance Prediction of OBIPV System with Partial Shading

4.1. Validation Test of Performance of Power Generation Prediction Method Using NE

In Section 3.2, we successfully predicted the performance of power generation of the OBIPV system with partial shading on a clear day. However, because the irradiation varies depending on the weather conditions, it is necessary to perform a validation test to verify that the NE prediction method calculated in Section 3 is valid. For this purpose, the irradiation and power generation data were collected after fixing the OBIPV system operating angle at a closed angle of 90 degrees for approximately two months, in November and December. Conversely, as the study for the energy performance verification of the double skin façade system [29] was conducted simultaneously, the data available for validation were 24 days in November and 19 days in December. In addition, the irradiance applied during the validation test was calculated by reflecting IAM in the measured irradiance, and the power generation P * 90 was calculated using Equation (14).
Figure 11 shows the measured power generation ( P * m e a s u r e d ) under the partial shading condition, predicted power generation ( P * c a l c u l a t e d ) under the partial shading condition using NE*, and the predicted power generation excluding the effect of partial shading ( P * n o _ s h a d i n g ), and assuming that NE* was 0.98. As a result, the differences between P * m e a s u r e d   and P * c a l c u l a t e d were 3% and 2% in November and December, respectively. These results confirm that the power generation prediction method using NE* is sufficiently effective.
In addition, the differences in the power generation of P * c a l c u l a t e d with partial shading and P * n o _ s h a d i n g without partial shading were 8% and 6% in November and December, respectively. The reason for the higher power generation difference depending on with or without partial shading in November, is that the solar altitude is higher than in December, and the effect of partial shading is therefore greater.

4.2. Prediction of the OBIPV System Performance of Power Generation with Partial Shading

With the validity of the prediction of the performance of power generation using NE proven, this section investigated the prediction on the annual performance of power generation by the operation method of the OBIPV system using NE*. The operating method is a monthly open/close control, where the operating angle of the open state is 45 degrees, and the operating angle of the close state is 0 degrees, based on the PV installation angle of 90 degrees (Table 2). The operating angle is shown in Figure 2; the left side of the figure is open state at 45 degrees, and the right side is closed state at 0 degrees. The irradiation used to predict the performance of the OBIPV system was obtained from the IWEC2 weather file [30], distributed by the American Society of Heating, Refrigerating and Air-Conditioning Engineers (ASHRAE). The location of the weather file is Daejeon (latitude 36.37, longitude 127.37), South Korea, and is the same as the region where the OBIPV system is installed. The values of irradiation, considering IAM depending on the operating angle, are shown in Table 1. According to the monthly irradiation analysis results, the monthly operation method that can maximize the power generation is operating in the close state from November to February next year, and the open state from March to October.
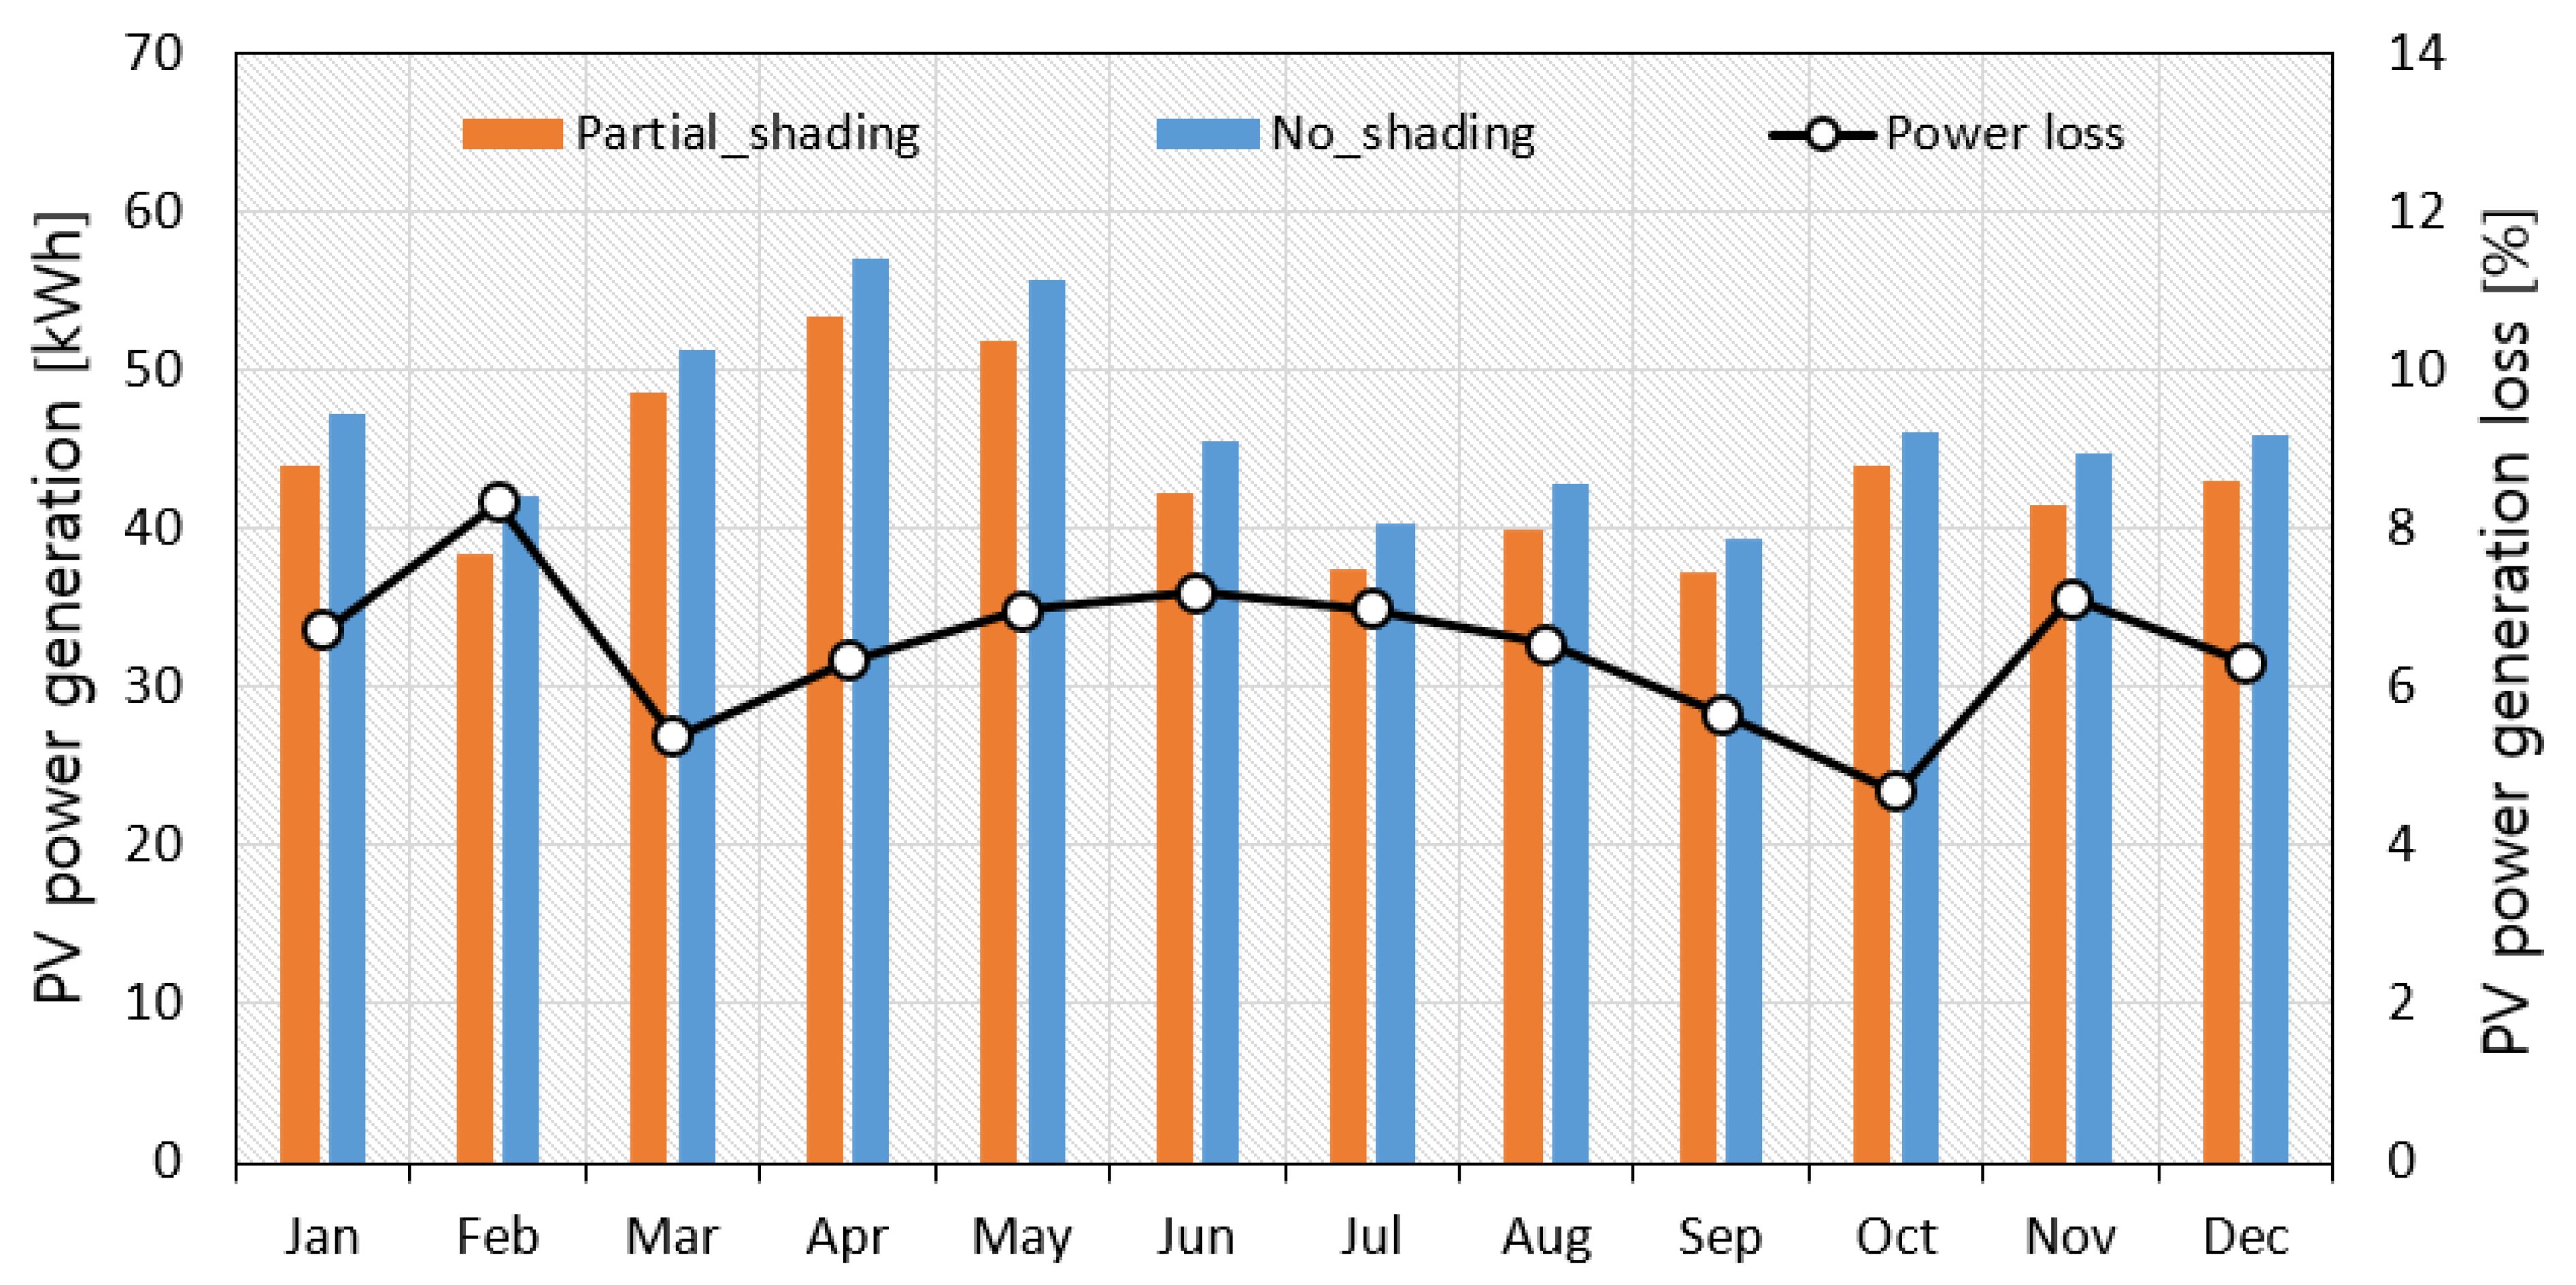
In the case of operating the OBIPV system according to the optimum operating angle (Table 2), the power generation with or without partial shading was predicted using Equations (14) and (15), and the results are shown in Figure 12. Monthly power generation reduced by the partial shading of the double skin façade overhang ranged from 5% to 8% and increased with higher solar altitude. In particular, when the operation method was in close control from January to February and from November to December, the power generation loss due to partial shading increased significantly. In contrast, when the operation method was in open control, the power generation loss was smaller.
This result is in agreement with the regression analysis (Figure 10), and can confirm the effect of partial shading depending on the operating angle. As a result of power generation evaluation using NE*, the annual power generation of the OBIPV system was 521 kWh/yr. If partial shading has not occurred, the generation is expected to be 557 kWh/yr, which will result in less electricity output of 36 kWh/yr (6.5%) per year due to the effect of partial shading.

5. Conclusions

This study introduced the temperature-corrected normalized efficiency (NE*), a performance ratio (PR)-based performance indicator, to evaluate the performance of power generation by the operation method of the Operable Building Integrated Photovoltaic system. The NE* is the ratio of the actual power generation to the power generation in the STC condition, and NE* can be used to confirm and compare the performance of the power generation of a PV system. This study evaluated the performance of each operation method using NE*, based on the performance monitoring results of the actual OBIPV system in operation. The results are as follows:
  • If the operating angle of the BIPV system was operated differently, the normalized efficiency was lower compared to the BIPV system operated at a fixed operating angle by calculating NE*. This result was because the voltage of the module decreased as the irradiance of some modules in the OBIPV system dropped, and eventually, the performance of the power generation of the entire array decreased. Therefore, by calculating NE*, we were able to determine the optimum operation method of the OBIPV system.
  • The NE* analysis of the OBIPV system found that the distribution of NE* decreased during the daytime. As a result of this investigation, it was found that partial shading was caused by the spherical structure on the upper part of the PV overhang for design purposes, and the effect of this partial shading increased in proportion to the solar altitude.
By calculating the NE* of the OBIPV system, we have confirmed the degradation of the performance of power generation of the BIPV system depending on the operation method. In the design of the OBIPV system, the performance of power generation decreased due to the unintended effect of the partial shading.
Furthermore, this study predicted the performance of the power generation of the PV system using NE* calculated from the measured data, and performed a validation test for this prediction method. Based on the validation test results, the annual performance of power generation of the OBIPV system was predicted with or without partial shading and the results are as follows:
  • The change of NE* depending on the solar altitude angle was predicted by regression analysis, and the regression analysis result was reflected in the power generation estimation method using NE*. Validation tests were performed based on measured data which were measured for two months in November and December. The differences between the measured power generation and the predicted power generation were 3% and 2% in November and December, respectively.
  • Using NE* to predict the annual performance of power generation with or without the partial shading of the OBIPV system, it is predicted that the electrical output will be reduced annually by 36 kWh/yr (6.5%) due to the effect of partial shading.
As NE* is calculated based on the measured data, it is an indicator that reflects the overall performance of the PV system which depends on the inverter performance, module performance, and the installation and configuration method of the PV system. The NE* can identify the degradation of the PV system performance by simply measuring short-term irradiance, module temperature and power generation, without detailed measurements such as an IV curve. Through NE*, it is possible to intuitively determine whether problems such as partial shading, module defect and system error have occurred. In addition to the performance of power generation that varies depending on the operation method, it is very useful as a performance evaluation indicator of the BIPV system through real-time power generation performance monitoring.
The performance of power generation calculated using NE* is worked out using the monitoring data of the actual installed PV system, so it is possible to more accurately predict the performance of power generation of the installed PV system. Although not included in this study, if the temperature of the PV is provided in the performance of the power generation prediction, it is expected that the actual power generation can be accurately predicted using Equation (11). In this study, the normalized efficiency was calculated using a simple and small BIPV system, and the accuracy of the calculation results was very high. In the future, verification of the accuracy of the normalized efficiency by applying it to a larger BIPV system will be necessary. In addition, since partial shading is highly dependent upon particular types of PV array configuration as shown in Figure 8, the prediction of the normalized efficiency under the partial shading conditions according to the PV array configuration needs to be investigated.

Author Contributions

Conceptualization, C.-s.L. and J.-h.Y.; methodology, C.-s.L. and J.-h.Y.; validation, H.-m.L. and M.-j.C.; formal analysis, H.-m.L. and M.-j.C.; investigation, C.-s.L. and M.-j.C.; data curation, H.-m.L. and M.-j.C.; writing—original draft preparation, C.-s.L.; writing—review and editing, J.-h.Y.; visualization, H.-m.L. and M.-j.C.; supervision, J.-h.Y.

Funding

This work was funded by the Korea Institute of Energy Technology Evaluation and Planning (KETEP) and the Ministry of Trade, Industry & Energy (MOTIE) of the Republic of Korea (No. 20183010013840). This research was also funded by the Technology Development Program to Solve Climate Changes of the National Research Foundation (NRF) funded by the Ministry of Science, ICT & Future Planning (2016M1A2A2936758).

Conflicts of Interest

The authors declare no conflict of interest.

References

  1. Tracking Clean Energy Progress: 2017; International Energy Agency: Paris, France, 2017.
  2. Yang, T.; Athienitis, A.K. A review of research and developments of building-integrated photovoltaic/thermal (BIPV/T) systems. Renew. Sustain. Energy Rev. 2016, 66, 886–912. [Google Scholar] [CrossRef]
  3. Belussi, L.; Barozzi, B.; Bellazzi, A.; Danza, L.; Devitofrancesco, A.; Fanciulli, C.; Ghellere, M.; Guazzi, G.; Meroni, I.; Salamone, F.; et al. A review of performance of zero energy buildings and energy efficiency solutions. J. Build. Eng. 2019, 25, 100772. [Google Scholar] [CrossRef]
  4. Biyik, E.; Araz, M.; Hepbasli, A.; Shahrestani, M.; Yao, R.; Shao, L.; Essah, E.; Oliveira, A.C.; del Cano, T.; Rico, E. A key review of building integrated photovoltaic (BIPV) systems. Eng. Sci. Technol. Int. J. 2017, 20, 833–858. [Google Scholar] [CrossRef]
  5. Kim, J.-H.; Kim, H.-R.; Kim, J.-T. Analysis of photovoltaic applications in zero energy building cases of IEA SHC/EBC Task 40/Annex 52. Sustainability 2015, 7, 8782–8800. [Google Scholar] [CrossRef]
  6. Tahri, A.; Oozeki, T.; Draou, A. Monitoring and evaluation of photovoltaic system. Energy Procedia 2013, 42, 456–464. [Google Scholar] [CrossRef]
  7. Silva, E.N.M.; Rodrigues, A.B.; da Guia da Silva, M. Stochastic assessment of the impact of photovoltaic distributed generation on the power quality indices of distribution networks. Electr. Power Syst. Res. 2016, 135, 59–67. [Google Scholar] [CrossRef]
  8. Rezk, H.; Tyukhov, I.; Al-Dhaifallah, M.; Tikhonov, A. Performance of data acquisition system for monitoring PV system parameters. Measurement 2017, 104, 204–211. [Google Scholar] [CrossRef]
  9. Whitaker, C.M.; Townsend, T.U.; Newmiller, J.D.; King, D.L.; Boyson, W.E.; Kratochvil, J.A.; Collier, D.E.; Osborn, D.E. Application and validation of a new PV performance characterization method, In proceedings of the Conference Record of the Twenty Sixth IEEE Photovoltaic Specialists Conference, Anaheim, CA, USA, 29 September–3 October 1997; pp. 1253–1256. [Google Scholar]
  10. Kurtz, S.; Newmiller, J.; Kimber, A.; Flottemesch, R.; Riley, E.; Dierauf, T.; McKee, J.; Krishnani, P. Analysis of Photovoltaic System Energy Performance Evaluation Method; Technical report No. 5200-60628; National Renewable Energy Lab. (NREL): Golden, CO, USA, 2013; pp. 1–54.
  11. Kratochvil, J.A.; Boyson, W.E.; King, D.L. Photovoltaic Array Performance Model; Sandia National Laboratories: Albuquerque, NM, USA, 2004.
  12. Touati, F.; Al-Hitmi, M.A.; Chowdhury, N.A.; Hamad, J.A.; San Pedro Gonzales, A.J.R. Investigation of solar PV performance under Doha weather using a customized measurement and monitoring system. Renew. Energy 2016, 89, 564–577. [Google Scholar] [CrossRef]
  13. Omer, S.A.; Wilson, R.; Riffat, S.B. Monitoring results of two examples of building integrated PV (BIPV) systems in the UK. Renew. Energy 2003, 28, 1387–1399. [Google Scholar] [CrossRef]
  14. Mellit, A.; Tina, G.M.; Kalogirou, S.A. Fault detection and diagnosis methods for photovoltaic systems: A review. Renew. Sustain. Energy Rev. 2018, 91, 1–17. [Google Scholar] [CrossRef]
  15. Salem, T.; Kinab, E. Analysis of building-integrated photovoltaic systems: A case study of commercial buildings under mediterranean climate. Procedia Eng. 2015, 118, 538–545. [Google Scholar] [CrossRef]
  16. Lee, H.M.; Yoon, J.H.; Kim, S.C.; Shin, U.C. Operational power performance of south-facing vertical BIPV window system applied in office building. Sol. Energy 2017, 145, 66–77. [Google Scholar] [CrossRef]
  17. Bingöl, O.; Özkaya, B. Analysis and comparison of different PV array configurations under partial shading conditions. Sol. Energy 2018, 160, 336–343. [Google Scholar] [CrossRef]
  18. Daliento, S.; Chouder, A.; Guerriero, P.; Pavan, A.M.; Mellit, A.; Moeini, R.; Tricoli, P. Monitoring, Diagnosis, and Power Forecasting for Photovoltaic Fields: A Review. Int. J. Photoenergy 2017, 2017, 1–13. [Google Scholar] [CrossRef]
  19. Herteleer, B.; Huyck, B.; Catthoor, F.; Driesen, J.; Cappelle, J. Normalised efficiency of photovoltaic systems: Going beyond the performance ratio. Sol. Energy 2017, 157, 408–418. [Google Scholar] [CrossRef]
  20. IEC 61724-1:2017. Photovoltaic System Performance—Part 1: Monitoring; CENELEC: Brussels, Belgium, 2017. [Google Scholar]
  21. Timothy, D.; Growitz, A.; Kurtz, S.; Cruz, J.L.B.; Riley, E.; Hansen, C. Weather-Corrected Performance Ratio; Technical Report No. 5200-57991; National Renewable Energy Laboratory (NREL): Golden, CO, USA, April 2013.
  22. van Sark, W.; Nordmann, T.; Clavadetscher, L.; Green, M. Analysis of Long-Term Performance of PV Systems; International Energy Agency: Paris, France, 2014. [Google Scholar]
  23. Ishaque, K.; Salam, Z. A review of maximum power point tracking techniques of PV system for uniform irradiation and partial shading condition. Renew. Sustain. Energy Rev. 2013, 19, 475–488. [Google Scholar] [CrossRef]
  24. Duffie, J.A.; Beckman, W.A. Solar Engineering of Thermal Processes, 4th ed.; Wiley: Hoboken, NJ, USA, 2013. [Google Scholar]
  25. Ramaprabha, R.; Mathur, B.L. A comprehensive review and analysis of solar photovoltaic array configurations under partial shaded conditions. Int. J. Photoenergy 2012, 1–16. [Google Scholar] [CrossRef]
  26. Huld, T.; Gottschalg, R.; Beyer, H.G.; Topič, M. Mapping the performance of PV modules, effects of module type and data averaging. Sol. Energy 2010, 84, 324–338. [Google Scholar] [CrossRef]
  27. Huld, T.; Friesen, G.; Skoczek, A.; Kenny, R.P.; Sample, T.; Field, M.; Dunlop, E.D. A power-rating model for crystalline silicon PV modules. Sol. Energy Mater. Sol. Cells 2011, 95, 3359–3369. [Google Scholar] [CrossRef]
  28. Ramos, G.; Bandera, C. Validation of calibrated energy models: Common errors. Energies 2017, 10, 1587. [Google Scholar]
  29. Lee, C.; Lee, H.; Choi, M.; Yoon, J. Design optimization and experimental evaluation of photovoltaic double skin facade. Energy Build. 2019, 109314. [Google Scholar] [CrossRef]
  30. ASHRAE IWEC2 Weather Files for International Locations. Available online: http://ashrae.whiteboxtechnologies.com/IWEC2 (accessed on 15 April 2019).
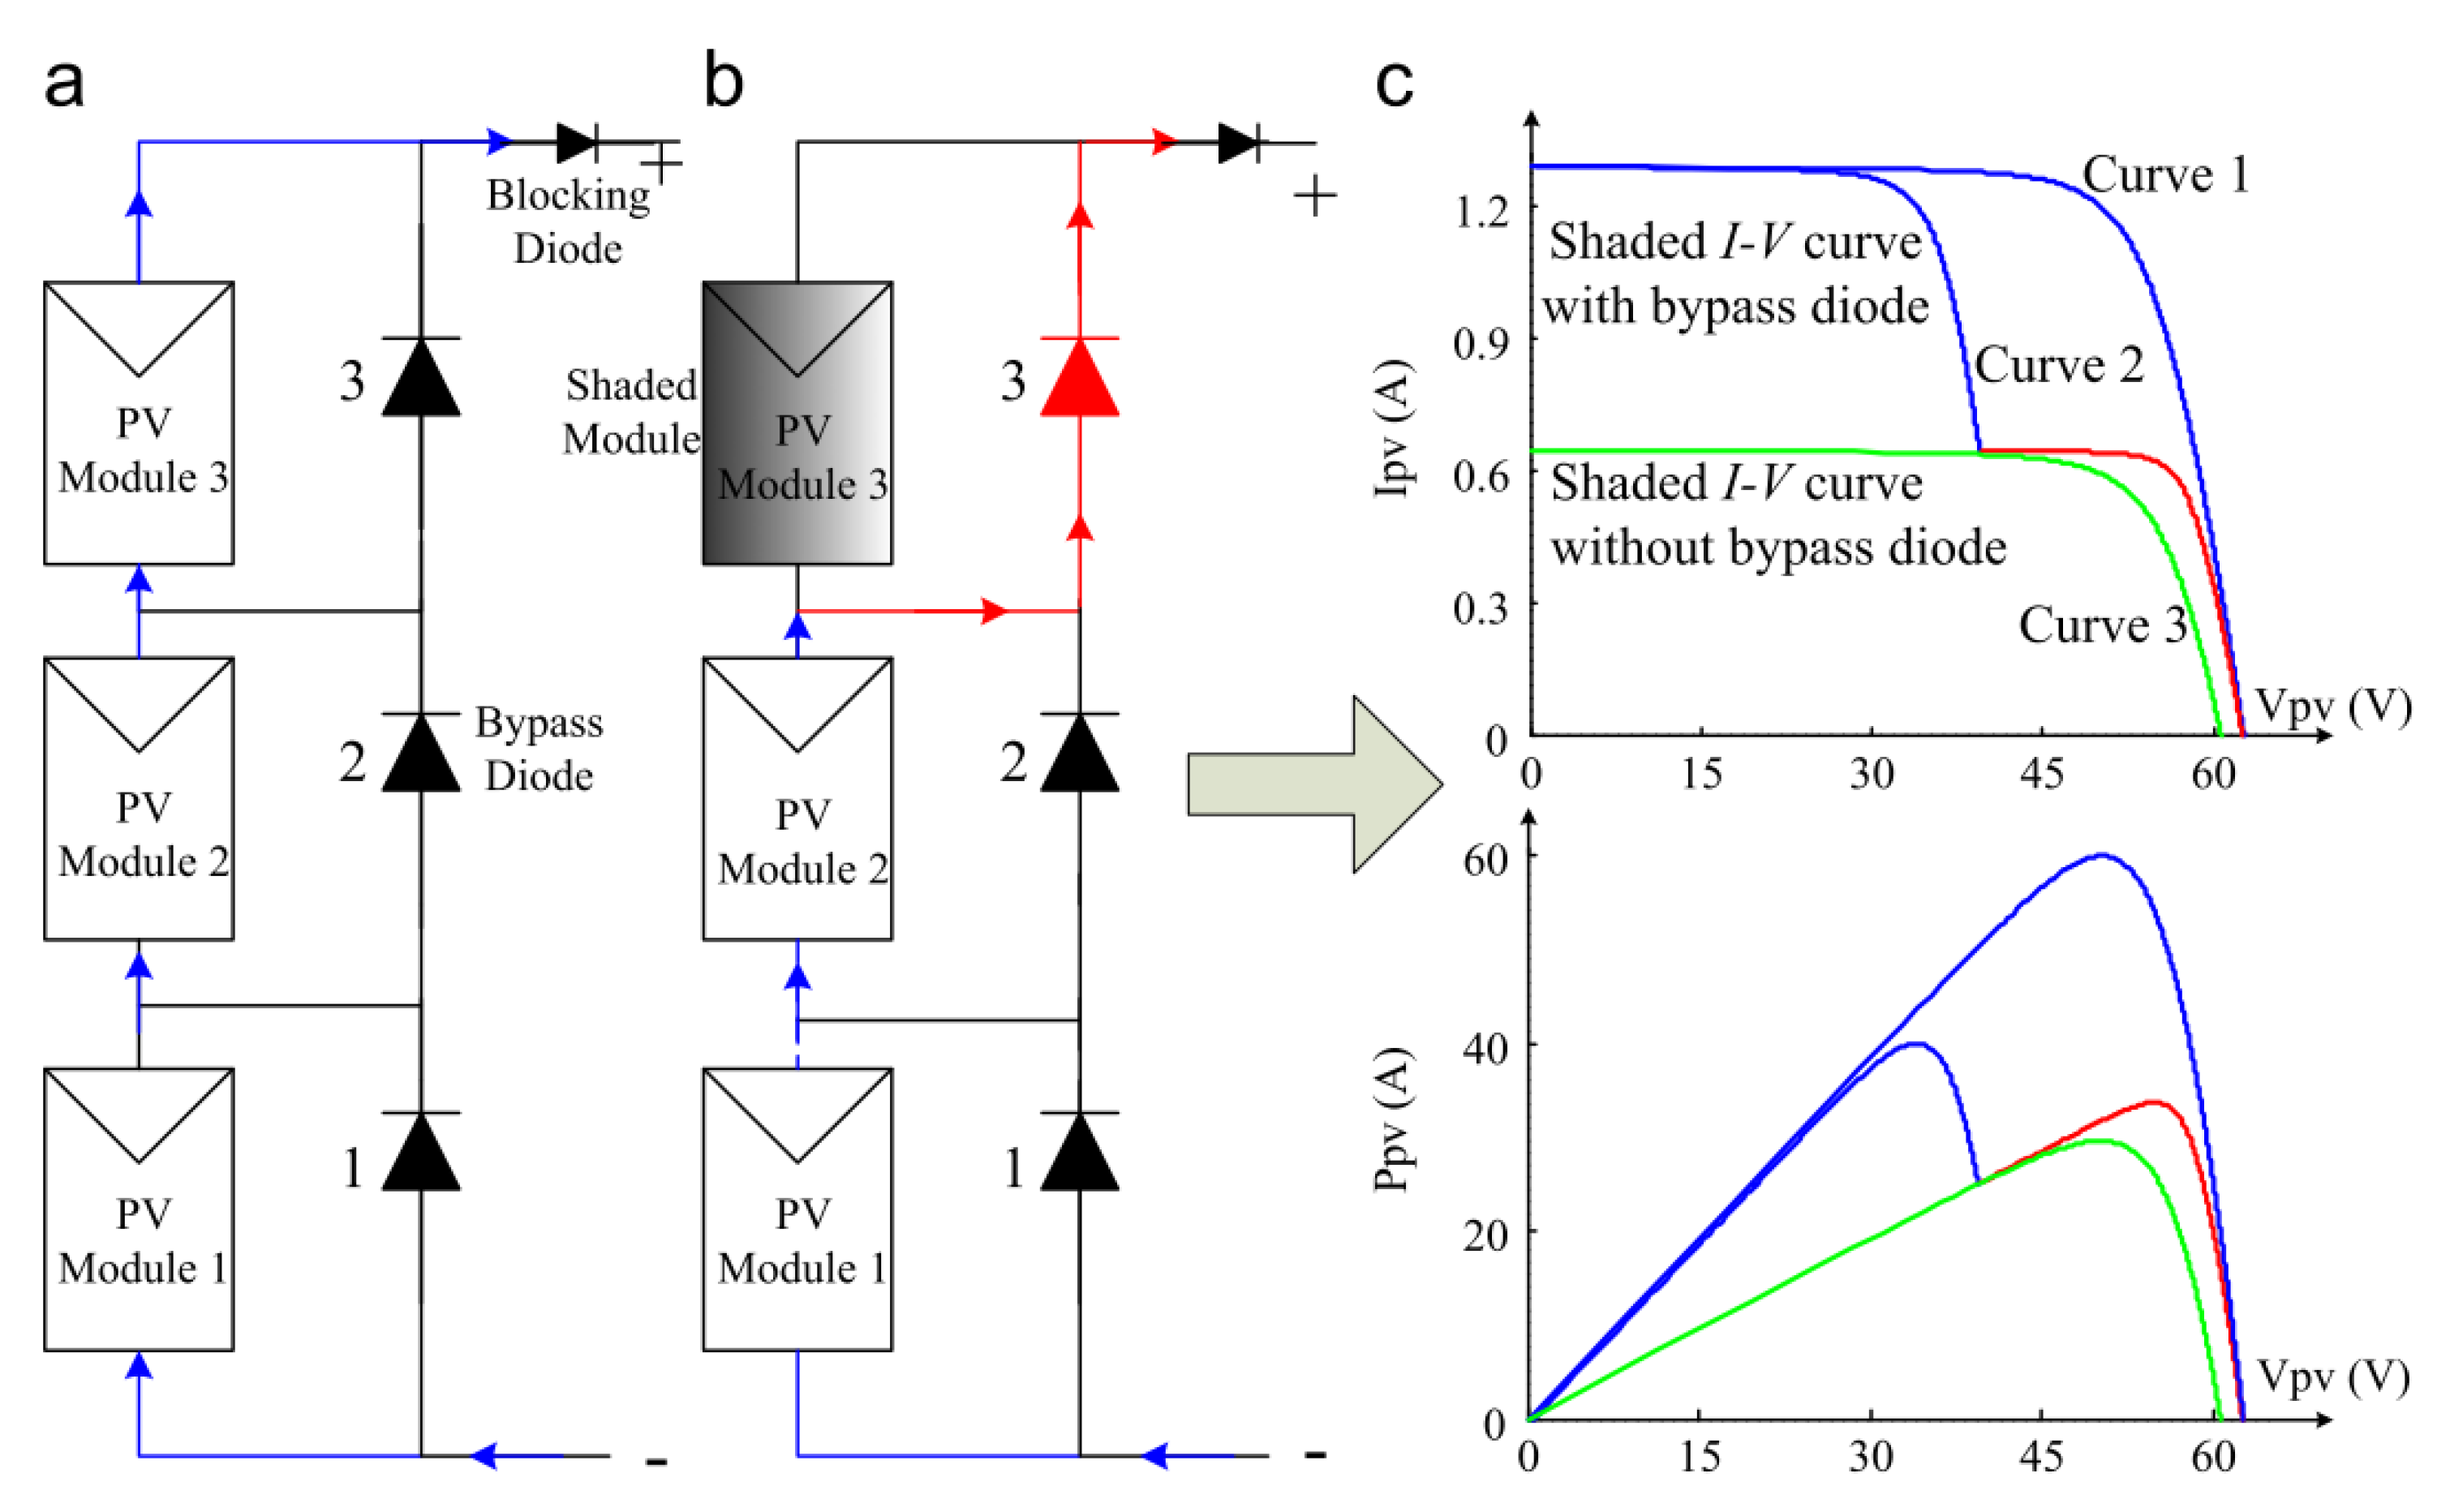
Figure 1. Photovoltaic (PV) array operation state (normal condition (a), occurrence of partial shading (b)), I–V curve and P–V curve for each case (c) with and without partial shading [23].
Energies 12 03777 g001
Figure 2. Double skin façade system with Building Integrated Photovoltaic (BIPV) vent window.
Energies 12 03777 g002
Figure 3. The geographical indication of the measurement site for the performance evaluation of the Operable Building Integrated Photovoltaic (OBIPV) system.
Energies 12 03777 g003
Figure 4. Power output and normalized efficiency (NE) of OBIPV systems depending on the irradiance level. The maker color represents the temperature of the PV module.
Energies 12 03777 g004
Figure 5. Temperature coefficient of the OBIPV systems calculated from measured data.
Energies 12 03777 g005
Figure 6. Partial shading occurrence region of the OBIPV window indicated by the red dotted line.
Energies 12 03777 g006
Figure 7. The difference in NE* by the operation method of the OBIPV system. Continuous line (──) indicates irradiance measured when all operating angles are 90 degrees; The dotted line (- - -) indicates irradiance measured at each angle when two operating angle of 45 degrees and 90 degrees are applied.
Energies 12 03777 g007
Figure 8. Schematic diagrams of the PV array configuration [25].
Energies 12 03777 g008
Figure 9. Predicted hourly PV power generation without partial shading using NE* (P* No_shading) and measured PV power generation under partial shading condition (P* Measured).
Energies 12 03777 g009
Figure 10. Difference of NE* depending on solar altitude angle caused by partial shading: Operating angle 90 degrees (left), operating angle 45 degrees (right).
Energies 12 03777 g010
Figure 11. Validation test result of the PV system performance of power generation prediction using NE.
Energies 12 03777 g011
Figure 12. Annual power generation evaluation results of the OBIPV system with and without partial shading.
Energies 12 03777 g012
Table 1. Sensor and equipment specifications used to measure irradiance and PV temperature.
Measurement ItemEquipment (Manufacturer)Specifications
IrradianceSMP11 (Kipp & Zonen)Classification to ISO 9060: Secondary standard
Spectral range: 285 nm to 2800 nm
Output range: −200 to 2000 W/m2
Temperature dependence of sensitivity: <1%
TemperatureT-type thermocoupleTemperature range: −270 °C to 370 °C
Accuracy: ±1.0 °C
Data loggerGL840 (Graphtec)Input voltage range: 20mV to 100 V
Accuracy: ±0.1% voltage, ±1.55 °C temperature
Table 2. Monthly irradiation (kWh / m2) and optimum operating angle according to the operating angle
JanFebMarAprMayJunJulAugSepOctNovDec
Close11098101947860556469103104107
Open96961191321291049298901079491