Abstract
Composite bucket foundation (CBF) is an environmentally friendly form of offshore wind power foundation. By virtue of the air-floating subdivision structure in the bucket, the foundation has a self-floating characteristic and can allow for long-distance air-floating towing and transport. In this study, first, a numerical analysis was performed on the towing motion characteristics of CBF, and the formula for foundation stability was deduced; then, we probed into the variation rules of the natural period of the foundation with draft and analyzed the response amplitude operator (RAO) responses, added mass coefficients, radiation damping coefficients, and exciting forces (moments) of the composite bucket foundation under different drafts and different wave directions. Finally, we clarified the basic hydrodynamic characteristics of the composite bucket foundation in the frequency domain and adopted multiple random wave models to investigate the effects of different wave heights, periods, and spectral peak factors on the towing motion characteristics of composite bucket foundation.
1. Introduction
Wind energy is a clean and renewable energy source, which is receiving increasing attention from all over the world. Particularly, offshore wind power has become a hot spot in research and application in recent years. In the construction process of offshore wind farms, the cost of foundations accounts for approximately 25% of the total investment [1]. As the specifications of wind turbines become larger and the depth of water is deeper, the safety requirements of infrastructure are higher. The offshore wind turbine foundation is subjected to large horizontal forces and large bending moments. Its main infrastructure forms include a gravity foundation, single pile foundation, jacket foundation, bucket foundation, and floating foundation. Among them, the bucket foundation is favored for its relatively low material and installation costs. Tianjin University and Jiangsu Daoda Company developed a new type of bucket foundation structure—a composite bucket foundation (CBF) [2]. The CBF consists of a steel cylinder, a concrete top cover, and a prestressed concrete transition. Its characteristics include onshore batched prefabrication, offshore air-floating transportation, rapid construction, low cost, high reliability, and good durability [3,4,5].
The composite bucket foundation is a “wide and shallow”-type foundation structure. The bucket foundation has self-floating stability mainly due to the fact of its special subdivision structure. The compression of the air cushion in the subdivision structure with the bottom opening produces an air pressure, which further displaces the water, creating a water pressure difference between the inside and outside of the bucket and provides a floating force. The floating force then realizes wet towing to the designated construction site via air floatation. In studies on the air-floating towing of a bucket foundation structure system, one of the critical issues lies in accurately assessing its hydrodynamic coefficients and forecasting its hydrodynamic performance in waves. In marine engineering, air-floating structures reduce overall draft through increasing inflating volume. Air-floating structures are different from solid floating bodies; for example, in the towing process, they may produce a substantial dynamic effect under waves and other environmental loads [6,7].
Foreign studies on air-floating structures began in the 1980s. Seidl [8] first proposed the conceptual design of air-floating structures and carried out model tests. The airbag coefficient is introduced to describe the compressed air effect of a structure supported by a single air cushion and a multi-air cushion.
In terms of the towing motion characteristics of air-floating structures, Kaplan et al. [9], Nakos et al. [10], and Miulijn [11] proposed different methods for calculating the motion characteristics of high-speed moving air-floating structures. Pinkste et al. [12,13,14] studied the motion of a part of the air cushion support and the complete air cushion support structure in the wave by the three-dimensional diffraction-radiation theory. These results are in good agreement with the results of the model test conducted by Tabeta [15]. In addition, Lee et al. [16] and Newman [17] calculated and described the disturbances in the air cushion and studied the resonant frequency of the gas in the air cushion. Cheung et al. [18] simulated the compressibility of the subdivision air of a floating platform with springs in numerical simulation and offered a new idea for the numerical simulation of air-floating structures. Malenica and Zala [19] extended Pinkste’s method and calculated and analyzed the hydrodynamic coefficients of air-floating structures. Gueret and Hremans [20,21] extended the work of Malenica and Zala and analyzed the heave hydrodynamic coefficients and internal free-surface changes of the air cushion structure under the zero-speed regular wave by the boundary integral equation method. Thiagarajan et al. [22] explored the wave responses of air-floating structures in shallow water by theoretical analysis and model test. Koo et al. [23] probed the effect of air pressure and damping on structural motion and wave propagation through decomposing non-linear free surfaces and acceleration potential. He et al. [24] mainly focused on the motion responses and air pressure variations of the asymmetric breakwater of a cabin under regular waves. With regard to the small-dip floating stability of air-floating structures, Bie et al. [25] put forward an air-floating force reduction factor to embody the differences between the air-floating structures and solid floating bodies in buoyancy variations during motion. Ding et al. [26] and Zhang et al. [27] studied the towing force variations of three-bucket, four-bucket, and bucket foundations in the towing process.
The bucket foundation is subjected to heave, roll, and pitch motion during the towing process. Not only is the structure itself moving, but a certain amount of water near the foundation also moves with the structure, and the quality of this part of the water is called additional mass. Due to the viscous effect between water and structure, the vibration of the structure is accompanied by corresponding radiation damping, which plays an important role in the movement of the bucket foundation during the movement. However, in the existing research, the theory and research on the controllable reference of the hydrodynamic parameters of the air-cushion floating bucket foundation are relatively few.
Following the 3D potential flow theory, this paper first probes into the hydrodynamic characteristics of composite bucket foundation; after that, using Moses software (Bentley Systems, Incorporated, Exton, USA), it analyzes the response amplitude operator (RAO) responses, adds mass coefficients, damping coefficients, exciting forces (moments), and other hydrodynamic parameters of prototype bucket foundation under different drafts within different period ranges; finally, it adopts multiple random wave models to investigate the effects of different wave heights, periods, and spectral peak factors on the towing motion characteristics of composite bucket foundation.
2. Stability Analysis on Composite Bucket Foundation
2.1. Stability Analysis
As shown in Figure 1, under the action of external forces in still water, composite bucket foundation inclines by an angle, after which the application points of buoyancy and gravity are no longer on the same plumb line. In this case, buoyancy and gravity produce a restoring moment, restoring the bucket foundation to the initial balance position. During towing in the ocean, composite bucket foundation inclines or even overturns under the combined action of offshore wind, current, and waves, mainly due to the relationship among the water–air ratio inside composite bucket foundation and foundation stability.
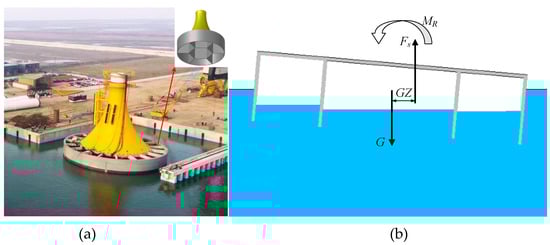
Figure 1.
Schematic diagram of the composite bucket foundation (CBF) under incline: (a) Engineering prototype; (b) Force distributing diagrammatic sketch
Calculating the initial stability of composite bucket foundation is to solve its metacentric height (h) in still water according to Equations (1) and (2):
The restoring moment produced can be calculated according to Equations (3) and (4):
where and denotes the metacentric heights of the structure in heeling and trimming, respectively; and denotes the coordinates of the center of gravity and the center of buoyancy in the Z direction; and denotes the stability radii of the structure in heeling and trimming; denotes the displacement of CBF (tons); and and denotes the rotation angles of the structure in heeling and trimming.
In inclination, CBF produces a restoring moment, the ability of which to resist foundation inclination can be expressed by the relationship between the restoring arm GZ and inclination angle . When CBF has a small dip, the relationship between the restoring arm and initial stability height can be calculated by Equations (5) and (6):
When CBF has a large dip, the relationship between the restoring arm and inclination angle can be calculated by Equations (7) and (8):
where denotes the position of the center of buoyancy in this inclination state; denotes the height of the center of gravity in this inclination state.
When impacted by gusts and huge waves during offshore towing, CBF may incline under the action of external moments, and inclination produces an angular velocity. In this case, the stability of CBF cannot be measured by static stability, thus necessitating the study of its dynamic stability. When CBF produces a heeling angle and trimming angle , the work applied by the restoring moment can be calculated according to Equations (9) and (10):
where denotes the dynamic stability arm of heeling; denotes the dynamic stability arm of trimming; the curve of varying with is called the dynamic stability curve of heeling; the curve of varying with is called the dynamic stability curve of trimming.
2.2. Natural Period
Figure 2 shows the Moses model established for prototype CBF. The first step was to adjust the water–air ratio in the room, followed by adjusting the interior and exterior drafts of the model. Table 1 provides the parameter settings of the water–air ratio and the interior and exterior drafts after balance.
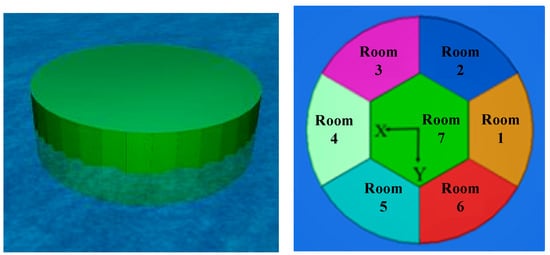
Figure 2.
Model for the prototype CBF in Moses.

Table 1.
Parameter settings of the prototype CBF in Moses.
Moses was used to calculate the response amplitude operators (RAOs) of the prototype CBF in the pitching direction under different drafts (wave direction = 0°), as shown in Figure 3. In the pitching direction, the period corresponding to the RAO amplitude was the natural period of the model in this direction. As indicated by the comparison with the natural period in the pitching direction in the model test, the natural period calculated by Moses was greater than the test result; however, the difference among them fell within the ±10% range (as shown in Figure 4).
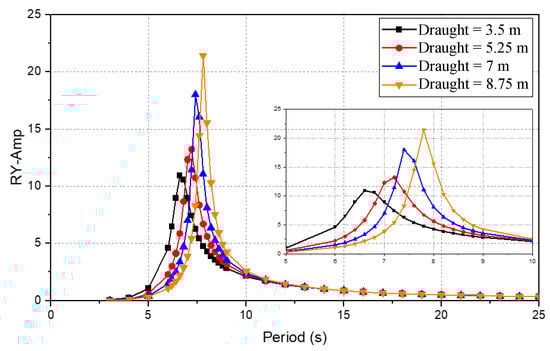
Figure 3.
The response amplitude operators (RAOs) in the pitching direction under different drafts.
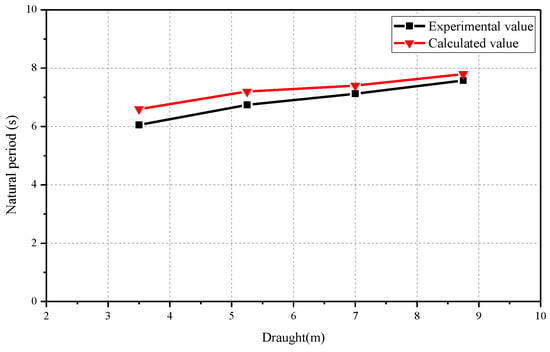
Figure 4.
Results verification of the natural period of pitching in Moses.
3. Hydrodynamic Characteristics of CBF
3.1. RAO
The RAO responses of the CBF under different drafts, different wave directions, and different wave periods were investigated according to the 3D potential flow theory. When exploring the RAO motion responses of the CBF, the first step was to analyze the effect of draft variations on the RAO responses under different wave periods, followed by analyzing the effect of wave direction variations on the RAO responses under different wave periods.
3.1.1. Effect of Draft on RAO
After selecting the head wave direction (wave direction = 0°), the RAO responses of CBF in surging/swaying, heaving, pitching, and rolling directions were simulated under the drafts of 3.5, 5.25, 7, and 8.75 m, as shown in Figure 5.
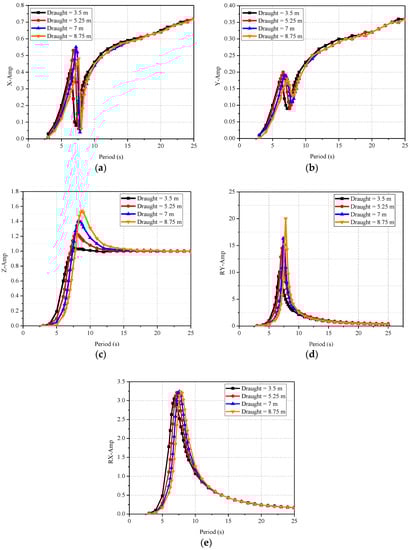
Figure 5.
Effect of draft on RAO: (a) RAO response in the surging direction; (b) RAO response in the swaying direction; (c) RAO response in the heaving direction; (d) RAO response in the pitching direction; (e) RAO response in the rolling direction.
As shown in Figure 5, in the head wave direction, the RAOs of the CBF in surging/swaying, heaving, pitching, and rolling directions were all related to the foundation draft, and fluctuated sharply within the wave period of 6–9 s; besides, when the wave period exceeded 15 s, the RAOs of the CBF in surging/swaying, heaving, pitching, and rolling directions were independent of draft variations. With increasing foundation draft, the wave periods corresponding to the RAO amplitudes of the CBF in the surging/swaying, heaving, and rolling/pitching directions slightly increased; the RAO amplitudes in surging/swaying and rolling directions showed no obvious variations with increasing draft, while those in heaving and pitching directions gradually increased with increasing draft.
3.1.2. Effect of Wave Direction on RAO
Referring to the on-site towing scheme, after the draught is 7 m and the wave direction is set to 0°, 30°, 60°, 90°, 120°, 150° and 180°, the RAO responses of CBF in surging/swaying, heaving, pitching, and rolling directions were simulated, as detailed in Figure 6.
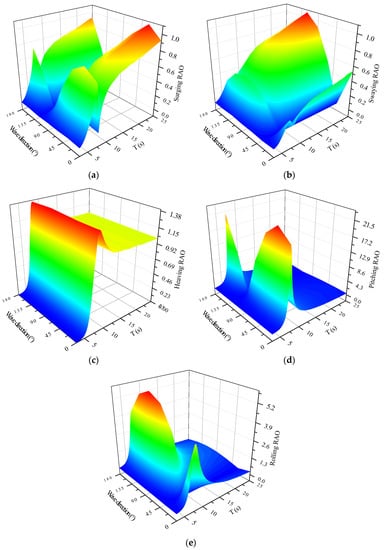
Figure 6.
Effect of wave direction on response amplitude operator (RAO): (a) RAO response in the surging direction; (b) RAO response in the swaying direction; (c) RAO response in the heaving direction; (d) RAO response in the pitching direction; (e) RAO response in the rolling direction.
As shown in Figure 6, the periods corresponding to the RAO amplitudes in different directions were independent of wave direction. In the case of surging RAO, when the wave direction was equal to 30°, the surging RAO was greater than that in other wave directions; when wave direction = 120°, the surging RAO was the minimum. In the case of swaying RAO, when the wave direction = 120°, the swaying RAO was greater than that in other wave directions; when the wave direction = 30°, the swaying RAO was the minimum. The heaving RAO was found to be independent of wave direction, and the wave period corresponding to the heaving RAO amplitude was T = 8.4 s. In the case of pitching RAO, when the wave direction = 30°, the pitching RAO was greater than that in other wave directions; when the wave direction = 30°, the pitching RAO was the minimum. In the case of rolling RAO, when the wave direction = 120°, the rolling RAO was greater than that in other wave directions; when the wave direction = 30°, the rolling RAO was the minimum.
3.2. Added Mass Coefficients
In the course of motion in an ideal fluid, CBF drives surrounding fluids to move with it, and the latter apply an inertia force on composite bucket fluid (equivalent to the inertia force produced by a mass added on the mass of the object itself). Added mass coefficient is defined as the ratio of such added mass to the total mass of the CBF (including the water in the room), and its mass coefficient is a 6 × 6 matrix, and the six added mass coefficients of the diagonal lines are the main object of this study. However, because of the symmetry of the foundation, surging and swaying have the same added mass coefficient, and pitching and rolling have the same added mass coefficient. For CBF, the focus is placed on the added mass coefficients in surging, heaving, and pitching directions, as shown in Figure 7.
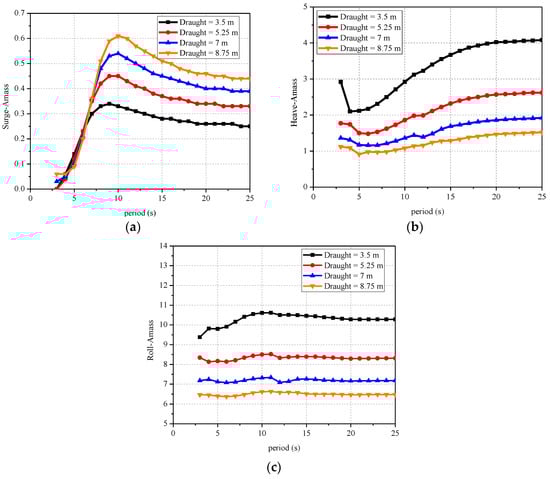
Figure 7.
Effect of draft on the added mass coefficients: (a) Added mass coefficient of surging (swaying); (b) Added mass coefficient of heaving; (c) Added mass coefficient of pitching (rolling).
As shown in Figure 7, the added mass coefficients of the CBF in surging/swaying, heaving, rolling, and pitching directions were related to the foundation draft and wave period. Taking the draft of 3.5 m as an example, the additional mass coefficient of the surging (swaying) of the structure first increased and then decreased with the increase of the period, and the period of the maximum amplitude was about 8 s. The deeper the foundation draft, the higher the amplitude of the added mass coefficient in the surging (swaying) direction, and the longer the wave period corresponding to the maximum amplitude; the period range corresponding to the maximum amplitude was 8–10 s. The deeper the foundation draft, the lower the amplitude of the added mass coefficient in the heaving direction. Under the same draft, when the wave period was shorter than 5 s, the added mass coefficient in the heaving direction presented a decreasing trend with wave period; when the wave period was longer than 5 s, the added mass coefficient in the heaving direction gradually increased with wave period, and slowly approached a constant value. The deeper the foundation draft, the smaller the added mass coefficient in the rolling (pitching) direction. Under the same draft, when the wave period was shorter than 6 s, the added mass coefficient in the rolling (pitching) direction presented a decreasing trend with wave period; when the wave period was within the range 6–11 s, the added mass coefficient in the heaving direction gradually increased with wave period; when the wave period was longer than 11 s, the added mass coefficient in the rolling (pitching) direction declined slightly and slowly approached a constant value.
3.3. Radiation Damping Coefficients
Radiation damping coefficient is defined as the ratio of radiation damping to the total mass of CBF (including the water in the room) and is a 6 × 6 matrix. The six radiation damping coefficients of the diagonal lines were the main object of this study. However, because the symmetry of the foundation, surging, and swaying has the same radiation damping coefficient, and pitching and rolling have the same radiation damping coefficient. For CBF, the focus was placed on the radiation damping coefficients in surging, heaving, and pitching directions, as shown in Figure 8.
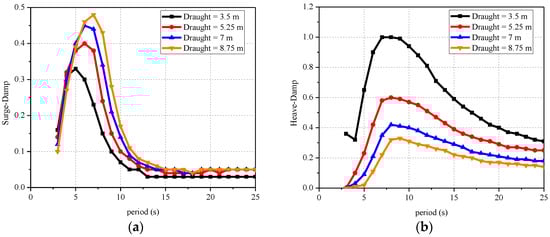
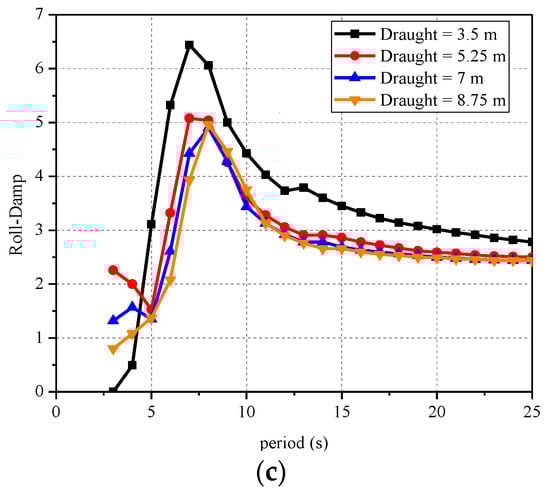
Figure 8.
Effect of draft on damping coefficients: (a) Radiation damping coefficient of surging (swaying); (b) Radiation damping coefficient of heaving; (c) Radiation damping coefficient of pitching (rolling).
As shown in Figure 8, the damping coefficients of the CBF in surging/swaying, heaving, and rolling/pitching directions were all related to the foundation draft and wave period. Taking the draught of 3.5 m as an example, the variation of the motion damping coefficient of the structure in all directions was consistent. It first increased and then decreased with the increase of the period, and the maximum occurred within the wave period of 6–9 s. With increasing foundation draft, the wave periods corresponding to the damping coefficient amplitudes of the CBF in surging/swaying, heaving, and rolling/pitching directions gradually increased; the damping coefficient amplitude in the surging/swaying direction increased with increasing draft; the damping coefficient amplitude in heaving and rolling/pitching directions gradually decreased with increasing draft.
3.4. Exciting Force
The exciting force of the CBF consisted of the Froude–Krylov force produced by the variable water pressure of the incident wave undisturbed by floating bodies and the diffraction force produced by waves when encountering floating bodies. In analyzing the exciting force of CBF, it is necessary to first analyze the effect of draft variations on the exciting forces under different wave periods, followed by analyzing the effect of wave direction variations on the exciting forces under different wave periods.
3.4.1. Effect of Draft on Exciting Force
After selecting the head wave direction (wave direction = 0°), the exciting forces (moments) of the CBF in surging, swaying, heaving, pitching, and rolling directions can be recorded as FX, FY, FZ, MY, MX, respectively and they were simulated under the drafts of 3.5, 5.25, 7, and 8.75 m, as shown in Figure 9.
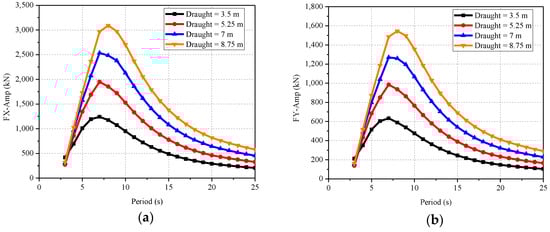
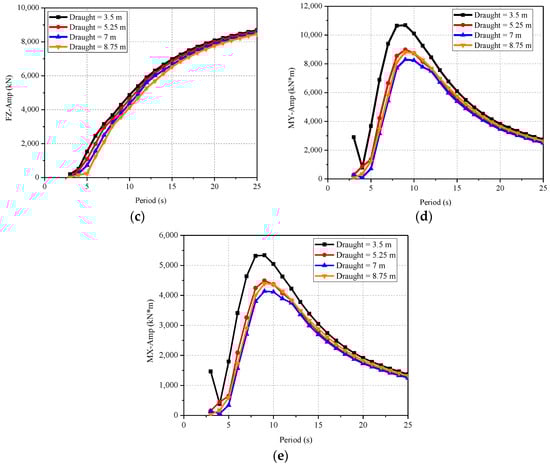
Figure 9.
Effect of draft on exciting force: (a) Exciting force FX in the surging direction; (b) Exciting force FY in the swaying direction; (c) Exciting force FZ in the heaving direction; (d) Exciting moment MY in the pitching direction; (e) Exciting moment MX in the rolling direction.
According to Figure 9, the exciting forces (moments) FX, FY, FZ, MX, and MY of the CBF were all related to the foundation draft and wave period, and exciting forces (moments) FX, FY, MX, and MY fluctuated sharply within the wave period of 6–9 s. With increasing foundation draft, the amplitudes of exciting forces FX and FY and the wave periods corresponding to such amplitudes all gradually increased. Within the same wave period, exciting force FZ gradually decreased with increasing draft, and under the same draft, exciting force FZ increased with increasing wave period; exciting moments MX and MY had the same variation trend. With the increase in the foundation draft, the wave period corresponding to the amplitude gradually increased; however, when the draft exceeded 5.25 m, the amplitude variation was not obvious.
3.4.2. Effect of Wave Direction on the Exciting Force
After selecting draft as 7 m and setting the wave directions at 0°, 30°, 60°, 90°, 120°, 150°, and 180°, the exciting forces of the CBF in surging/swaying, heaving, pitching, and rolling directions were simulated, as shown in Figure 10.
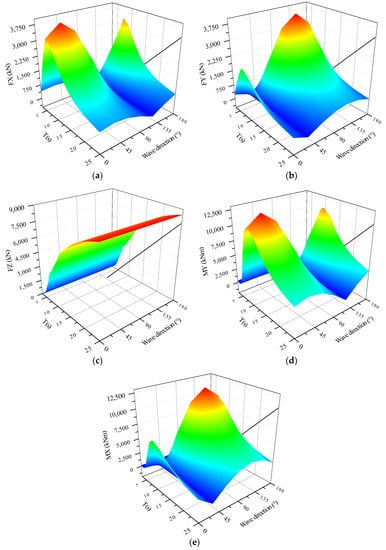
Figure 10.
Effect of wave direction on the exciting force: (a) Exciting force FX in the surging direction; (b) Exciting force FY in the swaying direction; (c) Exciting force FZ in the heaving direction; (d) Exciting moment MY in the pitching direction; (e) Exciting moment MX in the rolling direction.
According to Figure 10, the periods corresponding to the amplitudes of exciting forces in different directions were independent of the wave direction. In the case of exciting force FX, when the wave direction = 30°, the exciting force FX in the surging direction was greater than that in other wave directions; when the wave direction = 120°, the exciting force FX in the surging direction was the minimum. In the case of exciting force FY, when the wave direction = 120°, the exciting force FY in the swaying direction was greater than that in other wave directions; when the wave direction = 30°, the exciting force FY in the swaying direction was the minimum. In the case of exciting force FZ, the exciting force FZ in the heaving direction was independent of the wave direction; when the wave direction = 30°, the exciting moment MY in the pitching direction was greater than that in other wave directions. In the case of exciting moment MY, when the wave direction = 30°, the exciting moment MY in the pitching direction was the minimum; when the wave direction = 120°, the exciting moment MX in the rolling direction was greater than that in other wave directions; when the wave direction = 30°, the exciting moment MX in the rolling direction was the minimum.
4. Towing Motion Characteristics of CBF in Random Wave
4.1. Towing in P–M Random Wave
The P–M spectrum is an empirical spectrum and is suitable for wind and wave spectrums in the infinite wind region of the outer sea. Due to the sufficient data and reasonable analysis methods, it is widely used in marine engineering and ship engineering. According to the measured data of the North Atlantic, 54 spectra were obtained, and after the dimensionless treatment and the correction of the wind speed, it could be expressed as Equation (11).
where g is the acceleration of gravity, take 9.81, is the wave frequency, is the peak frequency, and .
The P–M spectra account for the significant wave heights of waves. To analyze the towing of the CBF in the P–M spectrum waves, reverse towing was conducted under random waves corresponding to the significant wave heights of 0.5, 1, 1.5, and 2 m. Figure 11 shows the P–M spectra corresponding to different significant wave heights. Comparative analyses were also conducted on the variations in the towing force of CBF, subdivision air pressures, and heaving angle, pitching angle, and vertical acceleration, as shown in Figure 12, Figure 13, Figure 14, Figure 15 and Figure 16.
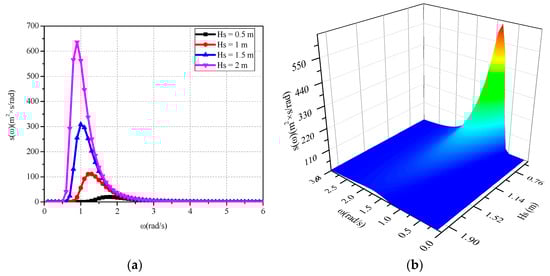
Figure 11.
The P–M spectra corresponding to different significant wave heights: (a) 2D P-M spectra diagram; (b) 3D P-M spectra diagram.
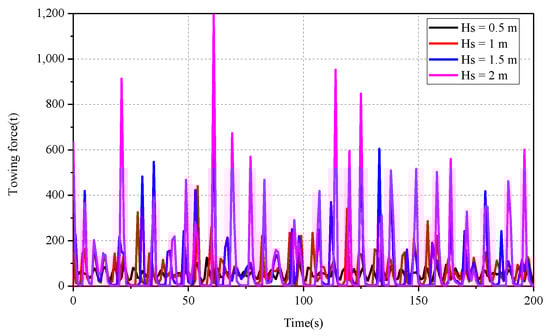
Figure 12.
Effect of significant wave height on the foundation towing force.
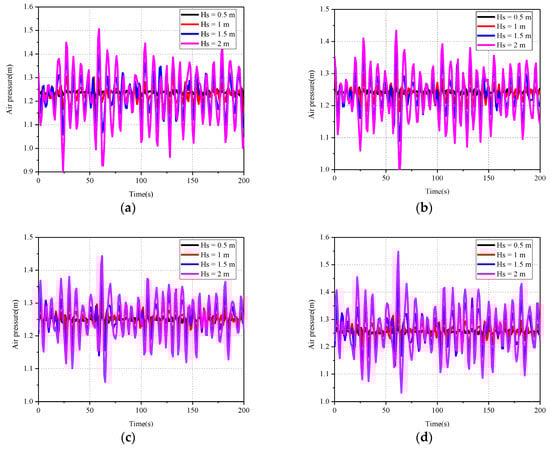
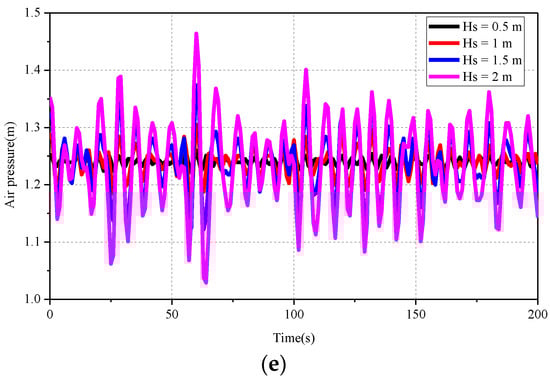
Figure 13.
Effect of significant wave height on foundation air pressure: (a) Effect of significant wave height on air pressure in room 1; (b) Effect of significant wave height on air pressure in room 2; (c) Effect of significant wave height on air pressure in room 3; (d) Effect of significant wave height on air pressure in room 4; (e) Effect of significant wave height on air pressure in room 7.
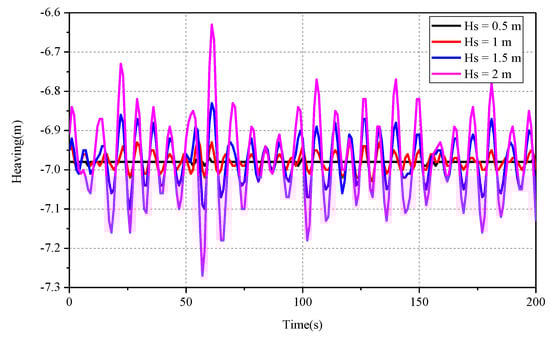
Figure 14.
Effect of significant wave height on foundation heaving.
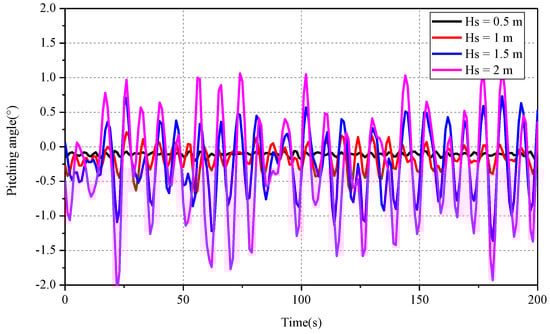
Figure 15.
Effect of significant wave height on foundation pitching angle.
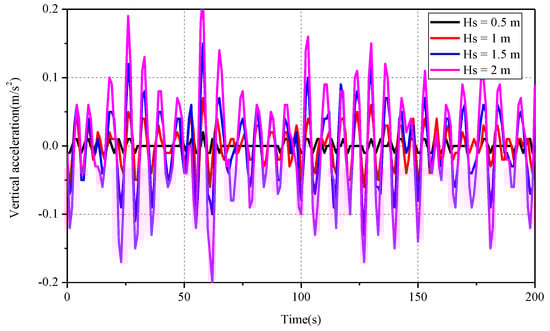
Figure 16.
Effect of significant wave height on foundation vertical acceleration.
As shown in Figure 12, Figure 13, Figure 14, Figure 15 and Figure 16, within the time domains of the P–M spectra corresponding to different significant wave heights, the CBF maintained a basically consistent motion characteristics and rules. A larger significant wave height led to a greater peak towing force of the CBF, a wider variation range of air pressure in each subdivision, and wider variation ranges of heaving angle, pitching angle, and vertical acceleration.
4.2. Towing of Random Waves in ITTC
The International Towing Tank Conference (ITTC) recommends the use of single-parameter and two-parameter spectra based on P–M spectral corrections. Single parameter spectrum can be expressed as Equation (12).
where ,.
Single-parameter spectroscopy cannot reasonably express the characteristics of underdeveloped waves, so ITTC recommends a two-parameter spectrum, see Equation (13).
where , , , is the characteristic period of the wave, and is the significant wave height.
The two-parameter wave spectrum is not only suitable for fully developed waves, but also for growing waves or waves with surges. To investigate the effect of the variations of wave characteristic periods in ITTC spectra on the towing of CBF, in this study, simulation was performed under a significant wave height of 2 m and the wave characteristic periods of 5 s, 10 s, 15 s, and 20 s. Figure 17 shows the ITTC spectra under different wave characteristic periods. The reverse towing of the CBF was conducted under random waves corresponding to different wave characteristic periods, and comparative analysis was also conducted on the variations in the towing force of the CBF, subdivision air pressures, and heaving angle, pitching angle, and vertical acceleration, as detailed in Figure 18, Figure 19, Figure 20, Figure 21 and Figure 22.
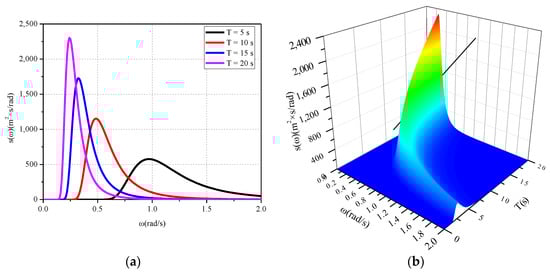
Figure 17.
The ITTC (International Towing Tank Conference) two-parameter spectra corresponding to different wave characteristic periods: (a) 2D ITTC spectra diagram; (b) 3D ITTC spectra diagram.
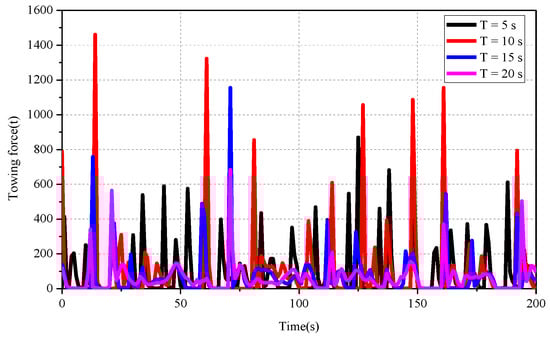
Figure 18.
Effect of wave characteristic period on the foundation towing force.
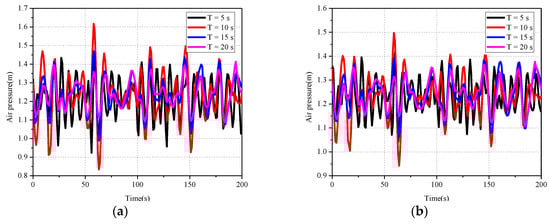
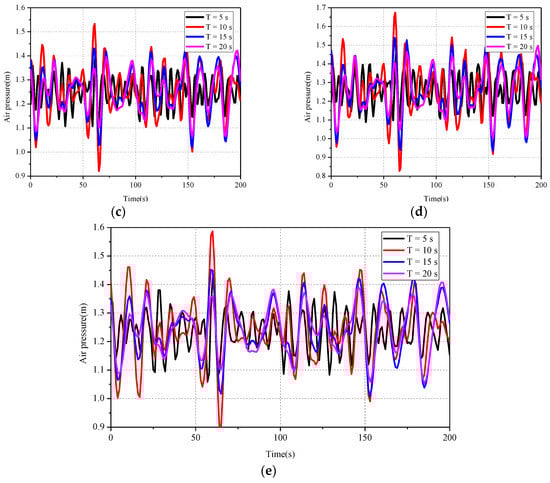
Figure 19.
Effect of wave characteristic period on the foundation air pressure: (a) Effect of wave characteristic period on air pressure in room 1; (b) Effect of wave characteristic period on air pressure in room 2; (c) Effect of wave characteristic period on air pressure in room 3; (d) Effect of wave characteristic period on air pressure in room 4; (e) Effect of wave characteristic period on air pressure in room 7.
Figure 20.
Effect of wave characteristic period on foundation heaving.
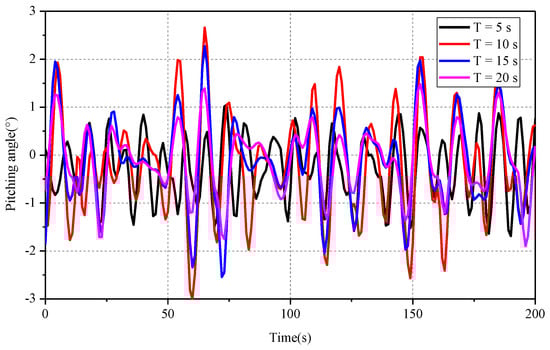
Figure 21.
Effect of wave characteristic period on foundation pitching angle.
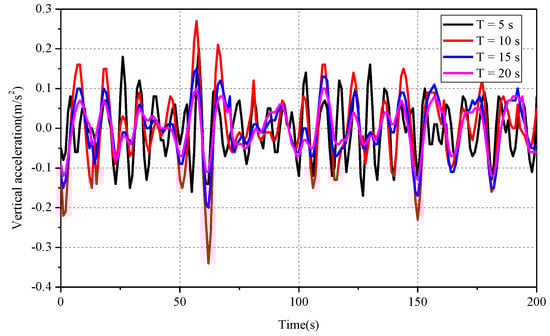
Figure 22.
Effect of wave characteristic period on foundation vertical acceleration.
As shown in Figure 18, the peak towing forces of the CBF in the wave characteristic periods T of 10 and 15 s were greater than those in other periods. According to Figure 19, the variation ranges of the subdivision air pressure in the wave characteristic periods T of 10 and 15 s were wider than those in other periods. According to Figure 20, heaving had wider variation ranges in the wave characteristic periods T of 10, 15, and 20 s and a narrower variation range in the wave characteristic period of T = 5 s. According to Figure 21, the variation ranges in the pitching angle in the wave characteristic periods T of 10 and 15 s were wider than those in other periods. According to Figure 22, the variation range in vertical acceleration in the wave characteristic period of T = 10 s was wider than that in any other period.
4.3. Towing of Random Waves in JONSWAP
The JONSWAP (Joint North Sea Wave Project) spectrum takes into account the effects of wind speed and wind distance. Most experience shows that this spectrum is consistent with the measured data, and its application range is increasingly wide due to its application to winds and waves at different stages of growth, see Equation (14).
where is a dimensionless constant, , x is the wind distance, U is the wind speed, is the peak frequency, is the spectral peak factor, and is the peak shape parameter.
For the same wind conditions, a family (five groups) of JONSWAP spectra may be produced with regard to the proportion of spectral peak factor , as detailed in Table 2. After selecting the wave conditions (wind run = 185 km, significant wave height = 2 m), JONSWAP spectra were drawn under different spectral peak factors () according to the formula for JONSWAP spectra, as shown in Figure 23. The reverse towing of the CBF was conducted under random waves corresponding to different JONSWAP spectra, and comparative analysis was also conducted on the variations in the towing force of the CBF, subdivision air pressures, and heaving angle, pitching angle, and vertical acceleration, as detailed in Figure 24, Figure 25, Figure 26, Figure 27 and Figure 28.
Table 2.
Spectral peak factors () and their proportions.
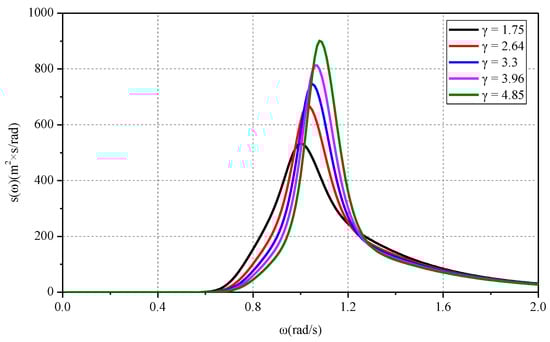
Figure 23.
JONSWAP (Joint North Sea Wave Project) spectra under different spectral peak factors ().
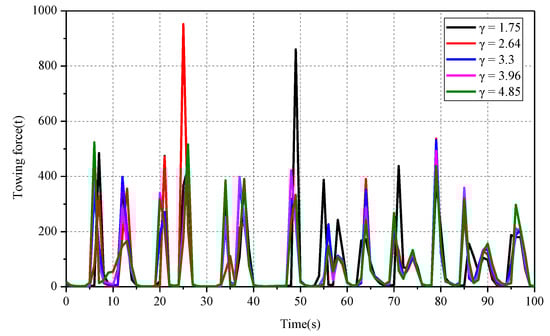
Figure 24.
Effect of spectral peak factor on foundation towing force.
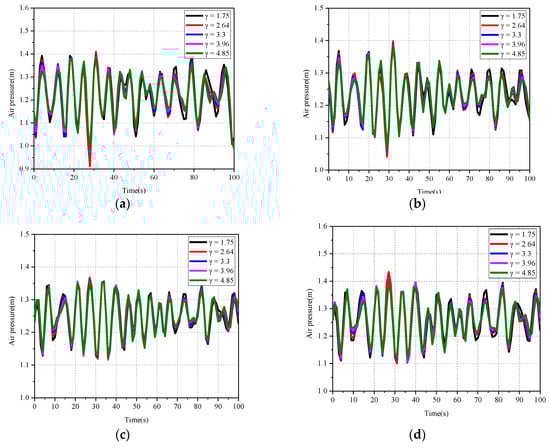
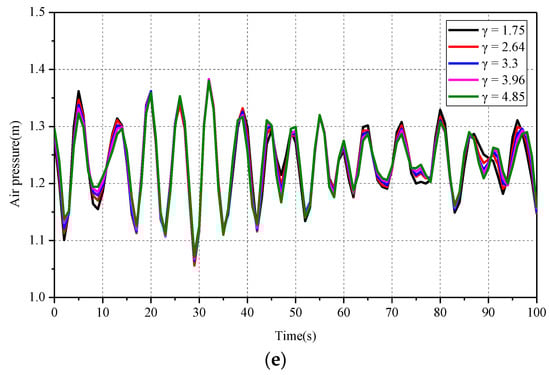
Figure 25.
Effect of spectral peak factor on foundation air pressure: (a) Effect of spectral peak factor on air pressure in room 1; (b) Effect of spectral peak factor on air pressure in room 2; (c) Effect of spectral peak factor on air pressure in room 3; (d) Effect of spectral peak factor on air pressure in room 4; (e) Effect of spectral peak factor on air pressure in room 7.
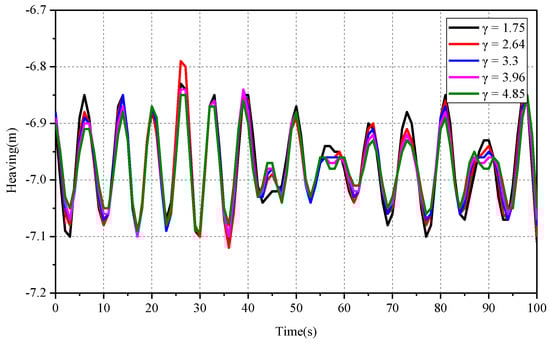
Figure 26.
Effect of spectral peak factor on foundation heaving.
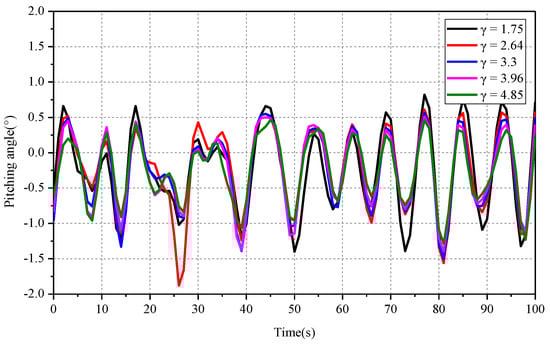
Figure 27.
Effect of spectral peak factor on the foundation pitching angle.
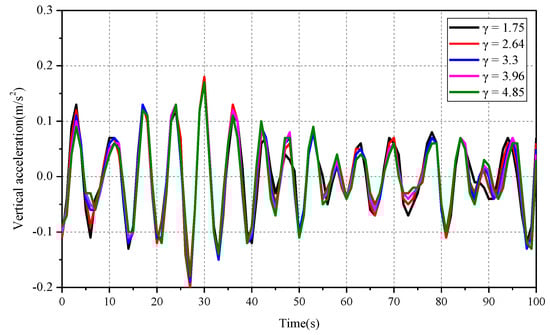
Figure 28.
Effect of spectral peak factor on foundation vertical acceleration.
As shown in Figure 24, the peak towing forces of the JONSWAP spectra corresponding to the spectral peak factors of 1.75 and 2.64 were slightly greater than those corresponding to other spectral peak factors; the towing force variations corresponding to different spectral peak factors presented consistent overall trends. According to Figure 25, the variation ranges of the subdivision air pressure of the JONSWAP spectra corresponding to spectral peak factors of 1.75 and 2.64 were wider than those corresponding to other spectral peak factors, and the variations in the subdivision air pressures corresponding different spectral peak factors presented consistent overall trends. According to Figure 26, the variation ranges of the heaving of the JONSWAP spectra corresponding to spectral peak factors of 1.75 and 2.64 were wider than those corresponding to other spectral peak factors, and the variations in the heaving corresponding to different spectral peak factors presented consistent overall trends. According to Figure 27, the variation ranges of the pitching angle of the JONSWAP spectra corresponding to the spectral peak factors of 1.75 and 2.64 were wider than those corresponding to other spectral peak factors, and the variations in the pitching angle corresponding to different spectral peak factors presented consistent overall trends. According to Figure 28, the variation ranges of vertical acceleration of the JONSWAP spectra corresponding to spectral peak factors of 1.75 and 2.64 were slightly wider than those corresponding to other spectral peak factors, and the variations in the vertical acceleration corresponding to different spectral peak factors presented consistent overall trends. Given that the variations in the spectral peak factor had no obvious effect on the motion characteristics of the CBF, according to the proportions of various spectral peak factors in Table 2, the spectral peak factor of JONSWAP spectra can be set as in the analysis on the motion characteristics of CBF.
5. Conclusions
The numerical calculation method was used to analyze the stability, natural period, RAO, add mass coefficient, and other parameters of CBF, and perform towing analysis under the action of random waves. It is convenient to simulate a variety of sea conditions through sea state parameter changes and to obtain the motion response of CBF under different sea conditions and the influence of various factors on the structural motion characteristics and provide reference for CBF towing.
According to the study results, the surging/swaying, heaving, and pitching/rolling RAOs of the CBF were all related to the foundation draft and fluctuated sharply within the wave period of 6–9 s. The deeper the foundation draft, the higher the amplitude of the added mass coefficient in the surging (swaying) direction, and the longer the wave period corresponding to the maximum amplitude; the period range corresponding to the maximum amplitude was in the range 8–10 s. The variation of the additional mass with the draft was similar to the results in References [24] and [28], where the additional coefficient of heave was close to the recommended value (1.2) in ship dynamics. The natural period was slightly different due to the structural differences in the CBF.
The damping coefficients of the CBF in the surging/swaying, heaving, and rolling/pitching directions increased with increasing draft, and fluctuated sharply within the wave period range 6–9 s. The exciting force (moment) of the CBF fluctuated sharply within the wave period range of 6–9 s. A larger significant wave height led to a greater peak towing force of the CBF, a wider variation range of air pressure in each subdivision, and wider variation ranges of pitching angle in the wave characteristic periods T of 10 and 15 s than in other periods. The variations in the spectral peak factor had no obvious effect on the motion characteristics of CBF. The influence of wave height and period on the wave towing motion response of the CBF was consistent with the wave response law of the conventional solid floating structure. In the subsequent research, the influence of the air cushion on the wave response can be further studied by model test or prototype data analysis.
Author Contributions
Conceptualization, H.D., C.L. and P.Z.; Methodology, H.D., P.Z. and C.L.; Software, X.Z. and Q.M.; validation, C.L., P.Z. and H.D.; Formal Analysis, X.Z. and Q.M.; Writing-Original Draft Preparation, X.Z., C.L. and P.Z.; Writing-Review & Editing, X.Z., C.L. and P.Z.; Supervision, H.D., C.L. and P.Z; Project administration, H.D. and P.Z; Funding acquisition, H.D., C.L. and P.Z.
Funding
This research was funded by the National Natural Science Foundation of China (Grant Nos. 51679163 & 51779171), Innovation Method Fund of China (Grant No. 2016IM030100) and Tianjin Municipal Natural Science Foundation (Grant No. 18JCYBJC22800).
Conflicts of Interest
The authors declare no conflict of interest.
References
- Wang, X.; Zeng, X.; Li, J.; Yang, X.; Wang, H. A review on recent advancements of substructures for offshore wind turbines. Energy Convers. Manag. 2018, 158, 103–119. [Google Scholar] [CrossRef]
- Ding, H.Y.; Lian, J.J.; Li, A.D.; Zhang, P.Y. One-step-installation of offshore wind turbine on large-scale bucket-top-bearing bucket foundation. Trans. Tianjin Univ. 2013, 19, 188–194. [Google Scholar] [CrossRef]
- Zhang, P.; Hu, R.; Ding, H.; Guo, Y.; Xiong, K. Comparative analysis of seepage field characteristics in bucket foundation with and without compartments. Ocean Eng. 2017, 143, 34–49. [Google Scholar] [CrossRef]
- Hu, R.; Zhang, P.; Ding, H.; Le, C. Numerical analysis of seepage field of bucket foundations for offshore wind turbines. Ships Offshore Struct. 2018, 13, 822–834. [Google Scholar] [CrossRef]
- Zhang, P.; Wei, W.; Jia, N.; Ding, H.; Liu, R. Effect of seepage on the penetration resistance of bucket foundations with bulkheads for offshore wind turbines in sand. Ocean Eng. 2018, 156, 82–92. [Google Scholar] [CrossRef]
- Chenu, B.; Morris-Thomas, M.T.; Thiagarajan, K.P. Some hydrodynamic characteristics of an air-cushion supported concrete gravity structure. In Proceedings of the 15th Australasian Fluid Mechanics Conference, Sydney, Australia, 13–17 December 2004. [Google Scholar]
- Pantouvakis, J.-P.; Panas, A. Computer simulation and analysis framework for floating caisson construction operations. Autom. Constr. 2013, 36, 196–207. [Google Scholar] [CrossRef]
- Seidl, L.H. Development of an ASP (Air Stabilized Platform). NASA STI/Recon Technical Report N. 1980, p. 81. Available online: http://adsabs.harvard.edu/abs/1980STIN...8114183S (accessed on 7 August 2019).
- Kaplan, P.; Bentson, J.; Davis, S. Dynamics and Hydrodynamics of surface-effect ships. Trans. SNAME 1981, 89, 211–247. [Google Scholar]
- Nakos, D.E.; Nestegard, A. Seakeeping analysis of surface effect ships. In Proceedings of the FAST’91, Trondheim, Norway, 17–20 June 1991; pp. 413–428. [Google Scholar]
- Moulijn, J.C. Added Resistance Due to Waves of Surface Effect Ships. Ph.D. Thesis, Delft University of Technology, Delft, The Netherlands, 2000. [Google Scholar]
- Pinkster, J.A. Motions and Drift Forces of Air-Supported Structures in Waves; Delft University of Technology, Faculty of Mechanical Engineering and Marine Technology, Ship Hydromechanics Laboratory: Delft, The Netherlands, 1998. [Google Scholar]
- Pinkster, J.A.; Fauzi, A.; Inoue, Y.; Tabeta, S. The behavior of large air cushion supported structures in waves. In Proceedings of the 2nd International Conference on Hydroelasticity in Marine Technology, Fukuoka, Japan, 1–3 December 1998; pp. 497–506. [Google Scholar]
- Pinkster, J.; Scholte, E.M. The behaviour of a large air-supported MOB at sea. Mar. Struct. 2001, 14, 163–179. [Google Scholar] [CrossRef]
- Tabeta, S. Model Experiments on Barge Type Floating Structures Supported by Air Cushions; Ship Hydromechanics Laboratory Report; Delft University of Technology: Delft, The Netherlands, 1998; p. 1125. [Google Scholar]
- Lee, C.H.; Newman, J.N. Wave effects on large floating structures with air cushions. Mar. Struct. 2000, 13, 315–330. [Google Scholar] [CrossRef]
- Newman, J.N. Diffraction of water waves by an air chamber. In Proceedings of the 15th International Waves and Floating Bodies, Caesarea, Israel, 17 February–1 March 2000. [Google Scholar]
- Cheung, K.F.; Phadke, A.C.; Smith, D.A.; Lee, S.K.; Seidl, L.H. Hydrodynamic response of a pneumatic floating platform. Ocean Eng. 2000, 27, 1407–1440. [Google Scholar] [CrossRef]
- Malenica, S.; Zalar, M. An alternative method for linear hydrodynamics of air cushion supported floating bodies. In Proceedings of the 15th International Workshop on Water Waves and Floating Bodies, Dan Caesarea, Israel, 25 February–1 March 2000. [Google Scholar]
- Gueret, R.; Hermans, A.J. Air cushion under floating of shore structure. In Proceedings of the 16th International Workshop on Water Waves and Floating Bodies, Hiroshima, Japan, 22–25 April 2001; pp. 45–49. [Google Scholar]
- Gueret, R. Interaction of Free Surface Waves with Elastic and Air-Cushion Platforms; Delft University Press: Delft, The Netherlands, 2002. [Google Scholar]
- Thiagarajan, K.P.; Morris-Thomas, M.T. Wave-induced motions of an air cushion structure in shallow water. Ocean Eng. 2006, 33, 1143–1160. [Google Scholar] [CrossRef]
- Koo, W. Nonlinear time–domain analysis of motion-restrained pneumatic floating breakwater. Ocean Eng. 2009, 36, 723–731. [Google Scholar] [CrossRef]
- He, F.; Huang, Z.; Law, A.W.-K. An experimental study of a floating breakwater with asymmetric pneumatic chambers for wave energy extraction. Appl. Energy 2013, 106, 222–231. [Google Scholar] [CrossRef]
- Bie, S.; Xu, Y.; Wang, G. Study on floating state and kinetic properties of the air floated structures. J. Tsinghua Univ. 2001, 41, 123–126. [Google Scholar]
- Ding, H.Y.; Huang, X.; Zhang, P.Y.; Liu, X.Q. Analysis on influence factors of towing of air float bucket foundation platform. Eng. Mech. 2012, 29, 193–198. [Google Scholar]
- Zhang, P.Y.; Ding, H.Y.; Le, C.H.; Huang, X. Towing characteristics of large-scale composite bucket foundation for offshore wind turbines. J. Southeast Univ. 2013, 3, 300–304. [Google Scholar]
- Bie, S.A.; Ren, Z.J.; Li, Z.Z. Mechanical Properties of Air Floating Structures. Chin. J. Appl. Mech. 2004, 1, 68–71. [Google Scholar]
© 2019 by the authors. Licensee MDPI, Basel, Switzerland. This article is an open access article distributed under the terms and conditions of the Creative Commons Attribution (CC BY) license (http://creativecommons.org/licenses/by/4.0/).