1. Introduction
Lithium-ion batteries are popular energy sources of our everyday life because of their high energy density, low self-discharge and lightweight. Portable electronic devices (mobile phones and laptops), home electronics, electronic tools and electric vehicles (EVs) all run on some type of lithium-ion battery. In applications such as electrical vehicles, batteries are connected in parallel and series to meet the power needs. The optimal performance and safe operation of the set of battery cells are managed by the battery management system (BMS). Another essential role of the BMS is the state of charge (SOC) and state of health (SOH) estimation. The former quantity informs the driver on the remaining charge of the battery bank (i.e., the remaining mileage that can be traveled with the electrical vehicle), while the latter shows the ratio between the capacity of a new battery in relation to the actual capacity of the battery. Similar to any other battery, the performance of the lithium-ion battery is not constant but slowly degrades during the operation and strongly depends on the ambient temperature. The battery health conditions cannot be measured directly therefore it should be estimated based on measurable quantities.
Thermal modeling and the analysis of lithium-ion batteries under different temperatures has been addressed by several authors. The thermal modeling of batteries as well as the modeling without temperature dependency can be classified based on the scientific background (e.g., equivalent circuit models and electrochemical models). The review by Madani
et al. [
1] gives a thorough analysis of not only the different electrochemical models but also the parameter identification methods.
In such applications where the computational complexity (i.e., time) is crucial, e.g., in BMSs (battery management systems),
equivalent circuit models are widely used [
2]. The authors of [
3] addressed the study of open circuit voltage-state of charge (OCV-SOC) characterization under the influence of different temperatures. The results show that the OCV-SOC characteristics curve highly depends on the temperature. An online estimation method for model parameters and SOC is proposed in [
4], for applications in EVs under various temperatures. Their model is based on the RC circuit equivalent of the investigated battery. In [
5], a design of experiment approach is used for the development of the electro-thermal model of electric vehicle batteries. The basis of their work is also an equivalent circuit model of the battery. The authors of [
6] investigated the influence of thermal effect on the performance of their dual Kalman filter based (state and parameter estimation) method.
Another class of battery models is the
electrochemical models where the chemical reactions and mechanisms taking place in the battery serves as a basis for the modeling equations. An electro-thermal model is developed and validated experimentally in [
7], where electronic conduction, heat transfer, energy balance and electrochemical mechanisms are included in the model. A computationally more efficient electrochemical lithium-ion battery model is proposed in [
8]. The simplified single particle model is compared with more complicated electrochemical models as well as experimental data. Hosseinzadeh
et al. [
9] gave a systematic approach for the development of thermal electrochemical models of large lithium-ion batteries for EV applications. An
et al. [
10] addressed the problem of non-uniformity of heat generation and electrochemical reaction increase with the discharge rate in an electrochemical-thermal coupled lithium-ion battery model.
Pure thermal models are also present in the literature; the authors of [
11] developed a lumped parameter thermal model of the widely used LiFePO
4 lithium-ion battery. Using thermal measurements and the model, they determined the heat transfer coefficient and the heat capacity of the examined battery.
Due to the above mentioned thermal effects taking place in lithium-ion batteries, the previously mentioned roles of BMSs are usually extended with
thermal management. The most frequently used thermal management solutions of lithium-ion batteries (used either in HEVs or in EVs) are reviewed in [
12]. Temperature dependence of the key battery parameters and variables motivated the authors of [
13] to develop a two stage battery capacity estimation method. In the first stage, battery core temperature is estimated and, afterwards, SOC and capacity are estimated by a sliding model observer.
Due to the nonlinear nature of parametric lithium-ion battery models and the fact that parameters might also depend on time and/or external variables, the computational complexity of battery parameter estimation can be demanding. Wang
et al. [
14] overcame this problem by a parallel Java algorithm implemented on GPU (CUDA) architecture. The authors of [
15] developed and compared three different solutions for the internal resistance estimation of lithium-ion batteries (direct resistance estimation, Extended Kalman Filter (EKF), and recursive least squares) and concluded that EKF approach performed the best in terms of computational efficiency.
In our previous work [
16], we proposed a parameter estimation for lithium ion batteries based on their first-order equivalent circuit model. The aim of the present paper is to generalize that work to the case when the temperature dependence of the parameters are also taken into account in such a way that a computationally effective way of temperature dependent parameters important from the viewpoint of applicability (e.g., actual capacity) could be given for implementation in future BMSs.
Therefore, the method presented in this paper proposes temperature dependent static characteristics for the battery parameters using a very simple dynamic model. The obtained characteristics can be used for determining the estimated parameter values for given thermal circumstances. Since the characteristics are determined for the parameters independently as static functional relationships, they can be calculated effectively in a real-time environment, e.g., a battery management system.
The paper is organized as follows.
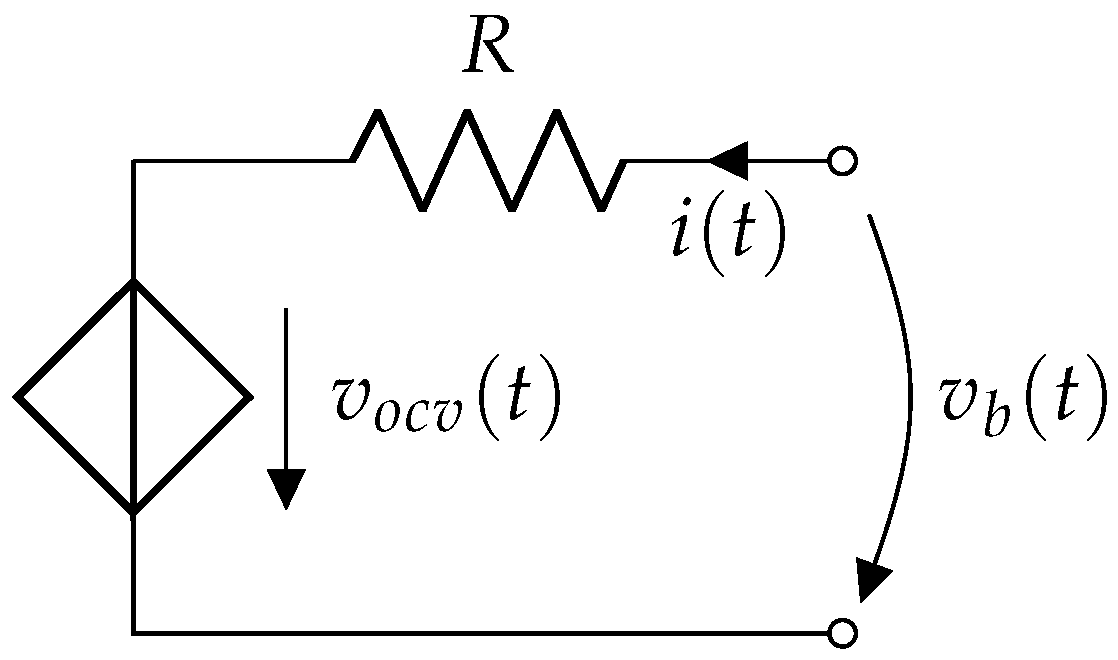
Section 2 introduces the parametric lithium-ion battery model that is used as the basis of our further steps. In
Section 3.3, the parameter sensitivity analysis of the model is performed together with the discussion of its results.
Section 3 is the main contribution of this paper and proposes our novel parameter estimation method for lithium-ion batteries. In
Section 4, the proposed parameter estimation method is analyzed by simulation experiments, and the paper is closed by concluding remarks.
3. Parameter Estimation Methodology
Based on the modeling and analysis results of
Section 2 and
Section 3.3, the parameter estimation method is presented in this section.
3.1. Input Signal
The pseudo-random binary sequence (PRBS) is chosen as the input signal for the parameter estimation. It is a widely used signal in the field of parameter estimation [
21] because it is easy to generate and provides sufficient excitation. The PRBS has only two values in between the signal changes randomly. The two parameters of the PRBS are the range (the upper and lower level of the signal) and the frequency of the change that should be chosen considering the system dynamics. In our case, the clock frequency of the PRBS was chosen to be five times the time constant of the system; the latter can be approximately determined from a step input to the system (see in
Section 3.3).
An other important factor of our parameter estimation method is the ambient temperature. At each experiment, the ambient temperature is chosen to be constant, thus we hold the ambient temperature constant during an experiment.
The minimum and maximum battery temperatures of the experiments should be chosen according to the recommended operating temperatures of the examined battery. Then, this range is evenly divided to get the list of ambient temperatures at which the experiments should be carried out.
3.2. Simulation Setup
The parameter estimation methods were implemented and tested by simulation experiments in Matlab. To simulate the heat dissipation of the battery during charge/discharge, the battery model in Simulink/Simscape/Electrical/Specialized Power Systems/Electric Drives/Extra Sources (an
extended model) was used.
This model contains additional energy balance equations that describe the temperature effects of the battery [
22]. This means that the cell temperature and the heating/cooling effects of the battery (including self-heating) during the operation can be simulated. It is important to note that the model that we used for parameter estimation (Equations (1)–(11)) is much simpler, as it does not contain the internal energy balance equation. The advantage of the Simulink model is that
the battery cell temperature can be directly extracted from the model, which can be used as measurement data for the cell temperature.
The simulated battery was a Samsung INR18650Q-20Q battery with 2000 mAh capacity. The nominal parameters of the battery can be seen in
Table 1. The operating temperatures of the battery from the datasheet are 0–50 °C for charge and −20–75 °C for discharge. Based on these values, we decided to simulate the battery in the range 0–50 °C. The charge and the discharge of the battery was simulated at 11 different ambient temperatures with PRBS input signal of 1–99% state of charge. The simulation setup in case of charge and discharge can be seen below.
Simulation setup for charge:
PRBS input: , ,
initial values: , ,
ambient temperatures: °C
stopping criterion: ;
Simulation setup for discharge:
PRBS input: , ,
initial values: , ,
ambient temperatures: °C
stopping criterion: ;
All simulations were performed on a PC (Intel i5 CPU with 4GB RAM) (Intel, Santa Clara, CA, USA).
3.3. Parameter Sensitivity Analysis
As a first step of the parameter estimation, the parameter sensitivity of the charge and discharge model of the battery was analyzed. It is important to note that the temperature has an indirect effect on the model output through the parameters directly depend on the temperature. We used our previously described method [
16] for the sensitivity analysis, i.e., the parameter values were changed one by one with
with respect to the nominal values, then the difference between the nominal and the perturbed model was evaluated using a quadratic loss function:
where
denotes the parameter vector, and
is the perturbed parameter vector. First, the step response of the model was simulated to get the time constant of the system (
). The sample time of the PRBS signal (
) was chosen to be
. The sensitivity analysis was repeated at six different temperatures: 0 °C, 10 °C, 20 °C, 30 °C, 40 °C and 50 °C. The battery was charged/discharged between 0% and 100% state of charge with PRBS current input (amplitude: charge {−2 A, −0.5 A} and discharge {0.5 A, 2 A}; and sample time: 160 s). Both the charge and the discharge models were analyzed. The nominal model was the charge/discharge model at the nominal ambient temperature
°C.
The models were simulated in Matlab using the model equations (Equations (1)–(6)). At each temperature, the nominal parameters were perturbed one-by-one and the value of the loss function was computed. The result of the sensitivity analysis of the charge and the discharge model can be seen in
Table 2 and
Table 3. The graphical representation of the results is depicted in
Figure 2.
It can be seen that the discharge model is a bit more sensitive to the change of the parameters as the magnitude of the error is greater in that case. Both the charge and the discharge models have similar characteristics with respect to the parameter sensitivity:
The models are highly sensitive to the constant potential .
The models are less sensitive to and Q.
The rate of sensitivity is similar in the case of and Q.
The sensitivity of the models increases as the temperature decreases.
At ambient temperatures greater than the nominal temperature, the effect of changing the parameters is really small (except for ), especially in case of the discharge model.
The change of the internal resistance R at different temperatures has no effect on the models, as the errors related to the change are the same. In these cases, only the temperature affects the models.
Based on these statements, the parameters and Q will be estimated while R is fixed to its nominal value.
3.4. Methods for Parameter Estimation
Our parameter estimation method consists of two steps. At first the battery is charged or discharged at different constant ambient temperatures. At each temperature, the parameters and Q of the battery are estimated. In the second step, the temperature coefficients of these parameters are estimated.
3.4.1. Estimation of the Battery Parameters
The first step of our method is the estimation of the battery parameters at different constant ambient temperatures to see how these parameters change with that temperature. The inputs of the parameter estimation are the battery current and voltage at different temperatures during a full charge or discharge process. The result of the estimation is a set of battery parameters at different temperatures.
It can be seen from Equations (1)–(6) that the battery model has a nonlinear output equation and four parameters to be estimated as we fixed the internal resistance
R to its nominal value. Therefore, a suitable nonlinear parameter estimation method should be chosen. In our work, the nonlinear least-squares method is chosen. Nonlinear parameter estimation problems are usually solved as nonlinear optimization problems where a suitable cost function should be minimized. In our case, the cost function is the sum of squared deviation between the model and the measurement data at every time instance (see Equation (13) below).
where
is the measured value of the battery voltage at the
kth sample,
is the output of the model (Equation (4) or Equation (6)) with the parameter vector
, and
N is the total number of samples.
As all of the parameters to be estimated have physical meaning, the range and scale of the parameter values are usually known in advance. Therefore, upper and lower bounds for the parameters can be defined that is useful to limit the searching space of the optimization. As a result, a constrained nonlinear optimization problem should be solved. From the potential algorithm, the trust region reflective algorithm [
23] is chosen in our work.
3.4.2. Estimation of the Temperature Dependency of the Parameters
The second step of the parameter estimation method is the estimation of the reference values and the temperature dependency coefficients of the parameters. The inputs of this parameter estimation problem are the estimated parameters at different temperatures from the previous step (
Section 3.4.1). It can be seen from the temperature dependent battery model that the battery parameters can be divided into two groups based on the type of their temperature dependency:
Parameters with linear temperature dependency: .
Parameters with nonlinear (exponential) temperature dependency: .
Moreover, it can be seen from Equations (7)–(11) that some of the parameters (Q) depend on the ambient temperature and others () depend on the battery cell temperature. The problem is that the cell temperature usually cannot be measured. To overcome this, we made the following additional assumptions:
The cell temperature does not change a lot during charge/discharge (maximum ±2 °C).
The cell temperature is substituted by the average surface temperature during charge/discharge.
Initially, the cell temperature and the ambient temperature are equal.
The surface temperature of the battery is measured.
With the above assumptions, the temperature coefficients of the parameters can be estimated. The coefficients to be estimated are:
and for the temperature dependency of
and for the temperature dependency of Q
and for the temperature dependency of
and for the temperature dependency of
The coefficients of and can be estimated with the simple linear least squares method because Equations (10) and (11) are linear.
The coefficients of and can also be estimated by the least squares method by transforming the equations and their dependent variables.
4. Simulation Results
In this section, the results of the simulation based experiments are introduced and analyzed. In
Section 4.1, the results of the estimation of the battery parameters at 11 different temperatures are presented. Then, in
Section 4.2, the results of the estimation of the temperature dependency of the battery parameters are described.
4.1. Estimated Battery Parameters
The battery parameters at different temperatures were estimated using the
lsqnonlin function from Matlab Optimization Toolbox [
24]. This function needs at least two input arguments: a function to minimize and the vector of initial parameter values. Additional input arguments such as lower and upper bounds of the parameters and other options can be also defined. In our case, the following bounds were defined for the parameters:
.
The function to minimize is the cost function in Equation (13) and the parameters to be estimated are
. The initial values of the parameters were set to the nominal parameter values (see in
Table 1).
The results of the parameter estimation can be seen in
Table 4 and
Table 5. It can be noticed in the second row of
Table 4 that above 35 °C the battery reached its maximum capacity during charge.
It can be seen from the estimated values that they are in good agreement with the nominal parameters of the investigated battery type, and coincide well with the parameters in the detailed dynamic battery model in Simulink/Simscape/Electrical/Specialized Power Systems/Electric Drives/Extra Sources.
The accuracy of the parameter estimation can be characterized by the covariance matrix of the estimation. In our results, the elements of the covariance matrices are really small (with orders between and ) in both charge and discharge cases. This means that the parameter estimation is very accurate. Note that the experimental data were obtained from the simulation of the model equations of the extended model with energy balance equation and not from real measurements, therefore no external noise or modeling errors are included.
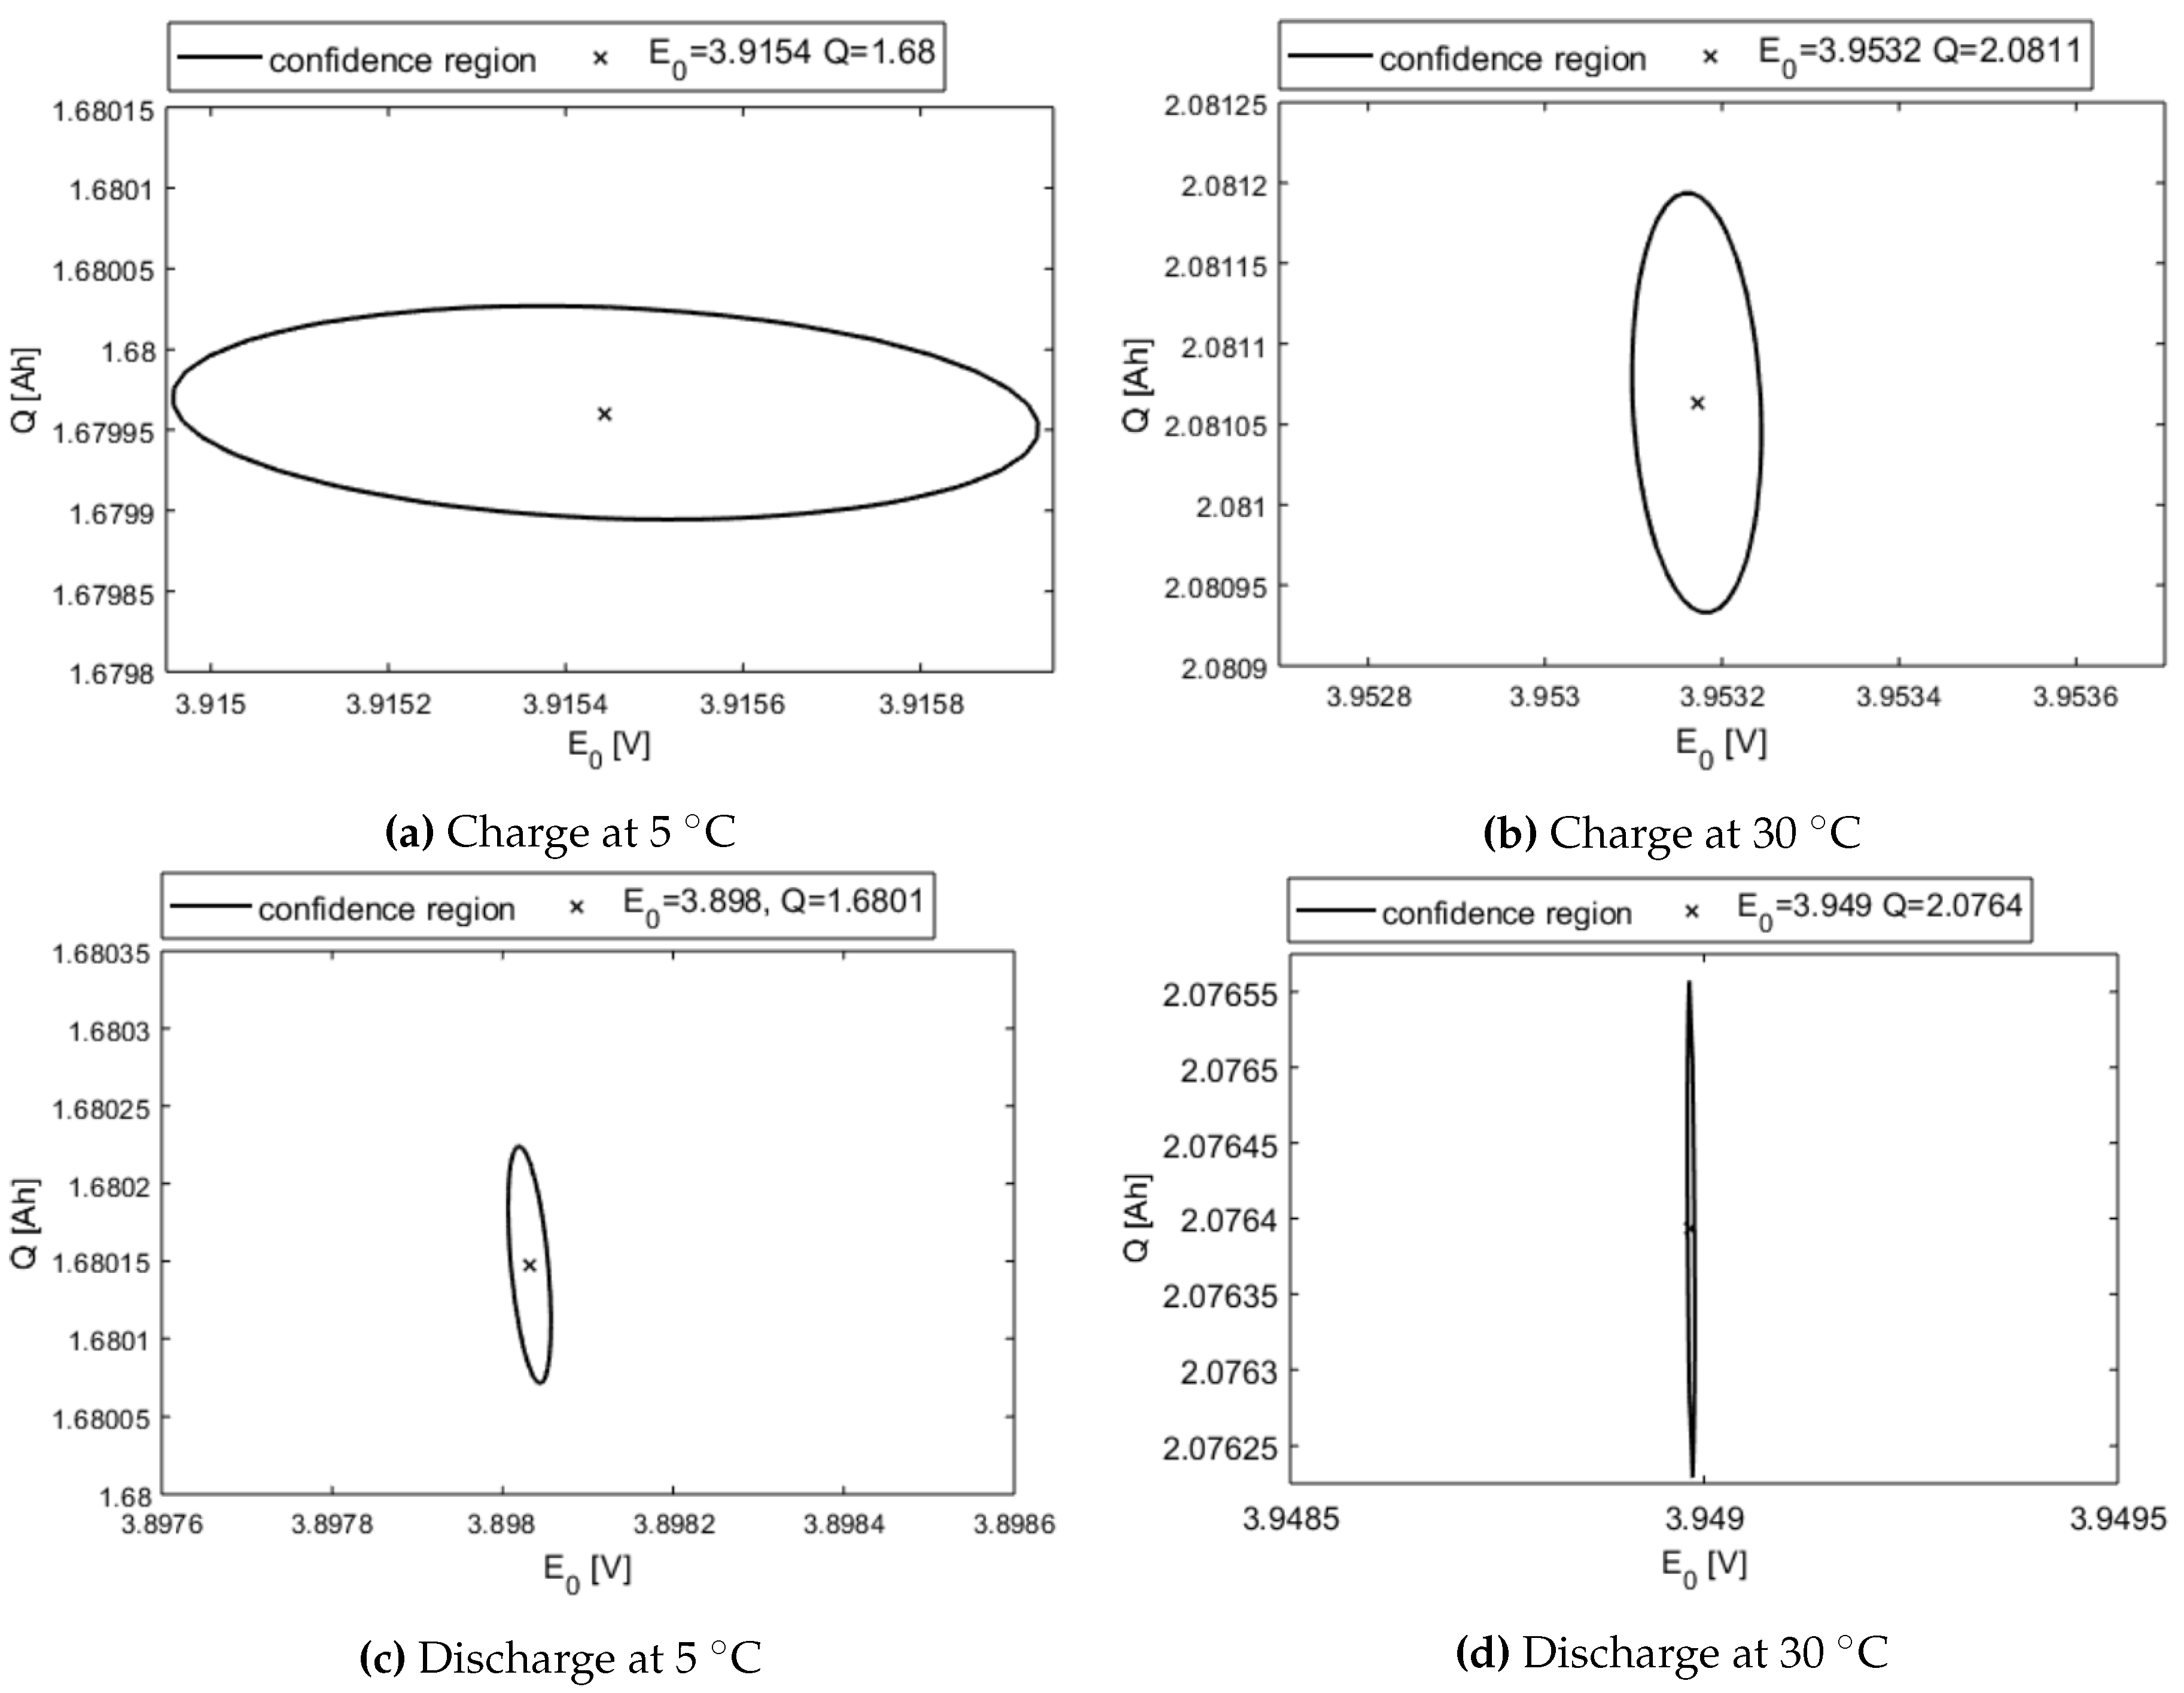
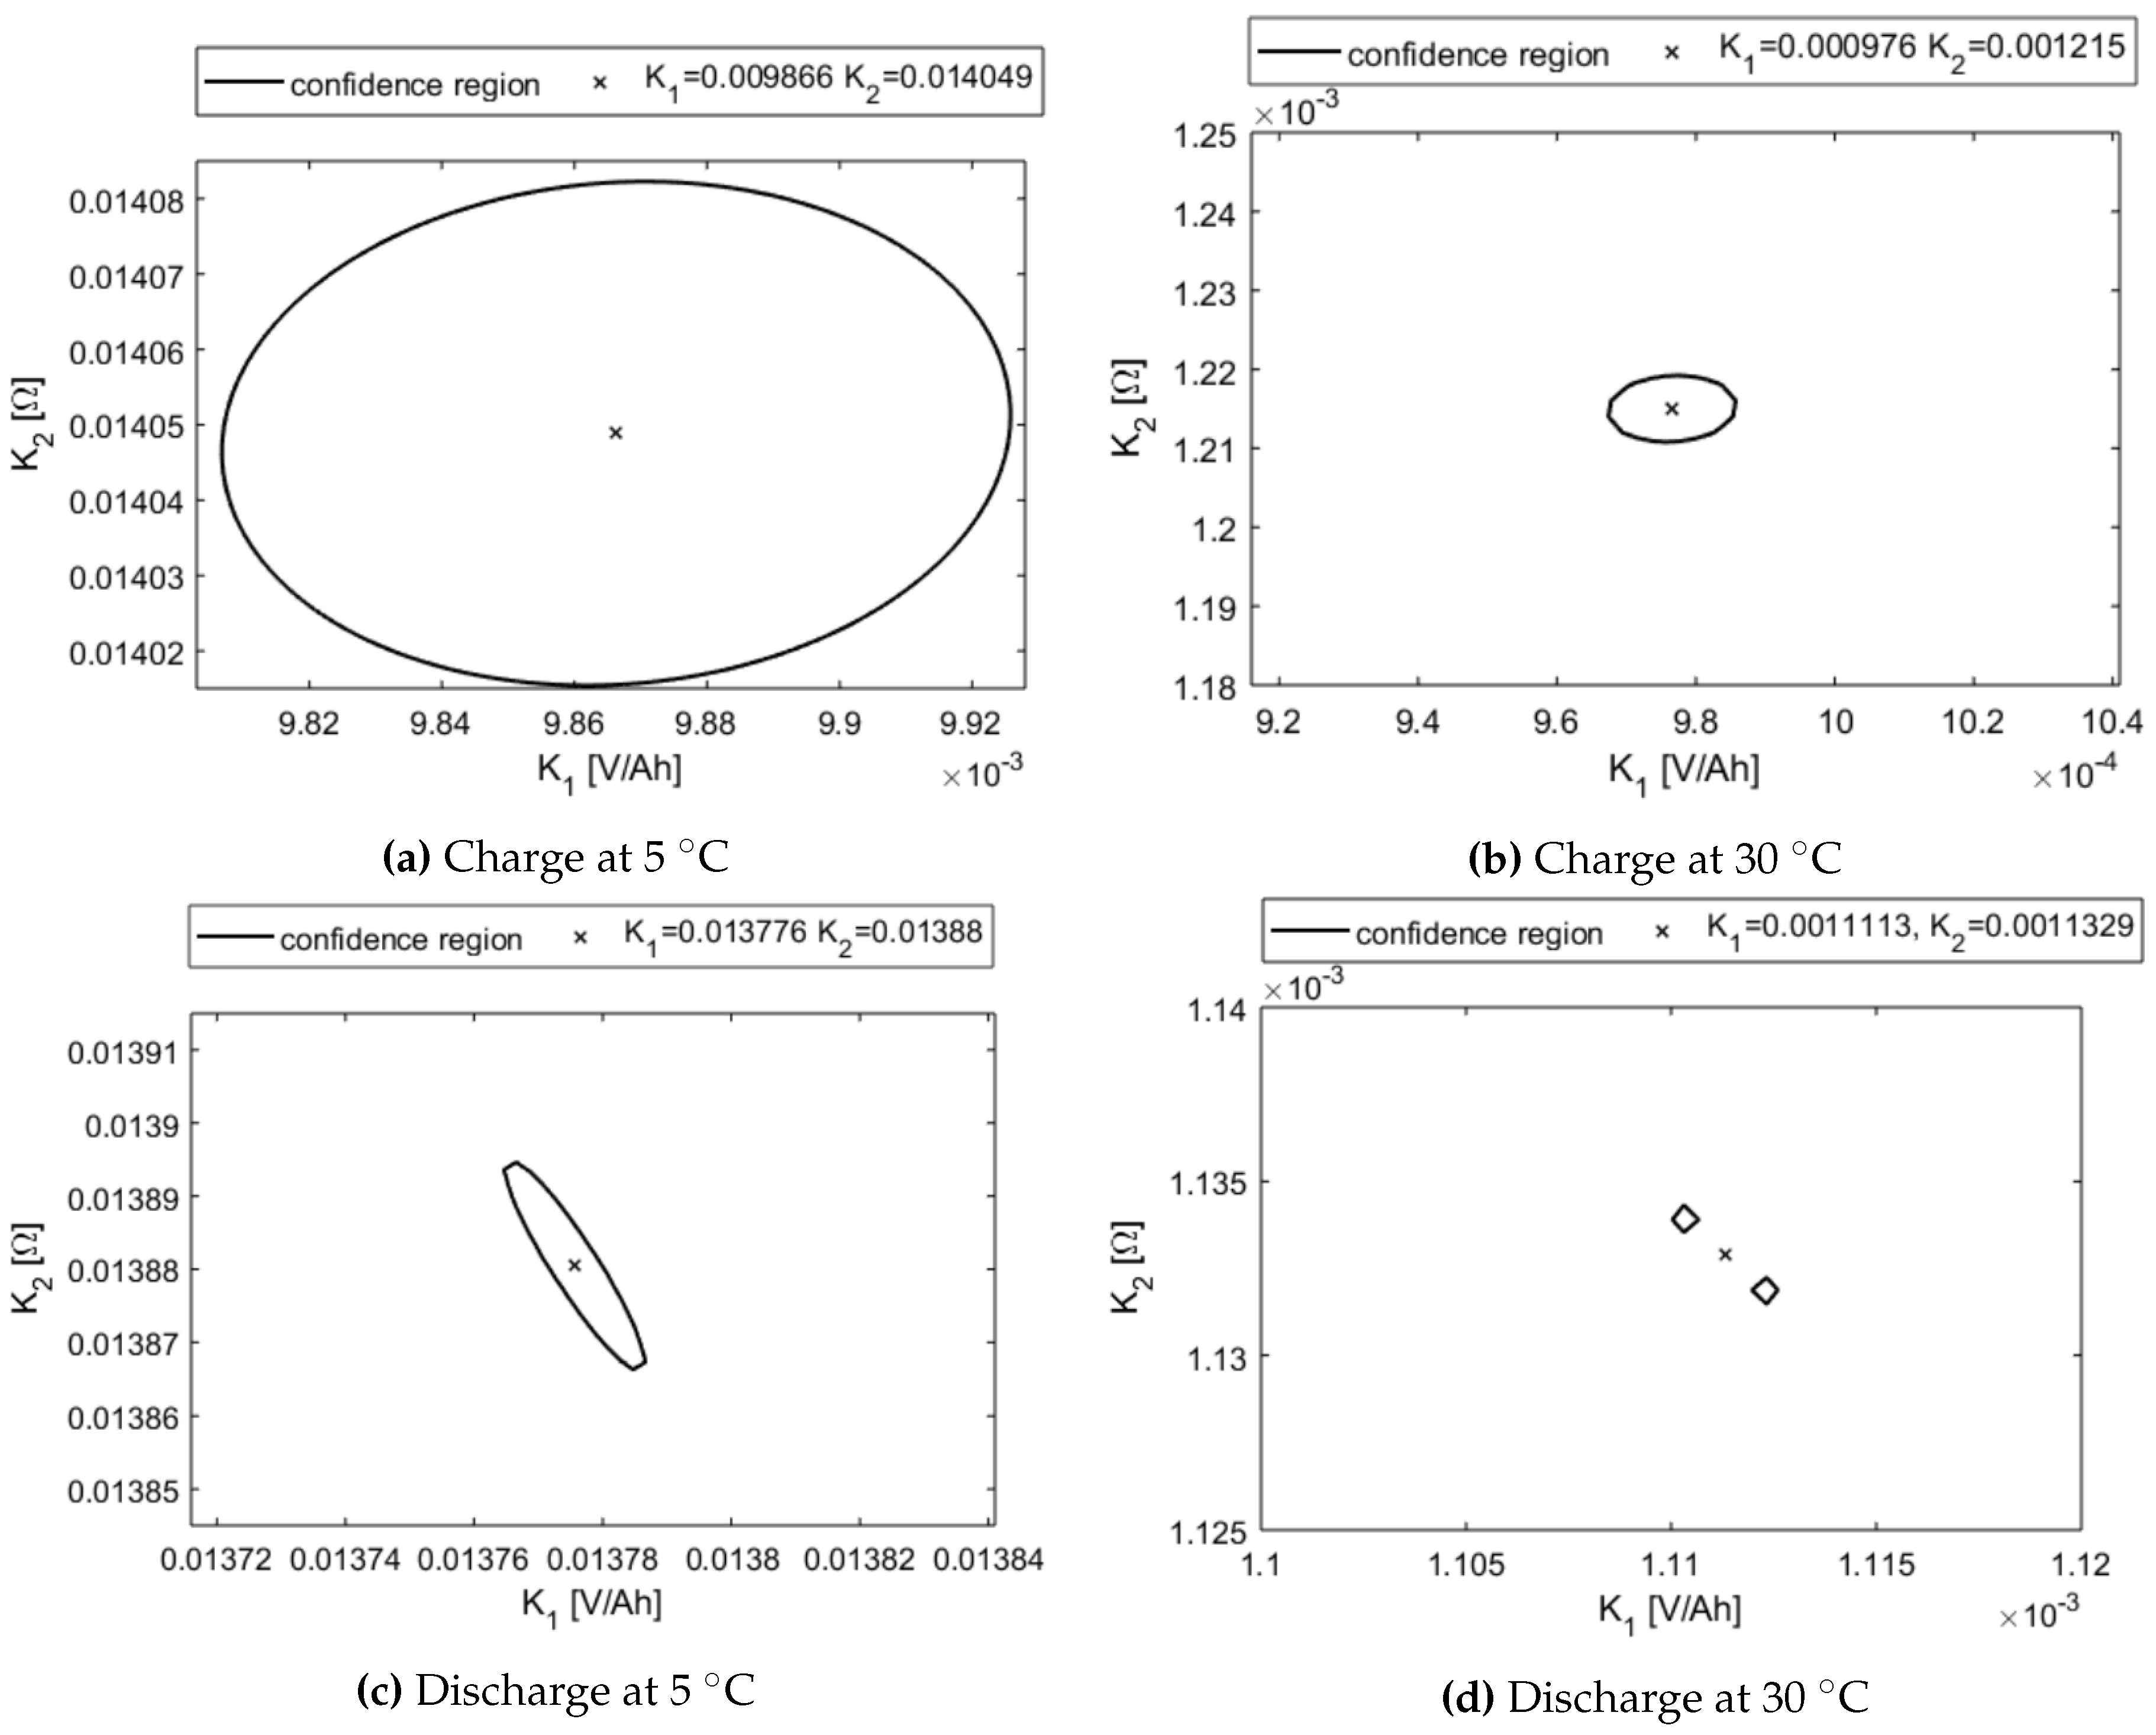
The confidence region of the estimated parameters can be approximated by the 1.05
contour line of the cost function
W. To analyze and illustrate the confidence regions, we analyzed the parameters in pairs. We fixed two parameters and computed the value of the cost function when changing the other two parameter values around their estimated value. The two parameters pairs were chosen as
and
. Some examples of the confidence regions in the case of charge/discharge at different temperatures are illustrated on
Figure 3 and
Figure 4. The order of magnitude on the x and y axes are the same in
Figure 3a–d and
Figure 4a–c respectively. In
Figure 4d, the axes are magnified for better visibility. Comparing the confidence regions at different temperatures and operating modes, the following conclusions can be drawn:
Looking at
Figure 5 and
Figure 6, it is apparent that the estimated values of
and
Q are more uncertain in the case of charge. This phenomenon can be explained by the confidence regions depicted in
Figure 3. It can be seen that the confidence region is wider in the case of charge, hence the uncertainty of the parameters are greater. It can be also noticed that the shape of the confidence region changes with temperature. At low temperatures, the confidence of the estimated
Q is smaller than the confidence of
. On the contrary, at high temperatures, the confidence of
Q becomes greater while the confidence of
decreases. That is why we can better estimate
Q at low temperatures and
at high temperatures. Additionally, the estimates are results of nonlinear optimization, which is affected by the initial values, stopping criteria, and the shape of the cost function.
4.2. Estimated Temperature Dependent Parameters
Having estimated the battery parameters at different ambient temperatures, the temperature dependency of the parameters was estimated with the help of the Matlab Curve Fitting Toolbox [
25]. Each parameter has two coefficients that describe the temperature dependency: the parameter value at the reference temperature and the temperature coefficient. The independent variables of the four different parameter estimation tasks are the following:
, in case of ;
, in case of ;
in case of and .
As mentioned in
Section 3.4.2, the cell temperature
T was substituted by the average surface temperature of the battery. The dependent variables are the estimated parameter values of the previous step that can be seen in
Table 4 and
Table 5.
The coefficients of the temperature dependency were estimated during both charge and discharge. The results of the estimation can be seen in
Table 6 and
Table 7. The 95% confidence bounds shows the uncertainty of the estimated coefficients.
It can be seen that the estimated temperature dependency of and Q is close to the nominal values in both charge and discharge cases. The estimation of and is better in the case of charge because the differences between the nominal and estimated parameter are smaller. However, the estimation of the other parameters is better in the case of discharge.
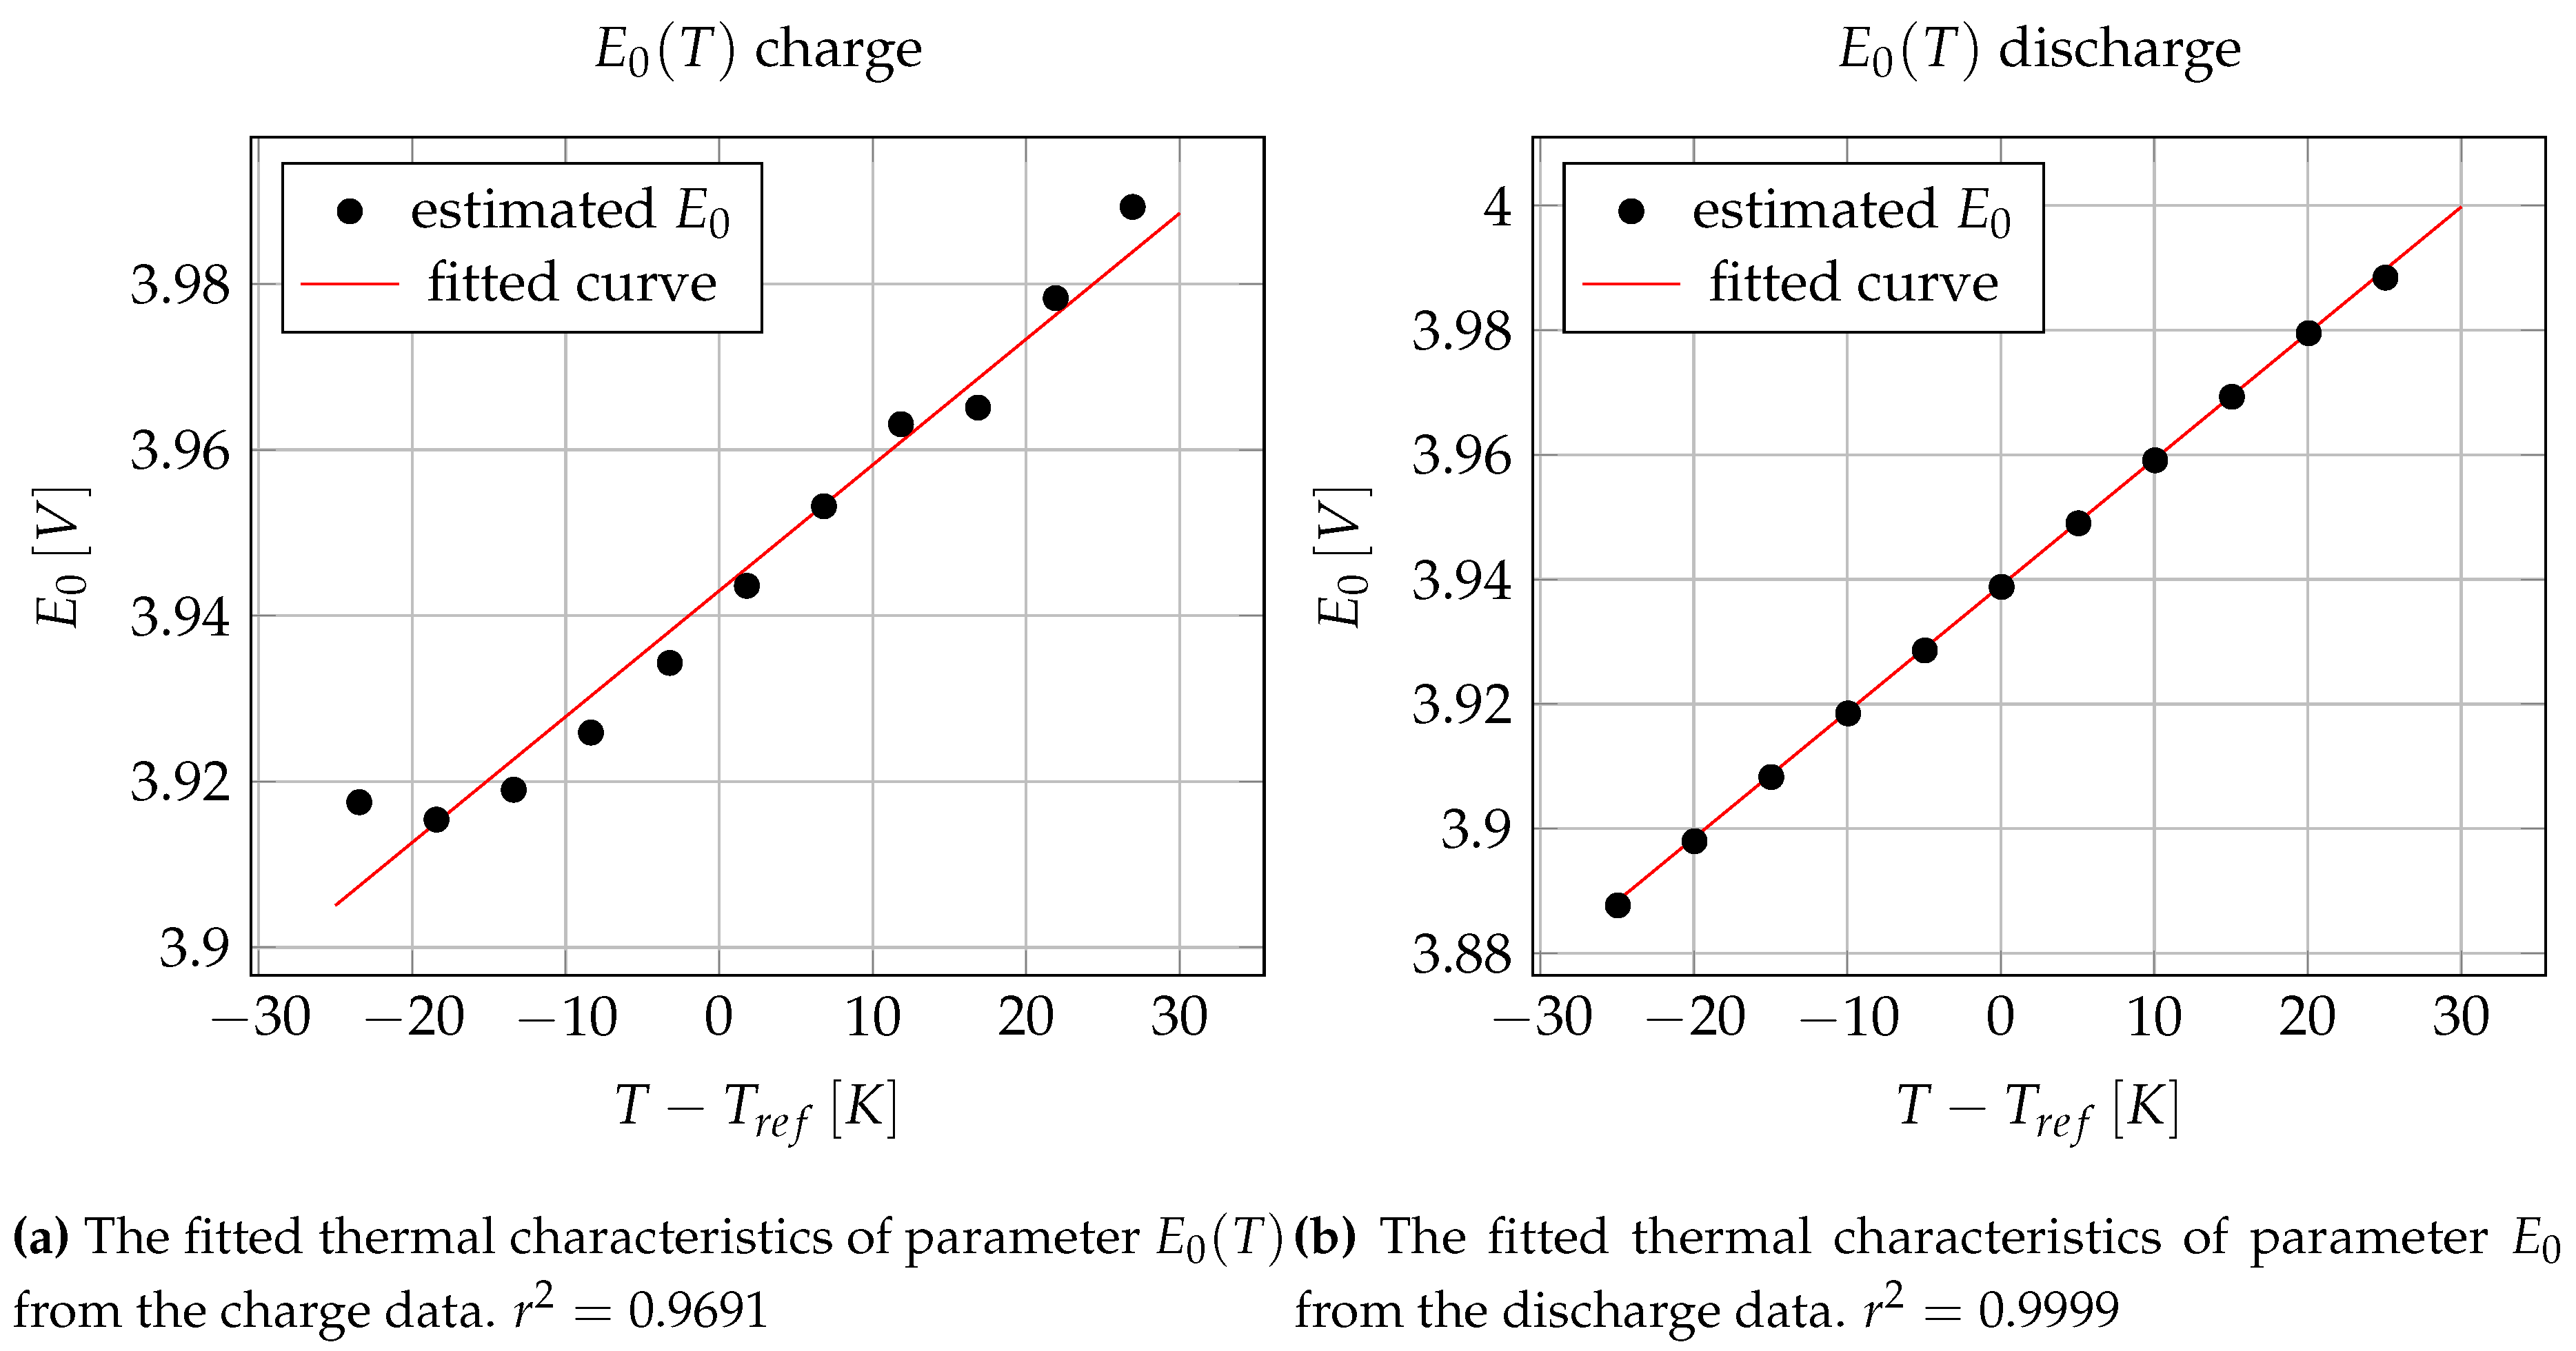
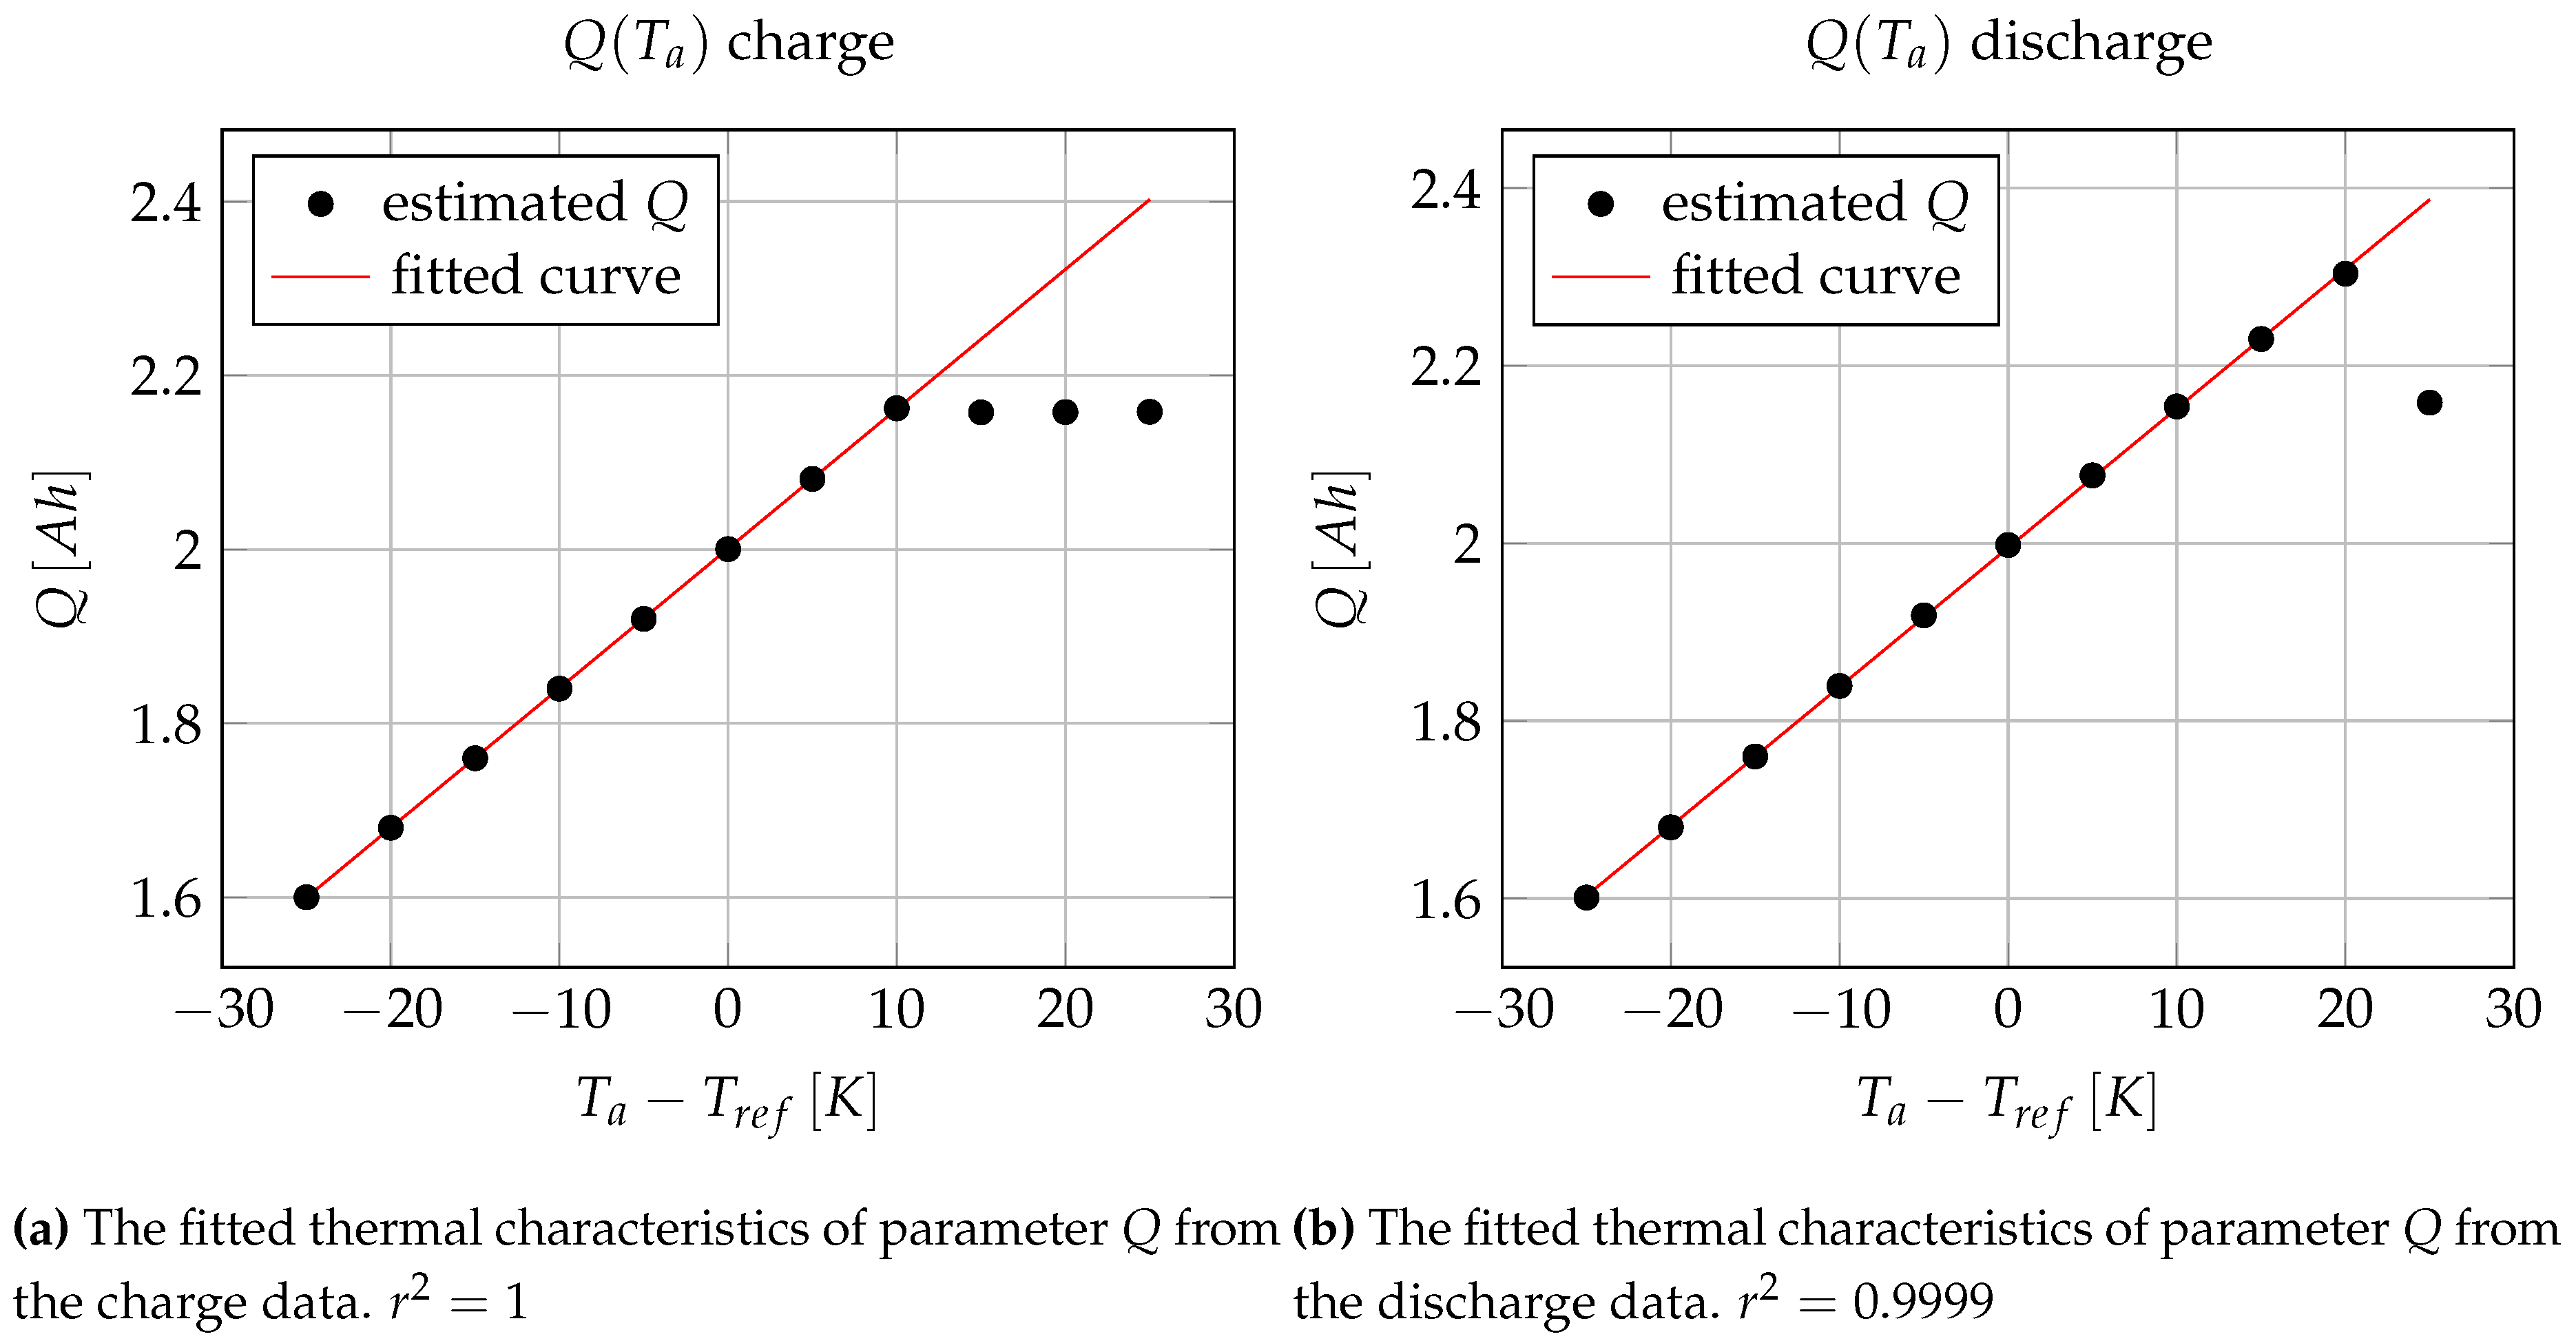
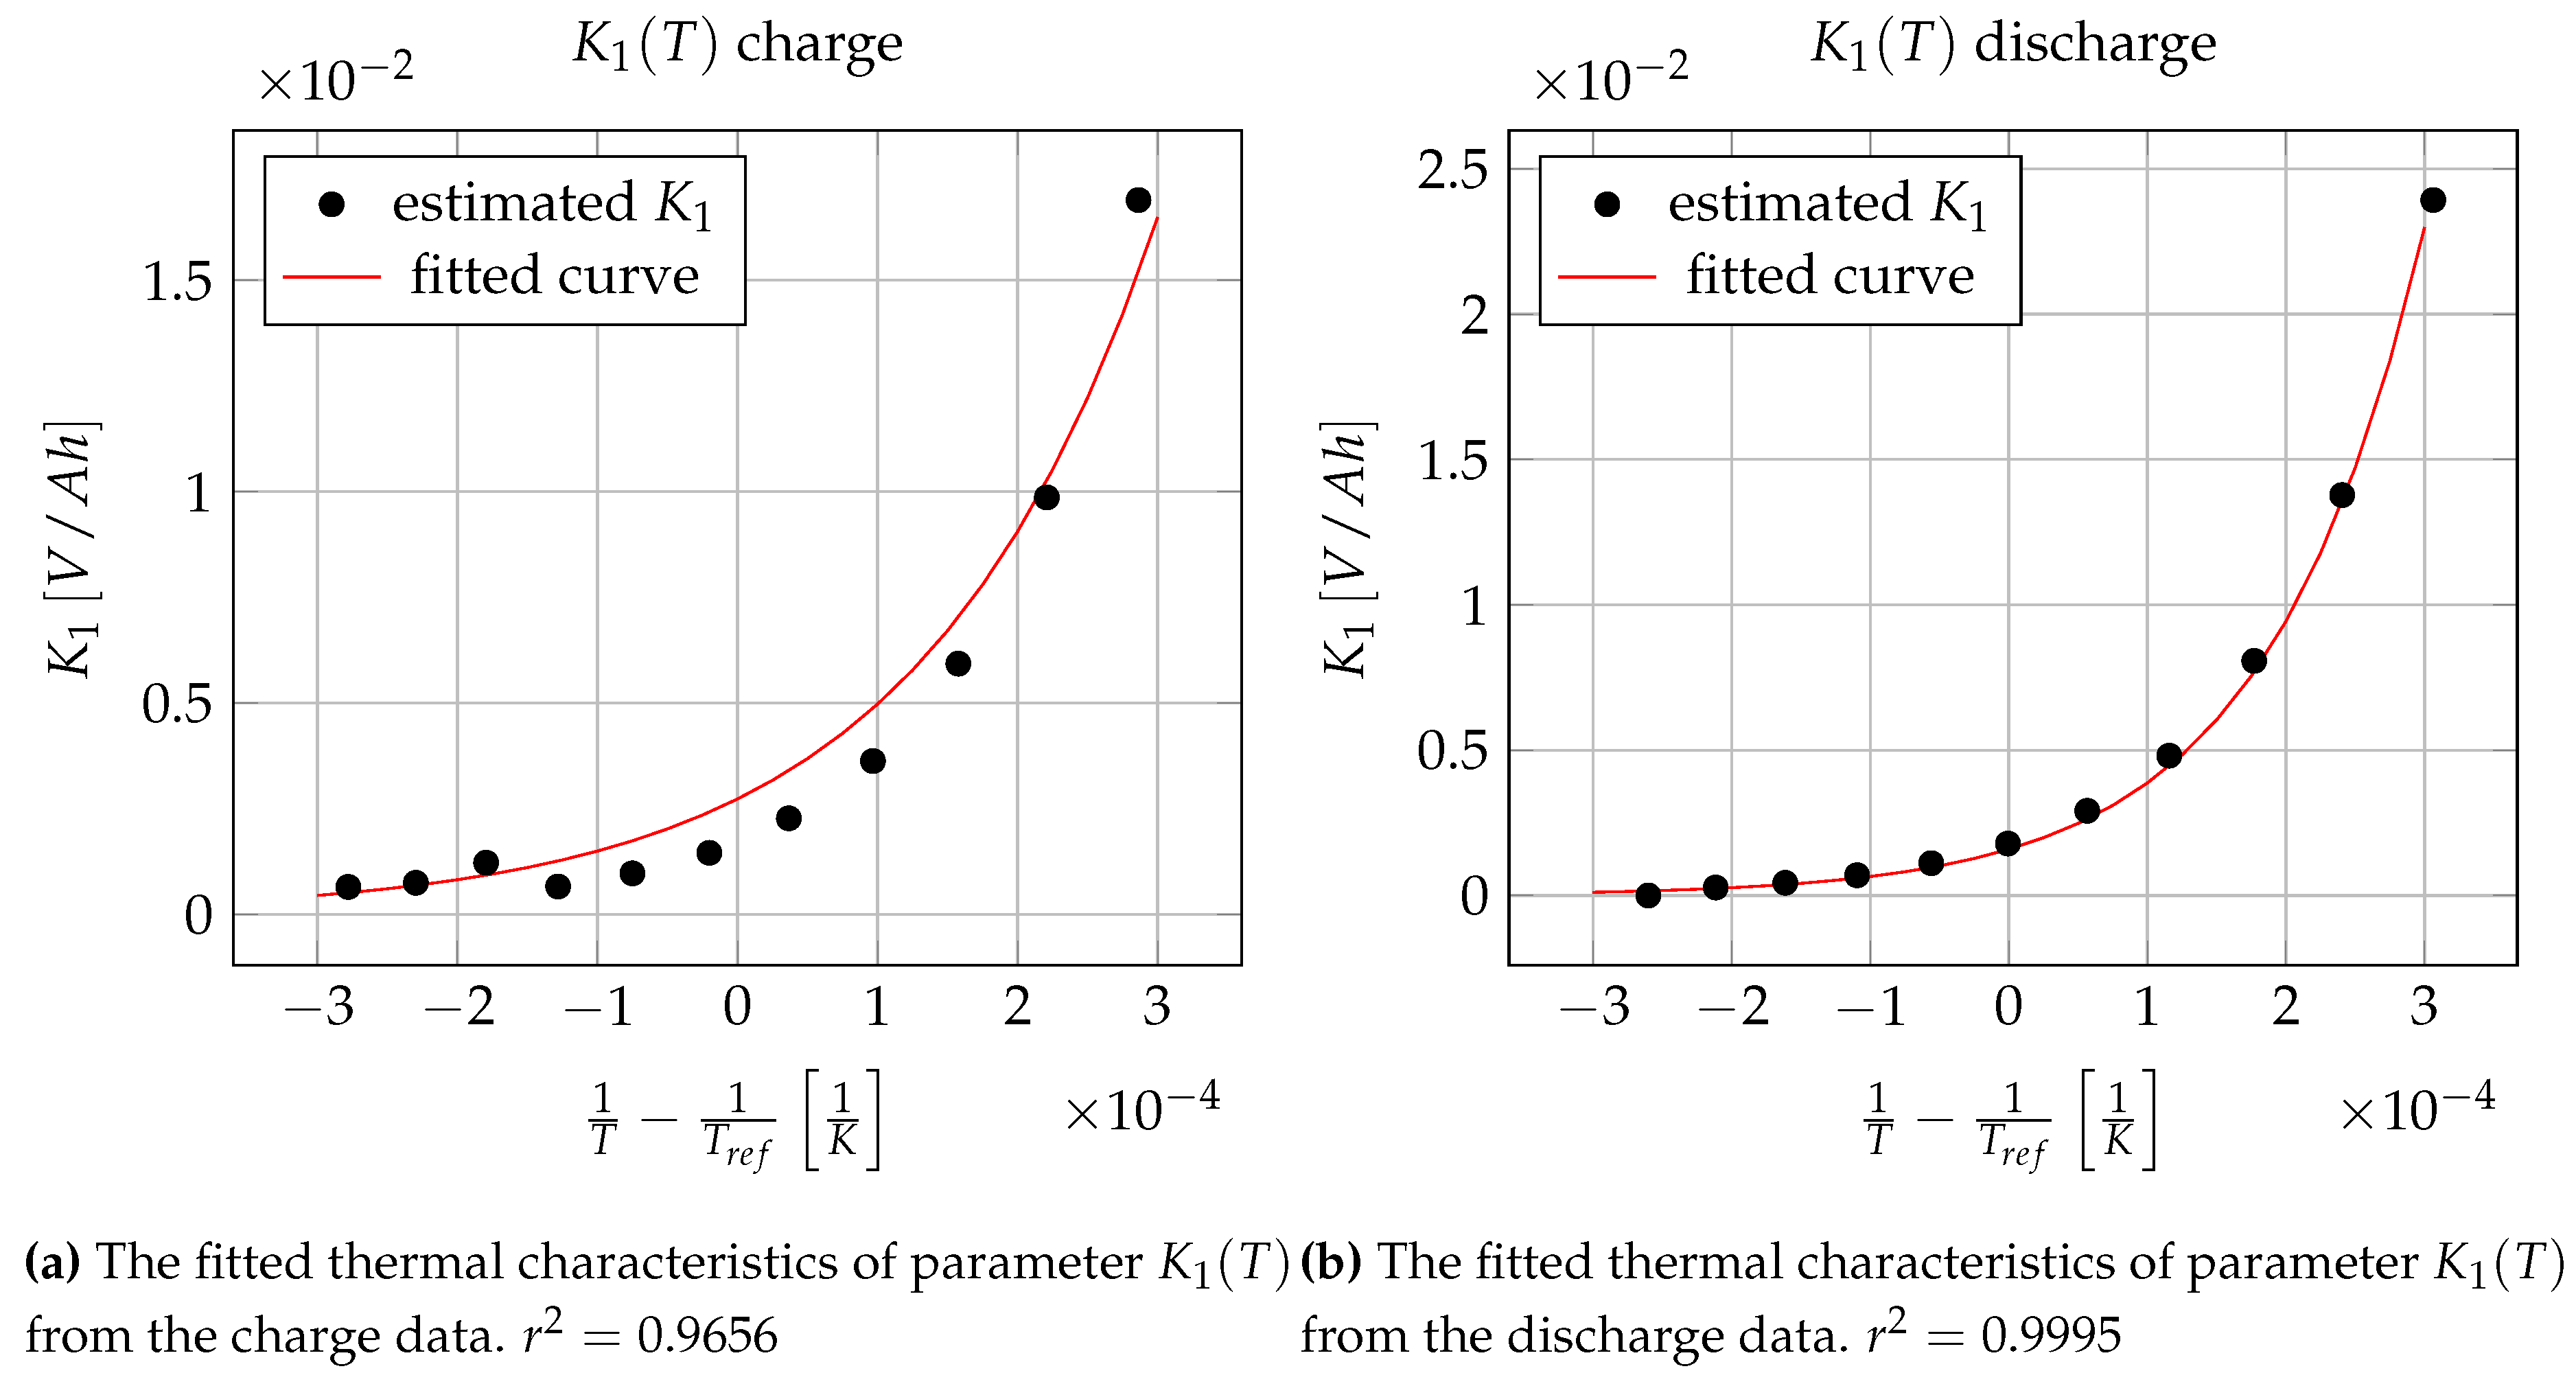
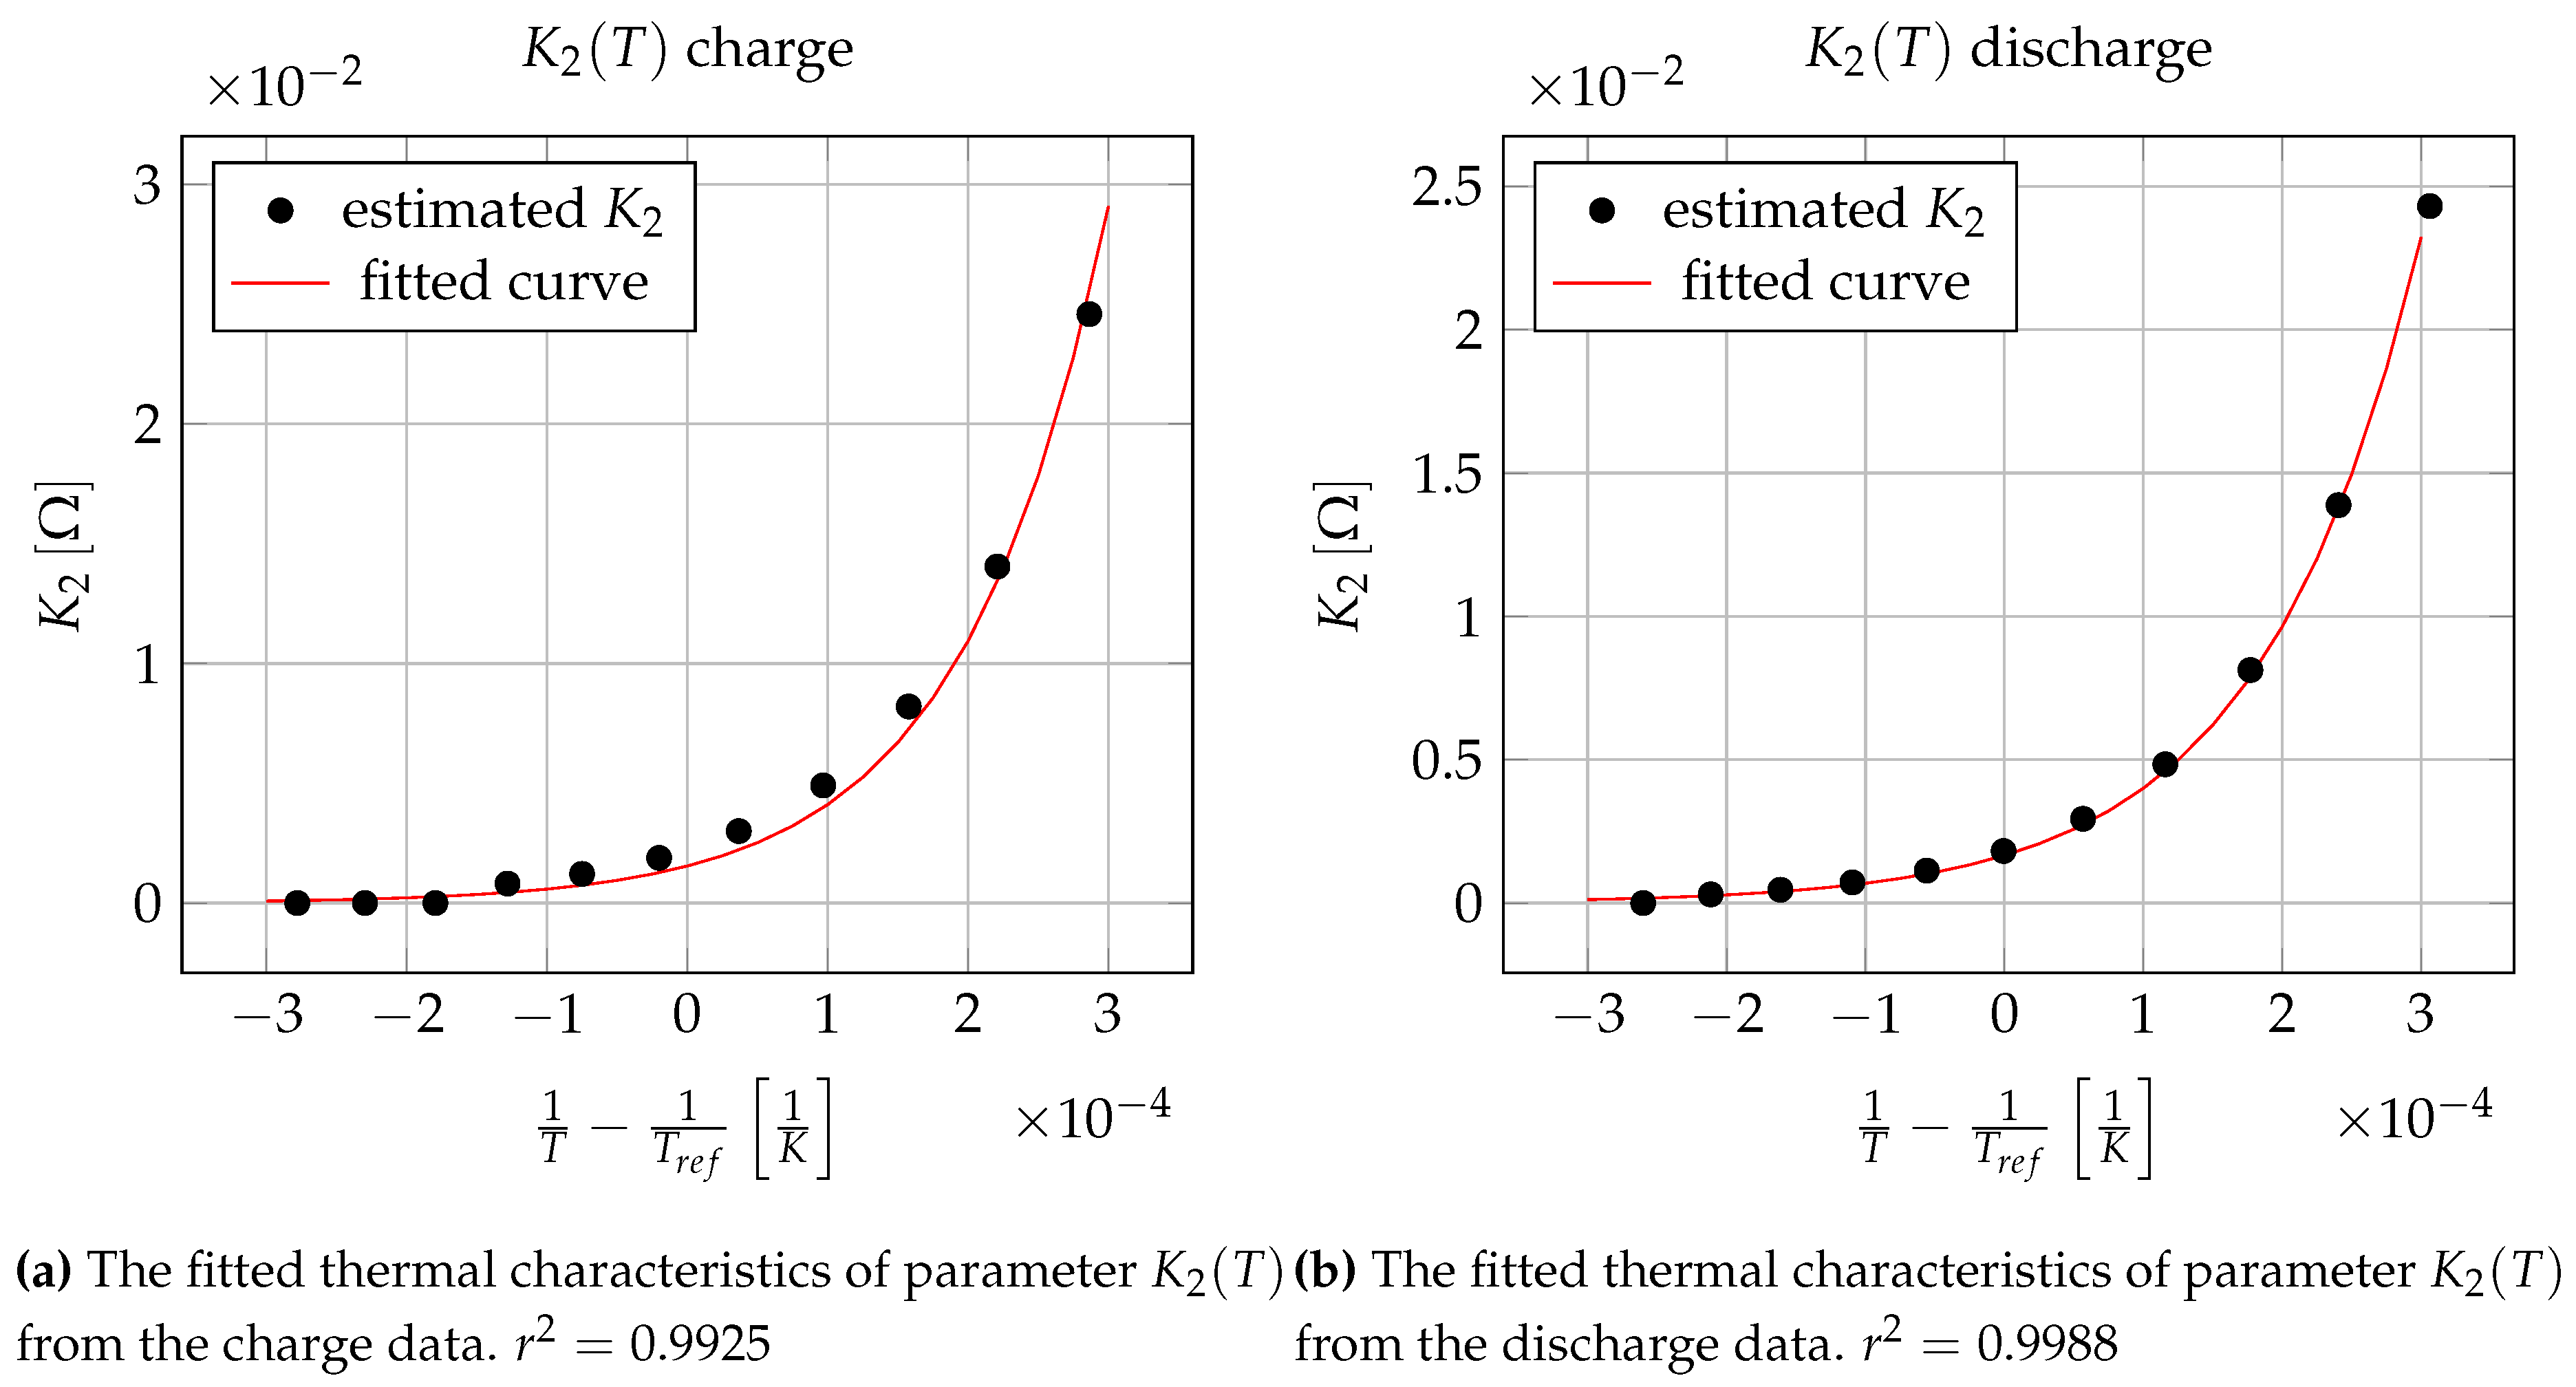
The fitted curves of the temperature dependency can be seen in
Figure 5,
Figure 6,
Figure 7 and
Figure 8 with red line. The goodness of fit was characterized by the
value that is computed by:
where
is the measured data,
y is the model predicted value, and
is the mean of the measured data. The results can be seen in
Table 8.
It can be seen that the curve fitting is a bit more accurate in case of discharge, except Q.
5. Conclusions and Future Work
An optimization based lithium-ion battery parameter estimation method is proposed in this paper that is capable of describing the thermal behavior of batteries. The basis of the method is a nonlinear charge and discharge model that describes the temperature dependency as a parametric function of temperature as an external variable.
Parameter sensitivity analysis was carried out on the model to find the parameters to be estimated, which are the electrode potential, the battery capacity, and two polarization constants. The internal resistance was found to be non-sensitive to the model output, thus it was not estimated.
The proposed parameter estimation method contains two steps. At first, the parameters are estimated from measured data of charging/discharging at different constant ambient temperatures. In the second step, the temperature coefficients of these parameters are estimated.
The proposed parameter estimation method was verified by a set of simulation experiments on an electro-thermal battery model capable of describing the energy balance (i.e., the thermal behavior) of the battery. The temperature dependent parameter characteristics obtained generated by the proposed method can be used as a computationally effective way of determining the key battery parameters at a given temperature. The novelty of the method is that the temperature dependent parameter characteristics can be estimated from charging profiles by the proposed method can be used as a computationally effective way of determining the key battery parameters at a given temperature. The proposed parameter estimation method was verified by simulation experiments on a more complex battery model that also describes the thermal behavior of the battery.
Further research directions include the use of this parameter estimation method for determining the state of health of the battery, and to estimate the temperature dependent state of charge during its life cycle. This is possible through a suitable experiment policy that estimates the battery capacity from well chosen charging operations under different thermal conditions. Therefore, extensive climate chamber experiments will be performed to validate the results of the present work.
