1. Introduction
By the end of 2050, at least 80% of the greenhouse gas emission of many countries will have been reduced. Wind energy, an abundant, widely distributed and environmentally friendly resource, is one of the most likely alternatives to petrochemical energy [
1]. In recent years, wind power technologies have been developed and the capacity of installed wind turbines has increased rapidly. As reported by the World Wind Energy Association (WWEA), the capacity of the installed wind turbines in China, India, Brazil, many other Asian markets, and some African countries, in 2018 grew robustly and strongly. For example, the new installed capacity in China amounts to 25.9 GW and China has become the first country with an accumulated installed wind power capacity of 221 GW by the end of 2018. However, nonlinearity and the fluctuations of wind power seriously influence its practical application [
2,
3,
4]. The problems compel engineers and researchers to develop more reliable and accuracy wind power forecasting (WPF) models.
In recent years, many statistical and artificial intelligent models based on historical wind power data and meteorological information [
1,
2,
3,
4,
5,
6,
7,
8,
9,
10,
11] have been developed for WPF. For example, Sebastian Brusca proposed a new spiking neural network-based system using wind speed data and wind direction of three different anemometric towers for predicting wind farm energy production [
5]. As stated by Meng [
6], neither single individual statistical forecasting approaches nor single artificial intelligent forecasting models can effectively catch the nonlinear characteristics of wind power time series; a single individual statistical method or artificial intelligent model suffers from large errors and cannot obtain high forecasting accuracy, thus, the single individual forecasting models may produce higher decision risk to wind farm operators for their larger forecasting deviations. Fortunately, hybrid models combining individual forecasting method with signal preprocessing technique can yield good prediction results and the hybrid methods in the previous relevant literatures have been proved to yield better forecasting results than the single individual prediction methods. For example, in the work by the authors of [
2], a novel hybrid intelligent method based on variational mode decomposition (VMD) and extreme learning machine (ELM) was proposed to predict short-term wind power. In the hybrid model, the original wind power data were disassembled into different modes by VMD, then, these subseries modes were utilized to construct training patterns and forecasting by ELM after feature selection. In the work by the authors of [
6], the original wind speed data were decomposed into different subseries by wavelet packet decomposition (WPD), then, this subseries were used as the inputs of artificial neural network (ANN) for short-term wind speed forecasting (WSF), the parameters in ANN were optimized by crisscross optimization algorithm. In the work by the authors of [
12], ensemble empirical mode decomposition (EEMD) was used as signal preprocessing technique to make the original wind speed data decomposed into more stationary subseries, and subsequently each subseries was utilized to train and test back-propagation neural network (BPNN) and the weights coefficients in BPNN were optimized by genetic algorithm (GA). The case studies illustrated the proposed EEMD-GA-BPNN obtained higher forecasting accuracy than the traditional GA-BPNN. From the above-mentioned literatures, some conclusions can be drawn that artificial intelligent forecasting method combined with the multiscale preprocessing technique can improve WSF/WPF accuracy effectively; in these hybrid forecasting models, preprocessing techniques are firstly used to decompose the original wind data into relatively stable subseries, and artificial intelligent forecasting engines make WSF/WPF using the decomposed components.
Although single signal preprocessing technique are indispensable in WSF/WPF, they cannot often handle the wind data thoroughly in that there is high fluctuation and a nonstationary and random character in wind speed. Liu et al. [
13] developed a novel hybrid approach combining the secondary signal decomposition algorithm (SDA) with Elman neural network to predict wind speed, in the SDA, FEEMD algorithm was utilized to re-decompose the high frequency, namely detailed components obtained by WPD, into different components. In the work by the authors of [
14], another SDA integrating empirical mode decomposition (EMD) and WPD was developed to decompose the wind speed for better WSP results. Peng et al. [
15] applied a compound WSF model combining the two-stage decomposition (TSD) with AdaBoost-extreme learning machine to make multistep WSF. These two-stage wind speed decomposition methods can eliminate the nonstationary of wind speed better in that the approaches yield higher accuracy. Thus, in this study, a TSD approach combining EEMD with wavelet transform (WT) is exploited to preprocess the original wind power time series.
Additionally, abnormal data or noise consist commonly in wind power data for malfunctioning sensors, measurement error or misoperation, etc., which is one considerable obstacle to achieving high WPF accuracy [
16]. In the work by the authors of [
17], binary particle swarm optimization and gravitational search algorithm (BPSOGSA) was developed as feature selection to identify and discard the ineffective candidate wind speed data. Coral reefs optimization algorithm (CRO) was employed to yield a reduced number of input variables from the output of the Weather Research and Forecast (WRF) model [
18], which were used as the input of ELM for WPF. The multiple imputation approach in the work by the authors of [
16] was applied to impute each missing wind power data using a vector of different plausible estimates. All of these wind power data processing have been proved to enhance the WPF accuracy. In this study, density-based spatial clustering of applications with noise (DBSCAN) method is developed to identify and discard abnormal data within wind power data.
Apart from applying the data processing method and parameter optimization algorithms on the individual forecasting engines to improve the forecasting quality, the integrations of multiple individual forecasting engines by artificial intelligent or optimization algorithm have been explored in the last few years [
3,
16,
17,
18,
19,
20,
21]. For example, Wang et al. [
3] proposed a new hybrid model based on a robust combination of different single individual forecasting models by Gaussian process regression (GPR) for probabilistic WSF. The preliminary forecasting results obtained by different base forecasting models were mapped into a feature space where the GPR approach was employed to integrate these candidates by a nonlinear way. In the work by the authors of [
20], a novel hybrid model based on weighted multiple forecasting machines with VMD was proposed for short-term WPF. In the hybrid model, the final forecasting results were obtained by combining the outputs of LSSVM, Echo State Network (ESN), and regularized extreme learning machine (RELM) using optimal weighted coefficients. In Ref. [
21], the modified support vector regression was explored to combine all the forecasting values generated by three base forecasting engines and yield the final forecasting values. These case studies in the literatures illustrate the hybrid forecasting model outperform the base forecasting engines.
5. Case Studies
All the simulated experiments are executed in an R2014a version Matlab with a Windows 8 operating system on a personal computer (PC) with CPU and . To illustrate the superiority of the proposal, the actual wind power data are randomly selected from the output of one wind turbine to test the proposed model and the three previously developed forecasting models. The forecasting effectiveness of the proposal is illustrated and compared comprehensively with other models in this section, which is divided into four subsections: statistical description of empirical wind power data, performance evaluation criteria, the proposed forecasting strategy modeling, and modeling parameter selection.
5.1. Empirical Wind Power Data Description
In this study, the empirical wind power data were collected from a wind farm located at the top of a mountain (32
28
N, 118
26
E) of 300 m height. The wind farm contains 23 wind turbines with a rated output power of 2250 kW, which can supply total installed capacity of 51.75 MW. Four sets of the original 1440 10-minute interval wind power time series are randomly selected from different wind turbine and illustrated in the
Figure 5. The first 1296 data points (those in blue in the subfigure of
Figure 5) are used as the training data, and the subsequent 144 data points, in red in the subfigure, are employed to test the models. From the figure, it can be seen that the original wind power time series exhibit high nonlinearity and randomness. The statistical description for the empirical wind power time series is listed in
Table 1.
5.2. Performance Evaluation Criteria
To access the forecasting capacity of the proposal and other comparative models, two widely used statistical indices, namely, normalized root-mean-square-error (NRMSE) and normalized mean absolute error (NMAE) [
2,
20], are applied to measure forecasting results, which are expressed as Equations (
20) and (
26). To illustrate the improving degree of the proposed forecasting strategy over the other comparing models, the improved indexes of NMAE and NRMSE, as shown in Equations (
27) and (
28), are utilized to evaluate the models.
NRMSE reveals the overall deviation between the measured and forecasting values, whereas NMAE can illustrate the similarity between the measured and forecasting values. Thus, these two statistical indices can evaluate comprehensively the forecasting performance of the base forecasting engines.
5.3. Forecasting Strategy Modeling and Simulation
The 1st to 1296th wind power time series in the subfigure of
Figure 5 are utilized to train the forecasting engines, and the subsequent 1297th to 1440th values are employed to test the forecasting engines. To illustrate the superiority of the proposal, three previously developed forecasting models are constructed and compared. In this section, modeling of the proposed short-term WPF using the wind power dataset A is carried out, the modeling process for the other wind power datasets B are made in the same manner.
5.3.1. Identification of Abnormal Wind Power Data Using DBSCAN Algorithm
There exist some abnormal data, also named erroneous data, in the wind power time series, which are generally caused by measurement error or maintenance operation. Apart from these reasons, dirt on the blades and other operational problems can also produce the deviations from the normal power curve. These abnormal data that influence the training results should not be employed as the training samples. The experienced analysts can manually identify and filter the subtle errors abnormal data in the stored historical data in the supervisory control and data acquisition (SCADA) files, but is time-consuming and expensive.
To yield the best forecasting results, an automatic filter method DBSCAN is utilized to identify and trim the abnormal data in the preprocessing step. To eliminate the adverse influence on the discontinuity of the missing data on the prediction results, Lagrange interpolation method is employed to get the corrected values of the missing points. In the DBSCN, rolling window amplitude, radius of search space and Minpts are set as 40, 2, and 209, respectively. The abnormal wind power data identified by DBSCAN are shown in
Figure 6a. The abnormal data are modified by Lagrange interpolation method, which is illustrated in
Figure 6b.
5.3.2. Wind Power Data Preprocessing
As suggested by Jiang et al. [
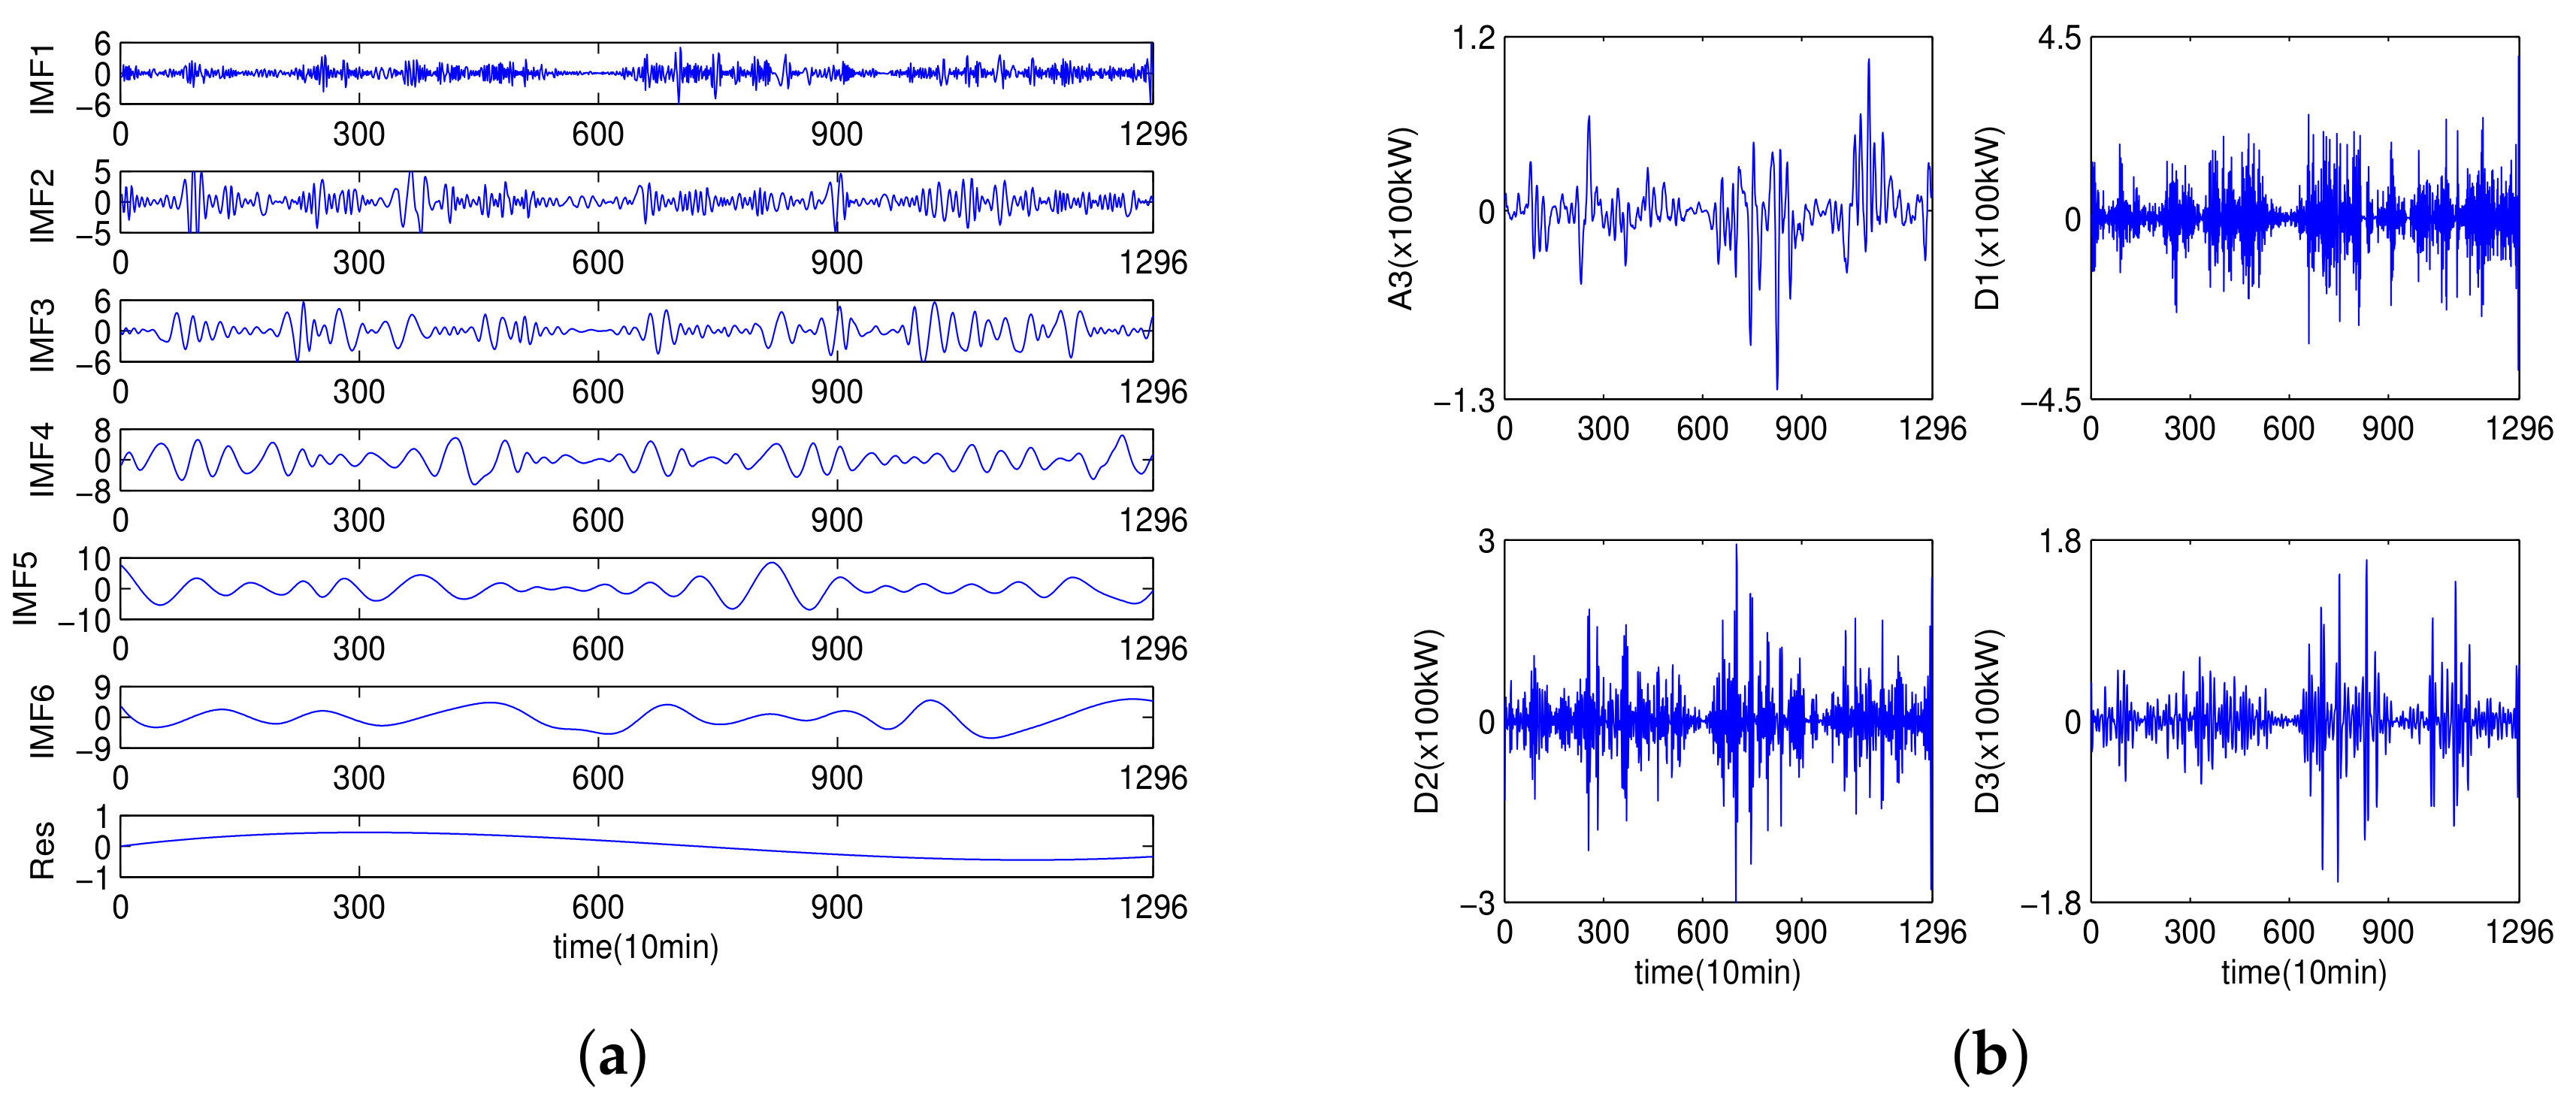
41], the ensemble number and the amplitude of the added Gaussian distribution white noise in EEMD are set to 100 and 0.2, respectively. Owing to the high fluctuation and randomness characteristic of wind speed, the EEMD algorithm is employed to break the original wind speed data into different relatively stable IMFs and one residual (Res), which is shown in
Figure 7a. From IMF1 to Res, the frequencies decrease while the wavelength increases. Among these subseries, IMF1 with highest frequency reveals the detailed information, and the Res reflects the general tendency of original empirical wind speed. In the second decomposition stage, the IMF1 is decomposed into four subseries, namely A3, D1, D2 and D3, by WT to further reduce nonstationarity and fluctuation of IMF1, which is displayed in the
Figure 7b.
The input–output candidate matrix of each decomposed subseries is constructed for training and testing. The input vector of each base forecasting engine can be represented as
and the output as
, where
, and
k denote the time point, dimension of input variables, and forecasting step, respectively. Prior to forecasting, the dimensions of the input variables are obtained by the PACF technique. Lags from 1 to 30 are calculated and the input candidate dimensions of the other subseries are listed in
Table 2. The input and output format for LSSVM model are displayed as
Figure 8, which illustrates that the inputs of the forecasting engine can be from the past values of the target variable.
5.4. Modeling Parameter Selection
The artificial intelligent methods ELM, WNN, and LSSVM and statistical approach ARIMA are employed as the base forecasting engines in the proposed model. The parameters in the artificial intelligent methods are tuned by the optimization algorithm BSA. In the modeling, the parameters are selected as following.
- i:
In the ARIMA, the order of autoregressive and moving average play a significant role in the construction of the model and influence its performance. The fitting effects are measured by Akaike’s information criteria (AIC) to determine the lag order of ARIMA; in other words, the smallest AIC values mean the optimal lag order of ARIMA. The detailed parameter selection for ARIMA can be referred to the work by the authors of [
37].
- ii:
For the BSA algorithm, the population size and iteration number are set as 30 and 100, respectively. The dimension numbers of input nodes, hidden nodes, and output nodes in ELM are set according to the works by the authors of [
2,
34], and the parameters in WNN are determined according to the work by the authors of [
32]. The dimension in BSA-LSSSVM is set as 2.
6. Comparisons and Performance Analysis
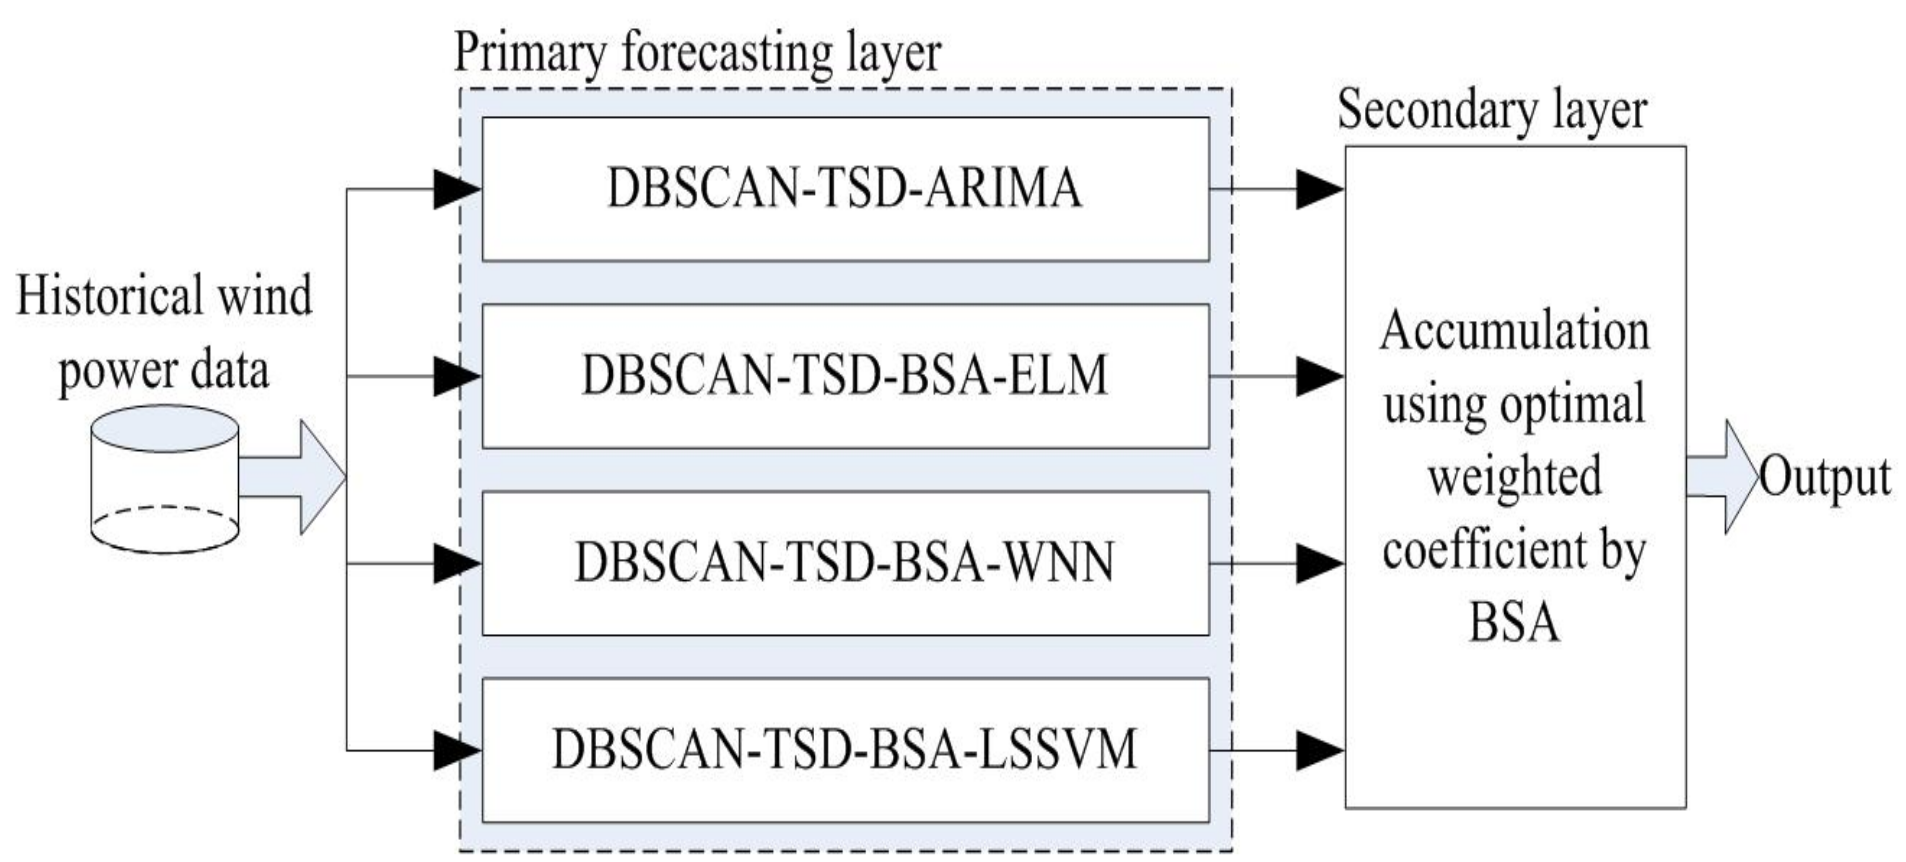
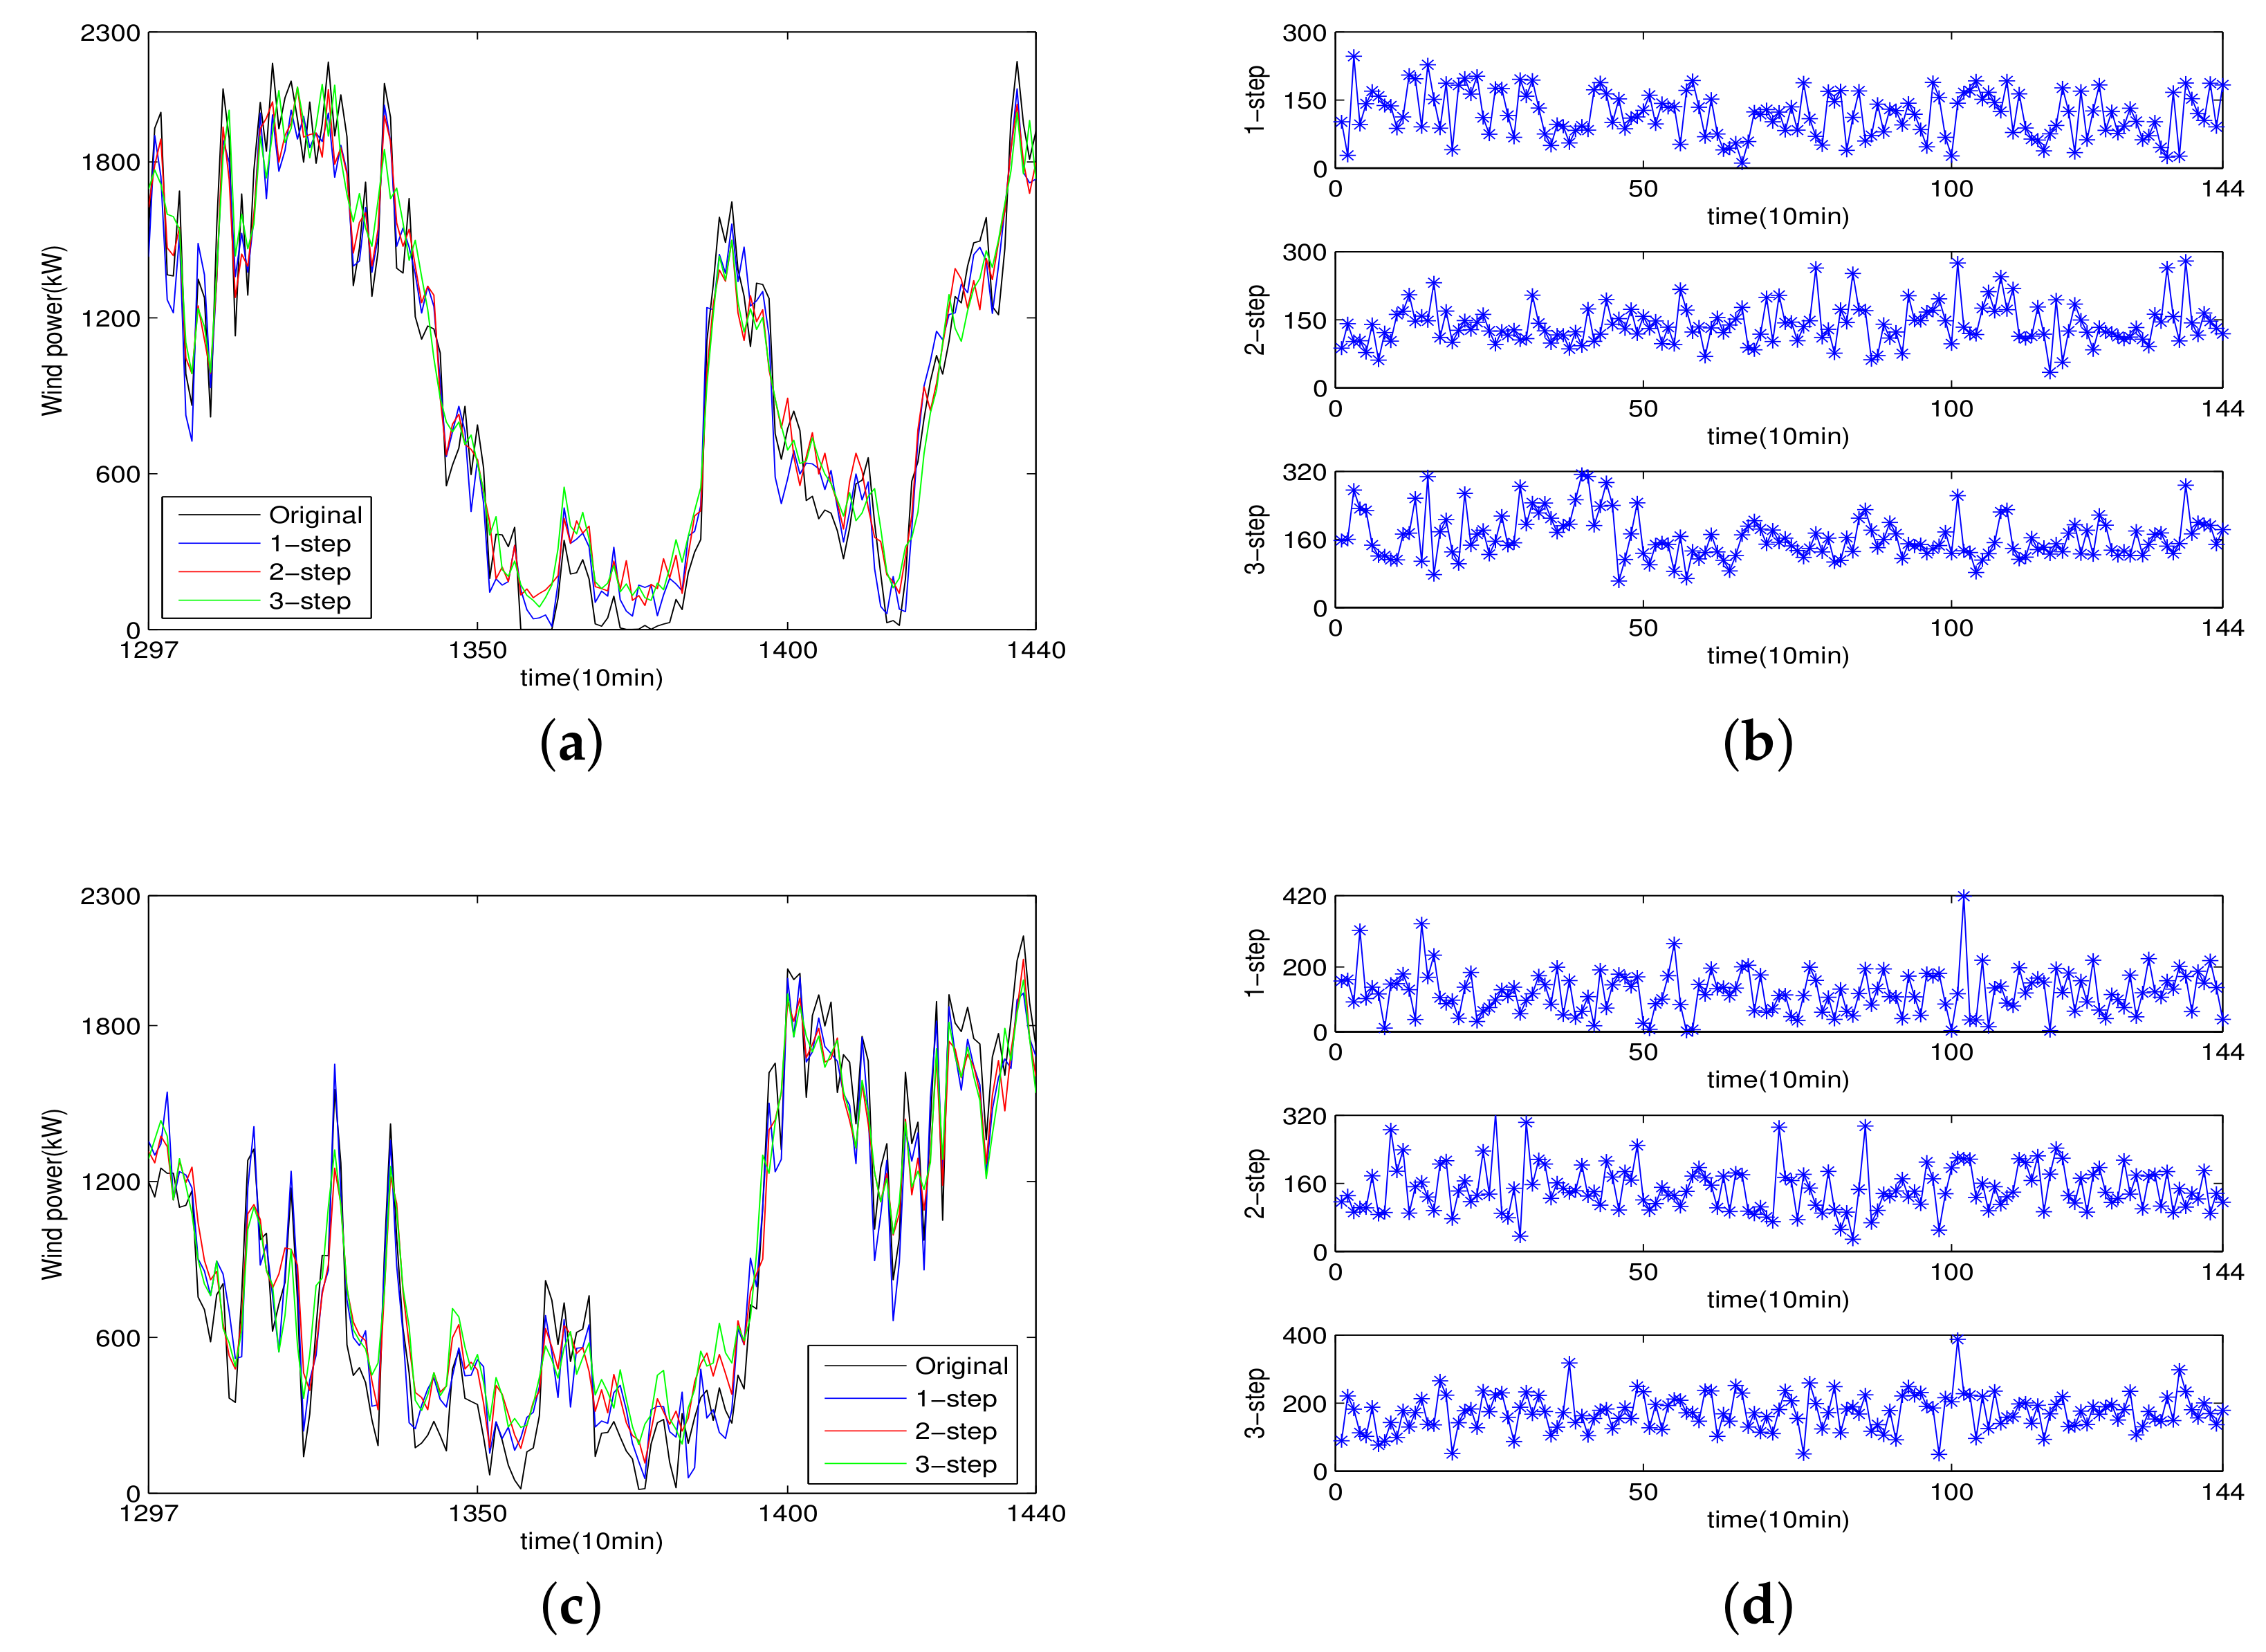
In the proposed WPF, the individual artificial intelligent forecasting engines in the proposed hybrid models are trained and tested using the optimization algorithm with the preprocessed wind power data, and the future 1-day wind power data are predicted in 1-step, 2-step, and 3-step horizontal in the primary forecasting layer. Then, the optimization algorithm BSA is also utilized to make an ensemble of the predicted outputs of the individual forecasting engines by optimal weights in the secondary forecasting layer, and the forecasting results are shown in
Figure 9.
To compare and analyze the proposal comprehensively, two categories of experiments are constructed in this section: (1) First, the individual models, including ARIMA, BSA-ELM, BSA-WNN, and BSA-LSSVM, and the individual models with the TSD method, namely, TSD-ARIMA, TSD-BSA-ELM, TSD-BSA-WNN, and TSD-BSA-LSSVM, are established to make multistep WPF; (2) second, four based forecasting models, including DSCAN-TSD-ARIMA, DSCAN-TSD-BSA-ELM, DSCAN-TSD-BSA-WNN, and DSCAN-TSD-BSA-LSSVM, and three recently developed forecasting models are constructed for further comparisons, which can effectively illustrate the superiority of the proposal.
Experiment I: The statistical indexes of the multistep forecasting results and their improved indexes are listed in
Table 3 and
Table 4, respectively. As seen from the statistical indices listed in
Table 3, some comparisons and analysis for wind power dataset A are carried out as follows.
- i:
Among the four individual forecasting models, the BSA-LSSVM approach performs best in multi-step-ahead prediction, the NRMSE values of BSA-LSSVM are smallest. For dataset A, the NRMSE values of BSA-LSSVM are 9.8063%, 11.0931%, and 12.4766% in 1-step, 2-step, and 3-step, respectively, whereas those of BSA-ELM, BSA-WNN, and ARIMA are 10.5605%, 11.6710%, and 12.9604%; 10.8760%, 12.1886%, and 13.4546%; 12.7560%, 14.3098%, and 16.1302% in 1-step, 2-step, and 3-step, respectively. From the statistical indexes, the ARIMA model performs worst in multi-step-ahead prediction.
- ii:
From the statistical indexes listed in the
Table 3, the four individual forecasting engines with signal decomposition approaches TSD perform better than the four individual forecasting engines without signal decomposition technique. For dataset
A, compared with the individual statistical approach ARIMA, the index NRMSE of TSD-ARIMA method leads to reductions of 3.1416%, 3.7195%, and 4.1245% in 1-step, 2-step, and 3-step, respectively; the NRMSE values of TSD-BSA-LSSVM method over those of BSA-LSSVM approach in 1-step, 2-step, and 3-step forecasting are cut by 2.3458%, 2.4726%, and 2.8162%, respectively.
- iii:
From the improved indexes listed in the
Table 4, the improved index
values of the proposal over TSD-ARIMA are 40.6093%, 34.6905%, and 30.8045% for 1-step, 2-step, and 3-step forecasting, respectively. Compared with TSD-BSA-LSSVM, the improved index
values of the proposal are 23.4616%, 17.8418%, and 14.0065% for 1-step, 2-step, and 3-step forecasting, respectively.
Remarks: The artificial intelligent models ELM, WNN, and LSSVM have better regression capacity in signal process than statistical approaches ARIMA, especially in dealing with nonlinear signal, because the artificial intelligent models can better capture nonlinear signal components. Not only the statistical model ARIMA, but also the intelligent models WNN, ELM, and LSSVM with signal decomposition TSD, can yield better forecasting performance, the reasons of which are that the original wind powder time series are highly fluctuate, nonlinear, and random and the signal decomposition method TSD decomposes the wind power into a few relatively stable time series and relieves the forecasting difficulties of the four forecasting engines, thus making great contributions to enhance the forecasting performance. For the four based forecasting models, the predicting accuracy decreases with the forecasting step increasing. The LSSVM-based method performs best among the hybrid forecasting models and individual forecasting models because LSSVM excels in dealing with the small sample and nonlinear signals. For the wind power data, B, similar conclusions can be also obtained.
Experiment II: In this section, the forecasting results obtained by four based forecasting models and their improved indexes are listed in the
Table 5 and
Table 6, respectively. The proposed WPF integrating the four based forecasting models is employed to make multistep WPF by optimal weighted coefficients. The results show that the integrated forecasting model performs better than the four based benchmark WPF model. From
Table 5 and
Table 6, the reasons why the proposed compound forecasting strategy can outperform the other hybrid forecasting models are drawn as follows.
- i:
As can be seen from
Table 3 and
Table 5, the four based forecasting engines that are embedded with signal decomposition TSD and abnormal signal identification technique DBSCAN perform better than those based models that embedded with sign decomposition TSD. For dataset
A, compared with TSD-ARIMA model, the NRMSE values of DBSCAN-TSD-ARIMA are decreased by 0.6759%, 0.4754%, and 0.6024% in 1-step, 2-step, and 3-step, respectively. Compared with TSD-BSA-LSSVM, the NRMSE values of DBSCAN-TSD-BSA-LSSVM are decreased by 0.4829%, 0.5959%, and 0.3706% in 1-step, 2-step, and 3-step, respectively.
- ii:
Each method has its strengths and weaknesses, and every forecasting engine has its own merits and disadvantages. The proposed combined model takes advantages of the individual merits of statistical method and artificial intelligent approaches by optimal weighted coefficients. The model comparisons in terms of statistical indexes illustrate that the proposed combined model outperforms the four based forecasting models. For dataset
A in the
Table 5, compared with DBSCAN-TSD-ARIMA, the NRMSE values of the proposal lead to reduction of 3.2284%, 3.1984%, and 3.0959%, in 1-step, 2-step, and 3-step, respectively; compared with DBSCAN-TSD-BSA-WNN, the NRMSE values of the proposal lead to reduction of 1.9781%, 1.9567%, and 2.0054% in 1-step, 2-step, and 3-step, respectively; compared with DBSCAN-TSD-BSA-ELM, the NRMSE values of the proposal lead to reduction of 1.714%, 1.7739%, and 1.7114% in 1-step, 2-step, and 3-step, respectively; compared with DBSCAN-TSD-BSA-LSSVM, the NRMSE values of the proposal lead to reduction of 1.2674%, 1.1081%, and 1.0925% in 1-step, 2-step, and 3-step, respectively. Seen from the improved statistical indices in
Table 6, compared with the DBSCAN-TSD-BSA-LSSVM model, the
of the proposal are 18.1645%, 13.8093%, and 11.6226% in 1-step, 2-step, and 3-step, respectively. For dataset
B, a similar conclusion can be also obtained.
Remark: Compared with the forecasting statistical indexes listed in
Table 3 and
Table 5, the abnormal data identification DSCAN has improved the prediction accuracy in NRMSE and NMAE values. This is because DBSCAN identifies and discards the abnormal data within the wind power time series and eliminates some disturbing factors. The foregoing operations including abnormal data identification, two-stage decomposition and parameters optimization in the first forecasting layer can make the four based forecasting engines easier to capture and deal with the nonlinear relationship within the wind power time series. The forecasting performance of the individual forecasting engines might change with different wind power time series, which influences seriously the actual industrial application, one solution to this problem is to take advantages of some different plausible forecasting engines.
In the further comparisons, the recently developed models including WPD-HPSOGSA-ELM [
34], EEMD-HGSA-LSSVM [
39], and TSD-HBSA-DAWNN [
42] are constructed to illustrate the effectiveness of the proposed model. The forecasting results and their improved indexes are listed in the
Table 7 and
Table 8, respectively. As seen from
Table 7 and
Table 8, the proposed combined forecasting model yields better forecasting performance than the previous developed hybrid models WPD-HPSOGSA-ELM, EEMD-HGSA-LSSVM, and TSD-HBSA-DAWNN for multistep prediction. For example, the improved NRMSEs
of the proposal over the EEMD-HGSA-LSSVM model for dataset
A are 19.4469%, 15.0278%, and 11.9169%; for dataset
B are 12.6462%, 14.3813% and 12.1499% in 1-step, 2-step, and 3-step, respectively. The way of the proposed wind power prediction model integrating four basic hybrid models by optimal weighted coefficients increases the complexity of the prediction strategy, but it is not a challenging problem for current computer technology.
7. Conclusions
In this study, a compound forecasting strategy combining multiple forecasting enginess with clustering, two-stage decomposition, and parameter optimization is proposed for short-term WPF. The forecasting framework includes four based hybrid forecasting models in the first layer and optimal integration of four individual forecasting models by optimization algorithm BSA in the secondary layer. Two sets of wind power time series are selected from a wind farm located in Anhui, China, to evaluate the performance of the proposed forecasting strategy. From comprehensive comparisons between the proposed model and other different forecasting models, some conclusions can be obtained as follows.
- i:
The aforementioned comparisons and analysis illustrate that the prediction performance of the four hybrid models TSD-ARIMA, TSD-BSA-ELM, TSD-BSA-WNN and TSD-BSA-LSSVM can be remarkably improved when compared with the individual forecasting models regardless of BSA-LSSVM, BSA-WNN, BSA-ELM, or ARIMA. Compared with TSD-ARIMA, TSD-BSA-WNN, TSD-BSA-ELM, and TSD-BSA-LSSVM models, these four based forecasting engines with DBSCAN and TSD methods obtain better forecasting results. Therefore, wind power data preprocessing method TSD and DBSCAN can effectively contribute to the forecasting performance of the forecasting engines because TSD decomposes the empirical wind power into relatively reliable components and DBSCAN idenitifies the abnormal wind power data.
- ii:
In the primary forecasting layer, the statistical method ARIMA excels in catching the linear variables within wind power, whereas the artificial intelligent approaches ELM, WNN, and LSSVM have good capacities in processing the nonlinear variables. What is more, the artificial intelligent algorithm BSA is employed to optimize the parameters combination in the ELM, WNN, and LSSVM for avoiding local optima. In the end, BSA is developed to tune the weighted coefficients for optimal combination of individual advantages of the four based hybrid forecasting models. Therefore, the proposed hybrid model outperforms all the four based hybrid forecasting models.
- iii:
For dataset A, compared with the recently developed forecasting models WPD-HPSOGSA-ELM, TSD-HBSA-DAWNN, and EEMD-HGSA-LSSVM, the NRMSE errors of the proposal are cut by 2.0776%, 2.1628%, and 2.1601%; 1.6826%, 1.7215%, and 1.6013%; and 1.3785%, 1.2232%, and 1.1239% in 1-step, 2-step, and 3-step forecasting, respectively. A similar conclusion can be obtained for dataset B.
Therefore, the proposed hybrid model combining multiple forecasting engines with clustering approach, two-stage decomposition and parameter optimization is an efficient and effective wind power forecasting method. For further studies, this proposed forecasting strategy will be evaluated for other wind farms using environmental and meteorological information and historical wind power data.


