Article

Additive Aerodynamic and Thermal Effects of a Central Guide Post and Baffle Installed in a Solar Updraft Tower

1
Department of Mechanical Engineering, College of Engineering, Chung-Ang University, 84 Heukseok-ro, Dongjak-gu, Seoul 06974, Korea
2
Department of Mechanical System Engineering, Graduate School, Chung-Ang University, 84 Heukseok-ro, Dongjak-gu, Seoul 06974, Korea
*
Author to whom correspondence should be addressed.
S.L. and S.K. are the co-first authors.
Energies 2019, 12(18), 3506; https://doi.org/10.3390/en12183506
Submission received: 2 August 2019 / Revised: 5 September 2019 / Accepted: 6 September 2019 / Published: 11 September 2019
(This article belongs to the Special Issue Solar Thermoelectric Generators)

Abstract

:
The solar updraft tower (SUT) is a renewable power generation system that uses natural air convection from the ground that is heated by solar radiation. Placing flow-guide structures within the collector of the SUT can enhance aerodynamic performance, and hence, increase the kinetic power. Here, we propose a central guide post (CGP) structure in the SUT that controls updraft flow. The effect of the CGP geometry on aerodynamic performance was investigated using computational fluid dynamics modeling (ANSYS Fluent 19.2) to show that a CGP can play a positive role by preventing stagnation of the airflow at the center of the collector, resulting in increased kinetic power output (up to ~2%). However, excessively long CGPs retarded airflow, resulting in a dramatic decrease in kinetic power output. We also investigated a system with both a CGP (to improve aerodynamic performance and minimize energy loss) and a heat-exchange baffle (to maximize thermal energy transfer). When installed with a proper distance between components, the CGP and baffle showed a combined effect of increasing the kinetic power output by up to 10%. We expect that our proposed method using the CGP and baffle system will contribute to the development of better future SUT technology.

1. Introduction

The solar updraft tower (SUT) system that can produce renewable energy from natural air convection currents resulting from solar heating of the ground under the tower. A typical SUT system consists of a central chimney, a collector that absorbs solar radiation, and an absorber that forms the bottom of the system. The roof of the collector is made from a transparent material. Solar radiation with large energy and short wavelength passes through the roof and transfers energy to the interior of the SUT. However, when the radiation that is absorbed by the absorber and is re-emitted is redistributed in the collector, energy is reduced, and the wavelength does not pass through the roof. This is the basic principle of the greenhouse effect, and based on this principle, the SUT has more heat energy inside than on the outside. Hence, the SUT contains more thermal energy inside compared with that of the external environment. This results in an increase in temperature at the base of the collector, which decreases the density of air, resulting in buoyancy and an updraft of the hot air through the chimney, where the hot air finally exits the tower (Figure 1a). The kinetic energy of the rising air flow is used to operate a wind turbine installed at the entrance of the chimney and produce electricity. Hence, SUT is an energy harvesting system that converts surrounding natural thermal energy into electrical energy; this is of great potential in modern society where there a high demand for environmentally friendly power generation systems. This technology also has the advantages of low operating and maintenance costs after the initial installation, as it does not use auxiliary equipment that requires fuel or power. Because the initial SUT concept was first proposed in the late 1970s [1], various efforts have been made to improve its performance and/or usability. For example, various SUT geometries with a divergent chimney [2] or sloped collector [3] have been investigated, along with the installation of an auxiliary heat source to improve roof permeability by removing condensation on the roof in the absence of solar radiation [4], and combination of the SUT with customized systems such as freshwater production [5]. However, the SUT is not well appreciated from the economic point of view, and therefore more diverse, in-depth studies are needed to increase the efficiency and performance.
One approach for enhancing the performance of the SUT system is using existing thermo-fluid dynamic components and systems. The guide vanes used in various industrial flow dynamic systems are used to improve the aerodynamic performance by guiding fluid flow in the desired direction. As an example, guide vanes were installed on a vertical axis wind turbine, improving the power coefficient by 48% [6]. Air conditioning ducts have also been applied to the guide vane in the duct branches to reduce resistance, and the resistance reduction rate was predicted to be 4.3–263.8% [7]. Hence, it was proposed that guide vanes should be installed in the SUT systems to properly control air flow, which is expected to increase efficiency, as flow dynamics in the collector and chimney are sensitive to flow cross-section area and rapid changes in the flow direction near the bottom of the chimney. Such a guide vane (in the form of a guide wall) was installed at the Manzanares SUT in Spain (the only practical SUT system presently existing), and a 40% increase of the power output was reported [8]. Baffles are another type of thermo-fluid dynamic component frequently used in heat exchanger systems, as they can increase the efficiency of the system by enhancing heat transfer. In our previous studies on the height and location of baffles, baffles have been shown to play an active role in the transfer of heat accumulated in the absorber to the air flow in the SUT. In a study of baffle height, the positive and negative effects of the baffle within the SUT was investigated, and performance improvement of up to 4.69% was confirmed [9]. The baffle location influences flow, which is divided into circulating flow and main flow in the collector, and it was confirmed that the baffle located at the inlet of the collector contributes the most toward enhancing the performance of the SUT [10].
Considering these previous studies, we hypothesized that simultaneous use of baffles and other types of aerodynamic components, such as guide vanes, in SUT systems could result in interesting additive effects. We proposed a quantitative study of the positive and negative interactions of the various components that is necessary to further improve SUT performance. This study quantitatively analyzes the aerodynamic function and effectiveness of a guide vane installed at the center of a SUT collector using computational fluid dynamics (CFD) models. In addition, the case where a baffle is installed simultaneously was analyzed to characterize the interaction between the baffle and guide vane. The guide vane was designed to improve the aerodynamic performance, and hence, was placed at the center of the collector in this study (as shown in Figure 1b), which is the region where the direction of flow changes significantly from radial (in the collector) to vertical (in the chimney). In this study, the guide vane installed at the center of the collector is referred to as the central guide post (CGP). As the function of the baffle is to improve thermal energy transfer, it was placed at the inlet of the collector in this study so that the flow efficiently received thermal energy in the collector. By analyzing the role of the CGP and baffle in the SUT and the effect of mutual interactions (both negative and positive), an optimal SUT system can be developed that takes advantage of both thermo-fluid dynamic components. The proposed methods and models are expected to provide insight for engineers and designers of future SUT systems when combining various thermo-fluid dynamic components to enhance aerodynamic performance.

2. Theoretical Background

The flow in the SUT is generated by natural convection and its Reynolds number is usually high enough to induce turbulent flow. The equations governing this flow are the continuity equation (Equation (1), the Navier–Stokes equation (Equations (2) and (3)), and the energy equation (Equation (4)). Since the shape of the SUT system is axisymmetric, the aforementioned governing equations are expressed using cylindrical coordination [11,12].
t ( ρ ) + 1 r r ( ρ r u ) + y ( ρ v ) = 0 ,
t ( ρ u ) + 1 r r ( ρ r u u ) + y ( ρ u v ) = p r + 1 r r ( r μ u r ) + y ( μ u y ) 2 μ u r 2 ,
t ( ρ v ) + 1 r r ( ρ r u v ) + y ( ρ v v ) = p y + 1 r r ( r μ v r ) + y ( μ v y ) + ( ρ 0 ρ ) g ,
t ( ρ T ) + 1 r r ( ρ r u T ) + y ( ρ v T ) = 1 r r ( r λ C p T r ) + y ( λ C p T y ) .
The main phenomena generating flow in the SUT is natural convection and buoyancy, which is often described by the Boussinesq model [13]. To calculate buoyancy, the Boussinesq model assumes a constant density in the governing equations, except in the buoyancy term of the momentum equation. On the basis of the simplicity of the density calculations, this model provides better convergence in CFD analysis than the use of the ideal or incompressible ideal gas models. The density of the buoyancy term in the momentum equation is given by Equation (5), where ρ0 is the constant density of the working fluid, β is the thermal expansion coefficient, and T0 is the operating temperature.
(ρρ0)g ≈ − ρ0β(TT0)g.

3. Methods

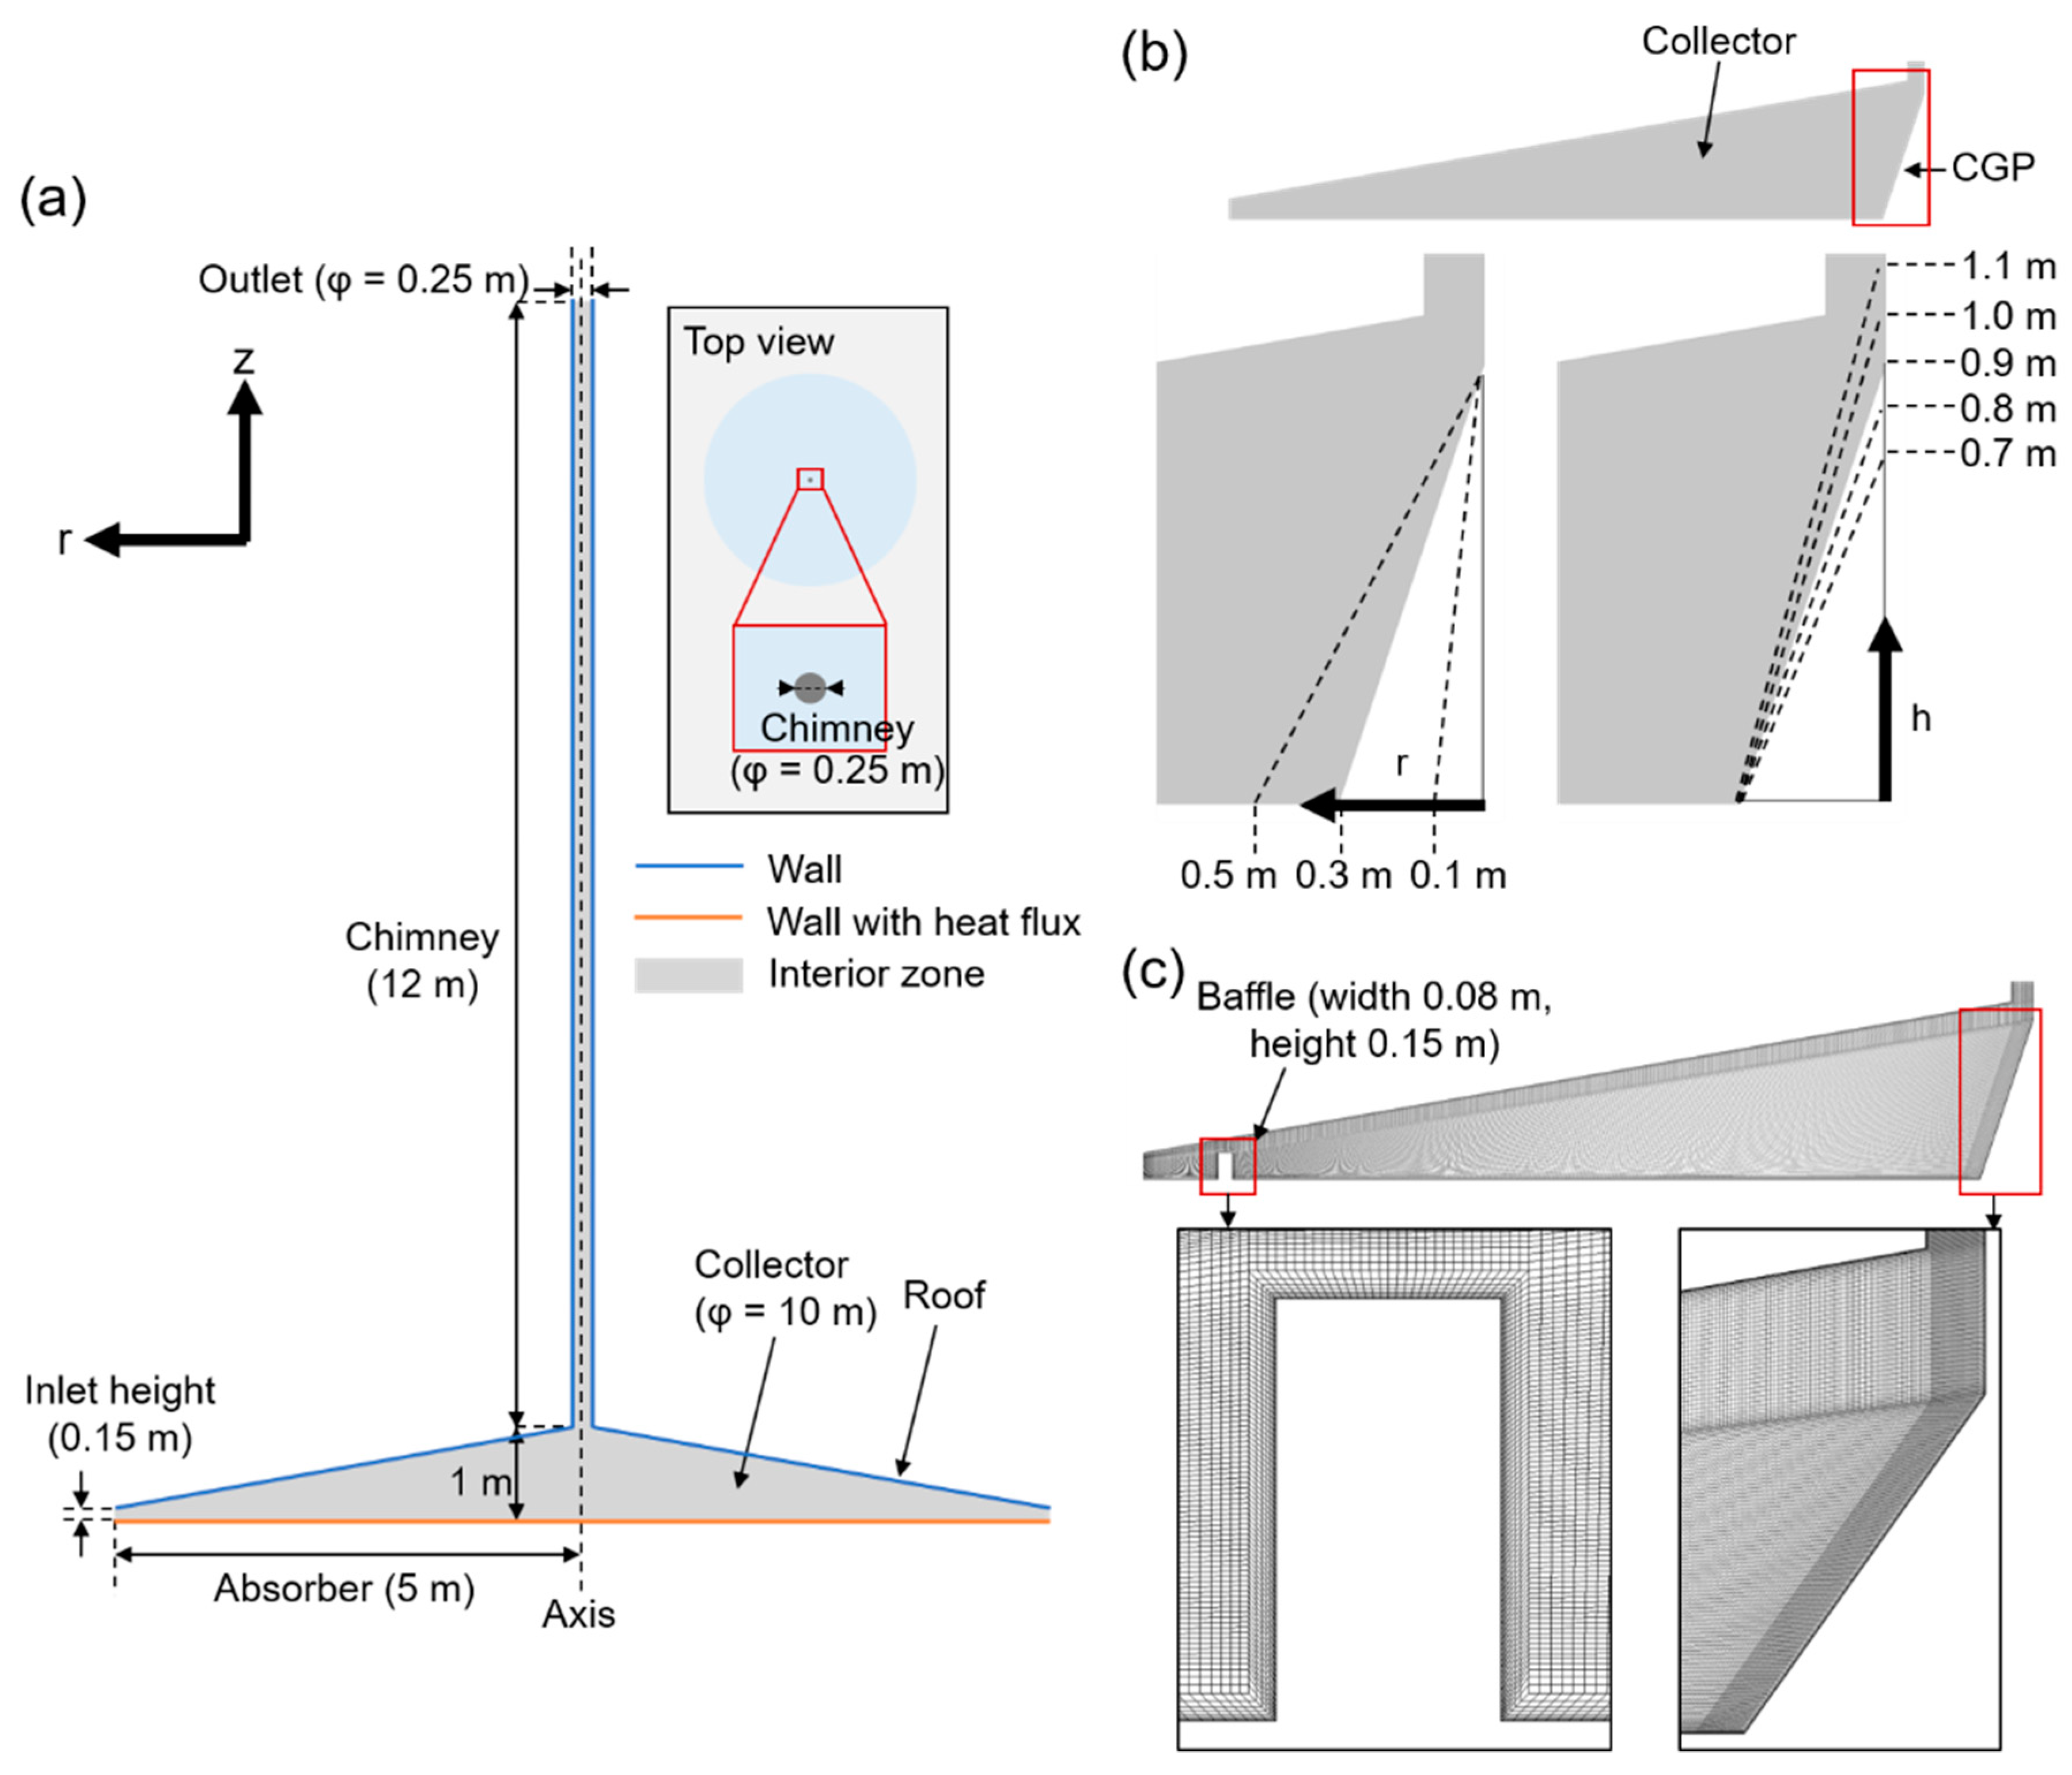
Computational Models and Boundary Conditions

The SUT model used in this study included a chimney with a height of 12 m and a diameter of 0.25 m and a collector with a diameter of 10 m. The height of the collector entrance was 0.15 m, which gradually increased to 1 m at the center (r = 0 m), where it joins the chimney, resulting an inclined roof (Figure 2a). The CGP had a cone-like shape, and radii of 0.1, 0.3, and 0.5 m, and heights of 0.7, 0.8, 0.9, 1.0, and 1.1 m were used in the simulations (a total of fifteen different models, Figure 2b). As one of the aims of this study was to quantify the interactions between the CGP and the baffle, we further created models with both the CGP and baffle installed in the collector. In the case of the baffle, the optimal shape, size, and installation location values determined in our previous studies [9,10] were used—0.15 m high, 0.08 m wide, and location of r = 4.5 m (from the center). As mentioned above, depending on the 15 geometries of the CGP and existence of a baffle, a total of thirty models were analyzed in this study (fifteen models for analyzing the effect of the CGP, and an additional fifteen models for investigating the simultaneous effects of the CGP and baffle). For example, the model R0.1_H0.7 had a CGP with a radius of 0.1 m and a height of 0.7 m. In the case of models using a baffle, ‘b’ was added after the model name. A summary of the different model conditions is listed in Table 1.
All computational simulations in this study were performed using the commercial program ANSYS Fluent 19.2 (ANSYS Inc., Canonsburg, PA, USA). The computational domain consisted of a two-dimensional (2D) axisymmetric geometry by using the axisymmetric feature of the SUT (Figure 2a). Standard k-ε turbulence model, used for the turbulence model in our research, is the most widely used model for turbulent flow analysis. In particular, it is known that accurate results are observed when the pressure gradient of the analysis target is not large [14]. The model was, therefore, determined to be suitable for SUT numerical analysis, where the pressure gradient was moderate because natural convection is dominant. We also referred to a previous study, which stated that numerical results of the standard k-ε turbulence model are most analogous to the temperature distribution inside the SUT when comparing the experimental results with those of various turbulence models [15]. In addition, various existing studies have used this turbulent model to analyze SUT [8,16,17,18]. The turbulent kinetic energy, k, and dissipation rate, ε, were modeled and expressed as follows:
t ( ρ k ) + x i ( ρ k u i ) = x i [ ( μ + μ t σ κ ) k x j ] + G k + G b ρ ε Y M ,
t ( ρ ε ) + x i ( ρ ε u i ) = x j [ ( μ + μ t σ ε ) ε x j ] + C 1 ε ε k ( G k + C 3 ε G b ) C 2 ε ρ ε 2 k ,
where Gk is the generation of turbulence kinetic energy due to the mean velocity gradients (calculated by G k = ρ u i ¯ u j ¯ u j x i ), Gb is the generation of turbulence kinetic energy due to buoyancy (calculated by G k = β g i μ t P r t T x i , β is the coefficient of thermal expansion calculated by β = 1 ρ ( ρ T ) p , and Prt is the turbulent Prandtl number for energy with a value of 0.85), and YM is the contribution of fluctuating dilatation in compressible turbulence to the overall dissipation rate. However, it was ignored in our incompressible models. The turbulent (or eddy) viscosity, μt, was calculated as μt = ρCμk2/ε. The constants C, C, Cμ, σk, and σε had values of 1.44, 1.92, 0.09, 1, and 1.3, respectively. These constant values were determined from experiments for fundamental turbulent flows, and they have been found to work fairly well for a wide range of wall-bounded and free shear flows [11]. The enhanced wall treatment was used for the laminar sublayer near the wall to improve accuracy [19]. The Boussinesq model was used to calculate the density in the buoyancy term of the momentum equation, and in the other governing equations, a constant value of 1.1543 kg/m3 was used as the density. This approach allowed for improved convergence compared with the use of incompressible ideal gas and ideal gas model. The thermal expansion coefficient was 3.2805 × 10⁻³ K−1. Both the inlet/outlet boundary had a pressure of 1 atm and a temperature of 300 K. For the thermal boundary conditions, the heat emitted from the ground collector due to solar radiation was assumed to be 13 W/m2, and the walls of the roof of the collector and chimney were assumed to be adiabatic. Operating conditions of 1 atm (101,325 Pa) and 288.16 K were used. Quadrilateral grids were applied to all geometries, and an inflation layer was used to predict the boundary layer profile near the wall, including the CGP and baffle (Figure 2c). The first grid distance nearest to the wall was set so that y+ was less than 5 to ensure an accurate analysis of the boundary layer, which was known to be acceptable when using enhanced wall treatment [20]. The number of grid elements was determined to be 123,720 at the base case, which was verified as the efficient grid density though a grid test, including the grid cases of 62,880 and 220,720. In other models including a baffle and CGP, the same grid density was used. A total of 50,000 iterations were performed for all models. The number of iterations was at least three times larger than that when the mass flow rate of the chimney outlet and the temperature of the chimney inlet converge to a calculated value, and the continuity residual in all cases was less than 10−4. Furthermore, according to our previous study [9], this grid density and iteration condition were validated; the temperature on the absorber was predicted to be within 3.2% of the experimental value in the existing study [21].

4. Results and Discussion

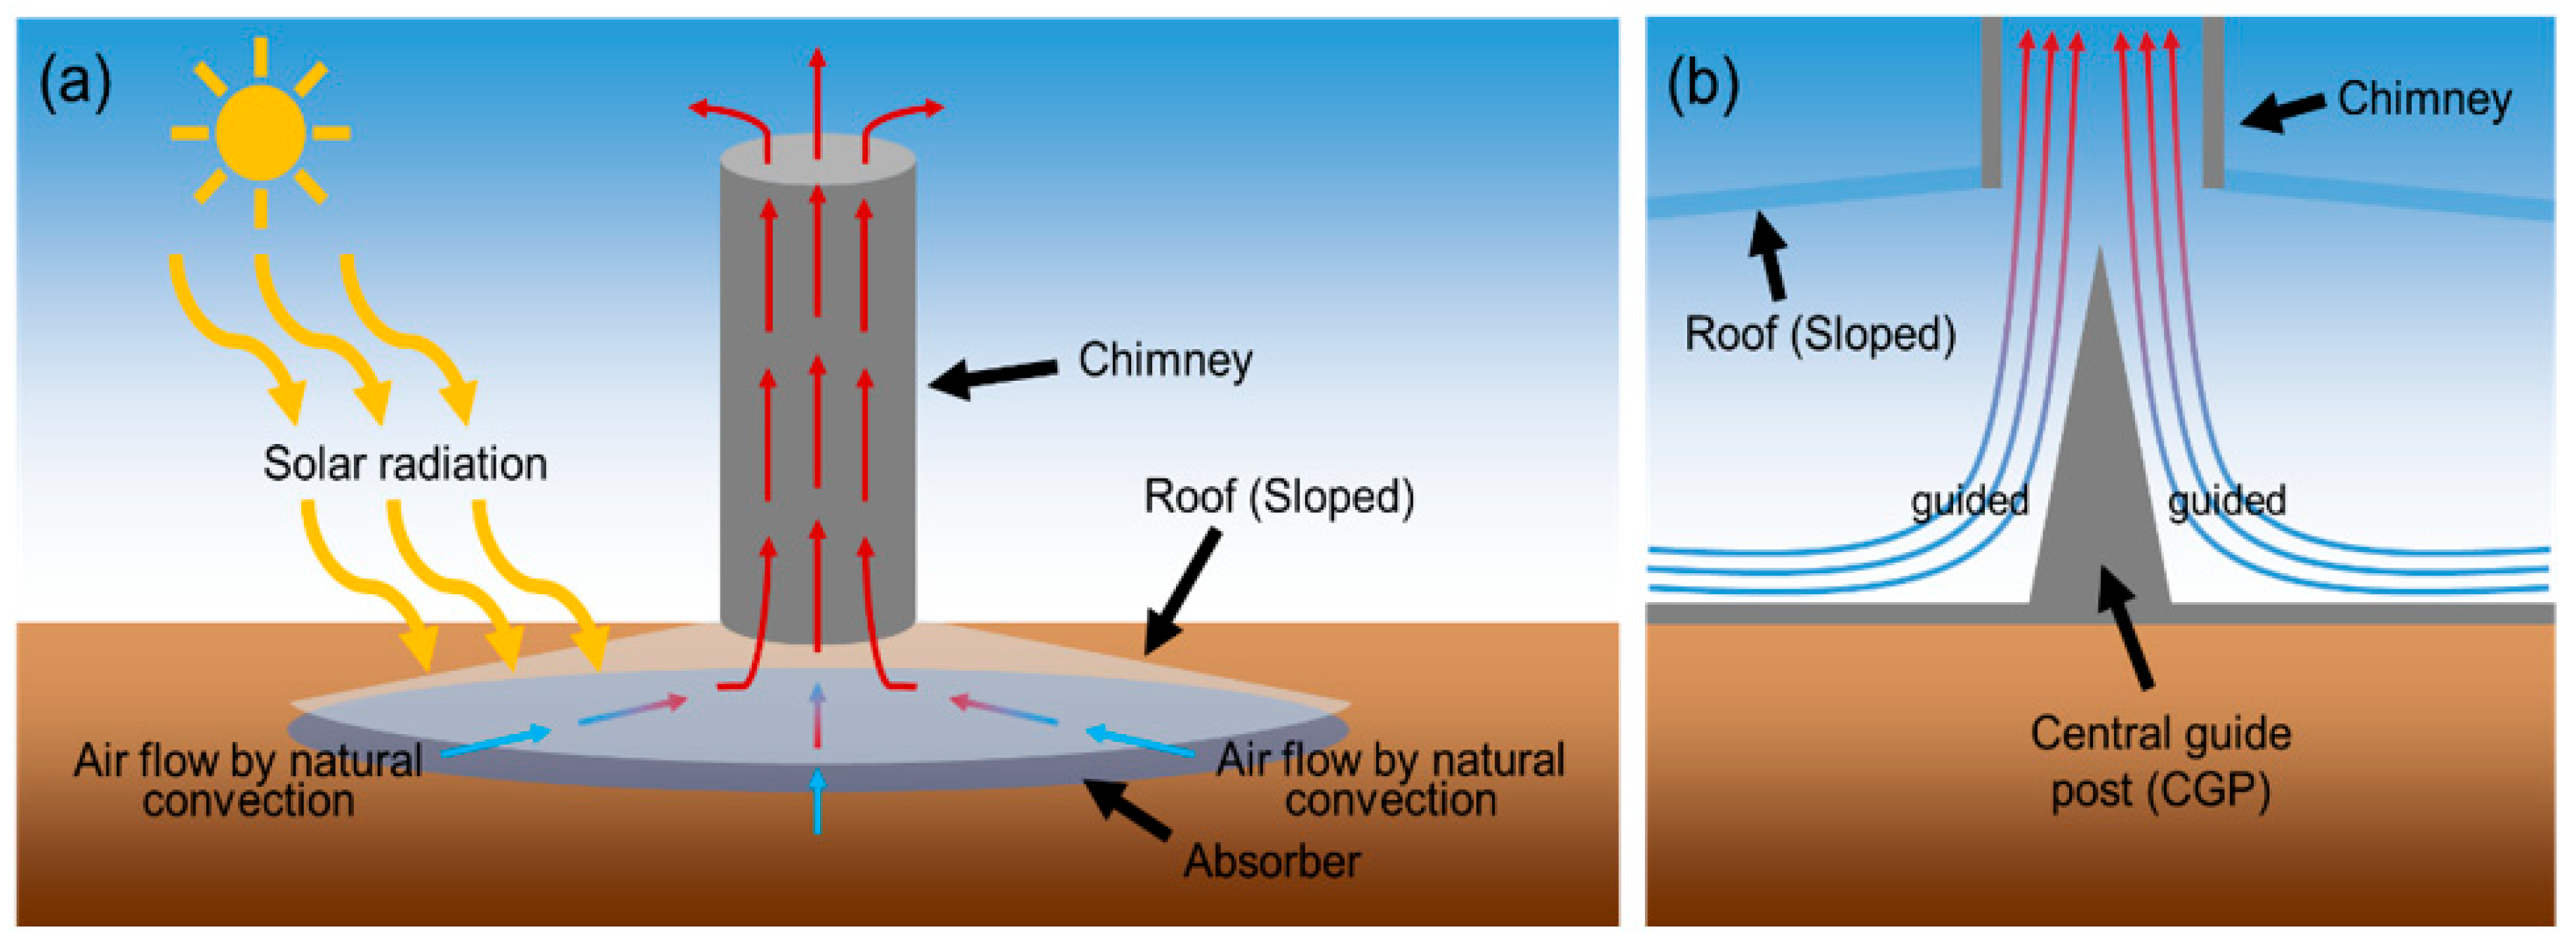
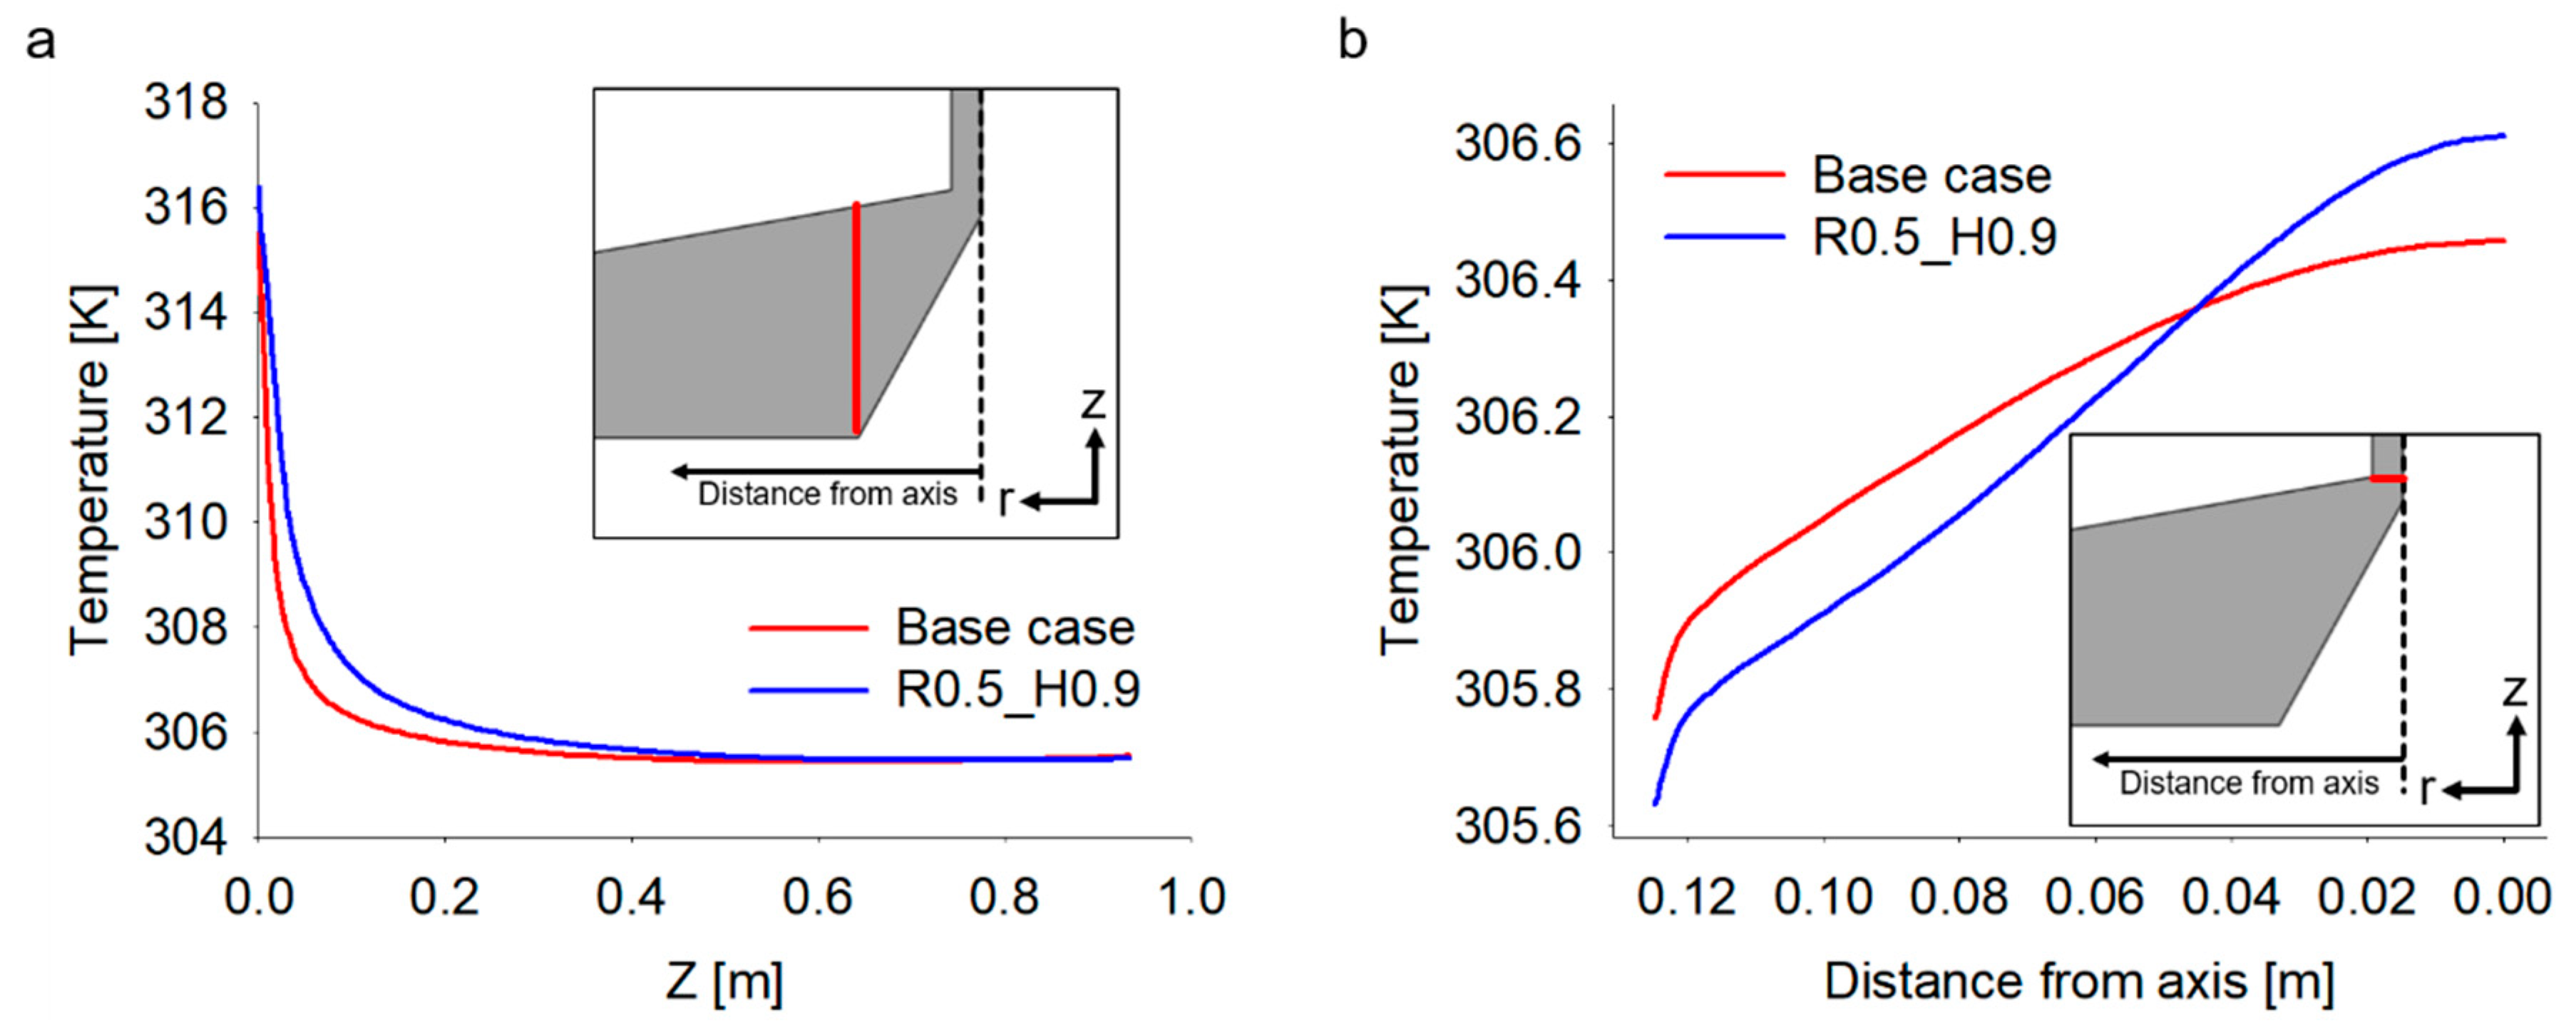
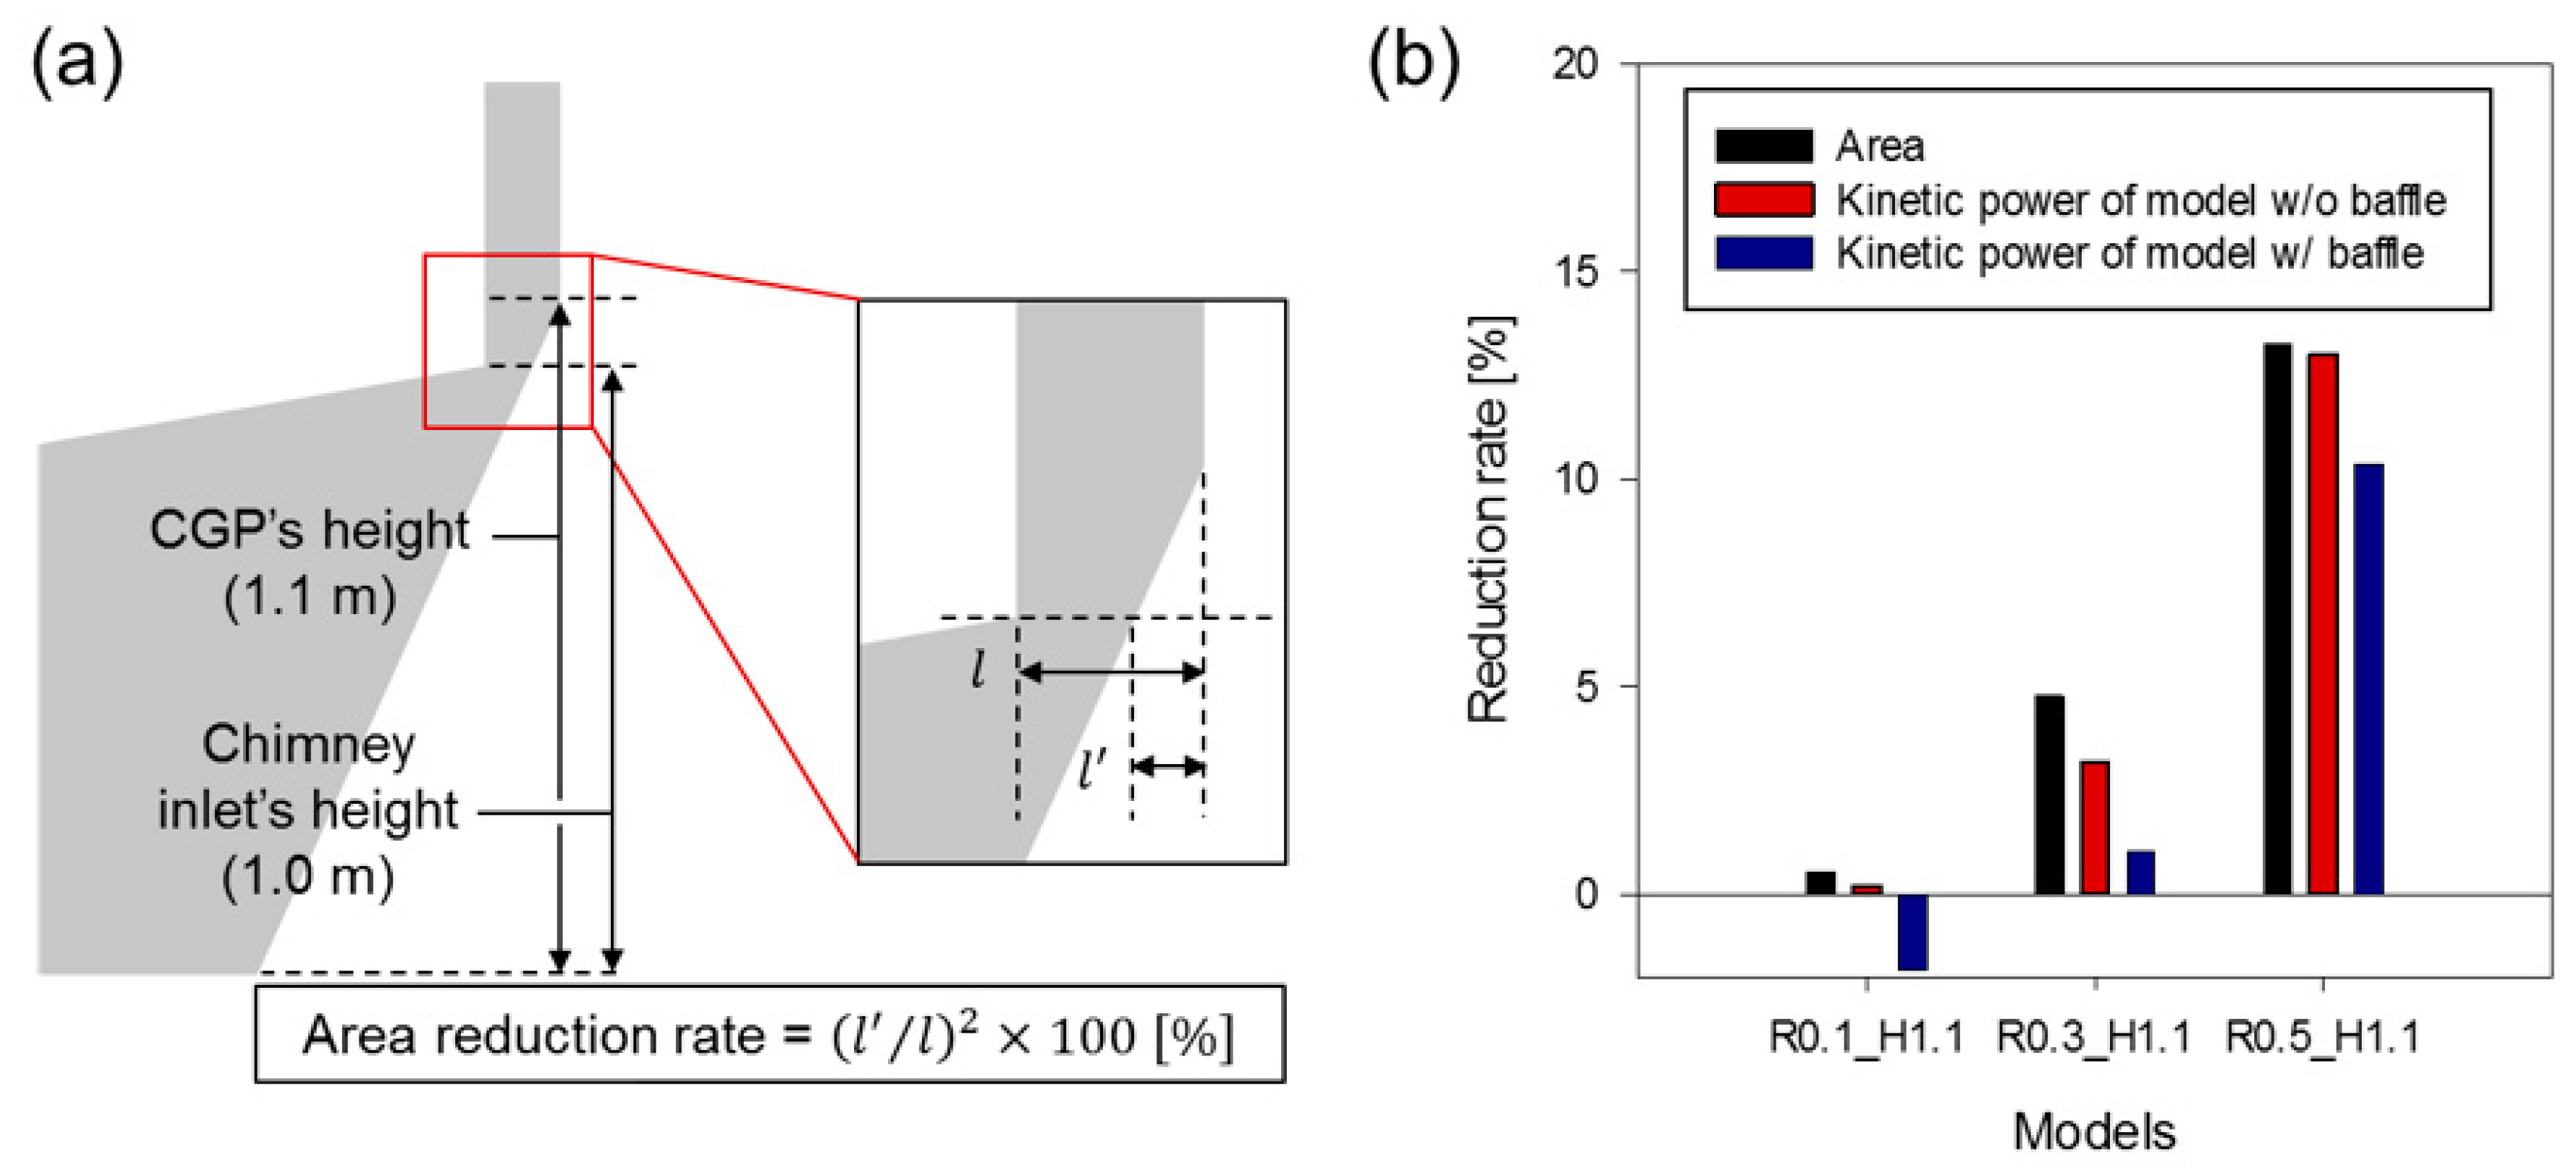
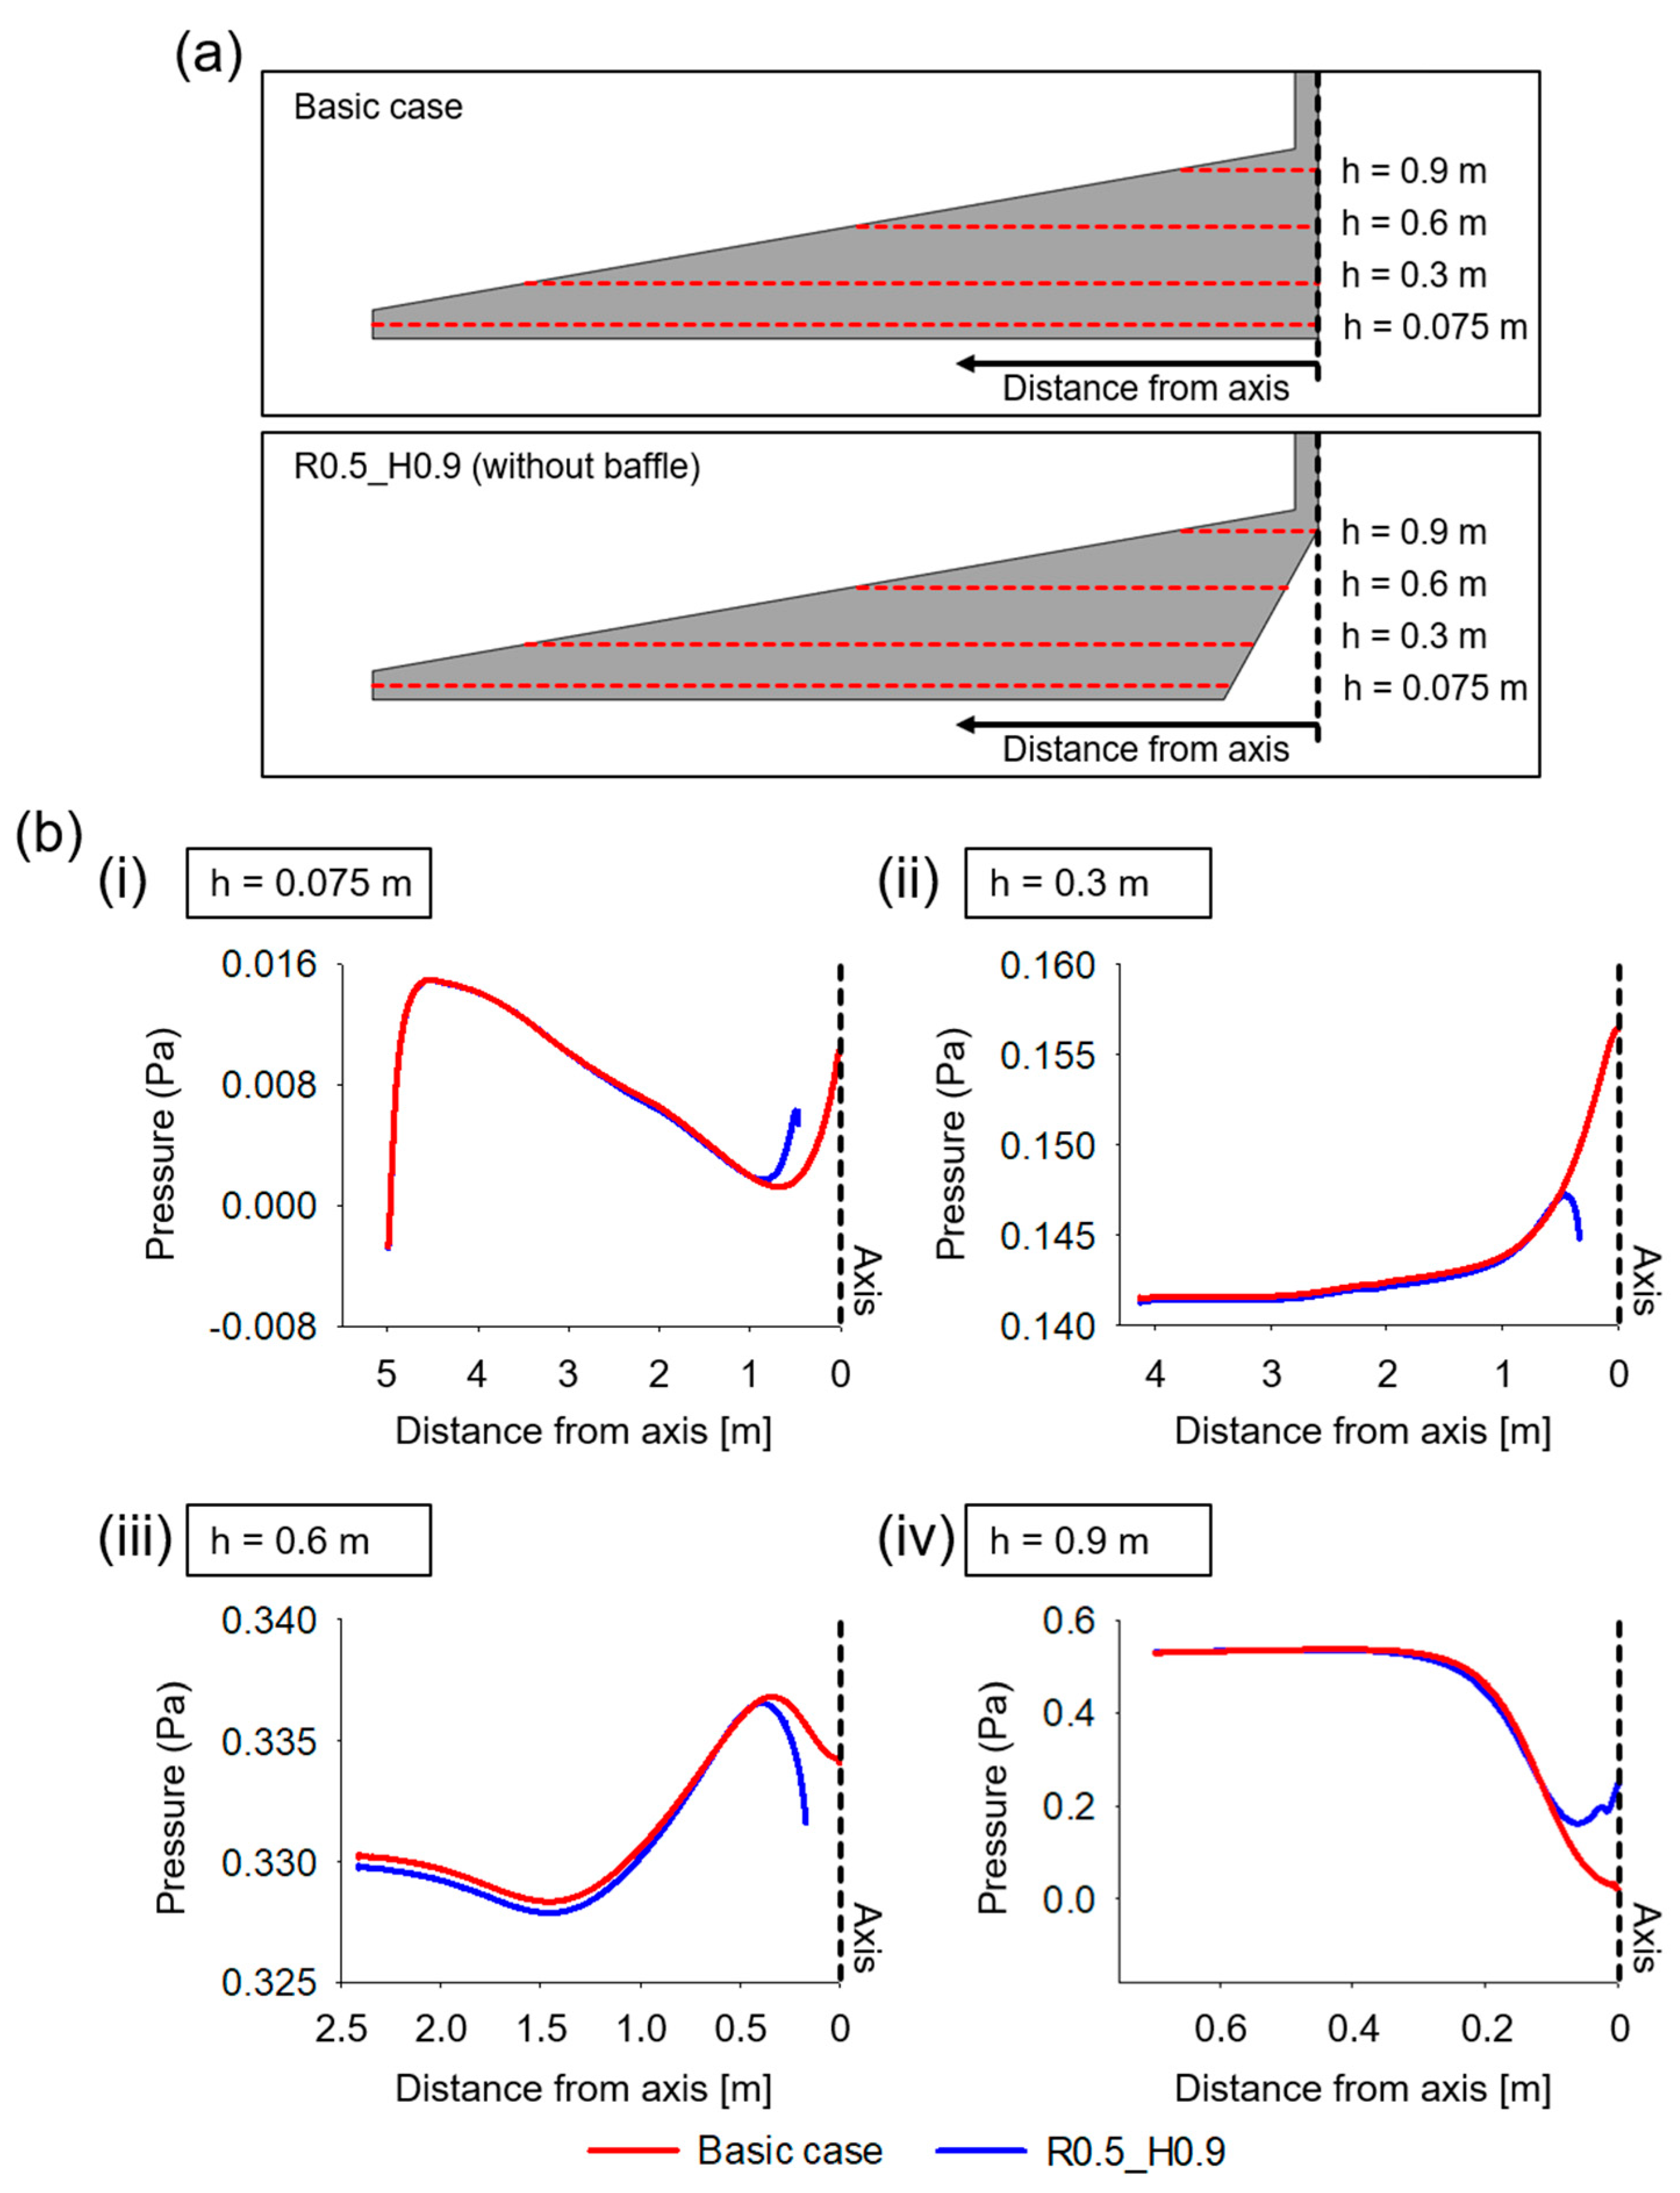
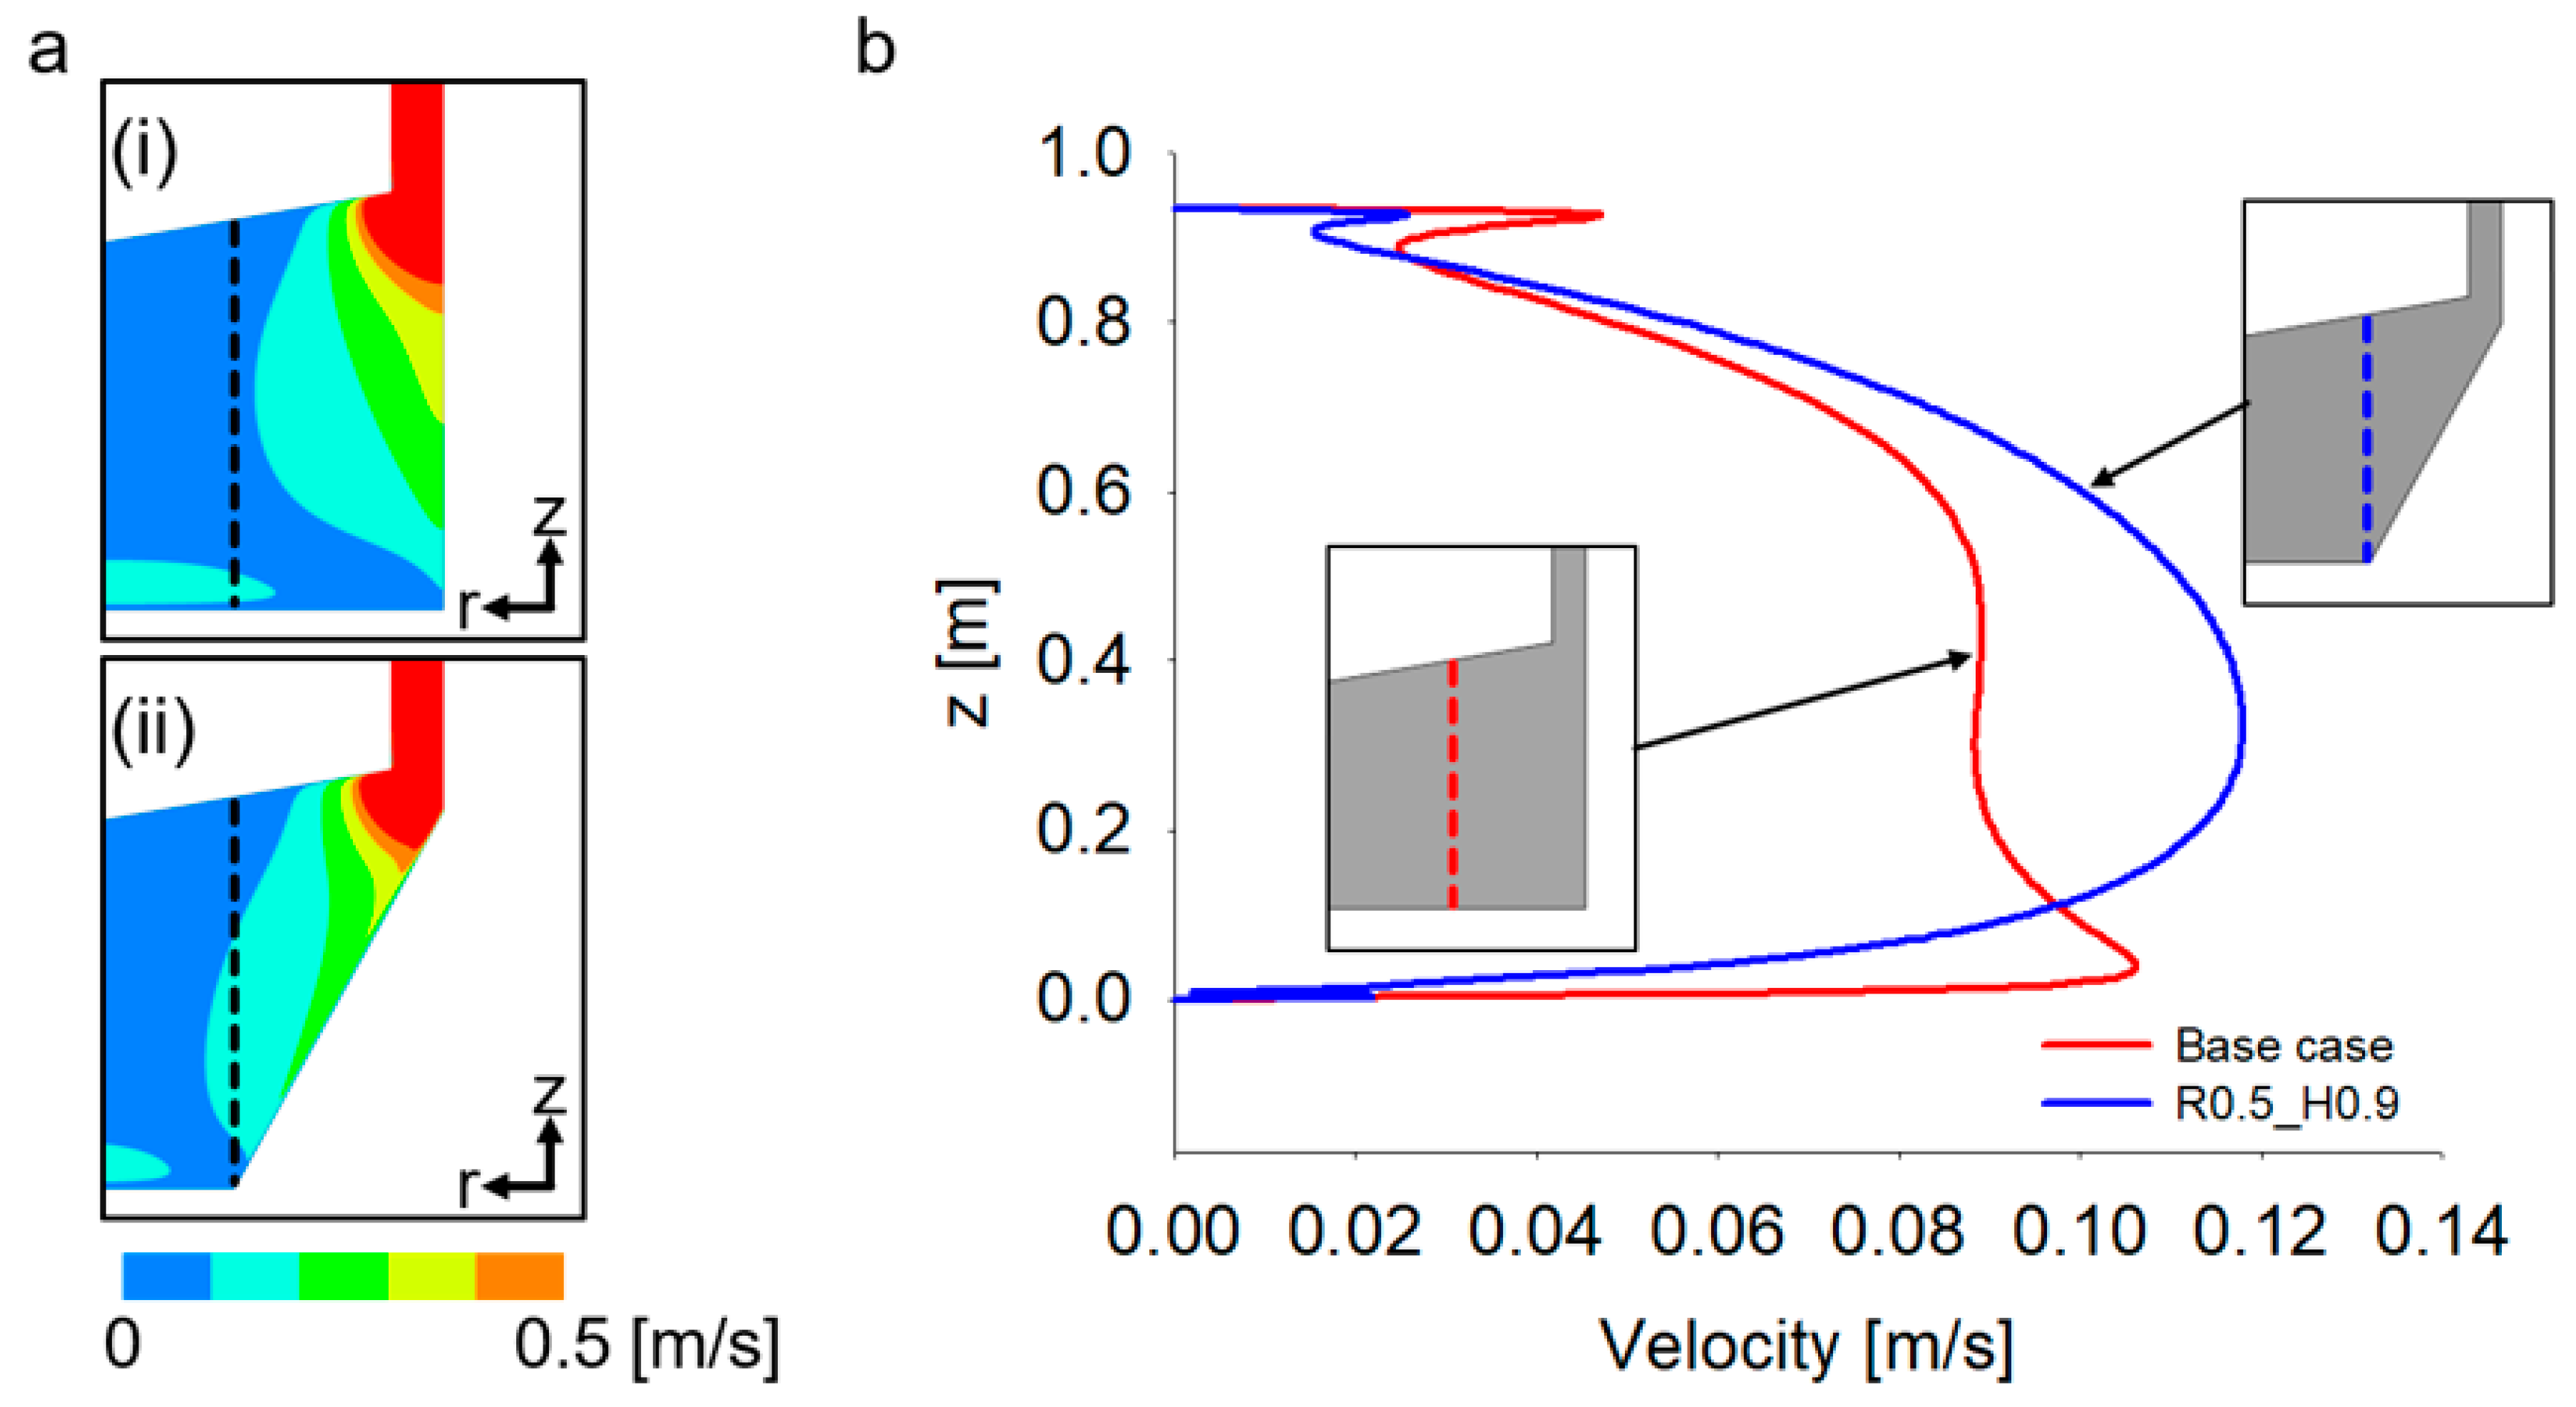
4.1. Positive and Negative Effects of CGP

The main driving force of the flow in the SUT is the buoyancy force, but the pressure difference also contributes significantly to flow development in the SUT. Therefore, analyzing the pressure field is essential to understand the flow of the SUT. Although it was reported that the effect of the CGP in the SUT is to efficiently guide the flow in the center of the collector into the chimney inlet, studies of the pressure pattern near the CGP are useful for understanding the hydrodynamic function of the CGP [8]. The flow in the collector without CGP is the source of chimney flow and is closely related to the performance of the SUT. The flow in the collector is in all directions and stagnates at the center of the collector. As the flow velocity decreases, the static pressure of stagnation flow increases. This phenomenon is explained by the simplified Bernoulli equation (p + ρv2/2 = p0) where gravity is ignored for incompressible air flows, and thus, the static pressure increase is a result of a decrease in dynamic pressure (ρv2/2). A pressure increase at the center of the collector has also been observed in the SUT with CGP. In contrast, when the CGP is installed at the center of the tower, the radial flow reaching the collector center is directed by the CGP to the chimney (axial flow) without forming a stagnation area, resulting in a higher flow rate near the center and a smaller local pressure increase than in the case without CGP [8]. As the lower pressure at the center results in a higher flowrate and overall SUT performance, it is important to quantify the effect of CGP in terms of the pressure distribution.
We compared the pressure distributions of the base case without the CGP and baffle and the collector of R0.5_H0.9 (no baffle), where R and H refer to the collector radius and height, respectively, and the corresponding values are in meters (Figure 3). The paths over which the pressure was determined for collector heights of 0.075, 0.3, 0.6, and 0.9 m are shown in Figure 3a. In the base case, the pressure at h = 0.075 and 0.3 m tended to increase approaching the adjacent region of the axis, as shown in Figure 3bi (0 < distance from axis < 1 m) and Figure 3bii (0 < distance from axis < 3 m), respectively. For a height of 0.6 m, a pressure decrease was observed at the center of the collector (0 < distance from axis < 0.34 m in Figure 3biii), while for the height of 0.9 m, this tendency was more obvious (0 < distance from axis < 0.43 m in Figure 3biv). The peak value near the center of the collector was 0.010 Pa at a height of 0.075 m, and this value increased up to 0.3368 Pa at a height 0.6 m in the base case. In R0.5_H0.9, the peak value increased from 0.006 Pa (0.075 m) to 0.147 Pa 0.6 m), and this was a reduction of 40% for 0.075 m and 0.06% for 0.6 m compared with the base case. At the height of 0.9 m, the pressure near the center of the collector decreased rather than at the height of 0.6 m, which was predicted to be 0.163 Pa in R0.5_H0.9 and 0.022 Pa in the base case. A stagnant region was observed at the center of the lower part of the collector (h = 0.075, 0.3 m), while the upper collector (h = 0.6, 0.9 m) showed flow quite well directed towards the chimney inlet; this affected the pressure distribution (Figure 3b). In the central collector region of R0.5_H0.9, a pressure decrease was observed even for lower heights (Figure 3bi,bii. Similar velocity distributions were formed in both velocity contours of the base case and R0.5_H0.9 (Figure 4a). However, for R0.5_H0.9, the velocity profile was affected and modified by the CGP to form a higher velocity upstream (closer to the collector inlet) than that of the base case. This tendency was clearly observed by comparing the 0.1 m/s velocity contour line. In the base case, a 0.1 m/s velocity contour line was formed downstream of a 0.5 m from the axis (black dash line, Figure 4ai), and in R0.5_H0.9, a 0.1 m/s velocity contour line was formed upstream at 0.5 m from axis (black dash line, Figure 4aii). The velocity profile at 0.5 m from the axis of R0.5_H0.9 (the blue line) was higher than that of the base case (the red line) in most regions (Figure 4b). The maximum value was predicted at 0.106 m/s and 0.118 m/s in the base case and R0.5_H0.9, respectively. These results show that the effect of the CGP on the pressure distribution and velocity were positive for the flow over the central collector area.
The temperature profiles at the collector center of the base case and R0.5_H0.9 were compared. The positions which were observed are downstream of the CGP (red line in Figure 5a; in the base case, it was observed at the same distance from axis) and chimney inlet (red line in Figure 5b). In the downstream of the CGP, the temperature of R0.5_H0.9 was predicted to be higher than that of the base case (Figure 5a). The velocity profile confirmed that the flow near the absorber of R0.5_H0.9 was stagnant by the CGP (Figure 4b). This increases increase of the temperature near the CGP. The flow along the CGP transferred the heat to the chimney inlet. At the chimney inlet of the R0.5_H0.9, the maximum temperature was predicted to be 306.6 K, 0.03% higher than 306.5 K of the base case (Figure 5b). The formation of high temperatures around the CGP had a positive effect on the natural convection inside the SUT. The tendency of the temperature, associated with the flow field, explained the mechanism of the positive effects of the CGP inside the SUT.
In addition to the advantageous effects of the CGP, the negative aspects should be carefully examined. When the turbine was located at the entrance of the chimney, the kinetic power of the fluid at the location was transferred to the turbine to produce power, so that the kinetic power of the fluid could be used to confirm power generation performance [22]. The kinetic power was calculated by the following Equation (8):
P = 1 2 ρ A V 3 [ kg   m 2 / s 3 ] .
To identify the cases where the negative effects of CGP were observed, the performance of all cases was examined. Representative cases that showed a negative effect included R0.3_H1.1, R0.3_H1.1b, R0.5_H1.1, and R0.5_H1.1b. In contrast to the other cases with minor efficiency gains, these four cases exhibited a decrease in SUT performance (Figure 6) as the CGP blocked some area of the inlet of the chimney through which the rising airflow passed. The chimney was located at a height of 1 m from the SUT center, where the height of the CGP of these four cases was 1.1 m, which penetrated the chimney area (Figure 7a) and interfered with the rising airflow. The R0.1_H1.1 and R0.1_H1.1b models also showed that the CGP partially blocked the chimney, although the negative effect was not highly significant. The reduction rate at a height of 1.1 m for the R0.1 series shown in Figure 5a was not larger than those for the R0.5 and R0.5 series, while there was no decrease in kinetic power for the R0.1 series shown in Figure 5b. This was because of the small radius of the CGP that resulted in a small reduction in the cross-sectional area of the chimney owing to the presence of CGP. Hence, the negative effect of the CGP depended on the cross-sectional area of the chimney blocked by the device. To quantitatively analyze this, we calculated the degree to which the CGP blocked the fluid passage area of the chimney inlet (Figure 7a). This blocked area was 0.53% for R0.1_H1.1, 4.76% for R0.3_H1.1, and 13.22% for R0.5_H1.1. As the area reduction rate increased, the reduction rate of kinetic power also increased (Figure 7b). In conclusion, we confirmed that it is advantageous for the CGP to have a geometry that does not significantly block the chimney area.

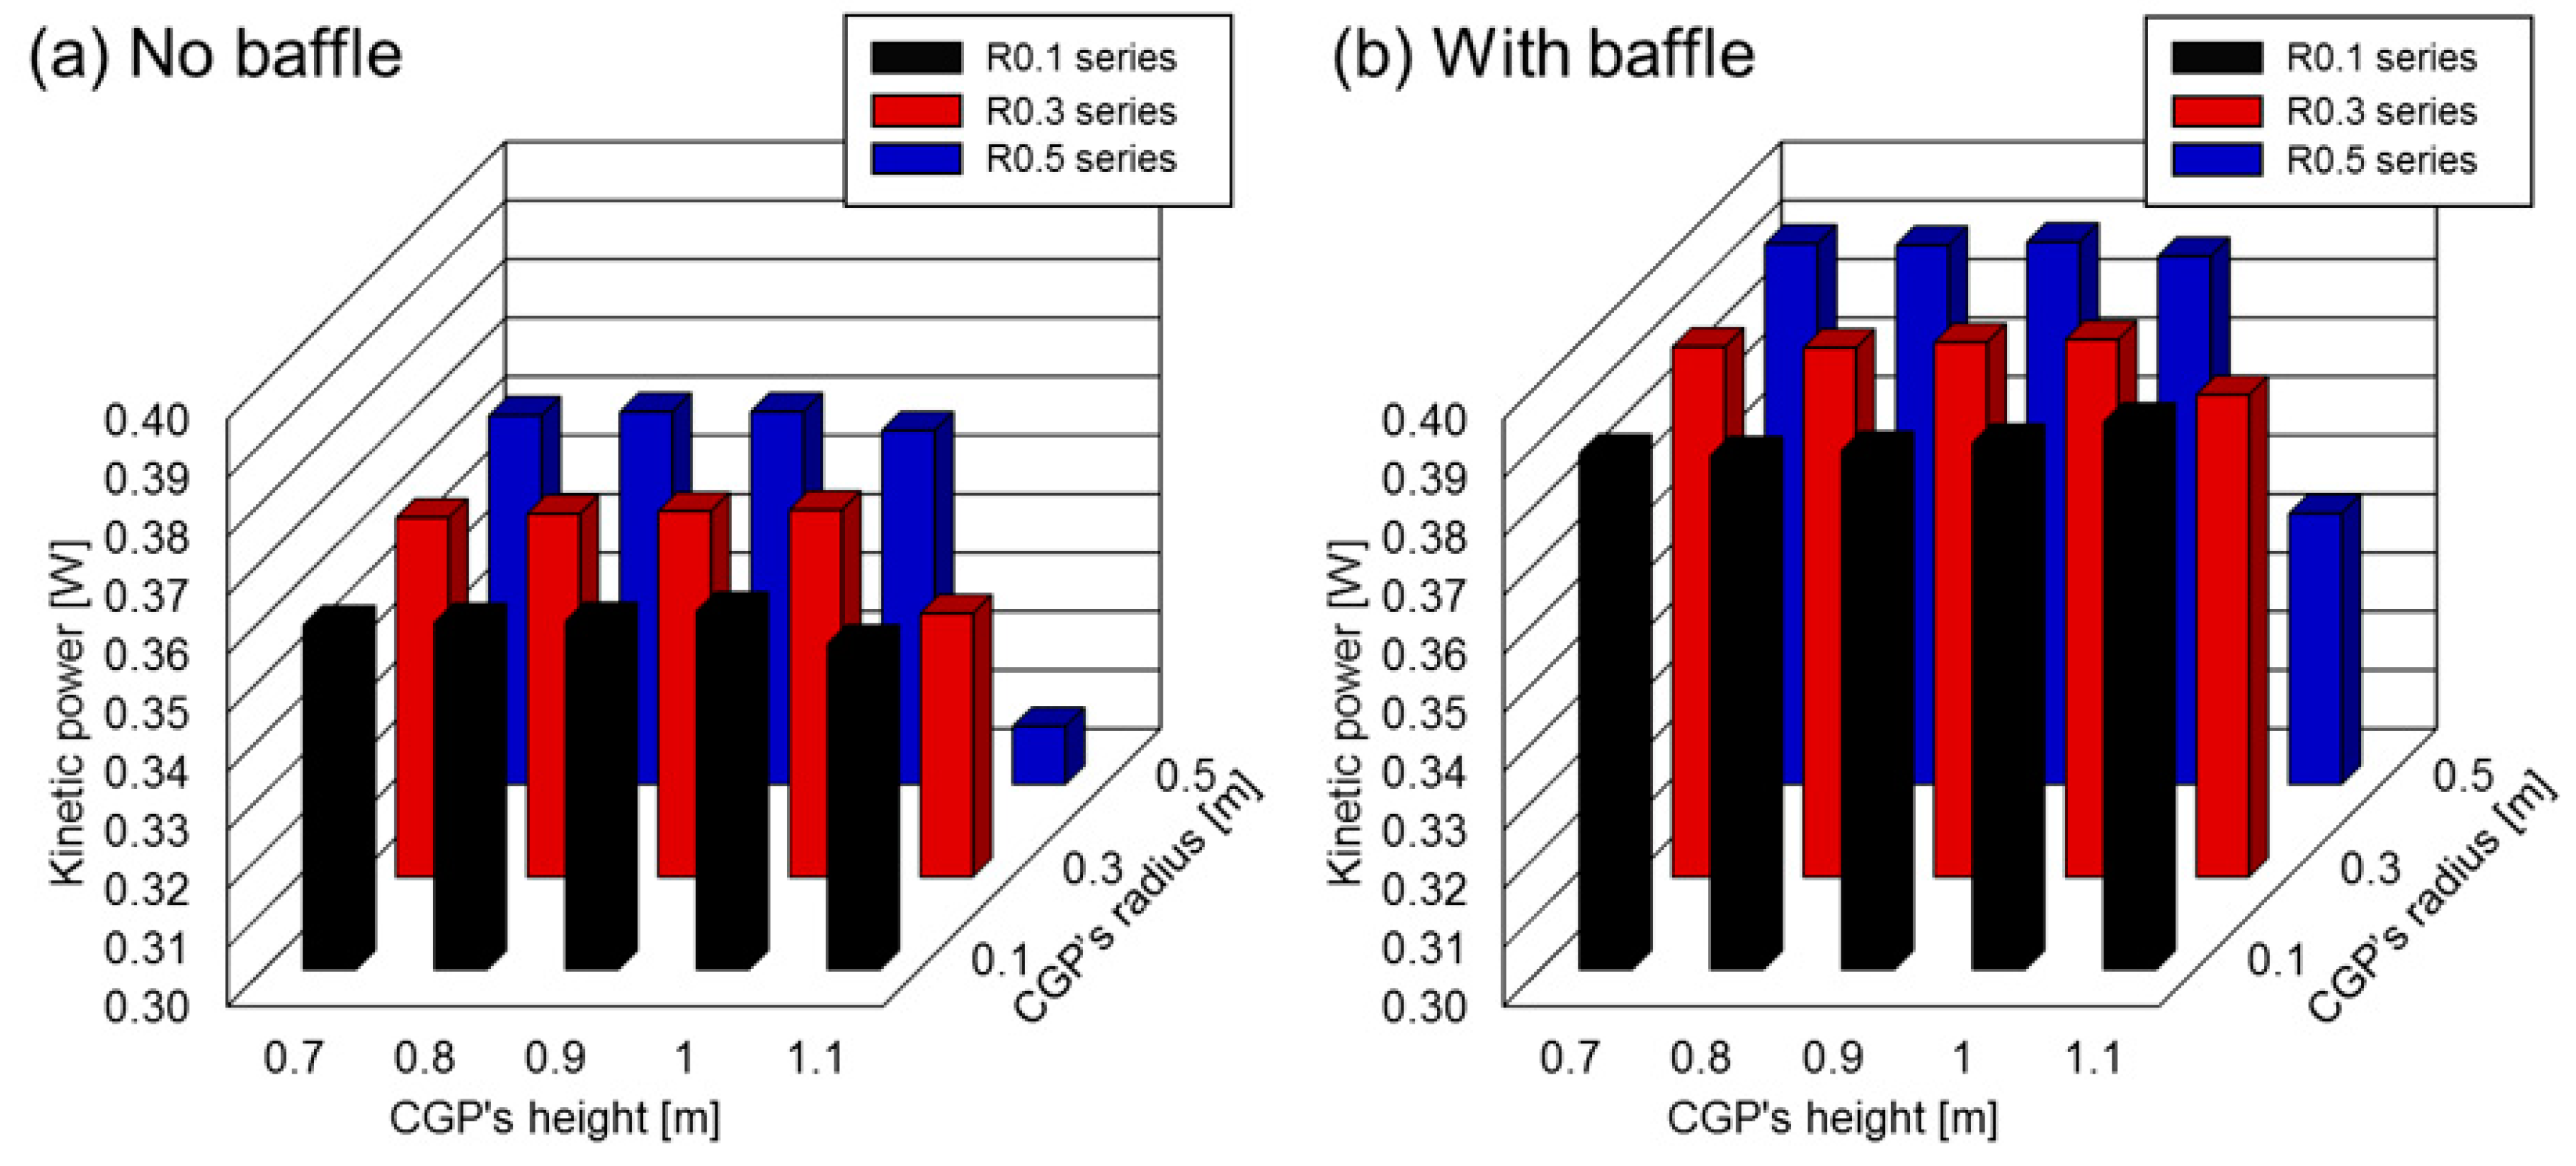
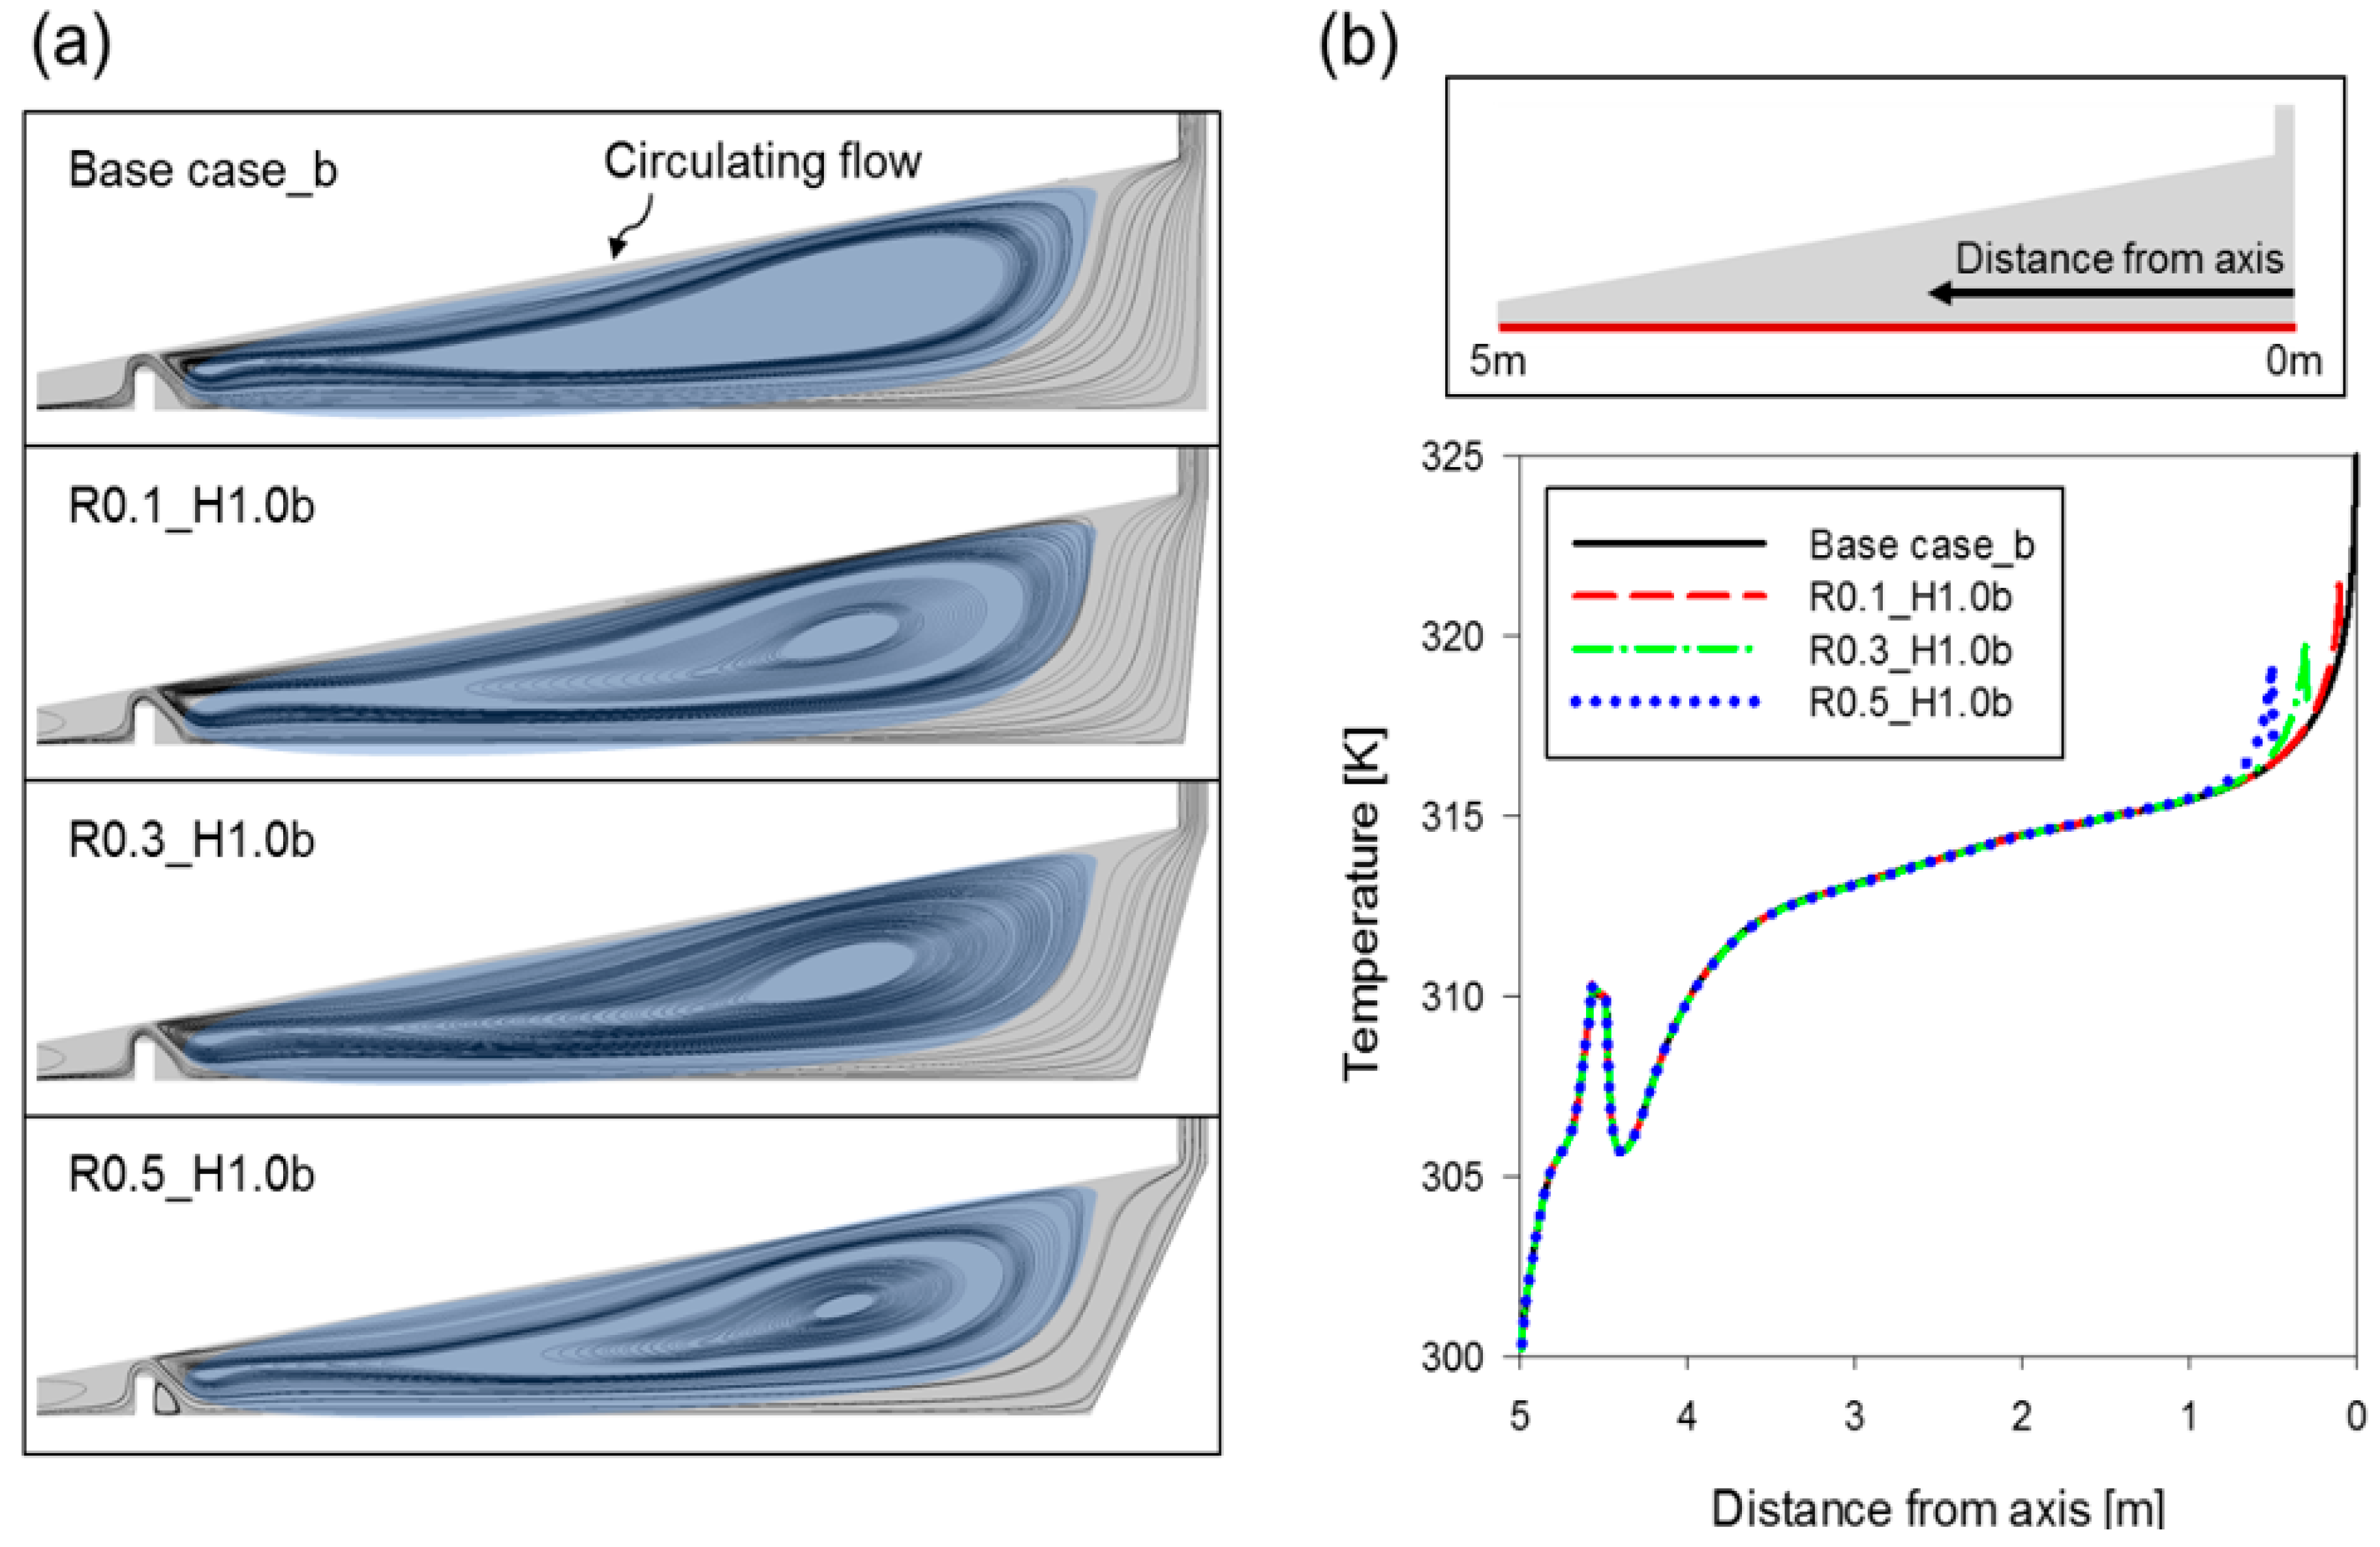
4.2. Cooperative Effect of CGP and Baffle

We previously studied the effect of the baffle in the SUT on the kinetic power change using numerical analysis with the geometry and location of the baffle as variables [9,10]. When the height and width of the baffle were changed, we observed that the baffle had both positive and negative effects. A positive effect was the formation of a vortex that enhanced heat transfer, while a negative effect was some flow interference. In addition, we confirmed that the height of the baffle had the greatest impact on the SUT performance. Meanwhile, in researching where the position of the baffle is a variable, we classified the internal flow of the SUT into two types: circulating flow in the collector and main flow towards the chimney. Of these two flows, we found that the ‘circulating flow’ was heavily influenced by the baffle; hence, when the location of the baffle from the center was changed from 1.0 m to 4.5 m, the baffle position of 4.5 m was observed to be optimum for maintaining the internal thermal energy by blocking the relatively cool external air that chill the heat in the collector. Contrary to the fact that the baffle had a great influence on the ‘circulating flow’, we also observed that the baffle had only a small negative effect until the ‘main flow’ entering the SUT and rising, except when the baffle was located too close to the inlet to interfere with the internal fluid flow. In summary, the baffle primarily affected the circulating flow, leading to improved heat transfer performance.
On the other hand, as previously noted, the CGP mainly prevented stagnation by guiding the main upward flow at the center of the collector. Therefore, different flow field areas in the collector were affected by the CGP and baffle. This was important because it meant that the two components could play different roles independently, and their positive effects could be super-positioned. Indeed, the shape and range of the streamlining of the circulating flow in the collector formed by the baffle were not significantly affected by the presence of the CGP (Figure 8a). Similarly, the temperature distribution in the absorber (a measure of the heat transfer tendency) was very similar to the model without CGP except for the area near the CGP (Figure 8b). The temperature distribution in the absorber increase sharply around the baffle and then decreases because of the vortex that was generated immediately. It then increase toward the center of the SUT. Because the circulating flow circulated inside the SUT and transmitted the heat flux generated from the absorber evenly to the entire SUT area, and the heat transfer proceeded, the temperature distribution of the absorber was greatly affected by the circulating flow. Thus, if the CGP interfered with the heat transfer of the circulating flow affected by the baffle, these data would not have been so similar. In the model with the CGP, the relative increase in kinetic power was also similar with and without the baffle (Table 2).
As a result, we confirmed that the functions of these two components did not interfere with each other, and each of them independently contributed to the performance of the SUT.

5. Conclusions

This study analyzed the effects of CGP and baffle devices installed in an SUT. The CGP prevented stagnation by changing the direction of the flow in the central part of the collector where the main flow of the SUT accumulated, resulting in changes to the pressure distribution of the main flow and an increase in kinetic power. However, when the height of the CGP exceeded that of the inlet of the chimney and blocked some of the chimney cross-sectional area, the kinetic power rapidly decreased because of the interference with the upward flow through the chimney. We also analyzed the interaction between the baffle and CGP and its effect on thermo-fluid dynamic performance and found that the two devices did not interfere with each other when placed in their optimal positions with the baffle near the inlet and CGP at the center of the SUT. Therefore, the CGP and baffle can independently provide advantageous effects without negative interference, where an increase in kinetic energy of >10% was observed compared to the base case. The maximum increase of kinetic power compared to the base case was found to be 10.18% in R0.5_H0.9b, but the reduction of the chimney inlet area of CGP caused a 2.8% decrease in R0.5_H1.1b. As the baffle affected the heat transfer, and the CGP had a guiding effect on the flow, it is expected that the use of both devices could aid future SUT development. This study is a case study based on geometrical parameters; however, in the future, the optimization considering the parameters of the baffle, the CGP, and other geometrical parameters should be performed using the optimization methods such as a design of experiments, artificial neural network, and genetic algorithm [23]. The SUT has been studied in various scales from small scale for laboratory experiments to large scale exceeding a height of 200 m for large power generation. This study has limitations in that it dealt only with the effects of the baffle and CGP for laboratory-scale studies. Studies of the effect on other scale (smaller or larger) SUTs should be conducted in future works.

Author Contributions

Conceptualization, S.L., S.K. and J.Y.P.; methodology, S.L., S.K. and J.Y.P.; software, S.L., S.K. and J.C.; validation, S.L. and S.K.; formal analysis, S.L., S.K. and J.C.; investigation, S.L., S.K. and J.Y.P.; writing—original draft preparation, S.L., S.K. and J.Y.P.; writing—review and editing, J.Y.P.; supervision, J.Y.P.; project administration, S.L., S.K. and J.Y.P.; funding acquisition, J.Y.P.

Funding

This research was supported by the Korea Institute of Energy Technology Evaluation and Planning (KETEP) funded by the Ministry of Trade, Industry and Energy, Republic of Korea (No. 20163010024690).

Acknowledgments

This research was supported by the Chung-Ang University Graduate Research Scholarship in 2017 (S.L.).

Conflicts of Interest

The authors declare no conflict of interest.

Nomenclature

C p Specific heatJ/kg K
g Gravitational accelerationm/s2
k Turbulent kinetic energym2/s2
PKinetic powerW ( kg   m 2 / s 3 )
p Static pressurePa
p 0 Total pressurePa
r ,   y ,   x Space coordinatesm
T TemperatureK
t Timesec
u , v Velocity componentsm/s
y + Dimensionless wall distance-
β Coefficient of thermal expansionK−1
ε Turbulent dissipation ratem2/s3
λ Thermal conductivityW/m K
μ Viscositykg/m s
μ t Turbulent viscositykg/m s
ρ Densitykg/m3
σk, σεTurbulent Prandtl numbers for and, respectively-

References

  1. Haaf, W.; Friedrich, K.; Mayr, G.; Schlaich, J. Part I: Principle and Construction of the Pilot Plant in Manzanares. Int. J. Sol. Energy 1983, 2, 3–20. [Google Scholar] [CrossRef]
  2. Xu, Y.; Zhou, X. Performance of divergent-chimney solar power plants. Sol. Energy 2018, 170, 379–387. [Google Scholar] [CrossRef]
  3. Koonsrisuk, A. Comparison of conventional solar chimney power plants and sloped solar chimney power plants using second law analysis. Sol. Energy 2013, 98, 78–84. [Google Scholar] [CrossRef]
  4. Al-Kayeim, H.H.; Aurybi, M.A.; Gilani, S.I.U. Influence of canopy condensate film on the performance of solar chimney power plant. Renew. Energy 2019, 136, 1012–1021. [Google Scholar] [CrossRef]
  5. Zhou, X.; Xiao, B.; Liu, W.; Guo, X.; Yang, J.; Fan, J. Comparison of classical solar chimney power system and combined solar chimney system for power generation and seawater desalination. Desalination 2010, 250, 249–256. [Google Scholar] [CrossRef]
  6. Shahizare, B.; Nazri Bin Nik Ghazali, N.; Chong, W.; Tabatabaeikia, S.; Izadyar, N. Investigation of the Optimal Omni-Direction-Guide-Vane Design for Vertical Axis Wind Turbines Based on Unsteady Flow CFD Simulation. Energies 2016, 9, 146. [Google Scholar] [CrossRef]
  7. Gao, R.; Liu, K.; Li, A.; Fang, Z.; Yang, Z.; Cong, B. Study of the shape optimization of a tee guide vane in a ventilation and air-conditioning duct. Build. Environ. 2018, 132, 345–356. [Google Scholar] [CrossRef]
  8. Hu, S.; Leung, D.Y.C.; Chen, M.Z.Q.; Chan, J.C.Y. Effect of guide wall on the potential of a solar chimney power plant. Renew. Energy 2016, 96, 209–219. [Google Scholar] [CrossRef]
  9. Lee, S.; Kim, Y.; Park, J. Numerical Investigation on the Effects of Baffles with Various Thermal and Geometrical Conditions on Thermo-Fluid Dynamics and Kinetic Power of a Solar Updraft Tower. Energies 2018, 11, 2230. [Google Scholar] [CrossRef]
  10. Kim, S.; Lee, S.; Park, J.Y. Thermo-fluid dynamic effects of the radial location of the baffle installed in a solar updraft tower. Energies 2019, 12, 1340. [Google Scholar] [CrossRef]
  11. ANSYS Fluent Theory Guide v17.1; ANSYS Inc.: Canonsburg, PA, USA, 2016.
  12. Chergui, T.; Larbi, S.; Bouhdjar, A. Thermo-hydrodynamic aspect analysis of flows in solar chimney power plants—A case study. Renew. Sustain. Energy Rev. 2010, 14, 1410–1418. [Google Scholar] [CrossRef]
  13. Borgnakke, C.; Sonntag, R.E. Fundamentals of Thermodynamics, 8th ed.; John Wiley & Sons: Hoboken, NJ, USA, 2016. [Google Scholar]
  14. Bardina, J.E.; Huang, P.G.; Coakley, T.J. Turbulence Modeling Validation, Testing, and Development. Nasa Tech. Memo. 1997, 8–20. [Google Scholar]
  15. Ayadi, A.; Nasraoui, H.; Bouabidi, A.; Driss, Z.; Bsisa, M.; Abid, M.S. Effect of the turbulence model on the simulation of the air flow in a solar chimney. Int. J. Therm. Sci. 2018, 130, 423–434. [Google Scholar] [CrossRef]
  16. Ming, T.; de Richter, R.K.; Meng, F.; Pan, Y.; Liu, W. Chimney shape numerical study for solar chimney power generating systems. Int. J. Energy Res. 2013, 37, 310–322. [Google Scholar] [CrossRef]
  17. Tingzhen, M.; Wei, L.; Guoling, X.; Yanbin, X.; Xuhu, G.; Yuan, P. Numerical simulation of the solar chimney power plant systems coupled with turbine. Renew. Energy 2008, 33, 897–905. [Google Scholar] [CrossRef]
  18. Fathi, N.; McDaniel, P.; Aleyasin, S.S.; Robinson, M.; Vorobieff, P.; Rodriguez, S.; de Oliveira, C. Efficiency enhancement of solar chimney power plant by use of waste heat from nuclear power plant. J. Clean. Prod. 2018, 180, 407–416. [Google Scholar] [CrossRef]
  19. Ahsan, M. Numerical analysis of friction factor for a fully developed turbulent flow using k–ε turbulence model with enhanced wall treatment. Beni-Suef Univ. J. Basic Appl. Sci. 2014, 3, 269–277. [Google Scholar] [CrossRef]
  20. ANSYS Fluent User’s Guide; ANSYS Inc.: Canonsburg, PA, USA, 2013.
  21. Nia, E.S.; Ghazikhani, M. Numerical investigation on heat transfer characteristics amelioration of a solar chimney power plant through passive flow control approach. Energy Convers. Manag. 2015, 105, 588–595. [Google Scholar] [CrossRef]
  22. Zhou, X.; Xu, Y. Solar updraft tower power generation. Sol. Energy 2016, 128, 95–125. [Google Scholar] [CrossRef]
  23. Aponte, R.D.; Teran, L.A.; Grande, J.F.; Coronado, J.J.; Ladino, J.A.; Larrahondo, F.J.; Rodríguez, S.A. Minimizing erosive wear through a CFD multi-objective optimization methodology for different operating points of a Francis turbine. Renew. Energy 2020, 145, 2217–2232. [Google Scholar] [CrossRef]
Figure 1. Schematic diagrams showing the effects of the central guide post (CGP) in a solar updraft tower (SUT) system. (a) Basic principles describing the natural convection occurring inside the SUT. (b) Guided updraft flow by CGP in the SUT.
Energies 12 03506 g001
Figure 2. Two-dimensional (2D) axisymmetric geometry of the computational domain used in this study. (a) Schematic diagram of the principle 2D axisymmetric geometry of SUT without CGP and baffle. (b) Detailed geometry of the CGP models with different radius and height. (c) Two quadrilateral grid systems applied for meshing the whole computational domain in the CGP model.
Energies 12 03506 g002
Figure 3. Effect of the CGP on the pressure distribution. (a) Observation line of the pressure profile (red line). (b) Pressure profile in (i) h = 0.075 m, (ii) 0.3 m, (iii) 0.6 m, and (iv) 0.9 m.
Energies 12 03506 g003
Figure 4. Comparison of the velocity at the center of the collector. (a) Velocity contours of the (i) base case and (ii) R0.5_H0.9. (b) Velocity profiles along the red lines indicated in the insets.
Energies 12 03506 g004
Figure 5. Comparison of the temperature at the center of the collector. (a) Temperature profiles along the z-axis on the red line in the inset. (b) Temperature profiles along the distance from the axis on the red line in the inset.
Energies 12 03506 g005
Figure 6. Kinetic power calculated using models with different geometries (a) without or (b) with a baffle.
Energies 12 03506 g006
Figure 7. Area reduction by the CGP. (a) Schematic diagram defining the reduction in the cross-section area as a function of CGP geometry. (b) Area reduction rate and kinetic power for models with a height of 1.1 m.
Energies 12 03506 g007
Figure 8. Additive effects of the baffle and CGP. (a) Streamlines obtained via computational fluid dynamics (CFD) modeling of the internal flow field of the SUT models with different CGP radii and a constant height of 1.0 m. (b) Temperature profiles at the absorber at the ground, as indicated by the red line in the inset above.
Energies 12 03506 g008
Table 1. Two groups of models classified as with or without a baffle. Each group included a base case and fifteen models with different CGP geometries, where ‘R’ denotes the radius, ‘H’ denotes the height, ‘b’ denotes the baffle, and the numbers give the corresponding values in meters.
Radius of CGPHeight of CGPModel Name
No BaffleWith Baffle
--Base CaseBase Case_b
0.10.7R0.1_H0.7R0.1_H0.7b
0.8R0.1_H0.8R0.1_H0.8b
0.9R0.1_H0.9R0.1_H0.9b
1R0.1_H1.0R0.1_H1.0b
1.1R0.1_H1.1R0.1_H1.1b
0.30.7R0.3_H0.7R0.3_H0.7b
0.8R0.3_H0.8R0.3_H0.8b
0.9R0.3_H0.9R0.3_H0.9b
1R0.3_H1.0R0.3_H1.0b
1.1R0.3_H1.1R0.3_H1.1b
0.50.7R0.5_H0.7R0.5_H0.7b
0.8R0.5_H0.8R0.5_H0.8b
0.9R0.5_H0.9R0.5_H0.9b
1R0.5_H1.0R0.5_H1.0b
1.1R0.5_H1.1R0.5_H1.1b
Table 2. Kinetic power calculated from the numerical analysis models and the relative increase compared to the base case.
No BaffleWith Baffle
ModelKinetic Power [W]Increase Rate Compared to ‘Base Case’ModelKinetic Power [W]Increase Rate Compared to ‘Base Case_b’Increase Rate Compared to ‘Base Case’
Base case0.35610%Base case_b0.38610%8.4275%
R0.1_H0.70.35870.7282%R0.1_H0.7b0.38790.4626%8.9291%
R0.1_H0.80.35910.8380%R0.1_H0.8b0.38750.3604%8.8182%
R0.1_H0.90.35930.8861%R0.1_H0.9b0.38840.5827%9.0593%
R0.1_H1.00.36101.3794%R0.1_H1.0b0.38970.9169%9.4216%
R0.1_H1.10.3554−0.1912%R0.1_H1.1b0.39321.8407%10.4233%
R0.3_H0.70.36121.4208%R0.3_H0.7b0.39031.0753%9.5934%
R0.3_H0.80.36181.6048%R0.3_H0.8b0.39011.0307%9.5450%
R0.3_H0.90.36231.7245%R0.3_H0.9b0.39111.2763%9.8114%
R0.3_H1.00.36251.7913%R0.3_H1.0b0.39151.3882%9.9326%
R0.3_H1.10.3449−3.1653%R0.3_H1.1b0.3821−1.0373%7.3028%
R0.5_H0.70.36281.8789%R0.5_H0.7b0.39211.5381%10.0952%
R0.5_H0.80.36352.0588%R0.5_H0.8b0.39191.4799%10.0321%
R0.5_H0.90.36352.0611%R0.5_H0.9b0.39241.6187%10.1826%
R0.5_H1.00.36031.1635%R0.5_H1.0b0.39000.9927%9.5039%
R0.5_H1.10.3099−12.9939%R0.5_H1.1b0.3461−10.3604%−2.8061%

