Article

Numerical Modelling of Dynamic Responses of a Floating Offshore Wind Turbine Subject to Focused Waves

1
Department of Naval Architecture, Ocean and Marine Engineering, University of Strathclyde, Glasgow G4 0LZ, UK
2
College of Engineering, Ocean University of China, Qingdao 266100, China
3
Saint-Venant Hydraulics Laboratory (Électricité de France, ENPC, Cerema), Université Paris-Est, 6 quai Watier, 78400 Chatou, France
4
Division of Ocean Science and Technology, Graduate School at Shenzhen, Tsinghua University, Shenzhen 518055, China
5
School of Marine Science and Technology, Northwestern Polytechnical University, Xi’an 710072, China
*
Author to whom correspondence should be addressed.
Energies 2019, 12(18), 3482; https://doi.org/10.3390/en12183482
Submission received: 24 July 2019 / Revised: 16 August 2019 / Accepted: 4 September 2019 / Published: 9 September 2019
(This article belongs to the Special Issue Recent Advances in Offshore Wind Technology)

Abstract

:
In this paper, we present numerical modelling for the investigation of dynamic responses of a floating offshore wind turbine subject to focused waves. The modelling was carried out using a Computational Fluid Dynamics (CFD) tool. We started with the generation of a focused wave in a numerical wave tank based on a first-order irregular wave theory, then validated the developed numerical method for wave-structure interaction via a study of floating production storage and offloading (FPSO) to focused wave. Subsequently, we investigated the wave-/wind-structure interaction of a fixed semi-submersible platform, a floating semi-submersible platform and a parked National Renewable Energy Laboratory (NREL) 5 MW floating offshore wind turbine. To understand the nonlinear effect, which usually occurs under severe sea states, we carried out a systematic study of the motion responses, hydrodynamic and mooring tension loads of floating offshore wind turbine (FOWT) over a range of wave steepness, and compared the results obtained from two potential flow theory tools with each other, i.e., Électricité de France (EDF) in-house code and NREL Fatigue, Aerodynamics, Structures, and Turbulence (FAST). We found that the nonlinearity of the hydrodynamic loading and motion responses increase with wave steepness, revealed by higher-order frequency response, leading to the appearance of discrepancies among different tools.

1. Introduction

One of the main challenges for floating offshore wind turbines (FOWT) installed in moderate depth and deep-water sites is the increased maintenance and operation costs due to the structural damage of the FOWT system under severe environmental conditions. The most critical issue for the design is how to accurately predict the hydrodynamic loading and structural dynamic response of the floating platform, the tension loads of the mooring system and aerodynamic responses of the wind turbine.
Several experimental campaigns examining the responses of FOWT to wave loads have been carried out [1,2,3]. However, the scaling effect becomes one of the main issues when laboratory test data are applied to practical FOWT design, due to the difficulty of retaining all relevant non-dimensional similarity parameters the same between the scaled model test and full-scale prototype. Most existing experimental FOWT models are designed and manufactured by keeping the Froude number the same, in which the ratio between the inertial and the gravity force is identical between the scaled model and full-scale prototype. However, in this situation, the Reynolds number is not the same. Muller et al. [4] mentioned in his study that, as most of the scaling laws applied to the FOWT are based on the Froude scaling, the prediction of the flow conditions over the wind turbine varies between the scaled model and full-scale prototype, as the Reynolds number is different.
Parallel to the experimental investigation, some simplified analysis tools have been developed, e.g., Fatigue, Aerodynamics, Structures, and Turbulence (FAST) [5], developed at the National Renewable Energy Laboratory (NREL) in the USA [6], the Wind Atlas Analysis and Application Program (WAsP) [7], and the Horizontal Axis Wind turbine simulation Code 2nd generation (HAWC2) [8], developed by the Technical University of Denmark (DTU). These tools use time-domain analysis to study the FOWT, in which the hydrodynamic loads are usually estimated by using the Morrison’s equations in combination with a potential flow theory approach. Associated with these potential flow models, the viscous term is excluded. To account for the viscous loss, a derived drag coefficient is introduced into these models. Such models underestimate the nonlinear forces, which are usually the results of the dynamic responses of the floating structures in severe sea conditions, including wave-current interaction. In addition, the damping model in potential theory is unable to consider the transverse or lift forces associated with vortex shedding, which significantly affects the accuracy of the predicted motion responses of a system in the transverse direction.
To completely account for viscous effects in the FOWT modelling, one needs to use the high-fidelity Computational Fluid Dynamics (CFD) method, where the viscous effects are taken into account by directly solving Navier-Stokes equations in CFD [9,10,11,12]. This becomes extremely important when FOWT operates in harsh environmental conditions when the nonlinear hydrodynamic wave loading applied to the FOWT structure should be accurately predicted. In addition, CFD simulation also allows an accurate prediction for large free-surface elevations, which is impossible to achieve using low-order methods.
At present, the studies on the hydrodynamic, structural and aerodynamic response of FOWT using a CFD tool are limited, and most of them primarily focus on regular waves. For example, Tran and Kim [13] investigated a semi-submersible platform dynamic response and tension loads by using a commercial CFD software STAR-CCM+. Their results showed a good agreement with the data from the experiments and NREL FAST. Liu et al. [9,11,14] developed a fully coupled CFD tool to simulate the complex fluid-structure interaction between wind/wave flow and the FOWT by using OpenFOAM. In addition, in order to obtain data comparable with potential flow theory tools, their CFD numerical modelling results provided more detailed wave-/wind- structure interaction.
However, as mentioned above, an FOWT operates in irregular wave conditions, and thus, strong wave-structure interactions occur. To address this, Nematbakhsh et al. [15] developed a nonlinear computational model to investigate the performance of a spar-type FOWT, where irregular waves are considered via solving unsteady Navier-Stokes equations with a level-set method to predict the free-surface. Two sea state conditions are studied, with significant wave heights Hs of 8.0 m, wave peak period Tp = 10.0 s and Hs = 14.0 m, Tp = 16.0 s. The CFD modelling in the time domain considers a sample time of 500 s, which corresponds to 30 to 50 wave peak periods. Although a reduced-order model is used to represent the impact of wind turbine onto the floating spar platform via imposing a specified force and thrust, the CFD results showed large responses in the surge, heave and pitch motions and also the large tension loads in the mooring system.
The term extreme wave is usually used to refer to an ocean wave with an extremely high amplitude which may cause FOWT sub-structure potential damages due to the large, unpredictable unsteady hydrodynamic force [16,17]. The survivability of an FOWT depends very much on how well it is able to withstand the very large wave and wind loadings which occur under unexpected extreme wave conditions. However, to analyse a FOWT subject to a train of extreme waves long enough to find a reliable estimation of extreme values requires a large computational resource. Some numerical analysis work has attempted to deal with extreme waves with either a linear or nonlinear theory [18]. With a nonlinear different phase-resolving deterministic wave models, Khait et al. [19] generated a 2D deep water extreme wave. Unfortunately, the above work is limited to a pure numerical wave generation without any interaction with offshore structures. Due to the requirement for long computational time, a full-scale CFD modelling of extreme waves in a numerical wave tank with nonlinear wave theories is rarely used.
One effective way to model the extreme wave loading with a reasonable computational time is to use the concept of linear focused wave technique [20]. A focused wave is a wave consisting of a series of regular waves generated from a prescribed wave spectrum. Compared to the modelling of the extreme wave using the irregular waves approach, the numerical computational time for a study based on a focused wave approach is dramatically reduced, as the desired peak can be reached in a very short time, on the level of a few tens of seconds or so. In contrast, the time for irregular wave normally takes a time window of typically three hours. Because of this reason, the focused wave approach has been used by several researchers to study the wave-structure interaction to replicate extreme wave conditions under severe sea states.
At a very early stage, Baldock et al. [21] designed a focused wave through the superposition of a group of regular wave trains. With that model, they investigated the nonlinearity of wave-wave interaction without offshore structures. Recently, their study has been extended to the focused wave impact on fixed and floating offshore structures with simple geometry. For example, Gao et al. [16] investigated the nonlinear effects for a semi-submerged horizontal cylinder column under focused waves using a CFD tool. The predicted numerical data were compared with the results obtained in a regular wave condition, in which the trough-to-trough period is selected to be the same as the regular wave parameters. The comparisons indicated that, with a focused wave, the vertical force and the horizontal velocity exerted on a cylinder are more significant. By generating a focused wave with a Joint North Sea Wave Project (JONSWAP) spectrum, Mai et al. [22] reported a wave tank test for a wave-structure interaction for a series of floating production storage and offloading (FPSO). With the use of a constrained interpolation profile method to capture the nonlinear wave-structure interactions, Zhao et al. [23] modelled a 2D simple floating body under three types of wave, e.g., a regular, a focused and a combined regular and focused wave to reveal the highly nonlinear effects with different incident wave parameters (wave amplitude, focused position). The numerical computations are in good agreement with the experimental results.
As a brief review of the above indicates, the early focused wave studies have either been limited to a fixed offshore structure like FPSO or simple floaters such as a cylindrical column, and less attention has been devoted to the floating platforms that are used to support floating offshore wind turbines. To bridge this gap, in the present paper, we use a high-fidelity CFD numerical modelling tool to investigate the dynamic response and the hydrodynamic loading of a FOWT. Unlike our previous work [9,11,14], which was focused on regular waves, here, we extend the study to focused waves and engage in a range of wave parameters. In addition, to better understand the nonlinearity associated with extreme waves, we compare our CFD results with the data obtained from the potential flow theory, which were calculated using the Électricité de France (EDF) [24] and NREL FAST codes.
The rest of this paper is organized as follows: in Section 2, the geometry and properties of the platform and FOWT are described; the governing equations and numerical algorithms used in the present study are briefly reviewed (details are included in our previous publications [9,11,14]). In 
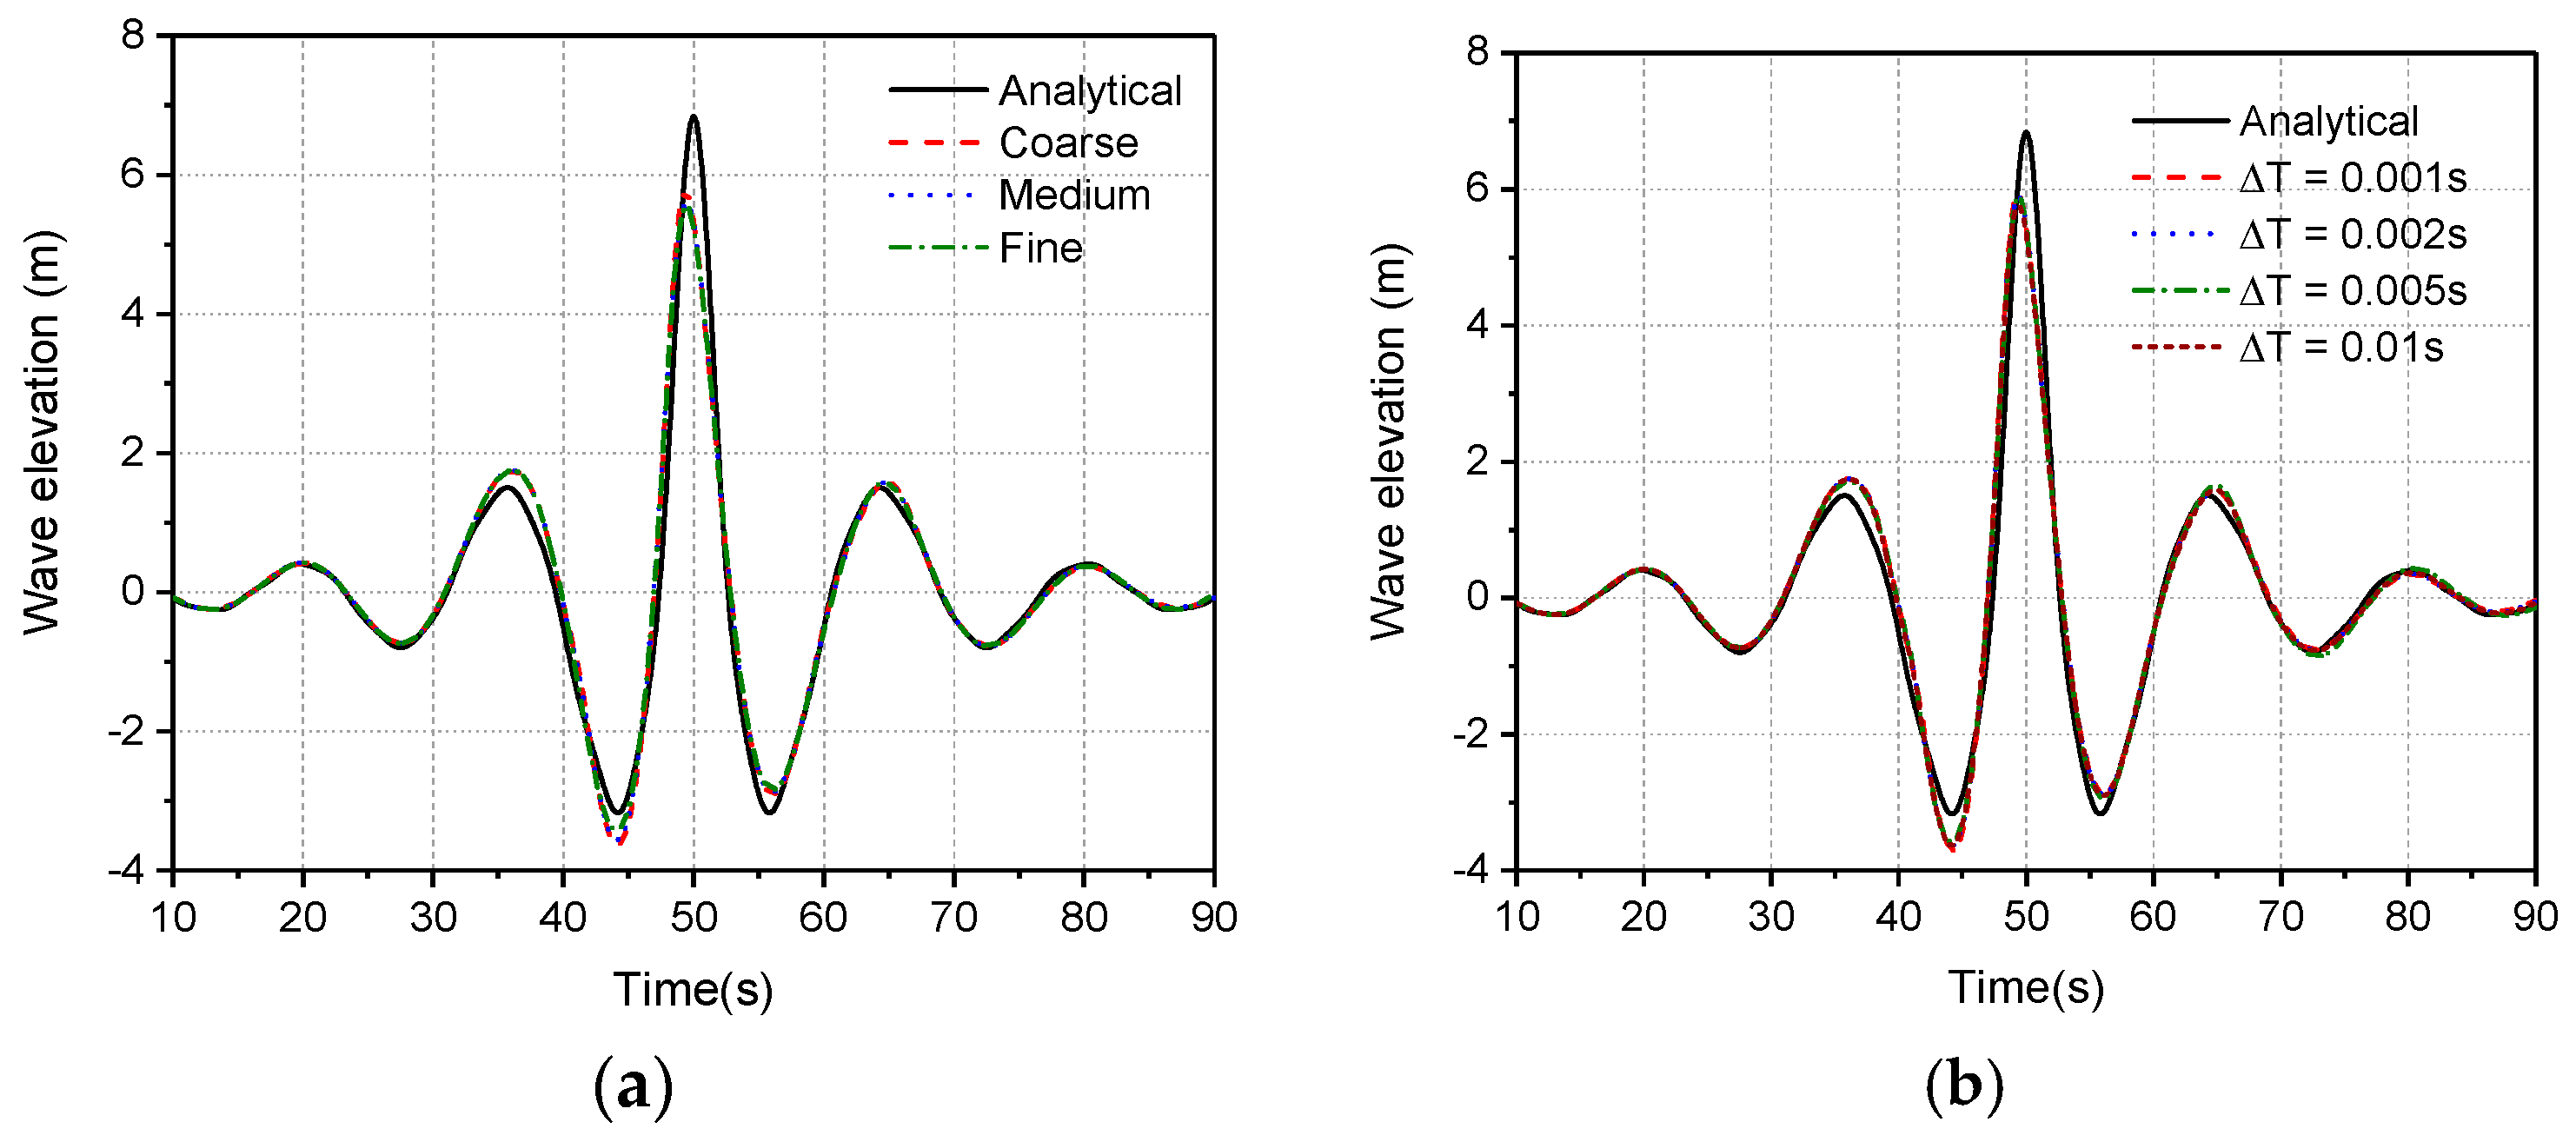
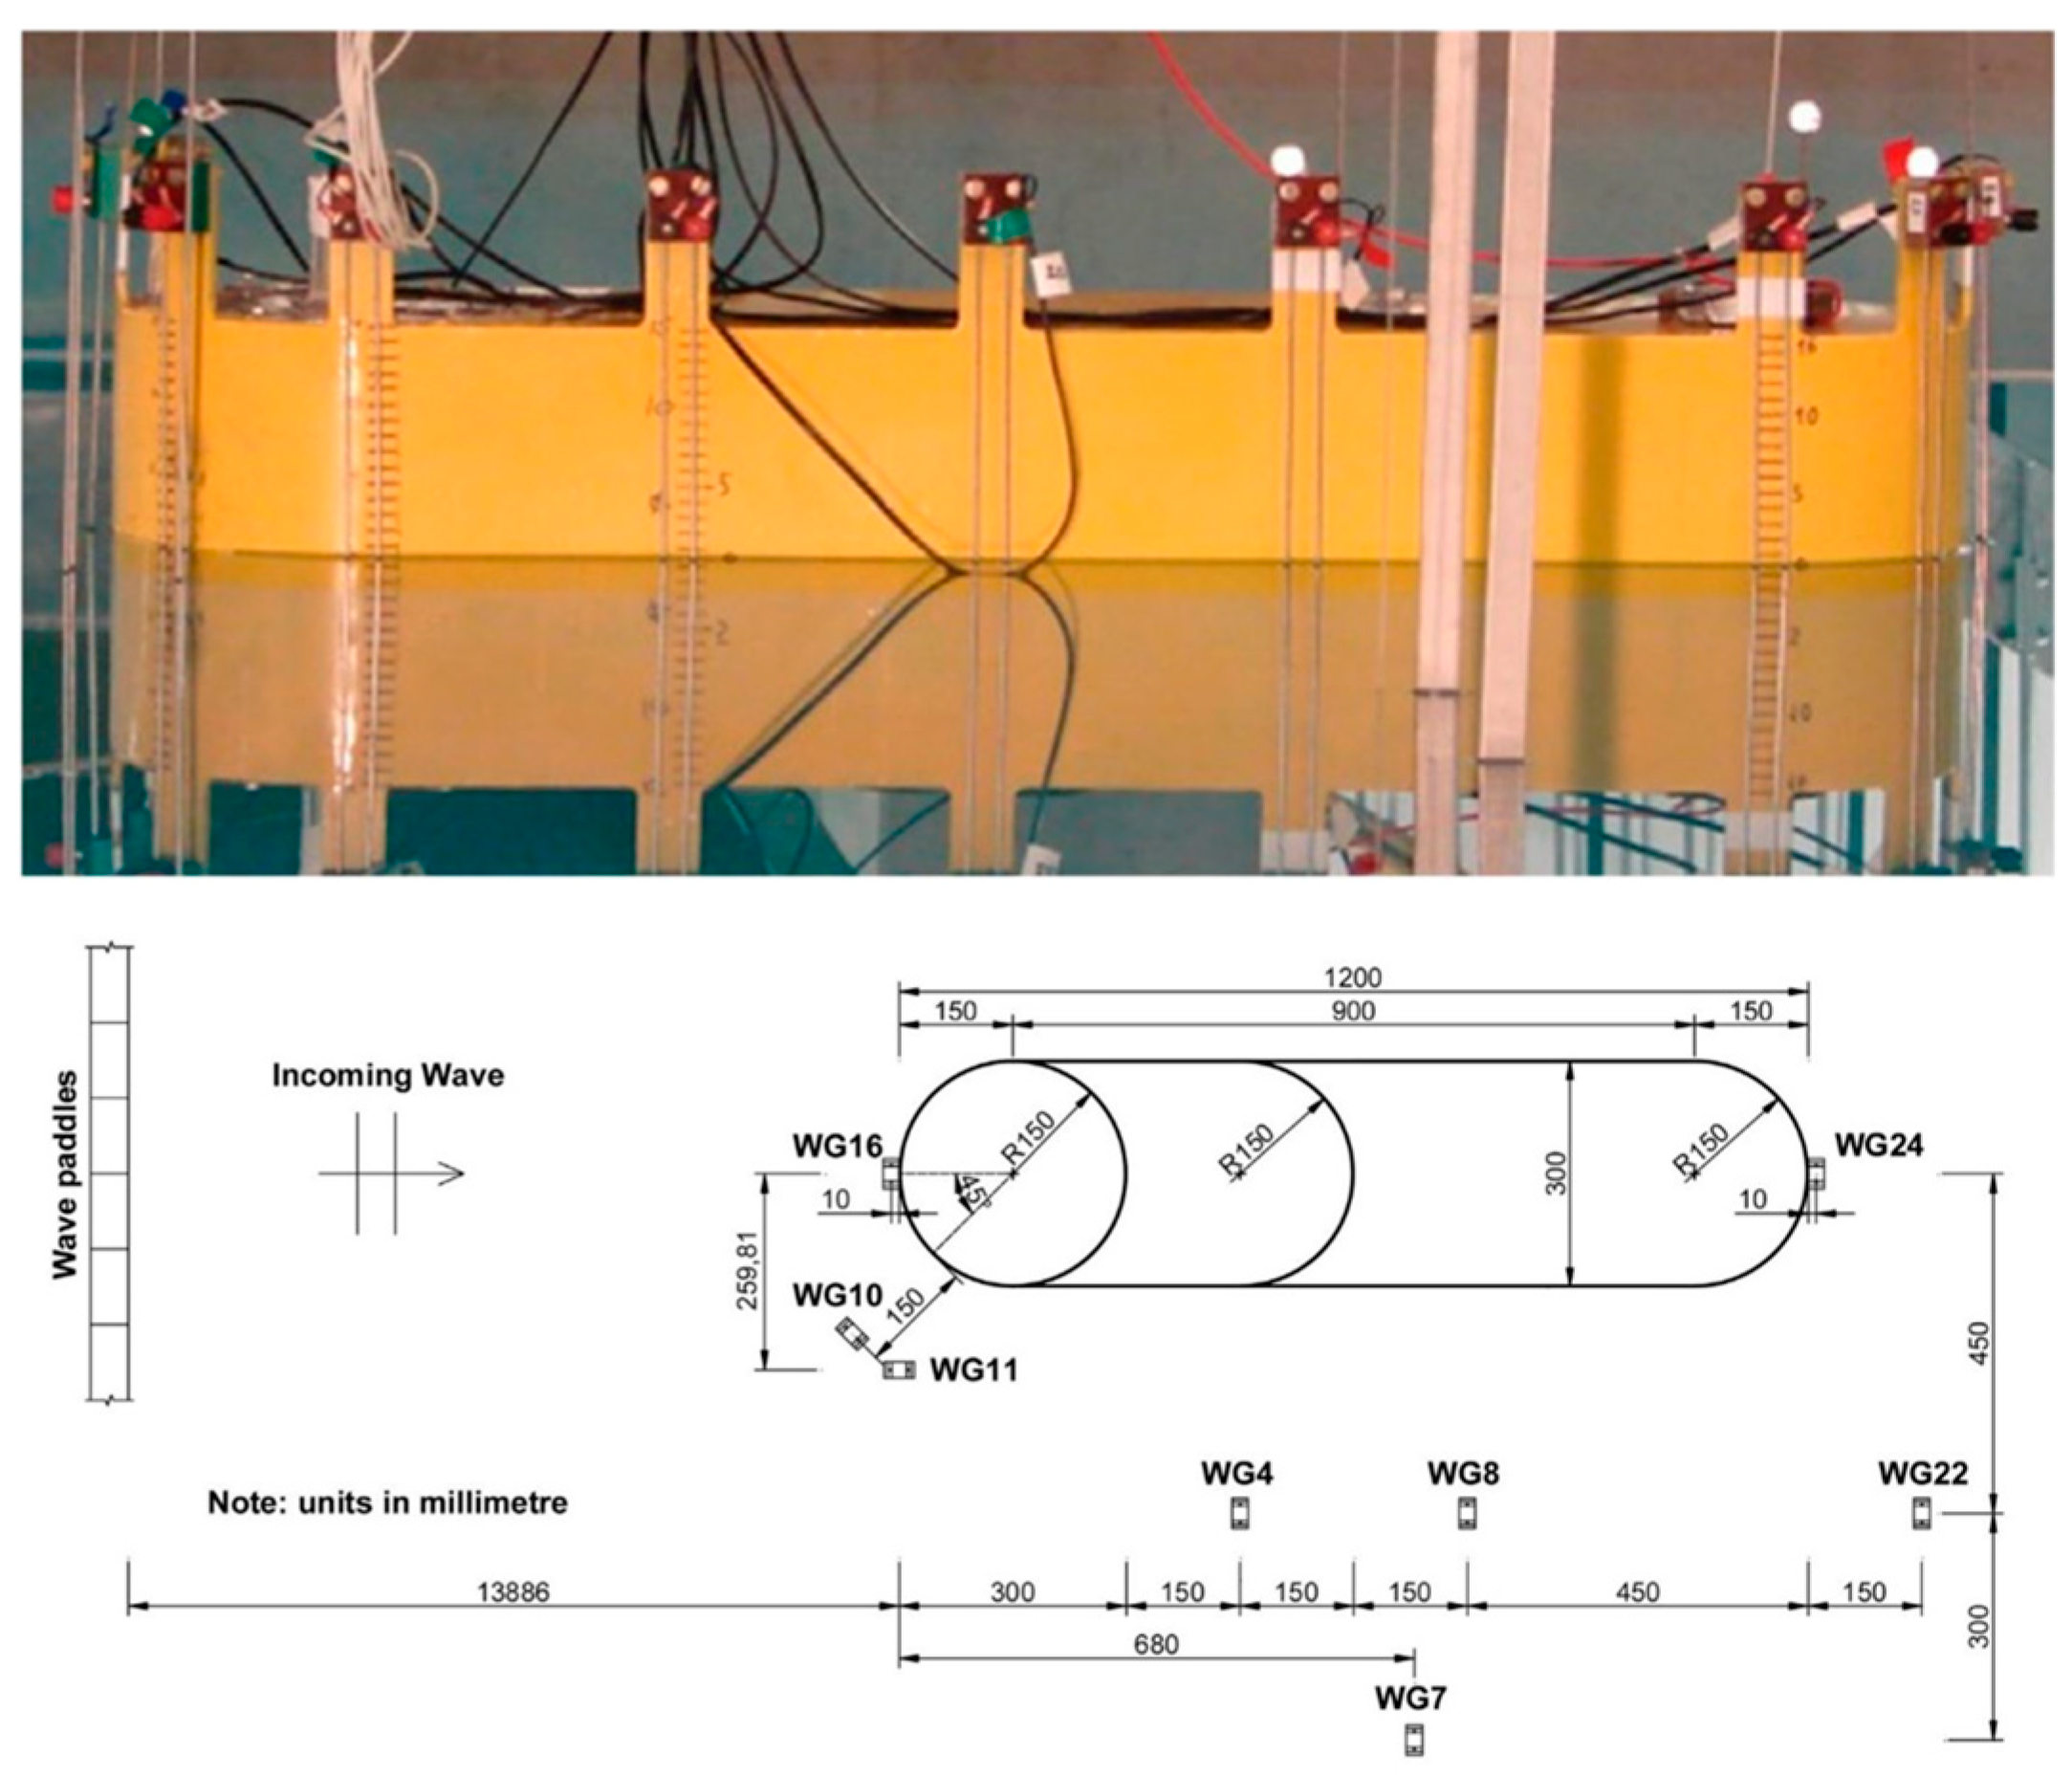
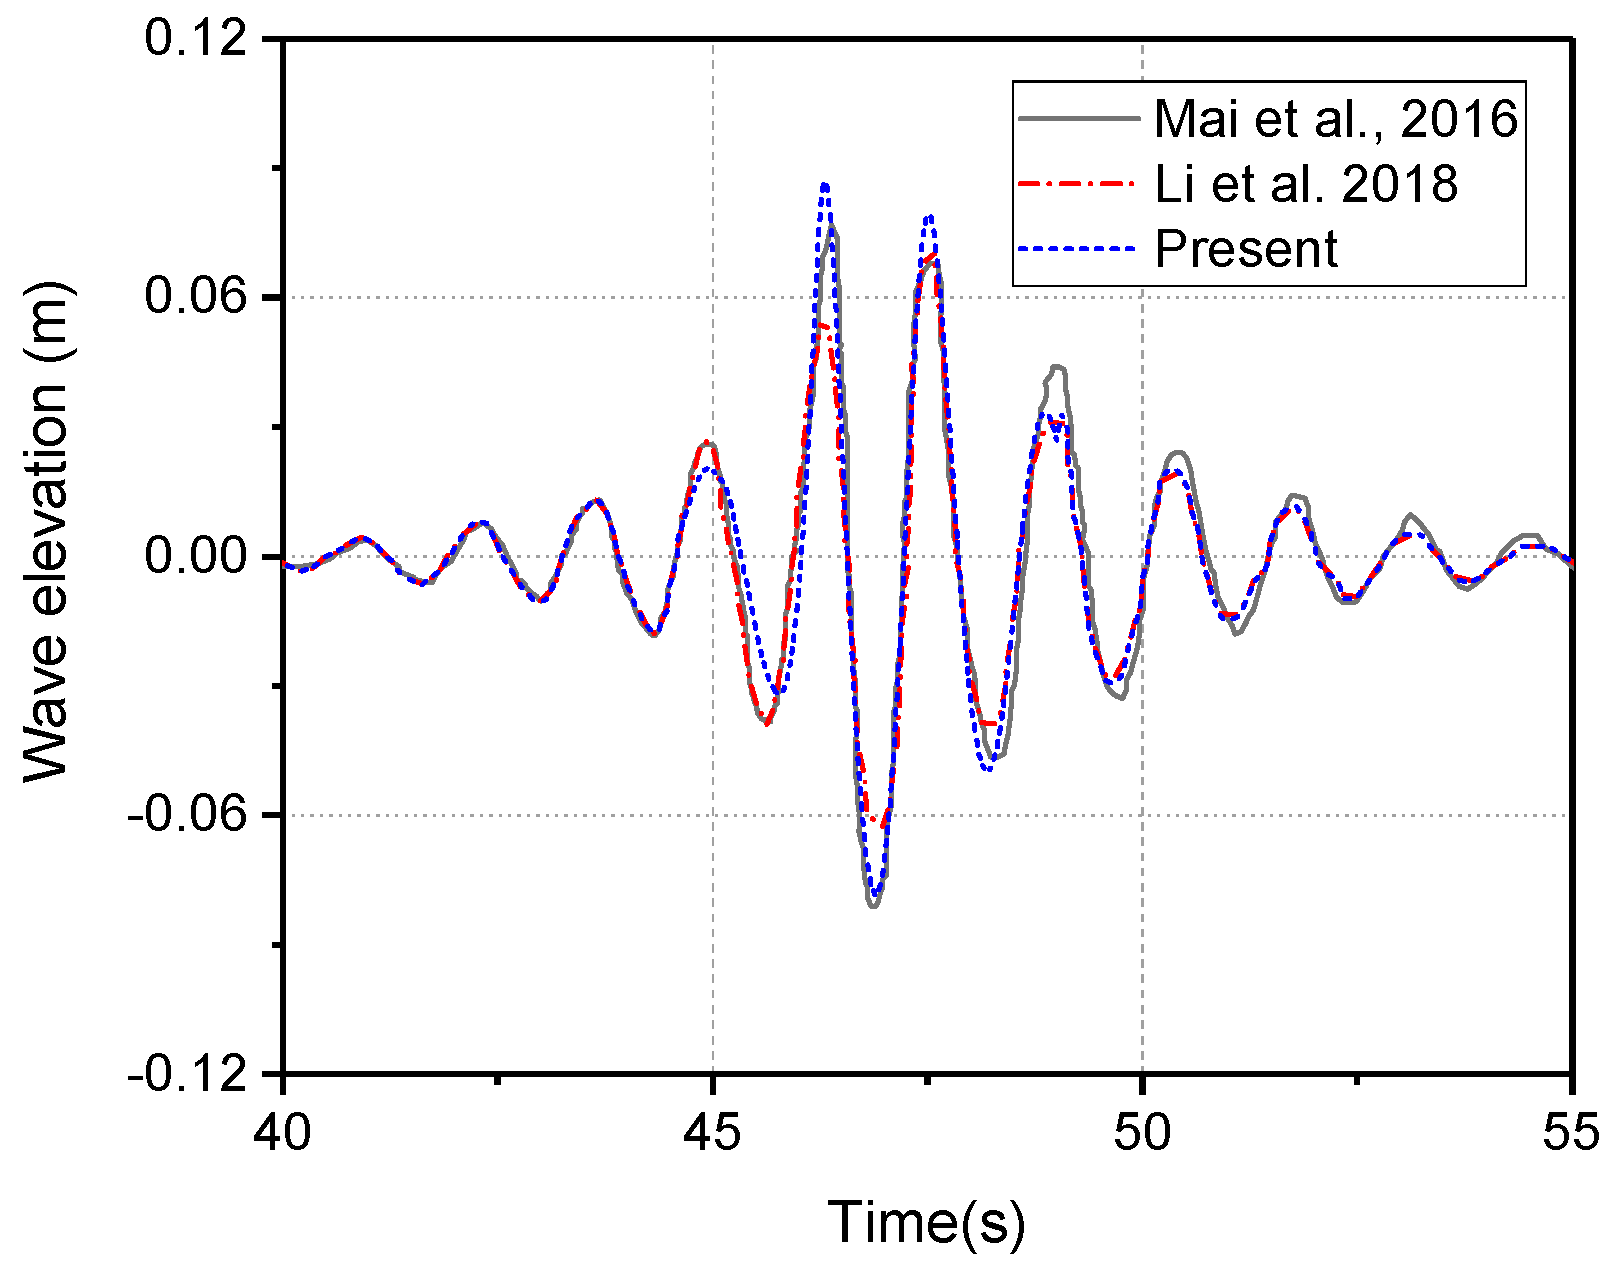
Section 3, the verification cases are presented which include a focused wave generation in a numerical wave tank; a wave-structure interaction study on a fixed FPSO subject to a focused wave. In 
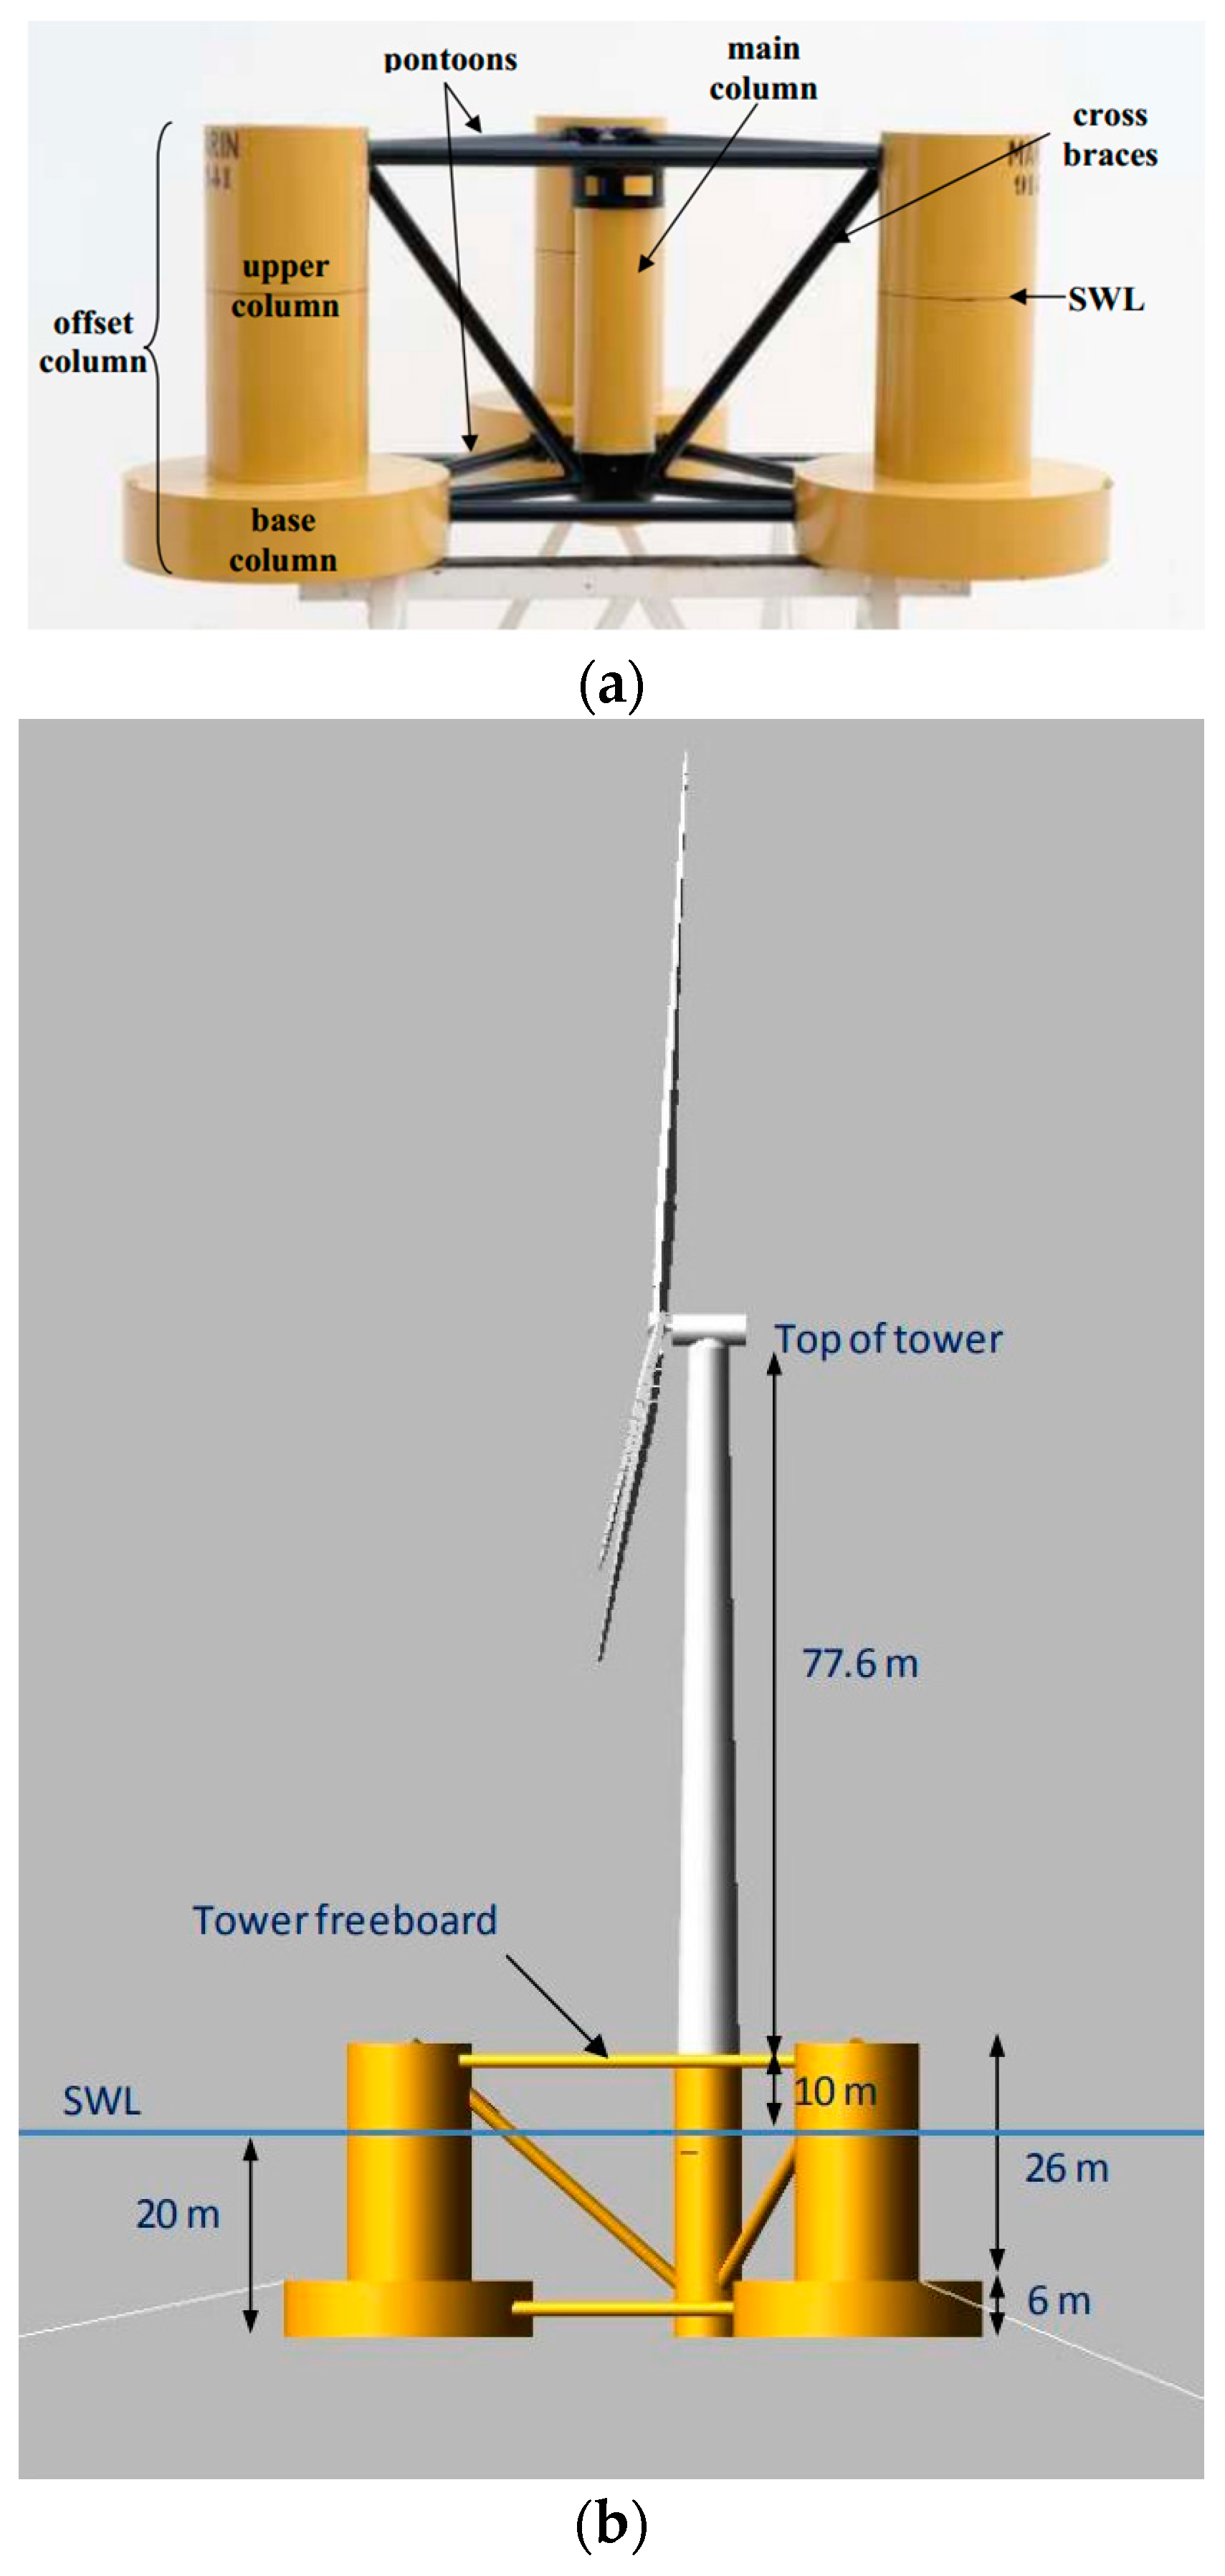
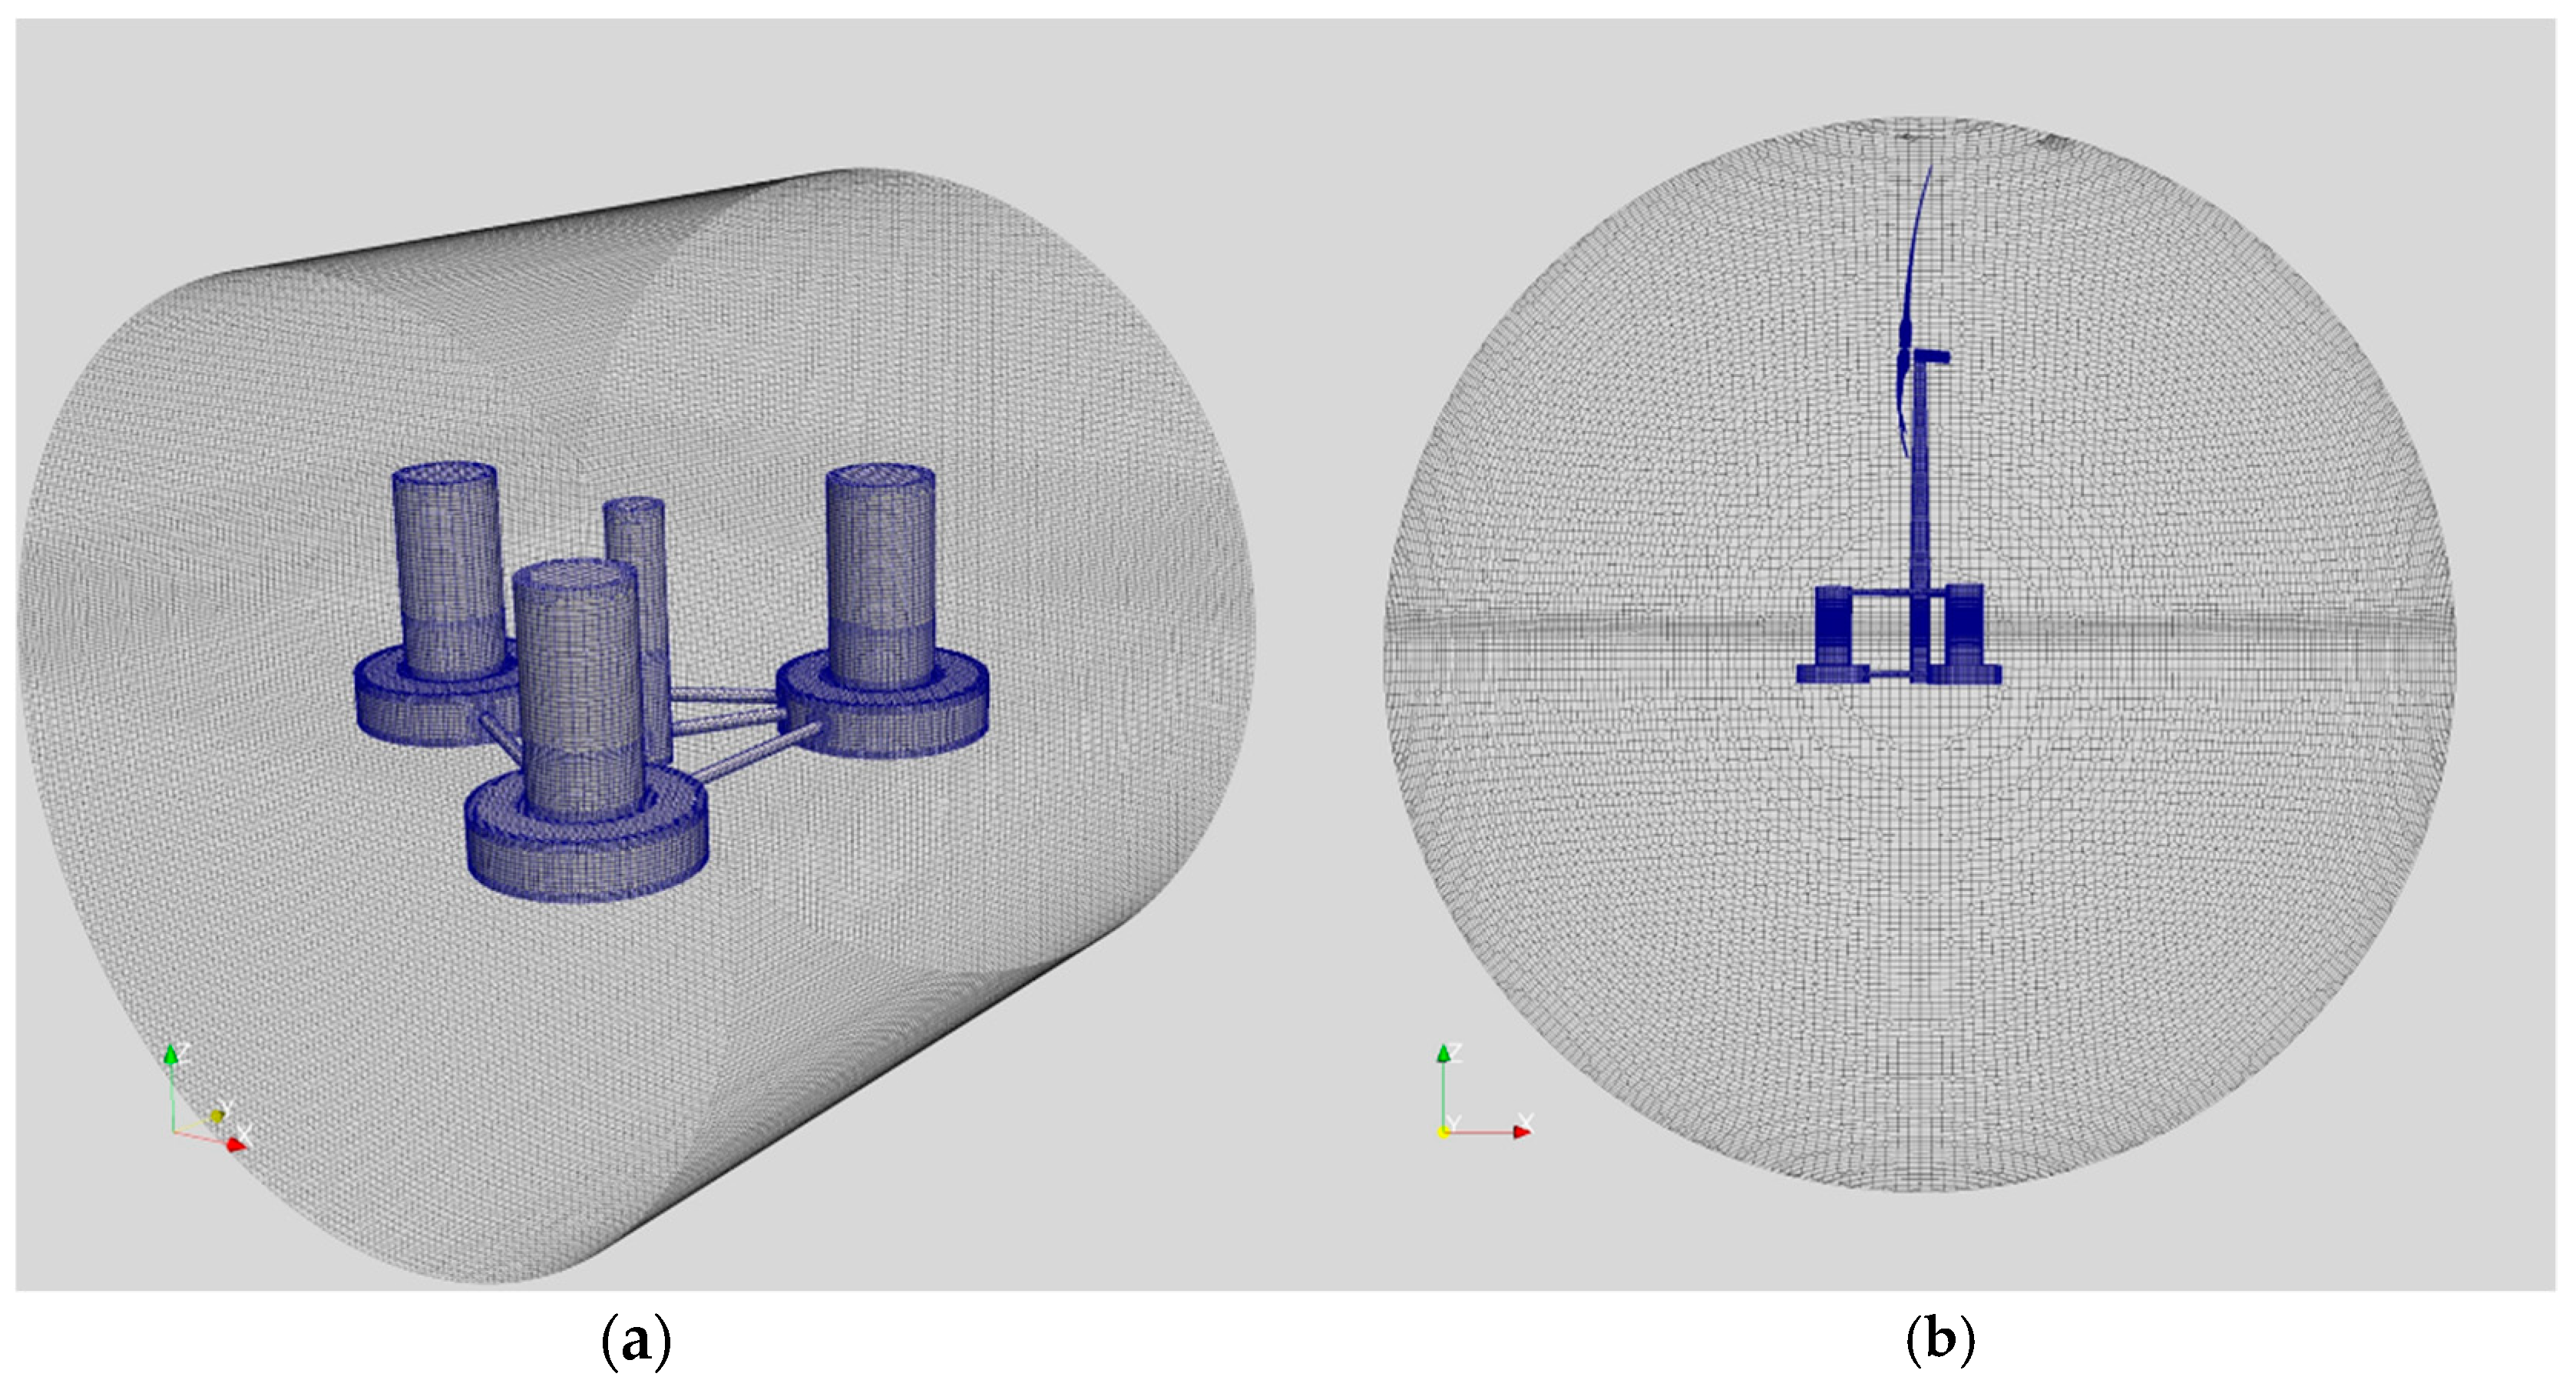
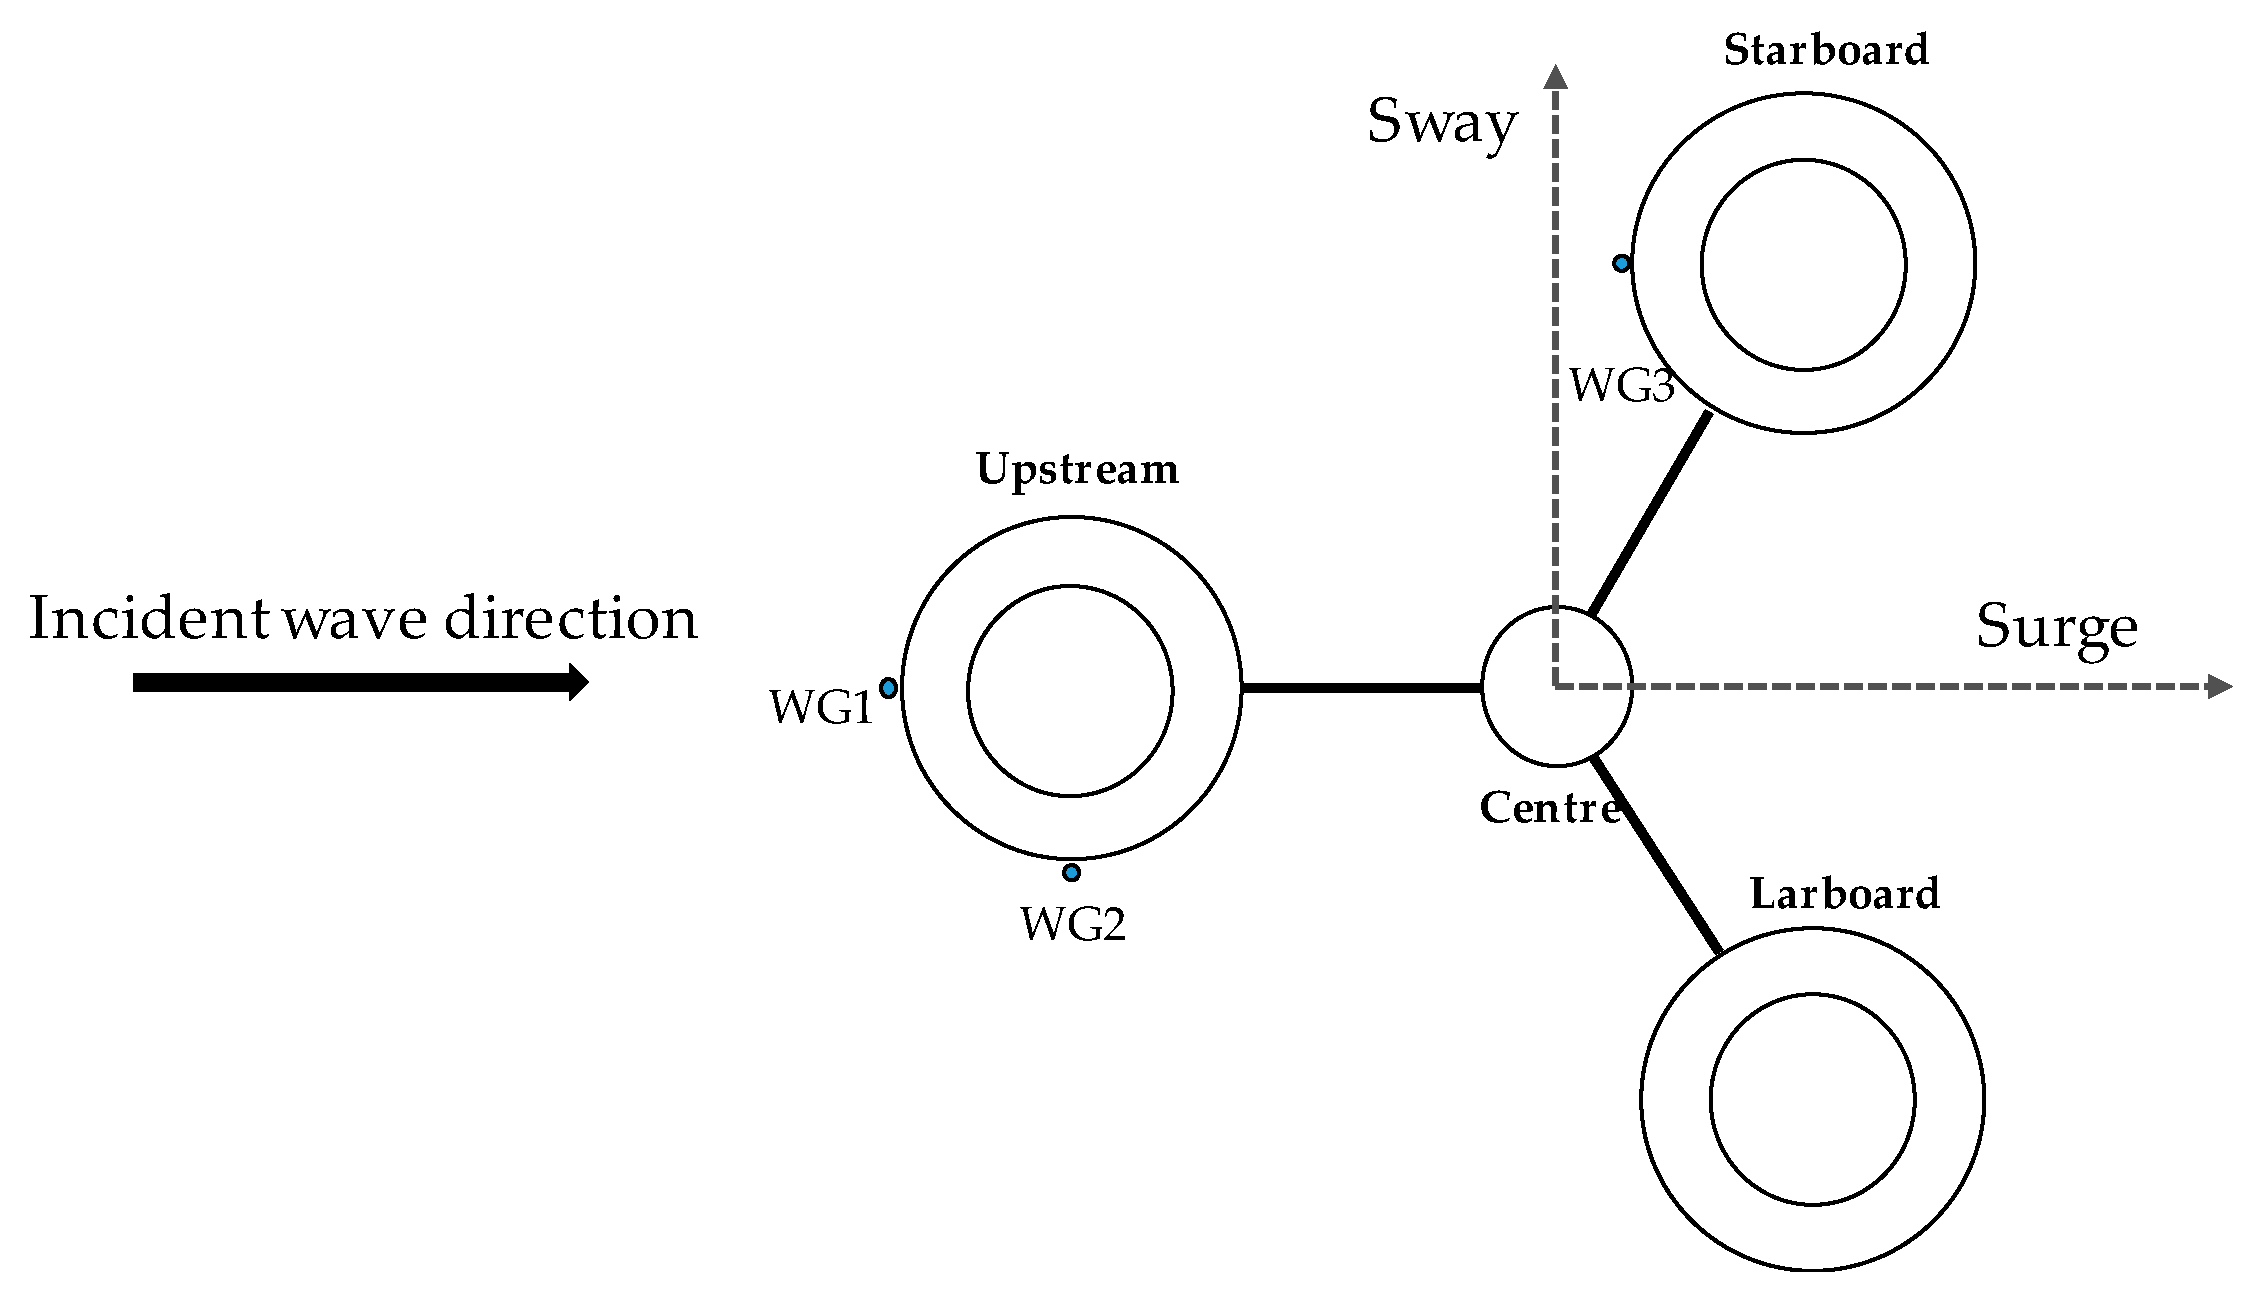
Section 4, the numerical results for the study on an Offshore Code Comparison Collaboration Continuation (OC4) floating semi-submersible platform and a parked floating wind turbine are presented. The results include the hydrodynamic motion response, the inline force, wave run-up and tension loads. The conclusions are drawn in the final section.

2. Problem Statement and Numerical Methodologies

As a benchmark in the studies on floating offshore wind turbine, the NREL 5 MW OC4 semi-submersible floating wind turbine is adopted in the present simulations [6,11,12]. Figure 1a shows a 1/50 scale model of the DeepCwind semi-submersible platform, and Figure 1b displays an entire FOWT. The design parameters and system properties, for the platform, mooring line, and NREL 5 MW wind turbine are listed in Table 1.
The key modules in the present floating offshore wind turbine modelling are a wave-structure/wind-structure interaction CFD solver based on solving the Unsteady Reynolds-Averaged Navier-Stokes (URANS) equations using a finite volume method. The two-phase free surface between wave and air is captured using the Volume of Fraction (VOF) method. For the numerical wave generation, the “waves2Foam” module based on the multiphase solver “interFoam” in OpenFOAM [21,22] is utilized. In this CFD work, the mooring lines are not directly simulated. Instead, its impact on the floating structure is considered via a dynamic mooring line model [14]. The present CFD solver has been successfully applied to study FOWT with the regular wave and aero-elastic response of the wind turbine blades as described in our previous work [9,11,14]. The detailed explanations on the flow solver, the moving mesh strategy and the mooring system analysis can be found in the above references. In the following sections, we will only provide brief descriptions of some important points.

2.1. Governing Equations of Fluid Flow

The continuity equations for a transient, incompressible and viscous fluid:
· U = 0
In addition, the Navier-Stokes equations are written as
ρ U t + · ( ρ ( U U g ) U ) = P d g · x ρ + ( μ e f f U ) + ( U ) · μ e f f + f σ
where U and U g refer to the velocity of the flow field and grid nodes in Cartesian coordinates, ρ is the mixed density of water and air, g is the gravity acceleration.   P d represents the dynamic pressure instead of the total pressure. μ e f f = ρ ( v + v t )   is the effective dynamic viscosity, in which v and v t are the kinematic and eddy viscosity respectively.   f σ is the surface tension, which is only taken into consideration at the free surface.
To capture the water–air free surface, the Volume of Fluid (VOF) method [25] is adopted, using the following transport equations to govern the volume fraction variable α ,
α α t + · [ ( U U g ) α ] + · [ U r ( 1 α ) α ] = 0
To ensure the boundedness and conservativeness of the volume fraction α , the third compression term on the left-hand side of the transport equations is introduced, where U r is a velocity field to compress the interface as the compression velocity. The last term on the left-hand side is referred to the interface compression term, which only functions near the free surface due to the inclusion of   ( 1 α ) α . For a multiphase flow problem, the volume fraction of each liquid is used as the weighting factor to obtain the mixture properties for the density and the viscosity,
ρ = α ρ w + ( 1 α ) ρ a
μ = α μ w + ( 1 α ) μ a
where ρ w and ρ a are the density of water and air. Furthermore, μ w and μ a refer to the viscosity coefficient of water and air, respectively.

2.2. Turbulence Model

The turbulence model is only utilized when the parked FOWT is studied, as under this condition, the Reynolds number can be as high as 107. To deal with fully turbulent wind flow, it is necessary to use a turbulence model in the simulation. OpenFOAM provides different types of turbulence models; the two-equation k - ω shear stress transport (SST) turbulence model [26] is adopted as the closure for the URANS equations. The k - ω SST turbulence model combines the standard k - ω and k - ε models by adopting the standard k - ω model near the boundary layer and switching to the standard k - ε model in the far-field.
The governing equations for the turbulent kinetic energy k and the specific dissipation rate ω are defined as follows:
ρ k α t + · ( ρ U k ) + · ( Γ k k ) + P k ˜ D k = 0
ρ ω α t + · ( ρ U ω ) + · ( Γ ω ω ) + P ω D ω + Y ω = 0
where Γ k and Γ ω refer to the effective diffusivity of the turbulent kinetic energy k and the specific dissipation rate ω , respectively. P k ˜ and P ω are the turbulence production terms as D k and D ω refer to the turbulence dissipation terms. Y ω is the cross-diffusion term introduced by blending the standard k - ω and k - ε models.
To model the hydrodynamic responses of a semi-submersible platform in the absence of wind, laminar flow is assumed. This is widely accepted by researchers, because it was found that there is no apparent disparity between the results obtained from turbulence or laminar models when the flow is wave dominant rather than current dominant [27].

2.3. Wave Generation and Absorption

An open-source toolbox “waves2Foam” [28] is used to generate and absorb free surface waves in a numerical wave tank. The relaxation zone technique is adopted to provide better wave quality and to avoid wave reflection in absorbing zone, which are applied at both inlet and outlet boundaries in the numerical wave tank. The following equations specify the main function of the relaxation zones,
α R ( χ R ) = 1 exp ( χ R 3.5 ) 1 exp ( 1 ) 1
ϕ R = ω R ϕ R c o m p u t e d + ( 1 ω R ) ϕ R t a r g e t
where ϕ R refers to either the velocity or volume fraction of water α . The definition of χ R is that the weighting functions α R is always equal to 1 at the interface between the non-relaxed computational domain and the relaxation zones, and χ R is a value between 0 and 1. The relations between χ R and α R are shown in Figure 2. The superscript computed and target represent the value calculated in the computational domain and evaluated from the chosen wave model, respectively.

2.4. Focused Wave Generation

The focused wave is generated based on the first-order irregular wave theory, which is a linear superposition of individual regular wave components. The spectral shapes of irregular waves are implemented by the JONSWAP spectrum [29]. The significant wave height Hs, peak angular frequency   ω p and shape factor γ are the main input parameters to the JONSWAP spectrum,
S j ( ω ) = 5 16 H s 2 ω p 5 ω j 5 ( 5 4 ) exp ( ( ω j ω p ) 4 ) γ r
Based on the irregular wave theory, modulation of phase angle among individual wave components can achieve a large amount of wave trains energy at a fixed time spot. The wave peak superposition at a fixed time and position is mathematically represented as
cos ( k i x ω i t + τ i ) = 1
where k i is the wave number and ω i is the angular frequency of each regular wave component, and τ i is the phase angle of each regular wave. The phase angle of the wave component is written as
τ i = k i x ω i t 2 π n ,   n = 0 , 1 , 2 ,
The wave elevation of the wave train at a focused position x c and a focused time t c is expressed as
η ( x , t ) = i = 1 n H i 2 c o s ( k i ( x x c ) + ω i ( t t c ) )

2.5. Mooring System Analysis

The mooring system of floating offshore structures is essential to providing the restoring force for motions in all degrees of freedom. An in-house dynamic mooring analysis module is developed, which is able to predict better motion response than a quasi-static method [14]. A 3D lumped mass method is utilized, which is based on the discretization of a mooring line into n segments and n + 1 concentrated nodes connected by adjacent segments as shown in Figure 3, which is sometimes also referred to as a Spring-Mass model. In addition, for the mooring line of the catenary shape, a large portion of the line lies on the seabed and a treatment is required to model the interaction between the mooring line and the seabed by using a simplified kinematic constraint.

2.6. Numerical Method

In the present study, flow equations are solved by using the open source software OpenFOAM [30]. PIMPLE (a combination of Pressure Implicit with Splitting of Operator (PISO) and Semi-Implicit Method for Pressure-Linked Equations (SIMPLE)) is utilized to solve the pressure-velocity coupling. The maximum allowed Courant number is set to 1 (wave only) and 75 (wind and wave) respectively. The time step is fixed as low as 0.002 s when a floating platform is simulated, whereas it is changed to 0.001 s for the modelling of a FOWT.

2.7. Computational Domain

The full-scale OC4 DeepCwind semi-submersible platform is analysed by using a built-in arbitrary mesh interface (AMI) method in OpenFOAM. The sketch of the numerical model is shown in Figure 4. The computational domain in the semi-submersible platform modelling extends in three dimensions, i.e., 5 D < x < 10 D , 5 D < y < 5 D and 4 D < z < 3 D , where D refers to the spacing of offset columns (50 m). To simulate a FOWT, the domain size in the x- and y-axes remain the same as the platform case. However, due to the large size of the slender shape of the turbine blade, the computational domain along the z-direction is extended to 4 D < z < 8 D . The length extends from the blade tip to the top of the computational mesh is 3.7D (184 m). In all simulations, the platform is located at the origin of the coordinate system. The length of the inlet and outlet relaxation zones are 3D and 6D respectively in order to provide a better wave quality and minimize the wave reflection of the outlet boundary.
Figure 5a,b shows the partial mesh on the structure and AMI surfaces of the entire computational mesh, which is generated with a built-in tool snappyHexMesh in OpenFOAM. Grid refinement is applied near the free surface and the platform. In addition, eight layers of boundary layer mesh with the first layer grid thickness of 0.012 m and 0.004 m and a progression rate of 1.2 is adopted in the semi-sub platform and parked FOWT simulations. The total number of grids are 2,353,906 and 4,899,720 for the platform only and parked FOWT, respectively.

2.8. Boundary Conditions

The boundary conditions are defined as follows. At the inlet boundary (left side of inlet relaxation zone), the velocity is prescribed as the incident focused wave and wind, while the pressure gradient is set as zero. Moreover, the boundary conditions at the outlet boundary vary in wave only and wind-wave simulations which is annotated in Figure 4, the velocity is fixed as zero in wave only simulations, while the gradient of the velocity is set as zero in wind-wave simulations. The boundary condition of the upper part is set as the atmosphere. The gradient of velocity and pressure is set as zero at the front and back boundary (the boundary with the maximum positive and minimum negative value in the y-axis in Figure 4). The non-slip wall boundary condition with zero pressure gradient is defined on the surfaces of the semi-submersible platform.

3. Verification and Validation

As indicated in Section 2, the present CFD solver has been validated via several FOWT cases in our previous papers [9,11,14]. Specifically, the solver was examined by simulating the hydro/structural responses and aerodynamic performance of OC4 NREL 5 MW floating wind turbine with a series of regular waves. All these cases showed good agreement with the results from reduced-order NREL FAST V8 tool. The discrepancies existed are due to the viscous effects which are dealt with differently via two different methods. In the present paper, we carry out additional studies to justify the correctness and accuracy of the methods we use to deal with the focused wave generation and the wave-structure interaction under focused wave conditions.

3.1. Sensitivity Study of Focused Wave Generation

In the present study, a 2D mesh and time step convergence test is carried out for the focused wave generation. The numerical wave tank has the length L of 680 m (−230 m < x < 450 m), the width of 2 m (−1 m < y < 1 m) and the height of 300 m (−200 m < z < 100 m). The water depth is set as 200 m. The significant wave height of the focused wave is Hs = 8.0 m and the wave peak period Tp = 15.0 s. The focused position is set at x = 0.0 m, and the focused time is set at 50 s. To generate this focused wave group, we used a frequency band between 0.035 to 0.085 Hz and 50 individual wave components.
Three meshes with different densities are generated, which are termed as Fine (20,060), Medium (15,470) and Coarse (10,880). Similarly, four time steps (Δt = 0.01 s, 0.005 s, 0.002 s and 0.001 s) are chosen for this sensitivity study as summarized in Table 2, Table 3 and Table 4.
Figure 6 summarizes the time history of wave amplitude for different mesh densities and time steps. It is seen that with sufficiently high mesh densities and sufficiently small time steps, the results of the predicted wave elevation are not sensitive to numerical parameters. Taking the computational cost into consideration, the medium size of the mesh and time step of 0.002 s is utilized for the following simulations.

3.2. Validation of Wave-Structure Interaction of Fixed FPSO to Focused Wave

In this case, the numerical verification for a focused wave-structure interaction problem is carried out with a fixed Floating production storage and offloading (FPSO) structure. The predicted results are compared with the wave tank data [22] obtained in the Ocean Basin at Plymouth University’s COAST Laboratory and other CFD results [31]. The significant wave height is given as 0.103 m, and the wave peak period is 1.456 s. The components of the wave group and the frequency band are set to be identical to the experimental test [22] and other CFD simulations [31]. The focused position is set at WG16, which is located upstream to the FPSO model. The layout of the FPSO model is shown in Figure 7. The length, width and depth of the numerical wave tank are 16 m (−8 m, 8 m), 5 m (−2.5 m, 2.5 m) and 5 m (−3 m, 2 m), respectively. The centre of the FPSO model is located at the origin of the coordinate system. The total mesh is 442,490, which is refined near the free surface and around the FPSO model. The relaxation zones of the wave generation and wave damping are set as 4.5 m and 6 m away from the inlet and outlet boundaries.
In Figure 8, the numerical wave elevation data at WG16) is plotted to compare with other CFD [31] and experimental results. As can be seen, the present CFD results are comparable to the wave tank data and other CFD simulation results. However, disparities in predicting the maximum wave elevation could be observed. The difference might be due to the different length of relaxation zones to generate and absorb waves. Moreover, the local instantaneous wave elevation contour is displayed in Figure 9b along with experiment results in Figure 9a. By comparing the CFD result together with the experimental picture, it is clear that the flow field around the FPSO is very similar when the wave propagates through the FPSO structure. This case demonstrates the capability and accuracy of the present CFD modelling tool.

3.3. Validation of DeepCwind Semi-Submersible Floating Offshore Wind Turbine

For the purpose of model validation and calibration, the hydrodynamic response and aerodynamic performance of a DeepCwind semi-submersible floating wind turbine under regular waves was investigated and published in our previous paper [11]. In that paper, a fully coupled hydro-aero-mooring FOWT was modelled under different working conditions by using a self-developed high-fidelity CFD tool. The results, in terms of free decay test, hydrodynamic response of floating platform, the tension loads of mooring lines and aerodynamics of wind turbine, were carefully examined and compared with wave tank data and other potential flow-based tools like NREL FAST. Good agreements were achieved, which provided evidence for the success of our CFD model.

4. Potential Flow Theory (EDF)

The results based on a potential flow theory presented in this paper have been obtained using the EDF R&D floating wind turbine aero-hydro-elastic solver CALHYPSO [
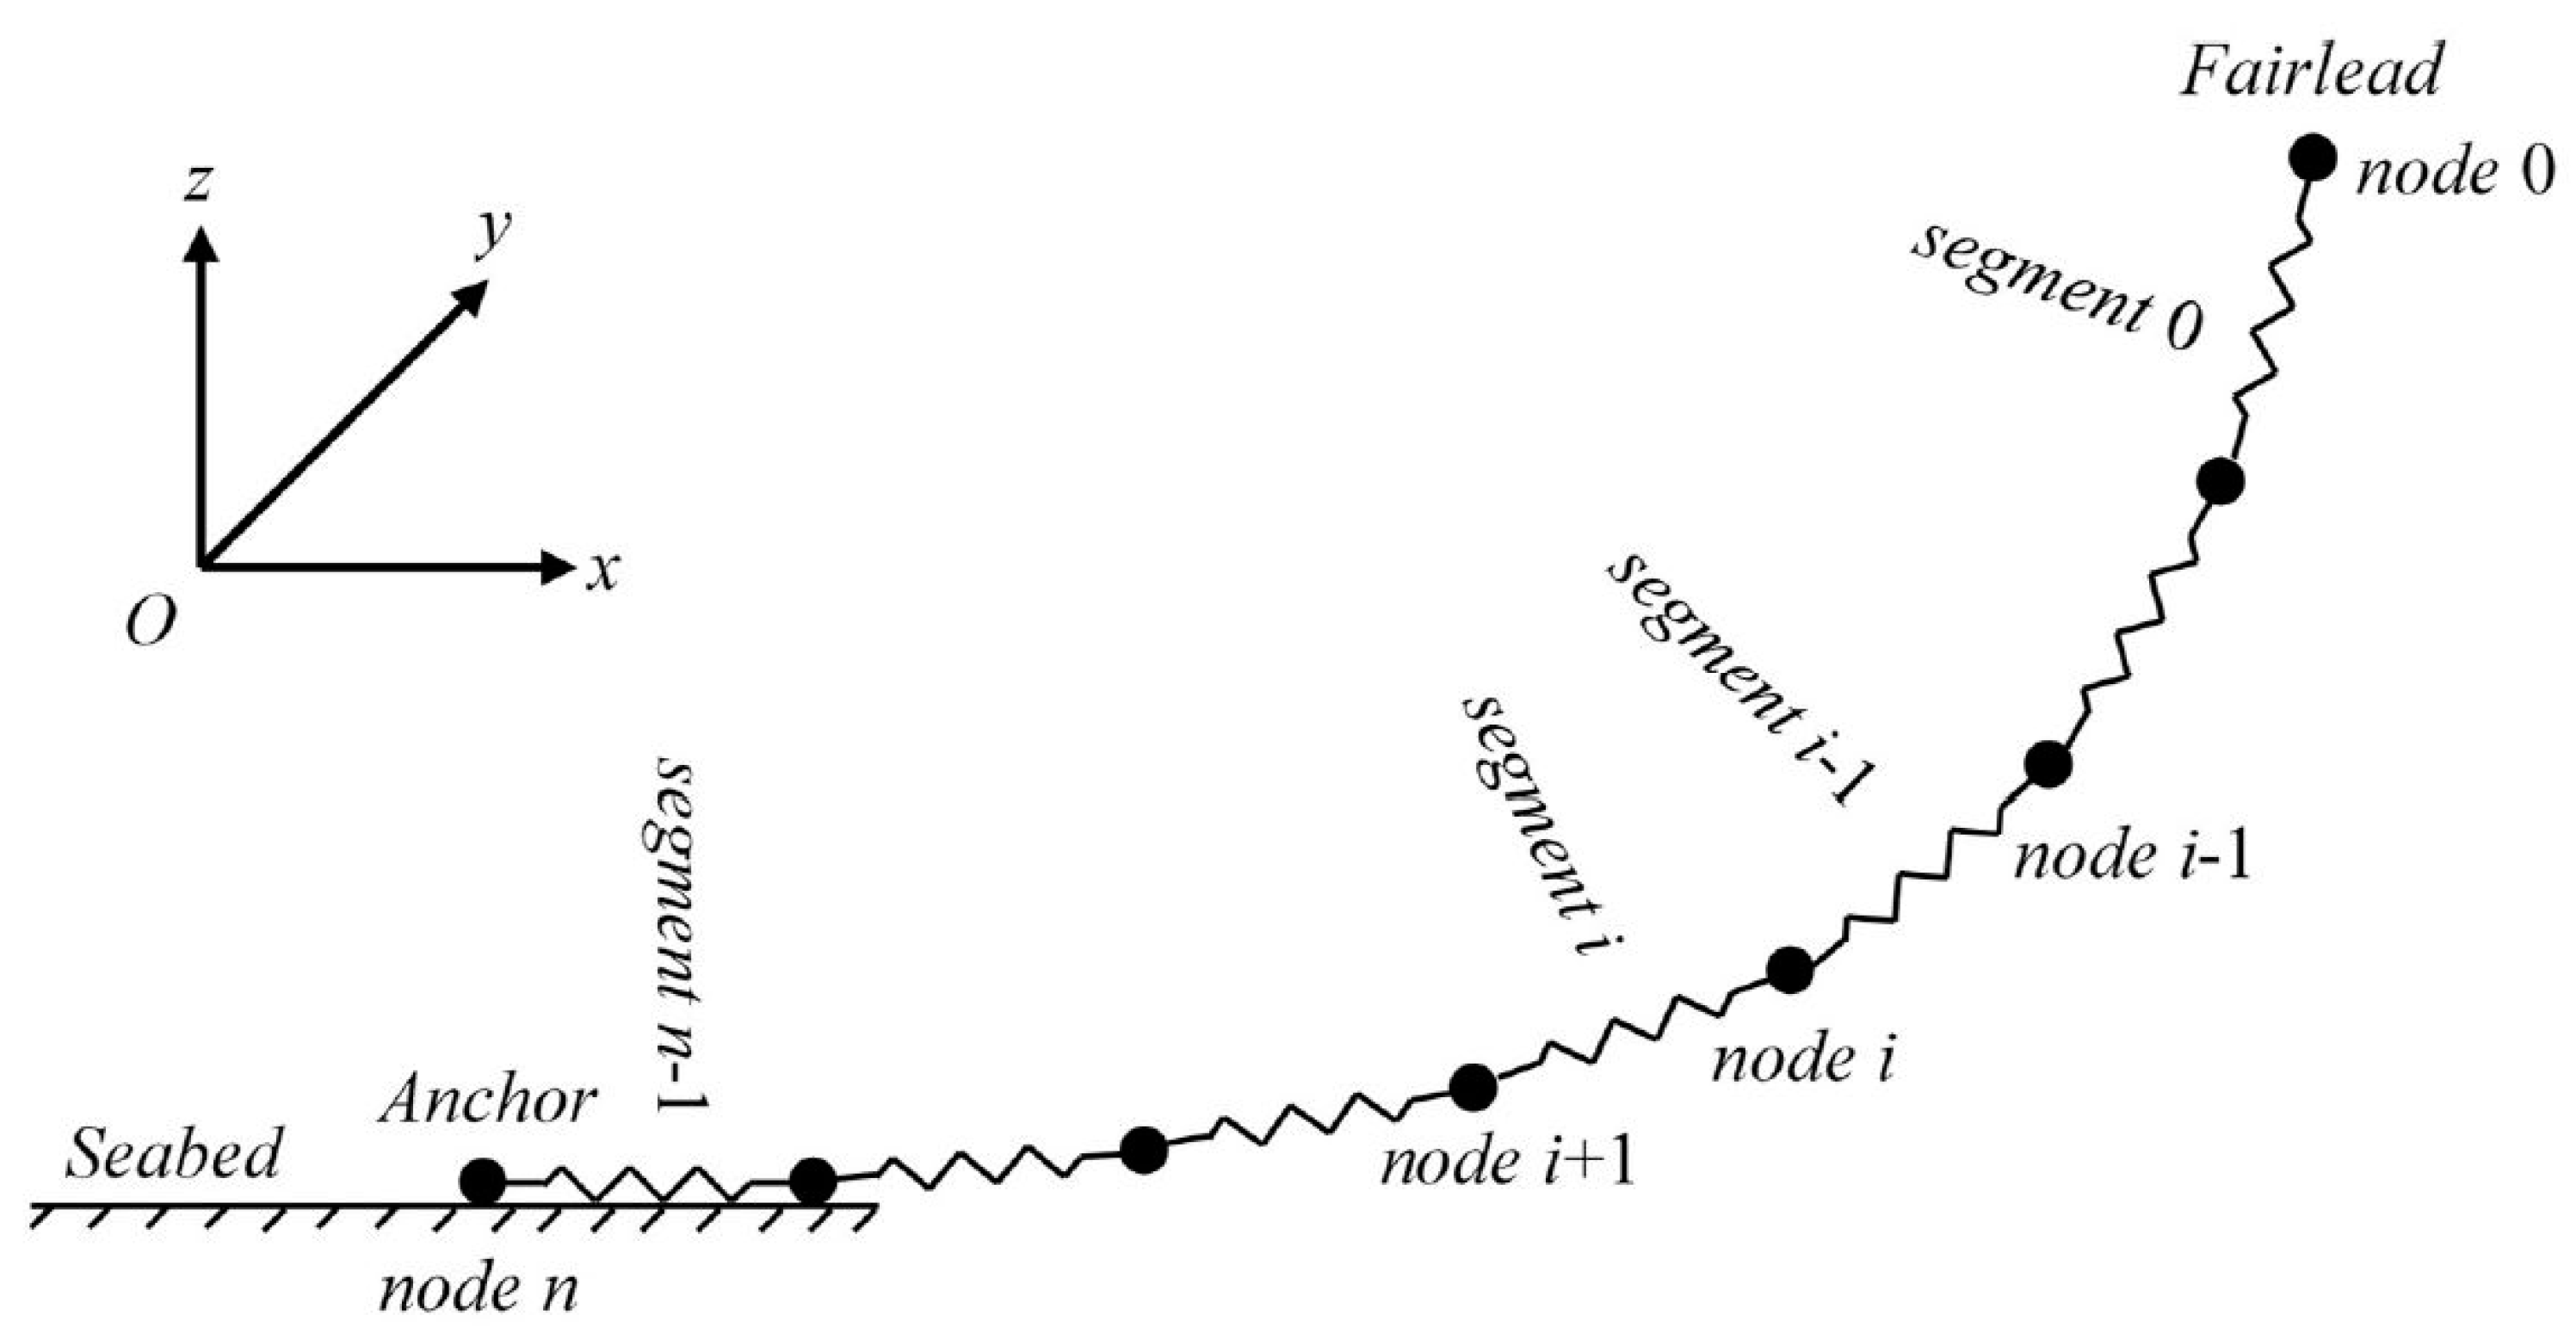
24]. In this paper, only the hydrodynamic part of the code is used. The floater is regarded as a rigid body; only the 6 rigid body motions are solved in the time domain, using a Newmark time marching scheme. For the present paper, mooring lines are regarded as quasi-static, and the catenary equation is used to capture their response to floater motion. As shown in [32], this assumption is not expected to influence the motions of the floater, but only the tension level in the lines, which are not studied in the paper. The hydrodynamic loads are computed in the frequency domain using the potential flow solver NEMOH, developed by Ecole Centrale de Nantes [33], which solves the diffraction and radiation problems. Then the Cummins approach is applied for the time domain resolution. The convolution integral is used to account for radiation effects with a time window of 60 s, which is enough regarding the typical RIRF of the floater. Forces are computed up to second order (QTF), and are applied in the time domain without bandwidth limitation. Even if not presented, it has been verified that the sum-frequency QTF has almost no influence on the floater motions, and thus only difference-frequency loads are included in the present model. This result was expected for semi-submersibles. The viscous part of the hydrodynamic force is accounted for using strip theory on all columns and bracings, with homogeneous drag coefficient Cd = 1. A sensitivity study was carried out on this value, but the motions showed little variations when using Cd = 0.6 or Cd = 2. Regarding the wave theory, first-order Stokes waves (Airy theory) have been used to compute the focused wave elevation. FFT is applied on the 200 s long free wave elevation time series obtained with the CFD solver at a reference point (centre of the floater at t = 0) in order to get the wave components of the focused wave. About 200 significant wave components are extracted for the cases considered here. Amplitudes and phases are then applied as imposed spectrum into CALHYPSO, and it is verified that the free wave elevation is consistent with the inputs. Finally, the modified Wheeler stretching model is applied to compute the undisturbed wave kinematics in the fluid domain. It is noted that wave kinematics are only used for viscous forces, as all other forces are included in the hydrodynamic database computed by NEMOH. The EDF CPU time is 40 s for the 200 s calculations performed in this study.

5. Results

5.1. Fixed DeepCwind Semi-Submersible Platform

In this section, a study on the wave-structure interaction problem is carried out for a fixed semi-submersible platform (Figure 1a) with both focused and regular waves. The main wave parameters are summarized in Table 5 and Table 6 for the focused and regular wave conditions with reference to the sea states from the North Sea. In all cases, the wave period (T or Tp) is fixed at 15 s, the significant wave height (Hs) for the focused wave and the wave height (H) for the regular wave are systematically increased from 6.0 to 14.7 m. The main aim is to examine the wave steepness impact on the hydrodynamic forces exerted on the semi-sub and to illustrate whether nonlinearity occurs.
It should be pointed out that the inline forces along the wave propagation direction are the most important forces in the study of wave-structure interaction as compared to the forces along y and z directions [16,34]. This can be seen in Figure 10, where the force components in x, y, and z directions are displayed for a regular wave case (H = 8.0 m, T = 15.0 s). As can be seen from Figure 10, Fx is much larger than Fy and Fz, its impact on the structure is large. Therefore, only the inline forces are deeply investigated in detail in the following sections.
Apart from the load analysis, the wave run-up is another crucial parameter that is widely adopted in the design of offshore structures or to investigate the occurring of wave over-topping especially under severe sea states. It is well accepted that the rapid rise of wave surface can cause large wave impacts on offshore structures [35,36]. Therefore, in this section, the predicted wave run-up from CFD analysis will be also discussed.
The typical wave elevations as a function of time for five designed focused wave cases defined in Table 5 are plotted in Figure 11. As can be seen, the focused time is pre-designated at 50 s, this value is determined considering the computational costs and also the limitation for the shortest focused time which must be large enough (see τ i in Equation (12)). The focused position is set at the centre of the coordinate system, where the centreline of the DeepCwind semi-submersible platform is located. These five focused waves will be adopted for the following FOWT analysis.

5.1.1. Inline Forces

The discussion on inline forces is given with its non-dimensional form for the analysis of wave steepness impact on the loads of a structure. With recommendations from [37,38], the inline force Fx is related to the following non-dimensional parameters
F x ρ g d D 2 = f ( D L , H D , d D , h D , υ / g L 3 )
where ρ is the water density, g is gravitational acceleration, h refers to the water depth, υ represents the kinematic viscosity, H is the wave height and D is the characteristic length of the model. d refers to the water depth while the L denotes the wave length of the incident wave.
To account for the wave loads due to per-unit incident wave height, the first term is divided by (H/D), where D is the characteristic length of the floater, leading to a non-dimensional force F’.
F = F x ρ g d D 2 D H
The dimensionless inline force for the focused wave, displayed in Figure 12a, shows that only peak values of F’ before the focused time (t = 50 s) profoundly increase when the wave steepness is lower than 0.074, the peak value remain in the similar value as the wave steepness is larger than 0.074. This may be largely due to the fact that the occurrence of wave overtopping does not cause extra loads along the wave direction. A sharper crest and broader trough around focused time are also observed as the wave goes steeper, implying the nonlinearity becomes remarkable as the wave steepness increases. Moreover, a secondary load cycle is captured near t = 52 s, which is caused by the wave diffraction in the opposite surge direction near the structure, suggesting again the nonlinearity of wave-structure interactions under focused wave conditions [16,39]. Figure 12b summarizes the time history of the dimensionless inline force F’ due to regular waves in one non-dimensional wave period. As can be seen, an increase of wave steepness leads to an increase of F’ amplitude and also the non-harmonic variations of F’, indicating that a strong nonlinear wave-structure interaction appears.
The Power Spectral Density (PSD) results are presented in Figure 13, together with the inline force Fx used for PSDs. Here, in all PSDs plots, a dimensionless (f/fp) is used to better reflect the linear and nonlinear results, where the fp indicates the incident wave frequency. As can be seen from Figure 13b,c), the first peak, where f/fp is close to 1, is well captured, which is within the incident wave energy range. The second peak is also noted, which might be induced via the second-order sum-frequency wave loading. The peak values of f/fp = 1 and 2 increase as the wave steepness increases. The PSDs results for regular wave cases are presented in Figure 13e,f). The peak value of f/fp = 1 and 2, which correspond to the linear and second-order forces, increase with wave steepness. The second-order forces appear due to the second-order terms in the second-order Stokes wave equations. This may also be induced via the wave diffraction around the fixed offshore structures.
To quantify the linearity and nonlinearity of the above forces in regular waves, the peak value for 1st and 2nd order forces (P1 & P2) are summarized in Table 7. As shown in Table 7, the ratio of P2 over P1 increases rapidly as the wave steepness increases, revealing the nonlinearity is getting stronger as the wave steepness increases. As it is hard to identify the frequency range of linear and nonlinear, thus, the afore-mentioned PSD integral method for regular wave analysis is not applicable to focused wave results.

5.1.2. Wave Run-Up

In this section, wave run-up is analysed to assist a better understanding of the flow field around the platform, and thus provide more insights for the wave steepness impact on the hydrodynamics of structures. To this end, three wave gauges are selected, as shown in Figure 14, e.g., WG1, 2 and 3. WG1 and WG2 are at the location of the upstream column, and WG3 is set near the starboard column.
Figure 15a–d presents the wave elevation in time series at WG1-3 for focused wave condition together with the amplitude of wave elevation. The wave overtopping, indicated by the maximum wave elevation over 10 m (free board is 10.0 m high), can be observed at WG3 when the wave steepness (H/λ) is larger than 0.062 (see Figure 15c). Such wave overtopping has an obvious impact on the platform dynamic responses via imposing unsteady loadings. It should also be mentioned that the amplitude of wave elevation for WG3 (Figure 15d) reveals a sudden jump.
As soon as the wave overtopping occurs, such green water loading may result in the potential damage of offshore structures as also found in [40].
Figure 15e–g shows the wave elevation variations at WG1-3 under regular wave conditions within one wave period, the amplitude of wave elevation (maximum minus minimum) is displayed in Figure 15h. In general, for all regular waves, the wave elevation at WG1 and WG3 is relatively larger than the wave elevation at WG2, as the wave diffraction near the WG1 and WG3 is stronger than WG2. It is also noted that the maximum wave run-up is less than 10.0 m for WG1 to 3 (see Figure 1a for SWL), indicating that no overtopping occurs associated with regular waves.
To better visualize wave-structure interaction, Figure 16 and Figure 17 present our CFD predicted wave elevation contours under focused (Hs = 14.7 m, Tp = 15.0 s) and regular wave (H = 14.7 m, T = 15.0 s) conditions, respectively. The contour plots clearly reflect the nature of wave elevation variations indicated by Figure 16. For example, at three specific instantaneous times of t/T = 0.4, 0.6 and 0.8, shown in Figure 17, it is expected to see the maximum negative elevation, the near zero elevation for WG1 and 2 and the maximum positive elevation. A comparison between the two figures demonstrates that the wave overtopping phenomenon is well captured when it is associated with focused wave cases; whereas they do not appear under regular wave conditions. In addition, the green water above the platform can easily be recognized in Figure 16. In this respect, we can conclude that a focused wave can better reflect the nonlinearity of extreme sea states than regular waves.

5.2. Floating DeepCwind Semi-Submersible Platform

This section describes the CFD results for a floating semi-submersible platform to focused waves and regular waves. The platform is modelled by adding the masses/inertia of the tower and turbine by using parallel axis theorem while there is no aerodynamic effect applied. The platform geometry is the same as the fixed one presented in Section 5.1; other relevant properties are summarized in Table 1. The discussions on the results will be focused on the platform motion response, the inline forces exerted on the platform, and the tension loads associated with three mooring lines (see Figure 4).

5.2.1. Dynamic Motions

Figure 18a–c illustrates the time series of the surge, heave and pitch motion with different wave steepness under focused wave conditions. It can be seen that an increase of wave steepness leads to the increase in the motion responses in all three DoF. An interesting phenomenon is that the pitch bounce near t = 53 s to t = 57 s becomes inapparent as the wave steepness increases, which may be induced by the occurrence of overtopping.
The wave elevation CFD contour plots are shown in Figure 20. The nonlinear wave-structure interactions phenomena can be revealed via the wave overtopping, wave radiation and wave diffraction. As can clearly be seen from Figure 20, they are very well predicted using our CFD simulation. Based on a comparison between Figure 20 and Figure 16, where the contours for a fixed platform are presented, we can see that the duration of wave overtopping is much longer for a floating platform than a fixed one. This is mainly due to the fact that a floating platform drifts downstream along positive surge direction when the incident wave is coming, leading to a longer time period for wave-structure interaction. Figure 18d–f displays the time history for motion response of the platform under two regular wave conditions, i.e., (Case6 and Case10 in Table 6). A non-dimensional time period is used, which is the same for 3 motions. For the translational motions, i.e., surge and heave, the response is similar to the results under the focused wave condition in Figure 18a–c. However, the pitch response is significantly smaller than the one subject to a focused wave. Our previous study also shows a similar trend [41].
A study is also conducted of the dynamic response under focused waves via different modelling approaches; the present CFD results are compared with the potential flow-based results provided by EDF and using NREL FAST tool. Since the changes among three sets of results are similar for all focused waves cases, a detailed discussion will be centred on Cases 1 and 5.
Figure 21a–d presents the platform motion responses in pitch and surge directions. As can be seen, the platform responses are comparable among three results before the focused time (i.e., t < 50 s). However, the discrepancy becomes obvious after the focused time. In addition, the disagreement grows as the wave steepness increases, i.e., from Case 1 to Case 5. The reason behind is the different treatments for the viscous effect for two potential flow tools (i.e., FAST v8 and EDF) and our CFD modelling. As expected, as the nonlinearity increases, which usually caused by the viscous effects or the high order wave loadings, the differences become more significant.

5.2.2. Inline Forces

The dimensionless inline force F’ on the platform under different focused wave and regular waves are plotted together with the power spectral analysis results and the dimensional force Fx used for PSD analysis in Figure 22. The appearance of F’ for floating platforms is quite similar to the fixed ones, see Figure 12a,b for comparison. However, the maximum F’ is relatively smaller due to the appearance of wave radiation associated with a floating platform and the structure motions with the incident waves. The results obtained from frequency domain analysis also indicate the existence of higher-order wave loading, and they increase significantly as the wave steepness increases.

5.2.3. Tension Loads

To further assess the behaviour of floating platforms with different wave steepness, the tension loads in mooring lines under focused waves are presented in Figure 23a,b. In general, the tension loads in both lines increase as the wave steepness increases. However, some disparities between the two mooring lines can be observed. Firstly, the maximum positive load in Line 2 is larger than Line 1, whereas it has a smaller minimum positive tension as compared to Line 1 due to the existence of drift force. In addition, the occurrence of the peak load in Line 1 (around t = 45 s) takes place earlier than in Line 2 (around t = 50 s). This is because the longest extension of Line 1 occurs at t = 45 s, when the minimum platform surge motion takes place; whereas the longest extension of Line 2 occurs at t = 50 s, when the maximum surge motion takes place. Apart from that, it is also noted that the tension loads under the largest wave steepness experience more fluctuations than the lowest one, which can be induced by the large forces from wave radiation, diffraction and viscous force.
Figure 23c,d presents the mooring tension loads under two regular waves. In general, the tension loads are strongly determined by the translational motion of the floating platform. The observations from Figure 18 indicate that the response of translational motions are similar between regular waves and focused waves; thus, in terms of magnitudes of load, there are no obvious disparities between a regular and a focused wave. However, we can observe the different mean loads under two types of waves, which are mainly caused by different magnitude of drift forces.

5.3. Parked Floating Offshore Wind Turbine Subject to Focused Waves and Steady Wind

Along with the above two sections on the study of a bottom-fixed and floating semi-submersible platform (i.e., DeepWind semi-sub), in this section, the investigation will be extended to an analysis on a floating NREL 5 MW semi-submersible wind turbine. The gross properties are listed in Table 1. To better illustrate the focused wave impact, only the steepest focused wave condition is examined in this section (Case 5). To model the wind field, the wind speed is fixed as the operating cut-off value of 25 m/s [6]. Under such extreme wave and wind condition, the wind turbine is expected to be parked. Therefore, no rotational motion of the rotor is modelled in the present simulation, the blade pitch angle is set as 0°. The main objective of this study is to examine the floating platform dynamic response, the mooring system tension loads and wind turbine tower-base fore-aft bending moment under severe weather conditions. A separate paper will be presented on the turbine aerodynamic performance under a combined focused wave and wind condition.

5.3.1. Dynamic Motion

Figure 24a shows the time-sequence motion responses in heave, pitch and surge for a parked FOWT. As can be seen clearly, the FOWT endures a tremendous motion response near focused time around t = 50 s. After the focused time, the motions present a free decay trend in both translational and rotational directions. Compared with the results without the tower, rotor and wind, as shown in Figure 19, the maximum surge enlarges almost by 5 m due to the wind speed along the positive surge direction. However, the pitch near the focused time is smaller due to the damper effect caused by the incident wind when the FOWT moves along the negative pitch direction. The heave motions are not significantly affected by the presence of wind and turbine.
The power spectral analysis of the surge and pitch responses is illustrated in Figure 24b, where several important peaks are well captured. Specifically, the first peak of surge provides a value of f = 0.14 fp or f = 0.0093 Hz, representing structure surge natural frequency. The second peak, which occurs between 0.5 fp–1.5 fp, accurately captures the response in wave energy range. Other peaks observed after 1.5 fp may be caused by the high-order wave loadings. Since the natural frequency of the structure in pitch is at f = 0.037 Hz, or f = 0.54 fp, the second peak response between 0.5 fp–1.0 fp represents the second-order difference-frequency wave loading, indicating the nonlinearity feature in pitch response.
The analysis of the inline force Fx on the floating platform with turbine and wind has also been carried out. The pattern of the inline forces is similar to those without wind and turbine shown in Figure 25.
Figure 26 demonstrates the velocity component Ux on the XoZ plane and free surface elevation contours around a parked FOWT under a focused wave. As can be clearly seen, a high-velocity regime is observed in the vicinity of both blade tips and roots, whereas a very low-velocity field is found immediately after the blades. In addition, the existence of the tower and blade causes a complicated flow field in the wake of the FOWT. The free surface elevation contours near the floating platform are similar to the plots without tower and blades as shown in Figure 20.

5.3.2. Tension Loads

The time sequence of tension loads together with the PSDs analysis of mooring lines is shown in Figure 27a,b. With the addition of the turbine and positive wind speed into the modelling, the tension loads in both Line 1 and Line 2 are larger than the loads without wind (see Figure 23). However, high-frequency loading does not change too much. The PSDs results for Line 1 and 2 are similar; thus, only the data for Line 2 is displayed in Figure 27b. As can be seen, the first corresponds to the natural surge frequency, while other higher peaks are within the wave energy range.

5.3.3. Tower-Base Bending Moment

It is well known that the structural damage of a wind turbine tower may occur under extreme weather conditions. In this section, the CFD results on the tower bending moments are analysed.
The time history of tower-base bending moment and PSDs are shown in Figure 28. The bending moment can be represented by the calculation of y component of the cross product of the distance vector and the turbine aerodynamic force vector. In the time domain, the tower bending moment reaches its lowest value near focused time, which is quite close to the appearance of surge motion. For the PSDs, the second-order difference-frequency, wave energy range, second-order sum-frequency and high-order results are clearly represented in the frequency domain PSDs. The present simulations also accurately predict the responses associated with the natural pitch frequency, i.e., f = 0.5 fp. In addition, as the entire FOWT system is regarded as rigid body, the peak of the tower eigenfrequencies can hardly be observed, i.e., f = 0.37 Hz = 5.5 fp.

6. Discussion and Conclusions

The ocean waves may induce complex and significant loads on floating offshore wind turbines; as such, it is essential to investigate the hydrodynamic and structural dynamic response of the FOWT under severe sea states. However, the complicated wave-/wind-structure interaction of FOWT subject to harsh weather conditions pose great challenges for computational modelling. Most numerical studies either idealize the wave as a regular wave or investigate simple geometry. The conclusions obtained are believed to be inaccurate when they are applied to FOWT operating conditions.
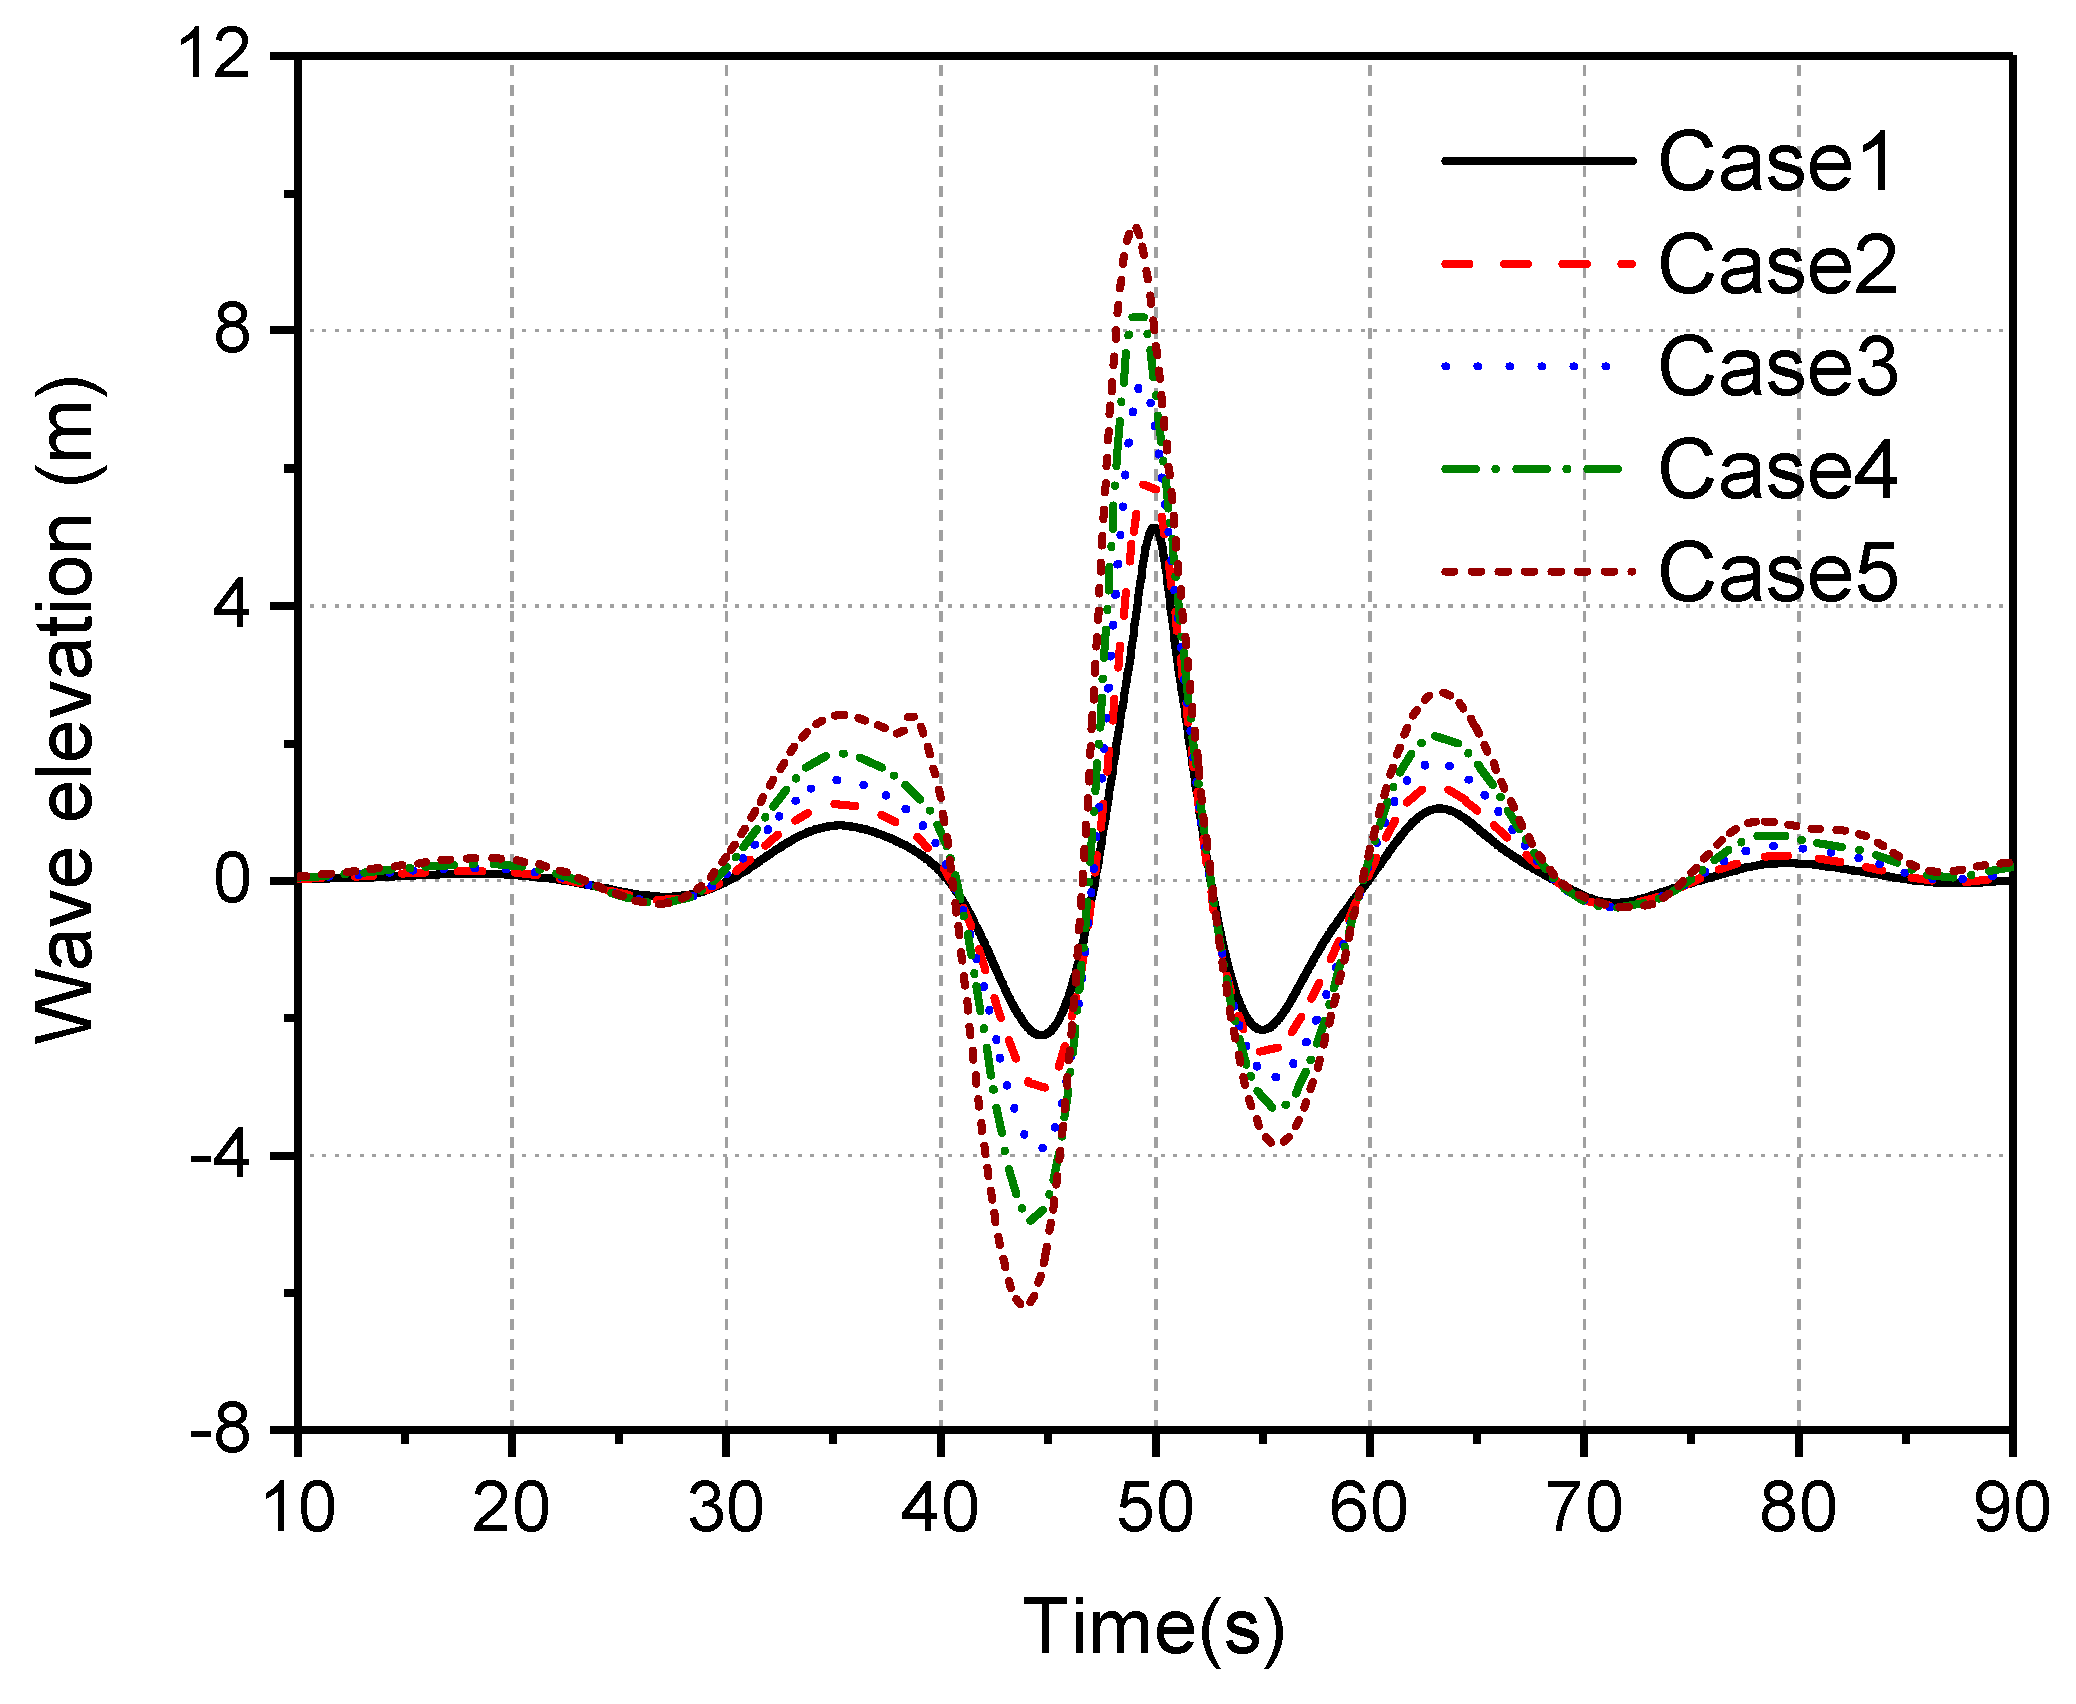
In this study, we have developed a high-fidelity computational fluid dynamics (CFD) modelling tool to study the NREL 5 MW floating offshore wind turbine under focused wave conditions. In this tool, the flow field is modelled by a further developed OpenFOAM-based code, where unsteady Navier-Stokes equation is solved based on a finite volume method. To elucidate the effects of various wave steepness on the hydrodynamic response of the system, we numerically examine a fixed semi-submersible platform, a floating platform with five consistently increased wave steepness for both regular and focused waves.
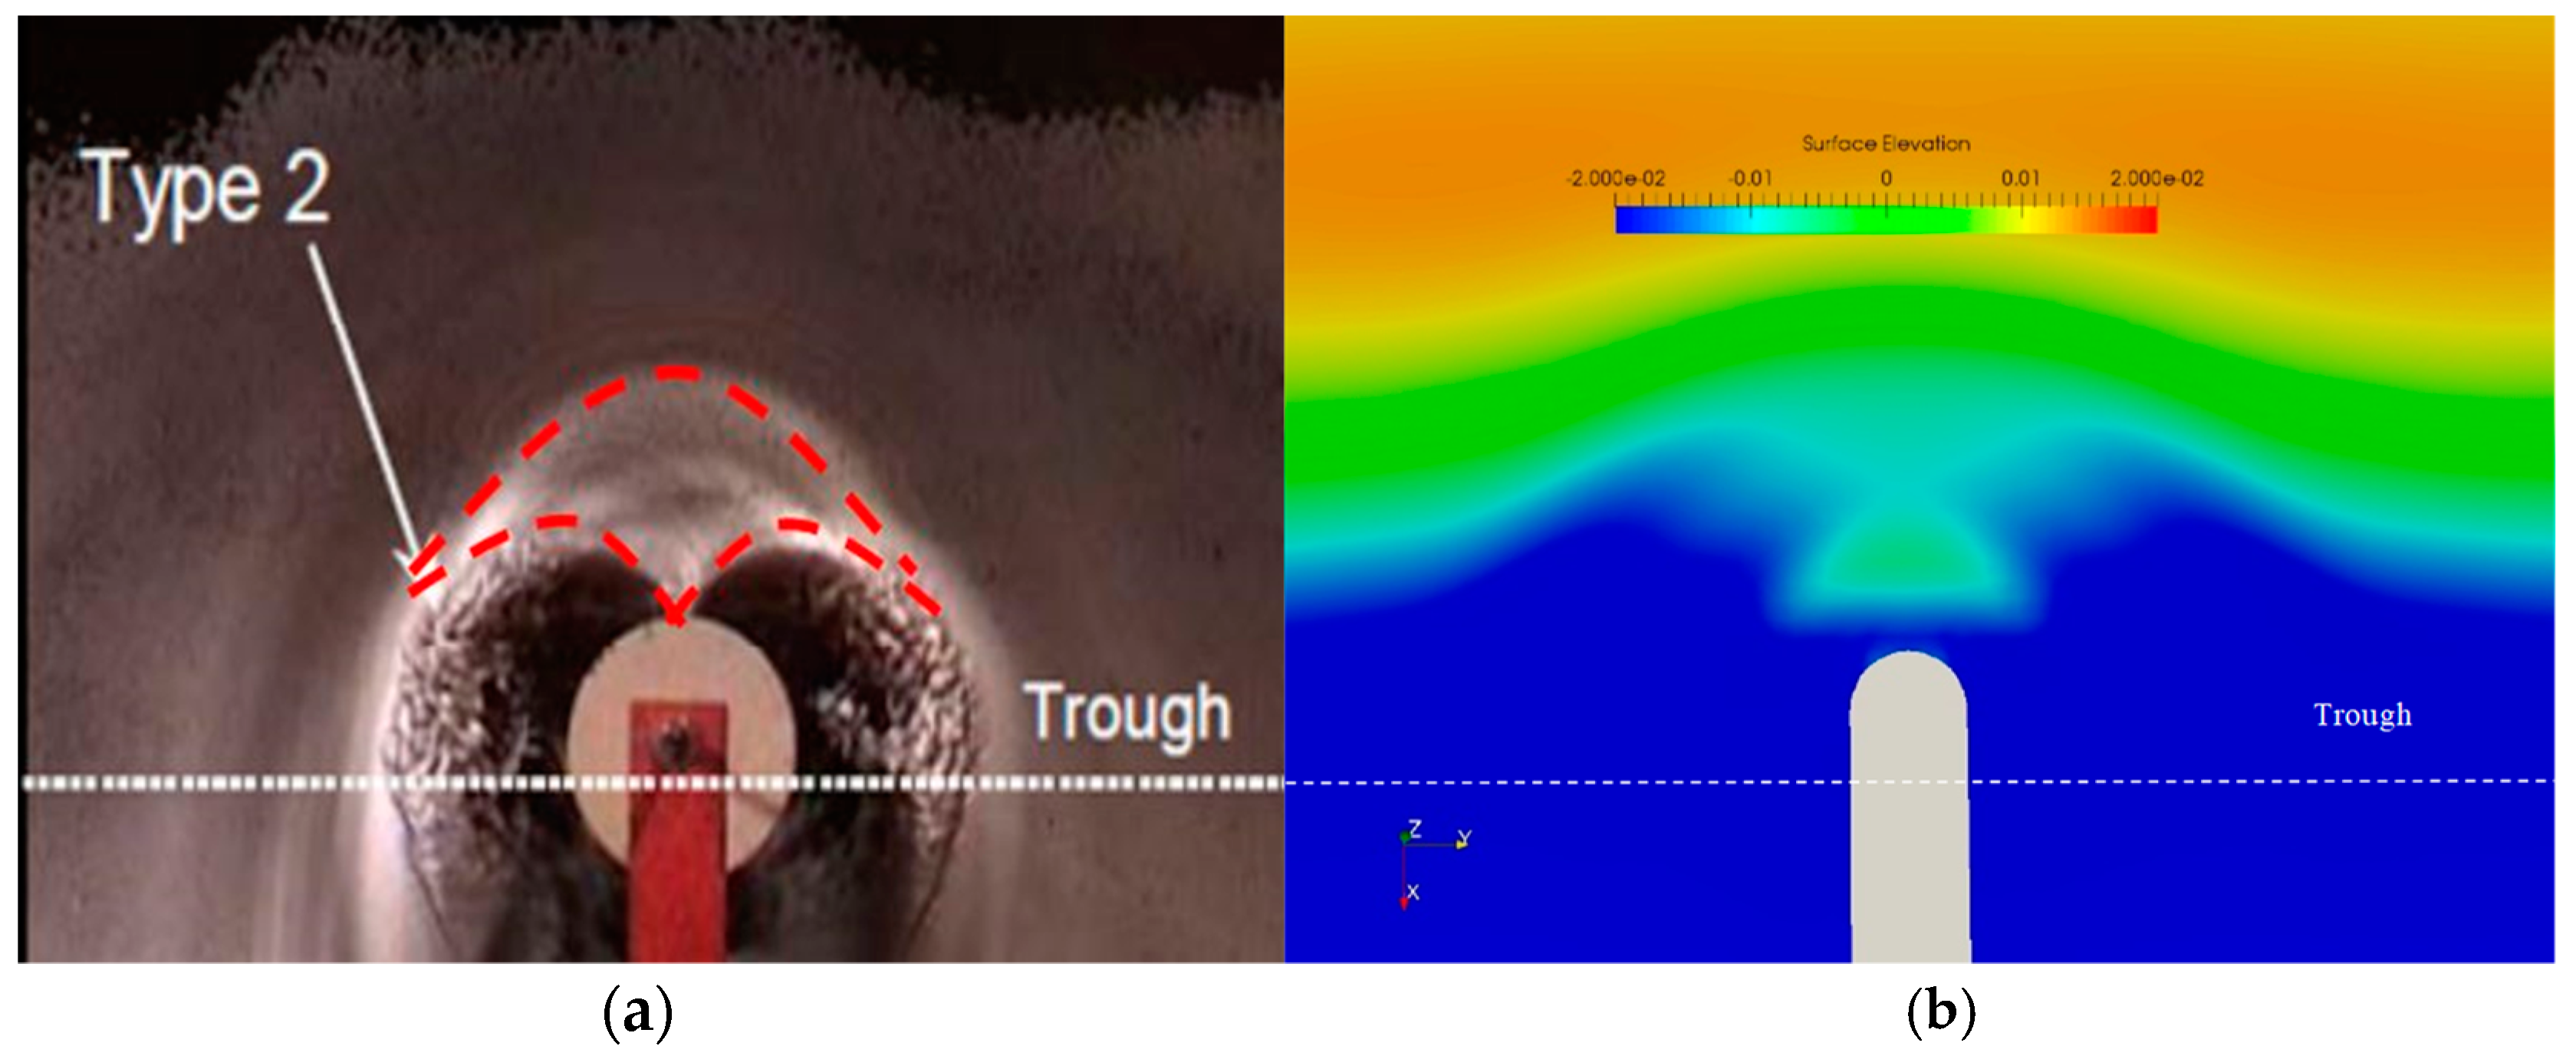
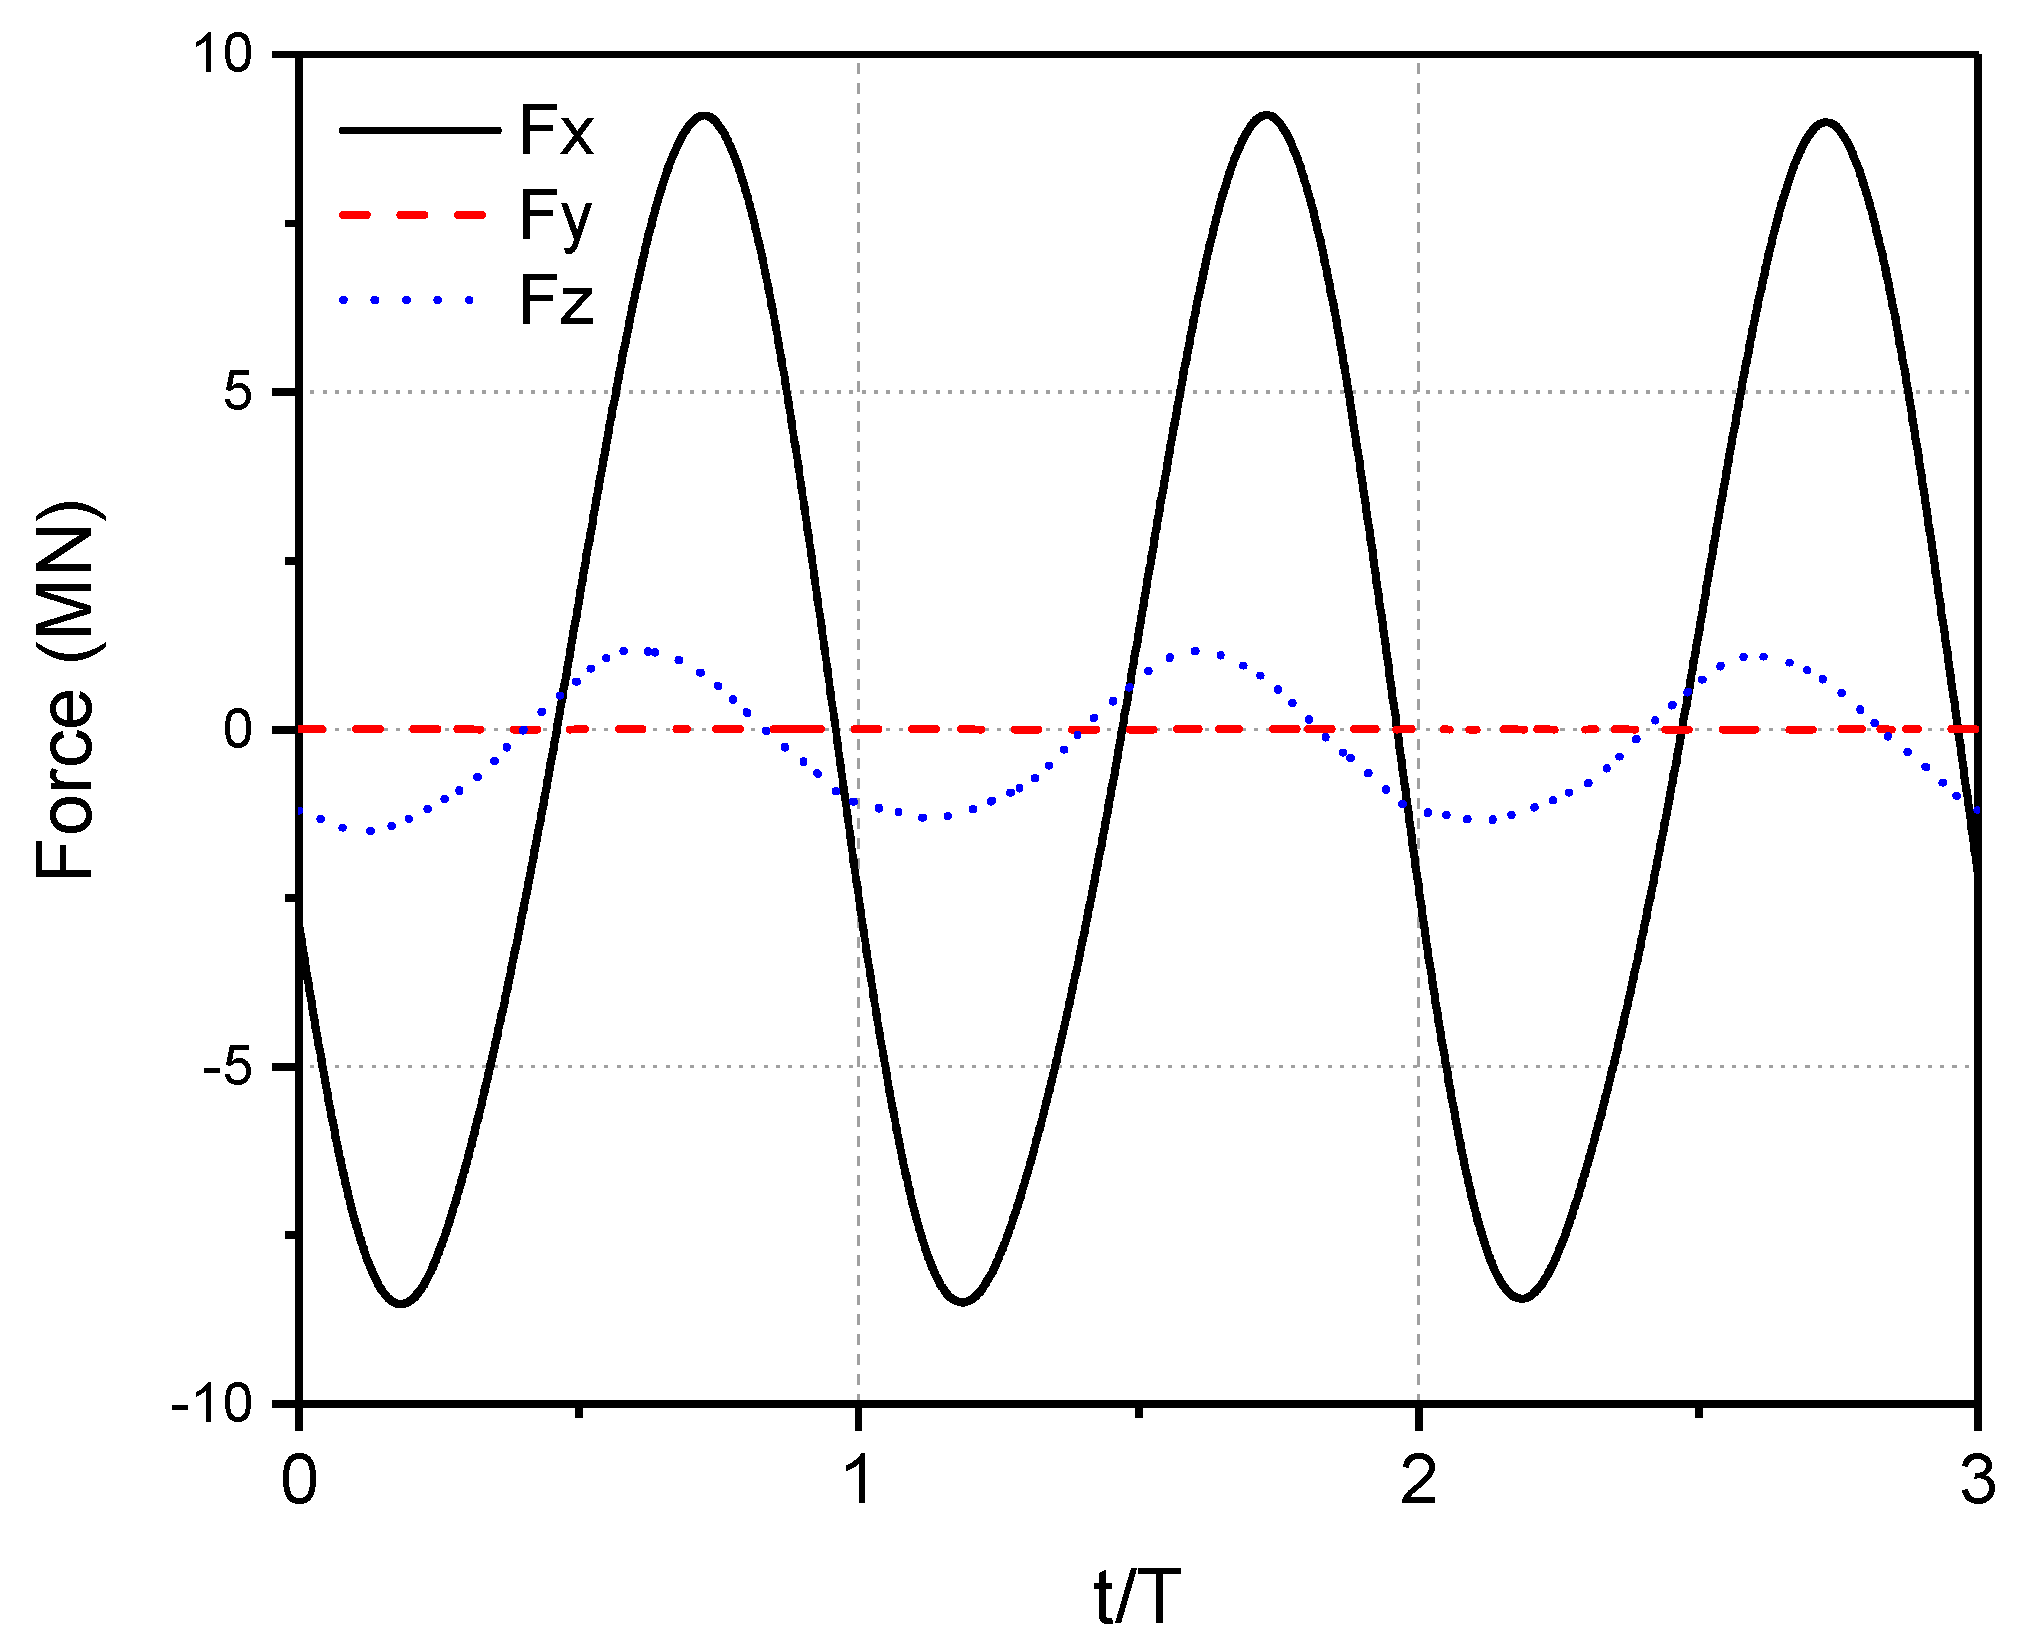
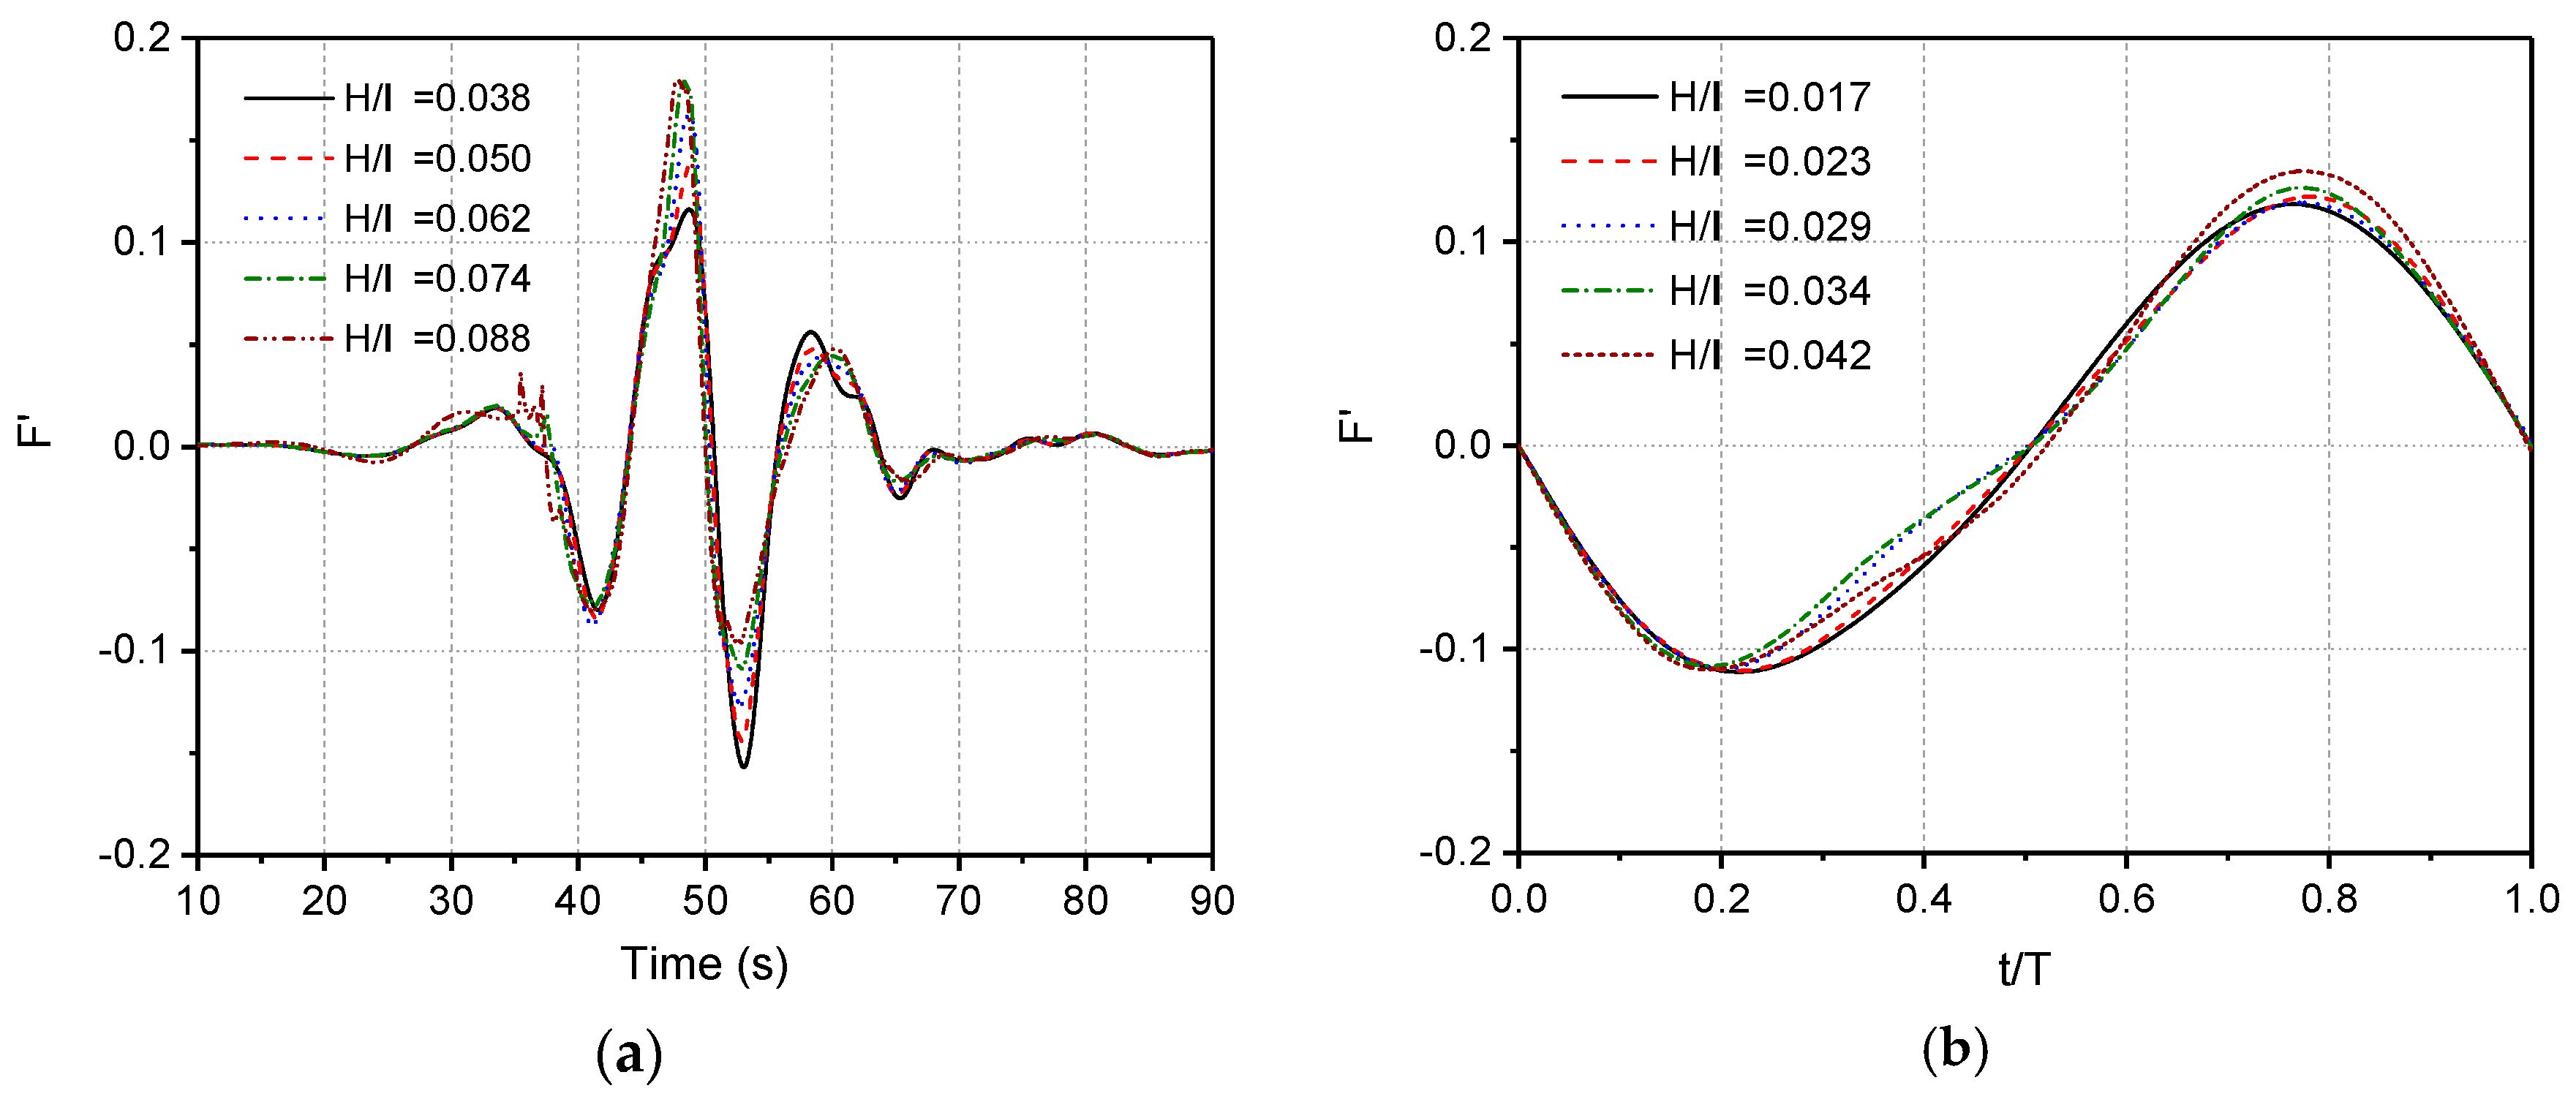
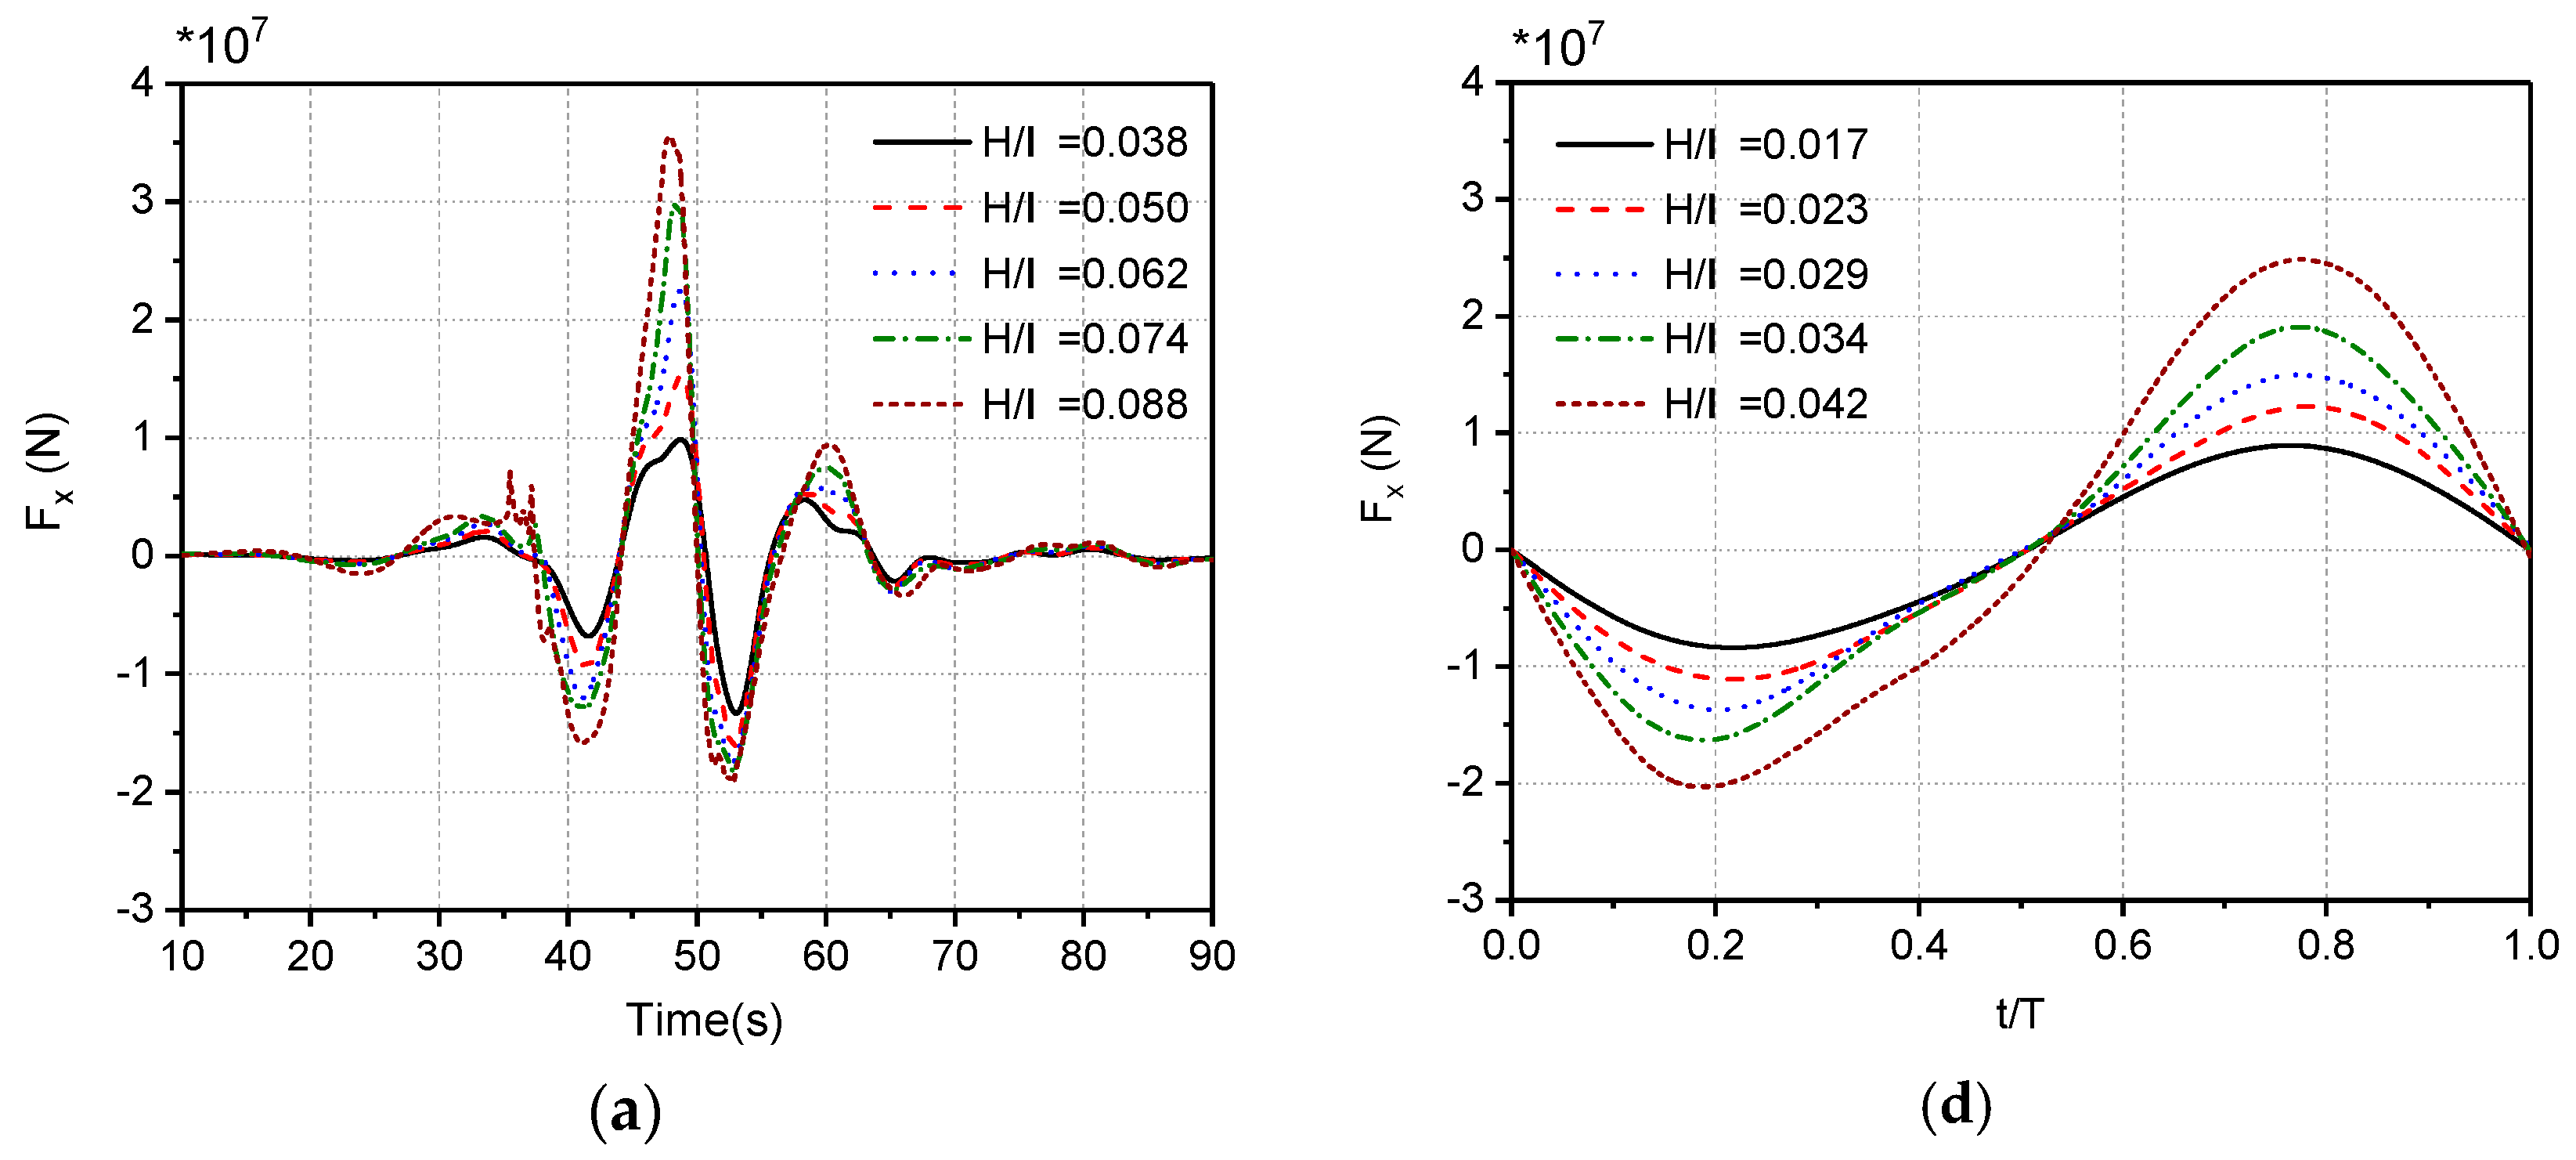
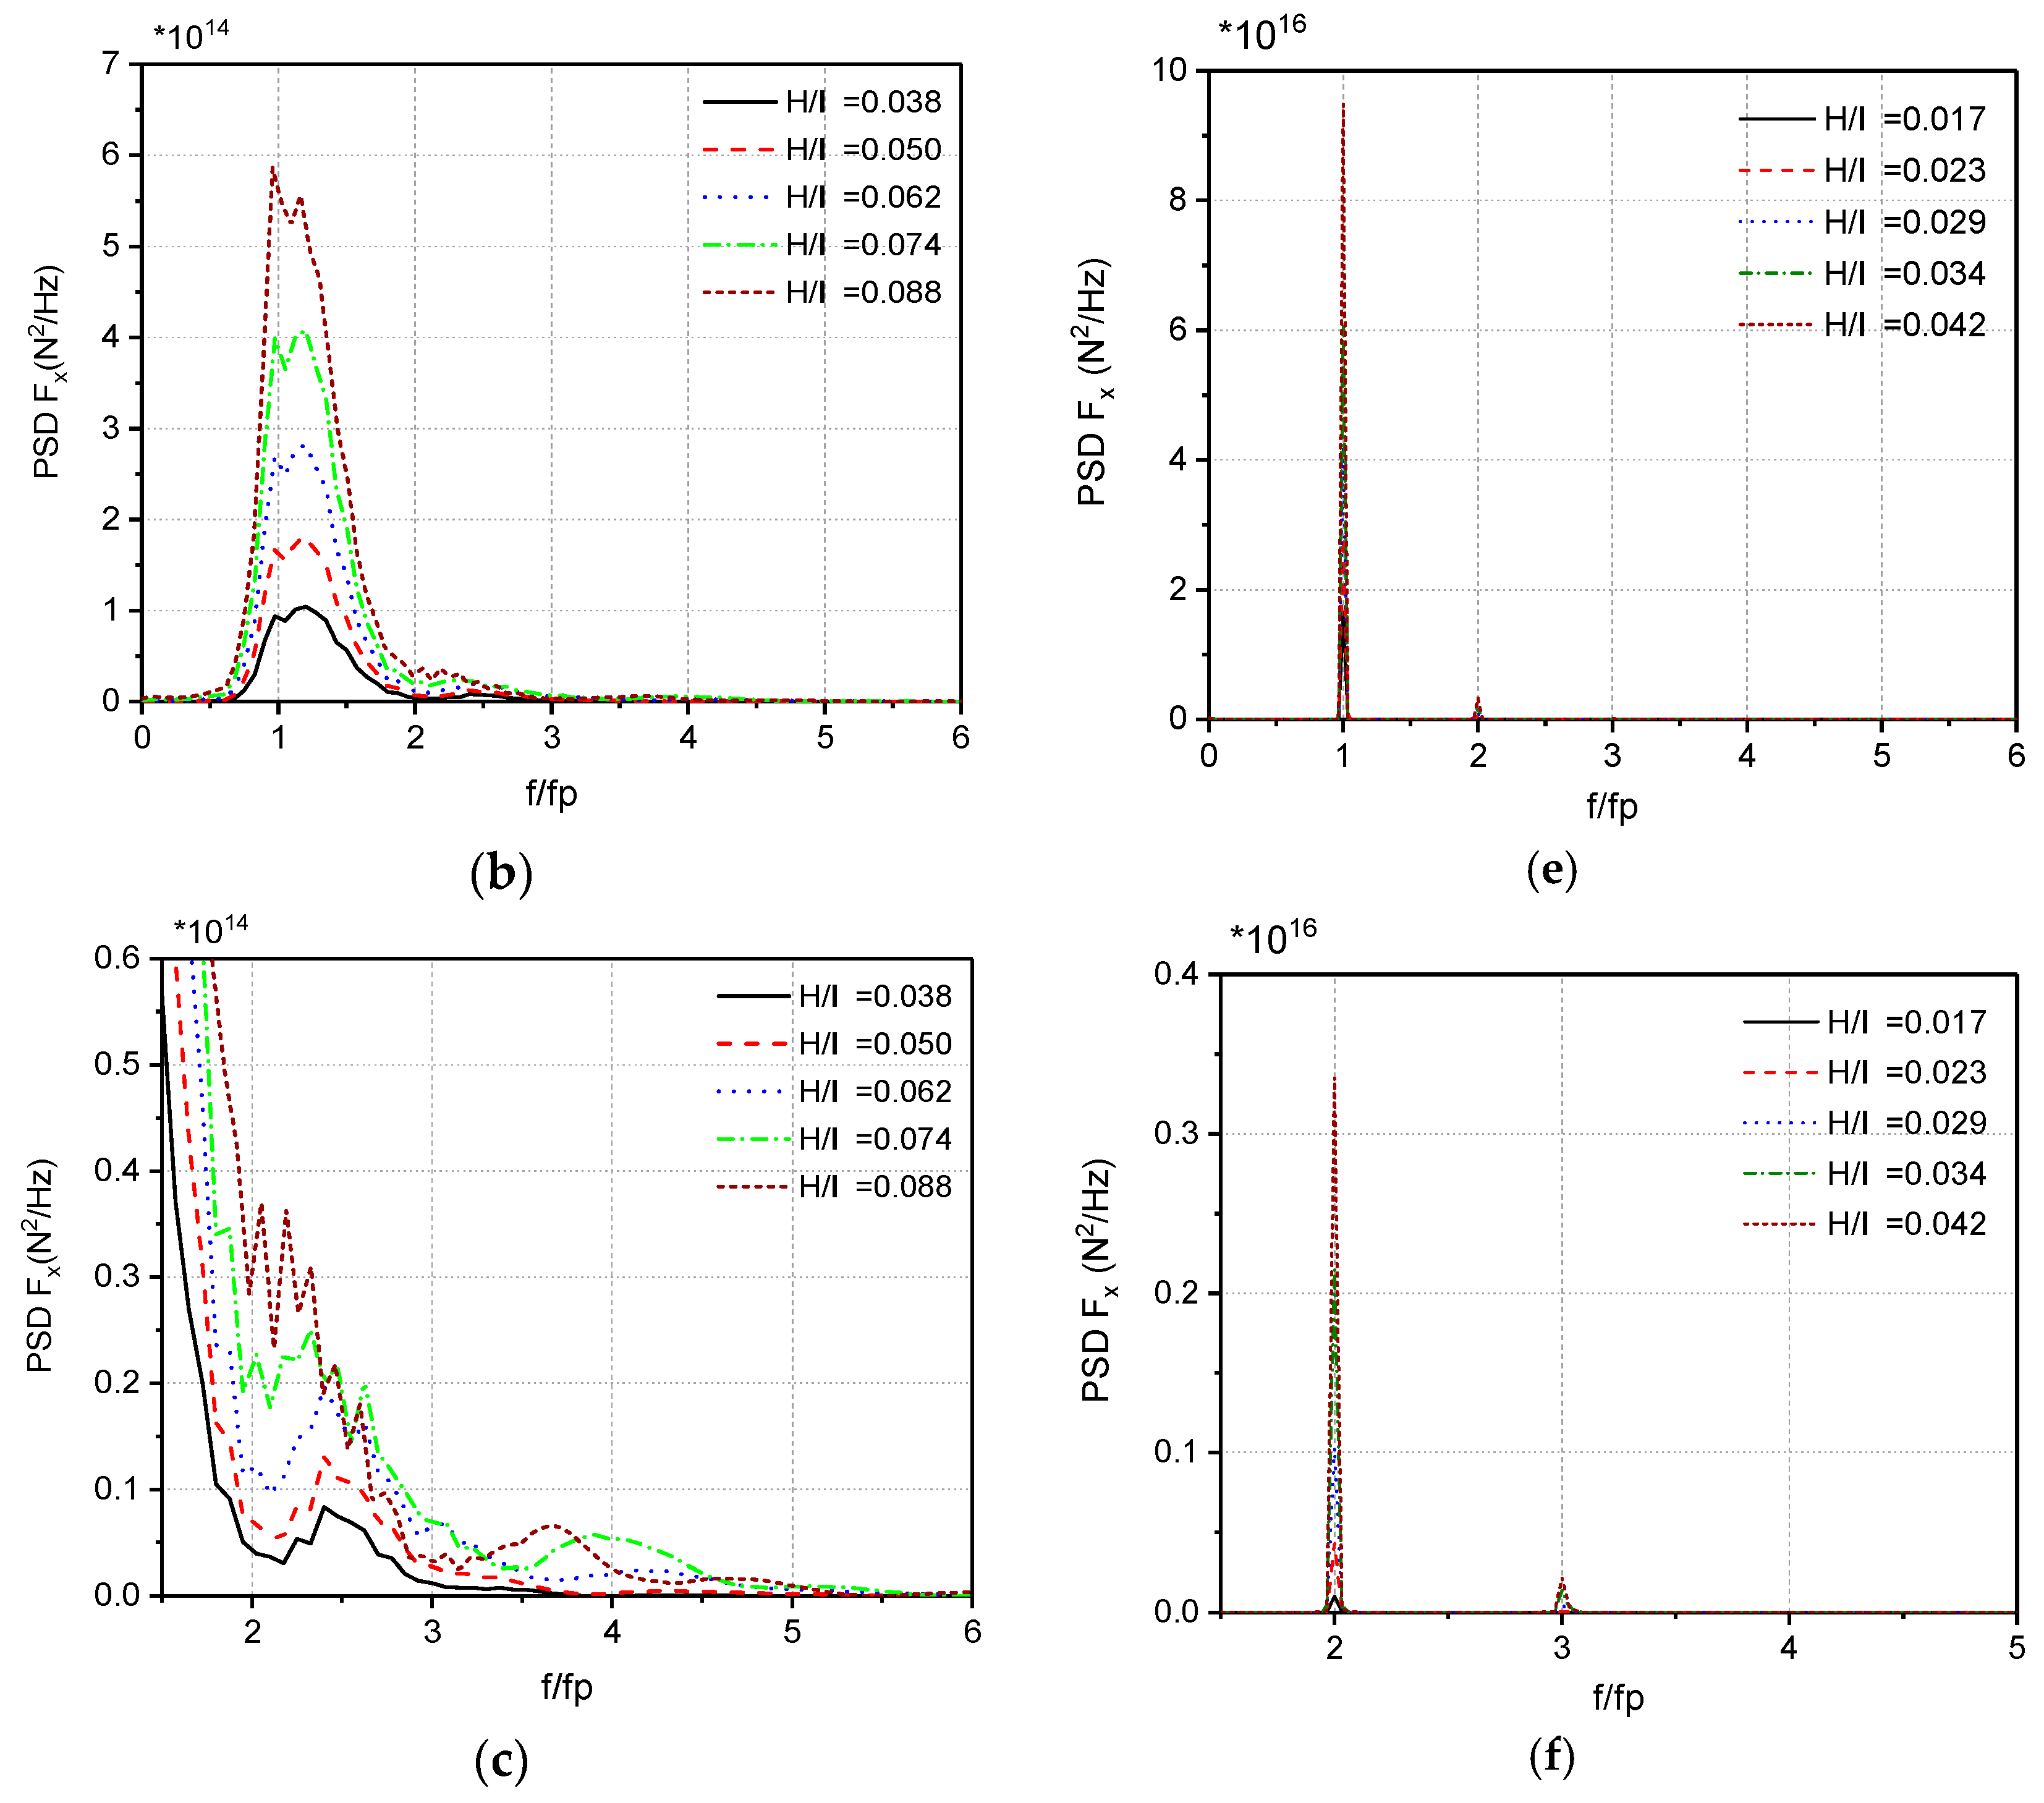
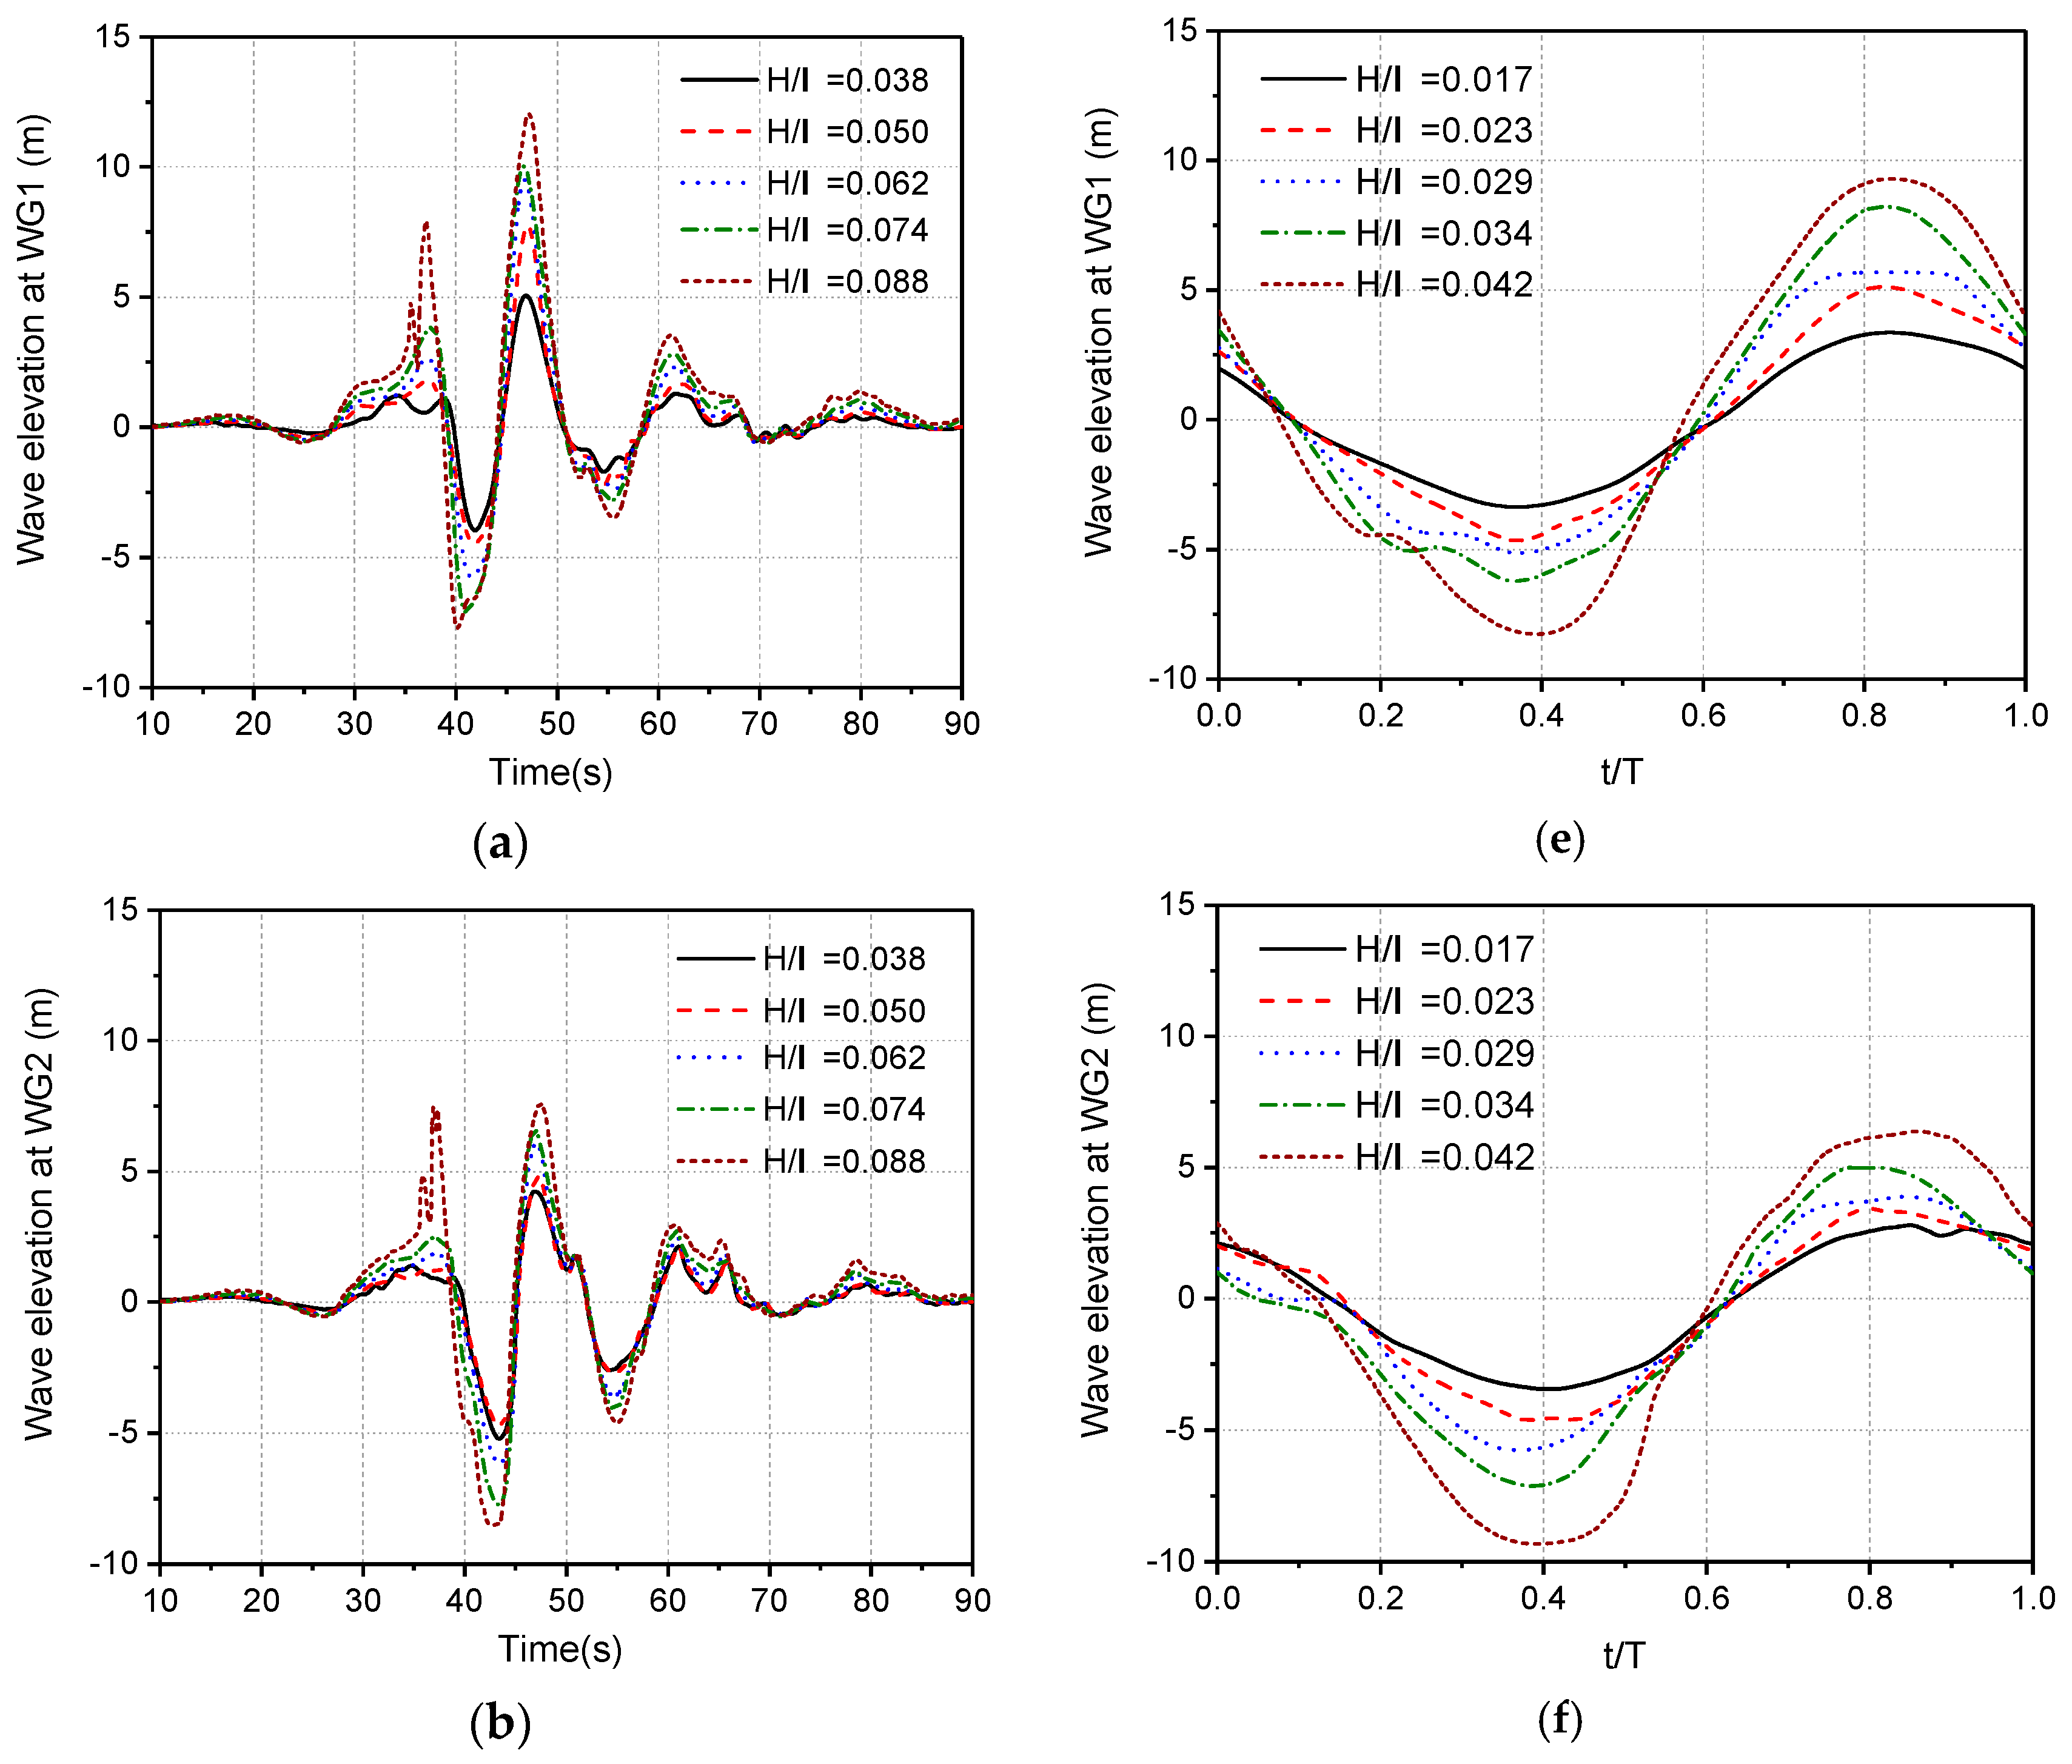
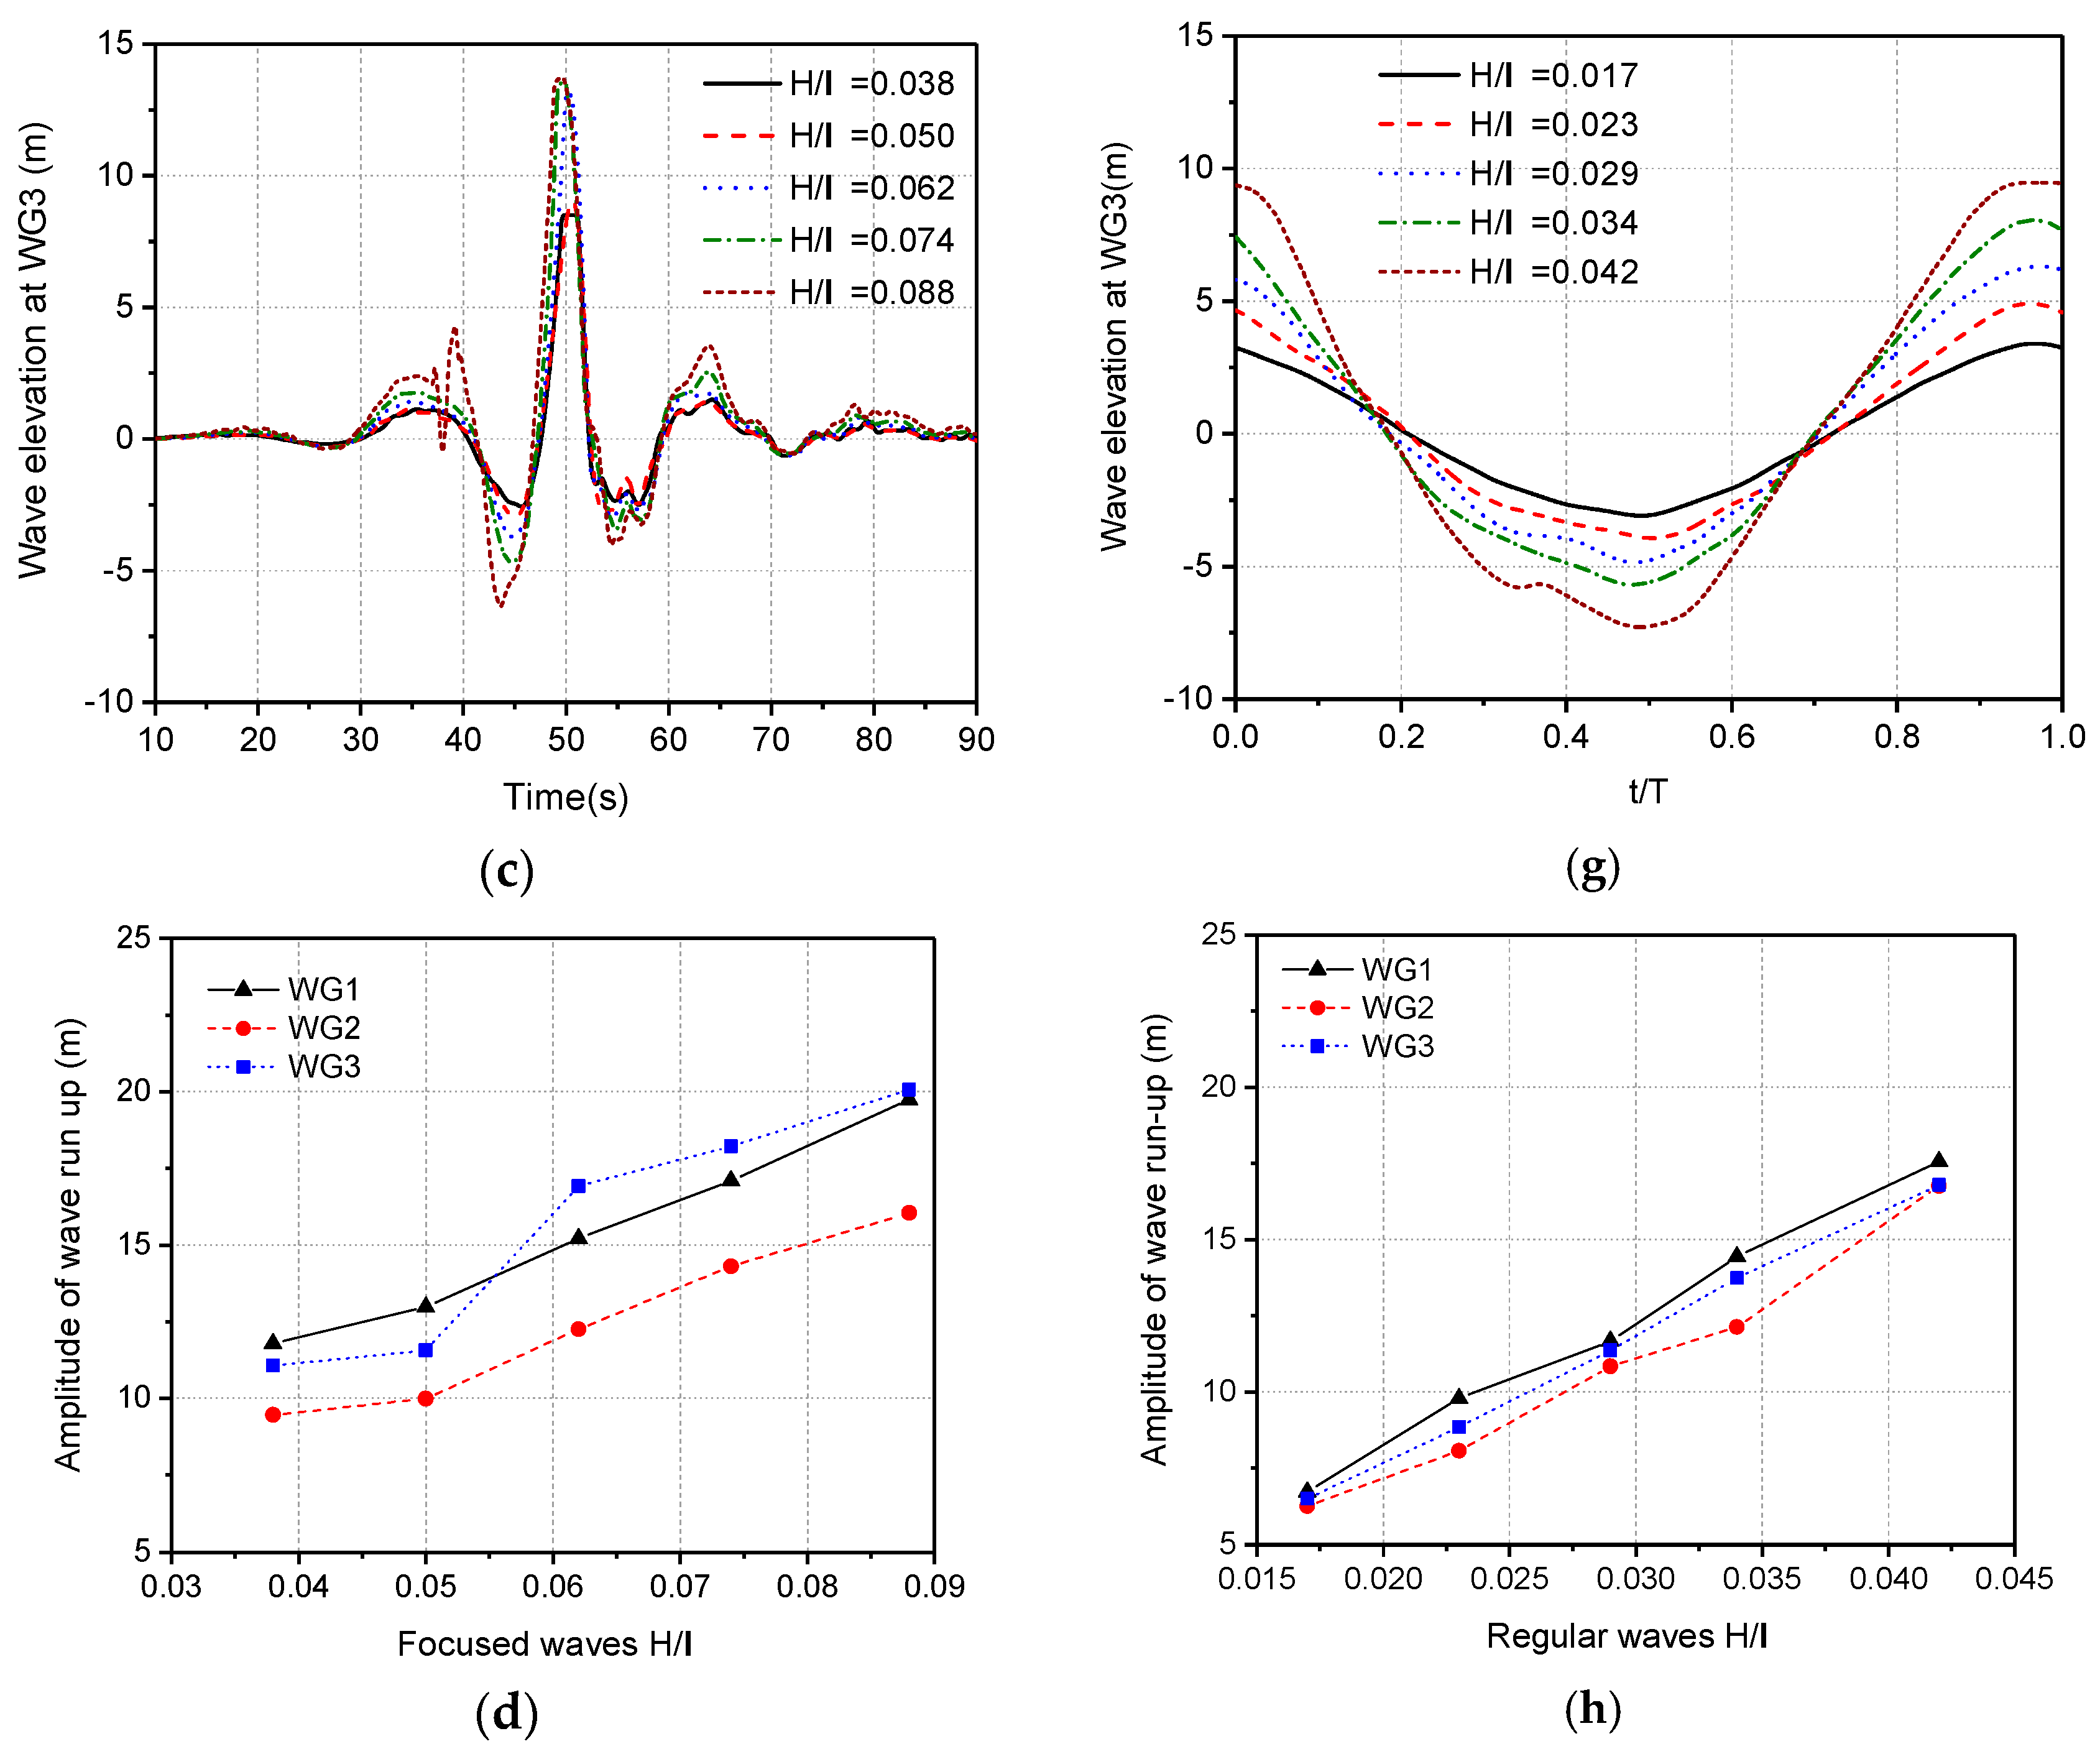
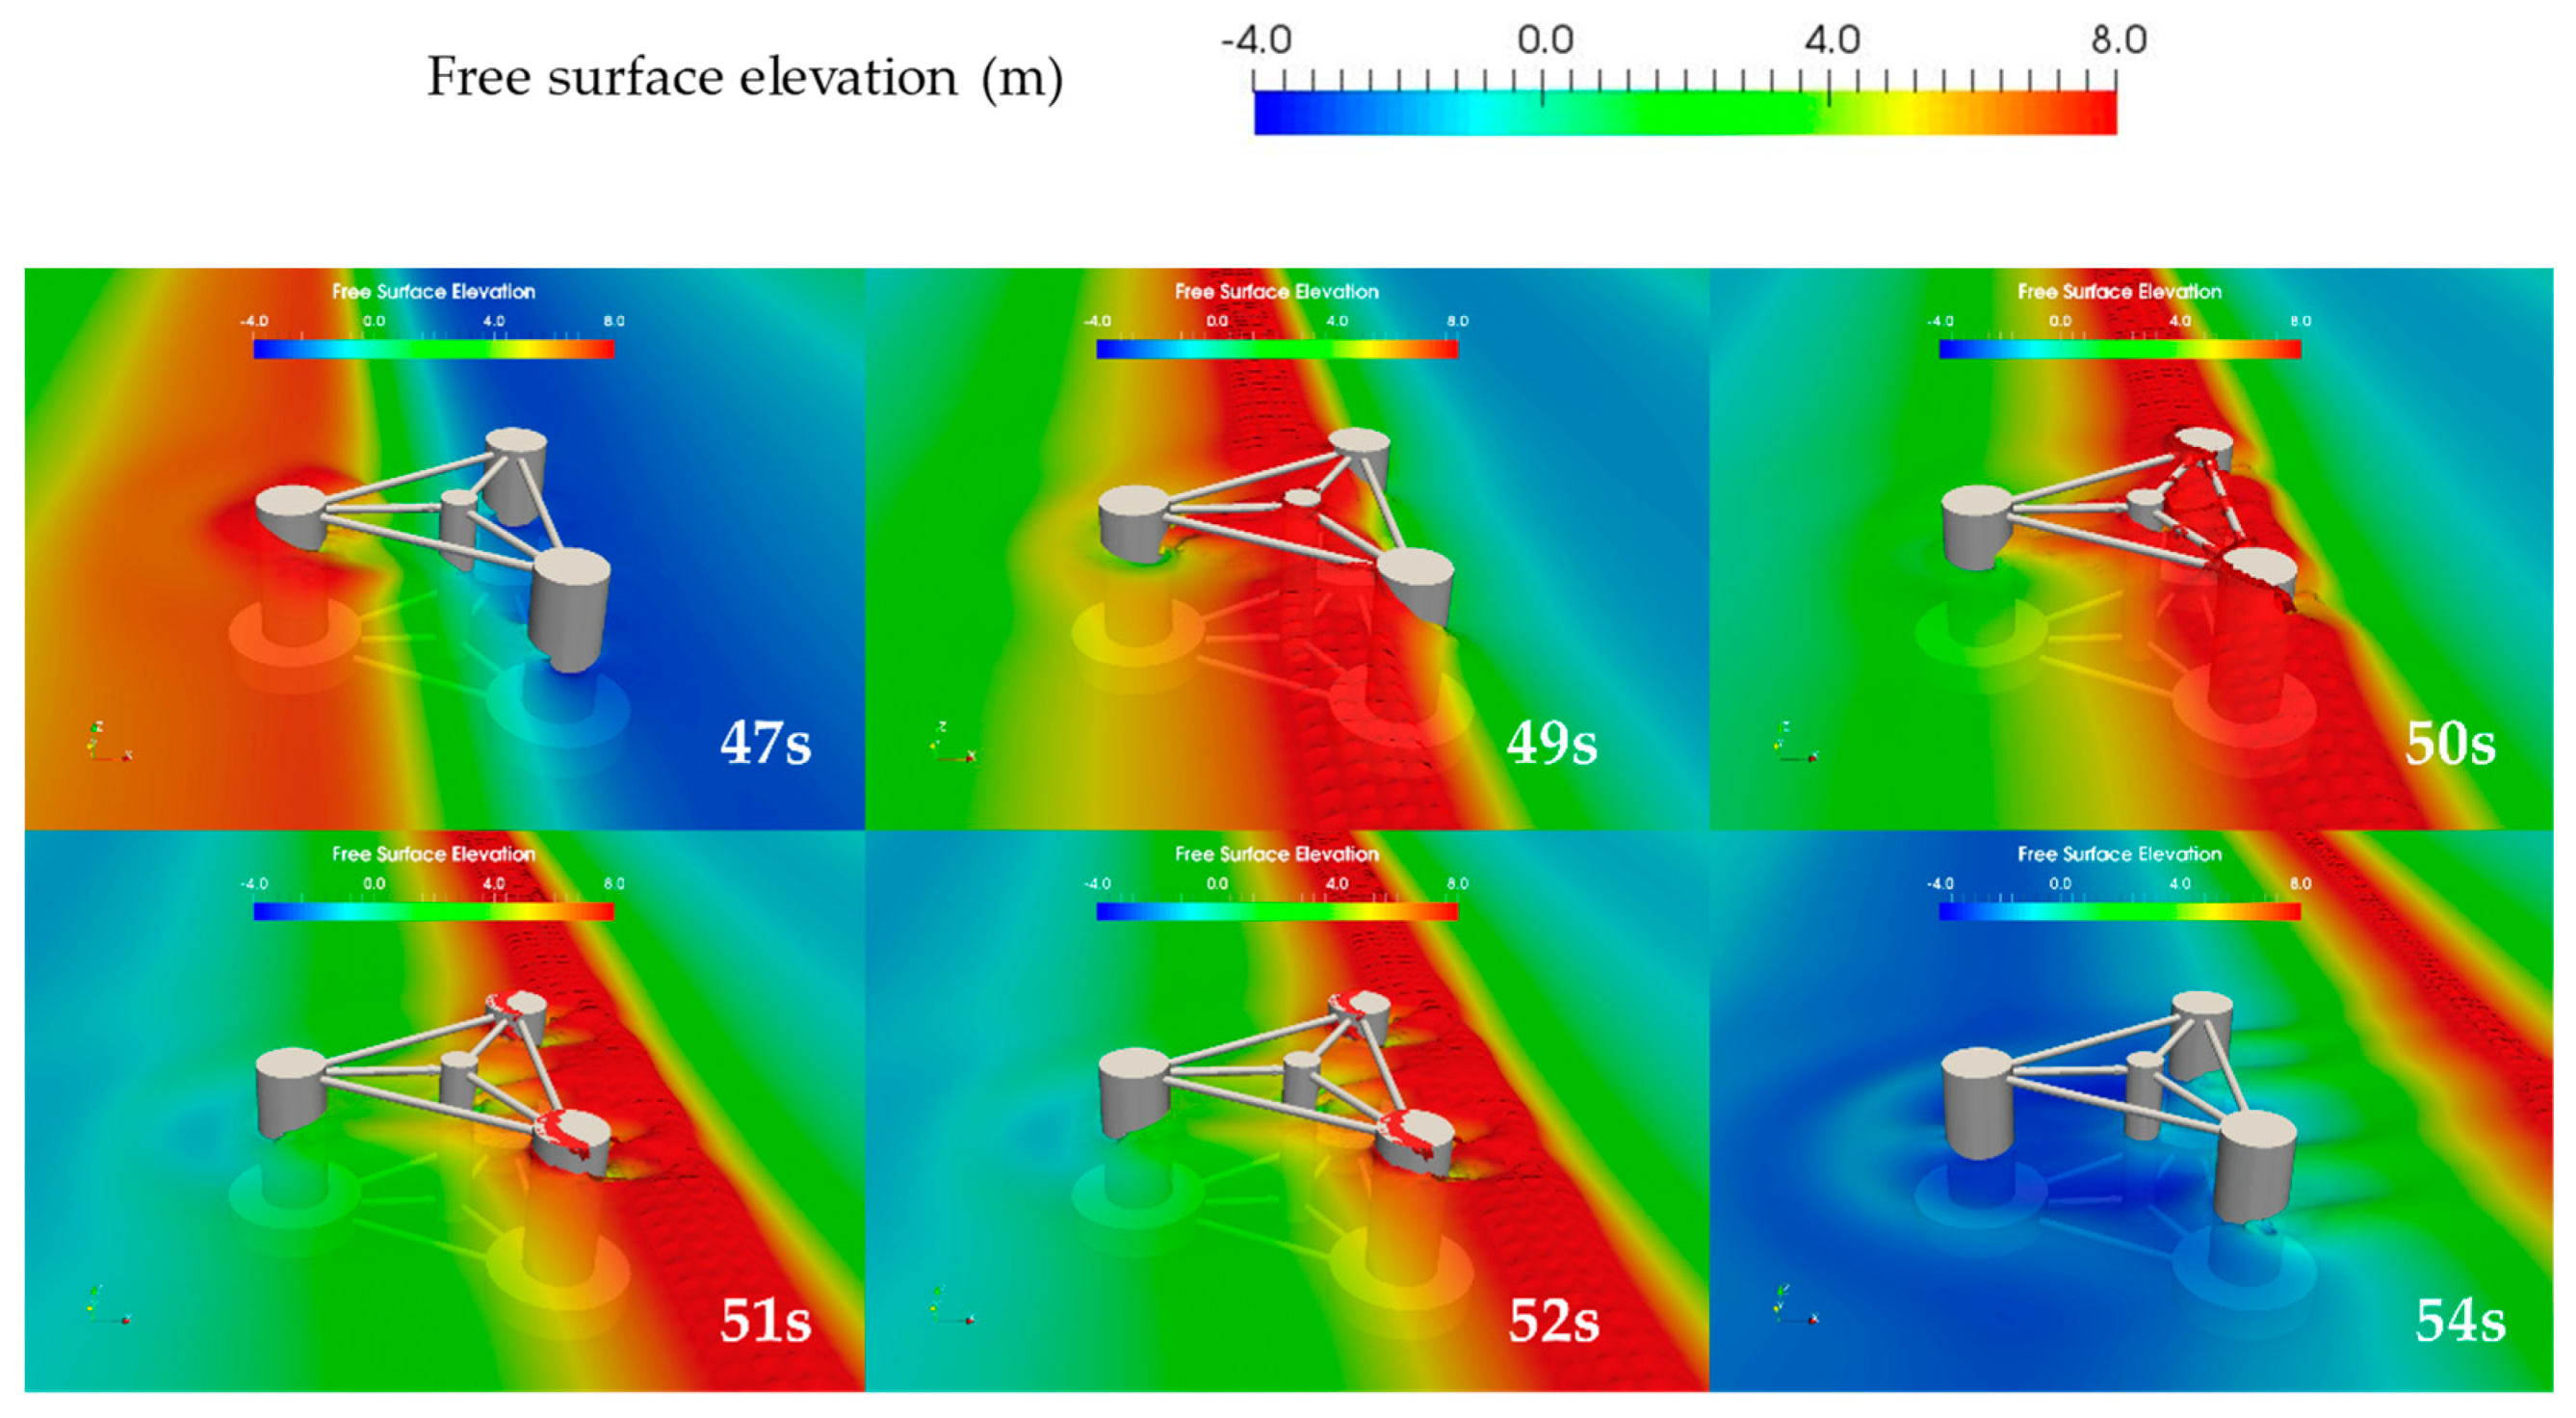
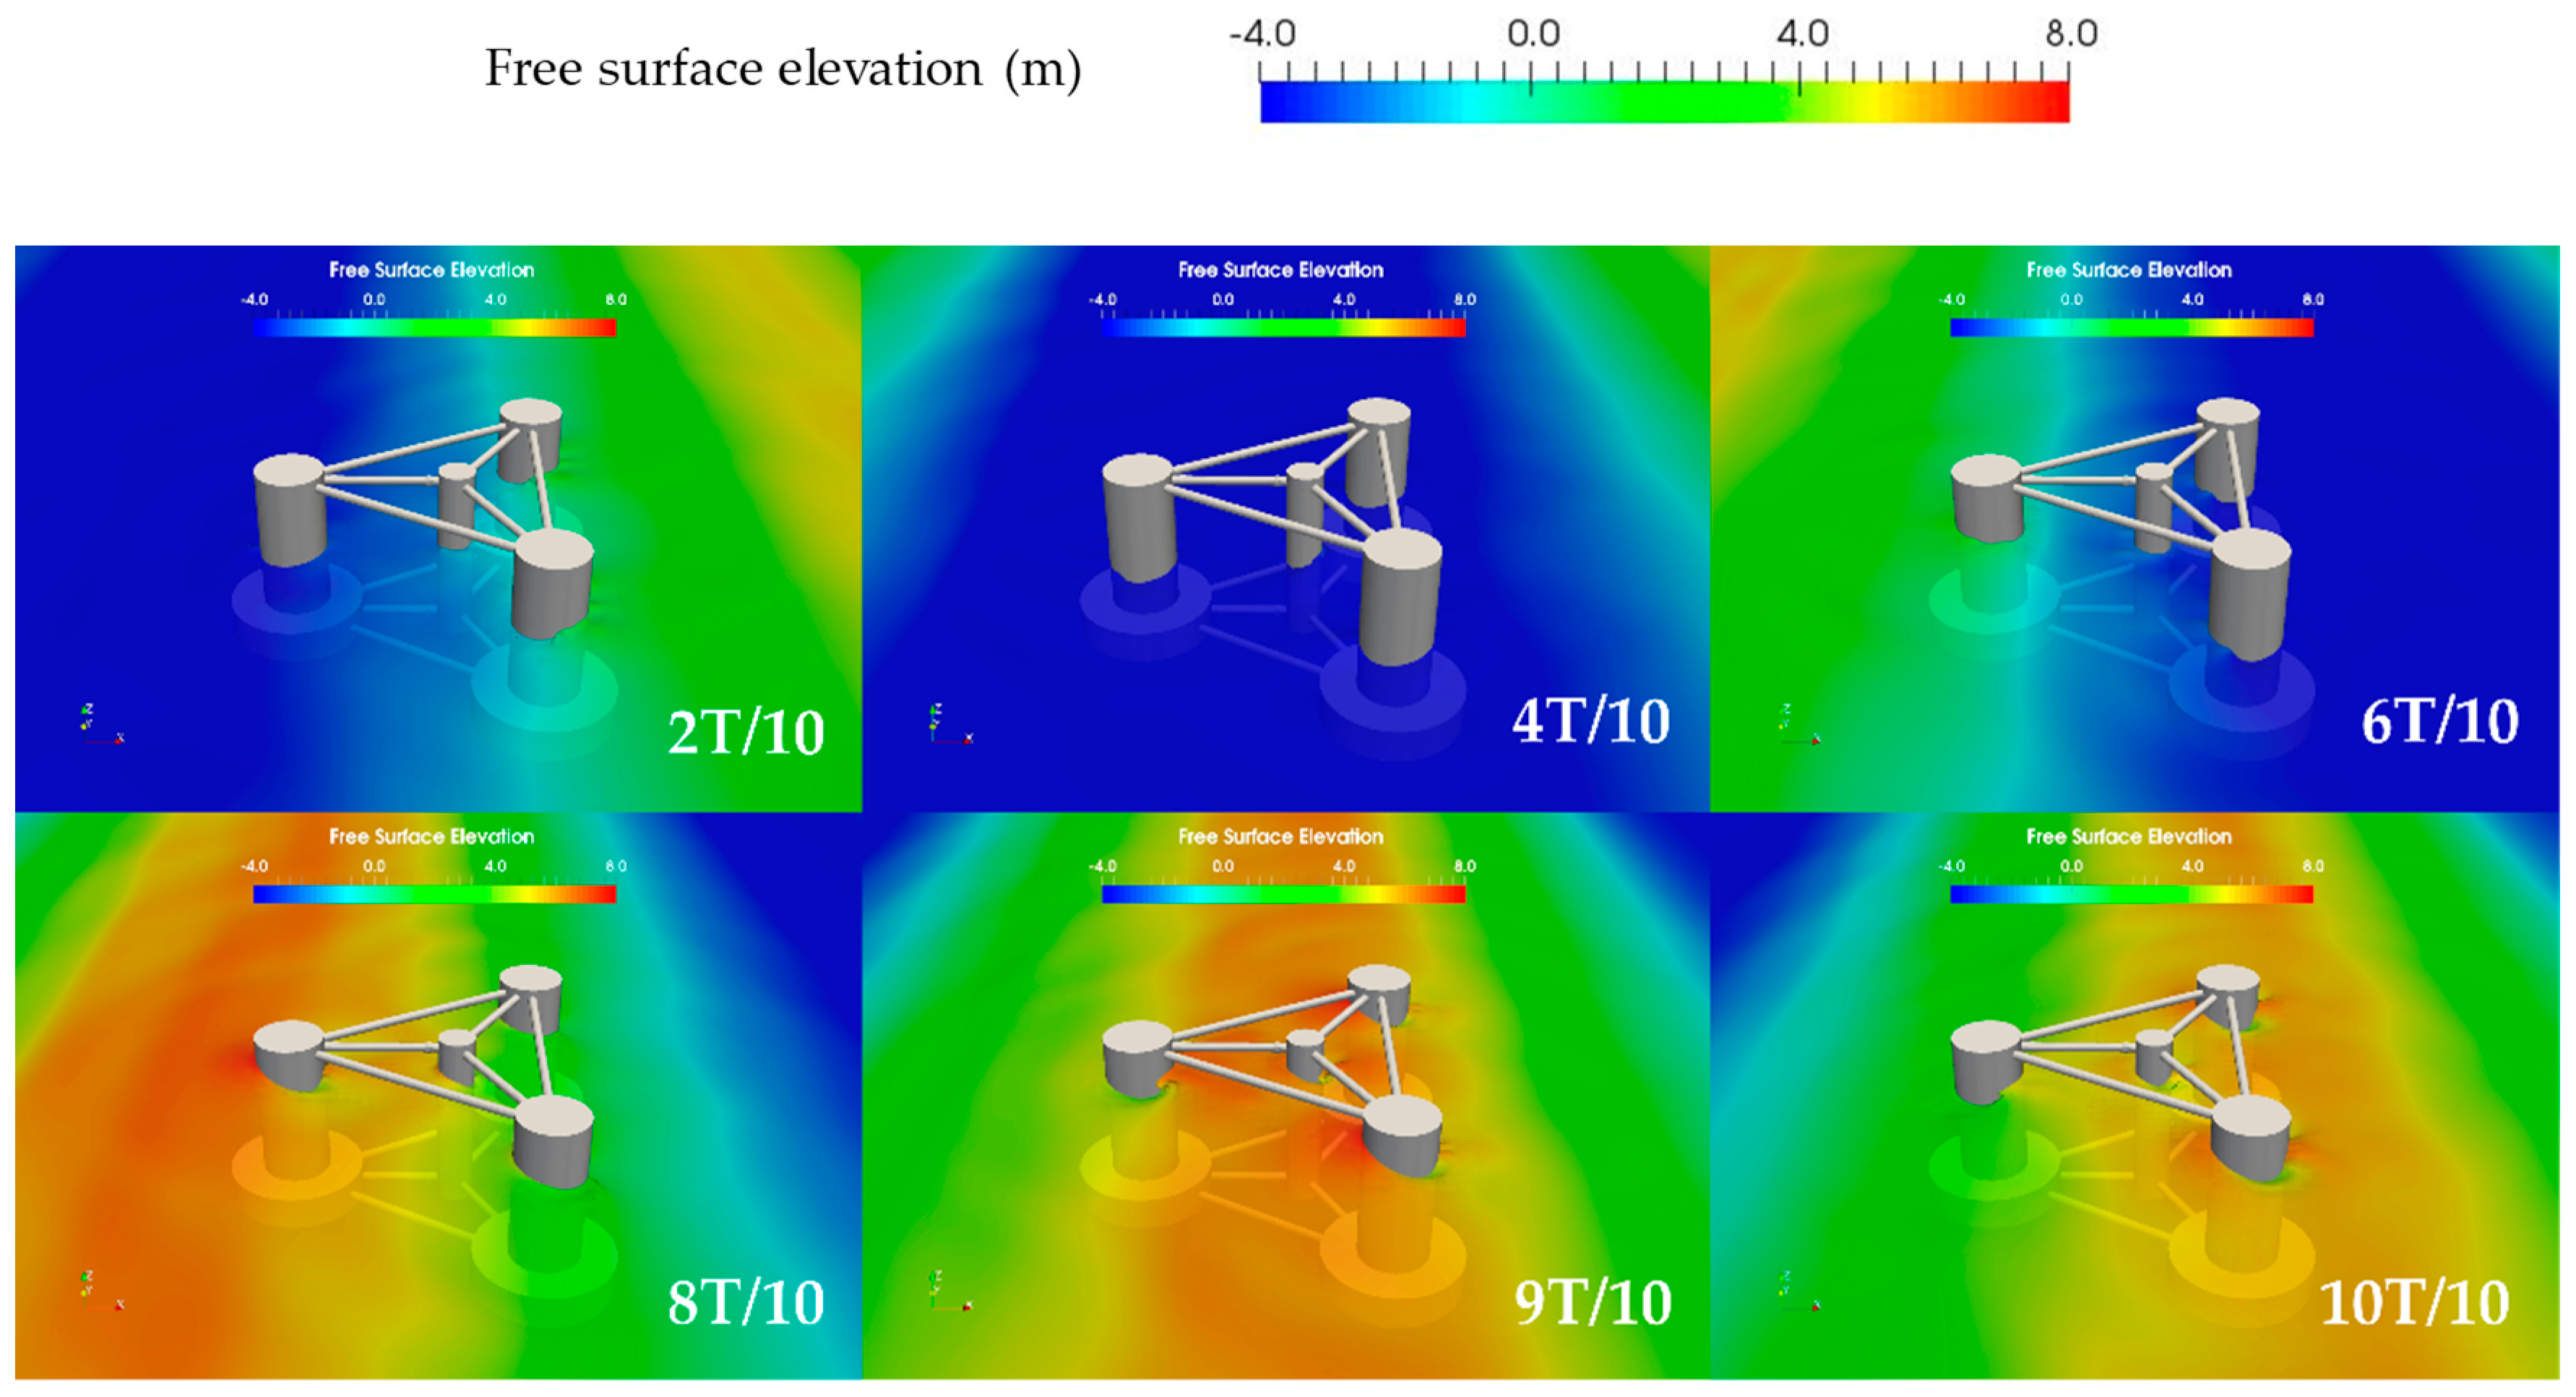
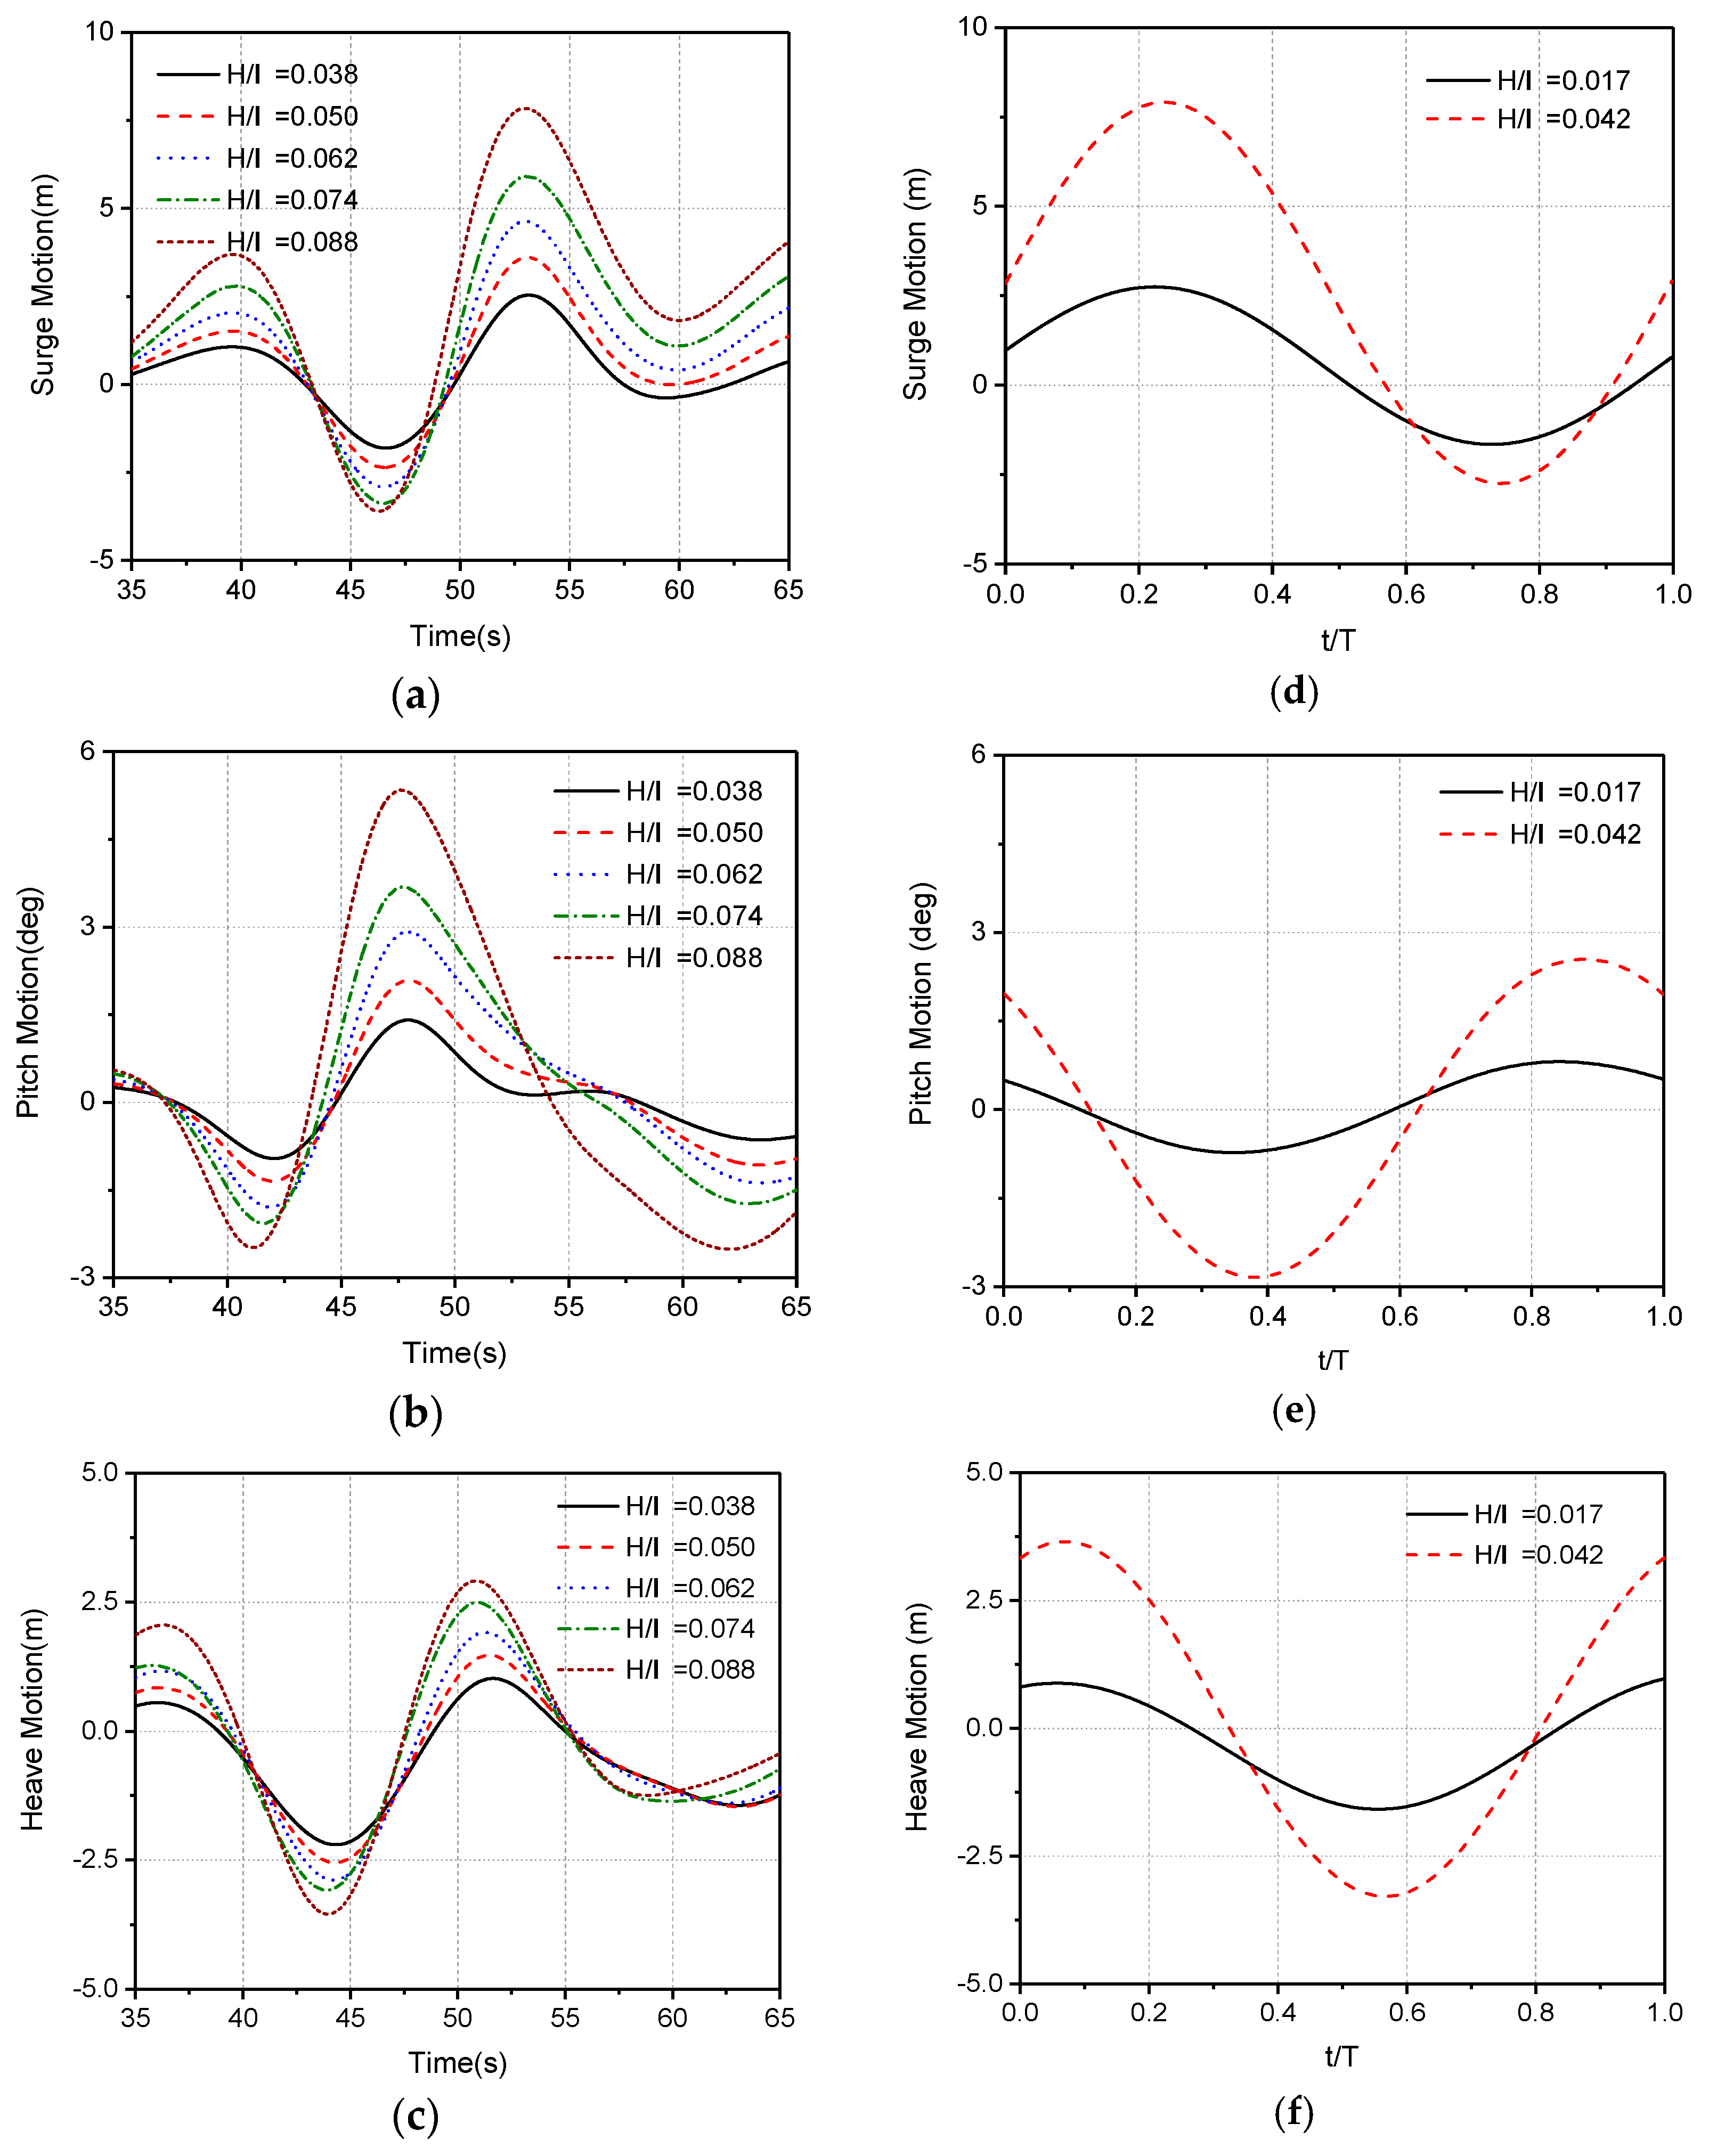
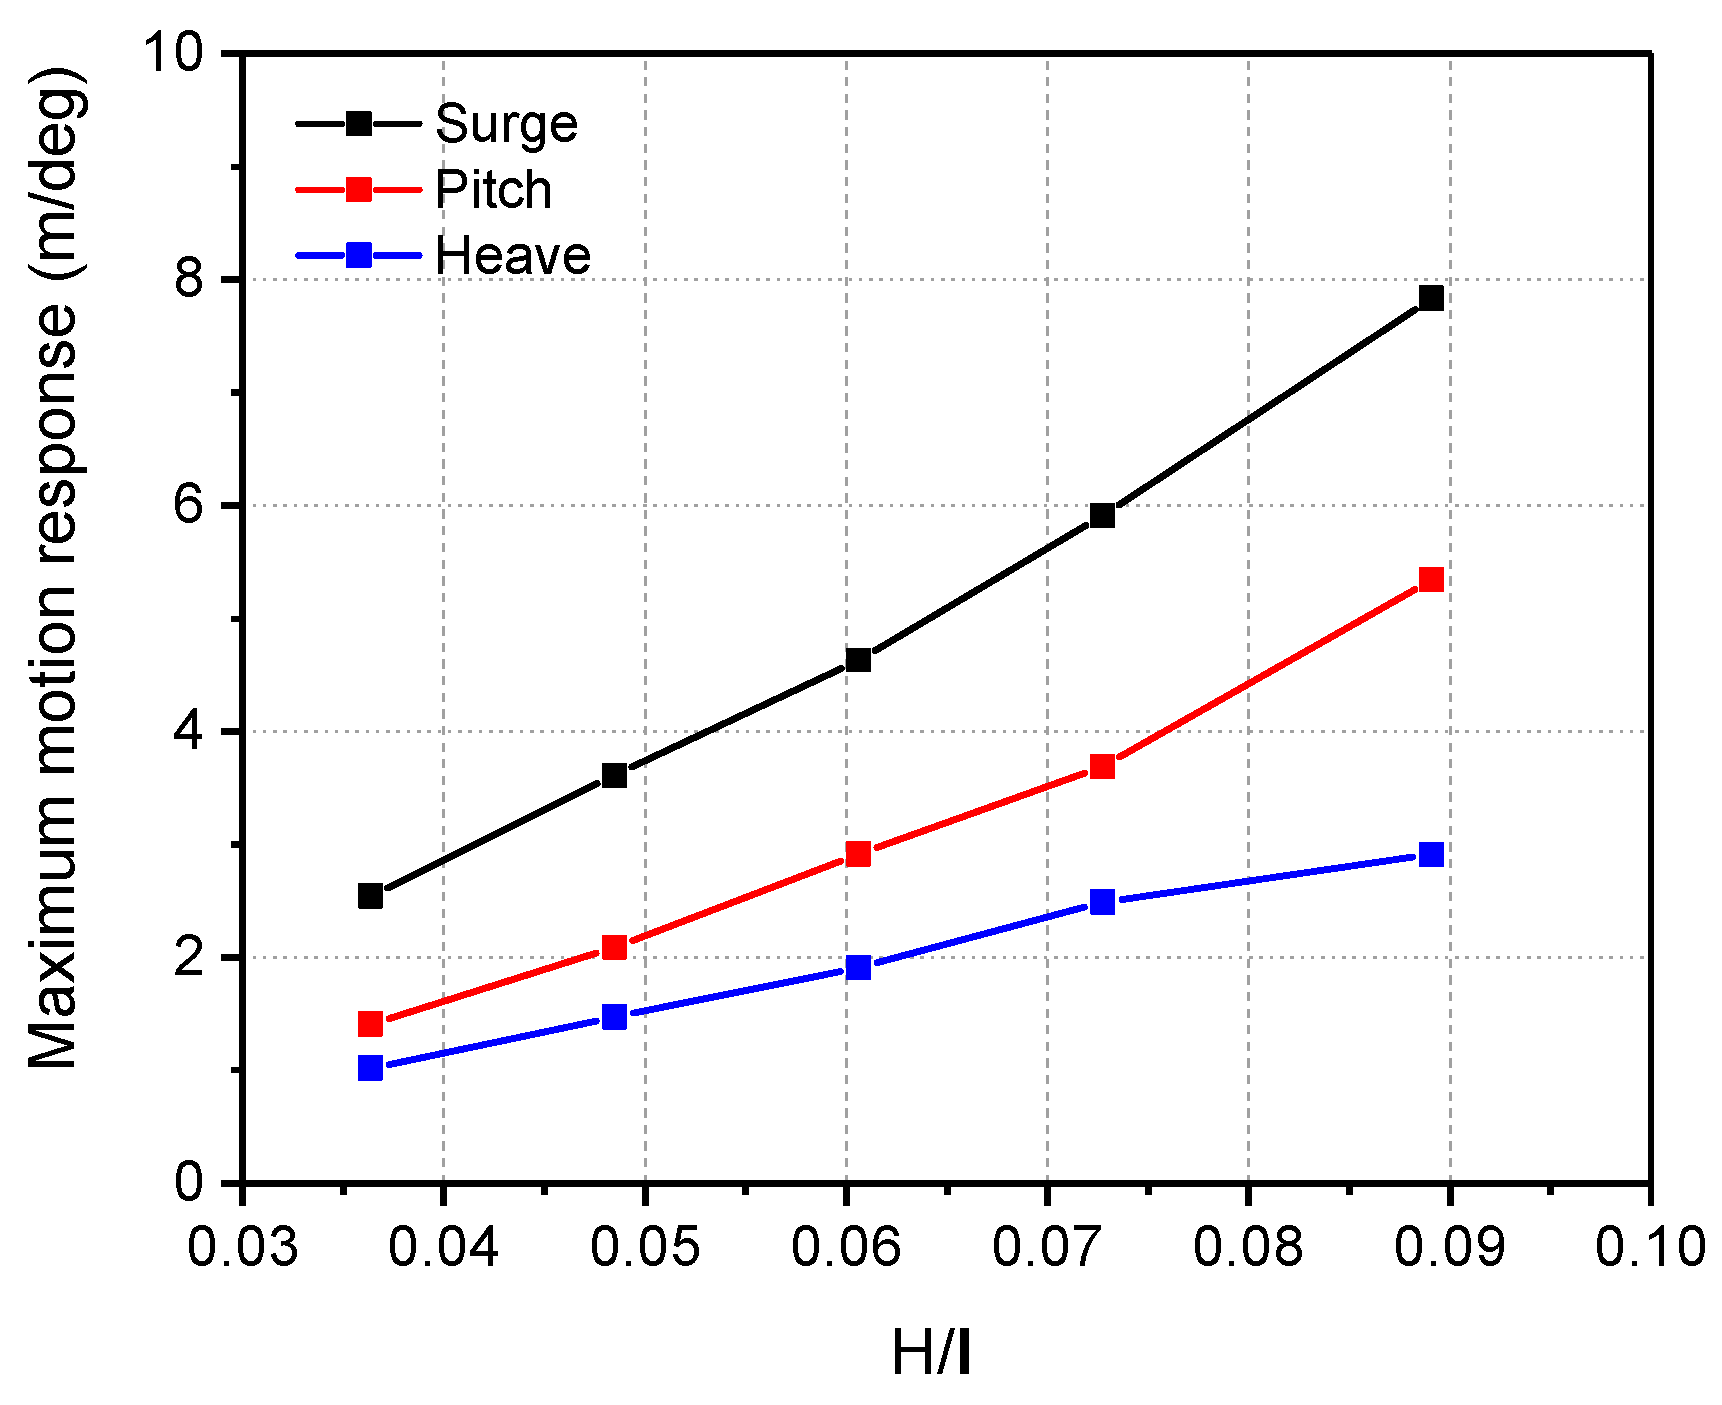
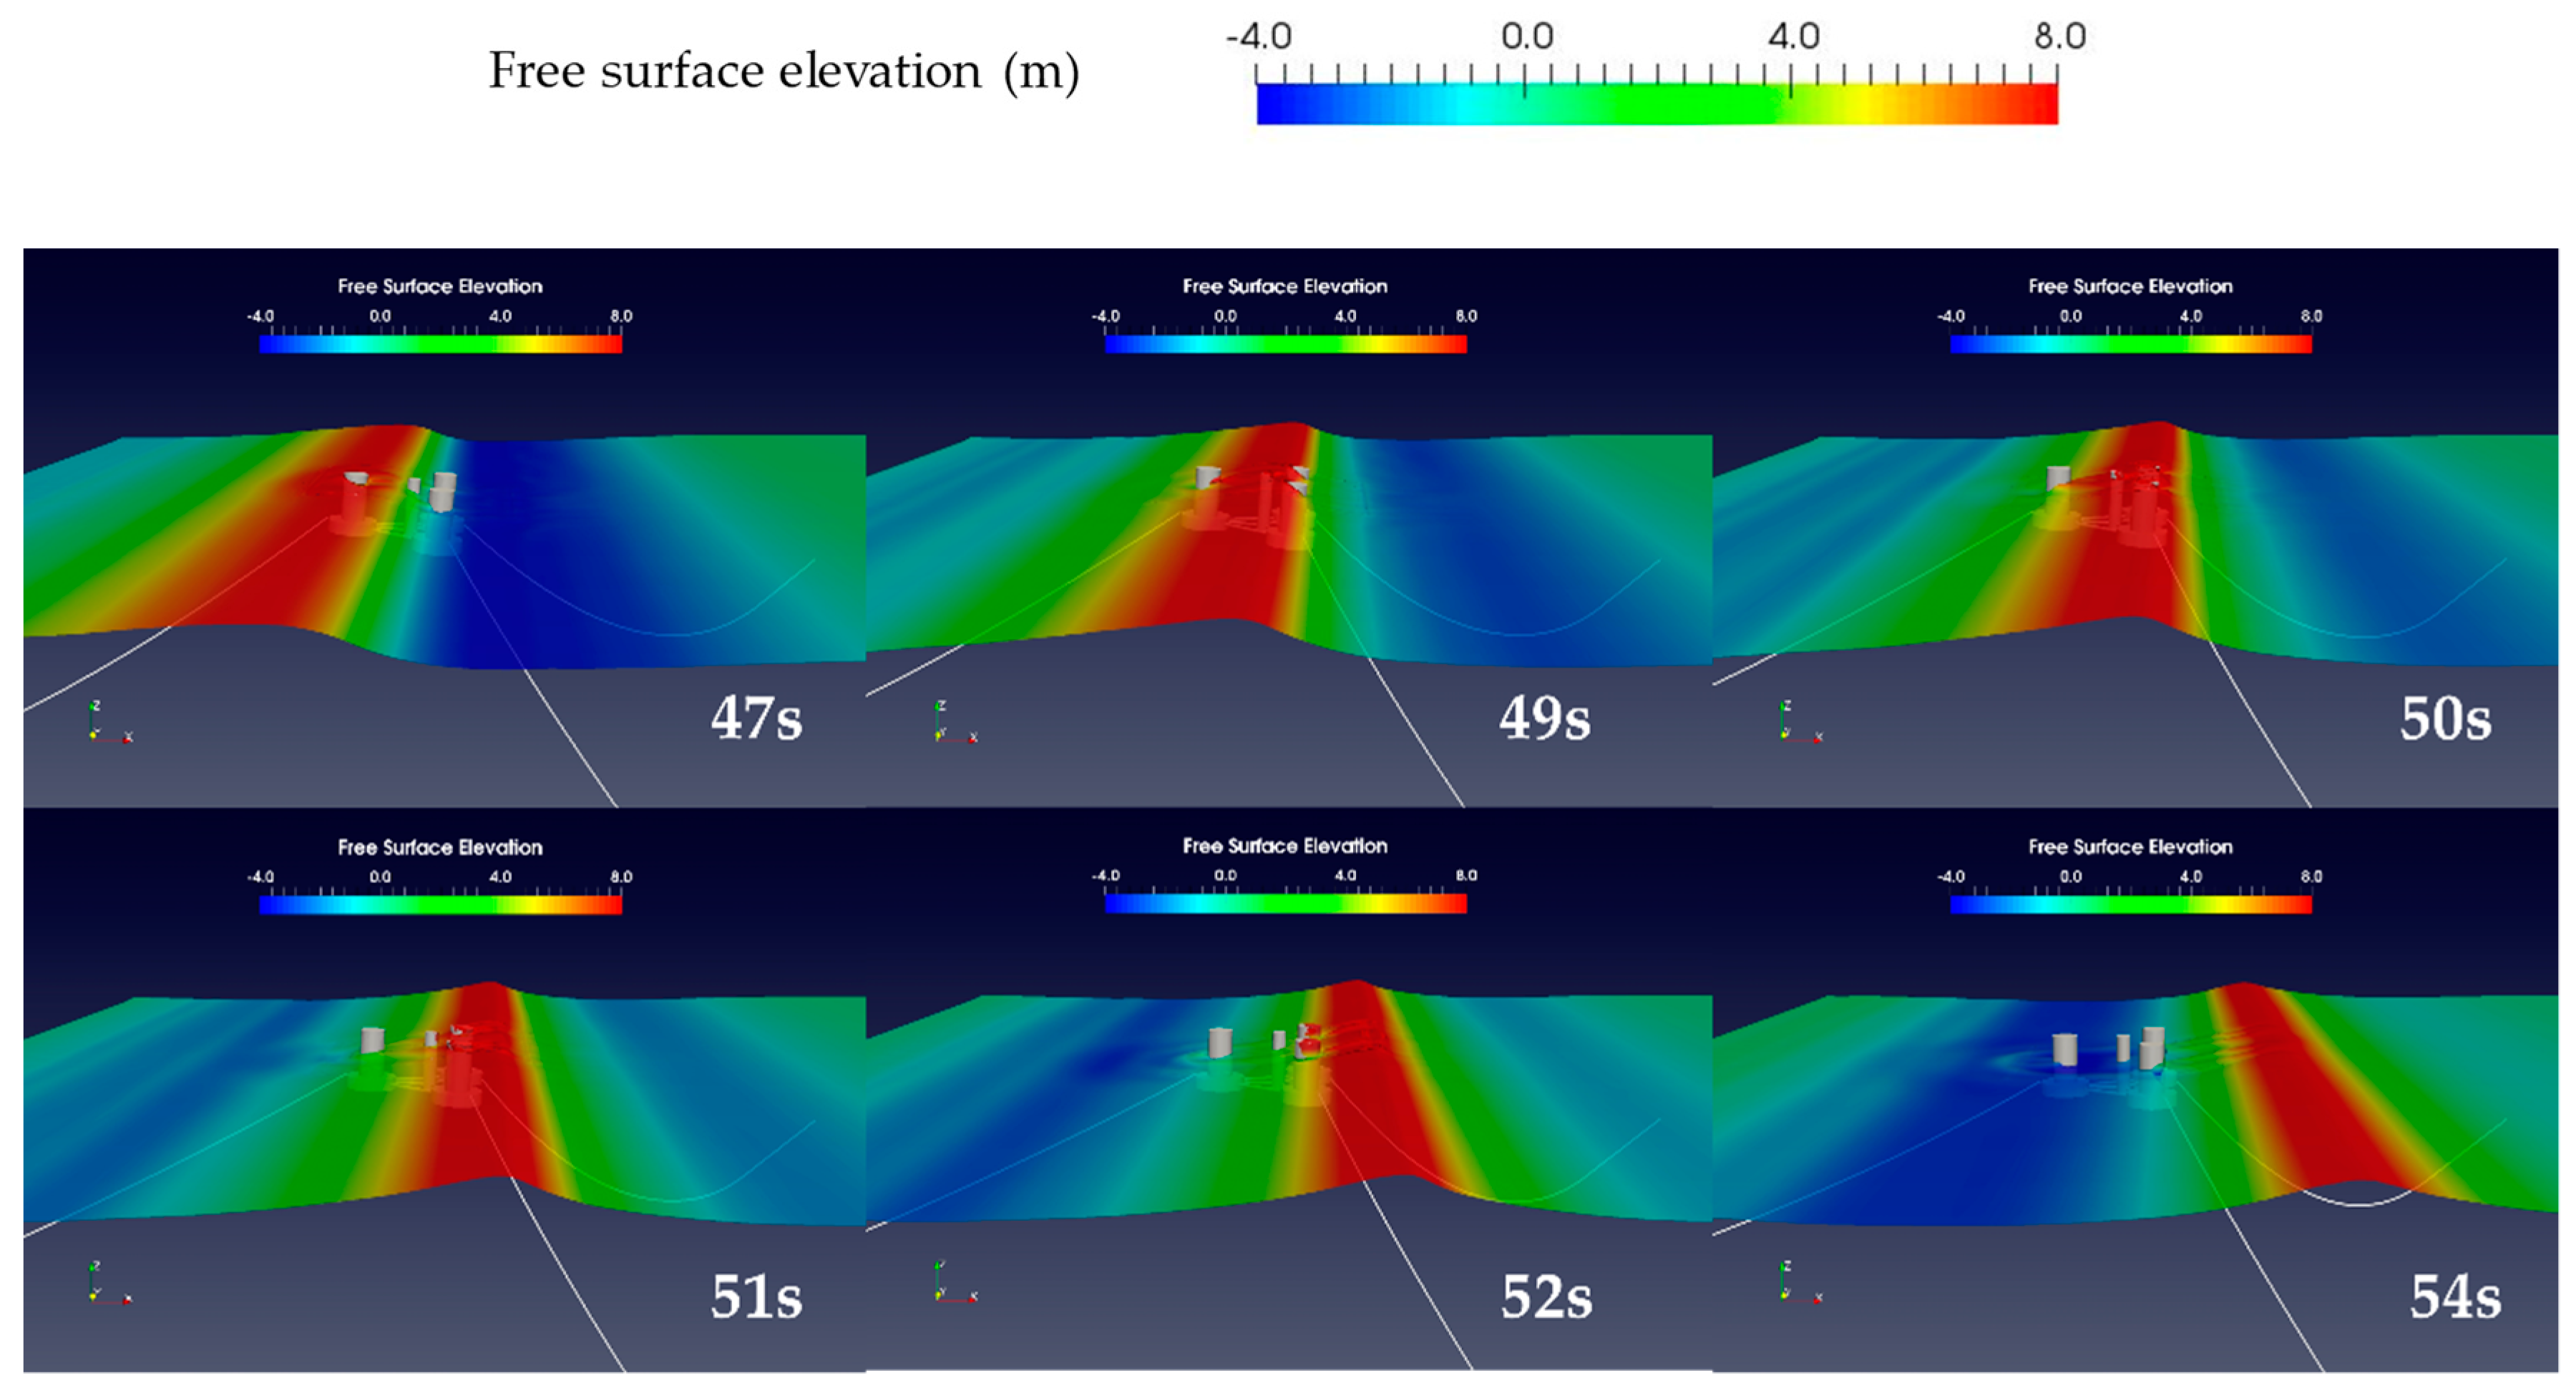
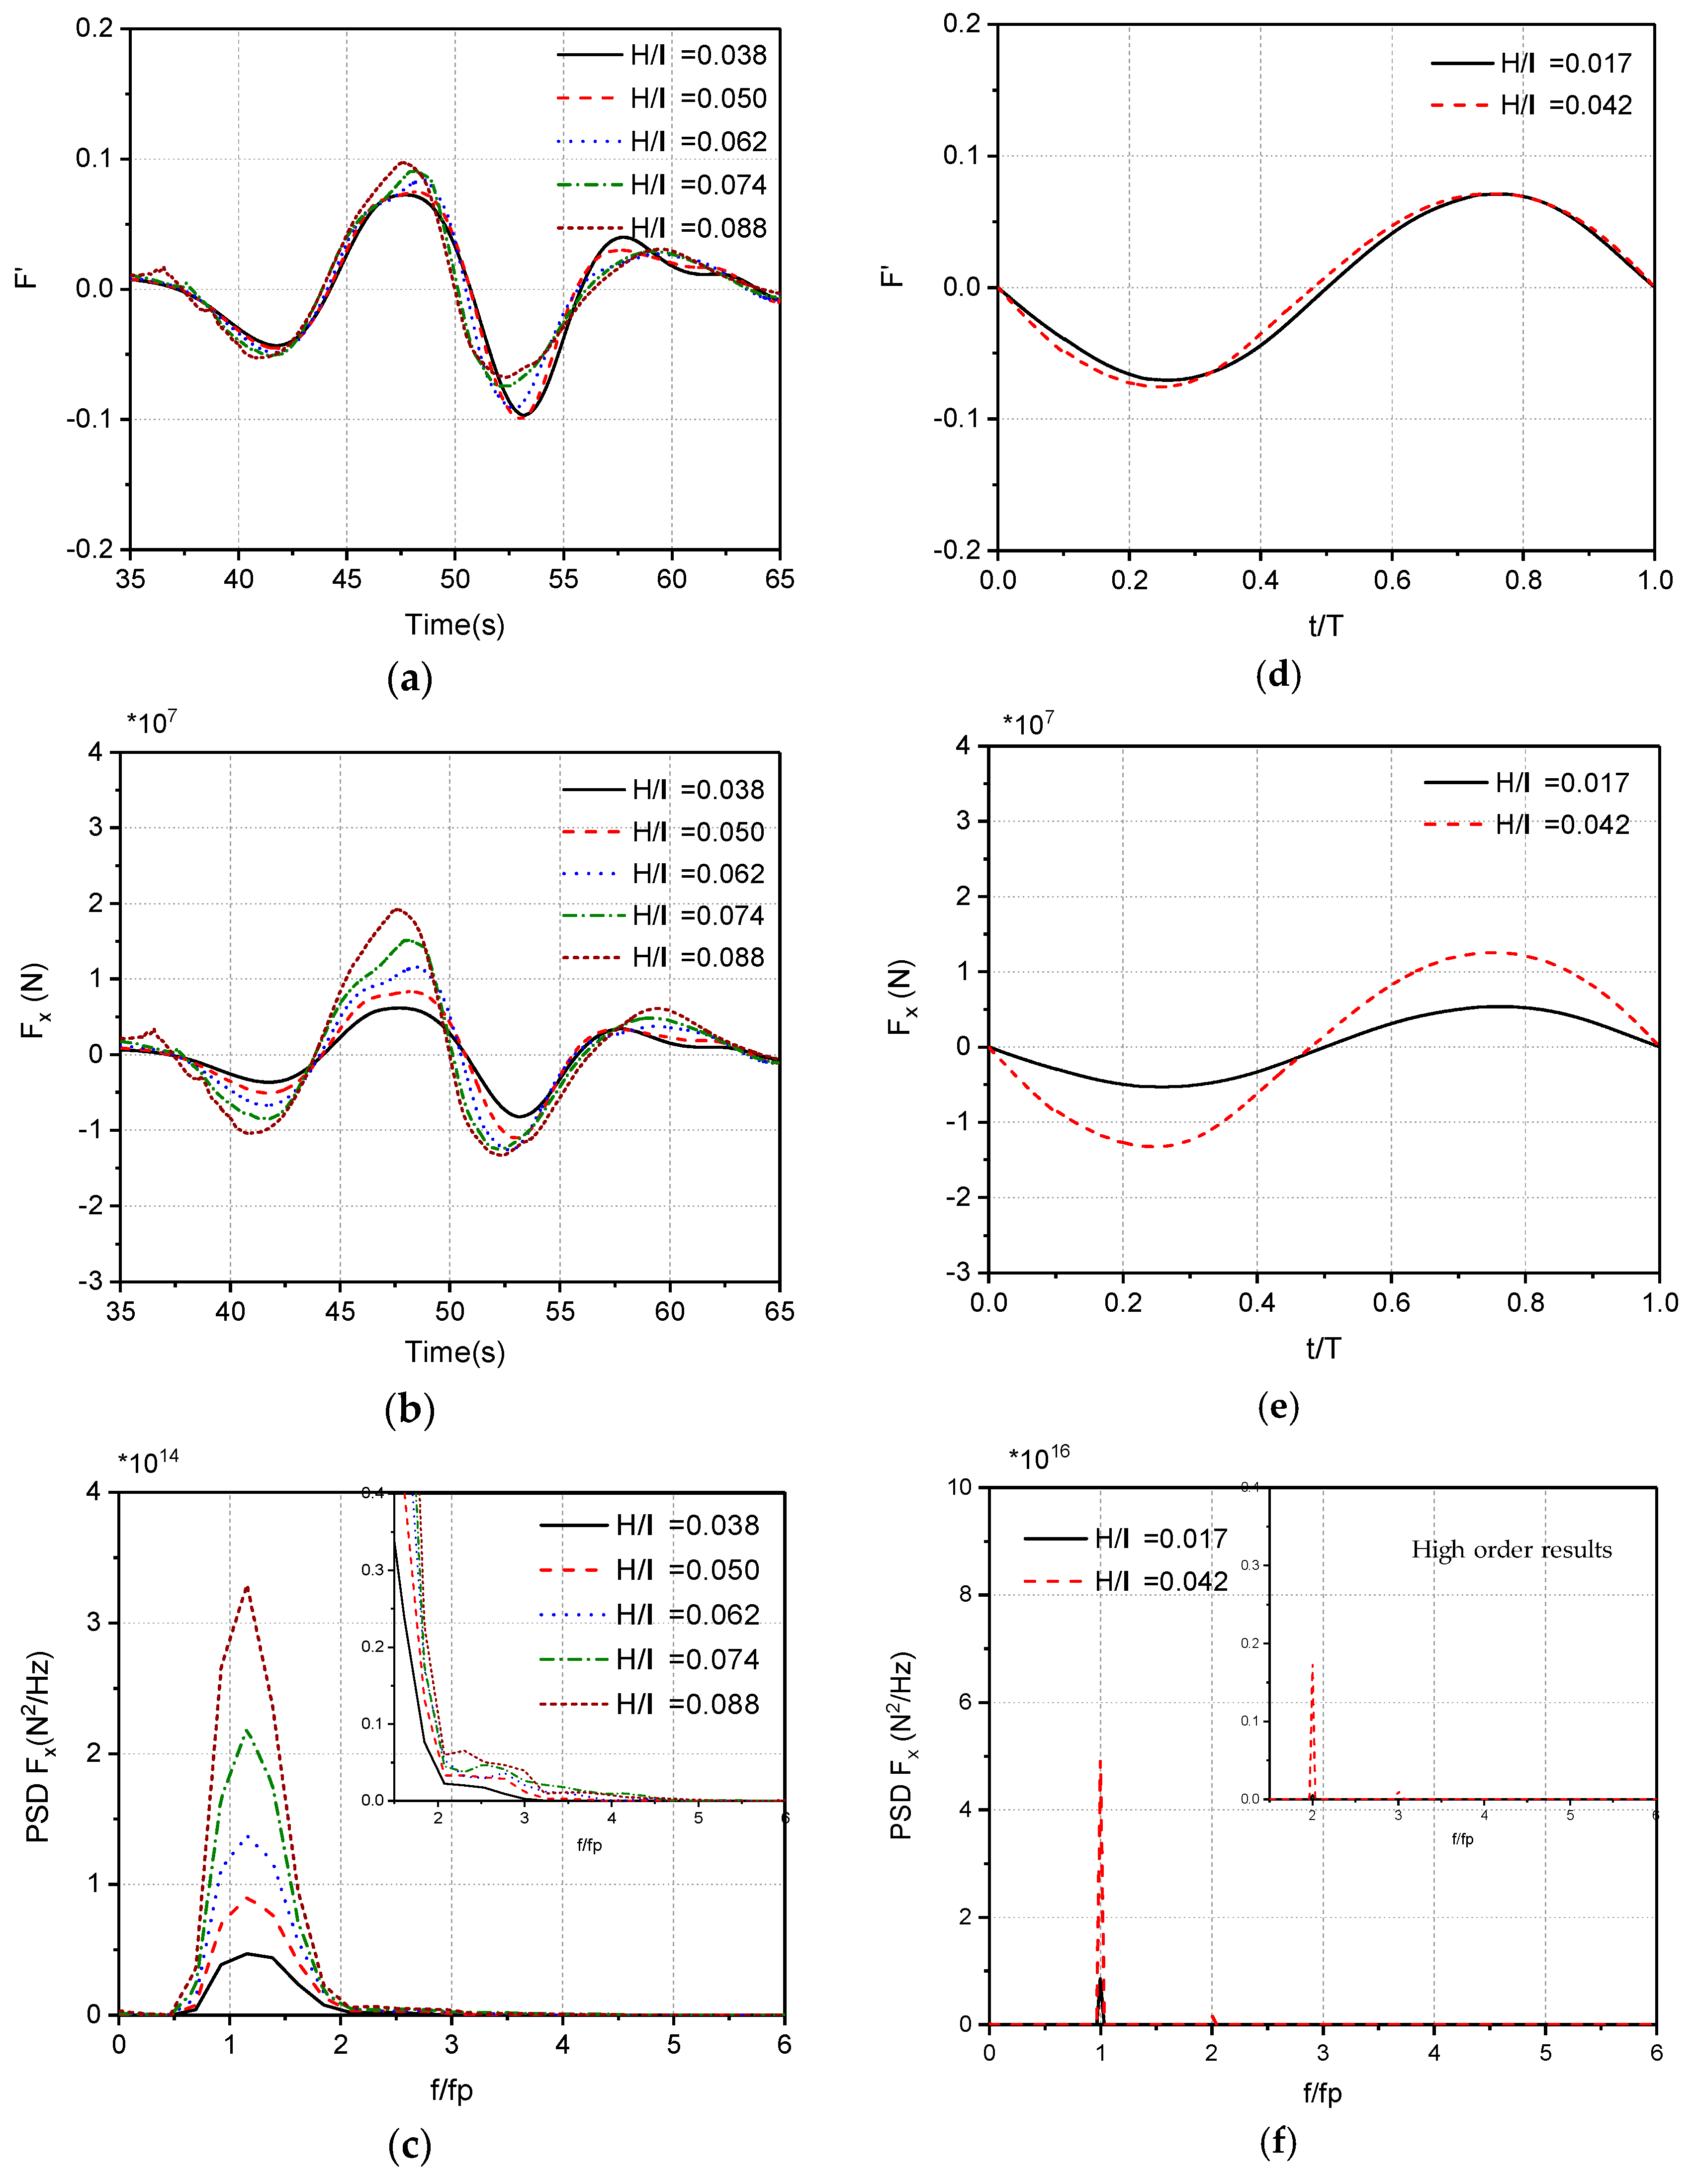
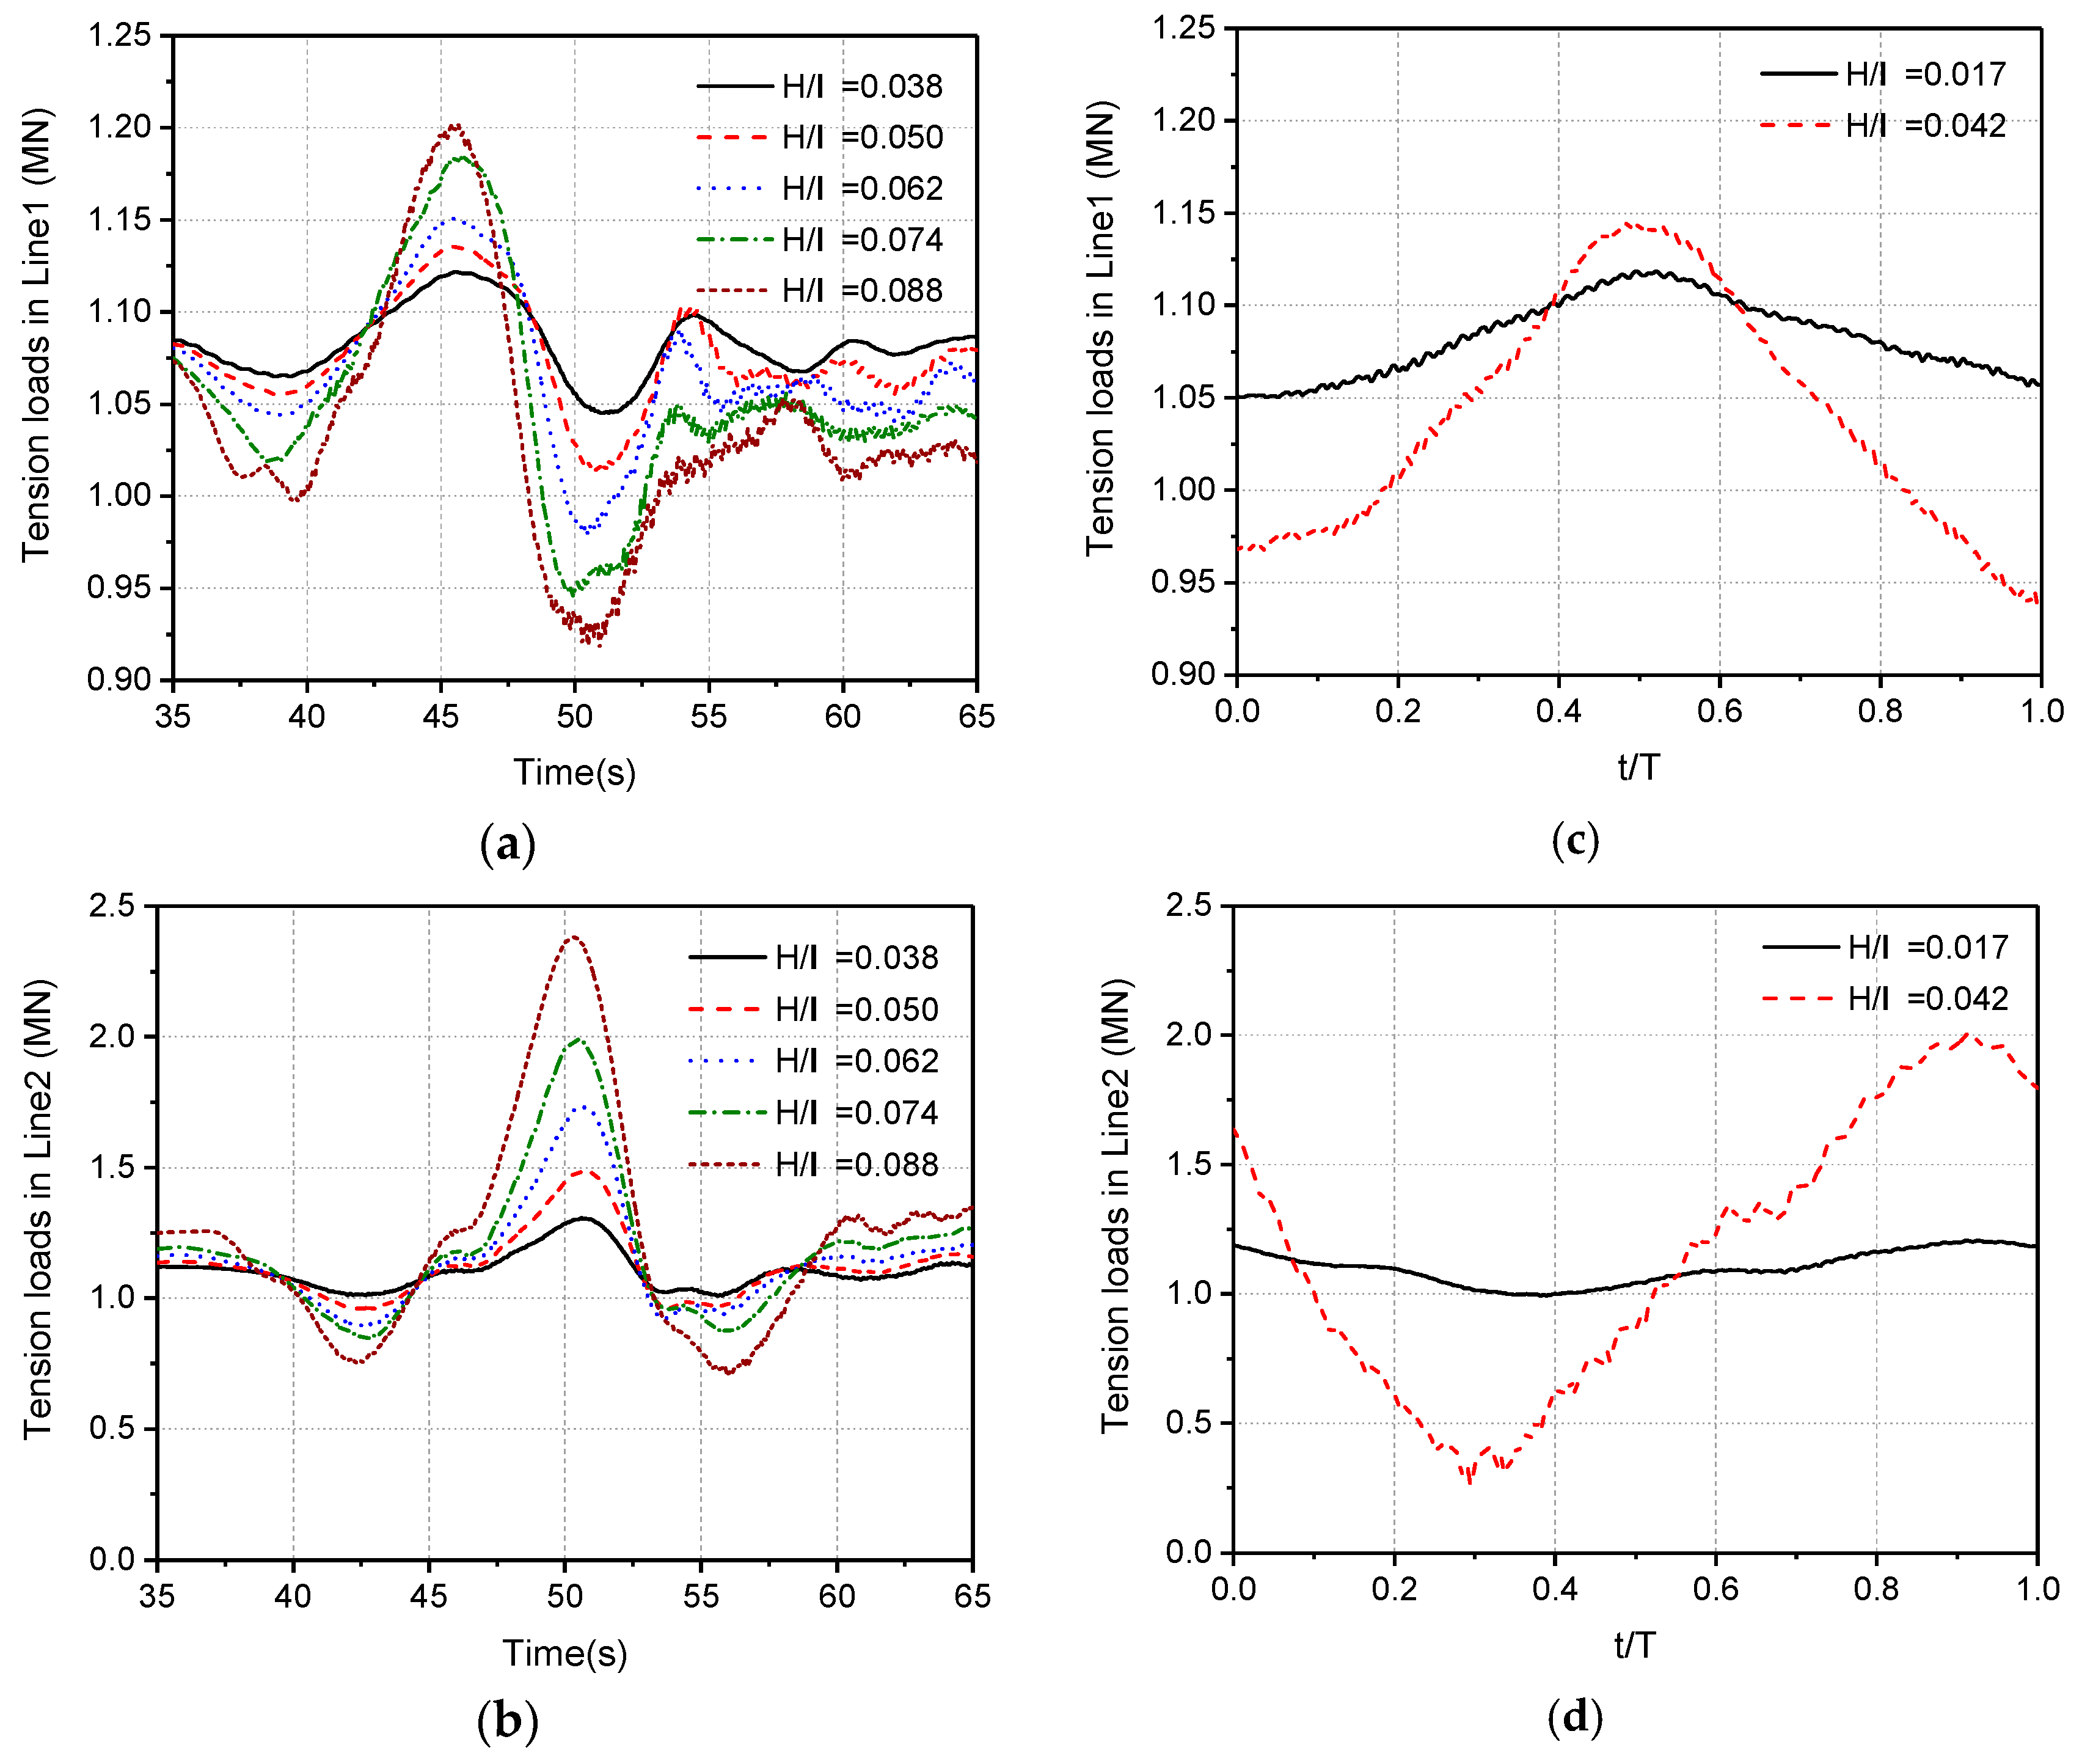
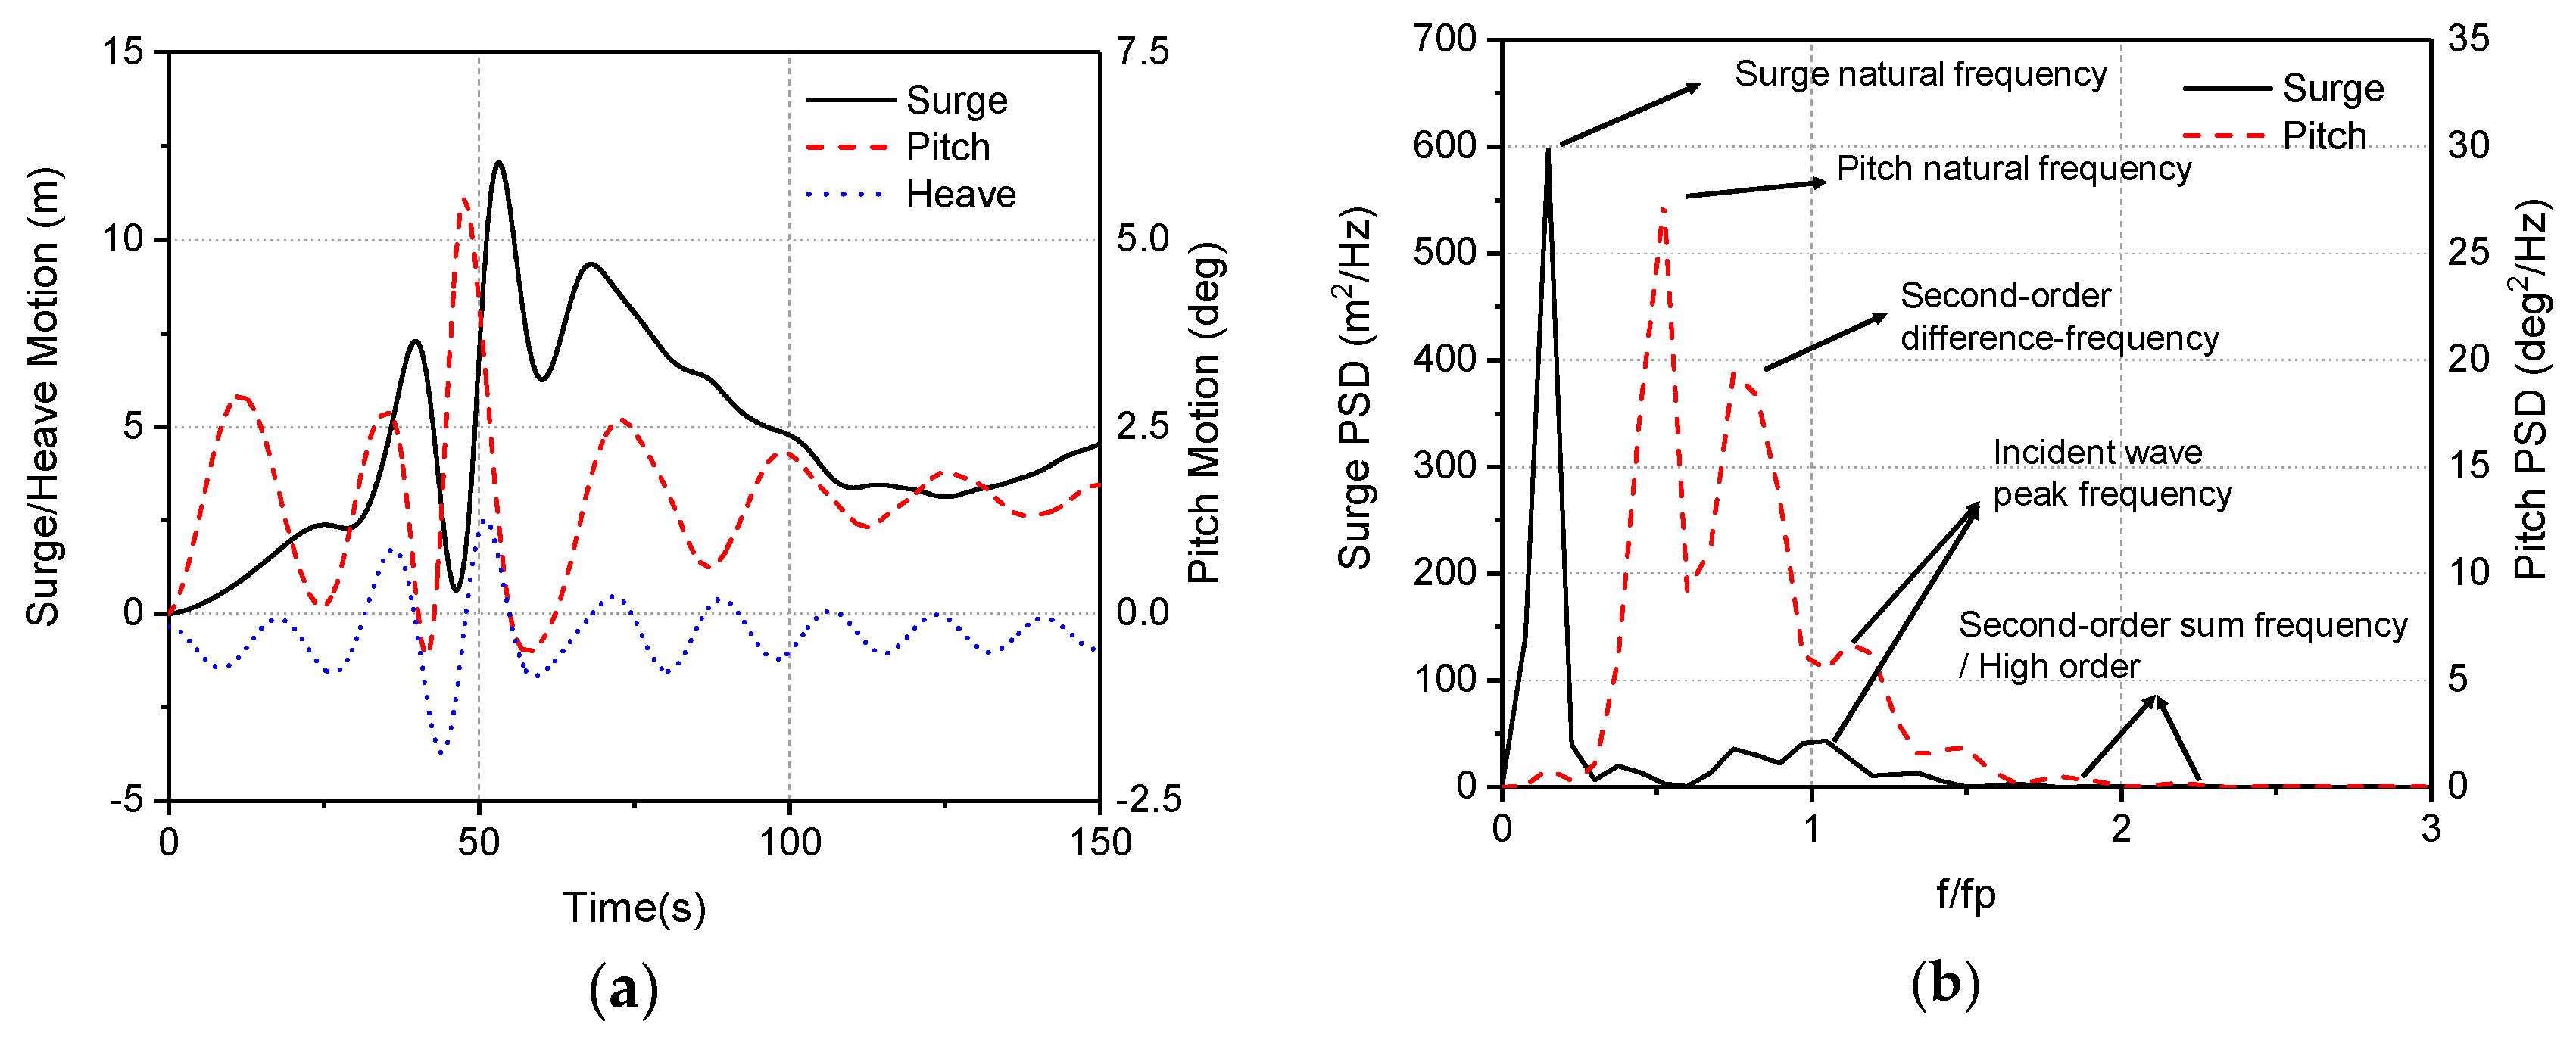
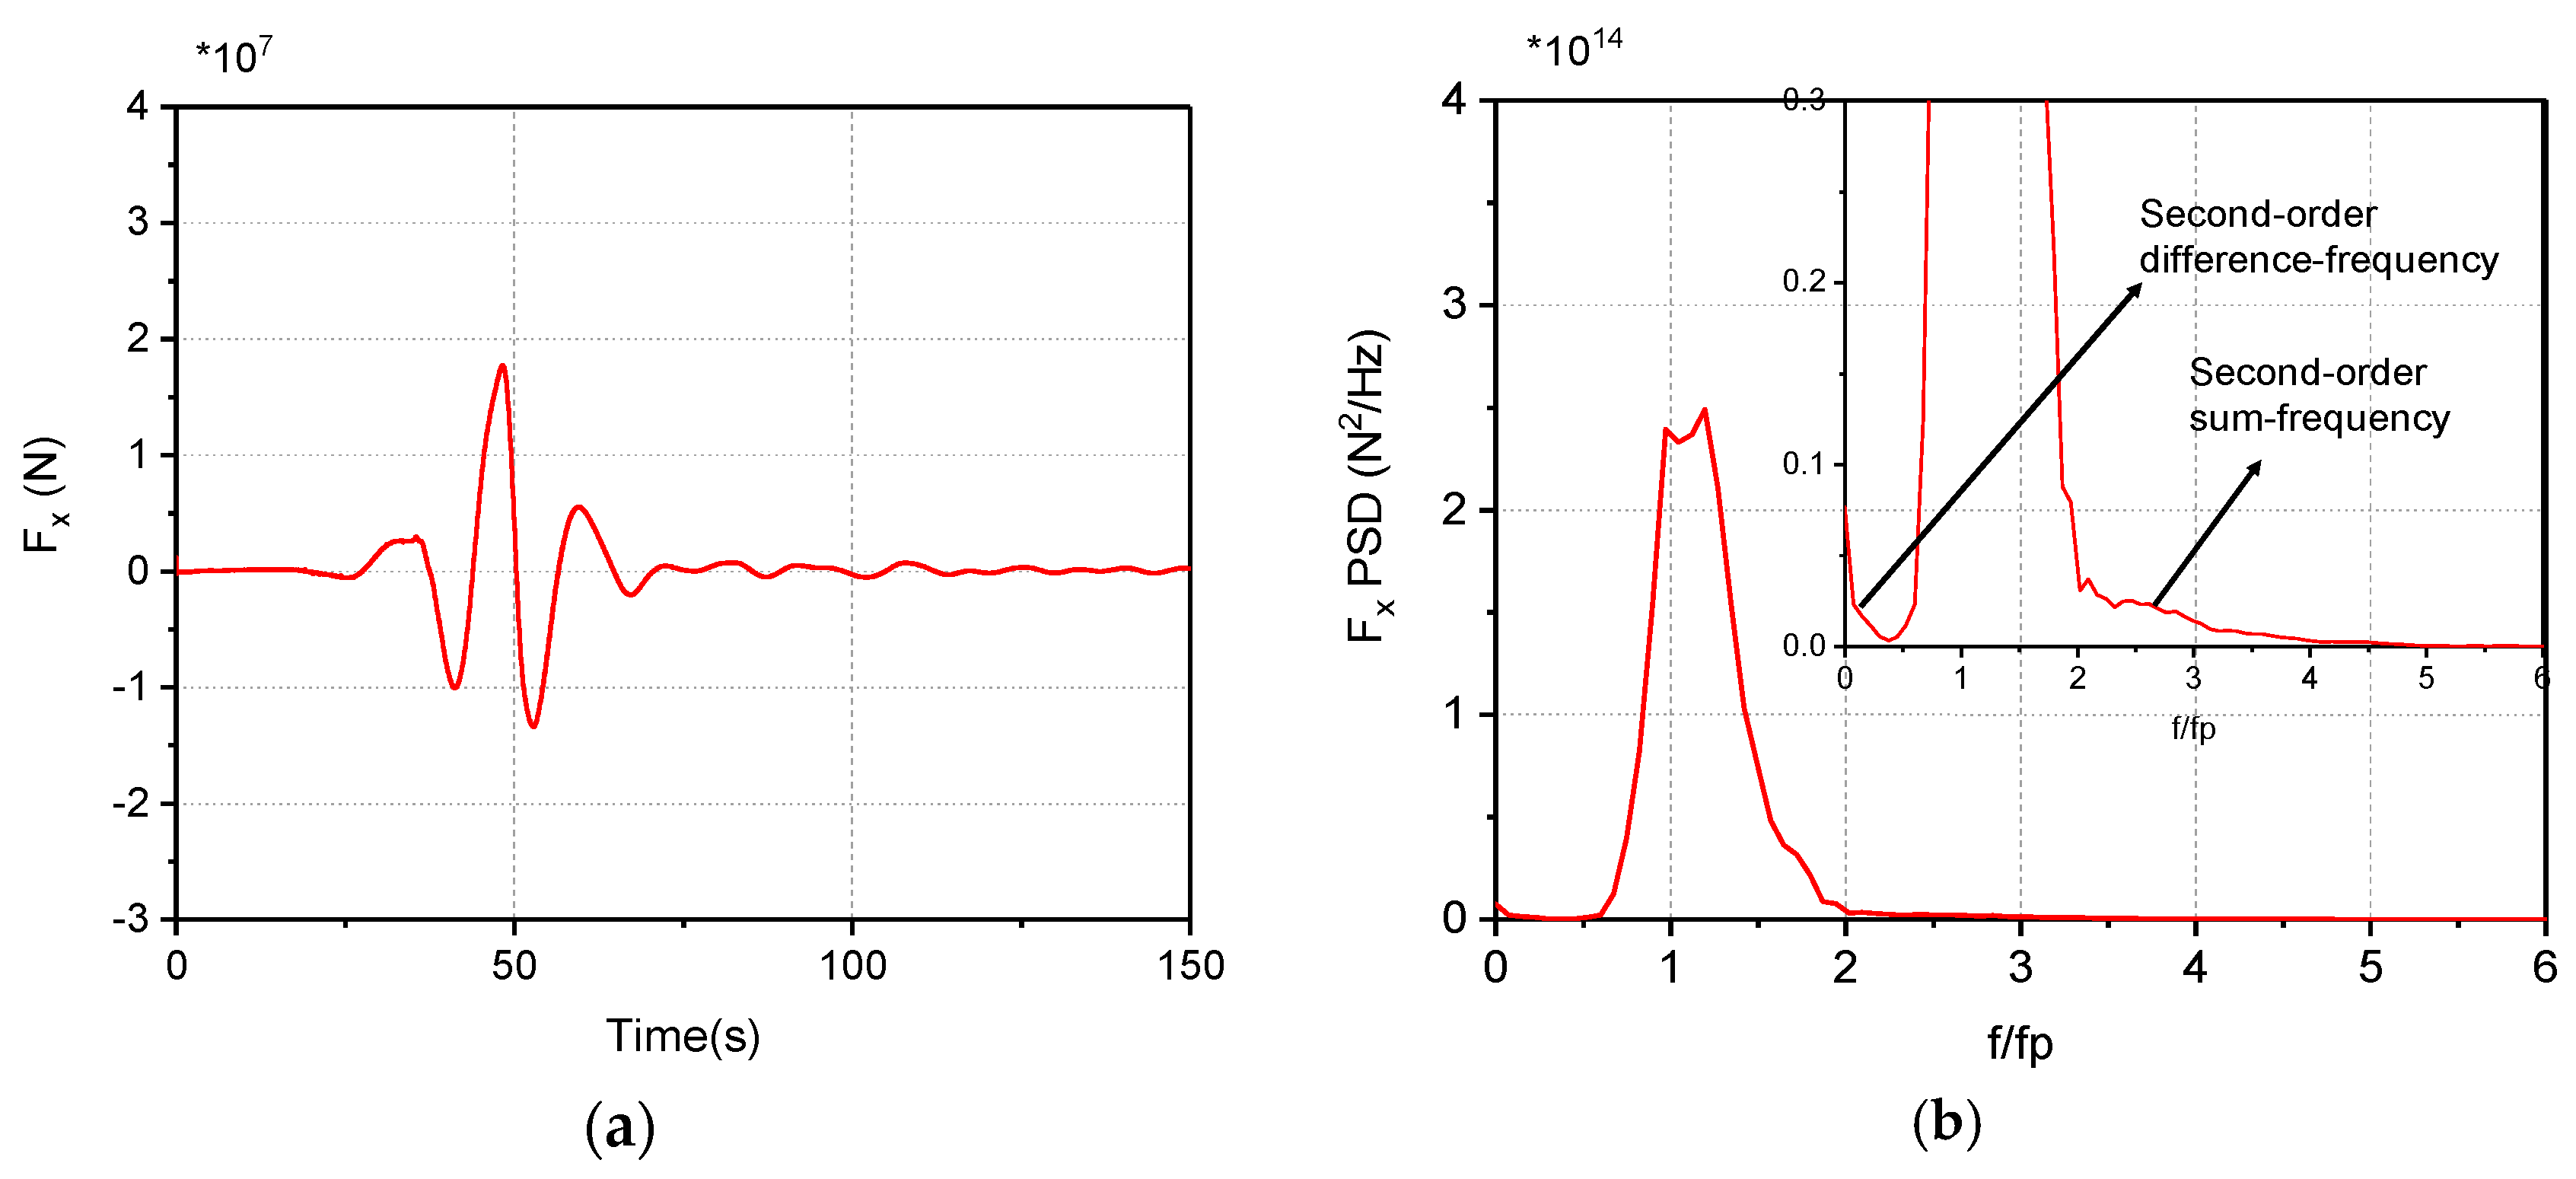
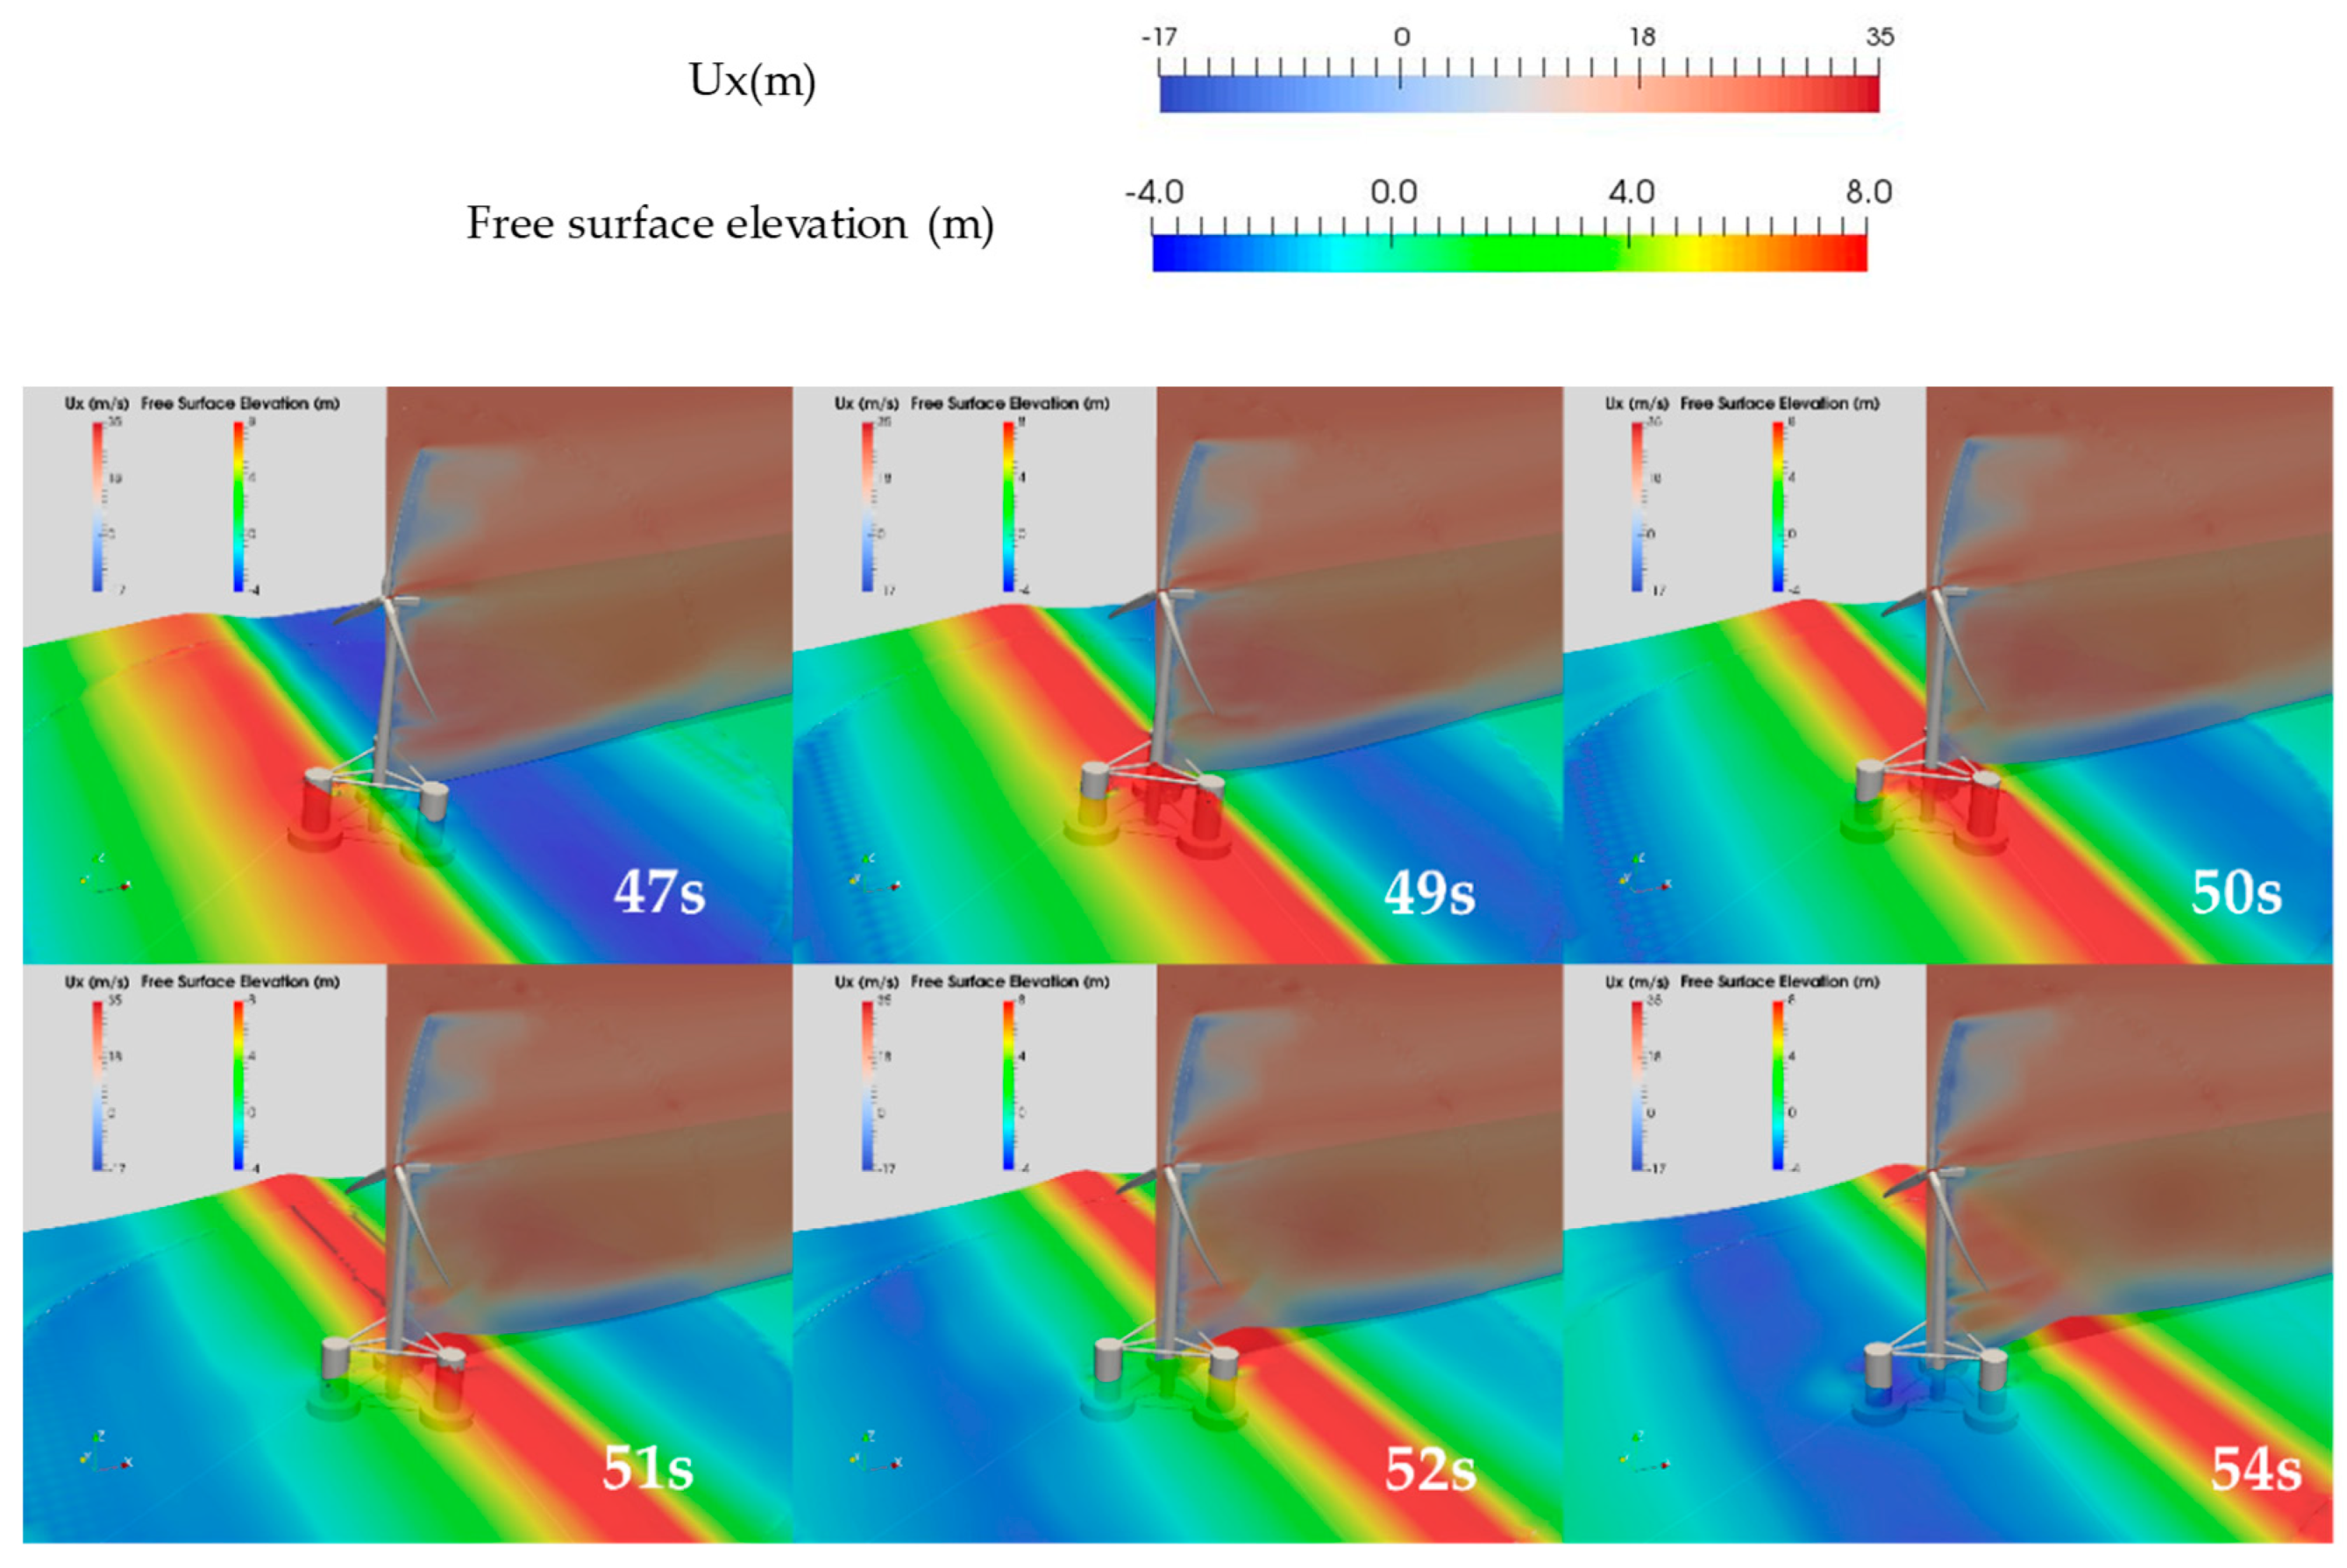
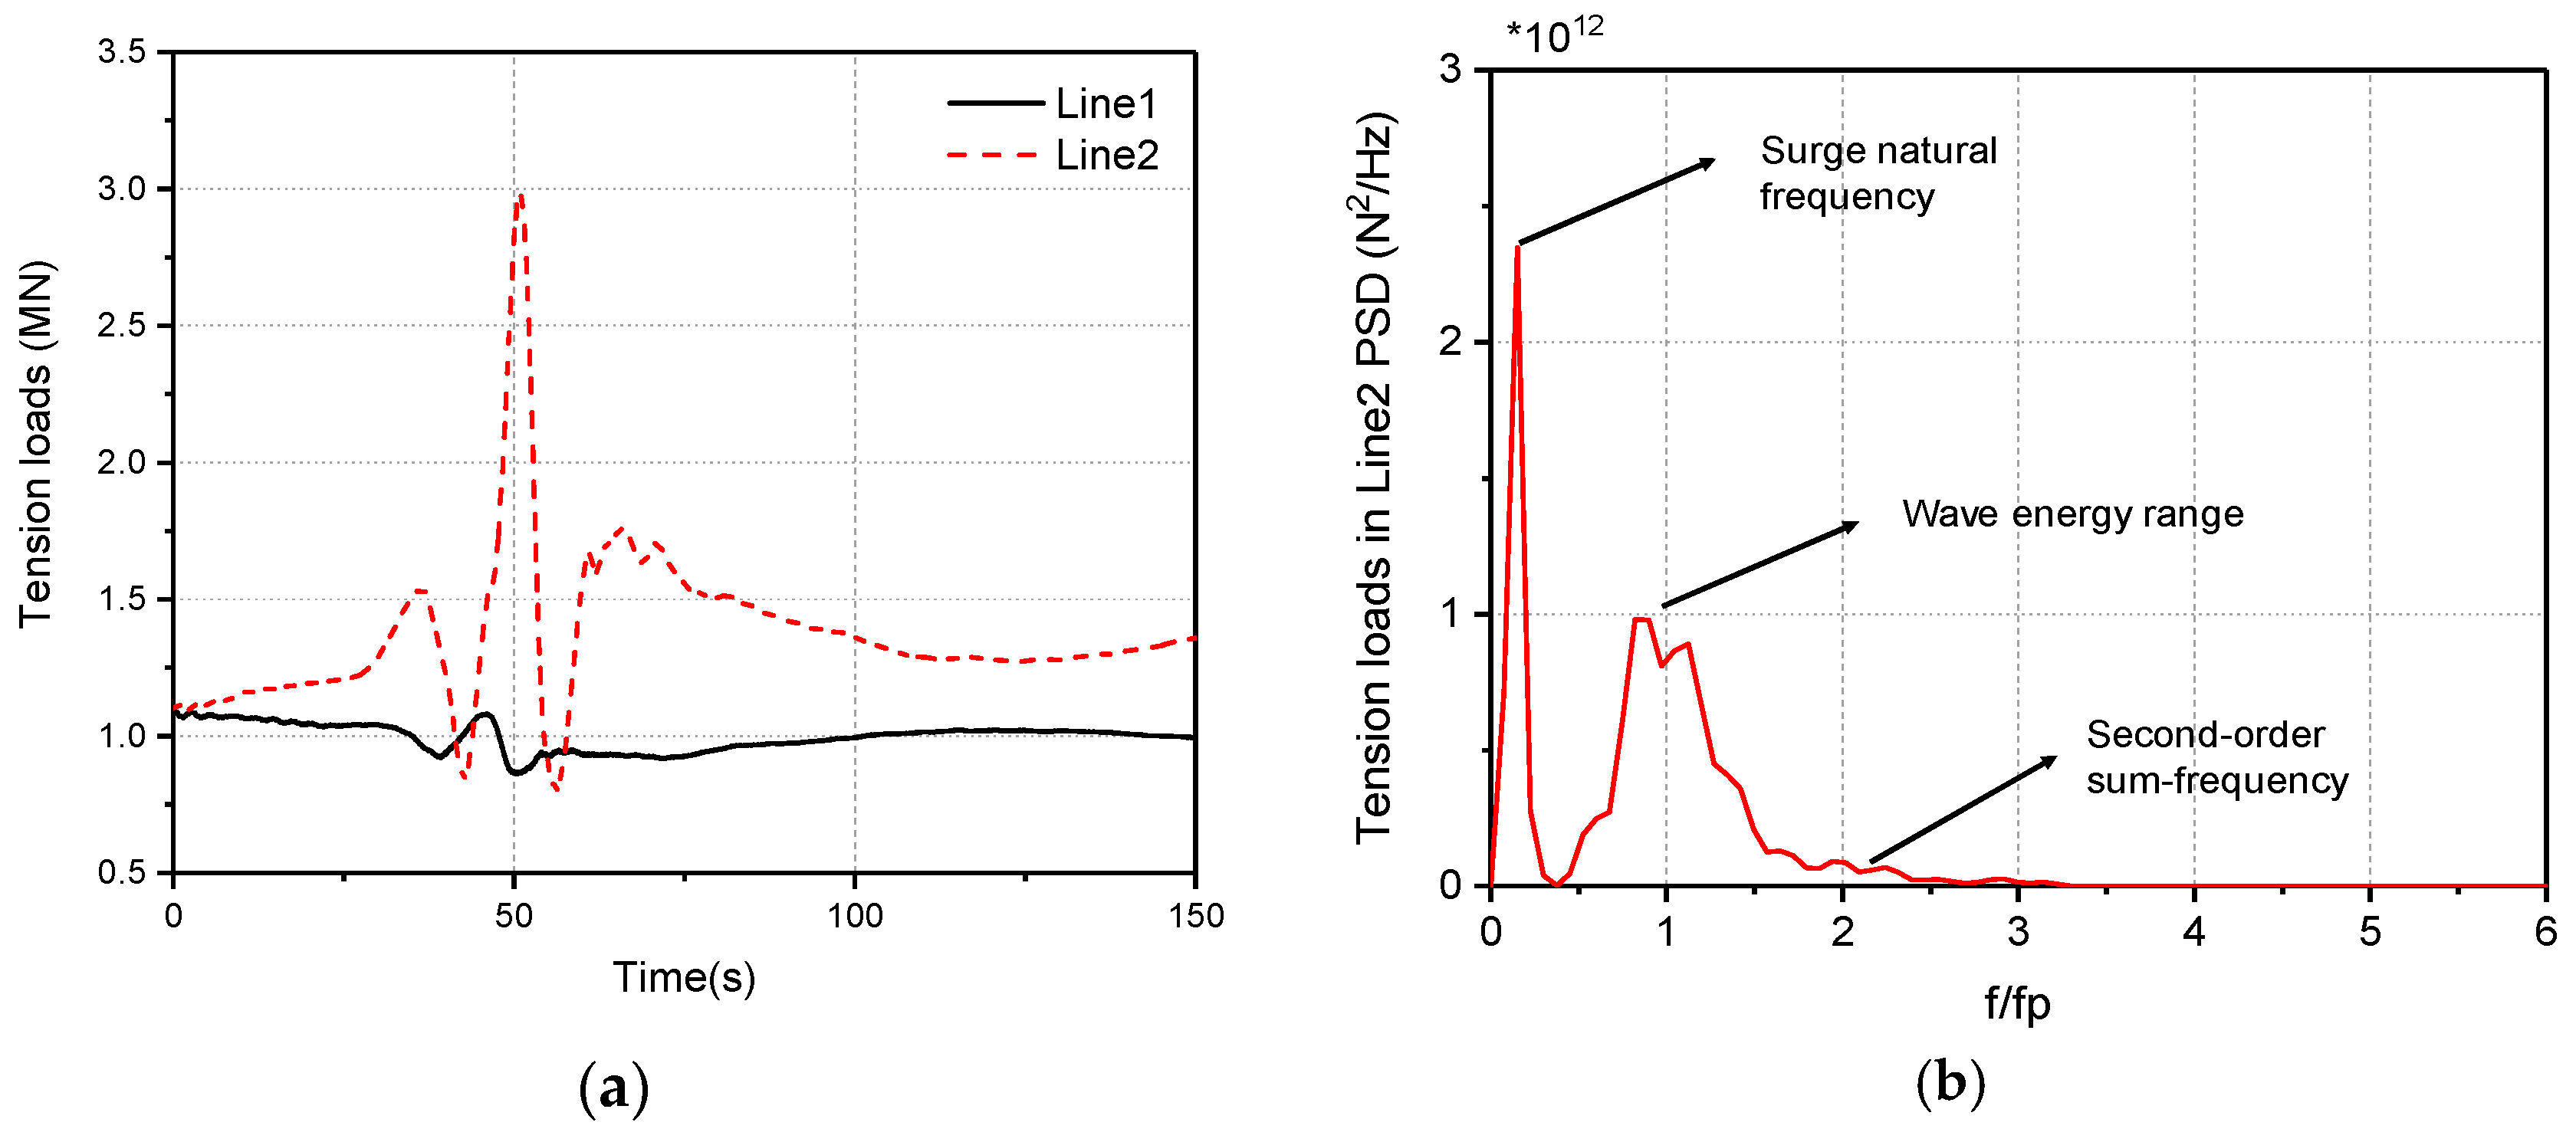
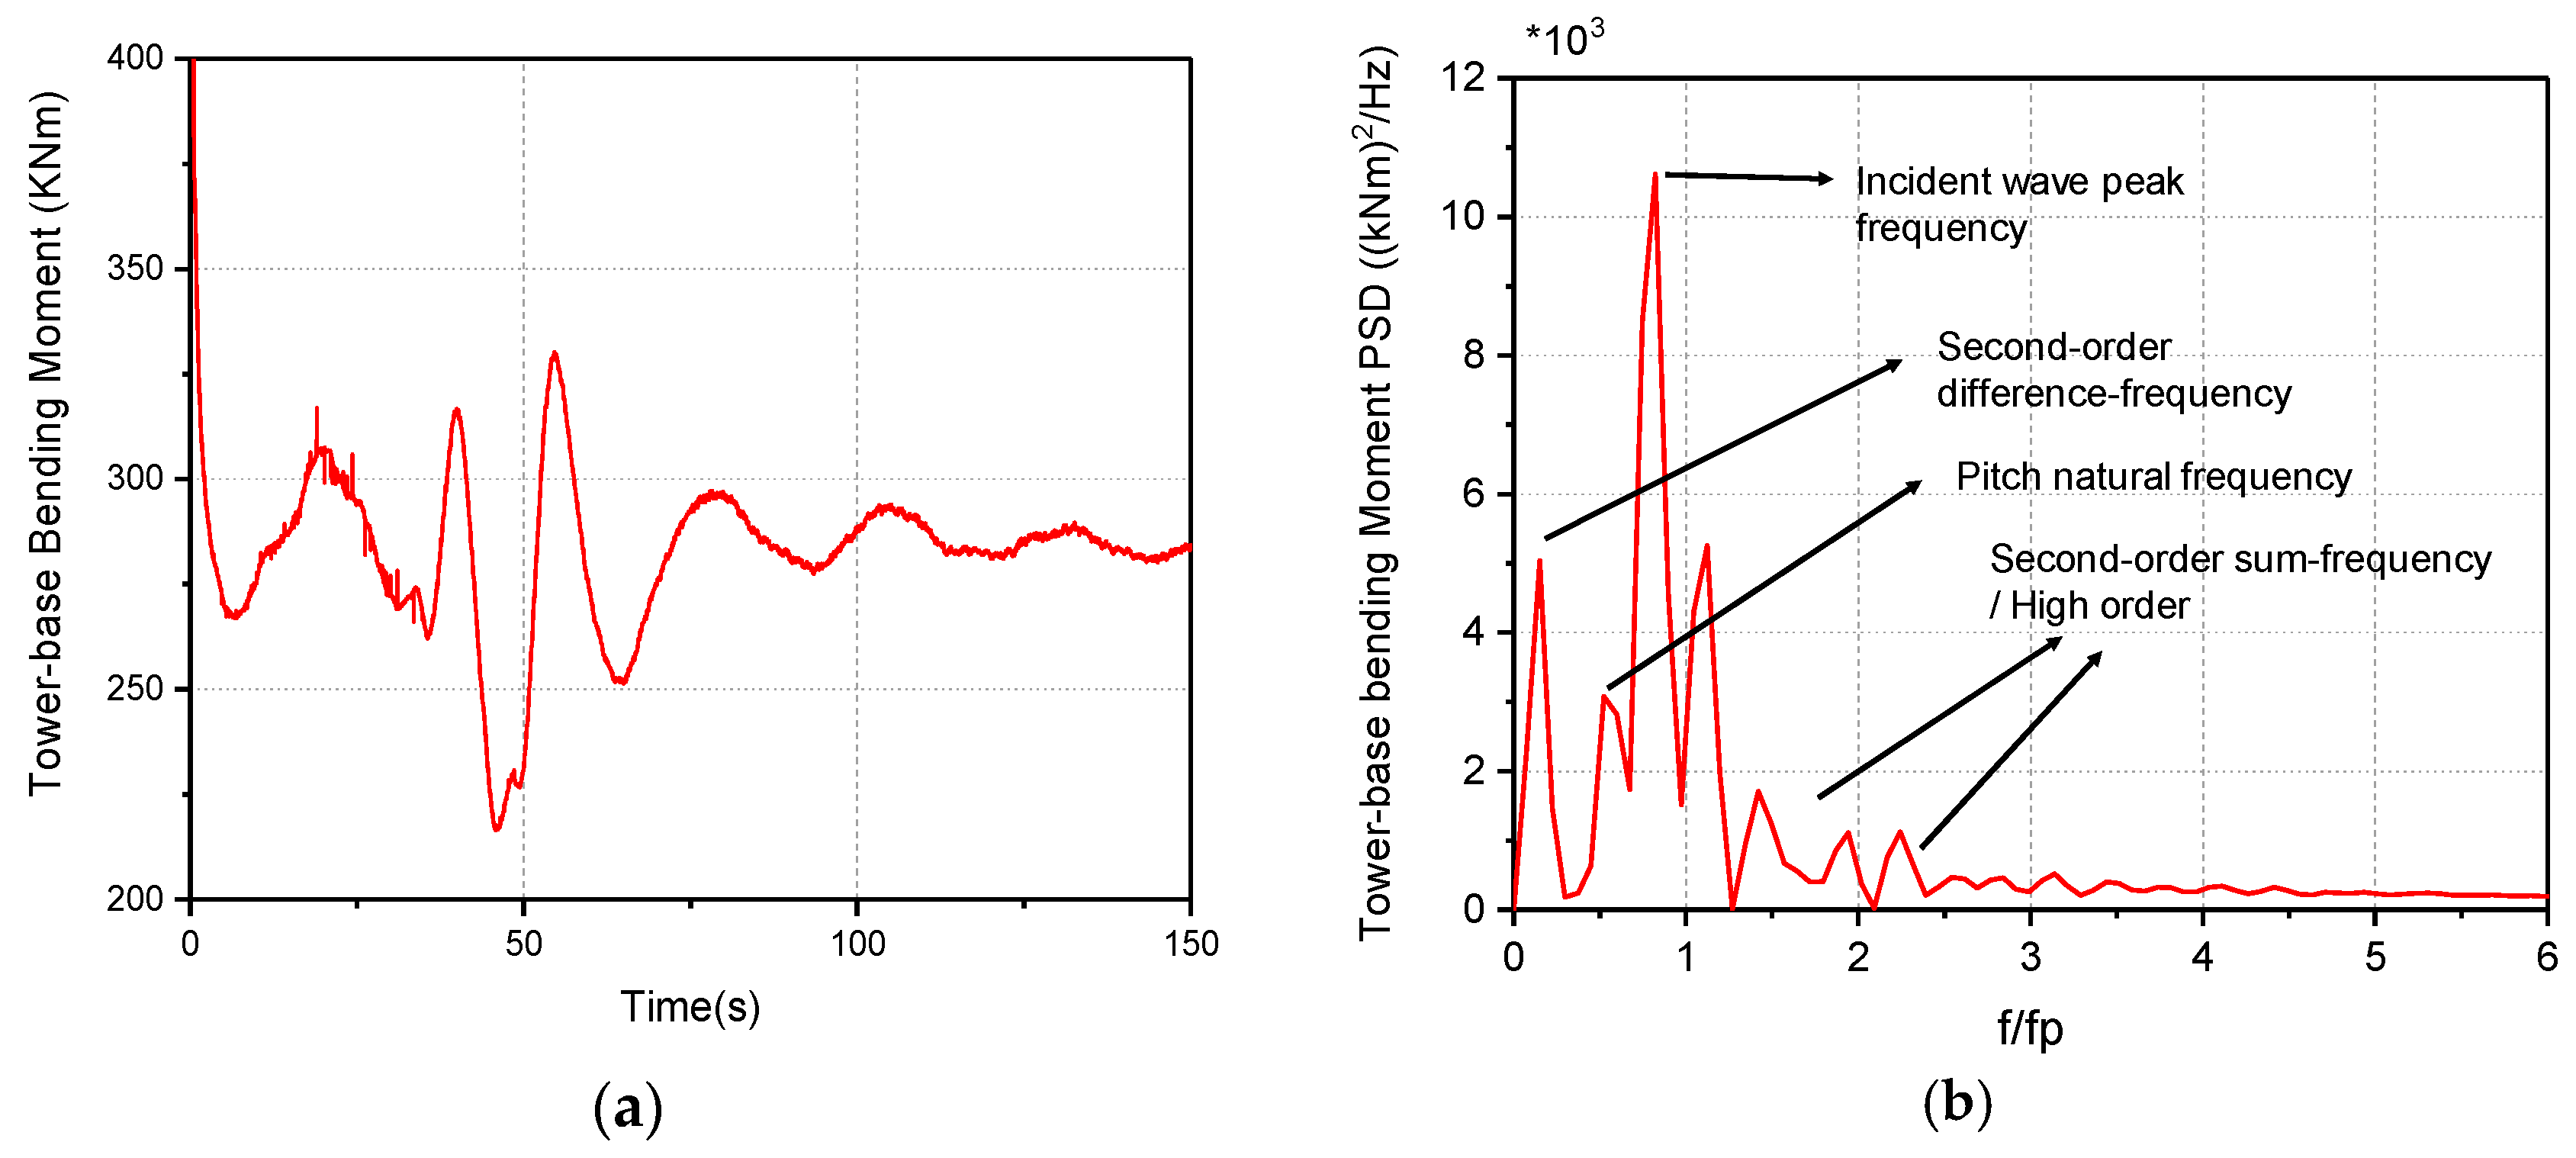
For the results with different wave steepness, the nonlinearity of the motion responses and hydrodynamic loadings becomes significant as the steepness increases, which is clearly indicated through both time and frequency domain analysis. By examining the wave surface elevation CFD contours and digital data, we observed the wave run-up at large wave steepness due to the wave overtopping under focused wave conditions. This further leads to the enhanced peaks of floating platform motion responses in surge, heave and pitch. A comparison between the results from focused waves and regular waves illustrates that, a focused wave causes more violent platform dynamic motions and larger loading than a regular wave. The examination of a parked NREL 5 MW with a maximum wave steepness and a constant wind speed at cut-off condition illustrates a complex unsteady flow field in the turbine wake. Both the tower bending moment and mooring tension loads present dynamic responses at several frequencies, corresponding to the first-order structural nature frequency, second-order and higher-order frequency, indicating the existence of system nonlinearity.
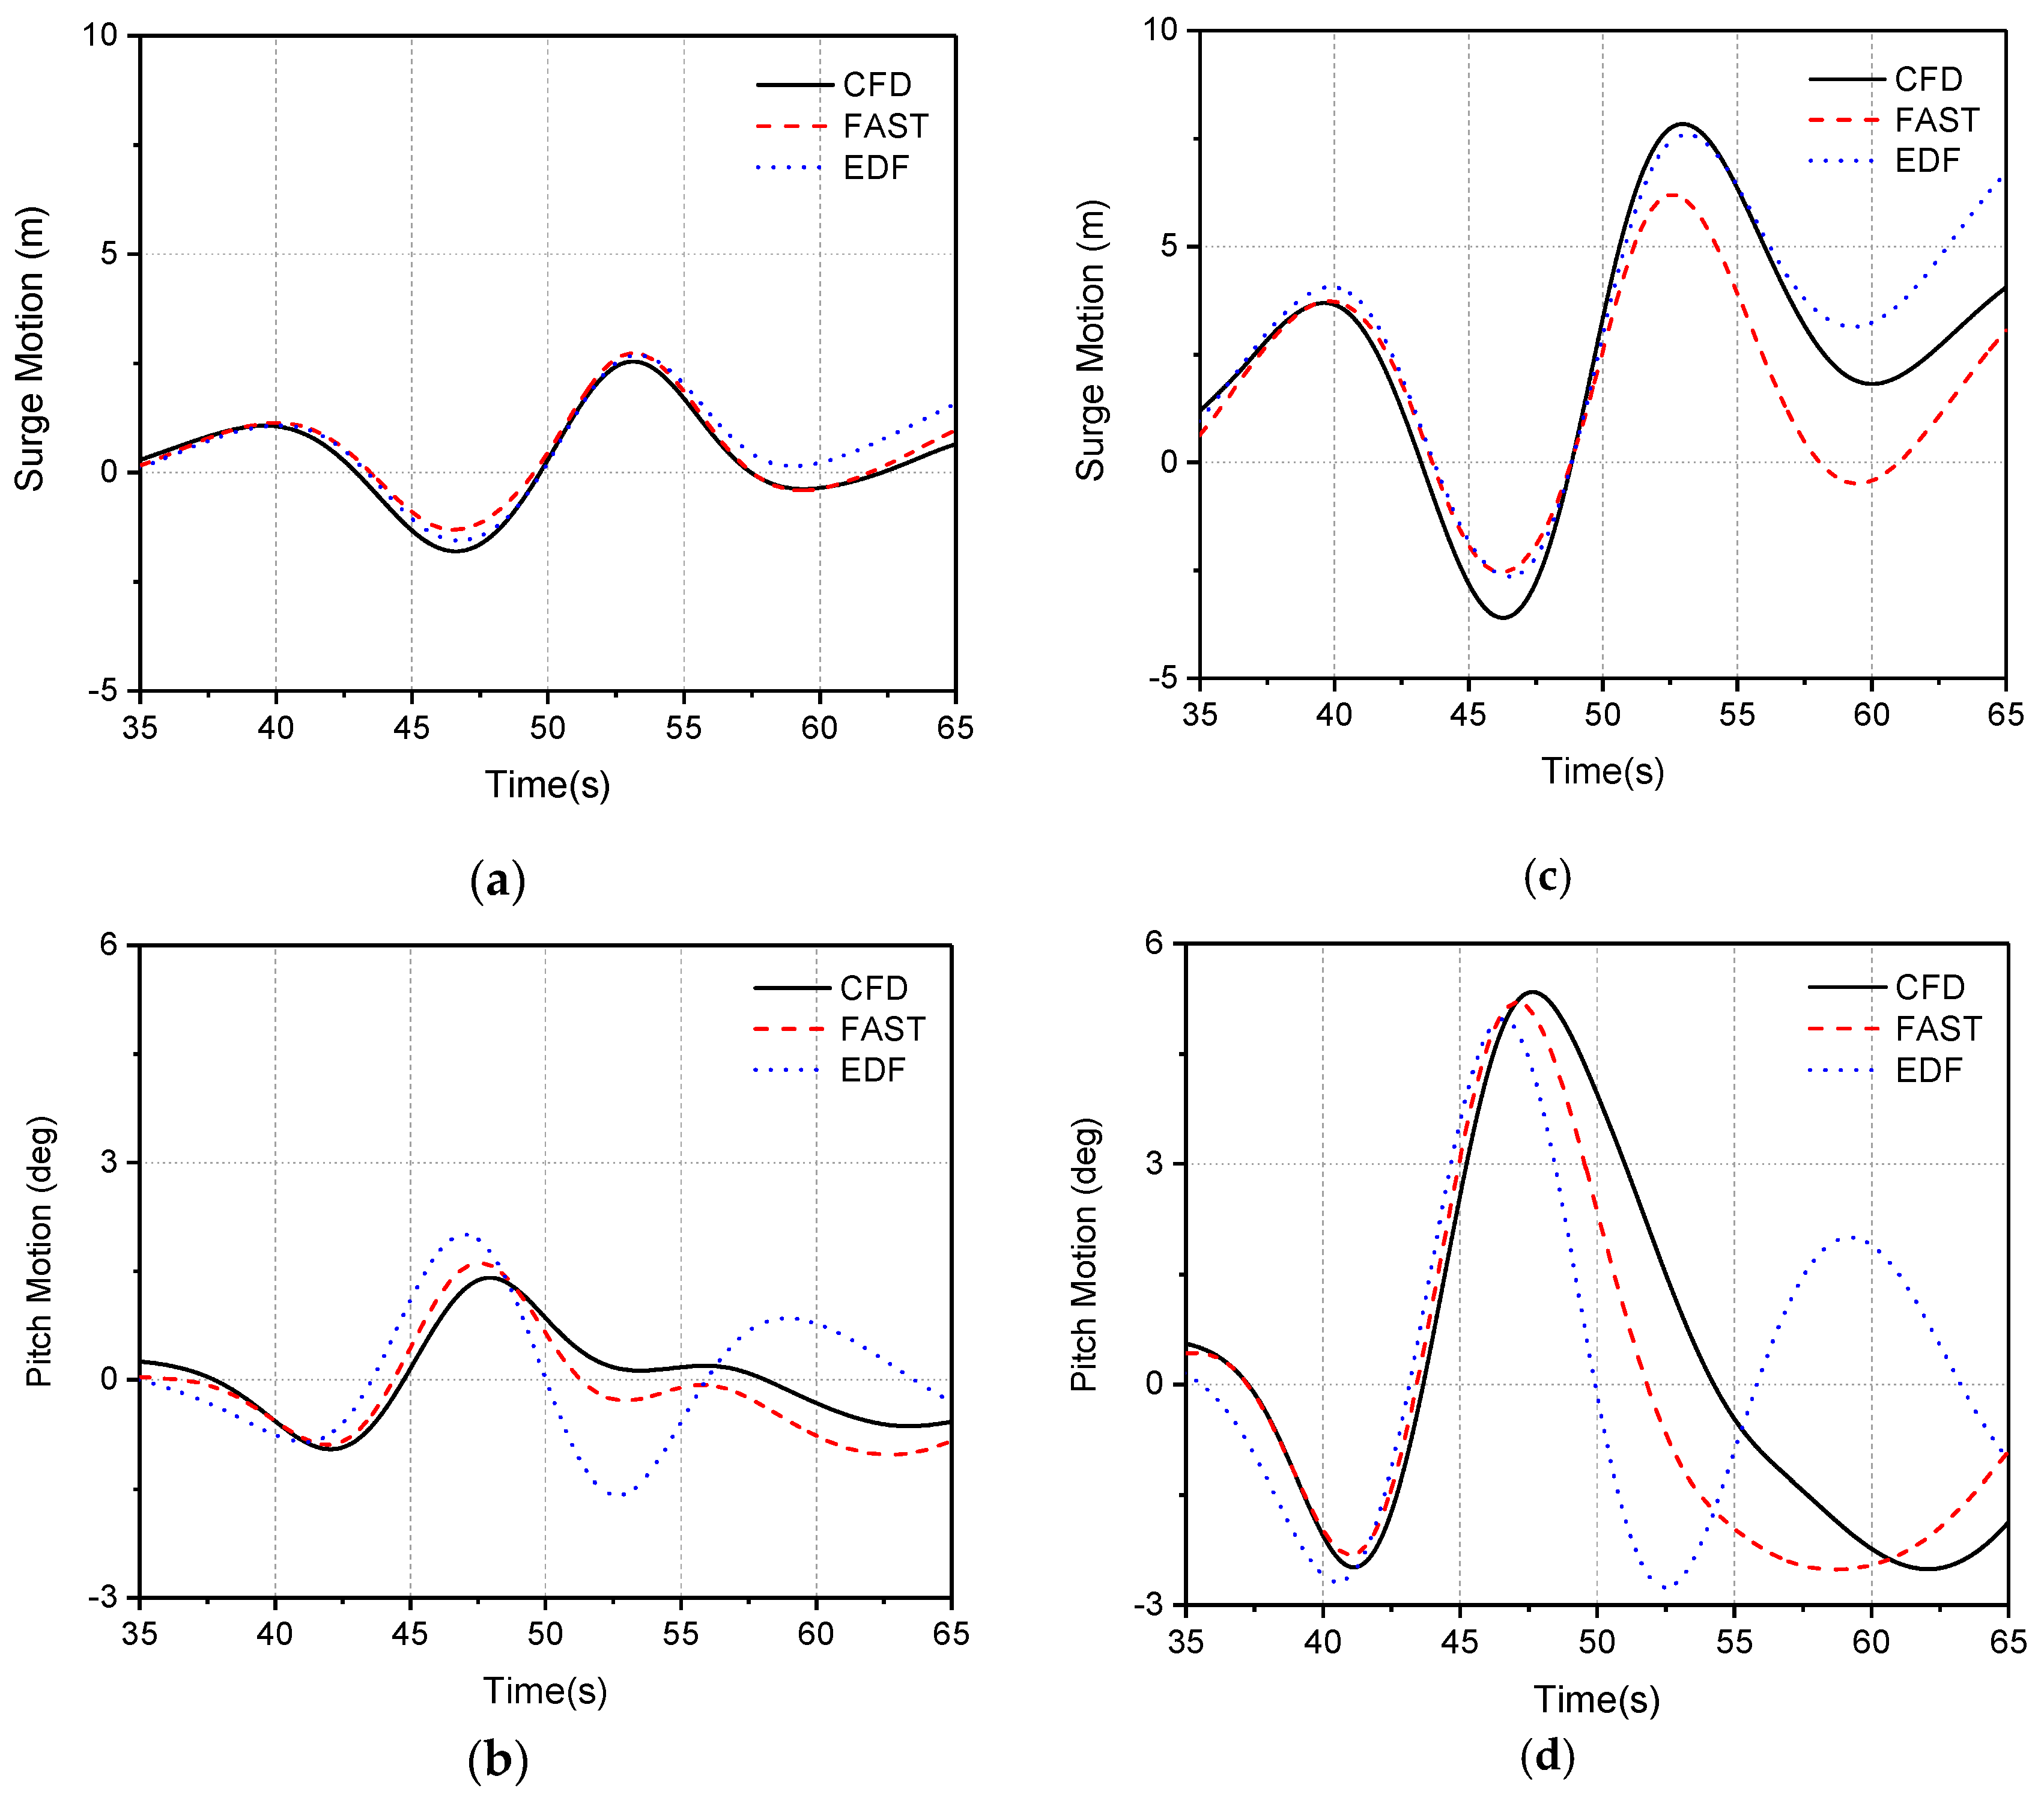
To justify the differences between the results obtained from a high fidelity CFD modelling and that from the reduced-order potential flow theory tools, we compare our results with those using EDF in-house potential flow code and NREL FAST. In general, the results are in agreement before the focused time; the difference becomes obvious after the focused time, and increases as the wave steepness increases. Again, this highlights the existence of disparities for the prediction of the high order hydrodynamic loads and the viscous effect due to the different methods used.

Author Contributions

Conceptualization, Y.Z., Q.X., Y.L., A.I. and C.P.; Methodology, Y.Z., Q.X., Y.L. and C.P.; Software, Y.Z., Y.L. and C.P.; Validation, Y.Z. and C.P.; Formal Analysis, Y.Z., Q.X. and C.P.; Investigation, Y.Z., Q.X., A.I. and C.P.; Resources, Q.X. and C.P.; Data Curation, Y.Z. and C.P.; Writing-Original Draft Preparation, Y.Z. and Q.X.; Writing-Review & Editing, Q.X., A.I., C.P., S.L., and G.P.; Visualization, Y.Z.; Supervision, Q.X., A.I., S.L. and G.P.; Project Administration, Q.X. and A.I.; Funding Acquisition, Q.X. and G.P.

Funding

This research is funded by Engineering and Physical Sciences Research Council (EP/P020267/1) and China Scholarship Council (201606290284).

Acknowledgments

Results were obtained using the Cirrus UK National Tier-2 HPC Service at EPCC (http://www.cirrus.ac.uk) funded by the University of Edinburgh and EPSRC (EP/P020267/1). Also, Results were obtained using the ARCHIE-WeSt High-Performance Computer (www.archie-west.ac.uk) based at the University of Strathclyde. The first author would like to thank China Scholarship Council (CSC) for financial support during his Ph.D. study in the UK.

Conflicts of Interest

The authors declare no conflict of interest.

References

  1. Coulling, A.J.; Goupee, A.J.; Robertson, A.N.; Jonkman, J.M.; Dagher, H.J. Validation of a FAST semi-submersible floating wind turbine numerical model with DeepCwind test data. J. Renew. Sustain. Energy 2013, 5, 023116. [Google Scholar] [CrossRef]
  2. Shin, H.; Kim, B.; Dam, P.T.; Jung, K. Motion of OC4 5MW semi-Submersible offshore wind turbine in irregular waves. In Proceedings of the ASME 2013 32nd International Conference on Ocean, Offshore and Arctic Engineering, OMAE 2013, Nantes, France, 9–14 June 2013; American Society of Mechanical Engineers: Nantes, France, 2013. [Google Scholar]
  3. Bredmose, H.; Mikkelsen, R.; Hansen, A.M.; Laugesen, R.; Heilskov, N.; Jensen, B.; Kirkegaard, J. In Experimental study of the DTU 10 MW wind turbine on a TLP floater in waves and wind. In Proceedings of the EWEA Offshore 2015 Conference, Copenhagen, Denmark, 10–12 March 2015. [Google Scholar]
  4. Müller, K.; Sandner, F.; Bredmose, H.; Azcona, J.; Manjock, A.; Pereira, R. Improved tank test procedures for scaled floating offshore wind turbines. In Proceedings of the IWEC 2014, Gold Coast, Australia, 1–5 December 2014. [Google Scholar]
  5. Jonkman, J.M.; Buhl, M.L., Jr. FAST User’s Guide; Technical Report No. NREL/EL-500-38230; National Renewable Energy Laboratory: Golden, CO, USA, 2005. [Google Scholar]
  6. Jonkman, J.; Butterfield, S.; Musial, W.; Scott, G. Definition of a 5-MW Reference Wind Turbine for Offshore System Development; National Renewable Energy Lab (NREL): Golden, CO, USA, 2009. [Google Scholar]
  7. Bowen, A.J.; Mortensen, N.G. Exploring the limits of WAsP the wind atlas analysis and application program. In Proceedings of the 1996 European Wind Energy Conference and Exhibition, Göteborg, Sweden, 20–24 May 1996; HS Stephens & Associates: Bedford, UK, 1996. [Google Scholar]
  8. Larsen, T.J.; Hansen, A.M. How 2 HAWC2, the User’s Manual; Risø National Laboratory: Roskilde, Denmark, 2007. [Google Scholar]
  9. Liu, Y.; Xiao, Q.; Incecik, A.; Peyrard, C. Aeroelastic analysis of a floating offshore wind turbine in platform-induced surge motion using a fully coupled CFD-MBD method. Wind Energy 2018. [Google Scholar] [CrossRef]
  10. Cheng, P.; Huang, Y.; Wan, D. A numerical model for fully coupled aero-hydrodynamic analysis of floating offshore wind turbine. Ocean Eng. 2019, 173, 183–196. [Google Scholar] [CrossRef]
  11. Liu, Y.; Xiao, Q.; Incecik, A.; Peyrard, C.; Wan, D. Establishing a fully coupled CFD analysis tool for floating offshore wind turbines. Renew. Energy 2017, 112, 280–301. [Google Scholar] [CrossRef] [Green Version]
  12. Robertson, A.; Jonkman, J.; Masciola, M.; Song, H.; Goupee, A.; Coulling, A.; Luan, C. Definition of the Semisubmersible Floating System for Phase II of OC4; National Renewable Energy Lab (NREL): Golden, CO, USA, 2014. [Google Scholar]
  13. Tran, T.T.; Kim, D.-H. Fully coupled aero-hydrodynamic analysis of a semi-submersible FOWT using a dynamic fluid body interaction approach. Renew. Energy 2016, 92, 244–261. [Google Scholar] [CrossRef]
  14. Liu, Y. A CFD Study of Fluid-Structure Interaction Problems for Floating Offshore Wind Turbines. Ph.D. Thesis, University of Strathclyde, Glasgow, Scotland, 2018. [Google Scholar]
  15. 1Nematbakhsh, A.; Olinger, D.; Tryggvason, G. Nonlinear simulation of a spar buoy floating wind turbine under extreme ocean conditions. J. Renew. Sustain. Energy 2014, 6, 033121. [Google Scholar] [CrossRef]
  16. Gao, N.; Yang, J.; Tian, X.; Li, X. A numerical study on the nonlinear effects in focused wave modelling and forces on a semi-submerged horizontal cylinder. Ships Offshore Struct. 2016, 12, 474–485. [Google Scholar] [CrossRef]
  17. Roy, S.; Ghosh, V.; Dey, S.; Vimmadi, S.; Banik, A. A coupled analysis of motion and structural responses for an offshore spar platform in irregular waves. Ships Offshore Struct. 2017, 12 (Suppl. 1), S296–S304. [Google Scholar] [CrossRef]
  18. Dysthe, K.; Krogstad, H.E.; Müller, P. Oceanic rogue waves. Annu. Rev. Fluid Mech. 2008, 40, 287–310. [Google Scholar] [CrossRef]
  19. Khait, A.; Shemer, L. Nonlinear wave generation by a wavemaker in deep to intermediate water depth. Ocean Eng. 2019, 182, 222–234. [Google Scholar] [CrossRef]
  20. Deng, Y.; Yang, J.; Zhao, W.; Xiao, L.; Li, X. Surge motion of a semi-submersible in freak waves. Ships Offshore Struct. 2016, 12, 443–451. [Google Scholar] [CrossRef]
  21. Baldock, T.; Swan, C.; Taylor, P. A laboratory study of nonlinear surface waves on water. Phil. Trans. R. Soc. Lond. A 1996, 354, 649–676. [Google Scholar] [Green Version]
  22. Mai, T.; Greaves, D.; Raby, A.; Taylor, P.H. Physical modelling of wave scattering around fixed FPSO-shaped bodies. Appl. Ocean Res. 2016, 61, 115–129. [Google Scholar] [CrossRef]
  23. Zhao, X.; Hu, C. Numerical and experimental study on a 2-D floating body under extreme wave conditions. Appl. Ocean Res. 2012, 35, 1–13. [Google Scholar] [CrossRef]
  24. Antonutti, R.; Peyrard, C.; Johanning, L.; Incecik, A.; Ingram, D. The effects of wind-induced inclination on the dynamics of semi-submersible floating wind turbines in the time domain. Renew. Energy 2016, 88, 83–94. [Google Scholar] [CrossRef] [Green Version]
  25. Hirt, C.W.; Nichols, B.D. Volume of fluid (VOF) method for the dynamics of free boundaries. J. Comput. Phys. 1981, 39, 201–225. [Google Scholar] [CrossRef]
  26. Menter, F.R. Review of the shear-stress transport turbulence model experience from an industrial perspective. Int. J. Comput. Fluid Dyn. 2009, 23, 305–316. [Google Scholar] [CrossRef]
  27. Finnegan, W.; Goggins, J. Numerical simulation of linear water waves and wave–structure interaction. Ocean Eng. 2012, 43, 23–31. [Google Scholar] [CrossRef]
  28. Jacobsen, N.G.; Fuhrman, D.R.; Fredse, J. A wave generation toolbox for the open-source libradry: OpenFOAM. Int. J. Numer. Methods Fluid 2012, 70, 1073–1088. [Google Scholar] [CrossRef]
  29. Hasselmann, K.; Barnett, T.; Bouws, E.; Carlson, H.; Cartwright, D.; Enke, K.; Ewing, J.; Gienapp, H.; Hasselmann, D.; Kruseman, P. Measurements of Wind-Wave Growth and Swell Decay during the Joint North Sea Wave Project (JONSWAP); Ergänzungsheft 8-12; Deutches Hydrographisches Institut: Hamburg, Germany, 1973. [Google Scholar]
  30. OpenFOAM. The OpenFOAM Foundation Website. 2018. Available online: http://www.openfoam.org/.
  31. Li, Q.; Zhuang, Y.; Wan, D.; Chen, G. Numerical Analysis of the Interaction Between a Fixed FPSO Benchmark Model and Focused Waves. In Proceedings of the 28th International Ocean and Polar Engineering Conference, International Society of Offshore and Polar Engineers, Sapporo, Japan, 10–15 June 2018; p. 8. [Google Scholar]
  32. Antonutti, R.; Peyrard, C.; Incecik, A.; Ingram, D.; Johanning, L. Dynamic mooring simulation with Code_Aster with application to a floating wind turbine. Ocean Eng. 2018, 151, 366–377. [Google Scholar] [CrossRef] [Green Version]
  33. Babarit, A.; Delhommeau, G. Theoretical and numerical aspects of the open source BEM solver NEMOH. In Proceedings of the 11th European Wave and Tidal Energy Conference (EWTEC2015), Nantes, France, 6–11 September 2015. [Google Scholar]
  34. Xiong, H.; Yang, J.; Tian, X. An experimental study on the inline wave force on a truncated vertical cylinder. Ships Offshore Struct. 2015, 1–16. [Google Scholar] [CrossRef]
  35. Lwanowski, B.; Wemmenhove, R. CFD simulation of wave run-up on a semi-submersible and comparsion with experiment. In Proceedings of the 28th International Conference on Offshore Mechanics and Arctic Engineering, Honolulu, HI, USA, 31 May–5 June 2009; OMAE2009-79052. pp. 19–29. [Google Scholar]
  36. Van der Meer, J.W. Wave run-up and overtopping. In Dikes and Revetments; Routledge: London, UK, 2017; pp. 145–160. [Google Scholar]
  37. Roy, P.D.; Ranjan, R. Variation of Wave Force on Submerged Object at Shallow Water: Fourier Series Technique. Aquat. Procedia 2015, 4, 95–102. [Google Scholar] [CrossRef]
  38. Paulsen, B.T.; Bredmose, H.; Bingham, H.B.; Jacobsen, N.G. Forcing of a bottom-mounted circular cylinder by steep regular water waves at finite depth. J. Fluid Mech. 2014, 755, 1–34. [Google Scholar] [CrossRef]
  39. Grue, J.; Huseby, M. Higher-harmonic wave forces and ringing of vertical cylinders. Appl. Ocean Res. 2002, 24, 203–214. [Google Scholar] [CrossRef]
  40. Buchner, B. Green Water on Ship-Type Offshore Structures. Ph.D. Thesis, Delft University of Technology, Delft, The Netherlands, 2002. [Google Scholar]
  41. Zhou, Y. Investigation of focused wave impact on floating platform for offshore floating wind turbine-A CFD study. In Proceedings of the ASME 2019 38th International Conference on Ocean, Offshore and Arctic Engineering OMAE2019, Glasgow, Scotland, 9–14 June 2019. [Google Scholar]
Figure 1. Definition of the semi-submersible floating offshore wind system [12]: (a) OC4 DeepCwind semi-submersible platform; (b) NREL 5 MW semi-submersible floating offshore wind turbine.
Energies 12 03482 g001
Figure 2. Diagrams of the variation of α R ( χ R ) in relaxation zones (both inlet and outlet) during wave generation and damping calculation in Equation (8).
Energies 12 03482 g002
Figure 3. Sketch of the dynamic mooring line modelling.
Energies 12 03482 g003
Figure 4. Sketch of the computational domain in XOY plane used in the present study.
Energies 12 03482 g004
Figure 5. Computational mesh: (a) semi-submersible platform; (b) floating offshore wind turbine.
Energies 12 03482 g005
Figure 6. Mesh and time step convergence test of focused wave generation (Hs = 8.0 m, Tp = 15.0 s): (a) mesh density; (b) time step.
Energies 12 03482 g006
Figure 7. Layout of the test FPSO [22].
Energies 12 03482 g007
Figure 8. Wave elevation comparison at WG16 between experimental data [22], other CFD results [31] and present CFD results.
Energies 12 03482 g008
Figure 9. Free surface elevation around FPSO model: (a) wave tank test at t = 50.7 s; (b) present CFD at t = 51 s.
Energies 12 03482 g009
Figure 10. Force comparison in x, y, z directions for a fixed semi-submersible platform to regular wave (H = 6.0 m, T = 15.0 s).
Energies 12 03482 g010
Figure 11. Time history of wave elevation under focused wave with wave peak period Tp =15.0 s.
Energies 12 03482 g011
Figure 12. Dimensionless inline force under different wave steepness: (a) Focused wave (Cases 1 to Case 5 in Table 5) (b) Regular wave (Case 6 to Case 10 in Table 6).
Energies 12 03482 g012
Figure 13. Power spectral density analysis (PSD) and the dimensional inline force Fx under different wave steepness: (a) Fx under focused wave (Cases 1 to Case 5) (b) PSDs under focused wave (Case 1 to Case 5) (c) PSDs of higher-order under focused wave (Cases 1 to Case 5) (d) Fx under regular wave (Cases 6 to Case 10) (e) PSDs under regular wave (Case 6 to Case 10) (f) PSDs of higher-order under regular wave (Case 6 to Case 10).
Energies 12 03482 g013aEnergies 12 03482 g013b
Figure 14. Sketch of wave gauge settings for a fixed semi-submersible platform.
Energies 12 03482 g014
Figure 15. Wave elevation around a semi-submersible platform: (a) WG1 wave elevation under focused wave (Cases 1 to Case 5) (b) WG2 wave elevation under focused wave (Case 1 to Case 5) (c) WG3 wave elevation under focused wave (Cases 1 to Case 5) (d) Amplitude of wave run up under focused wave (Cases 1 to Case 5) (e) WG1 wave elevation under regular wave (Cases 6 to Case 10) (f) WG2 wave elevation under regular wave (Case 6 to Case 10) (g) WG3 wave elevation under regular wave (Case 6 to Case 10) (h) Amplitude of wave run up under regular wave (Cases 6 to Case 10).
Energies 12 03482 g015aEnergies 12 03482 g015b
Figure 16. Wave elevation contour plots around a fixed semi-submersible platform under focused wave (Hs = 14.7 m Tp = 15.0 s).
Energies 12 03482 g016
Figure 17. Wave elevation contour plots around a fixed semi-submersible platform under regular wave (H = 14.7 m, T = 15.0 s).
Energies 12 03482 g017
Figure 18. 3 DOF motions under different focused waves and regular waves: (a) Surge motion under focused wave (Cases 1 to Case 5) (b) Pitch motion under focused wave (Case 1 to Case 5) (c) Heave motion under focused wave (Cases 1 to Case 5) (d) Surge motion under regular wave (Cases 6 and Case 10) (e) Pitch motion under regular wave (Case 6 and Case 10) (f) Heave motion under regular wave (Case 6 and Case 10). To complement the study of wave steepness and platform dynamic motion responses, the peak values of three DoF motions are analysed from t = 35 s to 65 s (e.g., ±15 s near focused time); the results are summarized in Figure 19. Before the wave steepness H/λ = 0.074, we can see a linear relationship between H/λ vs. maximum motion response, revealing that floating platform dynamic response follows a linear variation with the increase of wave steepness. However, above H/λ = 0.074, the sudden changes of slop for H/λ vs. maximum motion lines can be observed, due to the presence of nonlinear phenomena such as the extra excitation induced by wave overtopping.
Energies 12 03482 g018
Figure 19. Maximum and minimum value of 3 DOF motion under different focused waves.
Energies 12 03482 g019
Figure 20. Wave elevation contour plots around a floating semi-submersible platform under focused wave (Hs = 14.7 m, Tp = 15.0 s).
Energies 12 03482 g020
Figure 21. Surge and pitch motion comparison between CFD and potential flow theory tools: (a) Surge motion (Hs = 6.0 m, Tp = 15.0 s) (b) Pitch motion (Hs = 6.0 m, Tp = 15.0 s) (c) Surge motion (Hs = 14.7 m, Tp = 15.0 s) (d) Pitch motion (Hs = 14.7 m, Tp = 15.0 s).
Energies 12 03482 g021
Figure 22. Inline force and PSDs of semi-submersible platform under different focused waves (Case 1 to Case 5) in floating semi-submersible platform simulations: (a) Dimensionless inline force F’ under focused wave (Cases 1 to Case 5) (b) Dimensional inline force Fx under focused wave (Case 1 to Case 5) (c) PSDs under focused wave (Cases 1 to Case 5) (d) Dimensionless inline force F’ under regular wave (Cases 6 and Case 10) (e) Dimensional inline force Fx under regular wave (Case 6 and Case 10) (f) PSDs under regular wave (Case 6 and Case 10).
Energies 12 03482 g022
Figure 23. Tension loads of line 1 and line 2 under different focused waves (Case 1 to Case 5): (a) Tension loads of Line 1 under focused wave (Cases 1 to Case 5) (b) Tension loads of Line 2 under focused wave (Case 1 to Case 5) (c) Tension loads of Line 1 under focused wave (Cases 6 and Case 10) (d) Tension loads of Line 2 under regular wave (Cases 6 and Case 10).
Energies 12 03482 g023
Figure 24. 3DoF motion response for a parked wind turbine under focused wave (Hs = 14.7 m, Tp = 15.0 s) and wind (U = 25 m/s): (a) time history of surge, heave and pitch; (b) PSDs of surge and pitch.
Energies 12 03482 g024
Figure 25. Inline force Fx and PSDs analysis for a parked wind turbine subject to focused wave: (a) inline force Fx; (b) PSDs of inline force.
Energies 12 03482 g025
Figure 26. Free surface elevation contours and Ux contour at XoZ plane around a parked FOWT near focused time.
Energies 12 03482 g026
Figure 27. Tension loads of Line 1 and Line 2 and PSDs analysis for a parked wind turbine subject to focused wave: (a) tension loads of mooring lines; (b) PSDs of tension loads.
Energies 12 03482 g027
Figure 28. Tower-base bending moment and PSDs analysis for a parked wind turbine subject to focused wave: (a) tower bending moment; (b) PSDs of tower bending moment.
Energies 12 03482 g028
Table 1. Gross properties of semi-submersible platform including the mooring system.
Platform Gross Properties
Platform mass, including ballast13,444,000 kg
Displacement13,986.8 m3
Platform pitch inertia about centre of mass8.011 × 109 kgm2
Platform yaw inertia about centre of mass1.391 × 109 kgm2
Platform roll inertia about centre of mass8.011 × 109 kgm2
Mooring Line Properties
Number of mooring lines3
Angle between adjacent lines120°
Depth of anchors below SWL (water depth)200 m
Upstretched mooring line length835.5 m
Radius to anchors from platform centreline837.6 m
Mooring line diameter0.0766 m
Wind Turbine Properties
Rotor configuration3 blades
Rotor, hub diameter126.0 m, 3.0 m
Hub height about SWL90.0 m
Total tower-top mass397,160 kg
Blade mass16,450 kg
Blade length61.5 m
Cut in, rated, cut-off speed3 m/s, 11.4 m/s, 25.0 m/s
Table 2. Mesh configuration of 3 mesh density under the focused wave.
RefinementCoarseMediumFine
X axisΔx = L/100Δx = L/125Δx = L/150
Z axis Δz = Hs/10Δz = Hs/15Δz = Hs/20
Slenderness Ratio4.3755.2505.830
(Hs = 8.0 m Tp = 15.0 s) and Δt = 0.005 s.
Table 3. Mesh sensitivity test under different mesh sizes.
GridCoarseMediumFine
Maximum wave height (m)8.89 (+1.13%)8.90 (+1.25%)8.79
Trough to trough period (s)10.71 (−0.10%)10.72 (0.00%)10.72
(Hs = 8.0 m Tp = 15.0 s) and Δt = 0.005 s.
Table 4. Time step sensitivity study (medium mesh).
Time Step0.01 s0.005 s0.002 s0.001 s
Maximum wave height (m)8.82 (−1.89%)8.90 (−1.00%)8.95 (−0.44%)8.99
Trough to trough period (s)10.71 (−0.10%)10.72 (0.00%)10.73 (+0.10%)10.72
Table 5. Focused wave parameters with incident wave peak period Tp = 15.0 s.
12345
Hs (m)6.08.010.012.014.7
Tp (s)15.015.015.015.015.0
Hmax (m)6.778.8911.1413.2915.72
THmax (s)10.7210.7210.7210.7210.72
Steepness (H/λ)0.03770.04960.06220.07420.0878
Table 6. Regular wave parameters with incident wave period T = 15.0 s.
Case678910
H (m)6.08.010.012.014.7
T (s)15.015.015.015.015.0
Steepness (H/λ)0.01710.02280.02850.03430.0420
Table 7. Nonlinearity of regular wave.
Wave Height H (m)6.08.010.012.014.7
P1Linear (1016) N2/Hz1.642.824.216.079.31
P22nd Order (1014) N2/Hz1.034.3510.3321.4833.57
P2/P110−20.621.542.443.523.59

