1. Introduction
Charging stations or other types of energy storages need organization when they are used for special targets. Considering the grid’s situation, an organized program should cover the supply and demand needs of the grid. Supply needs, such as low loss operation without side effects, and demand needs, such as abundance in the charge station, low cost, and increased power quality, are required to be fulfilled. All of these needs and similar problems, issues or remodeling methods have created a basis to providing organization for electric vehicles (EV) charge stations. Factors, such as societal, populace, grid infrastructure, and renewable conditions [
1], critical power range, and financial analysis of a location, play important roles in determining the grid condition. However, supply/demand power and coordination, and the estimation of equipment is the telling factor, which needs focus to meet the incessant load demand.
The estimation of power, especially on the demand side of the grid, is very difficult [
2]. Increasing or decreasing the rate of grid power does not go on determined patents, such as battery open circuit voltage estimation by Extended Kalman Filter (EKF) or similar estimation operations [
3]. Supply/demand and coordinating for EVs charge station estimations have a lot in common, so they can contribute to an increase in power quality in the grid, directly when the grid infrastructure is ready. The benefits of this work are not limited to some factors, such as the decrease in green-house gas (GHG) emissions. Fuel transmission between oil refineries to gas stations consume electric power, especially in gas stations where compressed natural gas (CNG) stations use electric convertors. At present, too many researchers are trying to create and optimize algorithms to harvest fine results, but the methods and algorithms should be fed by trustworthy numerical data. In addition, the experiments are to be simulated using simulation software, such as MATLAB. In one Finnish study, to meet Finland’s target of 100% renewable energy usage by 2050’s (funded and presented by Ministry of Economy and Employment), the research on Energy PLAN (created by Aalborg University) modelling has focused on energy potential and generation from a perspective of economy, the rate of fuel usage, and CO
2 emission according to decrease in GHG emission policy [
4]. The result of this investigation shows that the energy future, based on 100% renewable energy, is entirely possible. In another study focused on Delhi, India’s energy sector, the Japanese Society for the Promotion of Science (JSPS) investigated the future of energy and its optimization methods in Delhi. Their study found that integrated-systematic modelling should be used for energy flow in urban energy systems. They have used an optimal energy scenario and found an energy gap between supply and demand. This research paid attention to government energy policy in improving the demand side of their energy sector [
5]. However, government policy and social behavior strongly influence the GHG emission in the transportation sector, in many countries, such as Austria [
5]. The emission of CO
2 is one of the primary problems in China and the CO
2 condition will be in 2030 with the use of control or uncontrolled EVs, V2G and similar transportation systems. Studies have shown that the application of these transportation systems provide advantages, such as decreasing peak load, which is used for EV charging; generating power from renewable energy sources (RES); and reducing energy generation and EV charging costs [
6]. Some of the literature has focused on the distance of charge stations with respect to the most capable grids. A Taiwanese study looked into helping customers receive better service from the grid by creating charge stations at reasonable distances in Taiwan [
7]. Therefore, it is possible to determine probable locations for EV charging stations, based on the grid and transportation technology of the time, rather than based on any specific algorithm.
Several algorithm-based research are still used in smart grid and V2G operations for special conditions or purposes which are explained below. One study focused on uncertain situations with respect to V2G operation pricing, using the robust game-theory to treat uncertain issues. This algorithm was named ENTRUST (Energy Trading under Uncertainty in Smart Grid Systems) [
8]. This study achieved reliability and cost efficiency in terms of energy management. Another grid lead system is known as multi-agent energy management. In this system, all elements of demand side of the grid (home, building, industries, and vehicles) are connected. It can improve autonomy, connectivity, diversity, and appearance of the systems in the grid. Another study in Great Britain (GB) [
9], created a dynamic virtual energy storage systems (VESS) to solve the dynamic frequency response. This model uses V2G and similar technology storages to notify grid whenever it needs emergency energy or whenever the rhythm of the energy flow has been disturbed. This model considered the response capacity of an EVs cluster. Researchers have furthermore developed some algorithms for EV charge stations, including the flow refueling location model (FRLM) [
10] maximum covering location problem (MCLP) [
11], nonlinear auto-regressive (NAR) [
12], Genetic Algorithm (GA) [
13], Genetic Algorithm-particle swarm optimization (GA-PSO) [
14], and Genetic Algorithm-binary particle swarm optimization (GA-BPSO) [
15].
Each research has coordinated points by special parameters, which is the dominant factor in supporting the system objectives. Previously described models, scenarios, and algorithms are the key to managing the grid and to increasing responsibility for EVs, charge stations and interconnected storage. The coordination of EV charging stations at first sight needs these methods to solve some pre-requisites. This paper considers Ankara’s metropolitan electric infrastructure and the conditions dependent on Ankara’s electricity infrastructure to determine potential locations for the charging stations. In Ankara’s case, the grid has not been updated to be smart enough to include online sensors, which may be used in determined algorithms. This study attempts to determine the location by specifications of the grid infrastructure, categorizing the capacity of transformers and their other parameters. A method, based on the Genetic Algorithm is designed to verify the probability of a location meeting the requirement is shown.
The rest of the paper is organized as follows.
Section 2 discusses the case study, particularly considering four locations in Ankara.
Section 3 takes grids in Ankara in consideration to nominate them as the station location.
Section 4 brings transformers into inspection by delineating several parameters to select transformers capable of matching the EV application.
Section 5 presents the corresponding transformer indices and parameters to aid the selection process. Considering this framework, the layout of the estimation algorithm with respect to the Genetic Algorithm is explained in
Section 6. Finally, conclusions are drawn in
Section 7.
2. Case Study
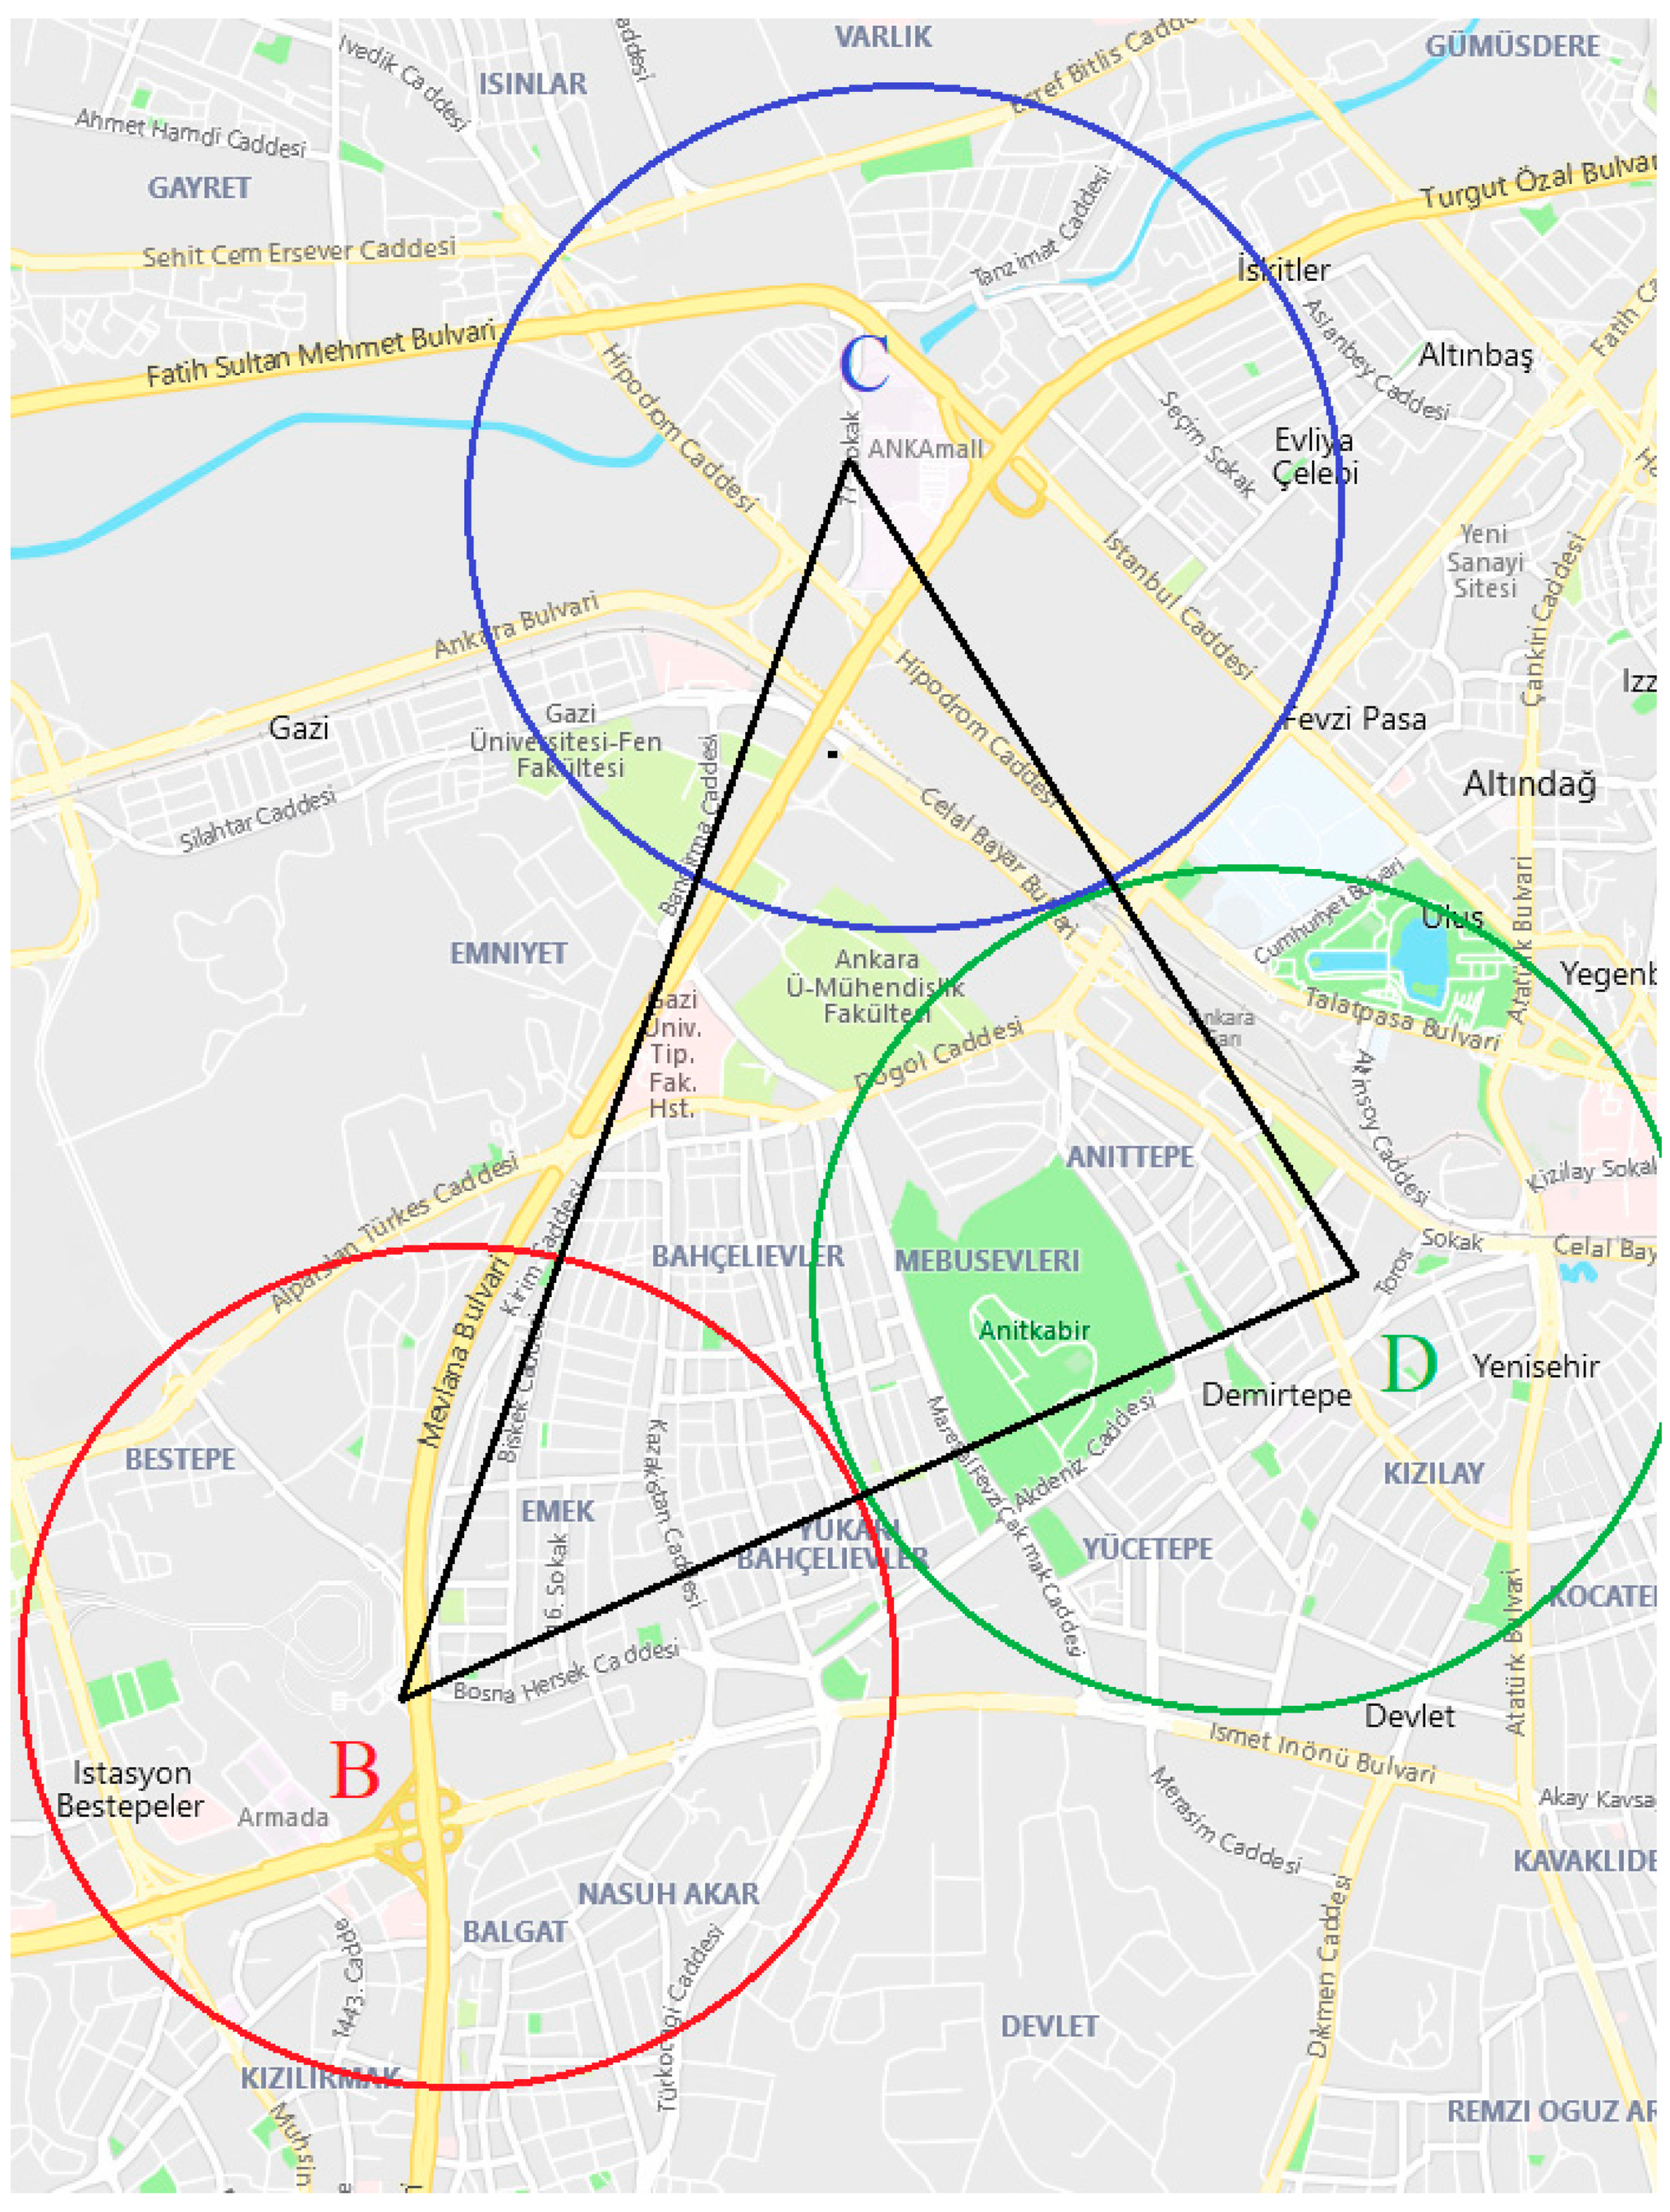
In this paper, four transformer centers have been considered at the start/end points, which are supplied by A point and finally used by D point. Each point has been analyzed by their maintenance history and current peak load point. Transformer maintenance history and current peak load point can illustrate most of their qualities. This research attempts to create a defined glance to recognize points, which are necessary for determining the location of EV charging stations, that can help to build a connection with the grid plan. In the next sections, the proposed solution for determining the coordination of EV charging stations will be elaborated with examples. Ankara metropolitan electricity grid is one of the real cases to study, indicating important parameters, when the grid should be ready to supply electric vehicle and storages.
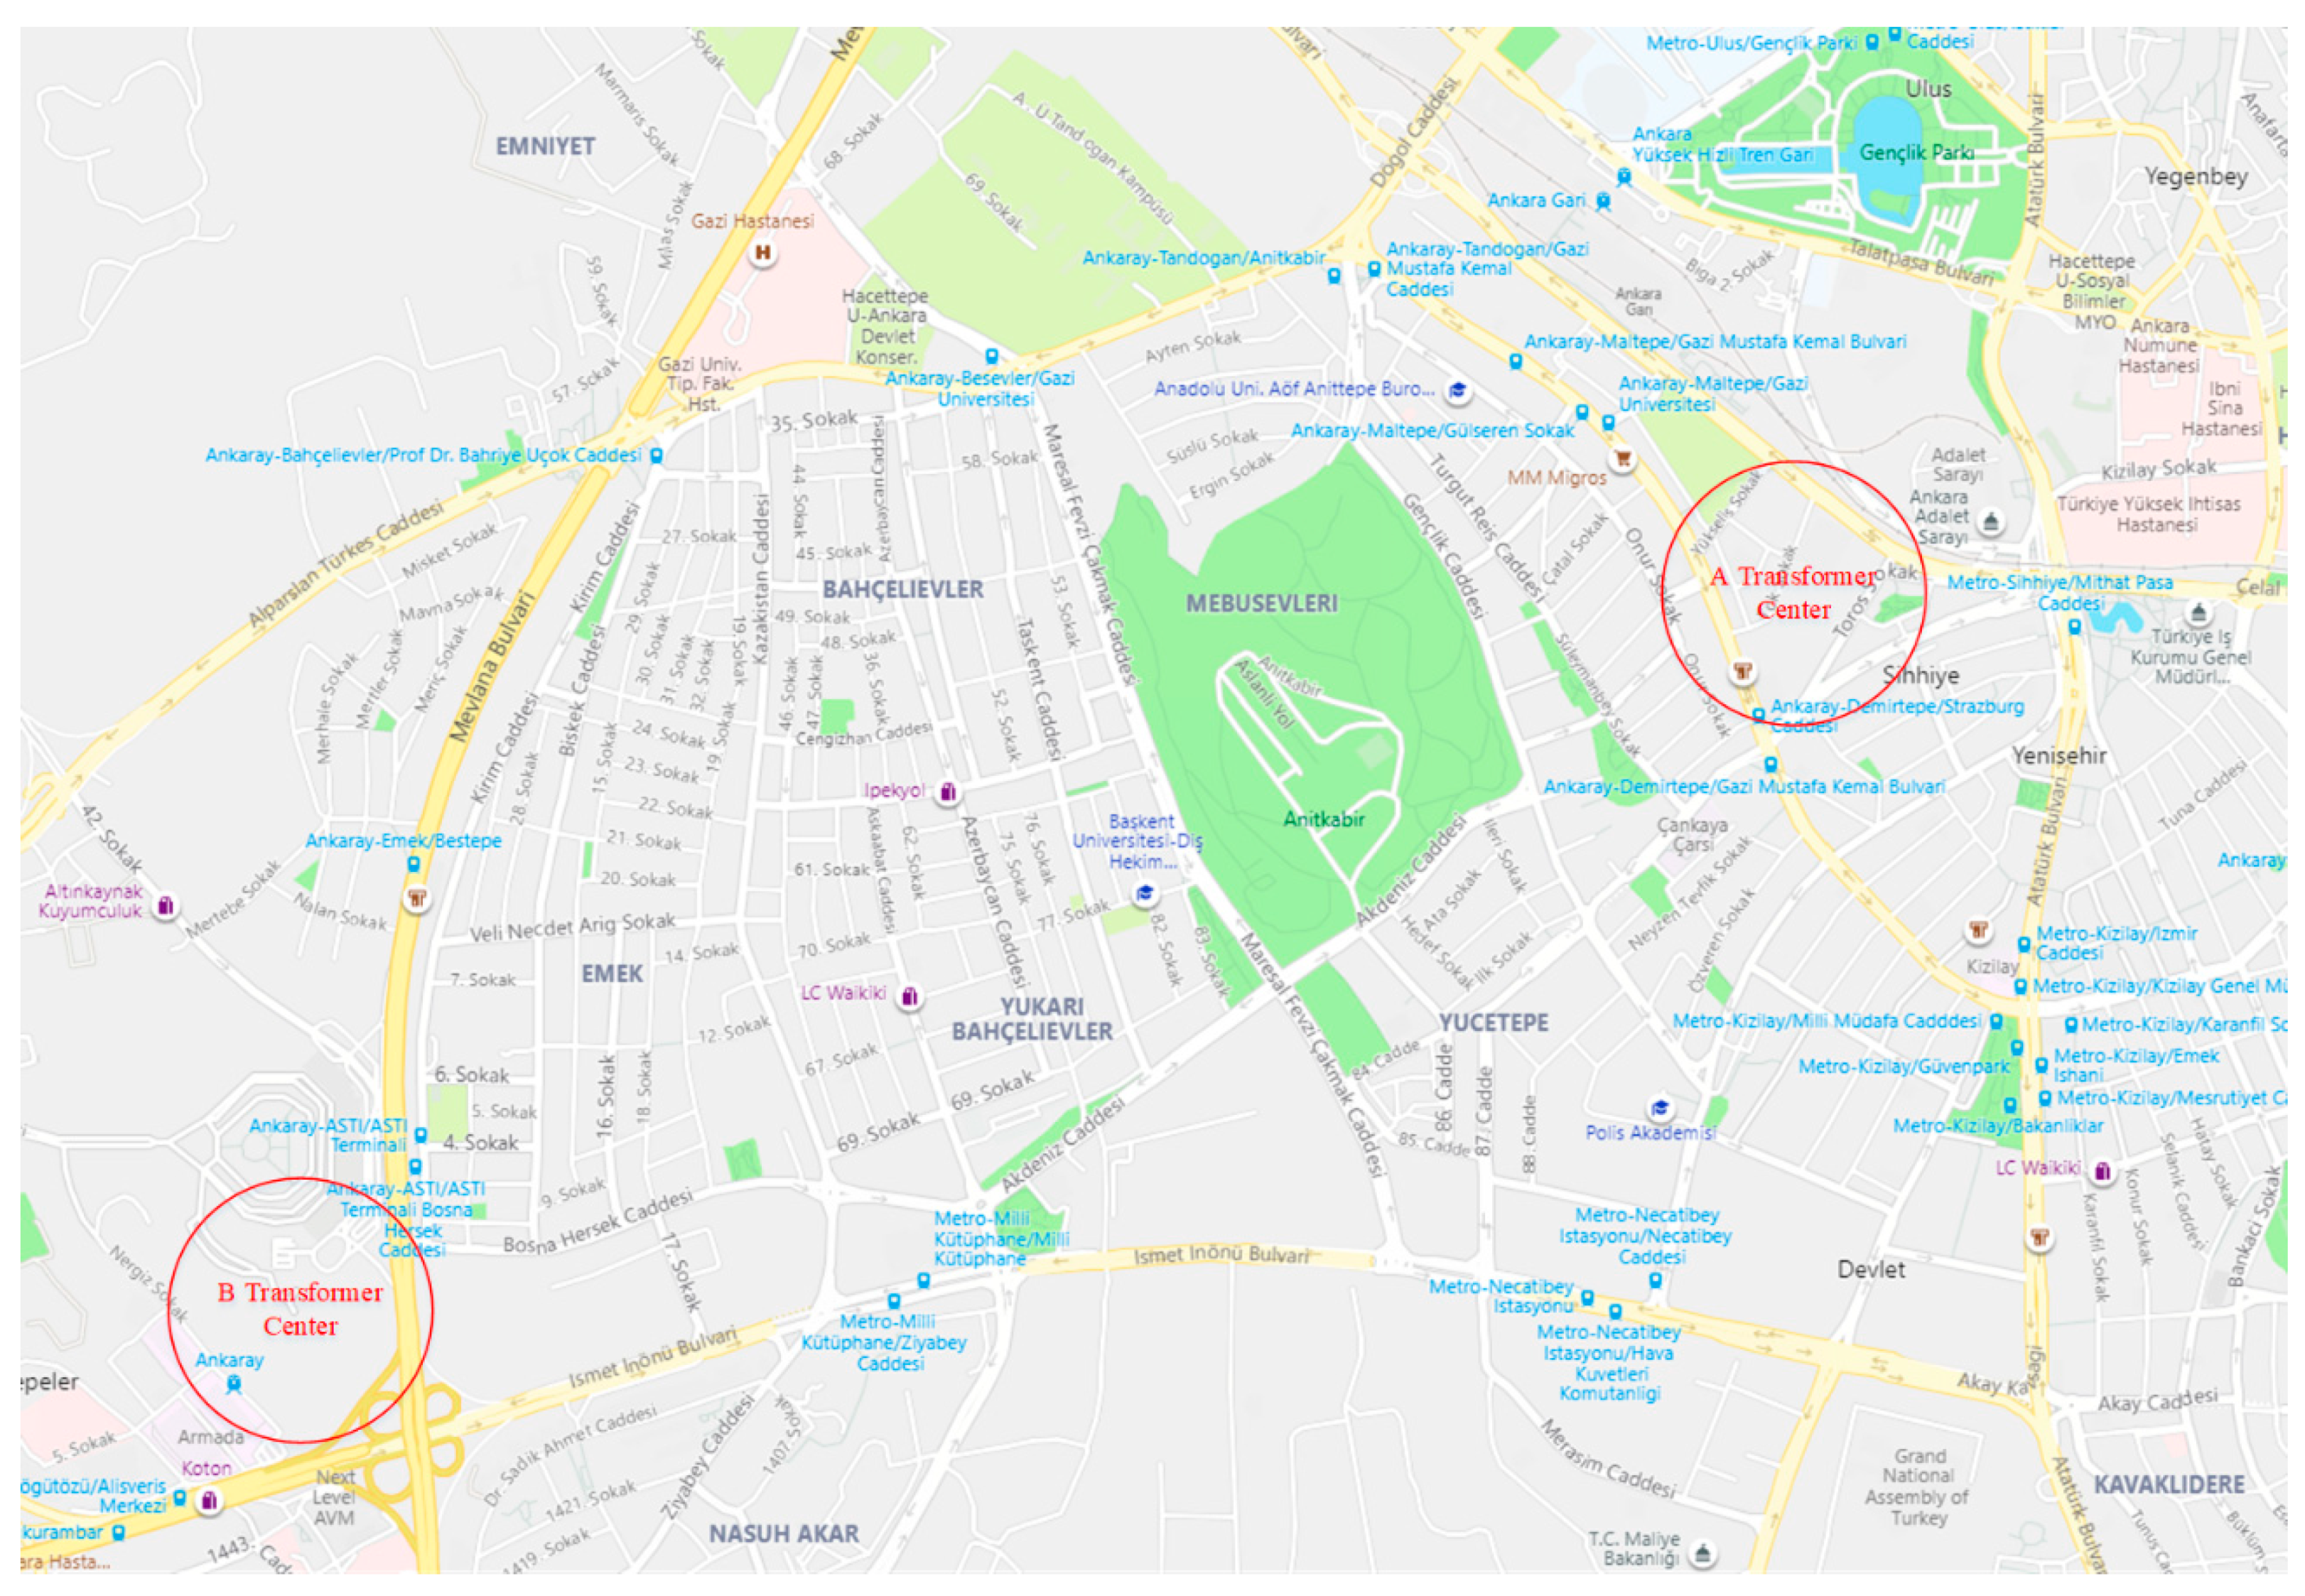
As demonstrated in the literature, the categories of charging stations distance can change quality of power, service, cost and EVs technology acceptance ratio between members of society. The range of charging stations were determined by various items, such as the grid infrastructure and existing EVs going around. Additionally if the grid does not use charging stations, some locations should be determined by other specifications. These can be different in each grid and depends on the grid’s condition. According to the previously mentioned information and Ankara metropolitan electricity infrastructure, the distance of grid terminals and power capacity are critical points in the coordination of electric vehicle charge station topic. A city’s transportation routes are different from the route of the power transmission grid and each location has specific power capacity details. In the first step, designers must select locations like points or places, which have the lowest distance to electricity terminals and are suitable for transportation systems. The goal is to measure energy, and responsibility for supply and demand. For example, two different points in Ankara have been assessed - the A and B transformer centers. Both of them are on main and crowded streets, but the A transformer center’s condition makes it more operational than the B transformer center. This is, because the A transformer center is close to downtown where the main transportation terminals, such as buses and trains are localized. Whereas 1~2 km from downtown, metro, terminals and location of transformer A and B have many free spaces, parking, schools, hospitals and ministries. It seems that in this area, a large amount of vehicles are stationary and this can be potentially beneficial. In contrast, the B transformer center does not have those options, and because of this, the B transformer center loses its priority to build a charging station.
Figure 1 has given the locations of both transformer centers and a map of Ankara for clarity.
Location EV charge station points should be categorized by reasonable distances such as 30, 35, 40, 45, and 50 km, depending on area and infrastructure condition. In the mentioned case, the grid conditions were analyzed, based on the transformer status, even though there was no pre-defined storage center or organized charge station. This indicates that transformer specifications could provide prospective information to evaluate the likelihood of charging stations.
4. Transformer Selection
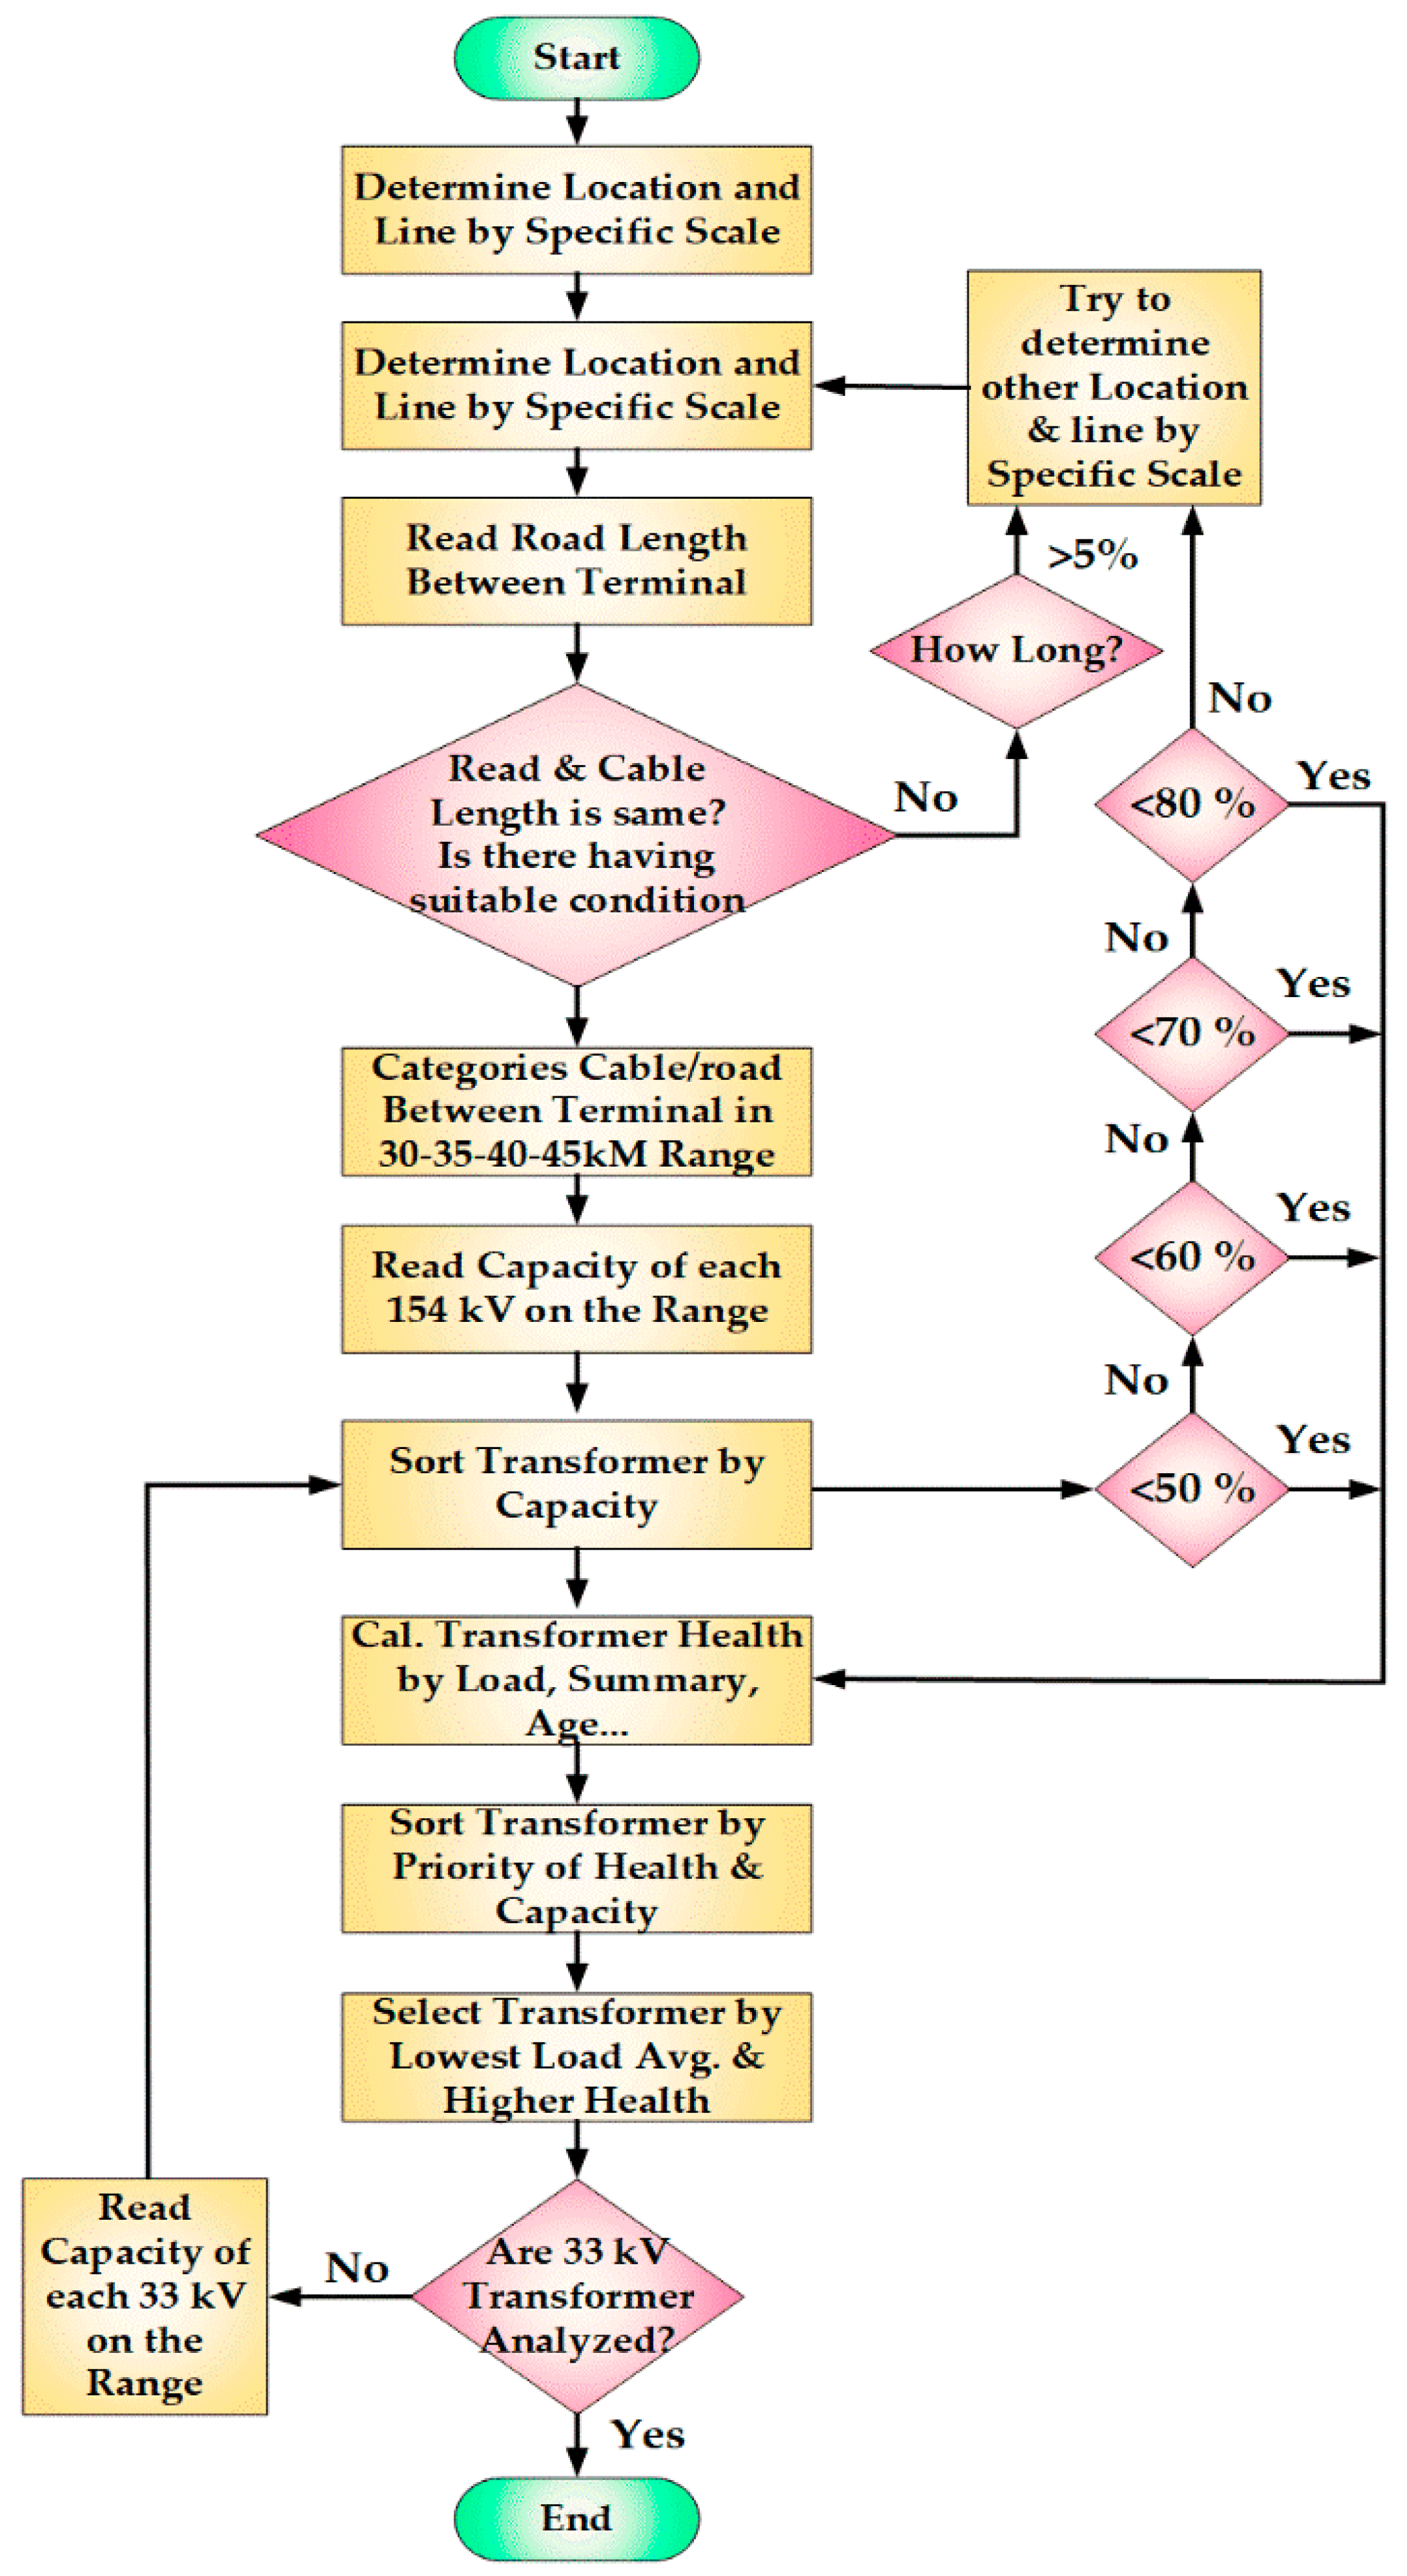
Transformers are the last operational part of the grid, which directly influence the quality of the grid and charge stations. Generally, all ranges of grid transformers are influenced by storages, such as charging stations or grid independent storages. Low- and mid-range transformers in the grid receive high impact from power electronic equipment, but they need support from high voltage transformers. Some transformer parameters depend on their own operational period, which cannot be determined in routine ways. The capacity of distribution in transformers has the potential to determine the necessary variables in the grid, related to financial problems, aging, health, and their priorities. Hence in this algorithm, the capacity and related problems have a higher priority. Low capacity or overload is the first step in system failure. Overload in electric equipment, like transformers, cause severe faults in the grid. In the second step, it causes a nonlinear increase in the transformers’ temperature [
19]. One of the regular solutions to solve these problems is by decreasing or changing the load pattern according to different grid specifications [
20]. Transformers should be sorted according to their capacity. The flow chart of sorting is shown in
Figure 3.
The purpose is to determine high priority transformers in the grid. By changing the timeslot in the Grid Valley filling technology [
21], grid demand level, load factor, and transformer aging have been changed at a reasonable scales. It can reduce load about 4~5 GW in a scenario and ambient transformers temperature 1.06~1.64% instead 52~100% in 50 kVA transformers and 200 °C temperature rate. Consequently, transformer aging is influenced with these statistics, where it has changed 17~18 factors, instead of 17~96. Another study has illustrated that EVs generate overload and shape impulses. Such grid problems have been solved through timetable changes and transformer hierarchy, as shown by MATLAB V9.5 software [
22,
23]. The solving method can change in each location, depending on related problem conditions, therefore, there (There will be various conditions at hand). The smart grid transmission and distribution costs are very important and have been influential in the other side of the grid. The function of transmission and distribution costs has been given in Equation (1) [
24]. Equation (1) has illustrated the importance of grid infrastructure and equipment costs when they have met low/over load. In this equation transformers and lines are the main factors [
24].
The above equation shows that transmission and distribution costs create a large part of the grid’s maintenance cost. The next equations have illustrated aging and the loss of life rate of the transformer for an average penetration rate of EV [
25,
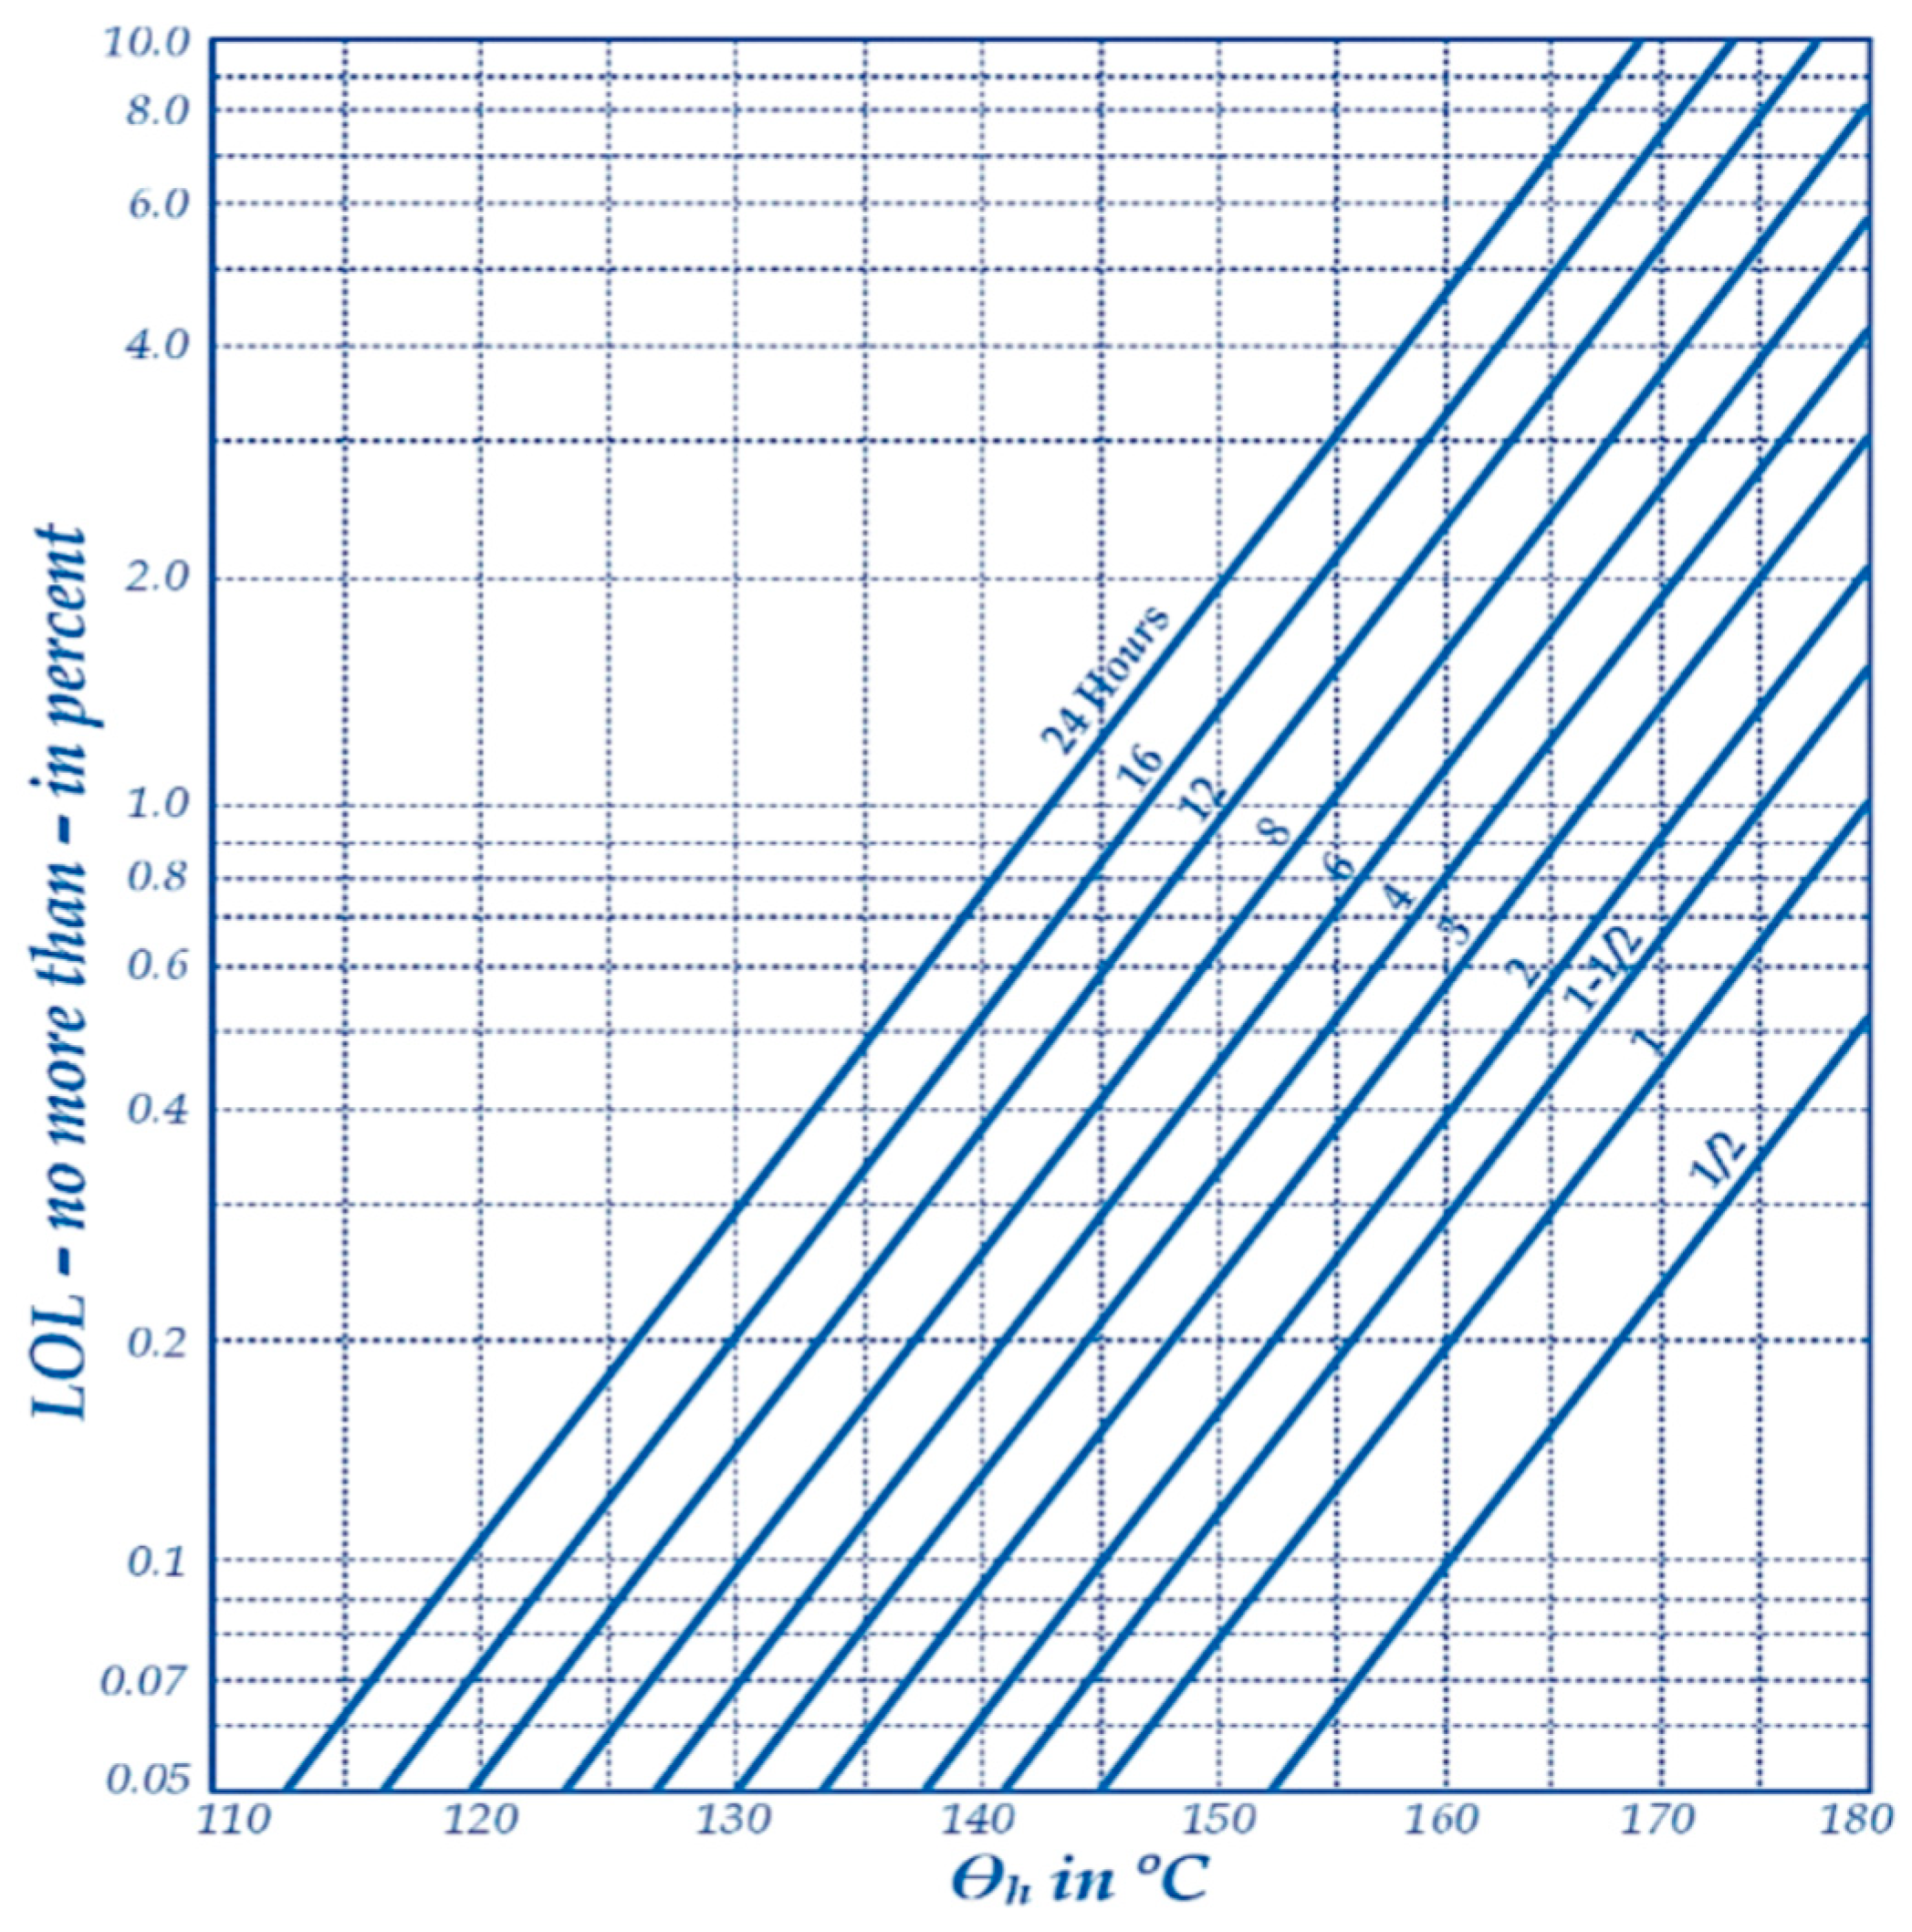
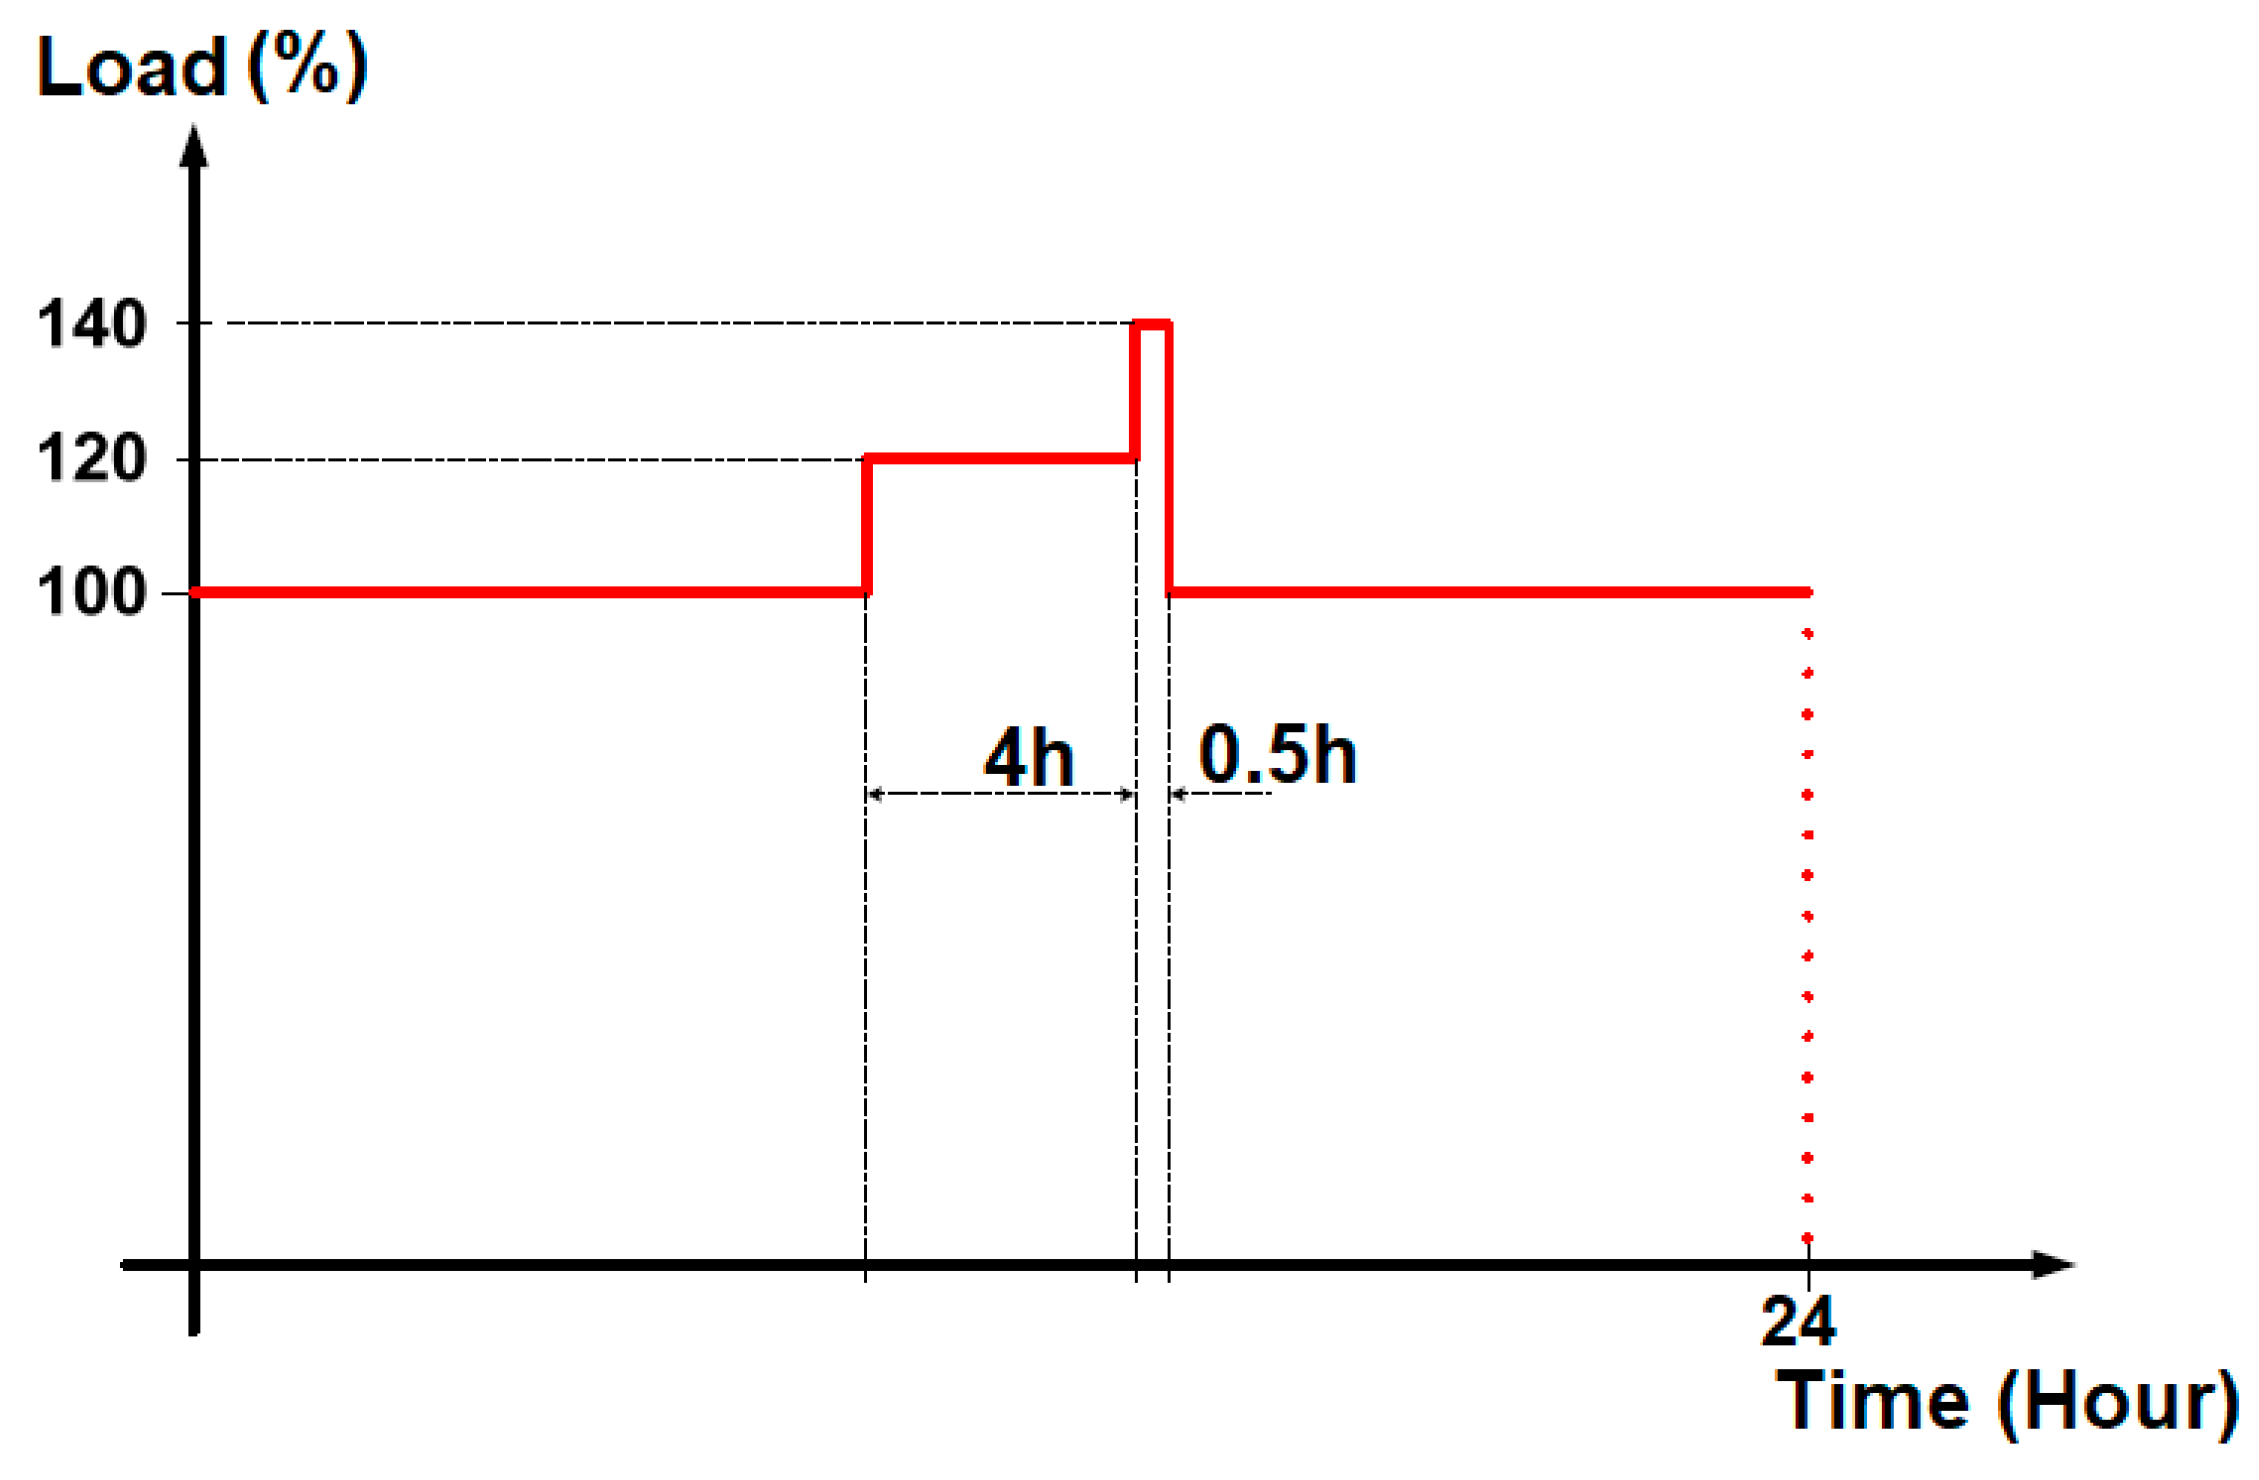
26], which completely depends on the transformers’ temperature. Through various investigations, EV fast charge stations or similar loads were found to generate an impulse load signal type, consequently, it hides hot-spot temperature points in the transformer, which sensors cannot detect.
Figure 4 clearly shows the temperature influence on the loss of life (LOL) rate on transformers, which can be proved by Equations from (2) to (7) [
25]. The transformers’ overall condition is important when transformer temperature exceeds 110 °C, so the LOL rate starts increasing.
One of the most effective ways to solve this type of problem is to monitor transformer temperatures, which are controlled at SCADA or matched on relay settings [
25]. Indisputably, sometimes by assigning more EVs in each grid, some transformers might get overloaded, consequently leading towards faults or interruptions in the grid. The solution to capacity problems depends on the grid communication infrastructure and the grid creation hierarchy. The flow chart of the grid communication infrastructure and the grid creation hierarchy is also represented in
Figure 3.
According to the grid condition, there are many factors in the flowchart that can be calculated altogether. For Ankara, we do not have a smart transformer with online monitoring, therefore, we must use tools based on summary data.
Table 2 shows information that owner C and D have a high priority to create a charge station on their locations. For example, the data of a grid with air quality sensor results are provided below.
In localizing EV charge stations, the regional condition and some of their priorities were more important than the grid infrastructure on their locations. Therefore, they should develop their own location grid infrastructure. In most of the locations parking and public areas provide benefits from the financial and technical side, to create a battery bank and base for an EV charging station. In addition, all of them are explained in the “Selection of High Efficiency and Operational Locations” section of this paper. In this case, the transformers are not smart and the operations group cannot monitor the transformers status, so they do maintenance operations using technical data and by estimation. The transformers are replaced every 30 years and they reach 55~70% capacity during load peak times. These provide some information about the grid, such as transformers work condition. The ANSI/IEEE C57.96-1989 standards [
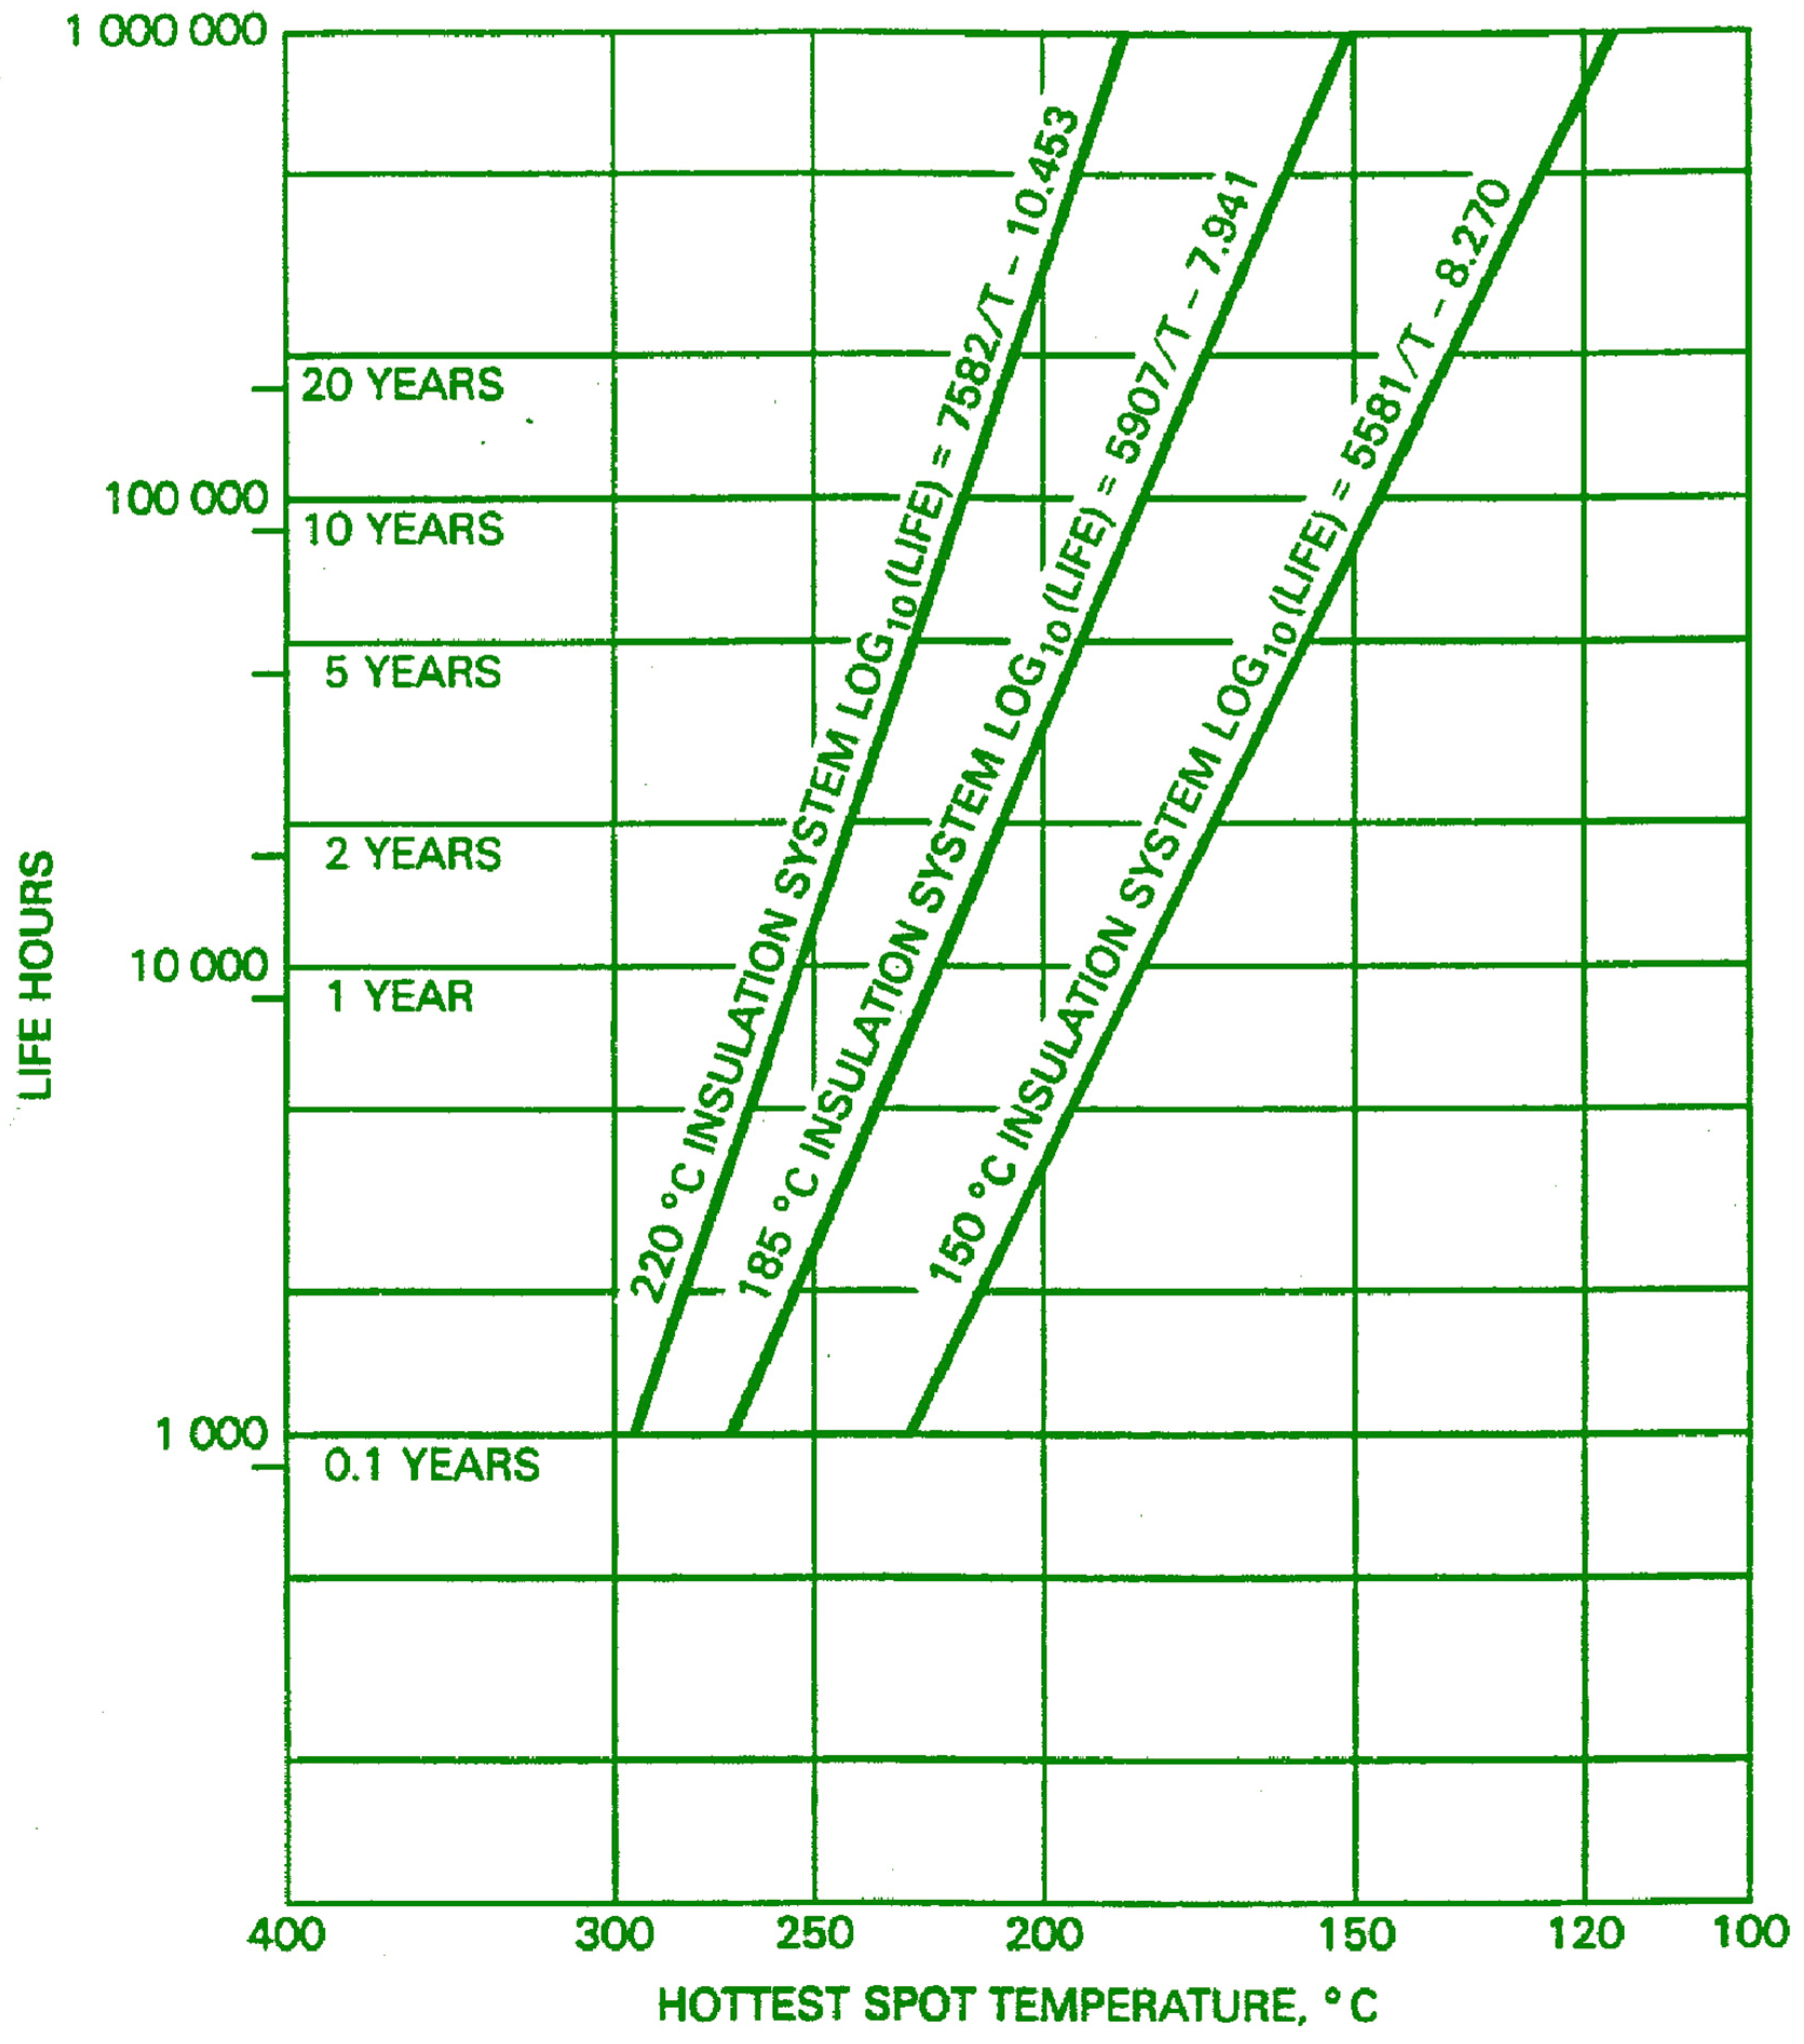
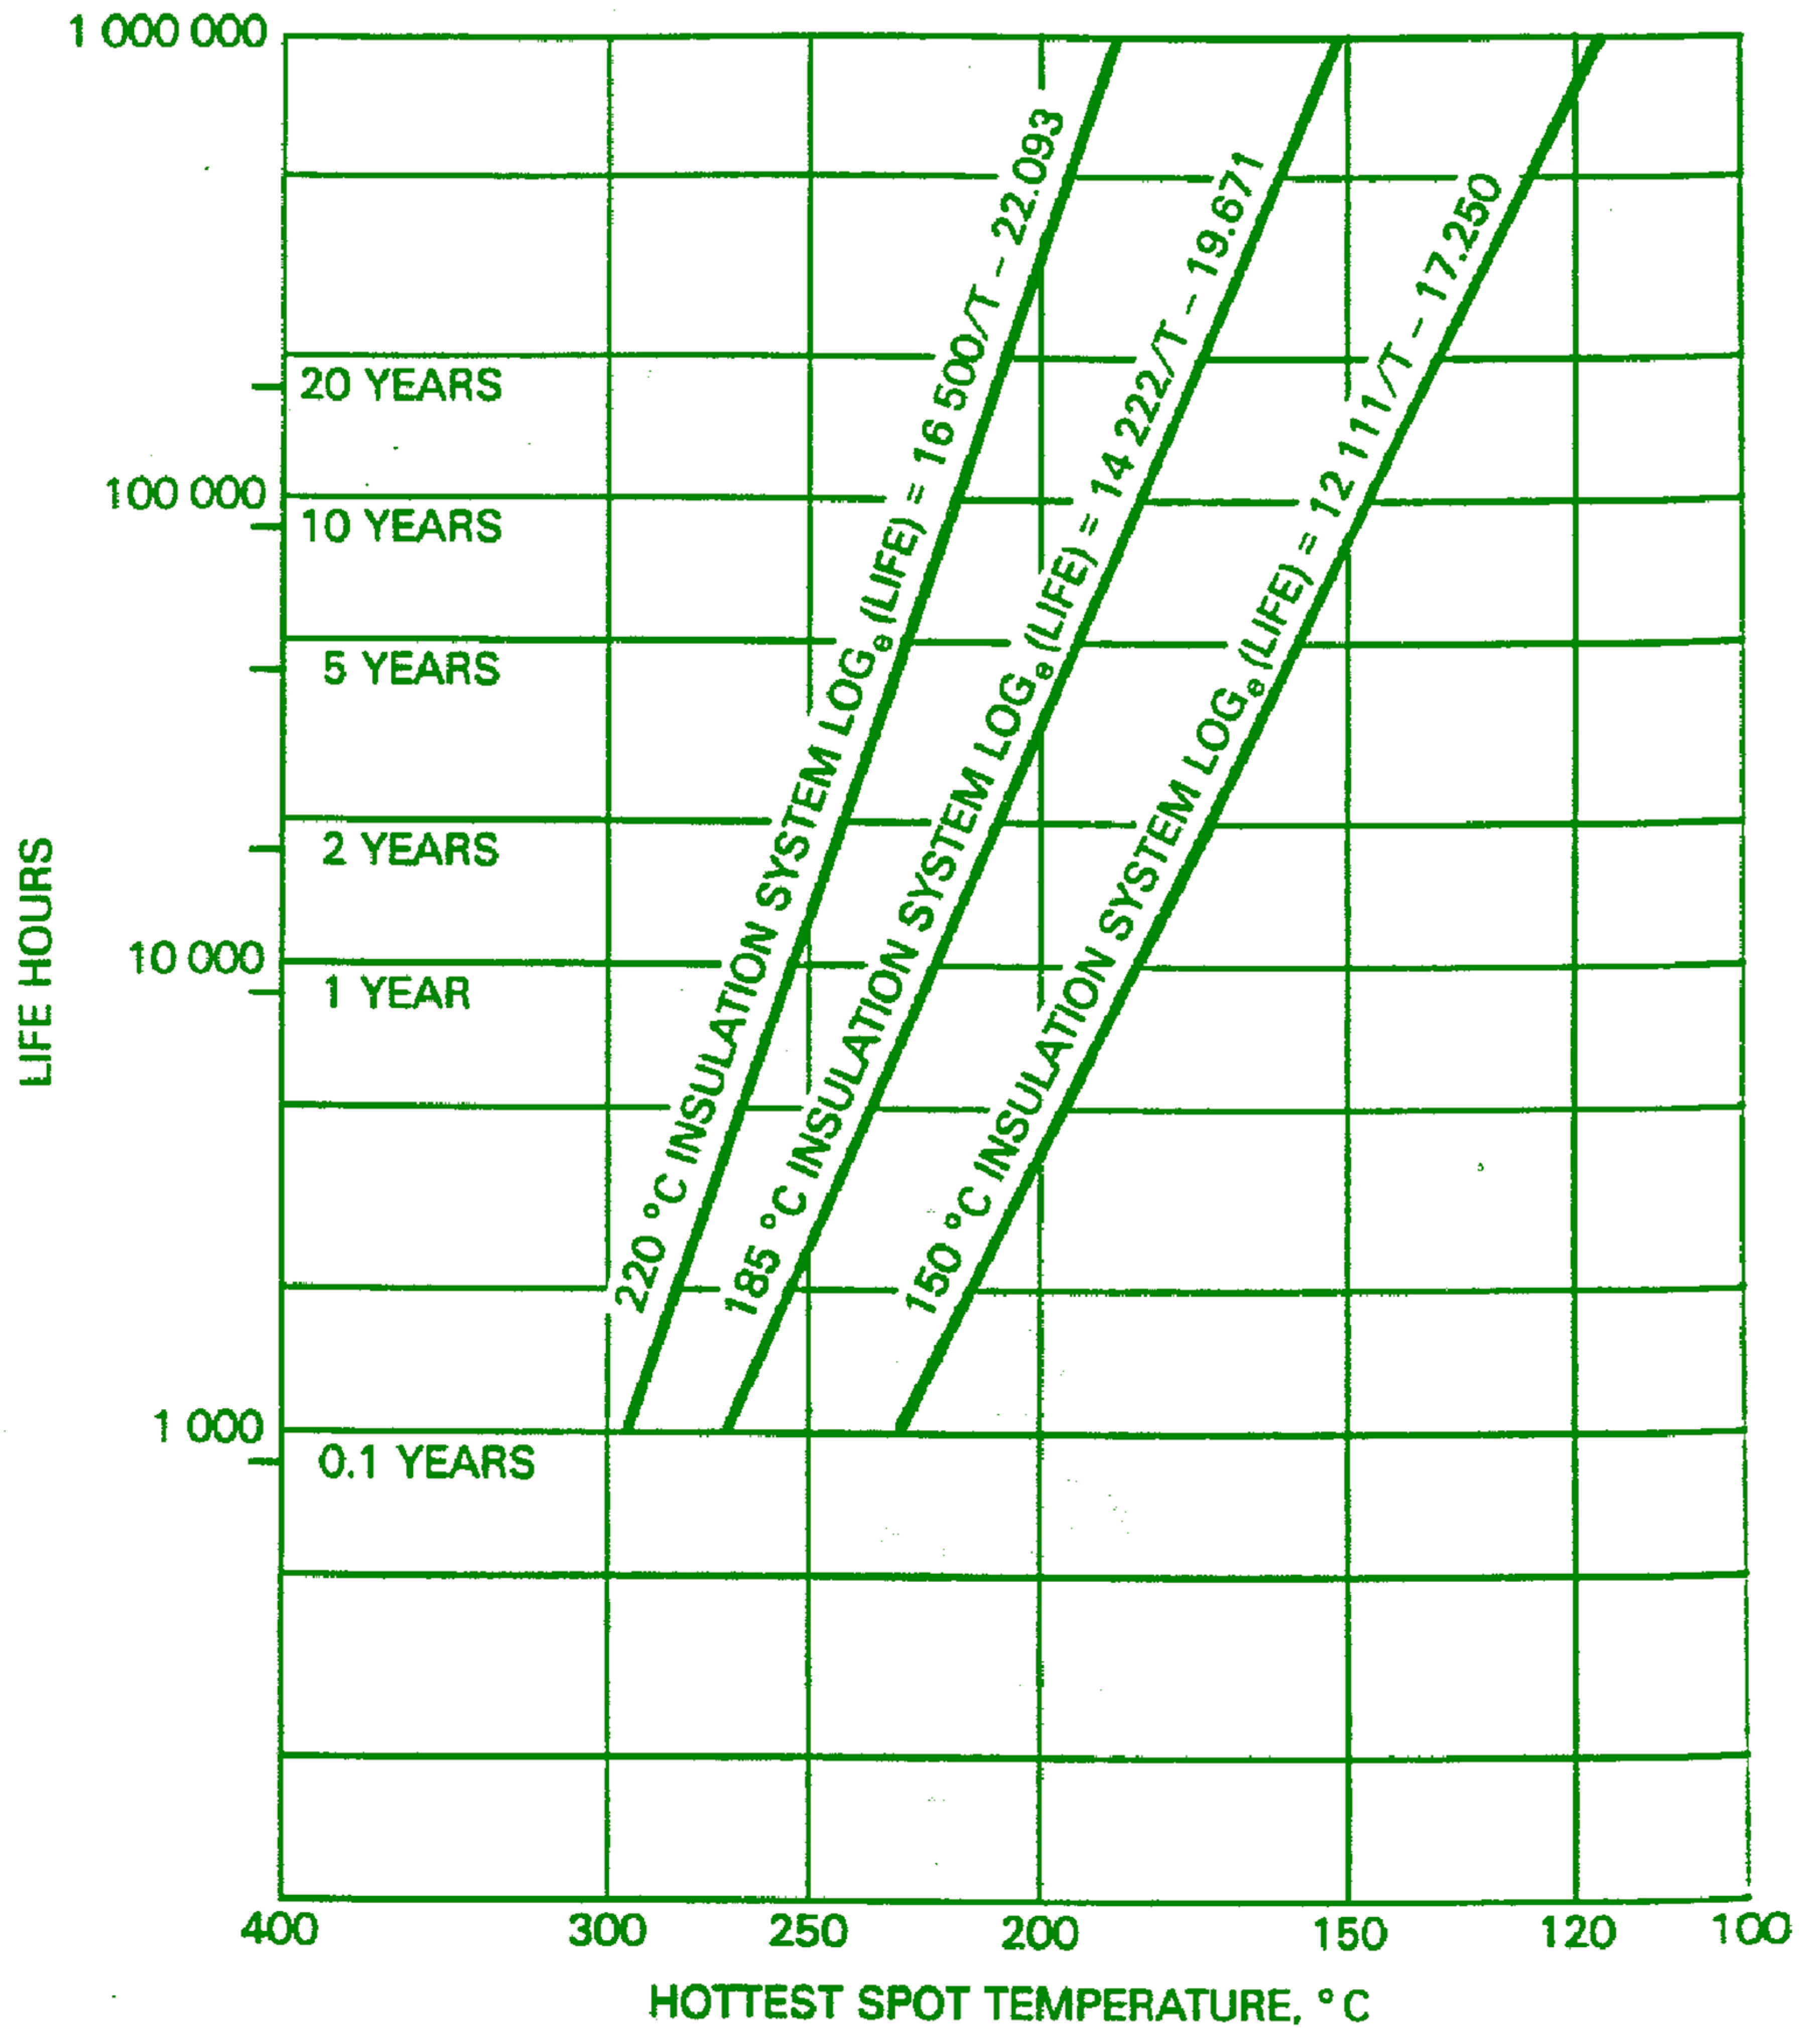
27] recommend transformers be replaced every 20 years, if they have been run under ideal maintenance conditions. The transformers’ life expectancy may be calculated by their insulation life equation, as illustrated below:
Based on Equations (8) and (9),
Figure 5 and
Figure 6 illustrates the time expectancy curve, used in Equations (8) and (9). It shows that transforms, which age more than 20 years, have been in the best maintenance condition.
Figure 5 and
Figure 6 and the related Equations (Equation number 8 and 9) have shown that the transformers have been maintained and are in good condition (the grid has passed “Calculate Transformers Health by Load Summery, Age,” term).
6. Results
In this section, we show that there are many factors which influence the distribution of charge stations. Air quality, transformer conditions, change infrastructure location, and local condition have illustrated that there are very important factors to feed the algorithms mentioned in the Introduction section of the paper. For example, the Gaussian distribution method in Equation (15) can give different results, depending on three factors, rather than two factors. Indeed, the factors change the distribution system variance and reference of their changes:
In addition, it is one of the distribution systems between different types. Today, most of the distribution systems work by multi-functional operations, based on the same system. The Genetic Algorithm is the most used algorithms for the same goal. However, they can work by different variables and functions. The control of each algorithm has its own special strategy and their responsibility efficiency depends on valid operational information from the location.
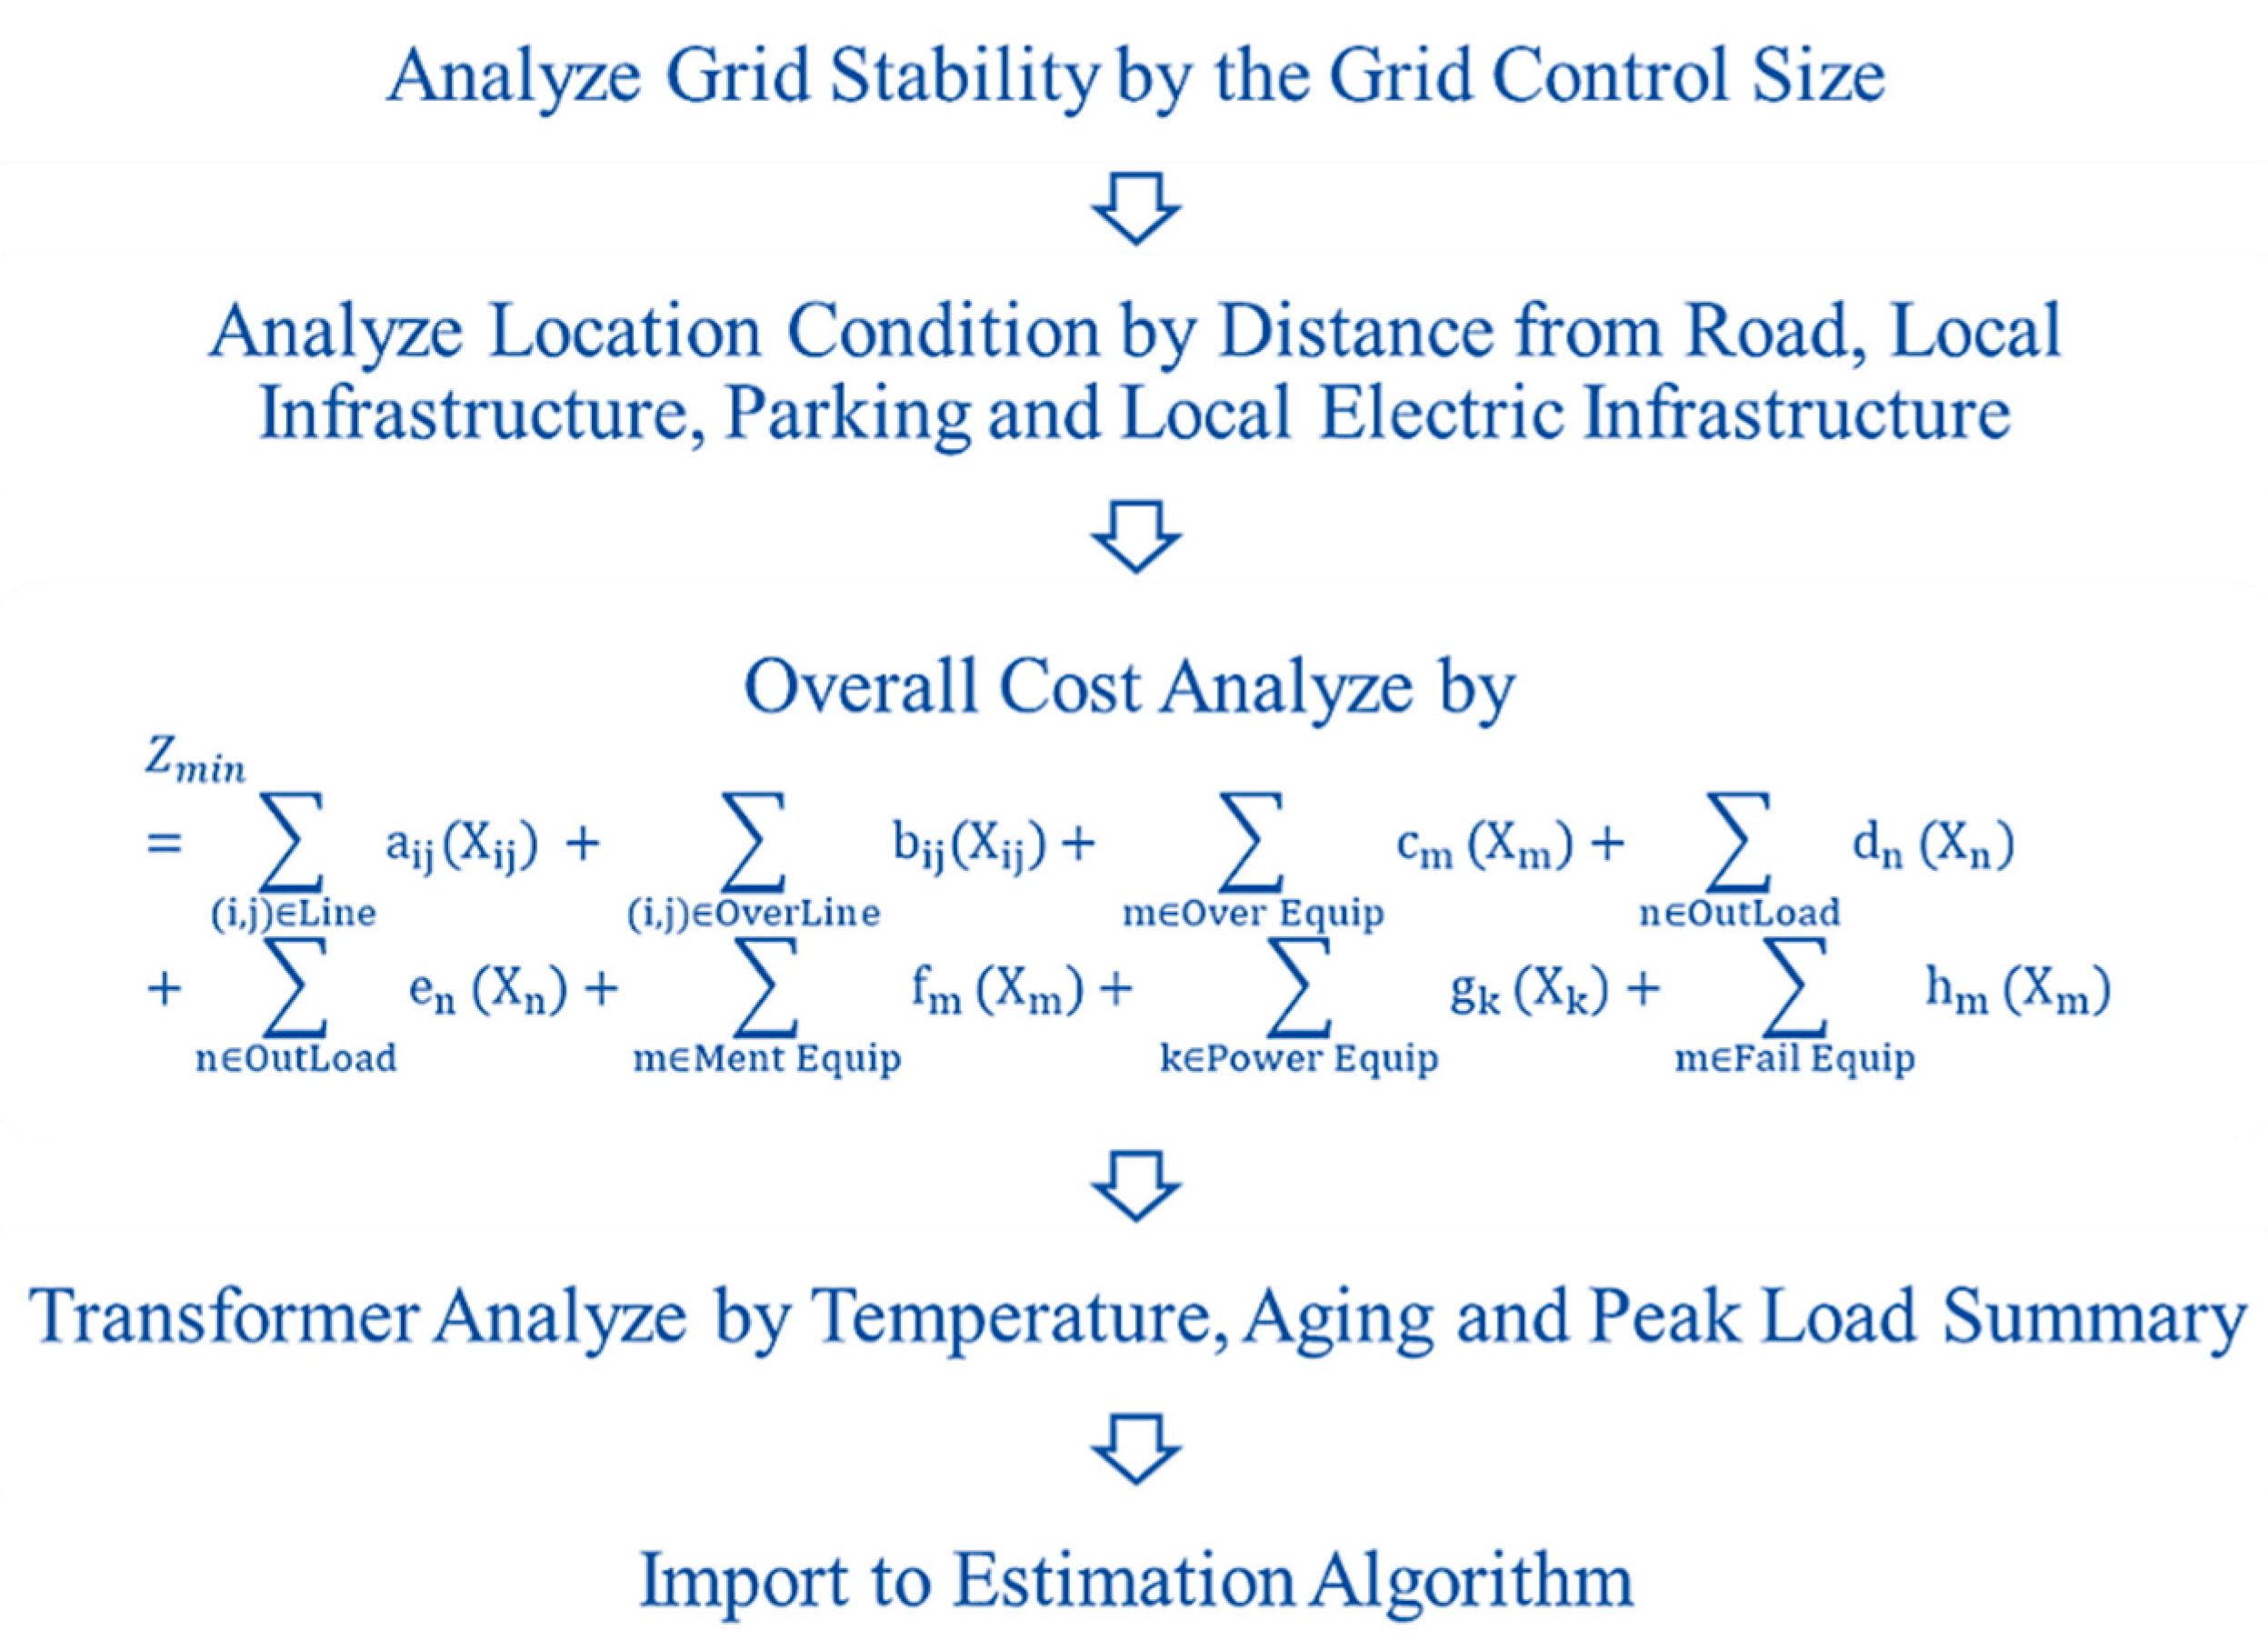
Figure 9 has illustrated a hierarchy of input data for algorithms. In addition, operations in each algorithm will change if other priorities are used in their hierarchy.
In this case, the result of the “Estimation Algorithm” block depends on Turkish energy policy which involves long-term planning. According to the data mentioned in
Table 1, two and location information, the GA is a reasonable method in creating a charging station point. Therefore, there are many drivers, reasons, and information, which can change algorithm targets. The information, which is issued by first data can be changed or improved by the GA algorithm.
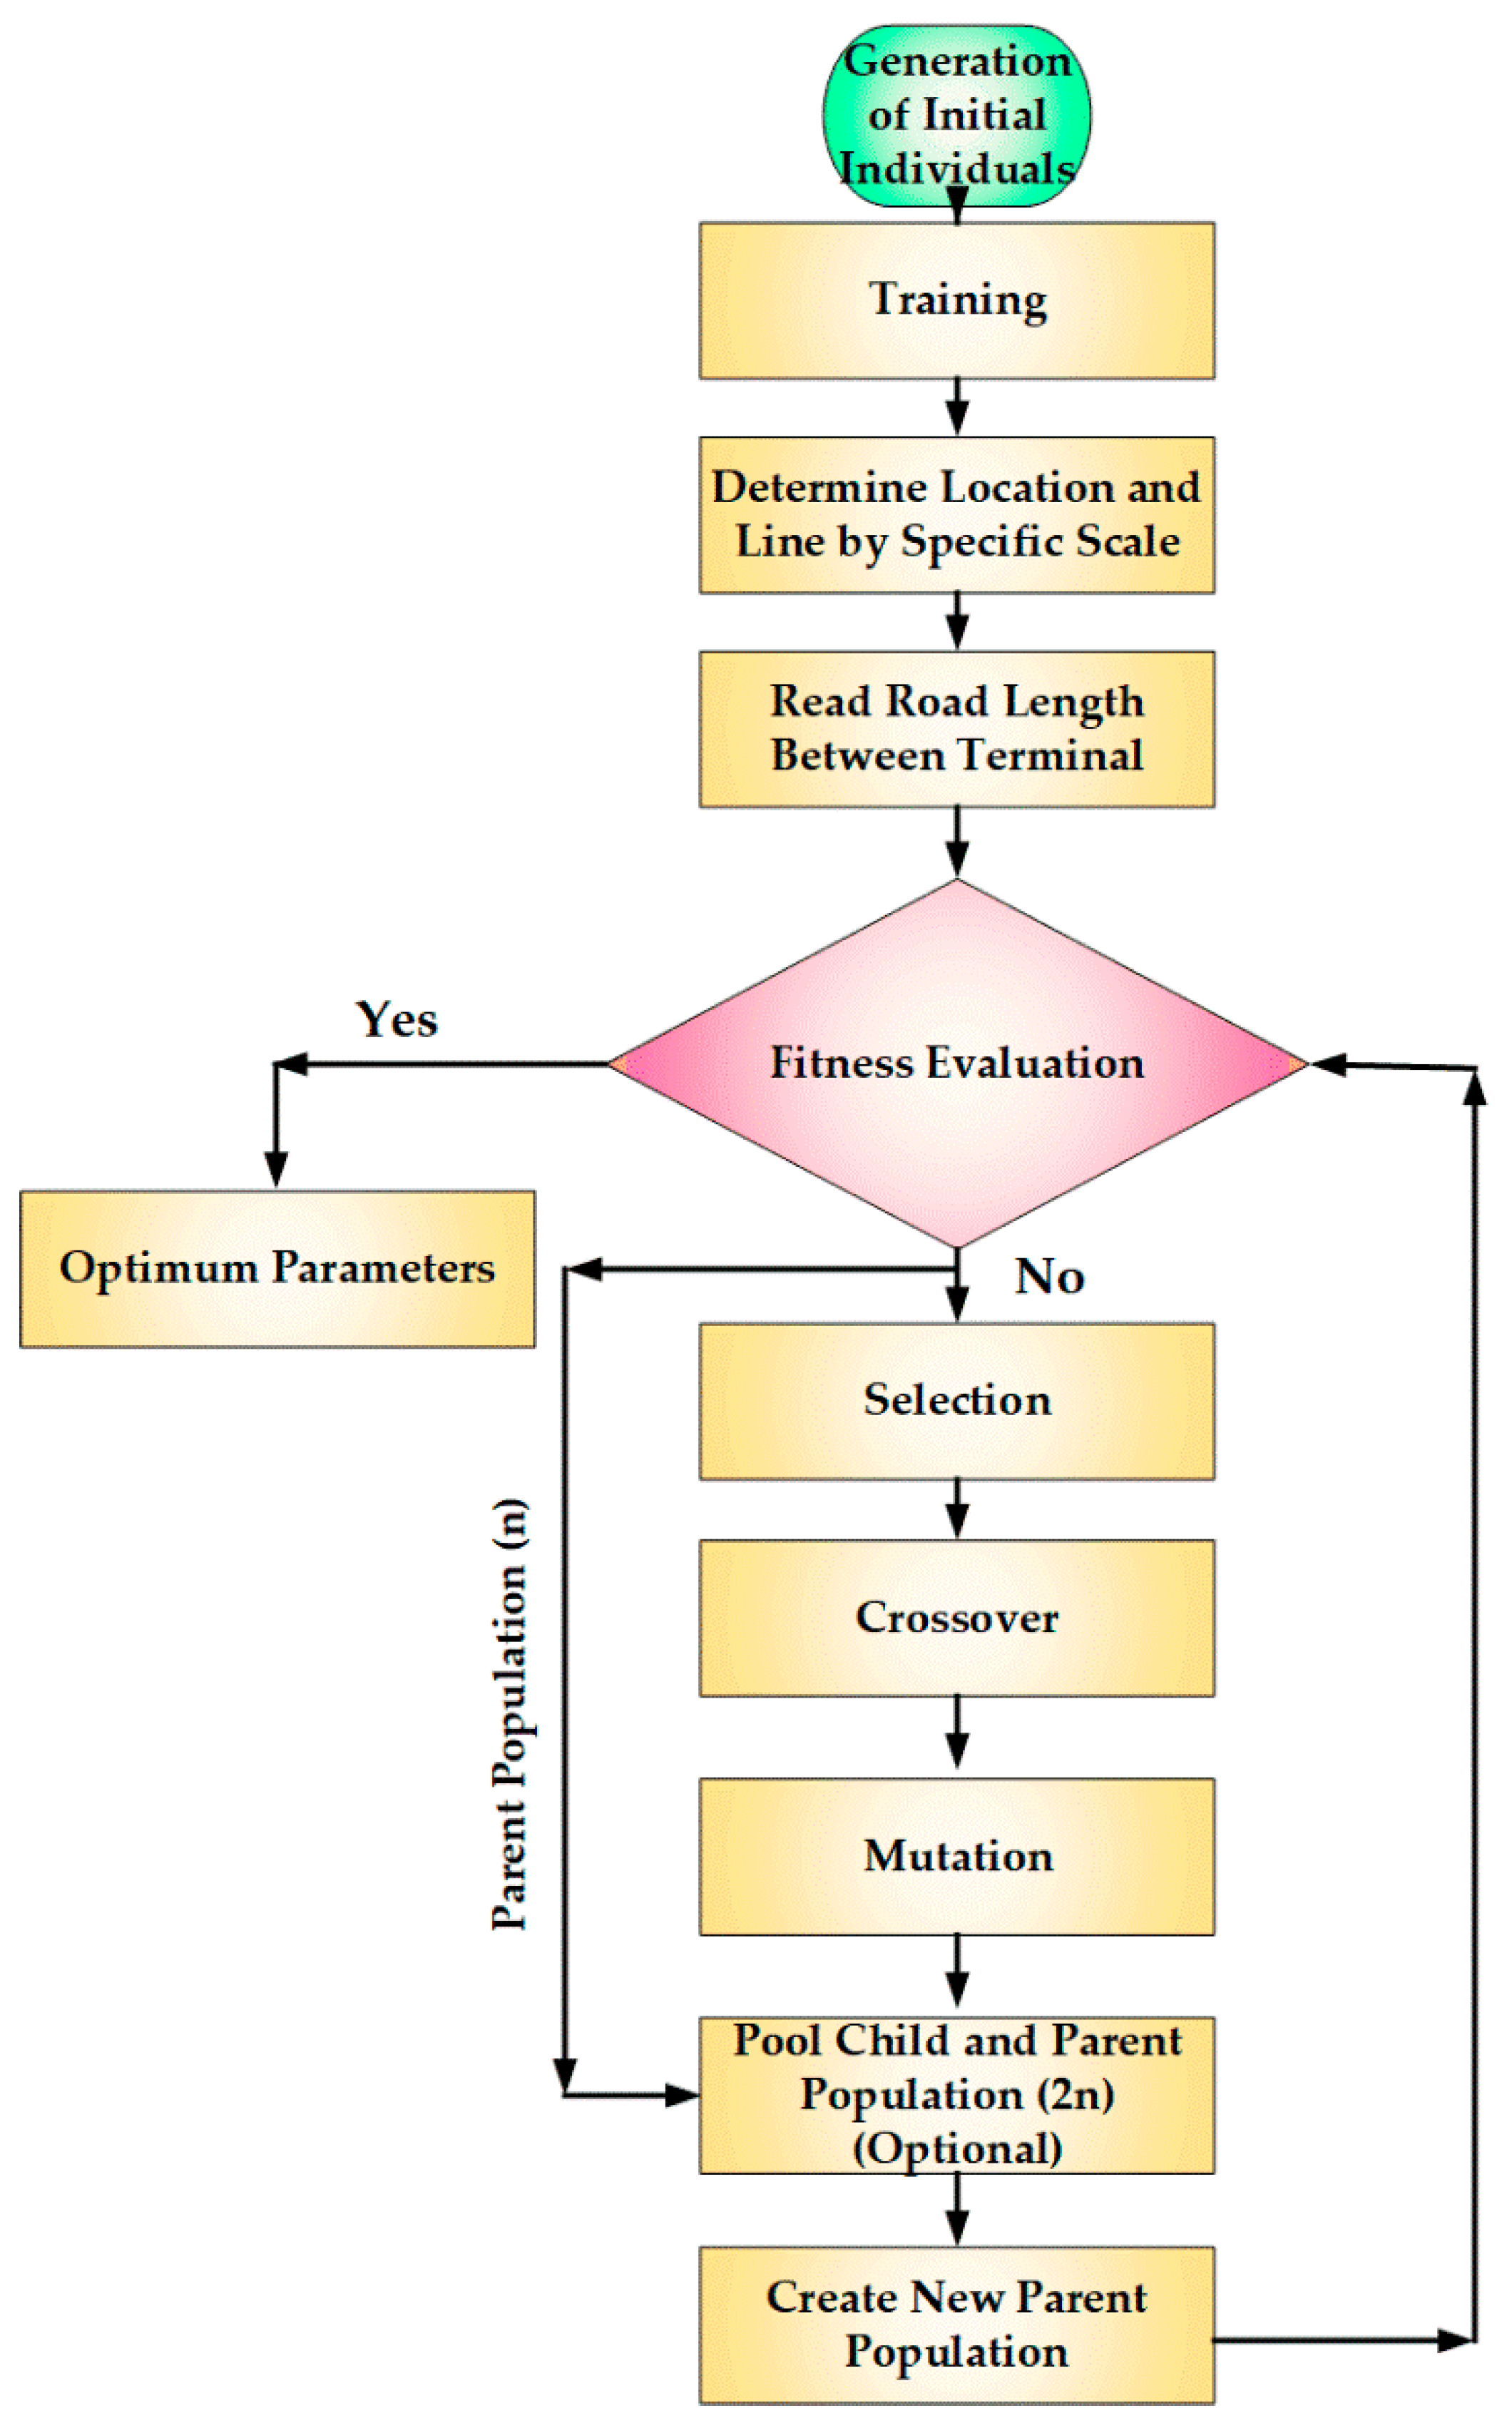
Figure 10 has mentioned an algorithm that was designed by the hierarchy presented in
Figure 9. The algorithm has analyzed and sorted pure data to import on the main estimation algorithm. Firstly, the algorithm achieves location information, however, one of the algorithm targets is the charging station determination near the transportation road to reduce equipment faults during energy transmission. In the next step, the algorithm has been redeterminated in each fail loop or unsuccessful operation. In addition, the algorithm sorts each charging stations in some distance, which depends on grid and customers’ needs. In the second step, the condition of the grid infrastructure has played a big role on algorithm output. In first technical command, it selects transformers, which have the highest reservoir capacity, so the transformers can absorb and transfer grid energy, and lacking in quality. The transformer should be selected by the highest criteria so that the charging stations, especially fast charging stations, behave differently than transformers’ norm. In the second step, which contains the analysis of technical condition, the determination of the points have been issued by their previous technical conditions. Transformers’ conditions can be calculated by temperature or maintenance information.
According to above-mentioned operations, three points (B, D and C) have been determined to be the locations for building EV fast charging stations in Ankara. There are sufficient reasons to select the mentioned transformer centers, by the time they have some difference between mentioned points. Some local infrastructure and transformer responsibility factors have different factors which can be solved by some location problem using GA.
Using the above-mentioned factors, the designers should give some scores to parameters, in order to determine factors’ priorities, then, their data might be ready to input on estimating algorithms. For example, in GA it can be solved by the Genetic Algorithm shown in
Figure 10.
According to the above flowchart, the algorithm can adapt in most of the estimating algorithms. For three areas, marked B, C, and D, several sets of locations and electric infrastructure have been arranged as chromosome structures, shown in
Table 3. Six chromosome sets are based on the flowchart in
Figure 10. The locations are sorted based on distance (a gene), local infrastructure (b gene), parking (c gene), and electric infrastructure (d gene). The generations are derived according to low loads, ageing, and transformer capacity transformer index of the mentioned areas respectively. A maximum of 30 locations have been considered to satisfy the objective function mentioned as:
Six chromosome have been created by location and infrastructure genes. The calculation of determination of the fittest chromosomes have been illustrated in
Table 4.
If the random values ranging from 0–1 are initiated and if C[1] < R[1] < C[2], then chromosome [
2] can be set as the new population for the next generation.
By those random patterns, new chromosomes have listed in below:
Considering a crossover-rate of 25%, if the corresponding value of
R[
k] is less than the rate, the chromosome will be considered as the parent chromosome. For an array of random number:
By the new randomization and chromosomes, the parents can be presented as below:
By the random numbers that have given in crossover section, new set of crossovers will be:
New chromosomes after the crossover process have been illustrated below:
For a mutation rate of 10%, as there are 24 genes in total, the number of mutation will be 0.1 × 24 = 2.4, which can be equated to 2. Thus, the mutated genes are marked in bold.
The mutated genes must be replaced by random numbers from 0–30 to obtain the new set of chromosomes to proceed for iterating in the next generation. If the numbers be 10, 15, 20 and 25 respectively, the new chromosomes will be:
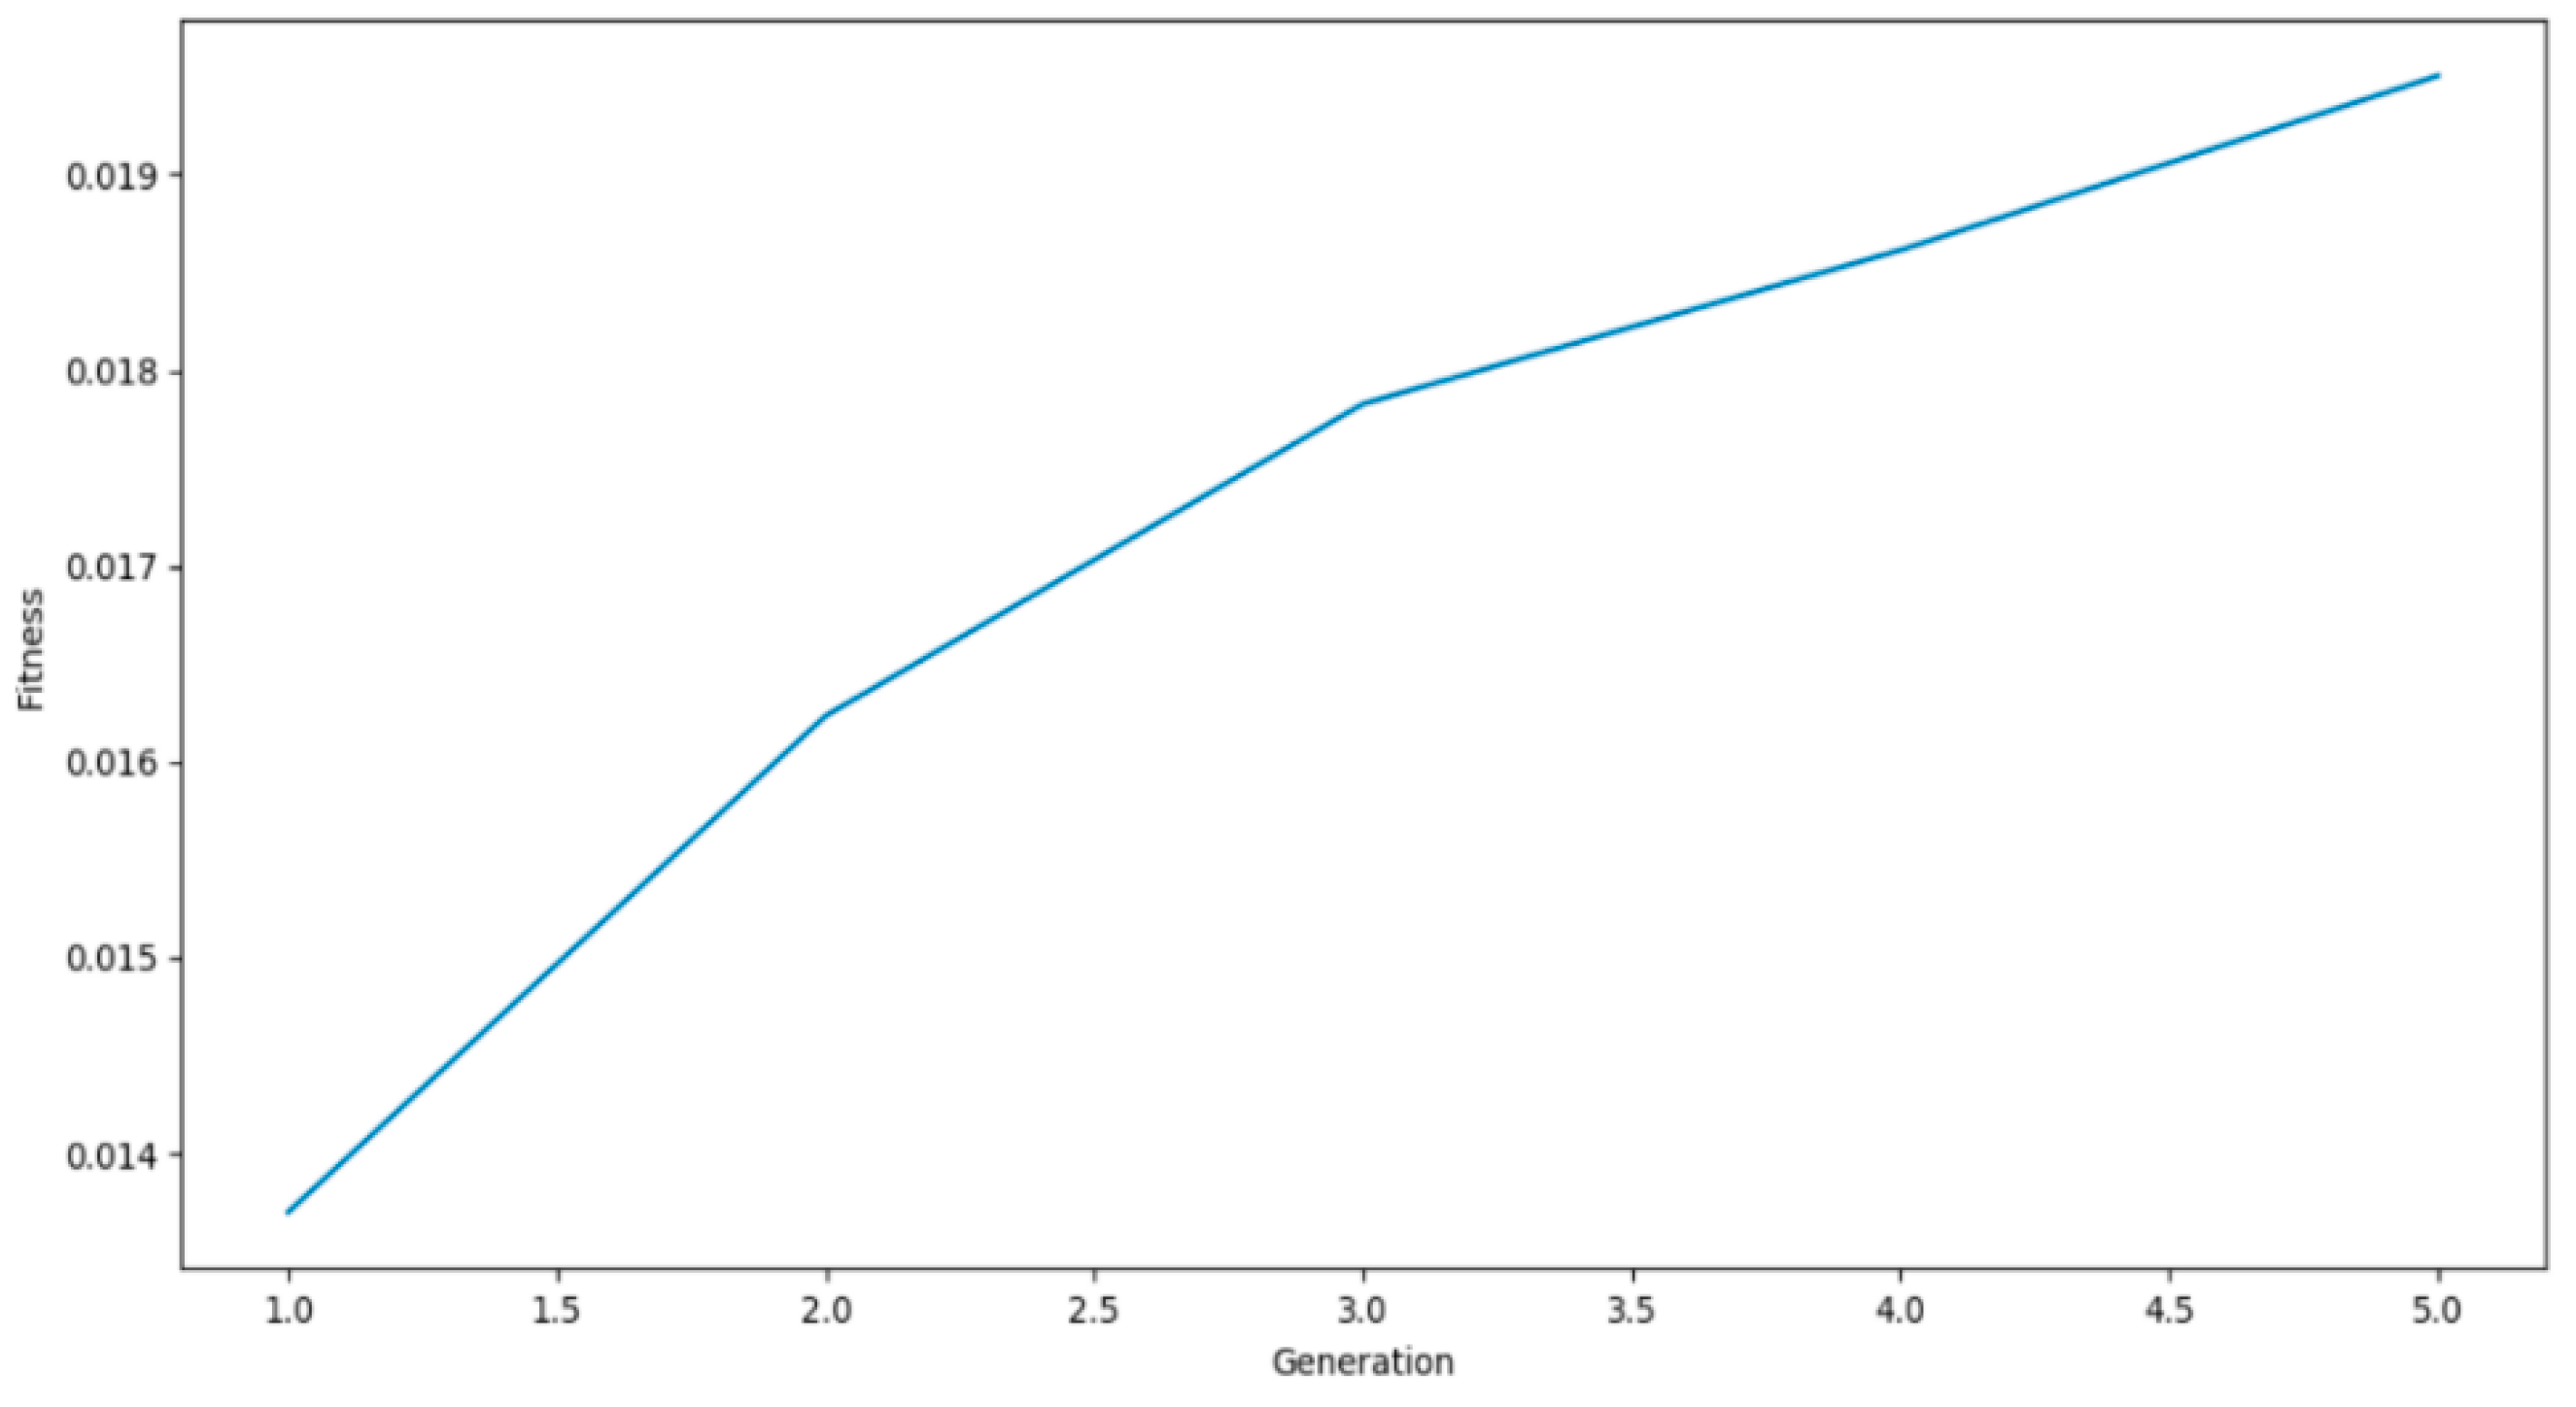
This is the chromosomes of generation one of the algorithm. The process will be iterated until the value of a, b, c, and d meets the optimum value to satisfy the equation. After iterating for 5 generations, the evolution fitness chart will be as represented in
Figure 11:
The algorithm considered three areas, and after selecting several locations according to the aforementioned parameters (
Figure 9), sorted the data into four segments. However, by creating six chromosomes, the algorithms mentioned in
Figure 10 were followed to obtain the first generation of the chromosome. The aim was to attain the best value for the variables in the objective function, so that the optimum location for the charging station can be determined. Fitness value for each corresponding generation is calculated, and as it can be seen, fitness increased with each generation, indicating the success of the algorithm. The higher the value of fitness, the better the algorithm. Thus, after several iterations, the optimal locations in these areas were determined in Ankara metropolitan, as the locations illustrated in
Figure 12.
7. Conclusions
In this research, an algorithm has been provided, which explains the hierarchy of the way the locations of EV charging stations should be determined by experimental exemplification from some literatures and the Ankara case study. The algorithm has been made up of three sections: Finding a location by specifications of the grid infrastructure, categorizing the capacity of transformers, and transformer analysis. It has been created especially for grid designers who have recently started to determine the points for charging stations in cities. In the Ankara case study, considerations for stability of the grid has been eliminated from the algorithm, because the grid can be considered to be stable for having adequate reserved power from neighboring control areas. The novelty of this research is the assertion that some limited parameters can show grid equipment conditions in the past to solve grid problems. Finally, this research has built a congruency and connection between the algorithm theories, programming languages, and practical strategy for the grid. The research has indicated that the transformers’ condition, electric infrastructure, budget, and various other aspects, which are influenced by energy consumption, are important factors in approaching this issue. Furthermore, this research has shown that the maintenance history of the grid equipment and infrastructure are the key points in determining the locations of electric vehicles charge stations. The optimum locations have been determined using a Genetic Algorithm, which has been mathematically interpreted and analyzed. EVs and storage are garnering interests to the People’s Republic of China, Europe, Japan, the United States of America, and recently, it has caught India’s attention for the purpose of decreasing GHG emission as soon as possible. Science and technology is improving every second. This algorithm can be a stepping stone in the field of technology, which is used for autonomous systems on storages supplied by the grid or DC link.

 ,
, 


