Article

An Experimental Study on the Heat and Mass Transfer of Liquid Nitrogen in a Loose Medium

School of Emergency Management and Safety Engineering, China University of Mining and Technology (Beijing), Beijing 100083, China
*
Authors to whom correspondence should be addressed.
Energies 2019, 12(18), 3464; https://doi.org/10.3390/en12183464
Submission received: 26 July 2019 / Revised: 3 September 2019 / Accepted: 5 September 2019 / Published: 8 September 2019

Abstract

:
Liquid nitrogen is a vital medium during the extinguishing and chilldown process of coal spontaneous combustion in coal mine goafs. In this paper, the heat and mass transfer of liquid nitrogen in a loose medium was investigated. A laboratory system including a temperature sensing system was designed and built to explore the effects of different nitrogen injection positions and angles on the chilldown effect. The results indicate that after liquid nitrogen injection, the temperatures in the liquid nitrogen flow area and the bottom of the model can be quickly reduced to −196 °C, which was the best chilldown effect zone. With the vaporization of the liquid nitrogen, the cryogenic nitrogen gradually diffused. At 20,000 s, the bottom temperature was about –63 °C, the middle was –30 °C, and the upper was 0 °C. When the model angle was 0°, the effective chilldown zone was the largest. As the angle increased, the effective chilldown volume and holding time decreased significantly. The model angle had a greater impact on the chilldown. For the position of nitrogen injection, the inlet was set slightly farther from the gas outlet’s position, leading to a larger coverage for the liquid nitrogen and cryogenic nitrogen chilldown. This study can provide a theoretical basis for the flow and chilldown of nitrogen injection in goafs.

Graphical Abstract

1. Introduction

The goaf in a coal mine is a confined space formed by the gradual breakdown and collapse of remaining coal and rock after mining, which can be regarded as a loose medium [1]. The remaining coal in a goaf has the possibility to spontaneously combust [2], which may happen because of an air leakage, and may make the heat accumulate gradually via coal–oxygen interactions [3]. Coal fires in goafs have the characteristics of a wide fire area, too many remaining coal locations, and the concealment of fire sources [4]. Coal fire accidents, which are caused by the spontaneous combustion of coal, account for more than 60% of mine fire accidents [5,6,7]. A wide range of spontaneous combustion reactions cause a serious problem for coal workers, equipment, and the environment [8,9,10]. Therefore, much importance should be given to preventing and extinguishing coal fires in goafs.
At present, fire prevention and extinguishing technologies commonly used in goafs include grouting [11], foam [12,13,14,15], flame retardants [16,17], and inert gases [18,19]. Among these technologies, liquid nitrogen has significant advantages in terms of its cold storage, flow characteristics, and heat exchange efficiency, which can be beneficially applied to fire extinguishing in coal mine goafs. Liquid nitrogen has ultra-low temperature properties and good fluidity, and its physical properties are listed in Table 1. According to the properties of liquid nitrogen, when liquid nitrogen is injected into the loose medium in a goaf, part of the liquid nitrogen vaporizes rapidly and undergoes a phase change, and the other part flows in the form of a liquid along the pores of the loose medium and gradually vaporizes with the flow. In this process, a large amount of cryogenic nitrogen can be used to dilute the oxygen and methane concentrations in the goaf. The liquid nitrogen’s phase transition and cryogenic nitrogen can absorb a large amount of heat during the flow process, so the ambient environment is rapidly cooled [20,21].
The process of fire extinguishing and cooling with liquid nitrogen in goafs involves a two-phase flow, heat transfer, and phase transformation in the loose medium, which is extremely complicated. A large part of the research on fire extinguishing with liquid nitrogen in goafs has focused on engineering applications, which has been successfully adopted to extinguish underground fires [22]. To explore the heat and mass transfer in goafs, Lu et al. [21] built a tunnel model with temperature sensors in porous coal media, and obtained the optimum position for the liquid nitrogen injection. Shi et al. [20] established a conical porous medium model to investigate the heat and mass transfer of liquid nitrogen (mainly in the vertical direction), supplemented in the horizontal direction. The experimental results showed that a variation of the temperature and oxygen concentrations under different particle sizes and infusion environments, and the optimum scheme of nitrogen injection was obtained under experimental conditions. The filling medium in a goaf is a loose medium, which is also called a porous medium in the literature [23]. The porous medium model, with its liquid nitrogen flow and phase change, can be divided into three regions in this process: The liquid region, the two-phase region, and the gaseous region. This model is described as a separate phase model (SPM), which is used to solve the transient, two-dimensional equations in the liquid and two-phase regions, as well as at the phase-change interface [24,25]. The improved model is a two-phase mixture model (TPMM), which improved the interface tracking problem [26].
In addition, research on the heat and mass transfer characteristics of the flowing phase transition of liquid nitrogen has focused on two-phase flow boiling in the pipeline. Shaeffer et al. [27] studied the flow and heat transfer law of liquid nitrogen in the tube. When the wall temperature of the medium was higher than the Leidenfrost point, the Leidenfrost phenomenon occurred (where the boiling state was film boiling). During film boiling, the liquid nitrogen was vaporized into nitrogen, and the wall was not wettable by the liquid nitrogen, resulting in a nitrogen film that was formed between the wall and the liquid nitrogen to shroud the wall [28]. A nitrogen film reduced the flow resistance and heat exchange efficiency of the liquid nitrogen. Kandlikar et al. [29] conducted an experimental study on the flow boiling of 10 fluids, such as liquid nitrogen and liquid neon, in vertical and horizontal tubes. The flow boiling region could be divided into a nuclear boiling region and a forced convective evaporation region. Steiner et al. [30] carried out an experimental study on the boiling heat transfer and pressure drop of liquid nitrogen in a horizontal tube. In the nucleate boiling zone, the heat transfer coefficient mainly depended on the system pressure, heat flux, surface roughness, and an inner diameter of the tube, and the corresponding empirical correlation was obtained from this study.
The current research on liquid nitrogen extinguishing and chilldown mostly focuses on heat and mass transfer in tubes. However, research on the cooling process of liquid nitrogen in a loose medium applied to goafs remains incomplete, except for engineering applications. As a result, the effect of liquid nitrogen fire extinguishing was unstable even during engineering applications. In this study, a laboratory experimental platform was adopted to investigate the chilldown effect of liquid nitrogen in a loose medium, reflecting the influence of inclination angle and injection position on the heat and mass transfer of liquid nitrogen in a loose medium; the effective chilldown zone is also proposed for the first time. This study could provide basic theoretical support for liquid nitrogen in fire prevention technology, aiming to optimize the fire extinguishing performance of liquid nitrogen and ensure the best treatment time in the fire zone. In this paper, the research progress of mine fire extinguishing technology and the heat and mass transfer of liquid nitrogen are presented in Section 1. Then, a laboratory experimental platform is developed under different influential factors, which are introduced in Section 2. The Leidenfrost effect is also introduced to better describe an effective chilldown zone. The experimental results are presented and discussed in Section 3 through the different axes, positions of injection, and angles of the model. Finally, Section 4 presents the conclusions.

2. Experimental Setup and Methods

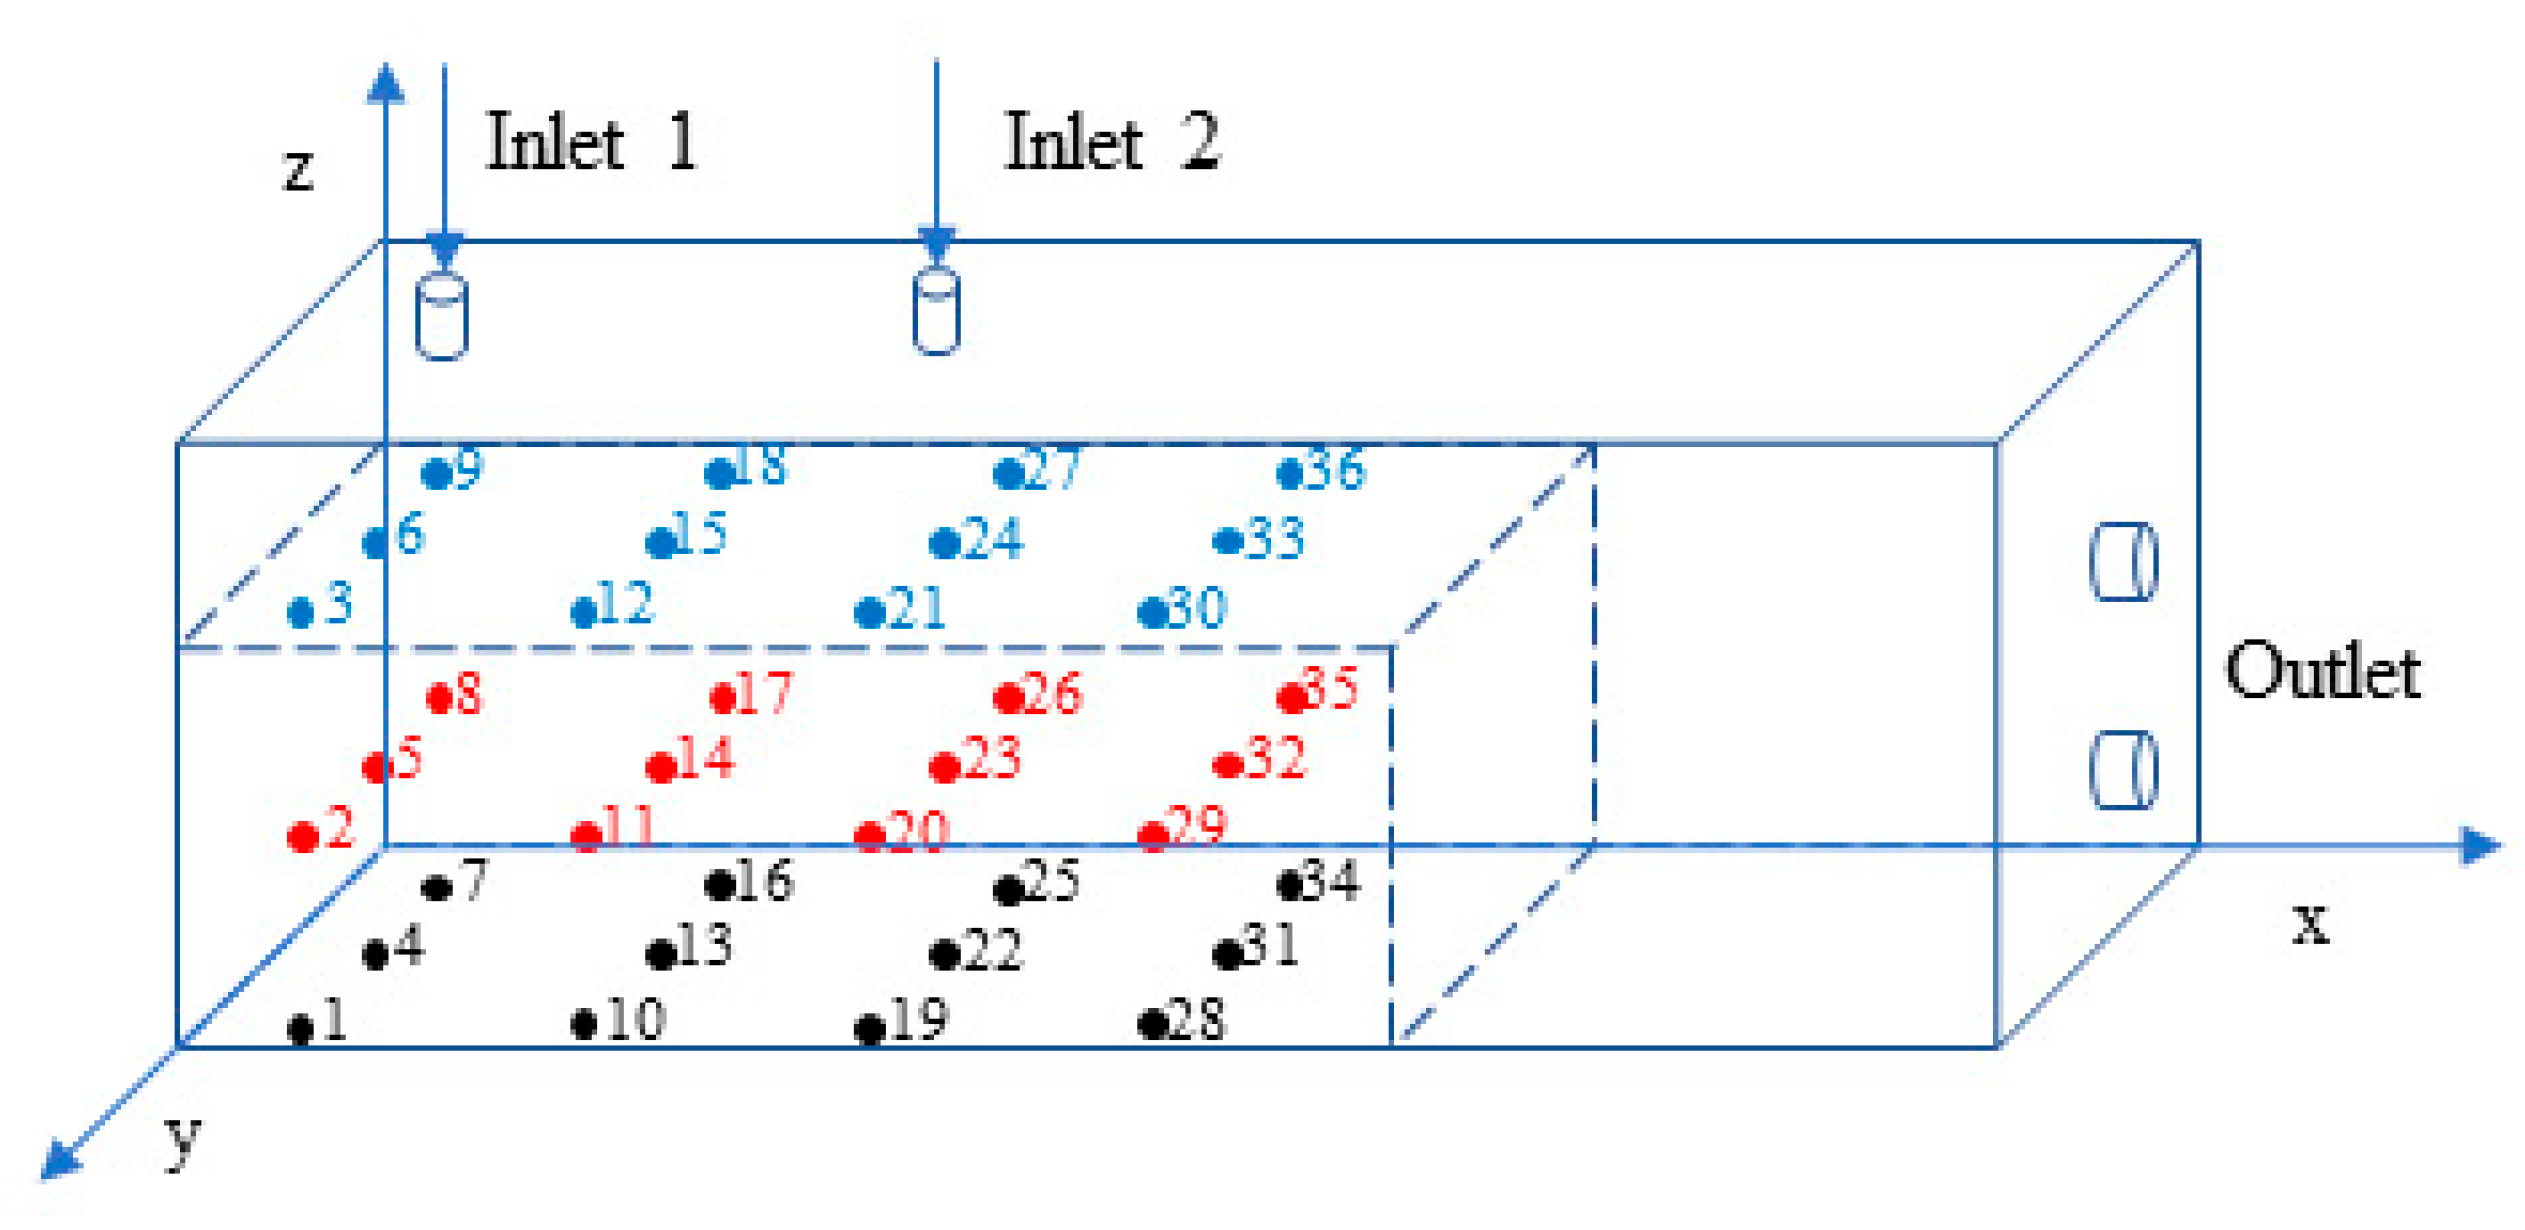
2.1. Experimental Setup

The experimental platform established in this study is composed of a loose medium model, a self-pressurized liquid nitrogen container and a data acquisition system including mass and temperature data acquisition units. The schematic diagram of the experimental platform is shown in Figure 1. The loose medium model was made of polymethyl methacrylate (PMMA), and its dimensions were as follows: 1 m long, 0.4 m wide, and 0.4 m high. In order to determine the mass and heat transfer law of liquid nitrogen in a loose medium, the model was simplified and filled with broken rocks to simulate the loose medium in a goaf. The particle sizes of the broken rocks varied from 10 mm to 50 mm. The goaf is the area left after the completion of mining operations. The goaf does not collapse in a short time. However, if it is not reinforced or backfilled for a long time, it causes collapse. There is a gradual process between them. Therefore, the goaf consists of a space filled with a loose medium and empty space. In this experiment, the model with part space of the loose media were designed to better simulate the goaf, where there was a lot of air flow, and coal was prone to spontaneous combustion. Adiabatic material was placed on the sides and bottom of the model to isolate the heat exchange. There were two liquid nitrogen injection inlets designed on the top of the model and two outlets on one side.
The self-pressurized liquid nitrogen container contained 50 L with a working pressure of 0.1 MPa and a daily evaporation rate of less than 1.3%. The amount of liquid nitrogen outlet flow could be controlled at 0–4 L/min through the discharge valve, but the flow rate could not be displayed. Therefore, a weigh scale included in the mass data acquisition units was employed to indirectly measure the flow rate of the liquid nitrogen. The mass difference of the liquid nitrogen container at the beginning and end of the experiment and the timespan of the experimental process were recorded; the mass difference to time’s ratio was the average flow rate throughout the experiment. The measurement range and accuracy of this weigh scale were 100 kg and 5 g, respectively.
The temperature data acquisition unit was composed of 36 temperature sensors and a data recorder (SIN-R6000C, Liance) at a sampling period of 1 s. The temperature sensors used in this study were PT100, with a working range of −200~250 °C and A-level accuracy. The temperature sensors were calibrated in an ice-water mixture at 0 °C, and the accuracy was of 0.1 °C.
The coordinate axis was established in the model to describe the position of the temperature sensors more intuitively and clearly, as shown in Figure 2. The vertex of the model was established at the origin of the coordinate, with the long side along the X-axis, the wide side along the Y-axis, and the high side along the Z-axis. All 36 temperature sensors were set regularly in the model. In the X-axis direction, the temperature sensors were placed in the position X = 8, 23, 38, and 53 cm. In the Y-axis direction, the placement nodes were Y = 8, 20, and 32 cm. According to this rule, the bottom temperature sensor coordinates can be defined as 1# (8, 32, 0), 4# (8, 20, 0), 7# (8, 8, 0), 13# (23, 20, 0), 22# (38, 20, 0), and so on. In the Z-axis direction, the spacings between each of the upper, middle, and bottom layers were 10 cm (for example, 8# (8, 8, 10) and 9# (8, 8, 20)). Similarly, the inlet positions were also set in the coordinate axis of inlet 1 (8, 20, 40) and inlet 2 (38, 20, 40). The injection inlets were set on the central axis at the top of the model, 30 cm apart and 2 cm in diameter. In addition, the change in the inclination angle of the model depended on the method of lifting the left side of the model. The angle between the model and the ground was designed to be 0°, 4.1° (the near horizontal coal seam), and 8.4° (the slowly inclined coal seam), according to the classification of the coal seam’s inclination angle [31,32].

2.2. Experimental Procedure and Scheme

Since the self-pressurized liquid nitrogen container was stored in a room temperature and pressurized environment, there was a certain amount of nitrogen gas in the container. In order to make the liquid nitrogen flow into the inlet, the drain valve of the container was opened, and the nitrogen was discharged first. When a steady flow of liquid nitrogen was observed to be discharged, the liquid nitrogen pipe was put into the inlet and the pipe was kept in a vertical state, at which time the indicator number of the weight scale was recorded. When the data on the data recorder was stable and maintained for a period of time, the discharge valve of the container was closed. The time and the end mass of the weight scale was recorded at the end of the experiment. The experimental scheme is shown in Table 2. The experimental error of the average mass flow rate in the six tests was no more than 6%. Thus, it can be concluded that the experiments were carried out under a stable flow rate of liquid nitrogen injection in all the experiments.

2.3. Leidenfrost Effect

The Leidenfrost effect was first observed in 1756 by J.G. Leidenfrost, who recorded the effect in Germany that year. This publication was translated into English in 1966 [33]. For liquids, the Leidenfrost effect can be described as follows: When a liquid contacts a loose medium, the contact portion violently vaporizes into a gas, which exists between the liquid and the loose medium, thereby forming a layer of film that separates the liquid and the loose medium. This film blocks the heat transfer between the liquid and the medium, so that the boiling speed of the liquid is greatly reduced, and the wrapped liquid remains in the liquid state for a certain period of time. This effect increases the lifetime of a wrapped liquid but makes the heat conductivity of liquids worse compared to direct contact with a medium.
When liquid nitrogen was injected into the loose medium model system at a warmer ambient temperature (which was significantly warmer than the saturation temperature of liquid nitrogen), the Leidenfrost effect occurred due to the large temperature difference between the liquid nitrogen and the medium, and the liquid nitrogen boiling at this time produced film boiling. As the temperature of the loose medium in the model continued to drop, this temperature was defined as the Leidenfrost point, where the heat transfer was at its minimum and the heat transfer between the cold vapor and the medium was inefficient. When the temperature continued to decrease below the Leidenfrost point, the liquid nitrogen remained in contact with the loose medium, and the heat transfer models changed from film boiling to a transition boiling regime or a regime between the liquid nitrogen dominated chilldown in nucleate boiling [34].
When the temperature was lower than the Leidenfrost point, the heat transfer coefficient was much larger than that in film boiling, and the chilldown effect was much better. In current studies, the proposed correlation for T L was derived by Berenson [35], and the formula is
T L = 0.127 ρ v h f g k v [ g ( ρ l ρ v ) μ v ( ρ l + ρ v ) 2 ] 0.5   [ g 0 γ l v g ( ρ l ρ v ) ] 0.33 + T s a t ,
where ρ l and ρ v are the density of the liquid and vapor nitrogen (kg/m3), h f g is the enthalpy from fluid to gas (kJ/kg), k v is the thermal conductivity of vapor (W/m·K), μ v is the vapor viscosity (Pa·s), γ l v is the surface tension (N/m), g is the gravity (m/s2), g 0 is conversion factor (kg/m·s2), and T s a t is the saturation temperature (K).

3. Results and Discussion

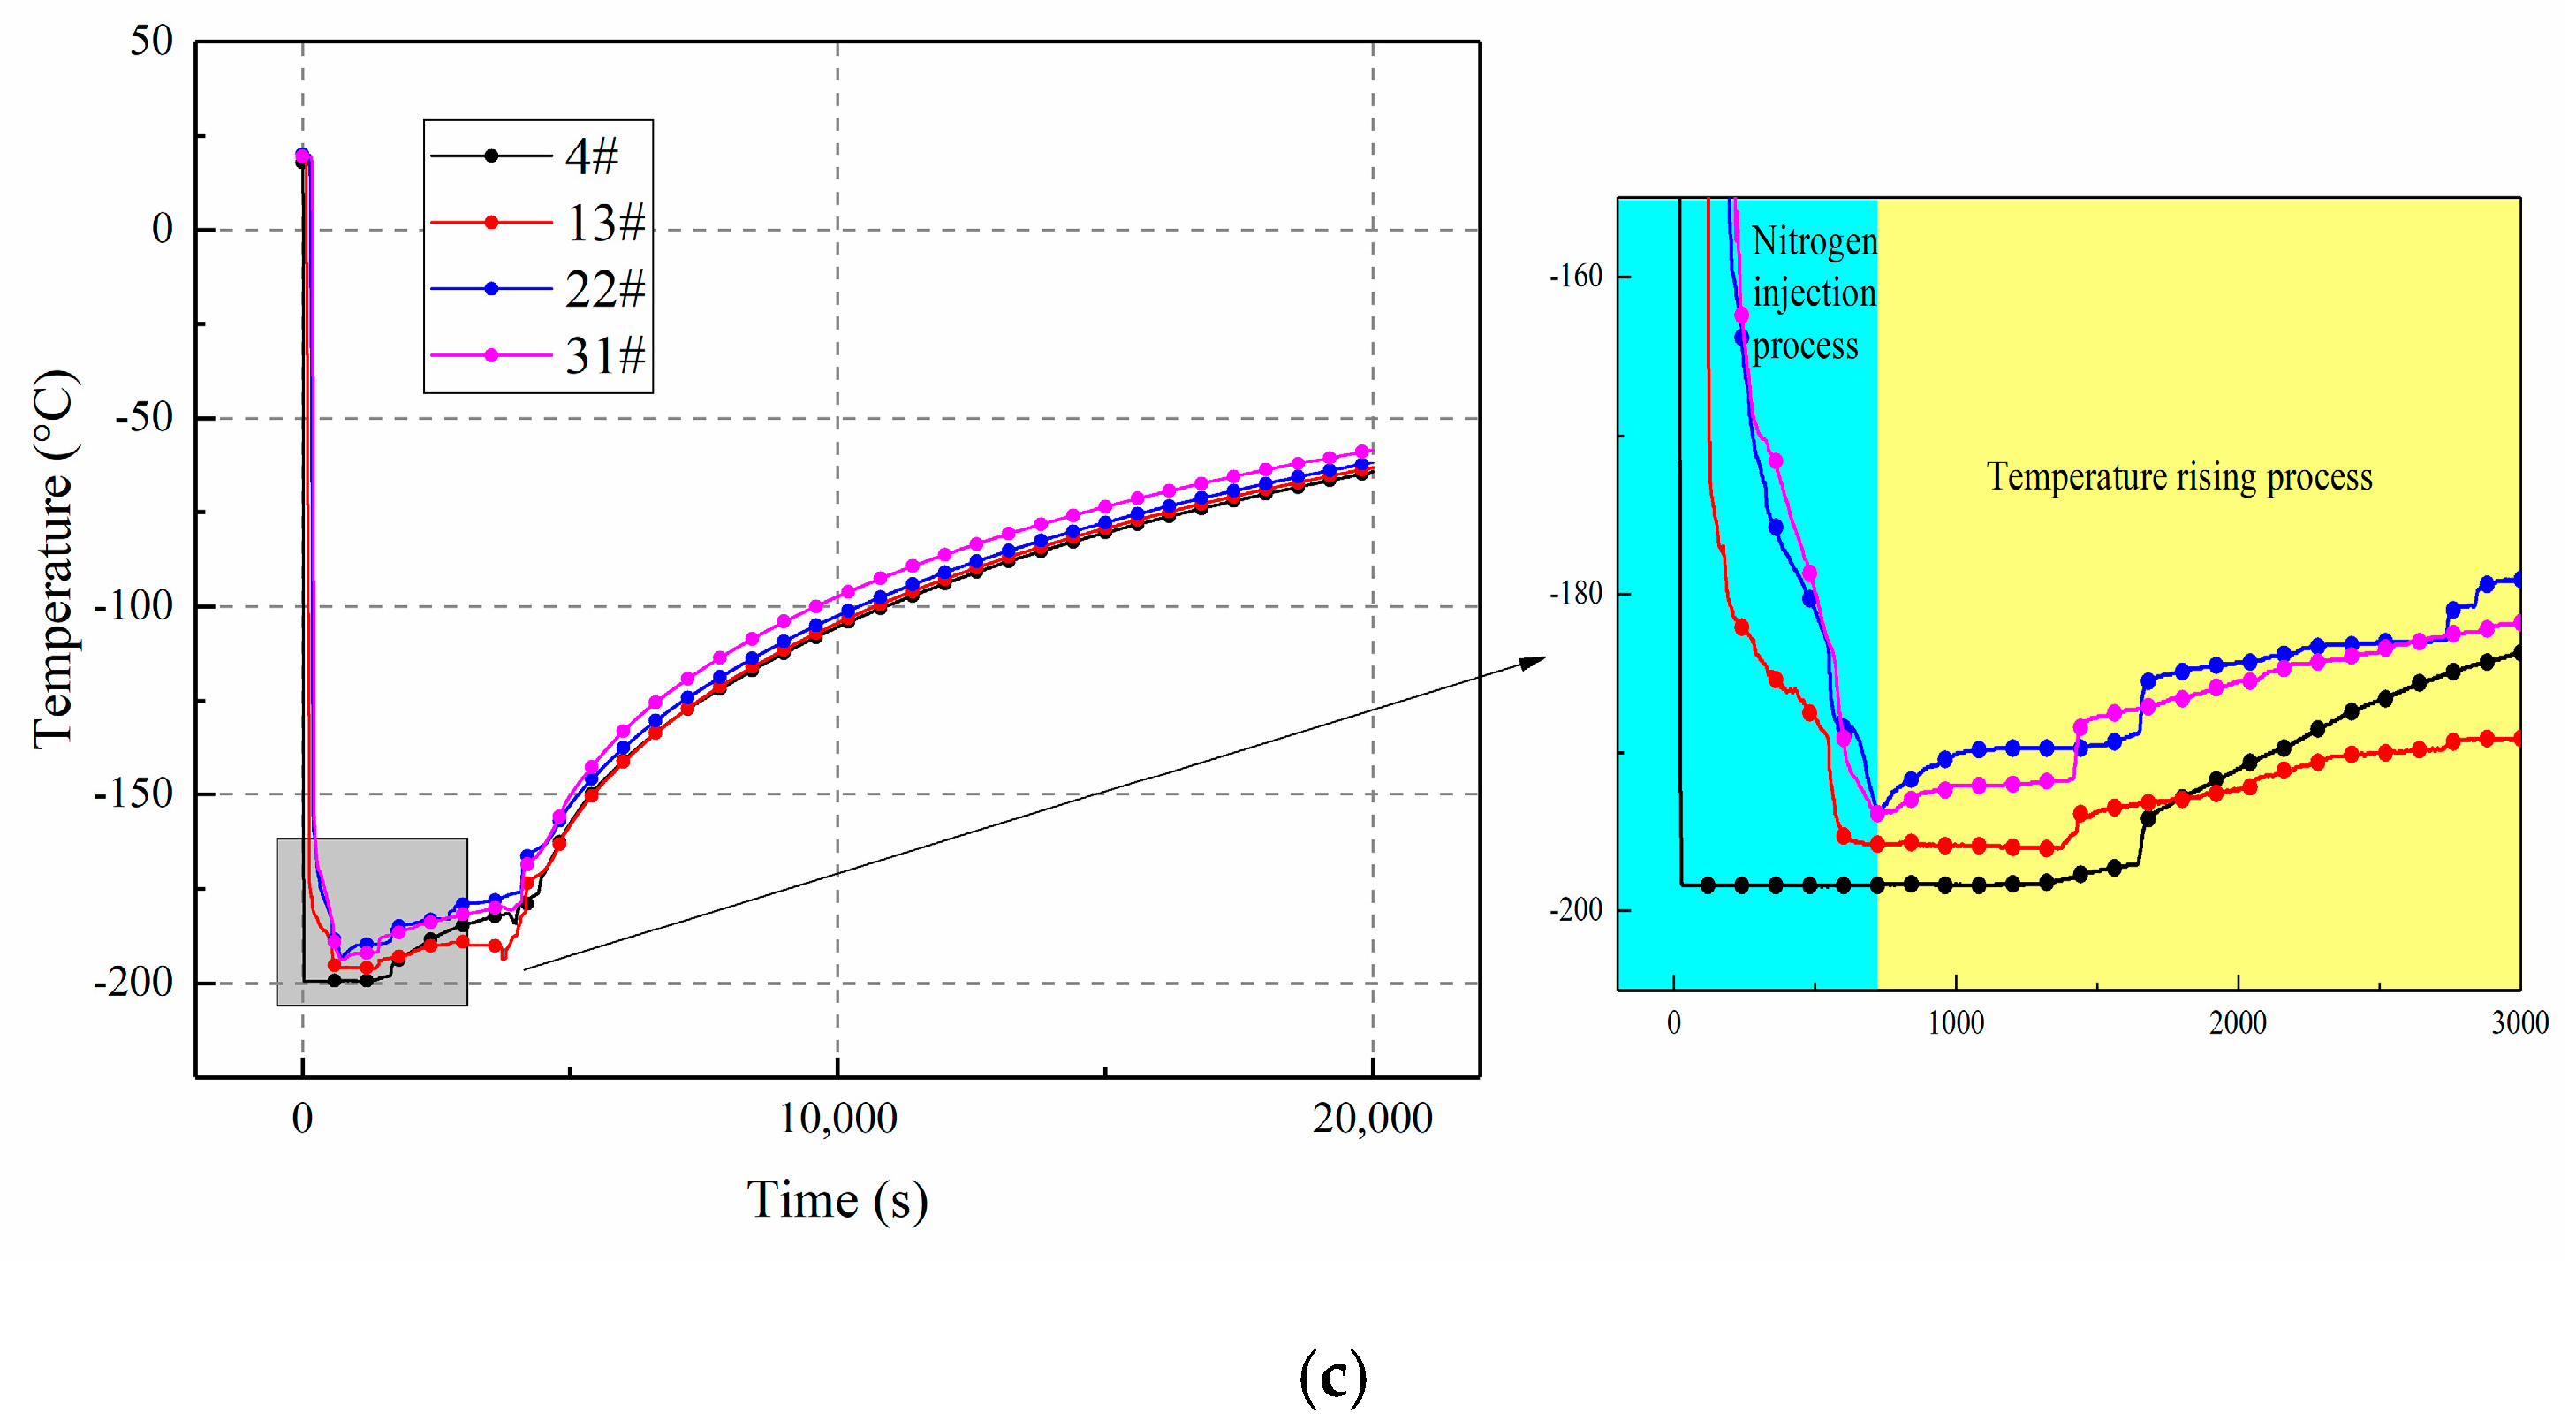
3.1. The Temperature Distributions in a Loose Medium along the X-Axis

Taking the No. 1 test as an example, the total mass of the liquid nitrogen injection was 13.2 kg, the time of injection process was 710 s, and the average mass flow rate was 0.0186 kg/s. Test 1 was the basic experiment, without the influence of the inclination angle (and this test shows a more intuitive performance of the temperature’s distribution). Figure 3 shows the central axis’ temperature distribution in the loose medium model along the X-axis, and (a), (b), and (c) indicate the upper, middle, and bottom layers, respectively.
In Figure 3a, after the liquid nitrogen was injected into the loose medium, the temperature closest to the injection inlet dropped first, because the position of 6# in the upper layer was below the injection port and in direct contact with the liquid nitrogen. The temperature rapidly dropped to −196 °C, which persisted for about 800 s. When liquid nitrogen ceased to be injected, the direct heat transfer of liquid nitrogen no longer continued at position 6#. The vaporized cryogenic nitrogen gathered near position 6# for a short time, so the temperature was kept at −196 °C for 90 s longer than the injection time. However, gases with large molecular spacing had difficulty conducting heat. Therefore, the temperature of 6# began to rise quickly after 800 s, and the heating rate was quite fast. The temperatures of the remaining three points (15#, 24#, and 33#) at the same height only dropped above 0 °C during this process. This result is reasonable because these three points were not directly in contact with the liquid nitrogen, and the cooling rate decreased with an increase in the distance from the inlet. The small drop in temperature was driven by liquid nitrogen gasification, which produced cryogenic nitrogen gas that diffused to these positions. Heat exchange also occurred. The thermal conductivity of the gas was small, which was unfavorable for heat conduction, and the heat in positions 15#, 24#, and 33# was difficult to derive. When the liquid nitrogen stopped being injected, the flow state of the upper gas started to make a transition from forced convection to natural convection, and the upper layer was heated by the warm air on top of the model, which was not perfectly insulated.
The graphical curve trend of Figure 3a,b was similar. This curve was also due to the vertically downward direction of nitrogen injection and the direct contact between 5# and liquid nitrogen causing the largest cooling rate. The lowest temperature of the other three points (14#, 23#, and 32#) was about −30 °C, among which the minimum temperature from low to high was found in 14#, 23#, and 32#. As the distance from the inlet increased, the minimum temperature gradually increased, and the cooling rate gradually decreased. The temperatures in the position not in direct contact with liquid nitrogen in the middle layer were 30 °C lower than those in the upper layer because nitrogen gas has the characteristic of gravity sedimentation [20] inside the loose medium. Thus, the low-temperature nitrogen gas migrated downward. In addition, in the middle layer, the heat exchange with the outside warm air was less, and the cold insulation was better than that of the upper layer. Thus, the temperature in the middle layer was lower than that in the upper layer.
The temperature changed as liquid nitrogen flowed to the bottom layer, as shown in Figure 3c. Liquid nitrogen flowed through the upper and middle layers to the bottom layer, and due to the accumulation of liquid nitrogen, the loose medium in the bottom layer remained in contact with the liquid nitrogen, leading to heat transfer via liquid nitrogen boiling. Liquid nitrogen boiling took away a great quantity of heat, and the heat exchange intensity was much larger than that without a phase change, so the bottom temperatures were all close to the boiling point of the liquid nitrogen.
The boiling heat transfer effect in the bottom layer was the best, and its duration was the longest. The cooling rate decreased with the distance from the nitrogen injection inlet. Position 4# was right below the nitrogen injection inlet, where the cooling rate was the fastest, and the other three positions (13#, 22#, and 31#) had a slight delay in cooling along the flow direction of the liquid nitrogen. Along the X-axis direction, the contact time between the loose medium and the liquid nitrogen was gradually reduced, and the heat exchange amount was gradually decreased in the surrounding low-temperature nitrogen atmosphere, so the lowest temperature increased slightly. When the time reached 710 s (the nitrogen injection time), the temperatures of 4# and 13# basically remained stable, while the temperatures of 22# and 31# continued to cool. The two points of 22# and 31# were slightly far from the nitrogen injection inlet, and the two heat exchange modes in the boiling heat exchange and cryogenic nitrogen heat exchange coexisted. Therefore, the temperatures and times of 22# and 31# were marginally delayed compared to 4# and 13# during the boiling heat exchange. However, as seen in Figure 3c (the enlarged image), the temperature did not start to rise at a rapid rate around 710 s. Instead, at 3700 s, there was an inflection point, and the rate of the temperature increase was extremely high. This occurred because the liquid nitrogen accumulated in the bottom layer through a long-term injection, and the bottom layer’s loose medium was rapidly cooled. The boiling of the liquid nitrogen removed a significant amount of the heat from the loose medium in the bottom layer, and the effect of the bottom insulating layer kept the temperature at a relatively low temperature for a long time. At around 3700 s, the liquid nitrogen was completely vaporized, and the heat exchange intensity of the cryogenic nitrogen was poor, thereby accelerating the rate of temperature increase.

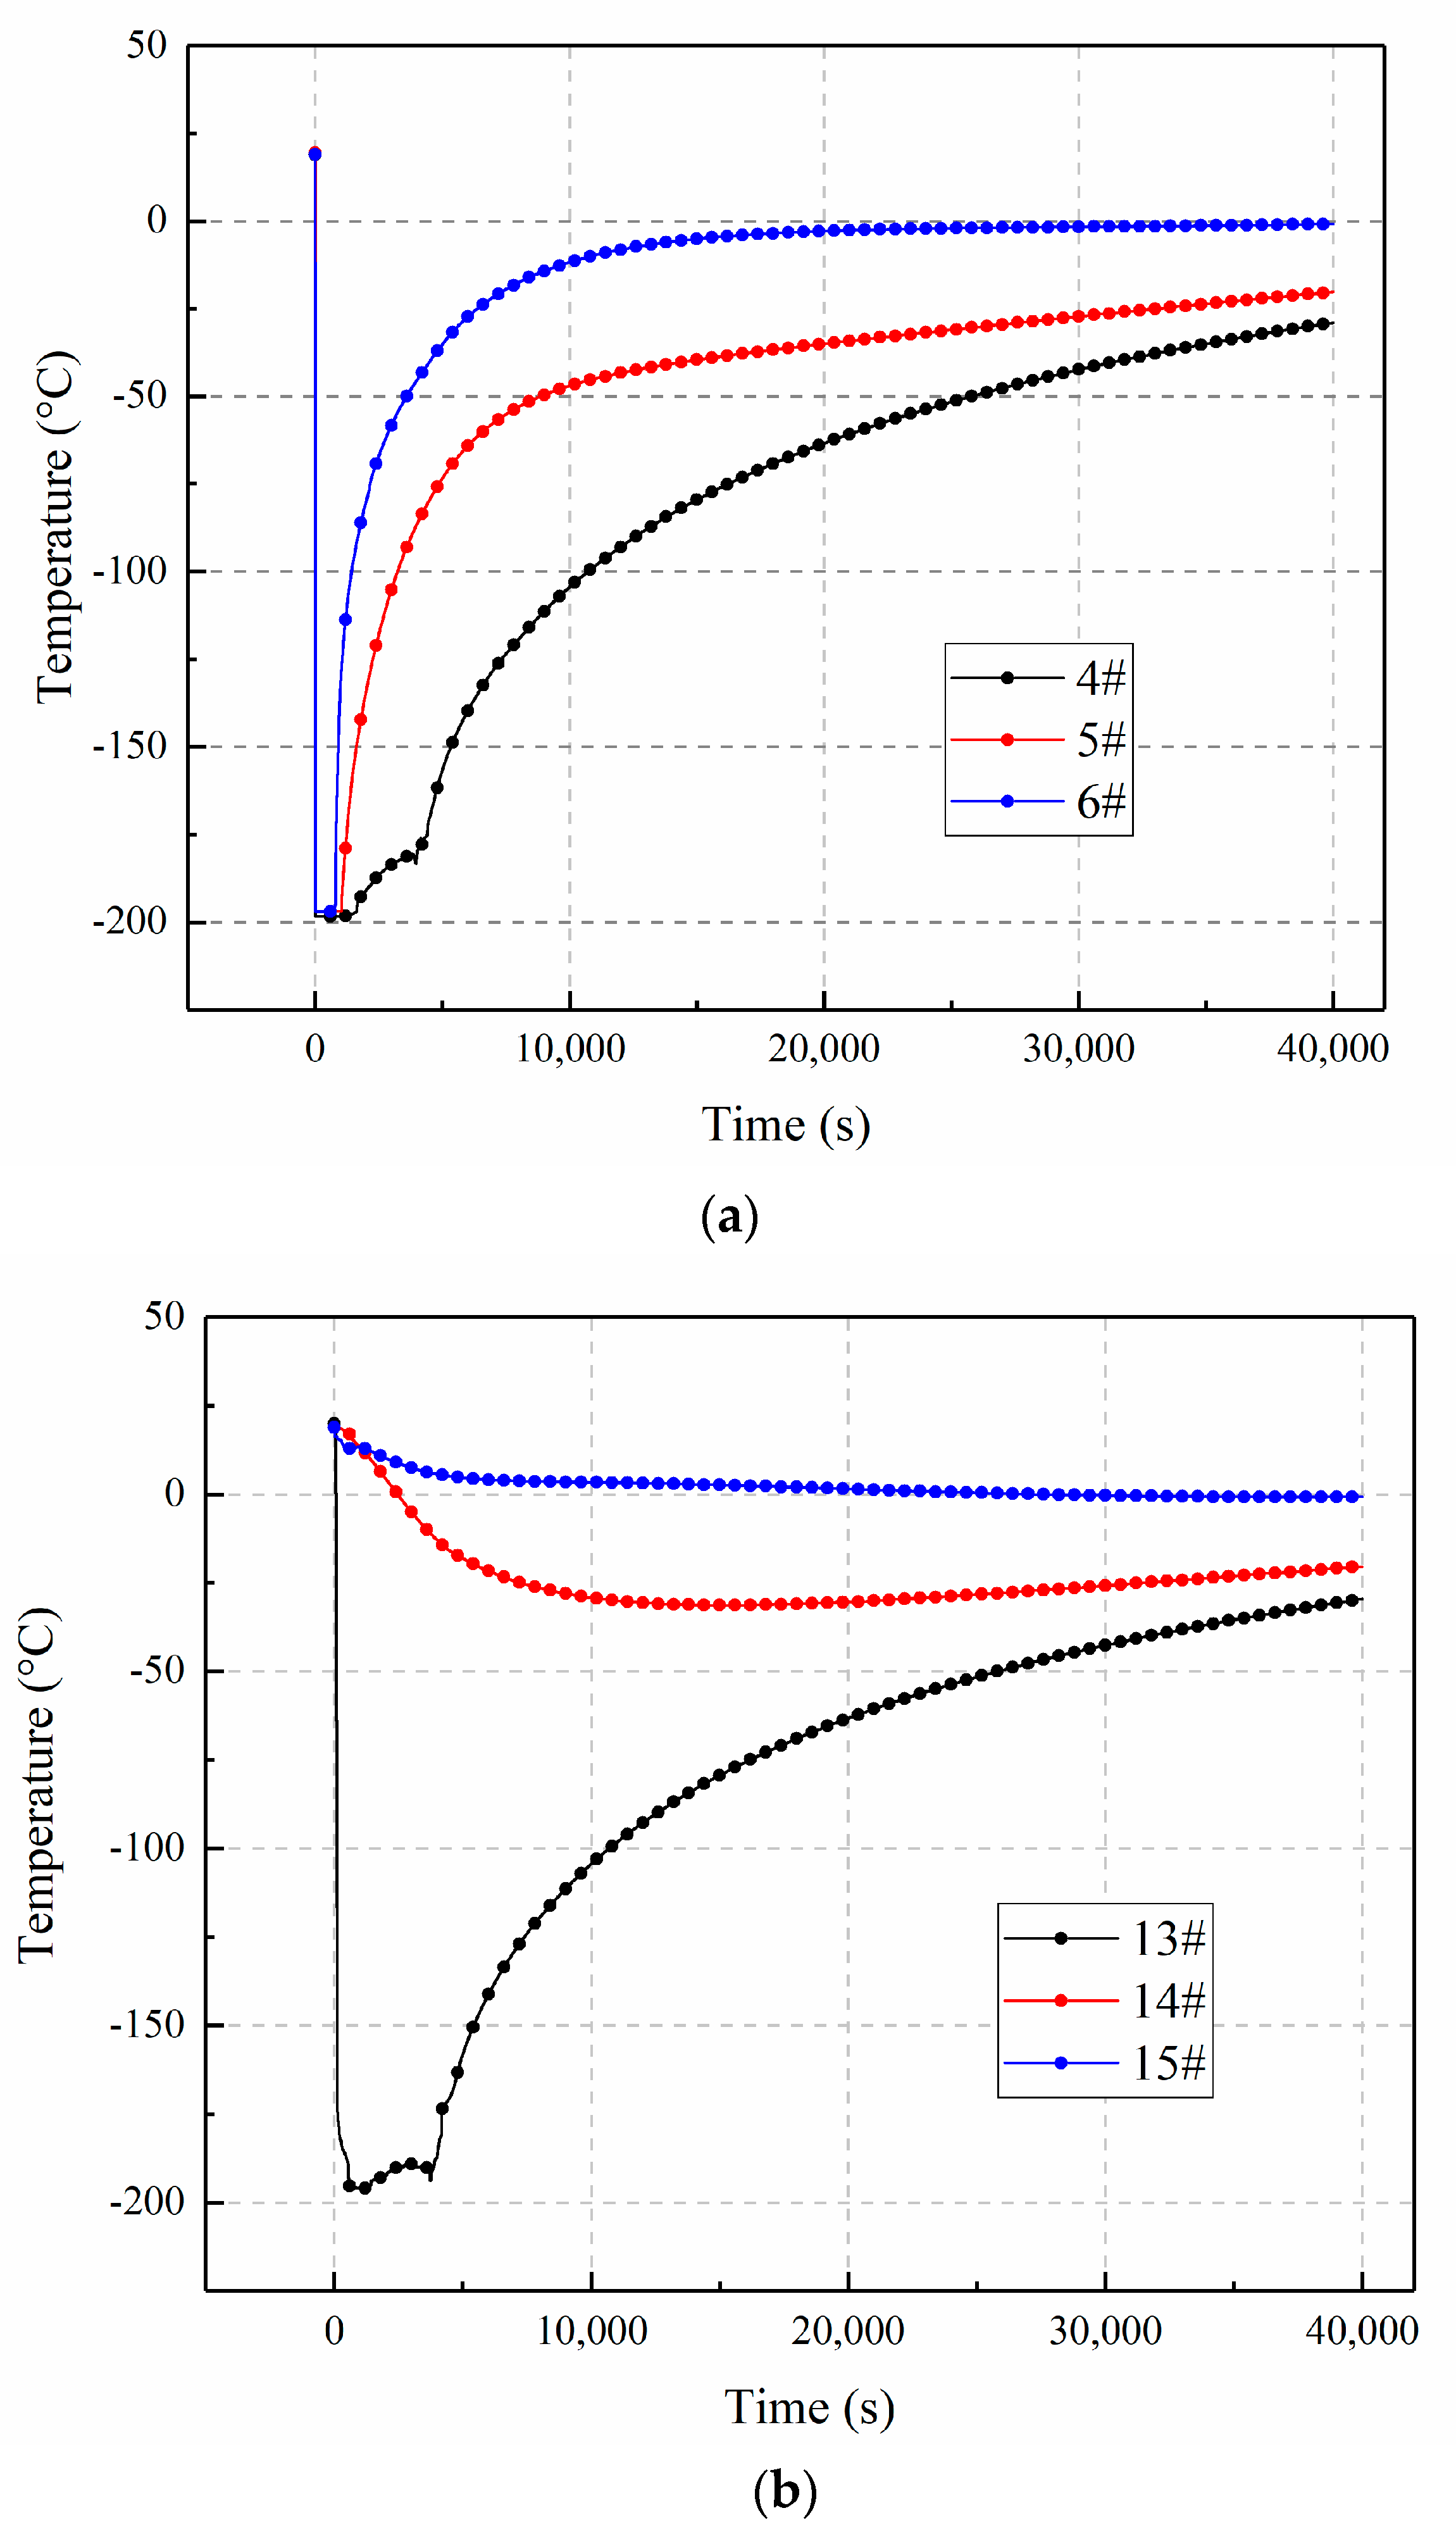
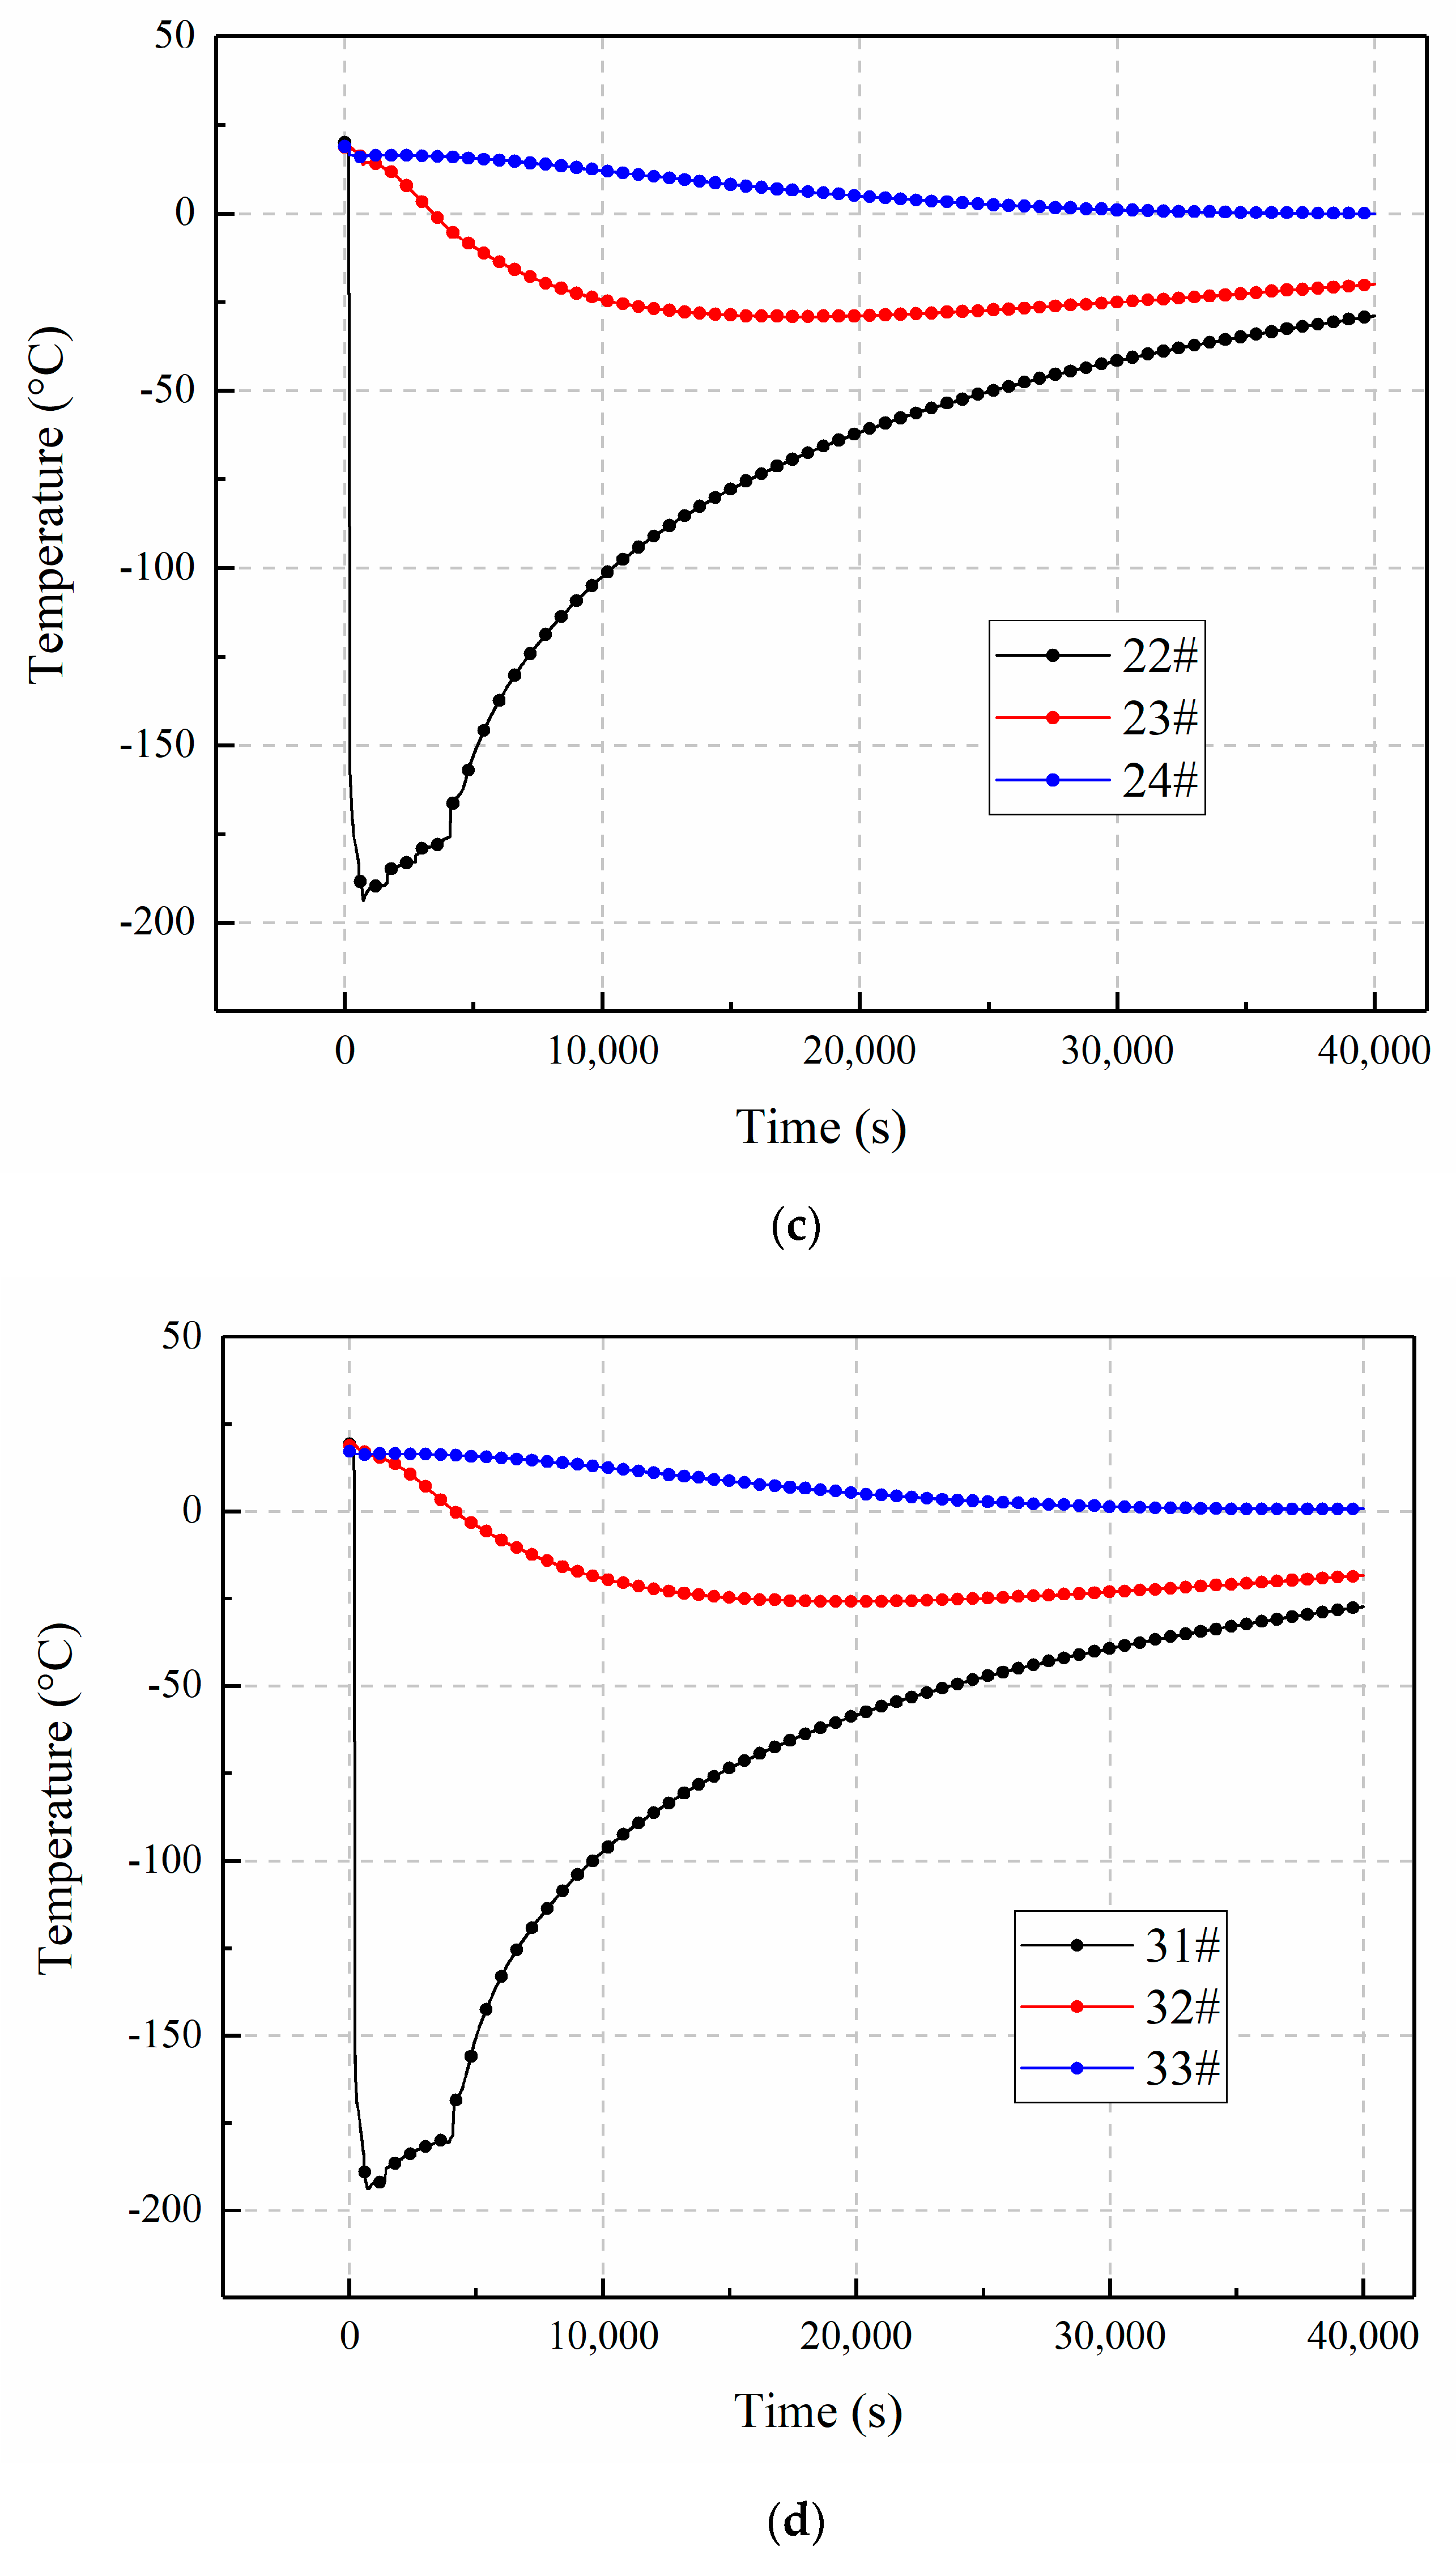
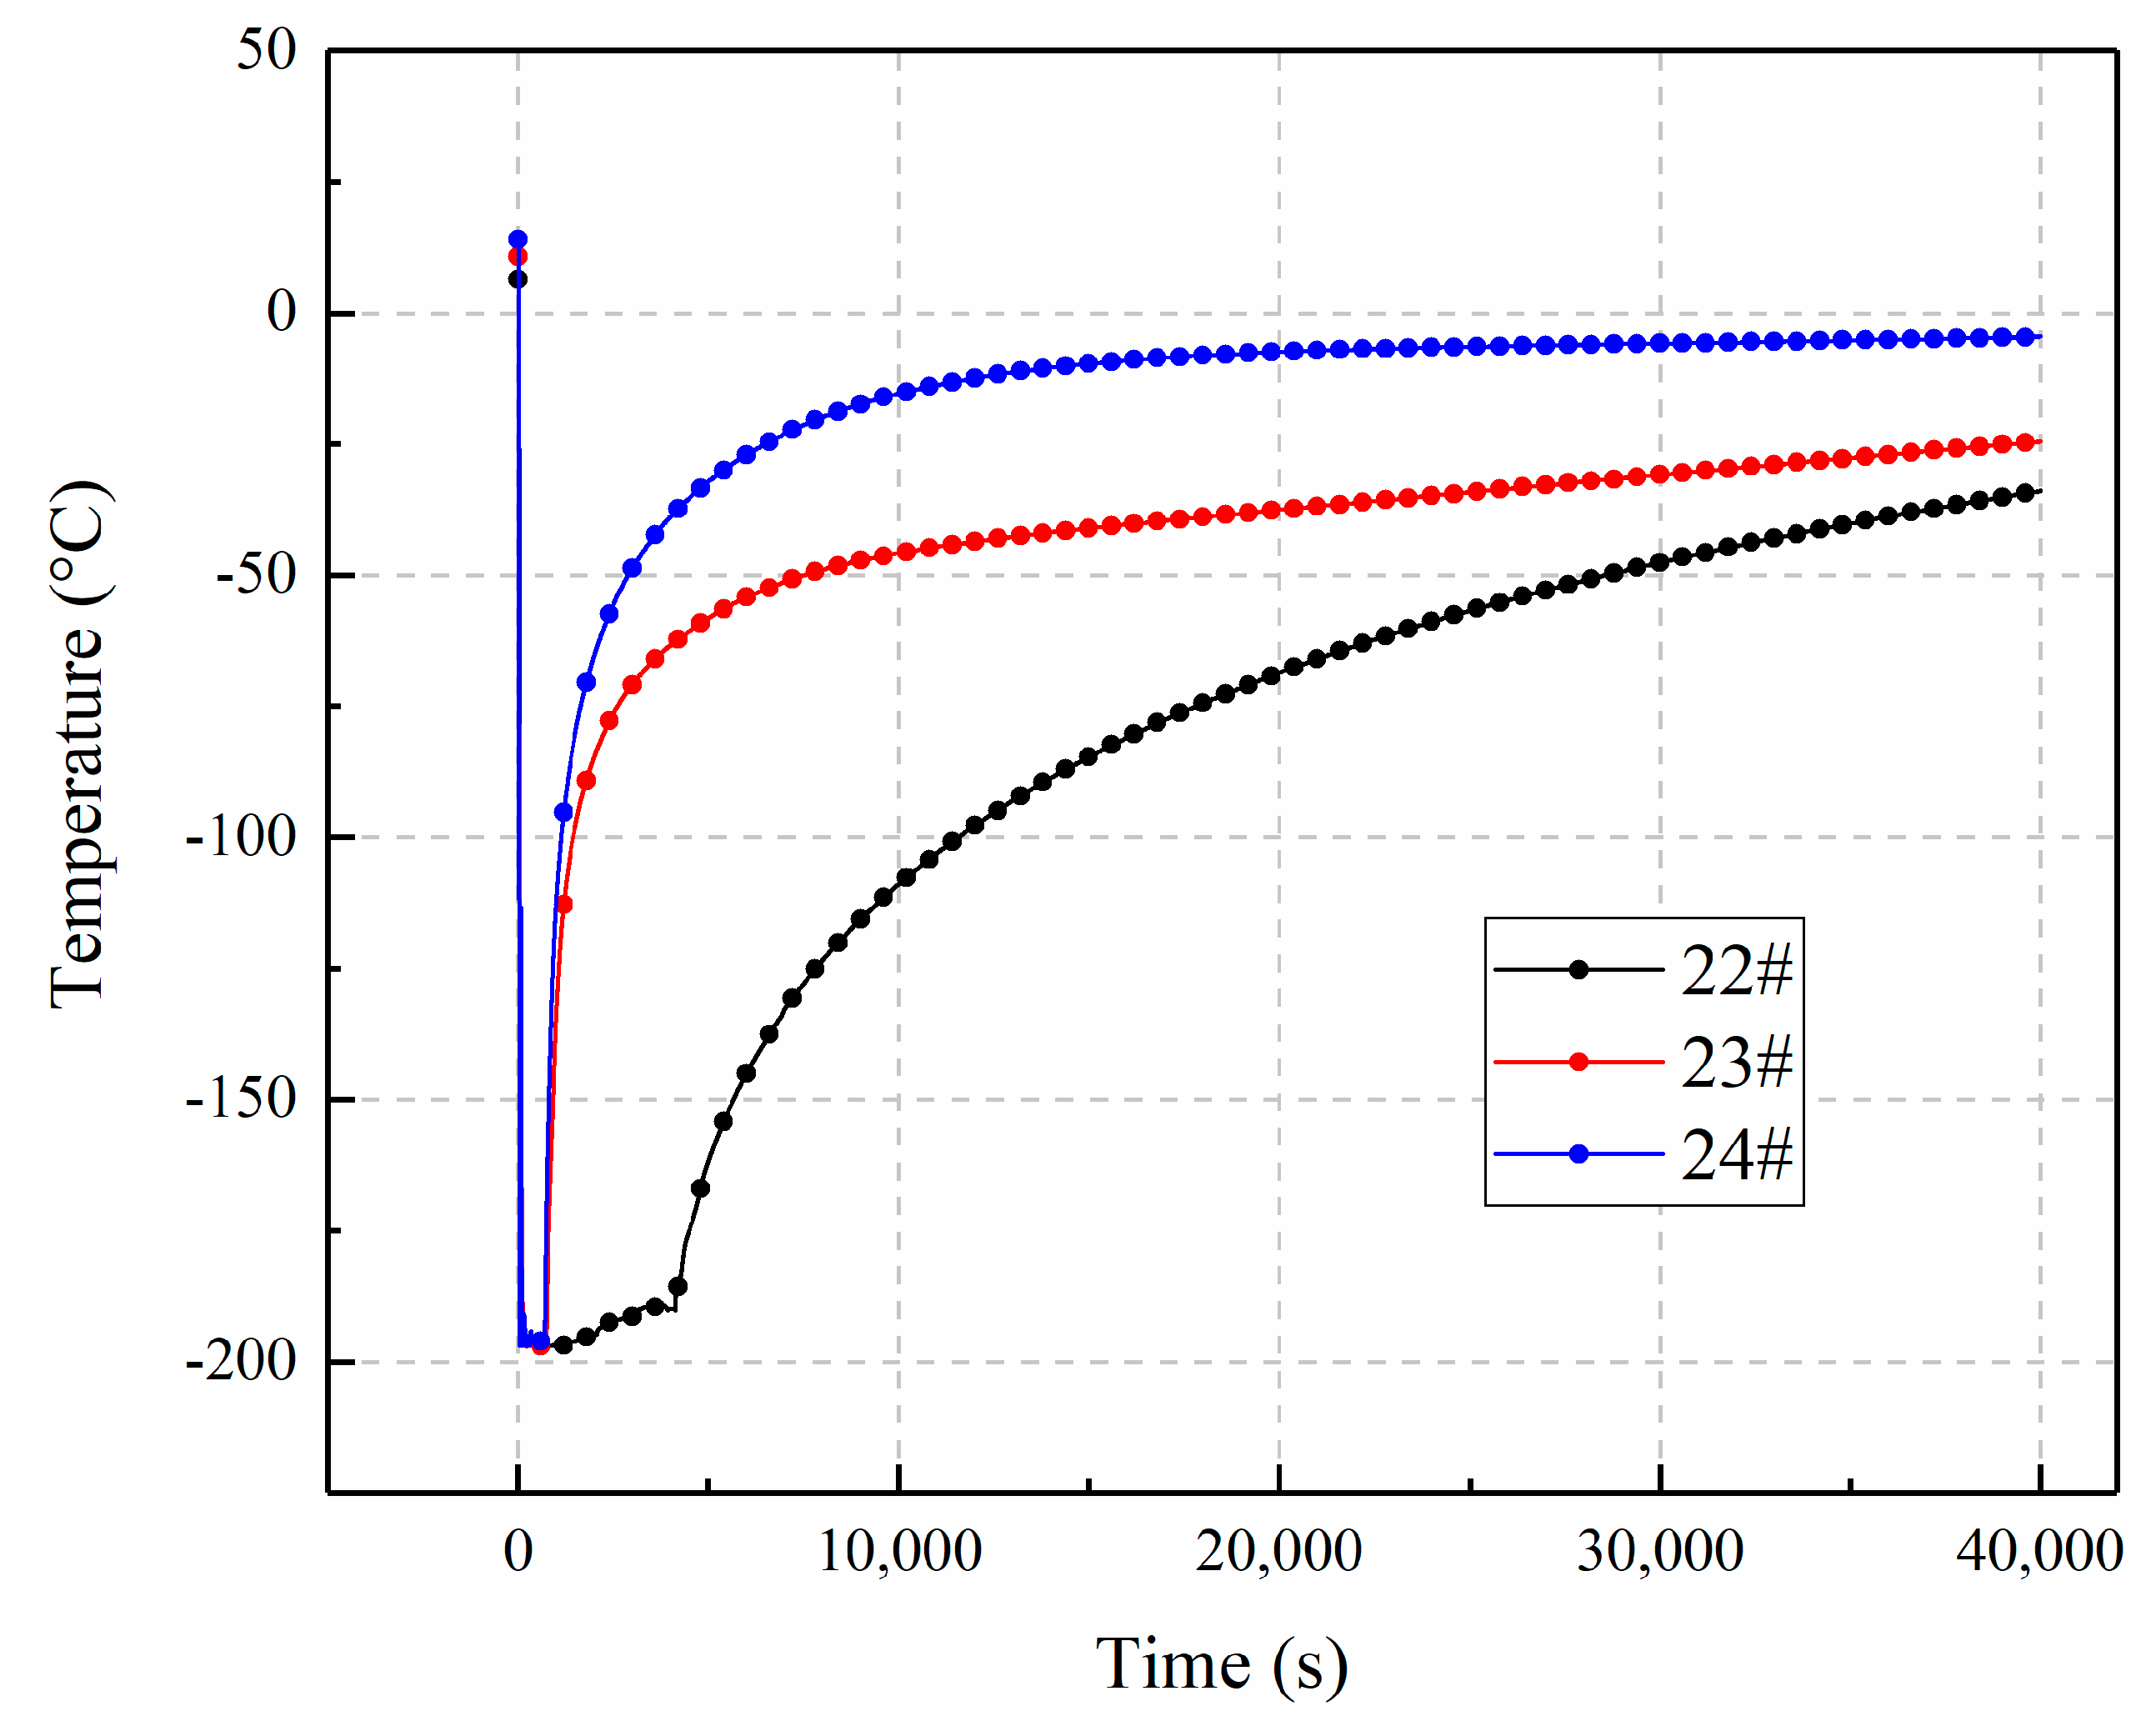
3.2. The Temperature Distributions in a Loose Medium along the Z-Axis

The temperature variations along the central Z-axis are shown in Figure 4. The points along the Z-axis were divided into four groups, from column 1 to column 4, whose distances were gradually increased from the horizontal position of the nitrogen injection inlet. Column 1 was located directly below the nitrogen injection inlet 1, and its temperature changed as shown in Figure 4a. The liquid nitrogen flowed through the 6#, 5#, and 4# positions in turn, accumulating at the 4# position of the bottom layer, and the temperatures of the three points were all lowered to −196 °C or less. After stopping injection, the temperature at the 4# position began to rise first, followed by that of 5# and 6#. Due to the accumulation of liquid nitrogen in the 6# position, after the liquid nitrogen was completely boiled and vaporized, the temperature of 6# started to rise rapidly (beginning around 3800 s) as its heating rate increased rapidly.
The tendencies of columns 2, 3, and 4 were quite similar. At positions 15#, 24#, and 33# in the upper layer, the temperature of the whole process was slightly decreased to 1.5, 4.9, and 5.2 °C, respectively, when the data were recorded for 20,000 s. Subsequently, at the time of 40,000 s, the temperatures in 15#, 24#, and 33# were −0.7, 0, and 0.7 °C, respectively. It was found that the temperatures in the upper layer continued to fall after stopping injection and could be maintained for a long time. This could be explained by the cryogenic nitrogen diffusion process. There were three stages during the diffusion of the vaporized nitrogen: The gravity sedimentation stage, the vaporization expansion stage, and the passive diffusion stage. The direction of the injected liquid nitrogen was vertically downward, thereby generating a downward initial momentum. Gravity sedimentation occurred after the liquid nitrogen’s vaporization to cryogenic nitrogen whose movement was dominated by inertial force, so the cryogenic nitrogen migrated downward. Subsequently, the initial momentum of the cryogenic nitrogen disappeared and then transitioned into the vaporization expansion stage. The forces that dominated the gas movement were gravity and reverse buoyancy. After a period of mixing, under the effect of gas convection diffusion in the model, the influence of gravity’s driving force gradually disappeared, and the cryogenic region gradually diffused from the bottom to the upper layer. Thus, the temperature of the upper layer of 15#, 24#, 33# continued to decrease. Similarly, for the 14#, 23#, and 32# positions of the middle layer, the gravity sedimentation effect made the intermediate layer temperature drop faster than the upper layer. Eventually, the temperatures within the model tended to be consistent.
The temperature variations under inlet 2 in the loose medium with a 0° inclination are shown in Figure 5. The injection parameters were as follows: The total mass of the liquid nitrogen injection was 13.1 kg, the time was 690 s, and the average mass flow rate was 0.0190 kg/s. The 22#, 23#, and 24# positions were located below inlet 2, and the direction of the nitrogen injection was vertical and downward, making the temperatures decrease almost simultaneously while the cooling rates remained almost the same. These three positions were in direct contact with the liquid nitrogen, in which the loose medium was boiled quickly to remove heat. In this way, the temperatures declined to about −196 °C. After stopping the injection of liquid nitrogen, the temperature of position 24# in the upper layer ascended first. Then, the temperature of position 23# in the middle layer rose a few seconds later. Finally, at a time of 4100 s, the temperature of 22# in the bottom layer began to accelerate. After the middle and upper layers were cleared of liquid nitrogen, the temperature rose at an extreme rate. This occurred because the energy transmitted by a loose medium through heat exchange cannot maintain the low temperature of −196 °C, and the loss of a cold source affected the maintenance of temperatures. Among the positions, the temperature rising rate of position 24# in the upper layer was the fastest because of its gravity sedimentation coupled with the upper air heat transfer effect. The cryogenic nitrogen concentration in the middle layer was higher than that in the upper layer, so the temperature rising rate in position 23# was second. As liquid nitrogen accumulated in the bottom layer, its vaporization took a long period of time. This phenomenon retained a low temperature for 4100 s in this experiment. When the accumulated liquid nitrogen was completely consumed, the temperature started to rise rapidly, and the cryogenic nitrogen was deposited into the lower layers, where the temperature rising rate was lower than that of the upper and the middle layers, which remained at about −63 °C after 20,000 s.

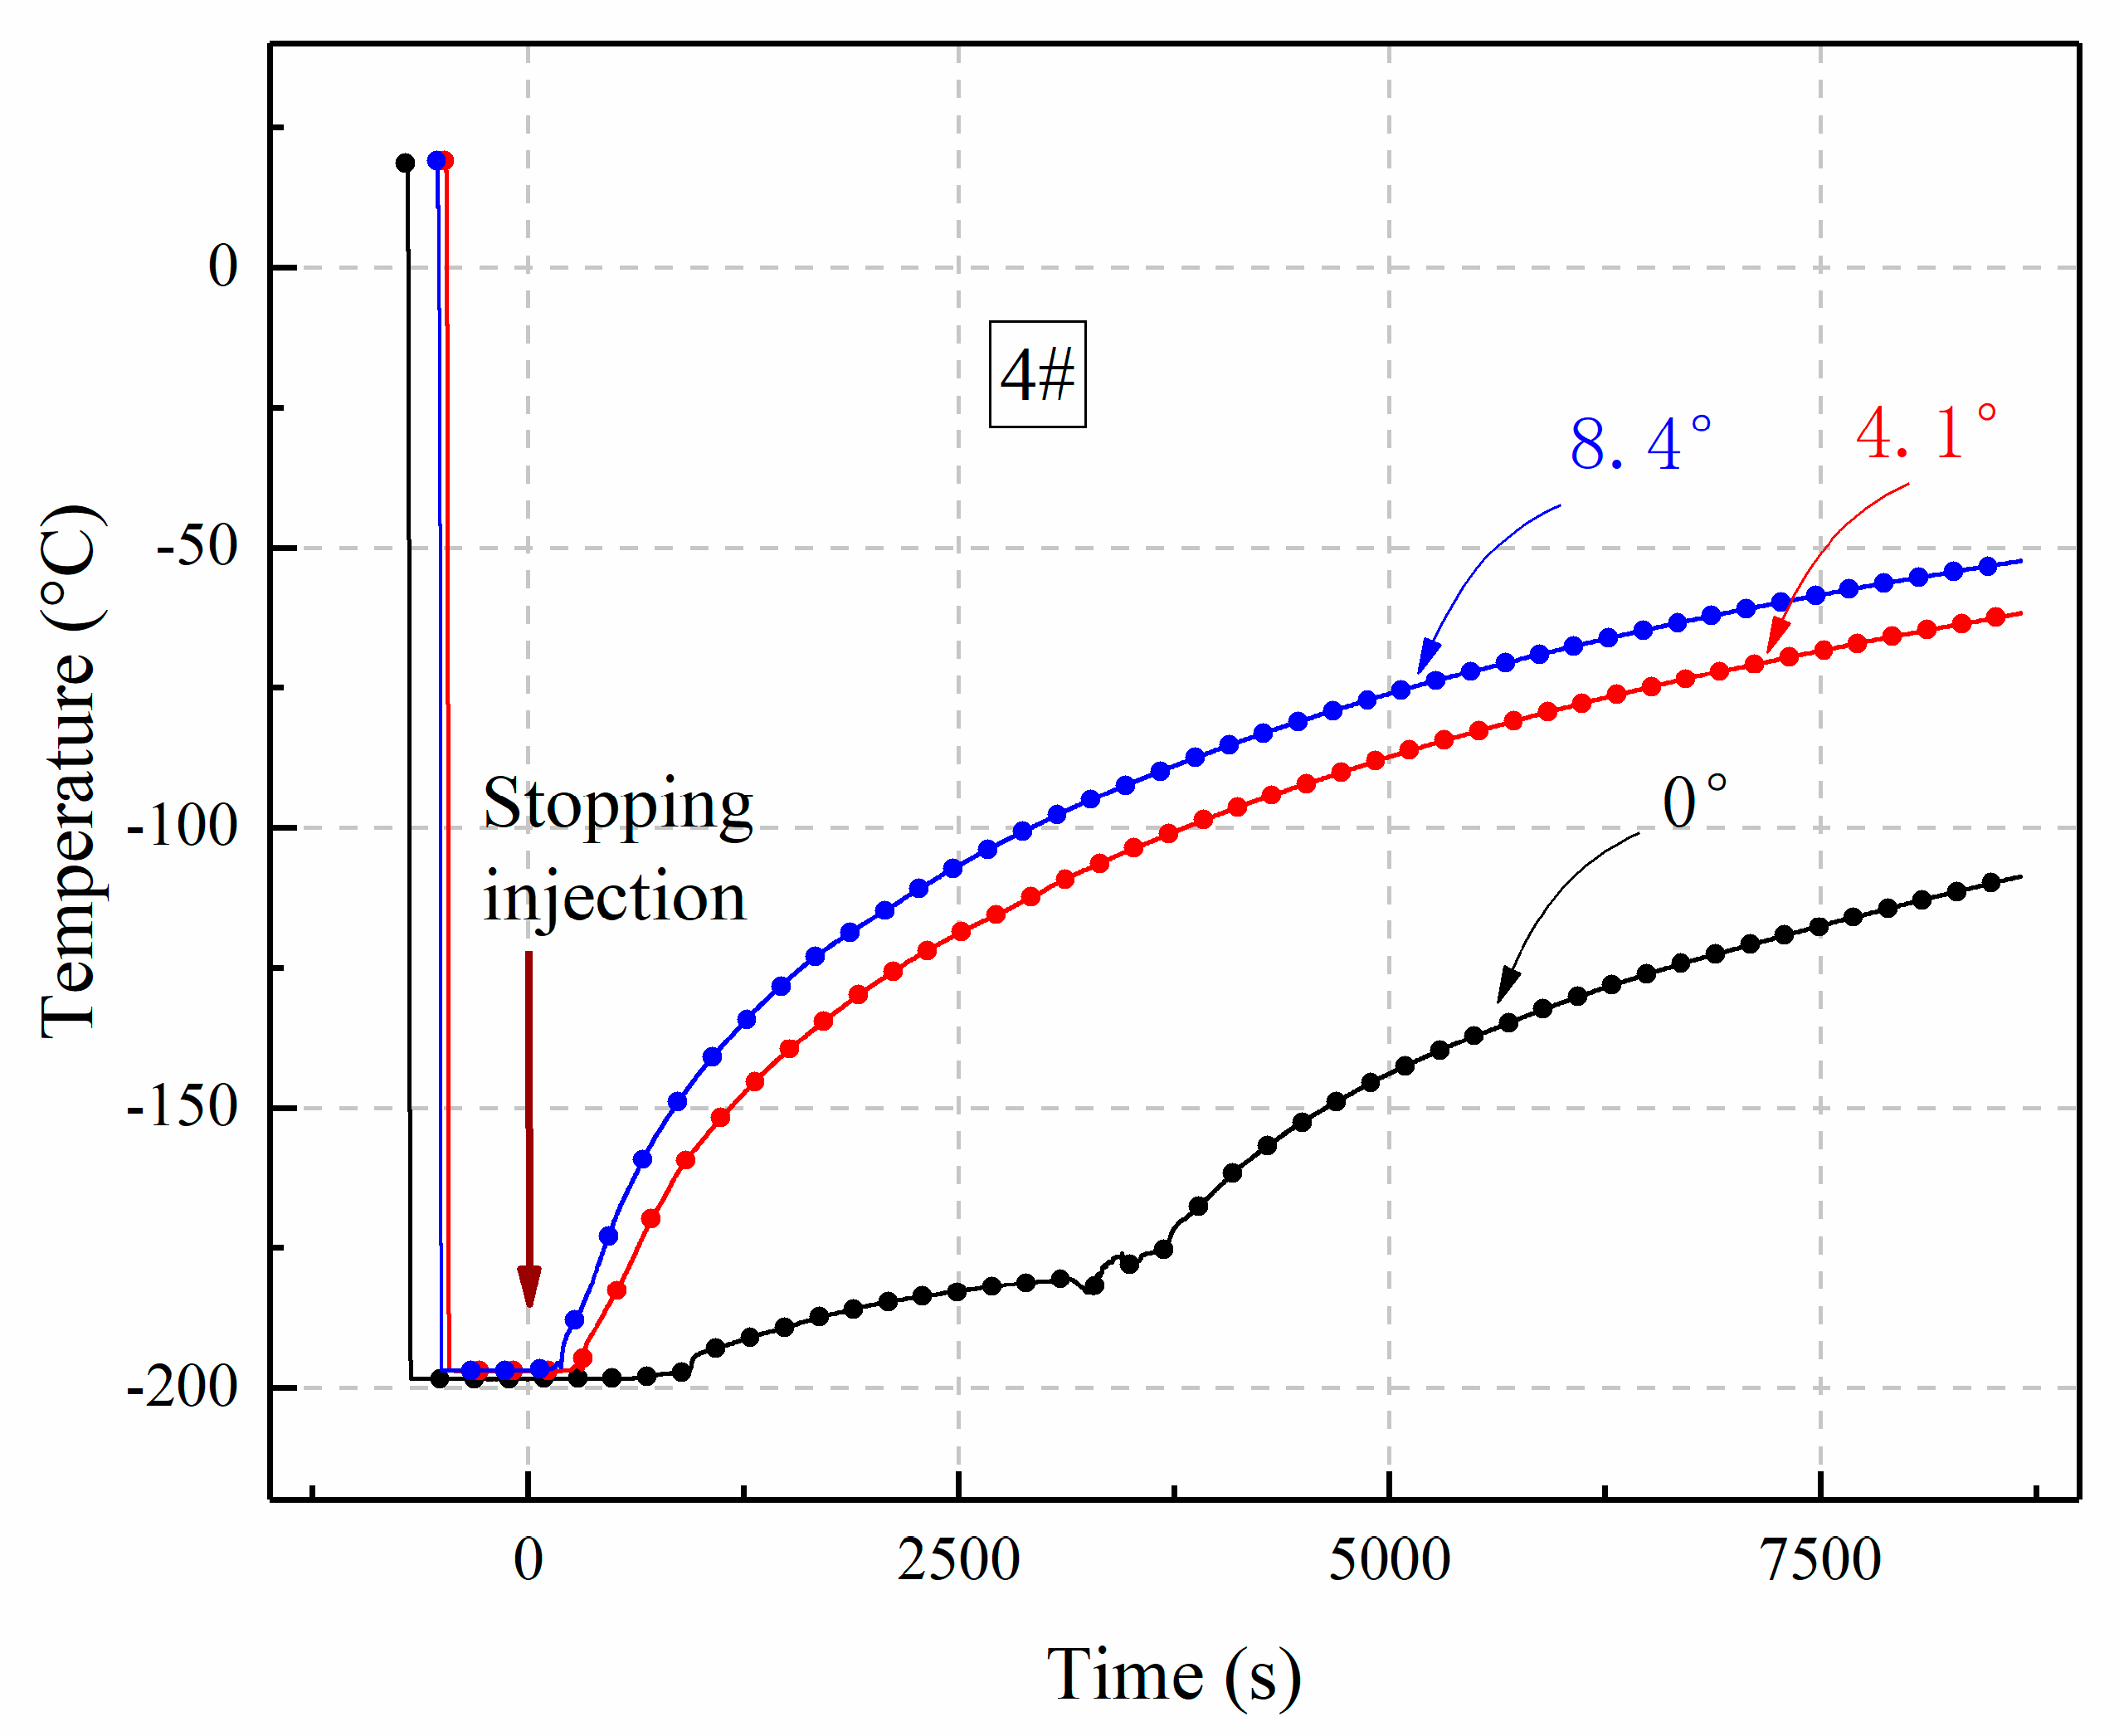
3.3. The Influence of Inclination Angle Variation on Temperature

The inclined angle in the coal seam usually influences the flowing state of liquid nitrogen injected in coal mine goafs. Figure 6 shows the temperature variation of position 4# in the bottom layer after the injection liquid nitrogen, as the model featured three different inclination angles, 0°, 4.1°, and 8.4°. In order to more intuitively and clearly determine the temperature change during the entire process of liquid nitrogen injection in the model, the stopping injection time at 0 s was uniformly calibrated in these three different inclinations; that is, liquid injection was carried out before 0 s and stopped after 0 s. It can be seen that in the initial stage of nitrogen injection, the loose medium in the bottom was immersed in liquid nitrogen due to the continuous inflow, and the temperatures all decreased significantly to −196 °C at three angles. When the nitrogen injection was stopped, the experimental conditions with the inclination angle cannot accumulate liquid, so the temperature at an angle of 8.4° began to rise first, followed by 4.1°. At an inclination angle of 0°, the loose medium remained at −196 °C for 900 s, after which the temperature rose slowly and started to accelerate at around 3300 s. During the temperature rising process, the temperature rising rates of the three angles were relatively close. After 8600 s, the temperatures with angles of 4.1° and 8.4° can still be kept below −50 °C, and 0° can be kept below −100 °C.
Inlet 2’s nitrogen injection was positioned directly above column 3 with a horizontal distance of 30 cm from column 1. The main gas outlet was on the right side of the loose medium model. The joint between the top and side wall of the model was sealed with a sealant. Inevitably, there was still a very small amount of gas leakage. In addition, according to Lu et al. [21], the gas leakage had little influence, so it can be ignored in this study. Figure 7 shows the influence of nitrogen injection inlet 2 on the temperature of position 4# at different inclination angles. The time of 0 s was the moment where we stopped injection. Times before 0 s represent the continuous injection stage. At this stage, the temperatures dropped sharply at inclination angles of 0° and 4.1°. The temperature decreased to −150 °C at 4.1° and to −196 °C at 0°. However, when the model angle was 8.4°, the temperature during the entire process remained at the initial temperature (the ambient temperature) in the model without significant changes, thereby illustrating that, in this case, the cooling effect of liquid nitrogen was not exerted. This phenomenon is related to the flow state of liquid nitrogen and cryogenic nitrogen. When the angle was 0°, the liquid nitrogen reached the bottom of the loose medium and flowed to the periphery, so the horizontal bottom was able to contact the liquid nitrogen for a long time at −196 °C. After the liquid was gradually vaporized, the pressure in the model increased, and the gas flowed in the direction of the outlet where it could be released. When the angle was 4.1°, there was no motivation for the liquid nitrogen to flow on the slope when it reached the bottom. It could only depend on the inertia of the liquid nitrogen’s diffusion around the contact point between the liquid nitrogen and the bottom to push a small amount of liquid to the position close to 4#. Further, the cryogenic nitrogen that vaporized from a liquid spread to the surroundings, so the temperature of position 4# position decreased to −150 °C. When the angle was 8.4°, the vertical height of the model was raised by 14.6 cm, and the liquid nitrogen could not completely approach position 4# by inertia. Meanwhile, it was obvious that within the time range of 9000 s, the cryogenic nitrogen was unable to diffuse to position 4# due to gravity sedimentation. The gas forming the laminar flow in the model was discharged along the outlet, and turbulence may not have been formed in the model to improve heat transfer efficiency. Therefore, the temperature at position 4# was unable to be significantly reduced, so the liquid nitrogen did not play a role in decreasing the temperature in this condition.

3.4. Effective Chilldown Zone

According to the Leidenfrost effect, the heat exchange efficiency of liquid nitrogen during film boiling was lower. As the temperature decreased to the Leidenfrost point, the boiling state changed from film boiling to a transitional boiling state or a state between the liquid dominated chilldown in nucleate boiling, where there was better heat conductivity. There are many methods to acquire T L . In the present study, a more accurate Berenson’s method was applied to obtain a T L value of −129.4 °C, according to Equation (1) [34]. This paper defines an effective heat exchange zone below this temperature, at which the heat transfer effect was the best in both the liquid and gas states. According to this temperature, the critical temperature was also used to set the effective chilldown of nitrogen gas at a low temperature as the same temperature used for the liquid state.
In Figure 8, the temperatures in the area below −129.4 °C are colored from light blue to dark blue. Figure 8 illustrates the temperature distribution contours over time on the central axis under tests 1, 2, and 5 (respectively at 30 s and 100 s, stopped injection time, as well as 4000 s and 8000 s). It was found that after the liquid nitrogen was injected, the temperatures in the region where the liquid nitrogen flowed were reduced to −196 °C. In addition, the gravity sedimentation of the cryogenic nitrogen caused the low-temperature region to be distributed to the lower parts of the model, while it was difficult for temperatures in the middle and higher areas to decrease very low. At each stage of the chilldown process, from 30 s to 8000 s, high temperatures, represented by the red portion, were present in the upper and middle parts of the model. In Figure 8a, when the angle was 0° and the injection inlet was 1, the most obvious temperature drop occurred in the area where liquid nitrogen flowed before the end of nitrogen injection. After the end of nitrogen injection, the cryogenic gas expanded and diffused for a period of time, and the low-temperature region gradually increased, causing the temperature to remain relatively consistent.
In Figure 8b, since the nitrogen injection point was inlet 2, the region where the temperature was first lowered remains around inlet 2, while liquid nitrogen flowed to the periphery in the loose medium. The liquid nitrogen flowing to the bottom diffused in all directions, while the cryogenic nitrogen flowed by forced convection due to the large pressure in the model, and its flow direction trended toward the outlet position (unlike the liquid nitrogen, which spread). As the injection of the liquid nitrogen was stopped, and the pressure inside the model was gradually relieved, the internal gas of the model gradually entered the passive diffusion stage. The temperature distribution counter at an angle of 8.4° in inlet 1 is described in Figure 8c. It can be seen that at 100 s, the flow area in (c) is larger than that in (a). This difference is due to the downward gravity of liquid nitrogen, resulting from the inclination angle of the model. Therefore, liquid nitrogen migrated faster in the direction of lower gravitational potential energy. Simultaneously, the time for liquid nitrogen to stay on the bottom surface was shortened, and no cryogenic region in blue existed at 4000 s.
A quantitative description of the effective chilldown volume in the model is presented in Figure 9. As the model angle increased, the effective chilldown volume decreased significantly. When the angle was 0°, the time of the effective chilldown was able to keep close to 8000 s, and its instantaneous maximum volume increased to 40%. Thus, in this condition, the chilldown effect was optimal.
Comparing the different angles for when the nitrogen injection inlet was 1, when the angle was 0°, the volume of the chilldown zone was the largest, and the instantaneous maximum effective chilldown volume fraction of the whole process went up to 39%. When the angle was increased to 8.4°, the volume fraction was only 25%. Similarly, under the condition of injection inlet 2, the effective chilldown volume fraction was decreased from 44.0% to 13.9% when the model’s angle was increased from 0° to 8.4°.
The value obtained by integrating the chilldown volume of test 1 into the whole process was set to 1, and the ratio of the chilldown range of the other groups of tests is presented in Table 3. It was revealed that when the angle was the same, the chilldown effect of the nitrogen injection in inlet 2 was always better than that in inlet 1. This result can be explained by the fact that under the conditions of inlet 1, the left side was the wall surface, so the liquid nitrogen cannot flow to the left side, and the flow direction was only toward the outlet on the right side, during which a part of the cooling amount was lost. When the injection inlet was 2, the liquid nitrogen flow was no longer obstructed by the wall surface and could flow to the left side within a certain range, thereby expanding the effective chilldown zone (although the zone was limited and unable to infinitely increase). When the angle of the model increased, the effective chilldown zone volume decreased sharply. When the inlets were 1 and 2, respectively, the effective cooling area was only 0.116 and 0.120 when the inclination angle was 8.4° compared to 0°, and the heat exchange effect was greatly reduced. Therefore, an increase in the angle was not conducive to the effects of nitrogen injection chilldown.

4. Conclusions

In this study, a loose medium model was designed and built to simulate a coal mine goaf. Meanwhile, a temperature sensing system was applied to monitor the temperature changes over a long period of time in the system after the injection of liquid nitrogen. The heat and mass transfer processes of liquid nitrogen and cryogenic nitrogen were investigated in the loose medium.
After the liquid nitrogen was injected into the model from the top inlet, the liquid flowed quickly to the bottom and along the bottom. The region where the liquid nitrogen flowed and the loose medium located at the bottom were lowered to −196 °C due to the direct contact with the liquid nitrogen, and the chilldown effect was optimal in these regions. Most of the middle and upper zones that were not in direct contact with liquid nitrogen were cooled only by cryogenic nitrogen. There were three stages in the migration of cryogenic nitrogen after liquid nitrogen vaporization: The gravity sedimentation stage, the vaporization expansion stage, and the passive diffusion stage. During the gravity sedimentation stage, cryogenic nitrogen had a downward initial velocity when it had just been separated from the liquid nitrogen and continued to migrate to the bottom. Subsequently, as the downward initial inertia was exhausted, the buoyancy of the cryogenic nitrogen gradually caused the cryogenic region to diffuse toward the middle layer. When the nitrogen injection was stopped, there was only natural convection inside the model, and the cryogenic nitrogen began to diffuse passively, which made the cooling area larger, but the temperature interval was lessened. From the end of the tests until 20,000 s, the upper, middle, and bottom temperatures were reduced to about 0 °C, −30 °C, and −63 °C, respectively.
The model angles of 0°, 4.1°, and 8.4° were set to explore the sensitivity of the inclination angle to the effects of nitrogen injection. When the angle was 0°, liquid nitrogen could accumulate at the bottom, so the chilldown time was the longest. As the angle increased, the time that the loose medium could remain cold was shorter. In addition, the position of the injection inlet also affected the cooling time. The loose medium, however, was separated from the inlet position; even if the nitrogen injection time and the diffusion time were long enough, it was difficult for both liquid and nitrogen to reach the inlet region, and chilldown was also difficult. Thus, there was a blind zone for cooling.
The T L temperature mentioned in Equation (1) was defined as the critical temperature of the effective chilldown zone, below which was the effective chilldown zone (which was −129.4 °C in this paper). Considering the position of the inlet and the model angle, when the position of the nitrogen injection inlet was slightly farther from the gas outlet position (when the model angle was fixed), the larger area could be effectively cooled. When the position of the nitrogen injection inlet was fixed, (with a smaller angle) the cryogenic zone was wider, and the temperature was kept low for longer.
In this paper, a laboratory loose medium model was used to simulate liquid nitrogen flow and heat transfer in the goaf, and the nitrogen injection position and model inclination angle were changed to study the laws of temperature distribution and determine the effective chilldown zone, which was first proposed in this paper. The temperature distribution law obtained in these experiments provides basic theoretical data for the implementation of liquid nitrogen fire extinguishing. In addition, this paper can also provide comparative experimental data for different methods of fire extinguishing, such as for CO2 and foam fire extinguishing technologies. At present, although the nitrogen injection technology in the goaf is very mature, while accidentally investigating spontaneous combustion in the goaf, experts discovered that there was still a high temperature area in the goaf that cannot be cooled after long-term injection of liquid nitrogen. The results of this paper confirm that there are effective and ineffective chilldown zones in the actual fire extinguishing process. According to this phenomenon, we can optimize the total amount of liquid nitrogen injected, and the location of the nitrogen injection, according to the angle of the goaf and the position of the initial nitrogen injection inlet, thereby improving the theoretical research of nitrogen injection fire extinguishing technology and better adapting it to practical engineering applications.

Author Contributions

Conceptualization, Y.Z. and B.W.; data curation, Y.Z., Y.M. and B.H.; formal analysis, Y.Z.; funding acquisition, B.W. and B.L.; investigation, Y.Z., Y.M. and B.H.; methodology, Y.Z., B.W. and B.L.; project administration, Y.Z.; resources, B.W. and B.L.; supervision, B.W. and B.L.; validation, Y.Z. and B.W.; visualization, Y.Z.; writing—original draft, Y.Z.; writing—review and editing, B.W.

Funding

This research was funded by the National Key R&D Program of China (2018YFC0808100).

Conflicts of Interest

The authors declare no conflict of interest.

References

  1. Li, X.; Wang, H.; Liu, B. Chemical characteristics of coal gangue as filter material in simulated coal mine goaf. Asian J. Chem. 2013, 25, 9409–9410. [Google Scholar] [CrossRef]
  2. Liang, Y.; Wang, S. Prediction of coal mine goaf self-heating with fluid dynamics in porous media. Fire Saf. J. 2017, 87, 49–56. [Google Scholar] [CrossRef]
  3. Yang, Y.; Li, Z.; Si, L.; Hou, S.; Li, Z.; Li, J. Study on test method of heat release intensity and thermophysical parameters of loose coal. Fuel 2018, 229, 34–43. [Google Scholar] [CrossRef]
  4. Yuan, L.; Smith, A.C. The effect of ventilation on spontaneous heating of coal. J. Loss Prev. Process Ind. 2012, 25, 131–137. [Google Scholar] [CrossRef]
  5. Song, Z.; Kuenzer, C. Fires in China over the last decade: A comprehensive review. Int. J. Coal Geol. 2014, 133, 72–99. [Google Scholar] [CrossRef]
  6. Kong, B.; Li, Z.; Yang, Y.; Liu, Z.; Yan, D. A review on the mechanism, risk evaluation, and prevention of coal spontaneous combustion in China. Environ. Sci. Pollut. Res. 2017, 23453–23470. [Google Scholar] [CrossRef]
  7. Wang, G.; Wang, Y.; Sun, L.; Song, X.; Liu, Q.; Xu, H.; Du, W. Study on the low-temperature oxidation law in the co-mining face of coal and oil shale in a goaf–A case study in the Liangjia coal mine, China. Energies 2018, 11, 174. [Google Scholar] [CrossRef]
  8. Du, W.; Wang, G.; Wang, Y.; Liu, X. Thermal degradation of bituminous coal with both model-free and model-fitting methods. Appl. Therm. Eng. 2019, 152, 169–174. [Google Scholar] [CrossRef]
  9. Feng, G.; Wu, Y.; Zhang, C.; Hu, S.; Shao, H.; Xu, G.; Ren, X.; Wang, Z. Changes on the low-temperature oxidation characteristics of coal after CO2 adsorption: A case study. J. Loss Prev. Process Ind. 2017, 49, 536–544. [Google Scholar] [CrossRef]
  10. Hao, C.; Chen, Y.; Wang, J.; Deng, C.; Xu, G.; Dai, F.; Si, R.; Wang, H.; Wang, H. Study on the effect of iron-based deoxidizing inhibitors for coal spontaneous combustion prevention. Energies 2018, 11, 789. [Google Scholar] [CrossRef]
  11. Li, S.; Zhou, G.; Wang, Y.; Jing, B.; Qu, Y. Synthesis and characteristics of fire extinguishing gel with high water absorption for coal mines. Process Saf. Environ. Prot. 2019, 125, 207–218. [Google Scholar] [CrossRef]
  12. Qin, B.; Lu, Y.; Li, Y.; Wang, D. Aqueous three-phase foam supported by fly ash for coal spontaneous combustion prevention and control. Adv. Powder Technol. 2014, 25, 1527–1533. [Google Scholar] [CrossRef]
  13. Wang, G.; Yan, G.; Zhang, X.; Du, W.; Huang, Q.; Sun, L.; Zhang, X. Research and development of foamed gel for controlling the spontaneous combustion of coal in coal mine. J. Loss Prev. Process Ind. 2016, 44, 474–486. [Google Scholar] [CrossRef]
  14. Zhou, F.; Ren, W.; Wang, D.; Song, T.; Li, X.; Zhang, Y. Application of three-phase foam to fight an extraordinarily serious coal mine fire. Int. J. Coal Geol. 2006, 67, 95–100. [Google Scholar] [CrossRef]
  15. Dong, S.; Lu, X.; Wang, D.; Wang, H.; Zheng, K.; Shi, Q.; Chen, M. Experimental investigation of the fire-fighting characteristics of aqueous foam in underground goaf. Process Saf. Environ. Prot. 2017, 106, 239–245. [Google Scholar] [CrossRef]
  16. Wu, J.; Yan, H.; Wang, J.; Wu, Y.; Zhou, C. Flame retardant polyurethane elastomer nanocomposite applied to coal mines as air-leak sealant. J. Appl. Polym. Sci. 2013, 129, 3390–3395. [Google Scholar] [CrossRef]
  17. Cheng, W.; Hu, X.; Xie, J.; Zhao, Y. An intelligent gel designed to control the spontaneous combustion of coal: Fire prevention and extinguishing properties. Fuel 2017, 210, 826–835. [Google Scholar] [CrossRef]
  18. Shi, B.; Zhou, G.; Ma, L. Normalizing fire prevention technology and a ground fixed station for underground mine fires using liquid nitrogen: A case study. Fire Technol. 2018, 54, 1887–1893. [Google Scholar] [CrossRef]
  19. Zhou, F.; Shi, B.; Cheng, J.; Ma, L. A new approach to control a serious mine fire with using liquid nitrogen as extinguishing media. Fire Technol. 2015, 51, 325–334. [Google Scholar]
  20. Shi, B.; Zhou, F. Impact of heat and mass transfer during the transport of nitrogen in coal porous media on coal mine fires. Sci. World J. 2014, 2014. [Google Scholar] [CrossRef]
  21. Lu, L.; Xin, C.; Liu, X. Heat and mass transfer of liquid nitrogen in coal porous media. Heat Mass Transf. 2017, 54, 1101–1111. [Google Scholar]
  22. Adamus, A. Review of the use of nitrogen in mine fires. Min. Technol. 2014, 111, 89–98. [Google Scholar] [CrossRef]
  23. Yu, Z. Study on The Process of Heat and Mass Transfer in Loose Coal with Phase Transition for Liquid Carbon Dioxide. Ph.D. Thesis, Xi’an University of Science and Technology, Xi’an, China, June 2017. [Google Scholar]
  24. Ramesh, P.; Torrance, K. Boiling in a porous layer heated from below: Effects of natural convection and a moving liquid/two-phase interface. J. Fluid Mech. 1993, 257, 289–309. [Google Scholar] [CrossRef]
  25. Ramesh, P.; Torrance, K. Numerical algorithm for problems involving boiling and natural convection in porous materials. Numer. Heat Transf. Part B Fundam. 1990, 17, 1–24. [Google Scholar] [CrossRef]
  26. Yuki, K.; Abei, J.; Hashizume, H.; Toda, S. Numerical investigation of thermofluid flow characteristics with phase change against high heat flux in porous media. J. Heat Transfer 2008, 130, 1–12. [Google Scholar] [CrossRef]
  27. Shaeffer, R.; Hu, H.; Chung, J.N. An experimental study on liquid nitrogen pipe chilldown and heat transfer with pulse flows. Int. J. Heat Mass Transf. 2013, 67, 955–966. [Google Scholar] [CrossRef]
  28. Surtaev, A.S.; Pavlenko, A.N.; Kuznetsov, D.V.; Kalita, V.I.; Komlev, D.I.; Ivannikov, A.Y.; Radyuk, A.A. Heat transfer and crisis phenomena at pool boiling of liquid nitrogen on the surfaces with capillary-porous coatings. Int. J. Heat Mass Transf. 2017, 108, 146–155. [Google Scholar] [CrossRef]
  29. Kandlikar, S.G. A general correlation for saturated two-phase flow boiling heat transfer inside horizontal and vertical tubes. J. Heat Transf. 1990, 112, 219–228. [Google Scholar] [CrossRef]
  30. Steiner, D. Heat transfer during flow boiling of cryogenic fluids in vertical and horizontal tubes. Cryogenics 1986, 26, 309–318. [Google Scholar] [CrossRef]
  31. Jiang, R.; Wang, Y.; Li, H.; Yang, M. A numerical simulation on the impact of coal seam dip on productivity of CBM horizontal well. J. China Coal Soc. 2015, 40, 151–157. [Google Scholar]
  32. Sun, J. Failure characteristics of floor “three-zone” along the inclined direction of coal seam. J. Min. Saf. Eng. 2014, 31, 115–121. [Google Scholar]
  33. Leidenfrost, J.G. On the fixation of water in diverse fire. Int. J. Heat Mass Transf. 1966, 9, 1153–1166. [Google Scholar] [CrossRef]
  34. Hartwig, J.; Hu, H.; Styborski, J.; Chung, J.N. Comparison of cryogenic flow boiling in liquid nitrogen and liquid hydrogen chilldown experiments. Int. J. Heat Mass Transf. 2015, 88, 662–673. [Google Scholar] [CrossRef]
  35. Berenson, P.J. Film-boiling heat transfer from a horizontal surface. J. Heat Transfer 2012, 83, 351. [Google Scholar] [CrossRef]
Figure 1. Schematic of experimental system.
Energies 12 03464 g001
Figure 2. The arrangement of temperature sensors for the experiment.
Energies 12 03464 g002
Figure 3. The temperature variation along the central X-axis. (a) Upper layer, (b) middle layer, and (c) bottom layer.
Energies 12 03464 g003aEnergies 12 03464 g003b
Figure 4. The temperature variation along the central Z-axis under inlet 1. (a) Column 1, (b) column 2, (c) column 3, and (d) column 4.
Energies 12 03464 g004aEnergies 12 03464 g004b
Figure 5. The temperature variation of the loose medium under inlet 2 with a 0° inclination.
Energies 12 03464 g005
Figure 6. The temperature variation in different inclination angles in the 4# position in inlet 1.
Energies 12 03464 g006
Figure 7. The temperature variation in different inclination angles in the 4# position in inlet 2.
Energies 12 03464 g007
Figure 8. The temperature distribution contour of the central axis along the X-axis: (a) test 1, (b) test 2, and (c) test 5.
Energies 12 03464 g008
Figure 9. The effective chilldown zone volume fraction in tests 1–6.
Energies 12 03464 g009
Table 1. Nitrogen properties.
FormulaMelting PointBoiling PointLatent Heat of VaporizationGas/Liquid Ratio (Gas at 21.1 °C and 101.3 kPa, Liquid at Boiling Point)
N2−210.01 °C−195.79 °C199.1 kJ/kg696.5 (volume ratio)
Table 2. The parameters of liquid nitrogen injection.
Test No.The Injection LocationThe Inclination Angle of Model/°The Mass of LN2 Injection/kgThe Time of LN2 Injection/sThe Average Mass Flow Rate/(kg/s)
11013.27100.0186
22013.16900.0190
314.19.14820.0189
424.114.97650.0190
518.49.55300.0180
628.410.15430.0186
Table 3. The effective chilldown zone ratio.
Test No.RatioTest No.Ratio
Test 11Test 21.056
Test 30.151Test 40.704
Test 50.116Test 60.120

