Article

Simulation of Stress Hysteresis Effect on Permeability Increase Risk Along A Fault

1
Department of Geoscience and Petroleum, Norwegian University of Science and Technology (NTNU), NO-7491 Trondheim, Norway
2
SINTEF Industry, NO-7465 Trondheim, Norway
*
Author to whom correspondence should be addressed.
Energies 2019, 12(18), 3458; https://doi.org/10.3390/en12183458
Submission received: 8 July 2019 / Revised: 20 August 2019 / Accepted: 1 September 2019 / Published: 7 September 2019

Abstract

:
CO2 sequestration projects will in the coming years include both aquifer and depleted oil and gas field sites, with different stress paths and history. Stress changes and stress concentration effects on faults will have to be readily assessed, potentially endangering shallower permeable formations. Usually, a fault is modeled as a singularity with shear strength or friction properties, and simulations are run to determine whether the fault is reactivated through shear failure. In this paper, we model a simple rectilinear fault as a finite surface with lowered mechanical properties compared to elsewhere in the domain, which represents a fractured zone alongside the fault core. SINTEF’s Modified Discrete Element code is used coupled to the flow simulator TOUGH2, to model the fracture initiation and propagation, monitoring the permeability increase along the fault. A simplified scenario is simulated, with a sandstone storage reservoir bounded by a fault, penetrating a shale caprock to a shallower sandstone layer. The storage site either undergoes depletion before CO2 injection or has its pore pressure increased to simulate the case of aquifer storage. Results show that during depletion, shear stresses may develop such that fractures propagate alongside the fault to the upper aquifer. However, for the mirror fault orientation with regards to verticality, no such fractures develop. These results are reversed for the aquifer storage case.

1. Introduction

CO2 sequestration is a proposed technology to rapidly help reach the 1.5 °C goal outlined in the Paris agreement, under the condition that storage volumes accept gigatons of CO2. The capacity estimates for each new storage site are limited, among other factors, by the geomechanical constraint of ensuring containment. A chosen reservoir must have a sealing caprock and not be divided into too many pressure compartments, which are sub-volumes delimited by faults which effectively act as closed boundary conditions. When evaluating the larger volume and less homogeneous reservoirs, the presence of more faults becomes inevitable. It is, therefore, vital to understand, as thoroughly as possible, how these faults behave under changing stress distributions linked to the injection of CO2, so as to plan the operations in the best possible manner to minimize leakage risk and optimize storage [1,2]. The most critical mechanism for leak initiation from a reservoir is assumed to be the shear stress evolution close to faults towards the critical slip value, upon an increase in the pore pressure inside the reservoir as CO2 is injected from one or several wells. If the fault slip happens, the permeability of or along the fault may increase, initiating a leakage across or along the fault [3].
In most computer simulation tools, faults are modeled as 1D lines in 2D domains or 2D planes in 3D domains. Many simulation tools employ one or other variations on the finite element method, with a coupling between the reservoir flow and the geomechanical model [4,5,6,7]. Even though the slip area of faults is extremely localized in the fault gouge, the examination of real faults shows that they are much more complex, with structure evolving outwards from a thin core to a process zone with fractures [8]. This structure on each side of the fault gouge has recently been incorporated in more advanced models. An example of such an approach is the use of the Cosserat extension of elasticity [9]. It is shown that this process zone may have different mechanical properties and permeabilities than the host rock, which could, therefore, lead to stress concentration and affect the permeability evolution during CO2 injection [10,11,12]. Stress and permeability evolution, in and around a fault during reservoir pressure changes, are complex problems, and have been addressed in recent years by several authors [13,14]. There is, however, room for improvement in our understanding of the governing factors such as variation of fault angles and the effect of stress history from reservoir depletion during previous oil and gas production.
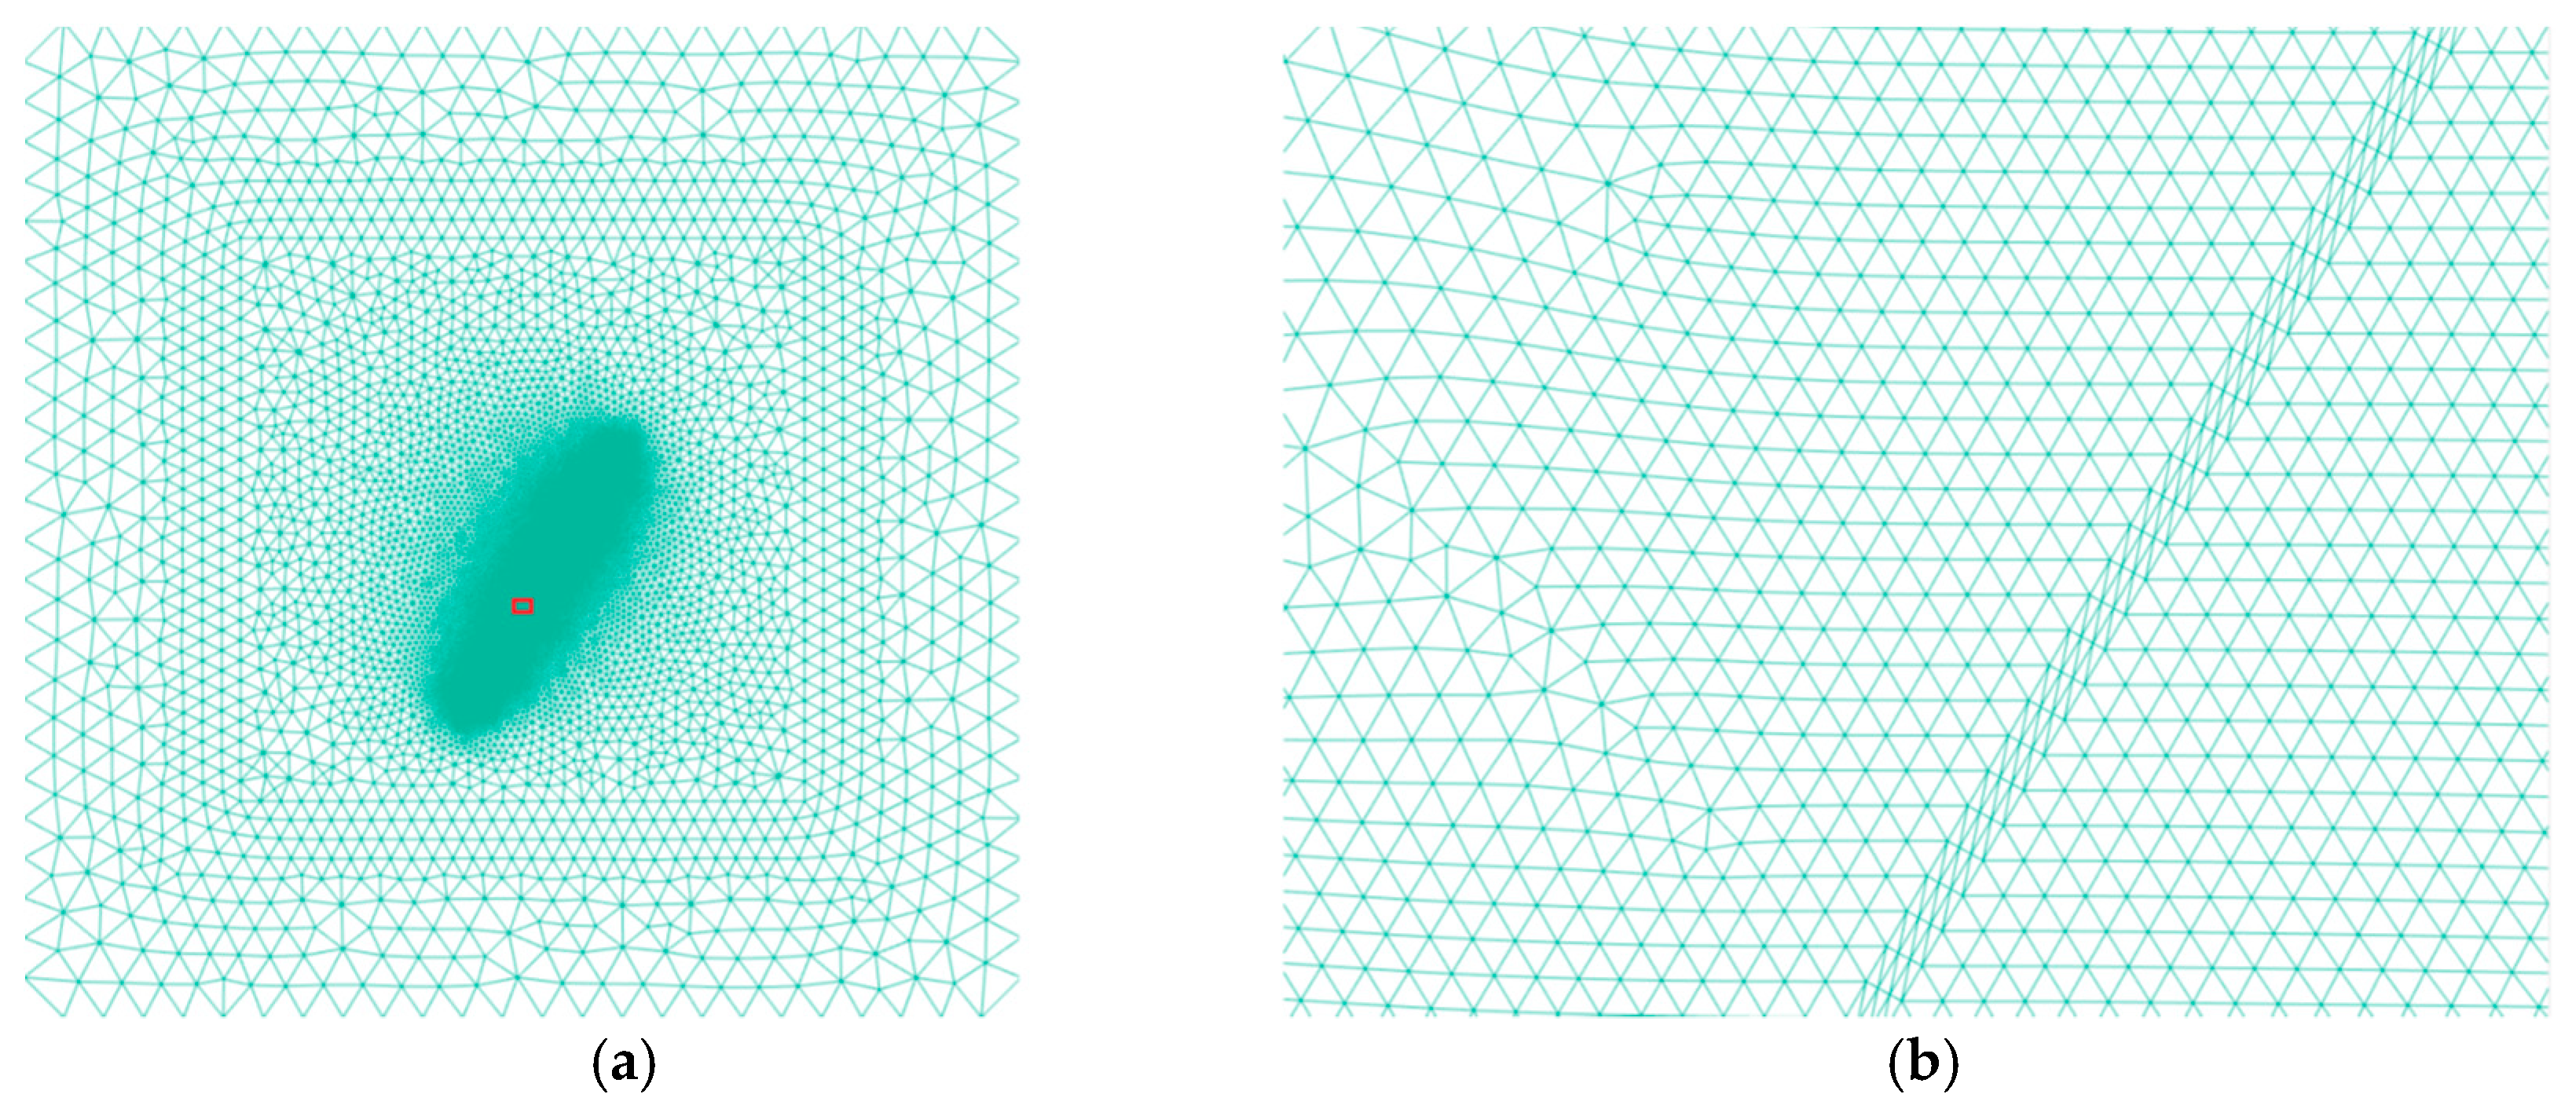
The MDEM (Modified Discrete Element Method) is a hybrid finite element method/discrete element method (FEM/DEM) hydro-mechanical model, developed at SINTEF. When failure conditions are met, the elements are redefined from a Voronoi tessellation on the basis of triangular elements. These clusters are used to define the contact lines (in 2D, planes in 3D) potentially failing to create fractures (Figure 1). When the failure criterion is reached, the mechanical properties of the failed elements are changed to model the behavior of a fracture. The failed elements behave as standard discrete element codes, their interaction being based on normal and tangential contact forces. This allows for element clusters to separate, stress to redistribute, and shear forces to build up on the failed clusters. A mechanical aperture can be calculated, which, therefore, could be used to update the permeability of the failed element. The code was successfully used to simulate extended leak-off tests [15].
Fluid flow is calculated by coupling MDEM to SINTEF’s MRST (Matlab Reservoir Simulation Tool) reservoir simulator, or as in the present study, TOUGH2, a reservoir simulator developed at the Lawrence Berkeley National Laboratory. Fracture permeability can be monitored in MDEM by tracking the fracture aperture in both tensile and shear mode [16]. The hydraulic aperture is calculated as a function of the mechanical aperture that could be decomposed into its initial aperture, the aperture due to normal opening and the aperture due to shear-induced dilatancy. MDEM calculates the tensile opening, and shear dilatancy based on the local stress state and pore pressure at every time step, where the upscaled permeability of a failed element is a function of the hydraulic aperture. The coupling between TOUGH2 and MDEM is a two-way explicit sequential, where the permeability and porosity field is sent to TOUGH2, which calculates the flow and sends back an updated pore pressure field to MDEM. MDEM will then solve for displacement and check for element failure, before updating the permeability and porosity fields. For a more detailed description of MDEM and its coupling to TOUGH2 see [17]. MDEM is designed as an explicit fracturing numerical tool. The objective of the study presented here is to design simple simulations highlighting for a case study the evolution of permeability or hydraulic conductivity along a fault, depending on the stress history of the reservoir intended for CO2 storage. This stress history is a direct consequence of the pressure variation in the reservoir, either as a result of prior hydrocarbon production or simply as a function of CO2 injection alone. The process zone alongside the fault core is a region with pre-existing fractures; a mechanism for increased permeability could be by the increase of the fracture connectivity. This is assumed to occur as effective stresses evolve with decreasing and increasing pore pressure due to reservoir depletion followed by, or just due to, the continuous CO2 injection in the reservoir. Note that in this study, dynamic evolution of fracture permeability is not calculated; rather, a track is kept of the initiation and propagation of fractures, where connectivity in a fracture chain imparts it a fixed, increased associated permeability. In reality, dynamic opening and shearing of fractures would make the chain permeability evolve with changing stresses, potentially increasing beyond the predictions in this study. On the other hand, shearing might reduce individual hydraulic conductivity of fractures, by mismatch of displaced asperities on the fracture faces, having moved relative to each other.
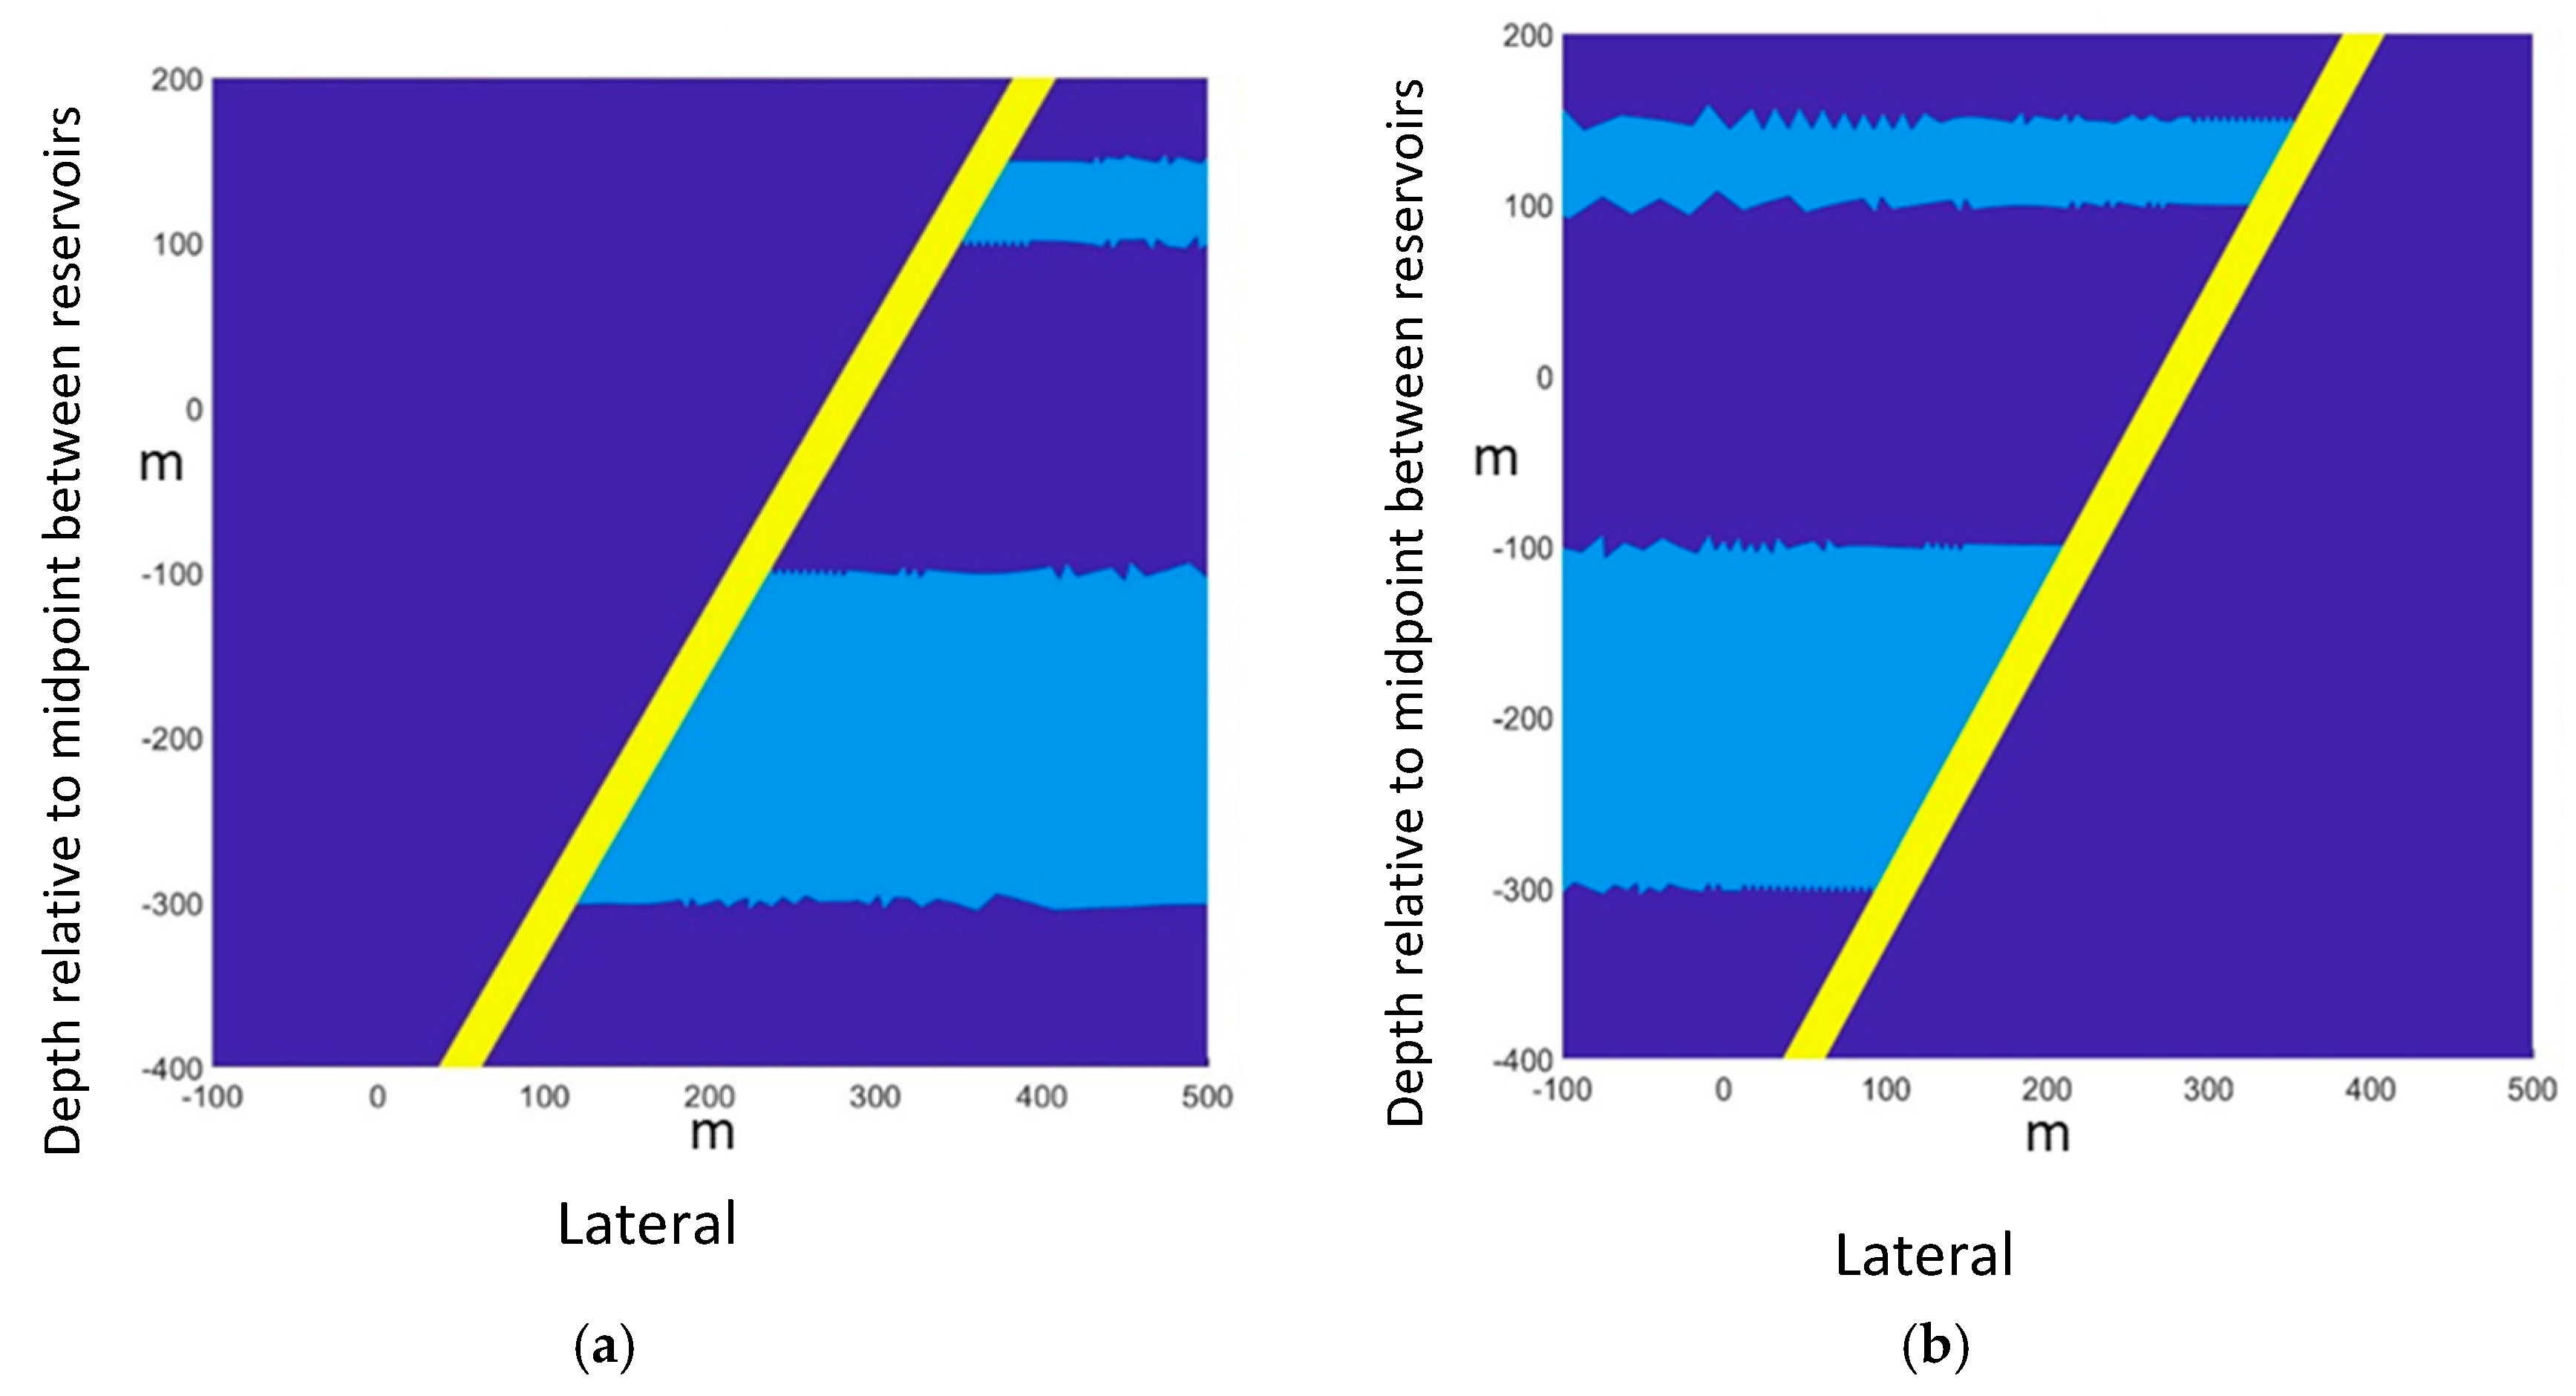
In the chosen model configuration, one fault bounds a sandstone reservoir, penetrating the overlying shale caprock and ending in a shallower sandstone reservoir (Figure 2). The fault makes an angle of 60° with the horizontal axis; two cases are simulated, one where the reservoir constitutes a hanging wall (to the left of the fault if the fault resembles the slash character "/") and one where the reservoir constitutes a footwall of the fault (to the right of the same fault topology). The two sandstone layers are embedded in the shale formations. The upper reservoir has a thickness of 50 m and the lower one has a thickness of 200 m. The two reservoirs are separated by a caprock layer which has a thickness of 200 m. To avoid side effects, both reservoirs are assumed to have an infinite length on the left (right) side of the fault, and the fault is assumed to have an infinite length as well.

2. Materials and Methods

The numerical calculation method, in terms of the mesh used, choice of material properties in the different parts of the simulation domain, and the random variation of the assigned strength properties are described in the following subsections.

2.1. Adaptive Meshing of the Simulation Domain

A triangular mesh was used for the elements prior to failure (Figure 3). Adaptive meshing was implemented to account for stress concentration in the vicinity of the fault and the corners defined by the fault and rock layer boundaries, where the element size is significantly reduced compared to elsewhere in the domain. Figure 3 shows that the mesh is created such that the fault area is marked by elements forming perfect straight-edged parallelograms. The reason for this was to avoid random computation of the fault zone placement in the domain and to avoid sharp angle effects. Away from the fault, where no large stress gradients are to be expected, the mesh is created coarser in order to minimize the needed computation time. A total of 44,700 triangles make up the mesh.

2.2. Assignment of Formation Properties in the Domain

The domain is divided into two different lithologies (sandstone and shale), as shown in Figure 2. In the simulation mesh, three different types of element properties are defined, corresponding to the two lithologies plus the damage zone of the fault; Figure 4 shows this partition. In what follows, the shear zone or process zone are used interchangeably to design the fault region on both sides of the central gouge core, as described in [8]. The fault core is not addressed in this paper, as we are primarily interested in the permeability evolution along the fault, not across it. Permeability in the process zone is thought to be much larger than that of the fault core, resulting in permeability anisotropy when the entire fault is taken into consideration in upscaled models [18]. Both sandstone layers are assigned a length of 1000 m away from the fault, to minimize boundary effects other than due to the presence of the fault. The fault itself is modeled as a uniform zone, where core and process zones are included in an upscaled manner. It is given a thickness of 25 m, where homogenized properties are assigned to represent the shear zone (implicitly including the core). In reality, fault thickness seems to depend on lithology juxtaposition (shale-shale, sandstone-sandstone, or shale-sandstone) and throw, among other things [18]. These conditions will also strongly influence the clay smear or content in the fault structure. We, however, choose a simplified approach as the simulations are meant to be generic and not specific to a given site. Each mesh element is, thus assigned as one of the three material properties based on its location: shale, sandstone, or damaged shale (weaker strength properties).

2.3. Strength Variation in the Domain

The user determines the mechanical properties to be attributed to the sandstone and shale formations, as well as the shear or process zone of the fault. The chosen shear and tensile strength values are input as average values, where a random variation from the average is applied, the variation being set at ±10% with Gaussian distribution. The shear zone around the fault core is modeled as a weaker version of the shale lithology, with shear strength variation set at ±12%. The weaker strength of the shear zone is justified by the presence of fractures [8], even though these may not constitute a percolating network and are not explicitly modeled as existing fractures in our model. The process zone has undergone relatively large shear deformations irrespective of real lithology and confining stress when the deformation occurred; the rock must have undergone grain cement breakage [18]. We assume that any remineralization due to subsequent potential burial will have either occurred in the center gouge (not affecting permeability along the fault) or insufficiently to restore pristine strength. To avoid stress concentration at the tips (ends) of the fault, element strength values are multiplied by a large enough factor to avoid fracturing in a square zone defined around the fault tip. The fault in our model is assumed infinite (or at least much longer than the region of interest, or in other words, fracturing at the tip of the fault has no consequence for the flow communication between the sandstone layers while using precious computing power/time).

3. Results

The results described here were obtained for two sets of simulation runs, the first one for a scenario of depletion followed by CO2 injection, and the second one for an aquifer case, where only injection occurs. Both runs look at the footwall vs. the hanging wall configurations.

3.1. Stress Changes During Depletion of Lower Sandstone Reservoir

In this simulation, the effect of stress arching during depletion of the lower reservoir is highlighted by monitoring the shear stress evolution in the fault process zone, with possible fracturing. The chosen reservoir and shale properties are given in Table 1, and are representative of the typical North Sea shale and sandstones from relatively shallow depths [19,20].
Note that tensile strength for geomaterials usually is lower than shear strength (unconfined compressive strength—UCS); in the process zone, tensile stresses are not expected as it simulates an already damaged shale rock, filled with fractures.
The lower sandstone reservoir was depleted in steps of 1 MPa, starting from 15 MPa. The upper reservoir is maintained at 15 MPa pore pressure. The initial total stresses are 20 MPa vertical stress and 17 MPa horizontal stress. Each pressure step is held until equilibrium is reached in the model; this is performed without coupling at this stage; the TOUGH2 flow simulator. In effect, this implies a sufficient permeability contrast between the sandstone and shale formations such that pore pressure is expected to be uniform in the sandstone and no transient pressure gradients persist on the scale of the time associated with total depletion. A depletion of 5 MPa, down to a reservoir pressure of 10 MPa, is accompanied by fracturing in the fault process zone, as shown in Figure 5. For the case when the sandstone layers are located in the hanging wall, shear fractures propagate up towards the upper reservoir, without quite reaching it at this stress level. For the case where the reservoirs are in the footwall (Figure 5b), the situation is reversed, with major fracture propagation downwards, in the basement formation, and a lower total number of fractures.
With increased depletion, the fractures propagate up (and down) along the fault until the upper reservoir is reached (when the reservoirs are in the hanging wall). Figure 6 shows the fractured elements (in red) at 5 MPa pore pressure in the lower reservoir, corresponding to 10 MPa depletion. This would in the field, correspond to an established hydraulic communication between the two sandstone layers, and a possible leakage pathway compromising CO2 containment in the lower reservoir already prior to injection commencement. Note also, that some tensile fractures appear in the caprock at the corner of the lower reservoir and the fault’s process zone. The picture is flipped about a horizontal line passing through the centerline of the lower reservoir when the sandstone bodies are in the footwall. In terms of fracturing upwards to the shallower sandstone layer, the fractures do not propagate all the way up, and there is; thus, no leakage risk for footwall formations.

3.2. Stress Changes During Pressure Increase in the Lower Sandstone Reservoir

To simulate the case of CO2 injection into an aquifer, where no prior depletion is assumed, the pore pressure in the lower reservoir is increased in the same manner and steps, as was done for the depletion case. Here, we start from a lower value of 11 MPa, assuming that a normally pressured aquifer was chosen for CO2 storage (keeping 20 MPa vertical stress and 17 MPa horizontal stress). Again, no direct simulation of the injection process was carried out, the pressure is increased uniformly in the lower reservoir based on the assumption of high permeability contrast and no strong pressure plume effect which could compromise the fault’s stability. This assumption has actually no strong influence if no other critically stressed plane is present in the lower reservoir, which could change the effective stress distribution and the resulting stresses at the main fault. The rock properties in the simulation domain are kept unchanged (Table 1).
The pressure in the lower sandstone reservoir was, thus increased in steps of 1 MPa starting from 11 MPa. The upper reservoir is maintained at 11 MPa pore pressure. Each pressure step is again held until equilibrium is reached in the model. An increase of 6 MPa, up to reservoir pressure of 17 MPa, is accompanied by fracturing in the fault process zone, as shown in Figure 7. For the case when the sandstone layers are located in the hanging wall (Figure 7, left panel), fracture propagation initiates at the lower intersection of the reservoir with the fault, with no fracturing propagating towards the upper reservoir. The number of fractures, in this case, is vanishingly small compared with the depletion case shown in Figure 5, even though the pressure change is larger (1 MPa more). For the case where the reservoirs are in the footwall (Figure 7, right panel), the situation is reversed, shear fractures appear at the upper intersection of the reservoir with the fault (no propagation up towards the upper reservoir, though). Notice that for the chosen parameters in Table 1, one does not expect leakage to ever occur to the upper reservoir, since effective stresses become tensile in the lower reservoir leading to hydraulic fracturing there.

3.3. Evaluation of Permeability Increase Along the Fault

Coupling the MDEM simulator to TOUGH2 allows us to simulate the potential flow of CO2 along a leakage pathway created along the fault, in the process zone. Note that in these simulations, no attempt is made to compute the relative permeability to scCO2 (super-critical carbon dioxide) in two-phase flow in the fracture system, neither is an attempt made to model miscibility effects between scCO2 and resident brine [21]. Therefore, no accompanying geochemical interactions between the flowing CO2 and brine mixture with the different lithologies are taken care of [22].
The process zone around the fault represents sheared and fractured shale (different from mostly clayey gouge at the center of the fault), which is modeled here as a mechanically damaged version of the intact shale elsewhere in the domain. Therefore, its absolute permeability should be at least equal if not higher than intact shale. This is in accord with a previous evaluation of permeability along faults [18]. A value of 10 nD was assigned to intact shale permeability, while for the process zone, a value of 10 µD was chosen [23]. The sandstone layers were given a permeability of 1 mD. Although much lower than typical for the best sandstone reservoirs, large-scale storage will dictate the use of all available reservoirs, including tighter sands. This has also no effect in our simulations, as the pressure gradient in transient filling of the reservoir is not modeled, only the resulting pressure gradient along the fault as steady-state reservoir pressure is achieved. Failed elements are given a permeability of 10 mD, or a factor 1000 larger than intact elements in the process zone. The assigned permeability values are summarized in Table 2. A permeability distribution map is shown in Figure 8 for two cases where fracturing has occurred.
Assuming that for both, injection after depletion and injection above original aquifer pressure, no further fracturing occurs on increasing the lower reservoir’s pore pressure, a pressure difference of 10 MPa is established between lower and higher reservoirs. The resulting flow rate is calculated for three cases:
(a)
No fracturing: this assumes that depletion was stopped prior to fracturing onset, then the increase of pressure to establish a pressure gradient along the process zone. For aquifer injection (no prior depletion), the above pressure differential is only an artificial means to establish measurable flow in the simulator, decoupling it from the fracturing simulator.
(b)
Fractures covering more than half the distance along the fault towards the upper reservoir, but no connection between the two reservoirs.
(c)
Fractures link the two reservoirs together.
Figure 9 shows the resulting pore pressure distribution once steady state conditions are obtained in the flow simulator. Similar plots are obtained for the case where the reservoirs are in the footwall of the fault. Case (a) is in essence similar to calculating the flow rate of CO2 though the weak shale in the process zone of the fault, solely based on the assigned weak shale permeability and the established pressure gradient (neglecting capillary entry pressure, CO2 buoyancy, and relative permeability, etc.). We normalize all computed flow rates in the presence of fractures—cases (b) and (c)—(i.e., in simulations with enhanced permeability due to fracture propagation along the fault) with respect to the intact case without fractures (i.e., in simulations with no induced fractures in the process zone, even though this zone is an upscaled representation of a zone with natural fractures—with a damaged shale set of properties). Upon steady-state, we could, thus calculate the resulting overall permeability along the fault and its increase for the different cases, representing an average estimate of leakage propensity from the storage reservoir. A summary of the results is presented in Table 3.

4. Discussion

The numerical model presented in this article focuses on the process or shear zone on each side of a fault core. The fault reactivation in terms of the classical description of the shear displacement across a discontinuity was not addressed here, but rather the more gradual increase in the hydraulic conductivity through percolation of fracture propagation in the process zone was attempted to be described using a hybrid modeling approach. This approach is supported by recent laboratory evidence, suggesting the possibility of fracturing along a fault prior to the reactivation of the core gouge [24]. On the one hand, the process zone was not explicitly implemented as a discrete fracture network (although this is definitely a possible alternative using the MDEM tool, provided one has a given geological observation of such a network to mimic with some degree of simplification) but rather as an upscaled continuum damaged shale model. To easily explore the influence of the stress concentration, in addition to stress history on the possible fracture propagation in the process zone, an artificial case was chosen with only one fault present. The modeled domain was also much simplified with two high-permeability rectangular reservoirs, where the deeper one served as a source and the shallower as a sink for the leakage flow modelling, using the TOUGH2 software. Another simplification in the model was the elimination of the presence of high permeability sandstone layers beyond the fault; in essence, the modeled single fault has an infinite throw [6]. This allowed for saving computing time so as not to have to consider cases only producing through-going fractures, establishing positive hydraulic conductivity between what could be considered as separate pressure compartments in the overall available storage volume. This last point should; however, be retained for future work, since it could contribute to the de-risking along-fault permeability enhancement by creating a fluid short-circuit, inhibiting fracture propagation in the unwanted direction upwards, parallel to the fault.
The simulation results illustrate that, should the process zone fracture before a large-scale fault core slip occur (with or without dilation), this may result in only partial fault "reactivation", in the sense of increased along-fault permeability. For any significant leakage to occur from the storage reservoir to a sensitive, shallower high-permeability spill layer, fracture propagation needs to occur all the way up to the shallower reservoir. Of course, this risk could vary both ways depending on the geochemical reactions in the fracture along the way up, which would depend on mineralogy, flow velocity, and scCO2 to brine miscibility. This also implies that for serious leakage to occur from an underground storage site in this manner, major faults must be present, or at least a system of linked (linkable) faults with the ability to transport the CO2 all the way up to sensitive shallow reservoirs. This may have been the case in the compromised In-Salah pilot [3]. The presence of thin shale layers, as is the case in the Sleipner storage reservoir [25] and the Decatur pilot [26], without faults acting as sub-vertical "elevators", does not present the same risk as their failure (be it due to pressurizing of the lowest high-permeability compartment or from stress history prior to the start of the storage injection) only imply nearly parallel filling of closed vertical compartments. This may or may not reduce the total theoretical storage capacity of the site.
Induced stress concentration close to a fault depends, as the results presented here point to, not only on the critical orientation of the fault but very much on the pore pressure history of the considered reservoir: the situation is markedly different for the injection into a depleted reservoir than the injection over the hydrostatic pressure as would be the case in a virgin aquifer. The fracturing threshold also depends on the position of the reservoir, for constant absolute fault orientation or inclination with respect to vertical, being in the footwall or hanging wall, reverses the direction of fracture propagation. Of course, in a field case, the injection reservoir will most probably be contained by a pair of critically oriented faults, among other faults oriented at various angles. Should the simple simulations presented here hold water for more complex cases, this would imply that the injection point placement is crucial and should be chosen as far as possible from the main fault whose orientation is such that fracturing will propagate upwards. This may not always be possible when reservoir geometry, especially the tilt, comes into consideration as buoyancy may direct the plume towards the "dangerous" fault; in such a case, several injection wells may be preferred or adding pressure-relief wells. Naturally, in the presented simulations, the fault orientation was made "critical" by adjusting the mechanical properties of the formations, which will depart from many field examples. We think, though, that this does not depart from generality by being completely equivalent to another combination of fault orientation and set of formation parameters which will be encountered in the field.
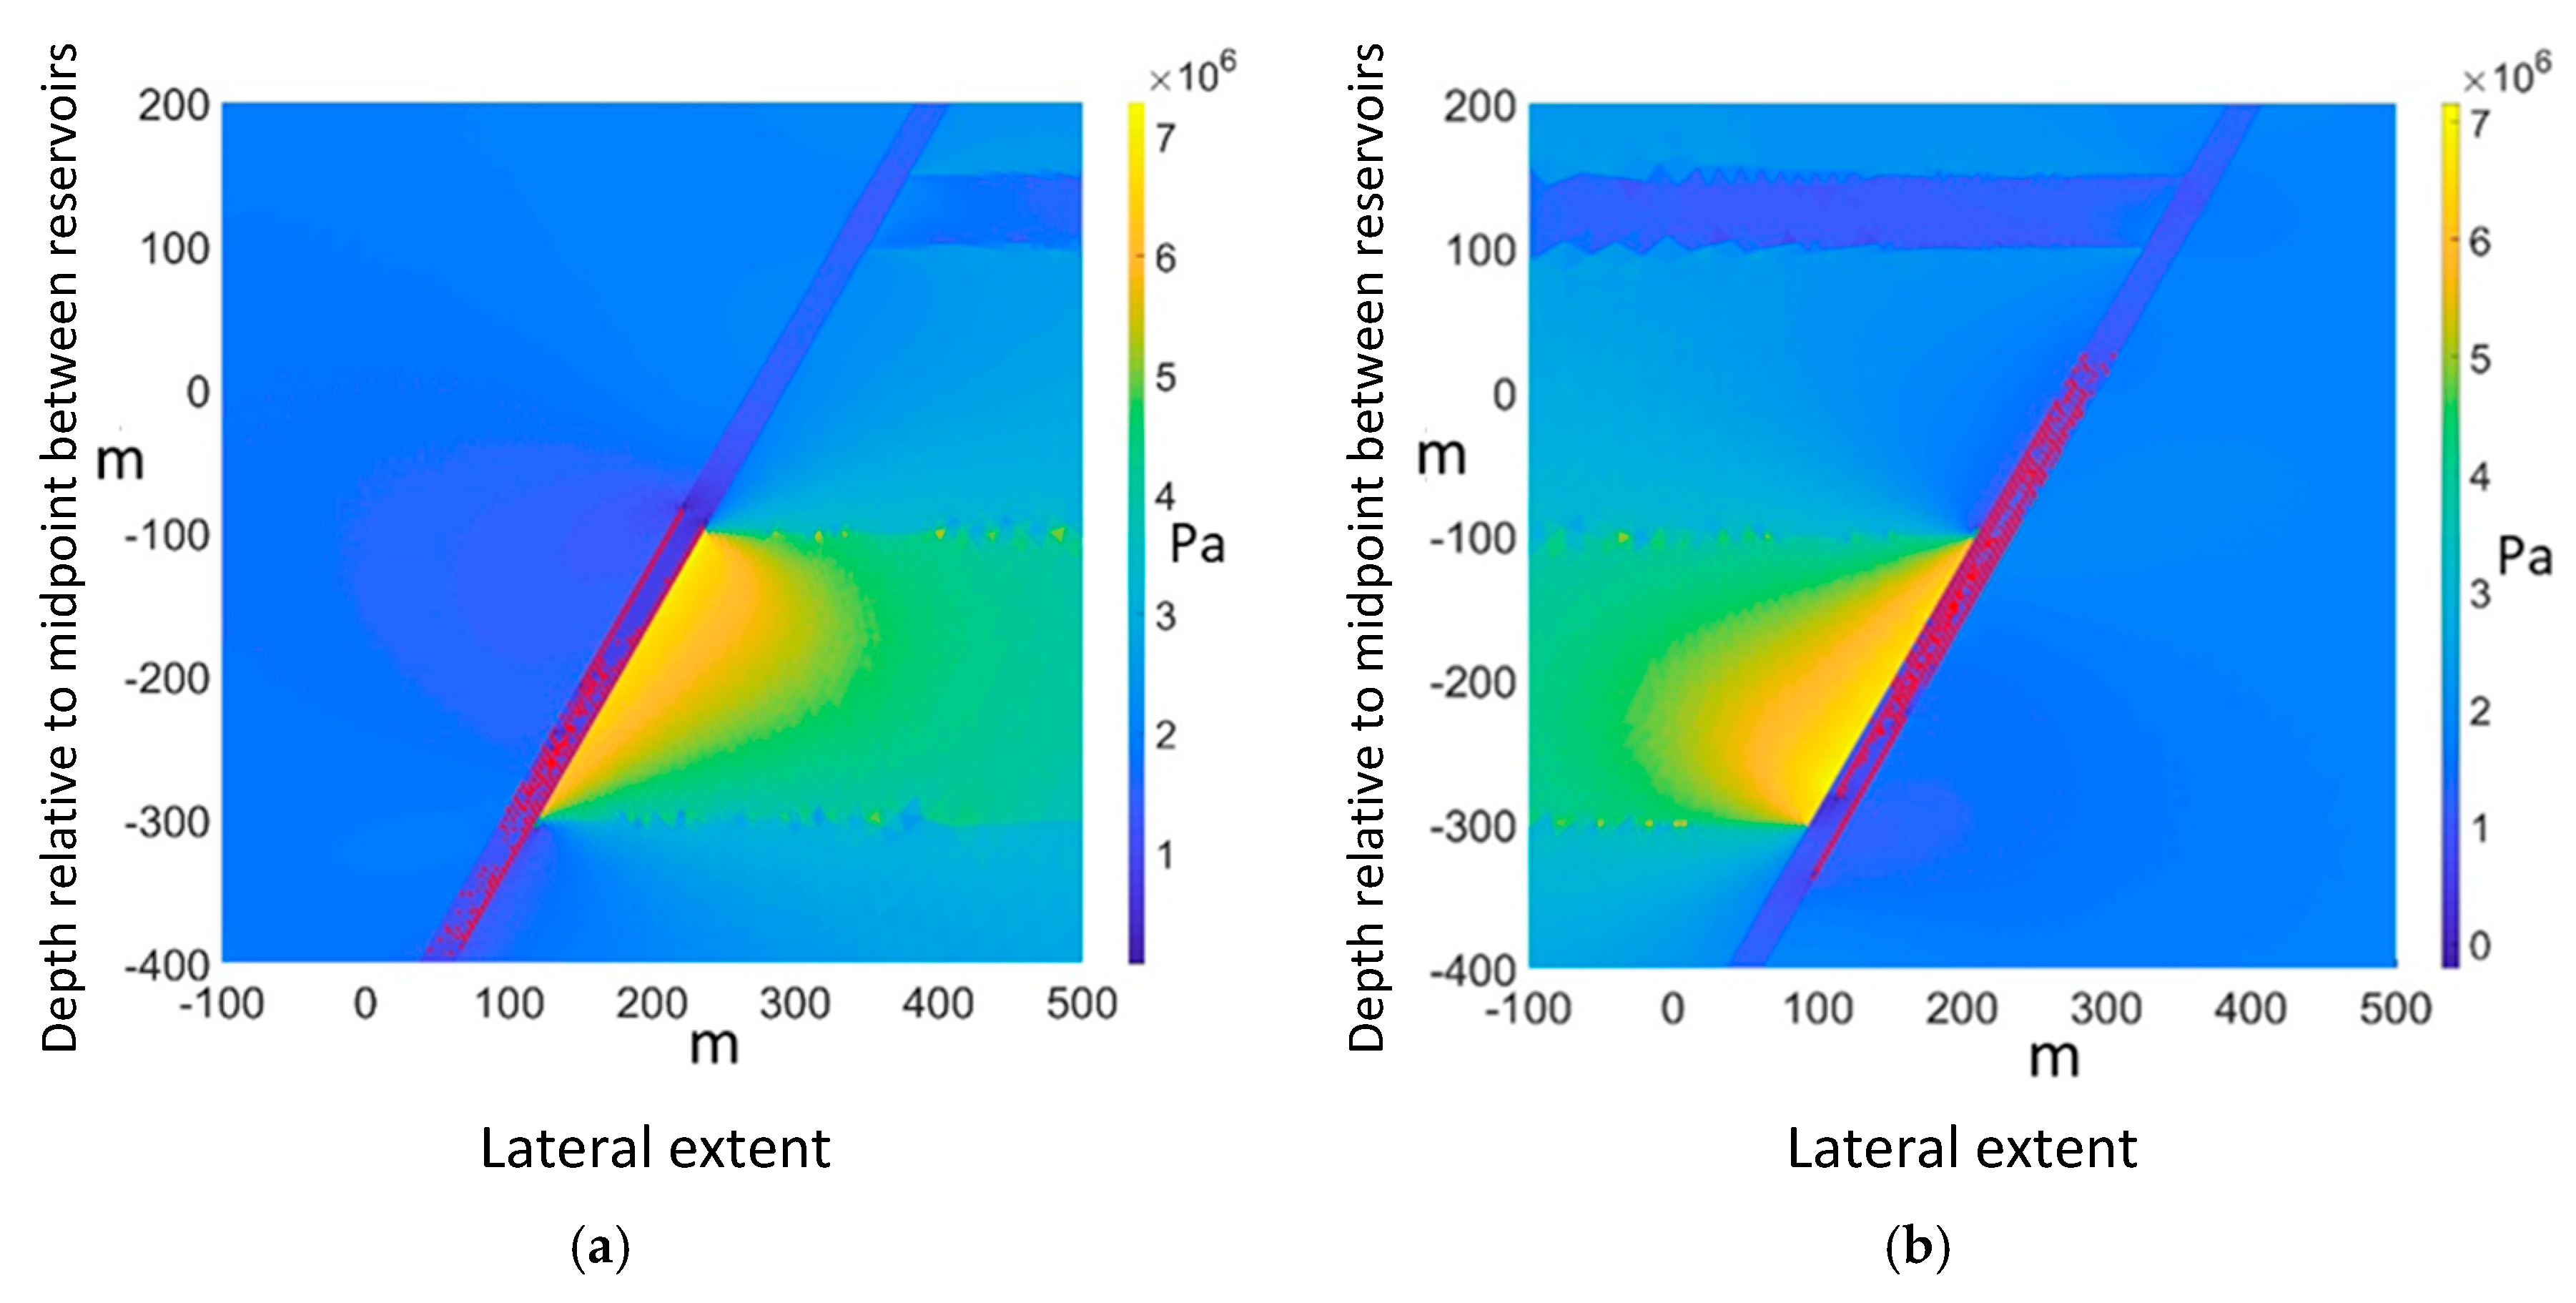
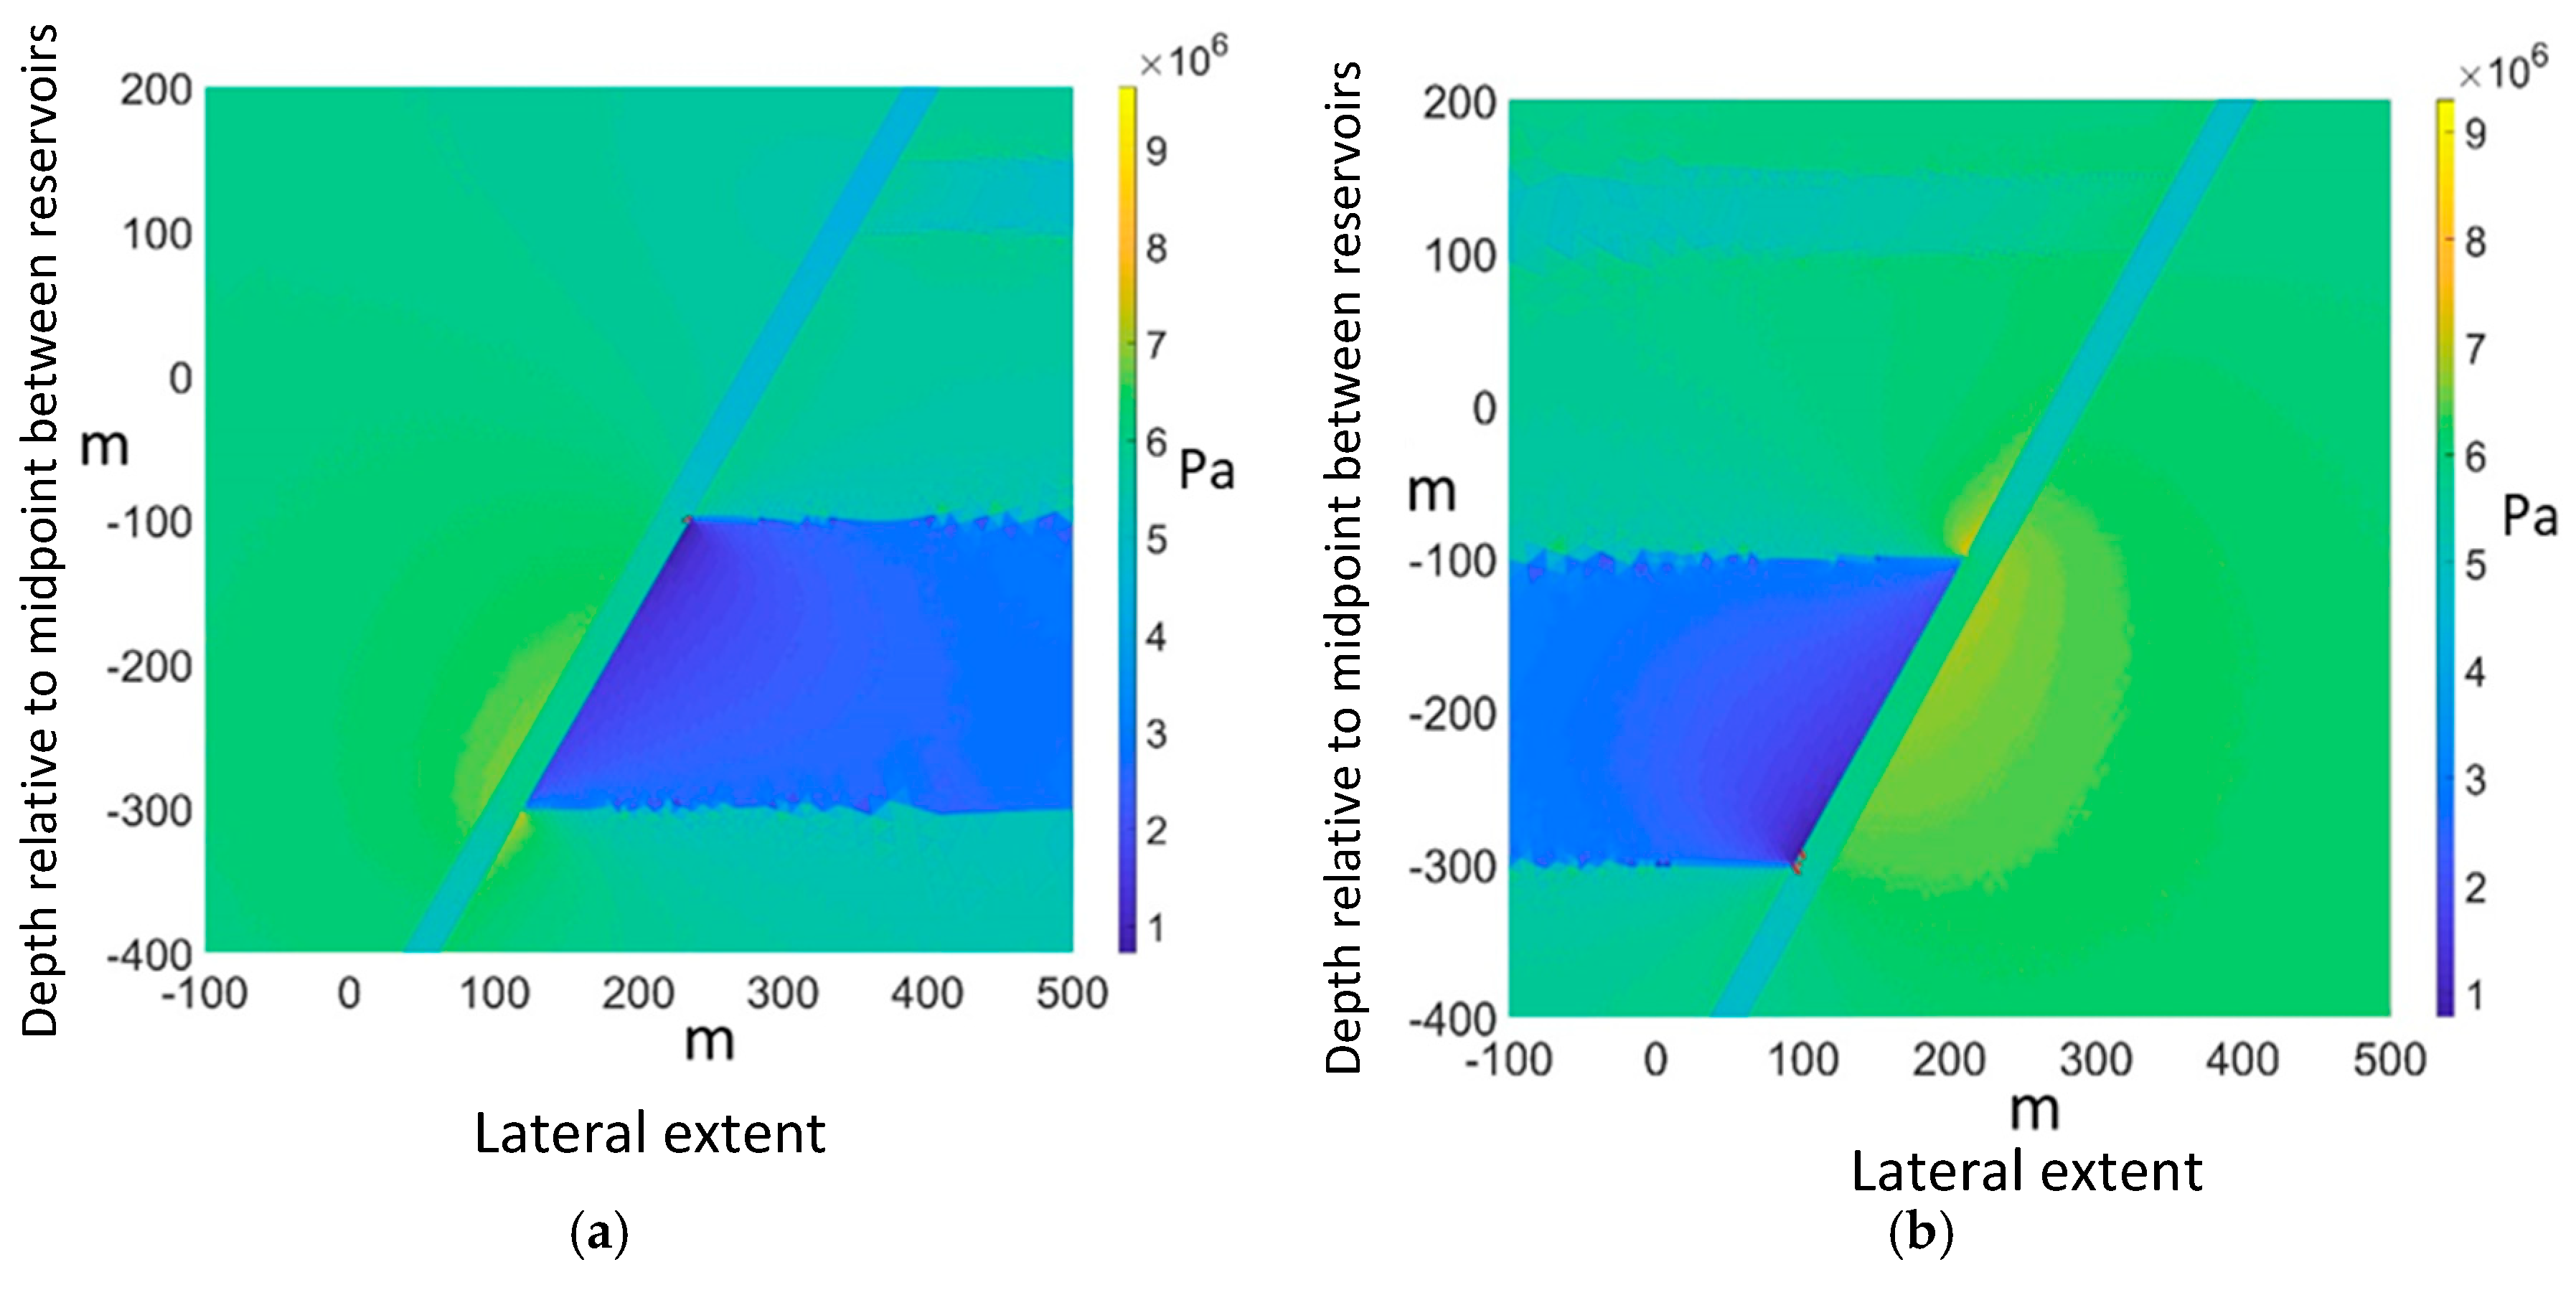
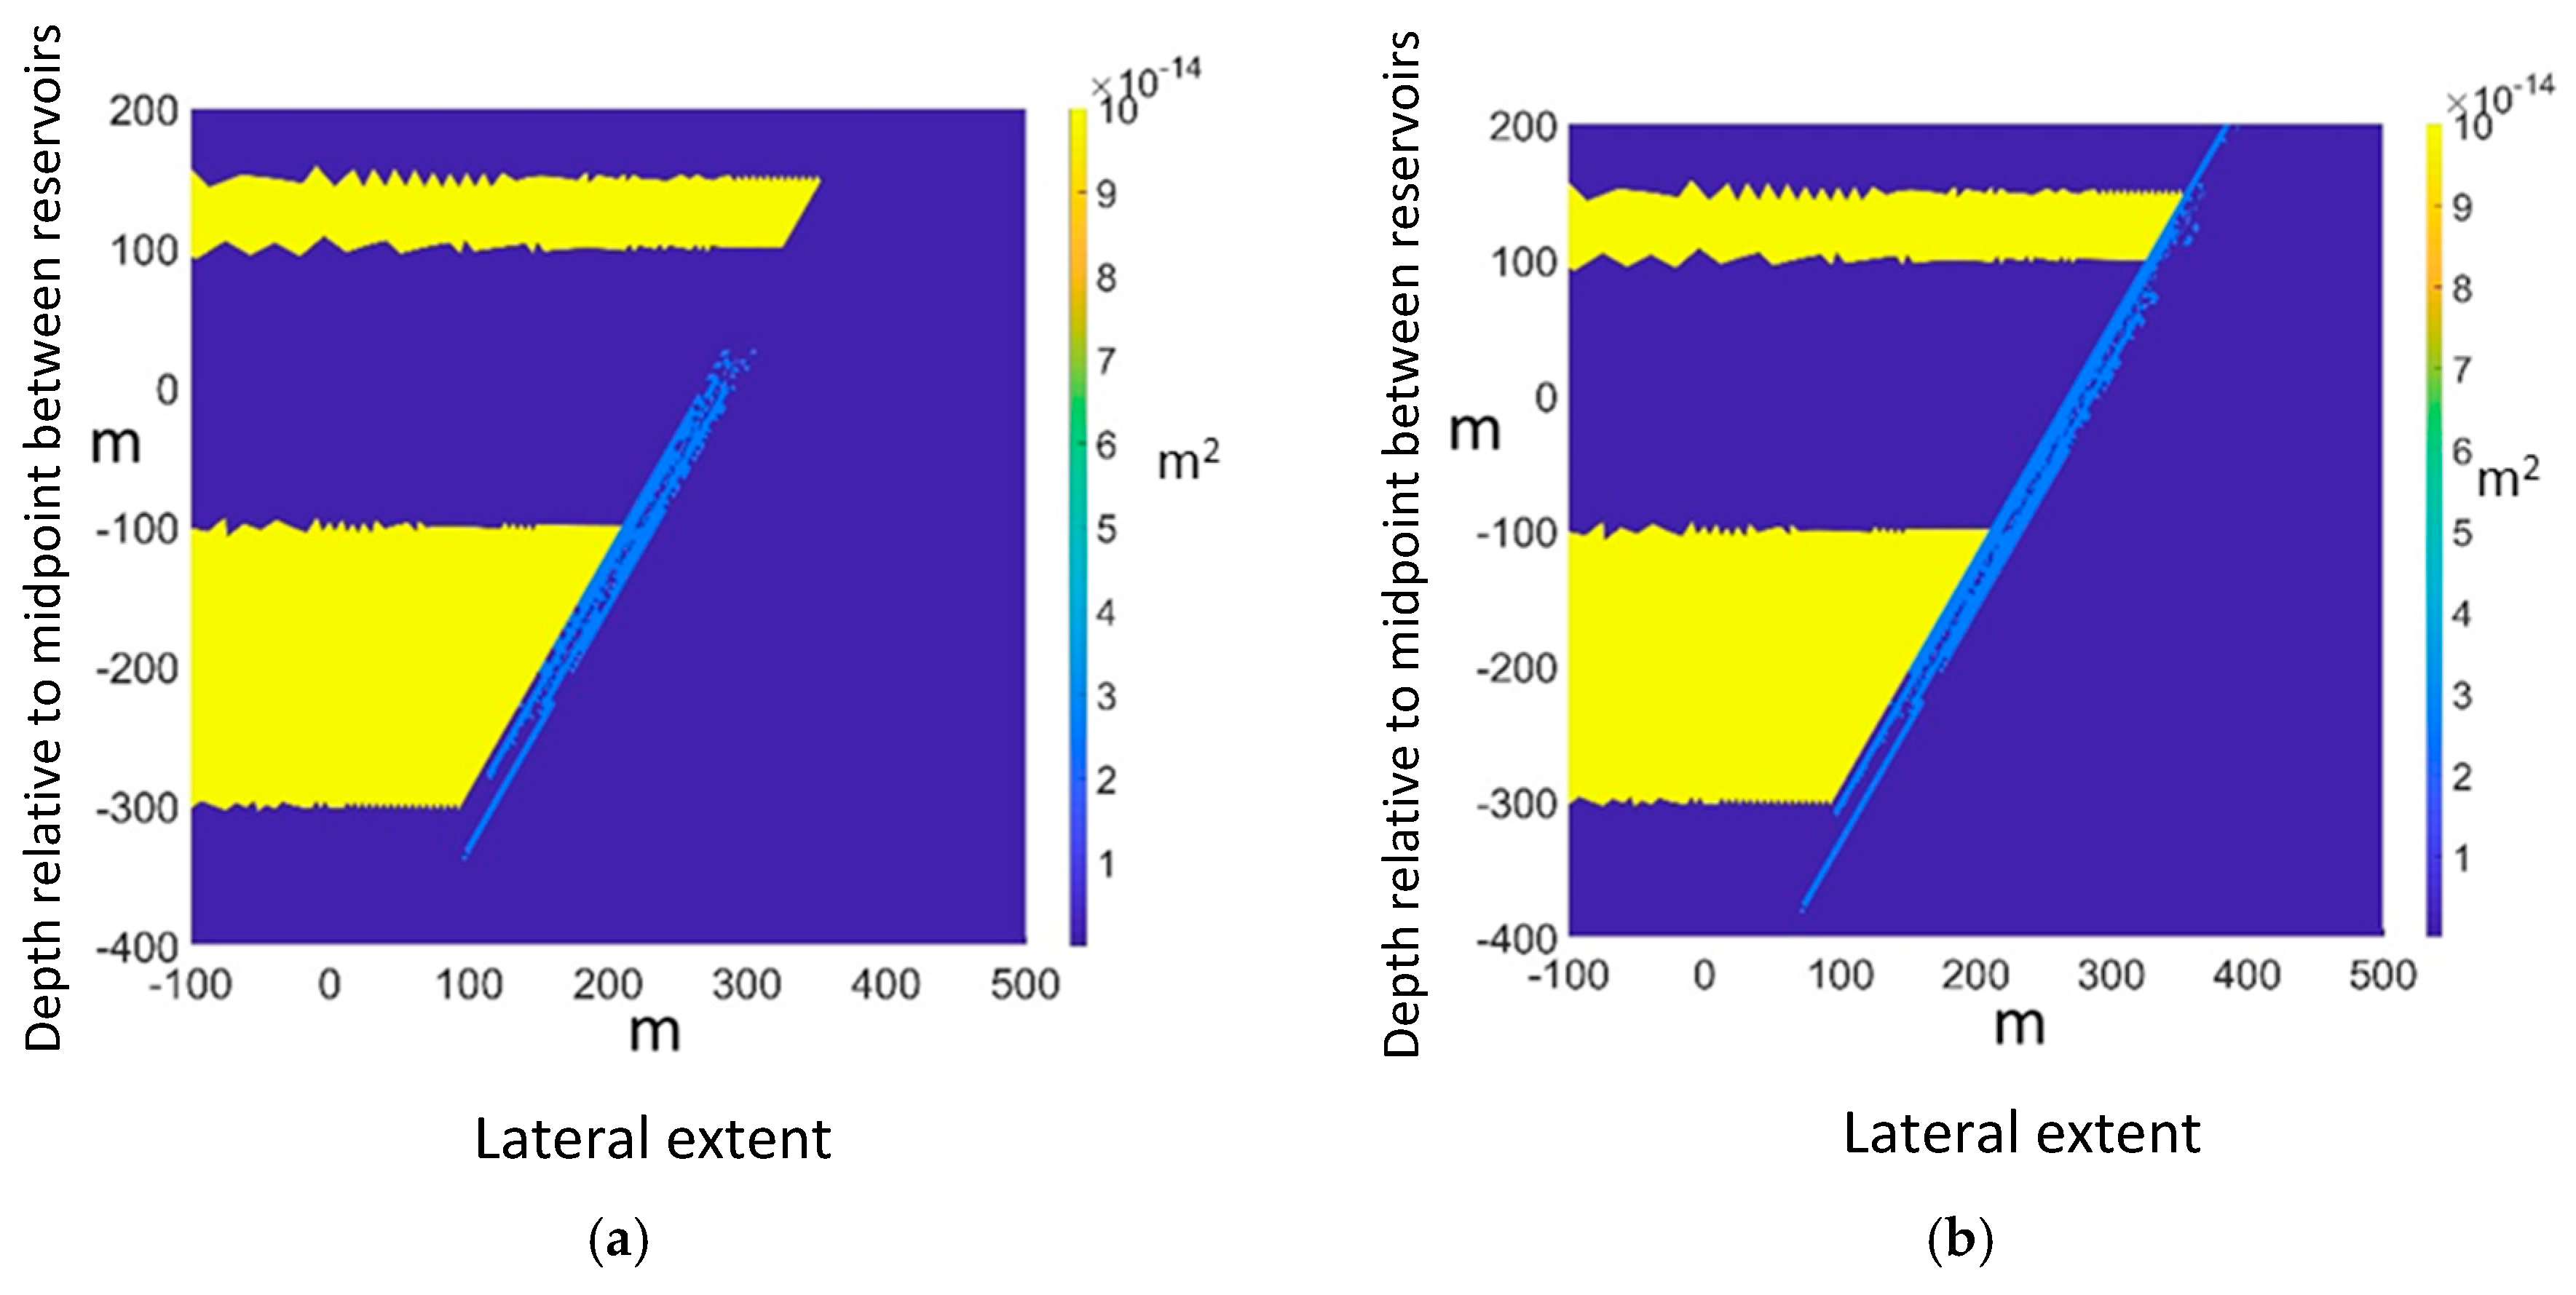
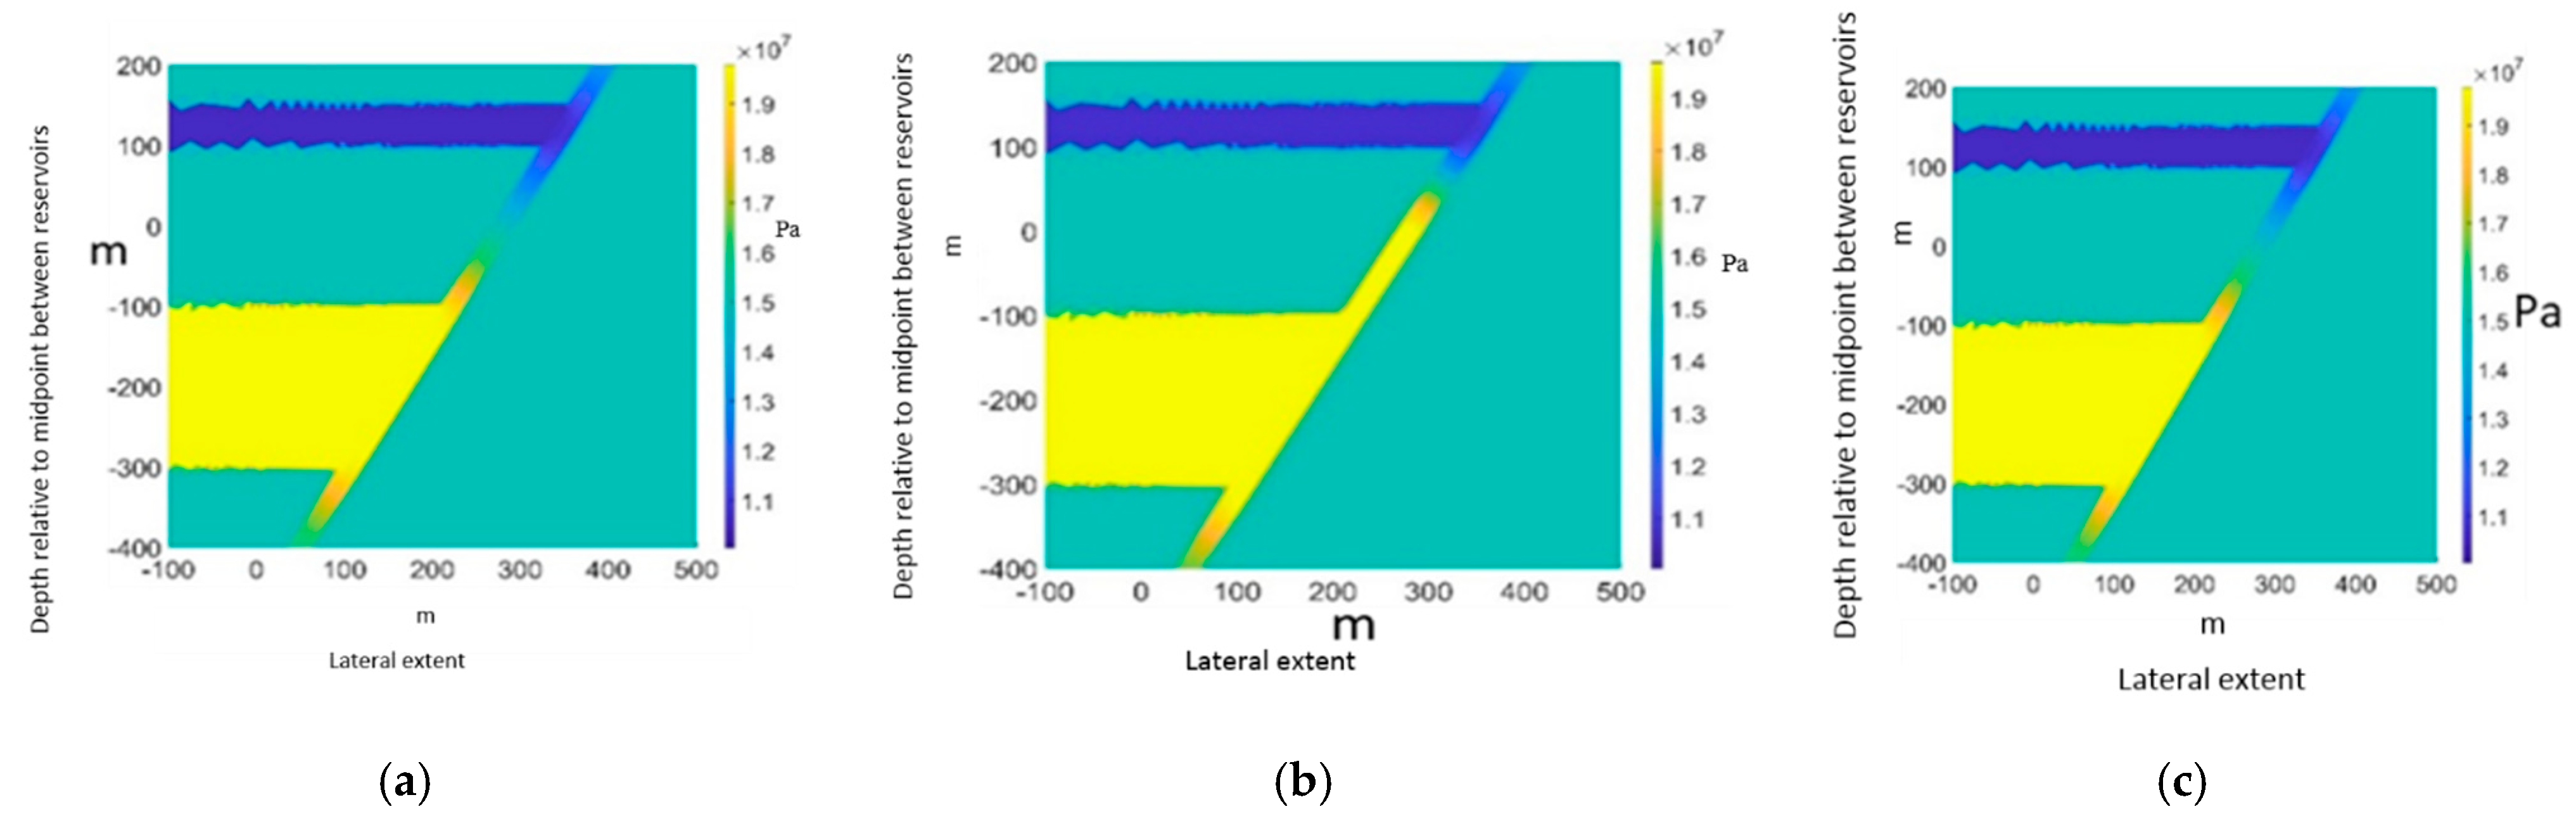
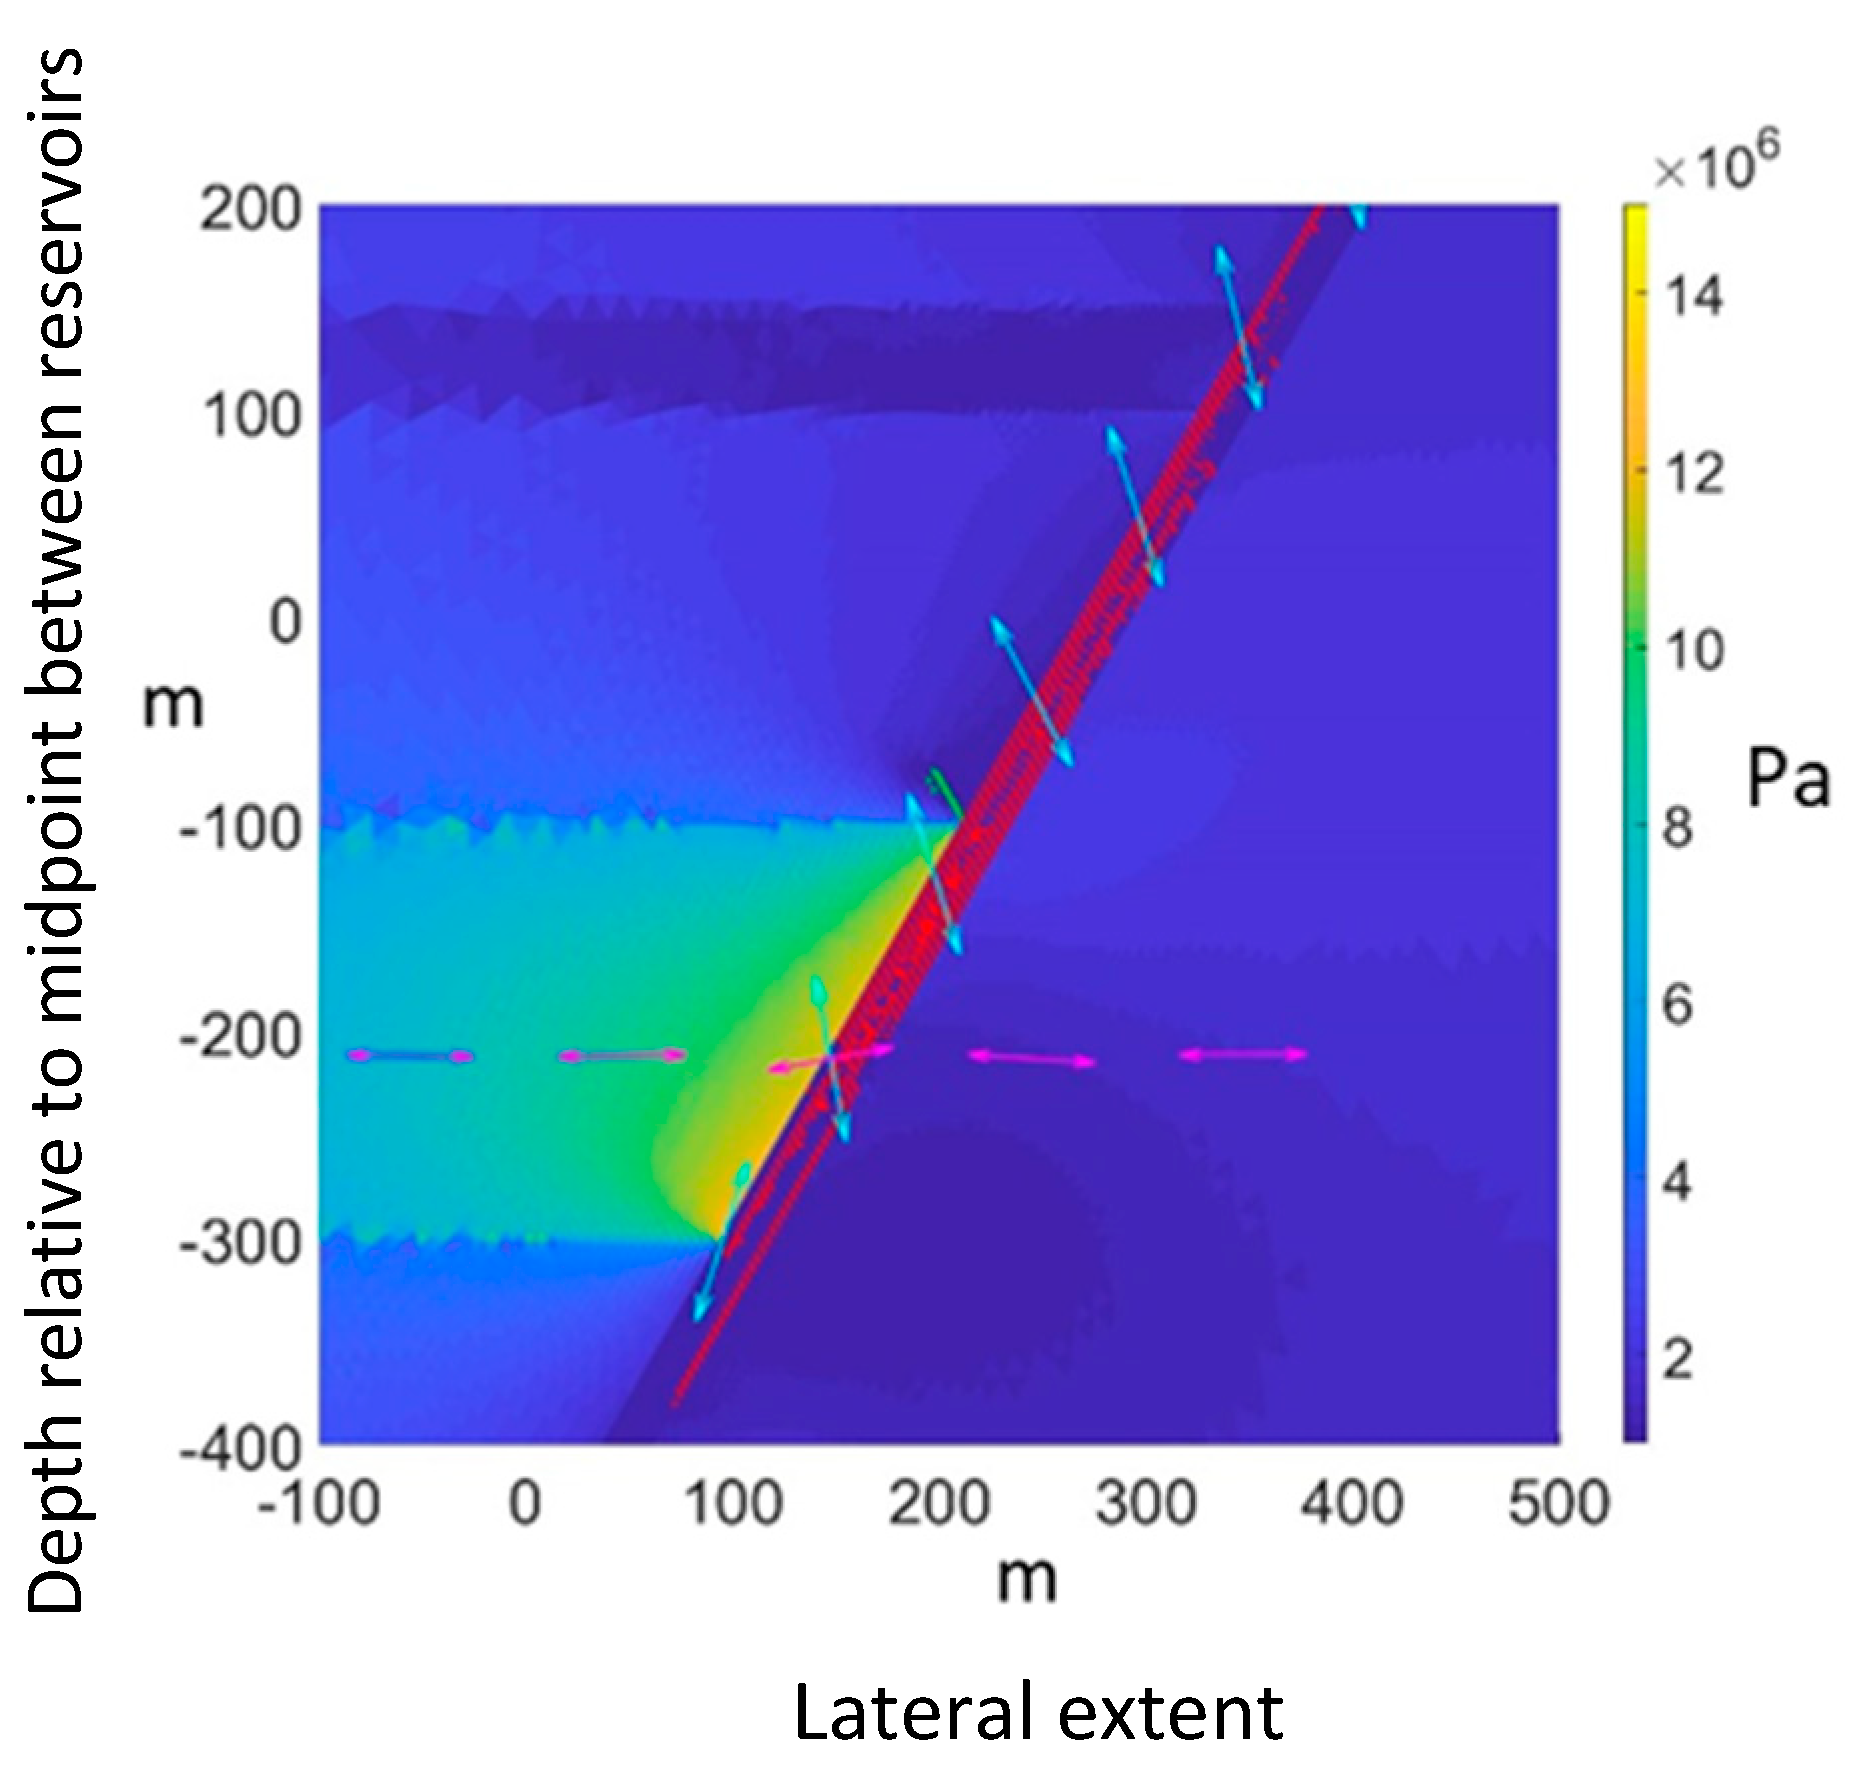
Stress concentration effects translate into inhomogeneous shear stress on the fault plane, again leading to non-uniform "activation" of the fault. This is readily illustrated by plotting the principal stress components along chosen lines crossing the simulation domain (Figure 10), highlighting the stress tensor rotation, and thus, varying the degree of shear stress on the fault plane. In our model, the narrow fault core, usually filled with gouge and traditionally interpreted in terms of lithology as a mixture of sand and clay (for sandstone reservoirs surrounded by shale, at least), is omitted; the proportion of clay in the gouge is usually taken to scale with the throw of the fault. However, little is known about a generic relation to the mechanical properties. The mechanism for whole-scale reactivation of a fault through a slip of its narrow core implies that the failure envelope will be reached upon pore pressure increase relatively uniformly over large stretches of the fault. In addition, the effect of shear failure may trigger shear-enhanced dilation or not, the degree of mineralization, and thus cohesion is not trivial to access, and classical fault reactivation neglects the deformation or the resistance to deformation in the rubble or process zone. It will be interesting to later add to our simple model a variety of possible fault core properties in order to assess the effect on mobilization of the process zone and propensity to large-scale permeability increase (according to laboratory experiments [27], stress hysteresis would also play a significant role on the permeability changes in the fault core). The core permeability may increase, accompanying shear-triggered dilation, or, for weak clayey cores, decrease upon further grain crushing and reduced porosity.
The presence of the process zone in our simulation is, we believe, essential to take field-scale geomechanical modeling to the next level; this is essential to de-risk studies of CO2 storage correctly without being overly conservative in the pressure-limited capacity estimates. For future detailed case studies, more detailed fault and reservoir geometries could contribute to reducing the uncertainty in the output results [5]. In this paper, the geometry and extent of the process zone were taken as approximate representations of average observations in outcrop systems, with the total thickness of the fault taken as 25 m.
The effect of stress hysteresis on our results could be summed up as follows:

4.1. Depletion of the Lower Reservoir Followed by Injection

The primary mechanism for leakage from the lower to the upper reservoir is shearing at the fault during the depletion part, for a reservoir in the hanging wall of the fault; this is intuitively what one would expect considering a deflating reservoir pulling down the overburden, with static side-burden. Stress arching on the fault will tend to make the reservoir side slide down as a rigid body relative to the footwall in the shale. One can also understand the lack of further fracturing when "inflating" the reservoir back to its initial pore pressure; increasing pore pressure will at first only reduce the effective stress components, and hence, the shear stress. However, the presence of a more complex fault system, with sub-faults branching off might change this simple conceptual picture, with perhaps the tensile opening of the sub fault upon shearing of the main fault. This is something that our MDEM tool can readily handle, given the correct input of the fault system geometry.
The situation is changed for the case where the lower reservoir sits in the footwall of the fault, in terms of propagation of fractures towards the upper reservoir. Depletion induces fractures primarily in the process zone’s deeper side, propagating down into the underburden. The same conceptual picture of a rigid body sliding down could be evoked to see that this will first increase the shear at the "narrower" lower part of the reservoir being squeezed against the fault (this is only a very naïve understanding of the deformation process, since in reality there is a gradient of deformation steered mainly by the boundary conditions imposed on the whole simulation domain).
The relevance for CO2 storage of the depletion case is especially interesting, since intuitively, these reservoirs are seen as good candidates, provided storage capacity is as required. The reason is that the well, and pipeline infrastructure is already in place for the oil and gas exploitation that depleted the reservoirs in the first place. Additionally, low in-situ pore pressure leaves a larger margin for storage without getting to values above what the total system experienced in geological times, where sealing was proven from the very presence of hydrocarbons. Our study shows that this is not necessarily true, due to the possibility of fracturing along the bounding faults upon depletion; this fracturing may have gone unnoticed since the production flow generates a pressure gradient towards the wells and not the faults. Thus, this fracturing action upon depletion would only be noticed by passive seismic monitoring, which is not in place everywhere, certainly not offshore. However, once the pressure builds up with CO2 injection, the fractures would manifest themselves and leakage occurs.

4.2. Aquifer Case: Injection Without Prior Depletion of the Lower Reservoir

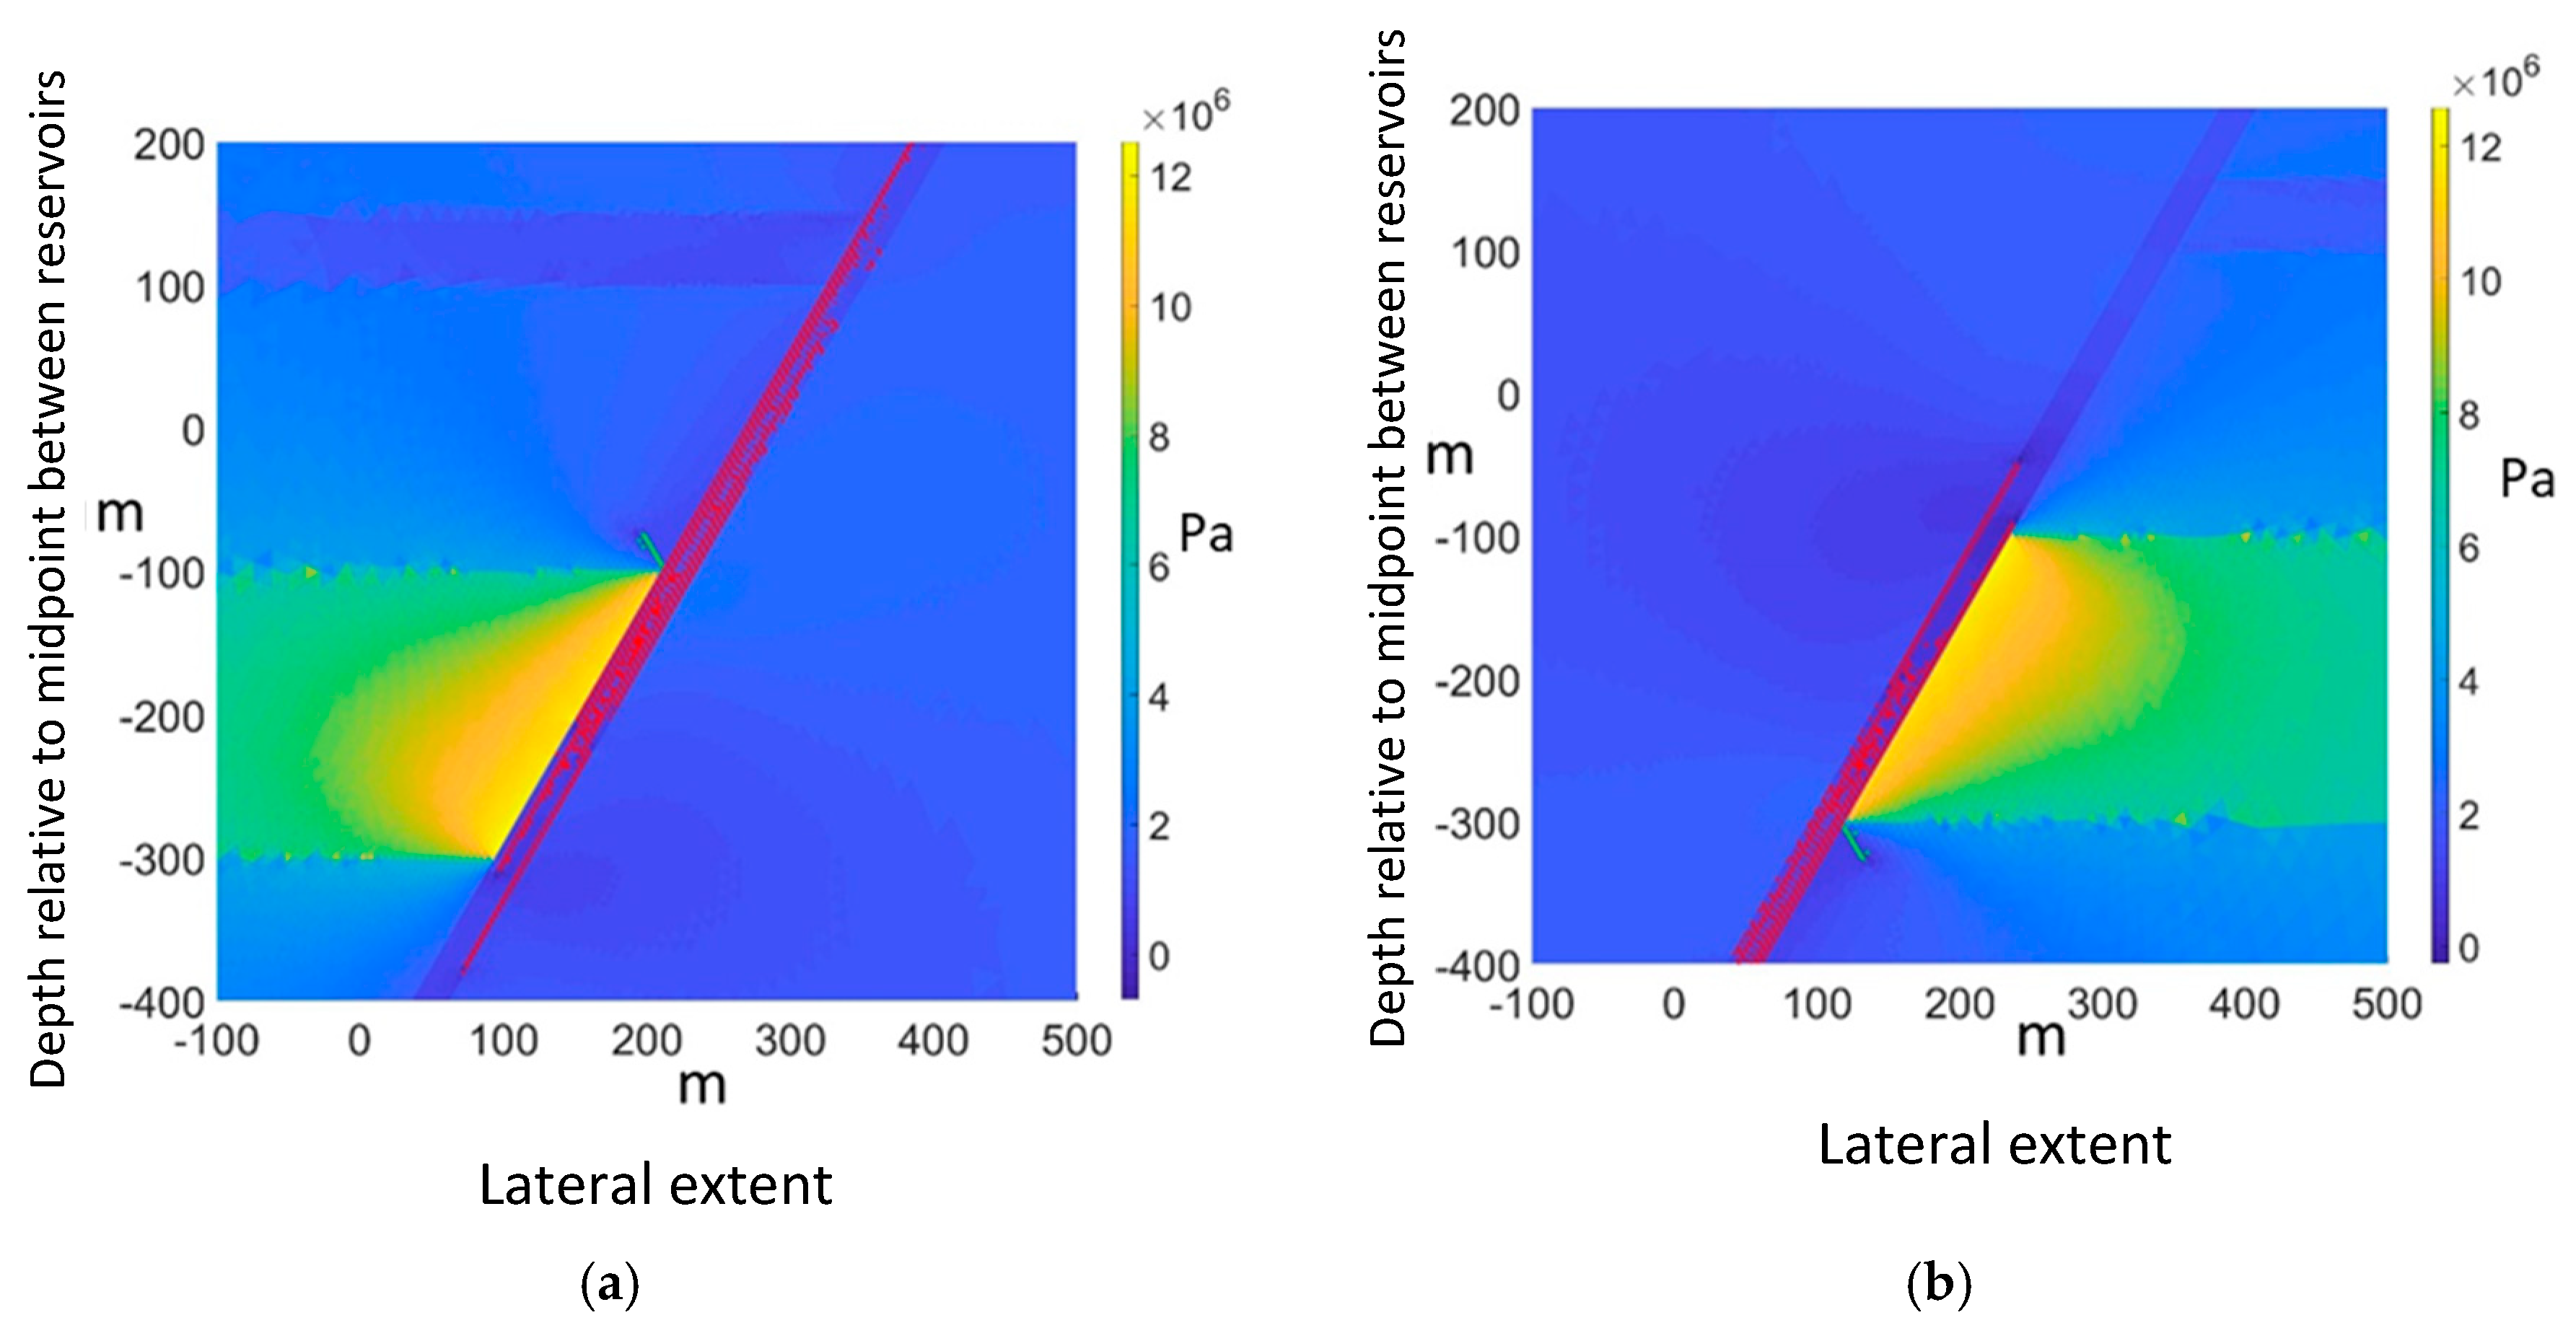
Here, the picture is again reversed as compared to the cases with depletion. For reservoirs in the hanging wall, fractures only propagate down into the basement. It is as if the uniform pressurization of the reservoir has more consequence in the lower, narrower part where it pushes harder on the fault and basement. The results might be somewhat mitigated in a more realistic case with pore pressure gradients and stress variations with depth.
For the case where the lower reservoir sits in the footwall of the fault, fractures propagate upwards preferentially. However, the situation is less critical than for the analogous case of a reservoir in the hanging wall upon depletion, since effective negative stresses develop in the reservoir and hydraulic fracturing would rapidly set in and dominate the picture.
The pressure increase due to CO2 injection in our simulations is taken all the way up to (initial) in-situ minimum horizontal stress, 17 MPa. This would of course not be pursued in the field, where allowable pressure increases would be kept well below the fracturing limit. This strengthens the surprising conclusion in our study, that for the fault properties and chosen reservoir geometry and placement the aquifer case would be completely safe, while the depleted reservoir option may lead to along-fault leakage.

5. Conclusions

In this article, we demonstrate with a simplified model that the departure from a singular fault description (i.e., as a feature-less line in a 2D domain) towards including a structured process zone has consequences on the quantitative evaluation of the risk for developing a leakage path along the fault. The chosen strategy makes use of an explicit fracturing code developed at SINTEF, MDEM, coupled to a commercially available flow simulator, TOUGH2. The obtained results could be seen as a first study looking at a simple layout: two rectangular reservoirs potentially in hydraulic connection by a through-going, rectilinear fault. Geometry, mechanical properties of all layers and complexity (adding more faults) could readily be altered to suit any given site-study requirements.
Four simulation cases are presented in this paper: the first two cases look at re-pressurization of a depleted reservoir, adjacent to a fault linking the reservoir to a shallower reservoir. The two first cases differ in the placement of the deeper reservoir relative to the fault, being either the hanging wall or the footwall. Results show that during the depletion process, the stress concentration at the fault may induce fractures propagating up towards the shallower reservoir (hanging wall case) or down to deeper layers (footwall case). Upon re-pressurization, the increased permeability along the fault may lead to leakage to the shallower reservoir, acting as a sink (hanging wall case). The findings are reversed for the next two simulation cases, where the hanging wall and footwall reservoirs do not undergo prior depletion, but monotonous pressure increase. However, in these last two cases, no hydraulic communication is established with the upper reservoir, even when approaching hydraulic fracturing conditions.
The simulation method used in this paper also opens for parametric studies, where the interest will lie in mapping the equivalent process zone permeability to the corresponding input parameters such as fault orientation, reservoir thickness and permeability, shale and sandstone mechanical properties, and most importantly, the history of the pore pressure variation in the considered reservoir (and hence accompanying stress hysteresis in the whole system). In turn, a more explicit description of the process zone could easily be implemented, setting in pre-existing fractures in the zone instead of weakening its intact mechanical properties.
Varying the properties of the layers in the simulation yields a range where fracturing is likely to occur, and pressure communication risks are established. Combining this with more complex flow simulations, taking into account multi-phase, miscible, and reactive flow could further increase the predictive power of these simulations. Once these properties are known, an upscaling could be performed, such that a permeability along the fault as a function of stress state can be established and exported to more complex cases using standard finite element methods.

Author Contributions

Conceptualization, M.R. and P.C.; methodology, M.R. and P.C.; software, M.R.; validation, M.R. and P.C.; formal analysis, M.R. and P.C.; writing—original draft preparation, P.C.; writing—review and editing, M.R. and P.C.; funding acquisition, P.C.

Funding

This research was funded by the Research Council of Norway in the framework of the SPHINCSS—Stress Path and Hysteresis effects on Integrity of CO2 Storage Site Researcher Project, grant number 268445. The APC was funded by the same RCN Project.

Conflicts of Interest

The authors declare no conflict of interest.

References

  1. Bohloli, B.; Skurtveit, E.; Grande, L.; Titlestad, G.O.; Børresen, M.; Johnsen, Ø.; Braathen, A. Evaluation of reservoir and cap-rock integrity for the Longyearbyen CO2 storage pilot based on laboratory experiments and injection tests. Nor. J. Geol. 2014, 94, 171–187. [Google Scholar]
  2. Rutqvist, J. The geomechanics of CO2 storage in deep sedimentary formations. Geotech. Geol. Eng. 2012, 30, 525–551. [Google Scholar] [CrossRef]
  3. Ringrose, P.; Atbi, M.; Mason, D.; Espinassous, M.; Myhrer, Ø.; Iding, M.; Mathieson, A.; Wright, I. Plume development around well KB-502 at the In Salah CO2 storage site. First Break 2009, 27, 85–89. [Google Scholar]
  4. Longuemare, P.; Mainguy, M.; Lemonnier, P.; Onaisi, A.; Gérard, C.; Koutsabeloulis, N. Geomechanics in reservoir simulation: Overview of coupling methods and field case study. Oil Gas Sci. Technol. 2002, 57, 471–483. [Google Scholar] [CrossRef]
  5. Aagaard, B.T.; Knepley, M.G.; Williams, C.A. A domain decomposition approach to implementing fault slip in finite-element models of quasi-static and dynamic crustal deformation. J. Geophys. Res. Solid Earth 2013, 118, 3059–3079. [Google Scholar] [CrossRef] [Green Version]
  6. Orlic, B. Some geomechanical aspects of geological CO2 sequestration. KSCE J. Civ. Eng. 2009, 13, 225–232. [Google Scholar] [CrossRef]
  7. Vilarrasa, V.; Makhnenko, R.; Gheibi, S. Geomechanical analysis of the influence of CO2 injection location on fault stability. J. Rock Mech. Geotech. Eng. 2016, 8, 805–818. [Google Scholar] [CrossRef]
  8. Lin, A.; Yamashita, K. Spatial variations in damage zone width along strike-slip faults: An example from active faults in southwest Japan. J. Struct. Geol. 2013, 57, 1–15. [Google Scholar] [CrossRef] [Green Version]
  9. Veveakis, E.; Sulem, J.; Stefanou, I. Modeling of fault gouges with Cosserat Continuum Mechanics: Influence of thermal pressurization and chemical decomposition as coseismic weakening mechanisms. J. Struct. Geol. 2012, 38, 254–264. [Google Scholar] [CrossRef] [Green Version]
  10. Gudmundsson, A.; Simmenes, T.H.; Larsen, B.; Philipp, S.L. Effects of internal structure and local stresses on fracture propagation, deflection, and arrest in fault zones. J. Struct. Geol. 2010, 32, 1643–1655. [Google Scholar] [CrossRef]
  11. Faulkner, D.R.; Jackson, C.A.L.; Lunn, R.J.; Schlische, R.W.; Shipton, Z.K.; Wibberley, C.A.J.; Withjack, M.O. A review of recent developments concerning the structure, mechanics and fluid flow properties of fault zones. J. Struct. Geol. 2010, 32, 1557–1575. [Google Scholar] [CrossRef]
  12. Mitchell, T.M.; Faulkner, D.R. Experimental measurements of permeability evolution during triaxial compression of initially intact crystalline rocks and implications for fluid flow in fault zones. J. Geophys. Res. Solid Earth 2008, 113, 5588. [Google Scholar] [CrossRef]
  13. Alassi, H.T.I.; Li, L.; Holt, R.M. Discrete Element Modeling of Stress and Strain Evolution Within and Outside a Depleting Reservoir. Pure Appl. Geophys. 2006, 163, 1131–1151. [Google Scholar] [CrossRef]
  14. Roy, P.; Morris, J.P.; Walsh, S.D.; Iyer, J.; Carroll, S. Effect of thermal stress on wellbore integrity during CO2 injection. Int. J. Greenh. Gas Control 2018, 77, 14–26. [Google Scholar] [CrossRef]
  15. Bauer, A.; Larsen, I.; Lavrov, A. Numerical model of extended leak-off test (XLOT). ARMA-2015-305. In Proceedings of the 49th US Rock Mechanics/Geomechanics Symposium, American Rock Mechanics Association, San Francisco, CA, USA, 28 June–1 July 2015. [Google Scholar]
  16. Lavrov, A.; Larsen, I.; Bauer, A. Coupling a fracturing code to a transient reservoir simulator: A hands-on approach. ARMA 16-560. In Proceedings of the 50th US Rock Mechanics/Geomechanics Symposium, American Rock Mechanics Association, Houston, TX, USA, 26–29 June 2016. [Google Scholar]
  17. Rongved, M.; Holt, R.M.; Larsen, I. The effect of heterogeneity on multiple fracture interaction and on the effect of a non-uniform perforation cluster distribution. In Geomechanics and Geophysics for Geo-Energy and Geo-Resources; Elsworth, D., Huppert, H., Li, J., Ranjith, P.G., Zhao, J., Eds.; Springer International: Basel, Switzerland, 2019; pp. 1–18. [Google Scholar]
  18. Sperrevik, S.; Gillespie, P.A.; Fisher, Q.J.; Halvorsen, T.; Knipe, R.J. Empirical estimation of fault rock properties. Norwegian Pet. Soc. Special Publications 2002, 11, 109–125. [Google Scholar] [CrossRef]
  19. Cerasi, P.; Lund, E.; Kleiven, M.L.; Stroisz, A.; Pradhan, S.; Kjøller, C.; Fjær, E. Shale creep as leakage healing mechanism in CO2 sequestration. Energy Procedia 2017, 114, 3096–3112. [Google Scholar] [CrossRef]
  20. Chang, C.; Zoback, M.D.; Khaksar, A. Empirical relations between rock strength and physical properties in sedimentary rocks. J. Pet. Sci. Eng. 2006, 51, 223–237. [Google Scholar] [CrossRef]
  21. Rinaldi, A.P.; Rutqvist, J.; Cappa, F. Geomechanical effects on CO2 leakage through fault zones during large-scale underground injection. Int. J. Greenh. Gas Control 2014, 20, 117–131. [Google Scholar] [CrossRef]
  22. Iyer, J.; Walsh, S.D.; Hao, Y.; Carroll, S.A. Assessment of two-phase flow on the chemical alteration and sealing of leakage pathways in cemented wellbores. Int. J. Greenh. Gas Control 2018, 69, 72–80. [Google Scholar] [CrossRef]
  23. Wibberley, C.A.; Shimamoto, T. Internal structure and permeability of major strike-slip fault zones: The Median Tectonic Line in Mie Prefecture, Southwest Japan. J. Struct. Geol. 2003, 25, 59–78. [Google Scholar] [CrossRef]
  24. Guglielmi, Y.; Birkholzer, J.; Rutqvist, J.; Jeanne, P.; Nussbaum, C. Can fault leakage occur before or without reactivation? Results from an in situ fault reactivation experiment at Mont Terri. Energy Procedia 2017, 114, 3167–3174. [Google Scholar] [CrossRef]
  25. Boait, F.C.; White, N.J.; Bickle, M.J.; Chadwick, R.A.; Neufeld, J.A.; Huppert, H.E. Spatial and temporal evolution of injected CO2 at the Sleipner Field, North Sea. J. Geophys. Res. Solid Earth 2012, 117. [Google Scholar] [CrossRef]
  26. Finley, R.J. An overview of the Illinois Basin—Decatur project. Greenh. Gases Sci. Technol. 2014, 4, 571–579. [Google Scholar] [CrossRef]
  27. Cuss, R.J.; Wiseall, A.C.; Tamayo-Mas, E.; Harrington, J.F. An experimental study of the influence of stress history on fault slip during injection of supercritical CO2. J. Struct. Geol. 2018, 109, 86–98. [Google Scholar] [CrossRef]
Figure 1. Definition of the potential fracture location in MDEM (Modified Discrete Element Method), showing the element definition, after failure. The arrows show the contact of normal and shear forces, Fn and Fs, respectively.
Energies 12 03458 g001
Figure 2. Diagram of the simulation domain. (a) Sandstone formations are in the hanging wall; (b) Sandstone formations in the footwall. Note that these diagrams are schematic and do not show the fault structure (process zone).
Energies 12 03458 g002
Figure 3. (a) Discretization of the entire numerical domain; (b) Refined mesh around the fault (zoom of the red rectangle at left).
Energies 12 03458 g003
Figure 4. Assignment of rock types to the domain elements. Dark blue: shale (caprock, underburden, overburden, and footwall at left (a) or hanging wall at right (b)). Light blue: sandstone (lower and upper reservoirs). Yellow: fault damage zone (process zone). Axes: distance in meters.
Energies 12 03458 g004
Figure 5. (a) For reservoirs in the hanging wall, shear fractures appear in the fault’s process zone as depletion reaches 5 MPa (10 MPa pore pressure). The failed elements are shown in red; (b) For reservoirs in the footwall, the picture is reversed (10 MPa pore pressure). Effective horizontal stress is plotted, scale in Pa.
Energies 12 03458 g005
Figure 6. (a) For reservoirs in the hanging wall, shear fractures propagate all the way up to the shallower reservoir when the depletion reaches 10 MPa (5 MPa pore pressure). The failed elements are shown in red; (b) For reservoirs in the footwall, the picture is reversed, with no breakthrough to the upper reservoir. Effective horizontal stress is plotted, scale in Pa.
Energies 12 03458 g006
Figure 7. (a) For reservoirs in the hanging wall, no shear fracture is seen to propagate up along the fault, even when the pore pressure reaches 17 MPa (11 MPa initial pore pressure). The failed elements are shown in red; (b) For reservoirs in the footwall, the picture is reversed, with a handful of fractures appearing at the lower reservoir’s top corner. Effective horizontal stress is plotted, scale in Pa.
Energies 12 03458 g007
Figure 8. Permeability (in mD) distribution in the simulation domain. Intact element permeability is assigned by the user (yellow: sandstone; dark blue: shale, light blue: computed permeability in failed process zone elements). (a) 5 MPa depletion; (b) 10 MPa depletion (reservoirs in the hanging wall).
Energies 12 03458 g008
Figure 9. Map of pore pressure distribution after setting a 10 MPa initial pressure difference between the lower and higher reservoir and turning off the fracturing simulator. (a) and (b) Partial fracturing along the fault’s process zone; (c) A leakage path has been established between the two reservoirs; thus the pressure equilibrates in the long-term. Pore pressure in Pa.
Energies 12 03458 g009
Figure 10. Visualization of principal stress rotation near the fault; maximum principal stress along the fault: light blue, minimum principal stress along the lower reservoir’s central line: pink. Horizontal effective stress magnitude in Pa.
Energies 12 03458 g010
Table 1. Mechanical properties in the simulation domain for the depletion case with fracturing.
Mechanical PropertyShaleSandstoneShear (process) Zone
Shear strength [MPa]12161.2
Tensile strength [MPa]121
Poisson’s ratio [-]0.30.150.3
Young’s modulus [GPa]5101
Table 2. Assigned permeability values in the simulation domain.
Permeability schemeShaleSandstoneShear (process) Zone
Initial permeability 10 nD1 mD10 µD
Fracture permeability (failed element) 10 mD10 mD10 mD
Table 3. Permeability increase in the fractured process zone relative to the intact case.
Reservoir placementStress PathAverage Permeability Increase Along the Fault Relative to the Intact Case (No Fracturing in the Process Zone) kfractured/kintact
Reservoirs in hanging wall5 MPa depletion case (b)1.38
10 MPa depletion case (c)162
6 MPa pressure increase case (a)1
Reservoirs in footwall10 MPa depletion case (b)1
6 MPa pressure increase case (b)1

