Knowledge Embedded Semi-Supervised Deep Learning for Detecting Non-Technical Losses in the Smart Grid


Abstract

1. Introduction
- The consumption pattern of residential customers is more stable than that of industrial customers. It is easier to find change points of residential consumption history, while industrial customers have multiple consumption patterns because they have to adjust their consumption behaviour according to the market [7].
- Residential customers are similar to each other, while industrial customers are quite different. It is easier to cluster residential customers into limited categories [8]. Particularly, [9] uses the location as assistant feature. On the contrary, industrial customers’ consumption patterns are quite different from one another, even if they belong to the same domain or are located near to each other [3].
- How to extract features with higher linear separability? Refer to recent research, the features are mostly designed manually according to observation and experience based on electricity consumption. They can hardly represent all scenarios of NTL because consumption behaviour is random and unpredictable, especially for industrial customers. For example, when changes in consumption pattern due to change in household residents or usage of electrical devices might make it looks like electricity theft [10]. This situation would destroy linear separability of traditional features.
- How to obtain satisfactory performance based on limited labeled samples? Compared to unsupervised learning-based methods, supervised learning-based methods acquired better detection accuracy and become used in the mainstream gradually. However, the realistic NTL samples of which in-field inspected are rare indeed, supervised learning methods are an easier lead to overfitting. On the other hand, the artificial samples as a possible solution are adopted by some approaches [10,11]. Even though they provide lots of labeled samples to support training models, the effectiveness of such attack models is not verified by realistic cases. Due to preconfigured parameters or fixed distribution, it is believable that such artificial samples would also lead to overfitting easily.
- How to achieve higher accuracy among various customers? Currently, many of related approaches which are based on Support Vector Machines (SVM), K-Nearest Neighbors (KNN), etc., have low accuracy. Even if using much auxiliary data [3] or a large number of labeled samples [12], the performance of these approaches still cannot suit realistic requirements.
- Based on SM data, this paper designs a domain knowledge embedded data model to enhance linear separability of normal samples and abnormal samples.
- We propose a novel deep neural network-based semi-supervised model to extract advanced features from limited labeled samples efficiently. In addition, by designing an adversarial module, our model has stronger anti-noise ability.
- Our approach improves the performance of NTL detection obviously. Experimental results show that all metrics of SSAE model outperform other existing approaches in realistic cases.
2. Related Work
- Supervised learning-based methods. They mainly include Decision Tree (DT) [13,14], Support Vector Machines (SVM) [13,15,16], K-Nearest Neighbors (KNN) [17], Bayesian Networks (BN) [18], Artificial Neural Network(ANN) [12,17], Deep Neural Network(DNN) [12], etc. Depend on supervised learning algorithm and artificial feature, these methods acquire satisfactory effect in some situations. Due to the variety of NTL, especially electricity theft, these methods require large samples with the right labels to train algorithms. However, it is difficult to collect enough realistic normal and abnormal cases, which makes the labeled samples are very scarce. To avoid insufficient realistic NTL samples, [10,11,13] attempt to model NTL and produce artificial NTL samples. Same as the necessary requirement of massive labeled samples, features are equally important to classifiers. To construct powerful feature models, most researchers applied raw data, statistics, Fourier coefficients, wavelet coefficients, slope of consumption curve, etc. However, all of them still could not cover all situation of NTL, especially the NTL of industrial customers. Hence, [12] proposed deep learning-based method and self-learned features from massive consumption data. The results from [12] show that wide and deep convolutional neural networks has strong feature learning ability and improve accuracy in electricity theft detection. However, the limitation of consumption data blocks the implementation of [12] to industrial customers.
- Unsupervised learning-based methods. To avoid labeling massive samples, some researchers choose unsupervised methods to detect NTL. Unsupervised methods do not need any labeled samples, and primary contain clustering [8,19], outlier detection [20] and expert systems [21]. Even though a series of unsupervised methods are free from labeling training set, their performance always could hardly satisfy electricity providers when they deploy standalone. Frequently, unsupervised algorithms pose auxiliary methods. They are used to group similar consumers, and then train further classifiers on these groups [8,19]. However, because of the fact that abnormal samples are always far less than the normal samples, it is still difficult to promise that each group own enough labeled samples. Hence, misjudging tends to occur whatever clustering or classification.
- Semi-supervised learning-based methods. They allow the NTL detector to be trained on a few labeled samples and large unlabeled samples [22]. In ref. [23] uses Transductive SVM(TSVM) to build a NTL detecting system. Restricted to TSVM could not handle imbalance situation, [23] has not been demonstrated enough for detecting NTL. However, semi-supervised learning still is competitive and hopeful choice for detecting NTL when it meets deep learning.
3. Modeling Samples with Knowledge
3.1. Principle of Electricity Measurement
3.2. SM Data
3.3. Analysis of NTL
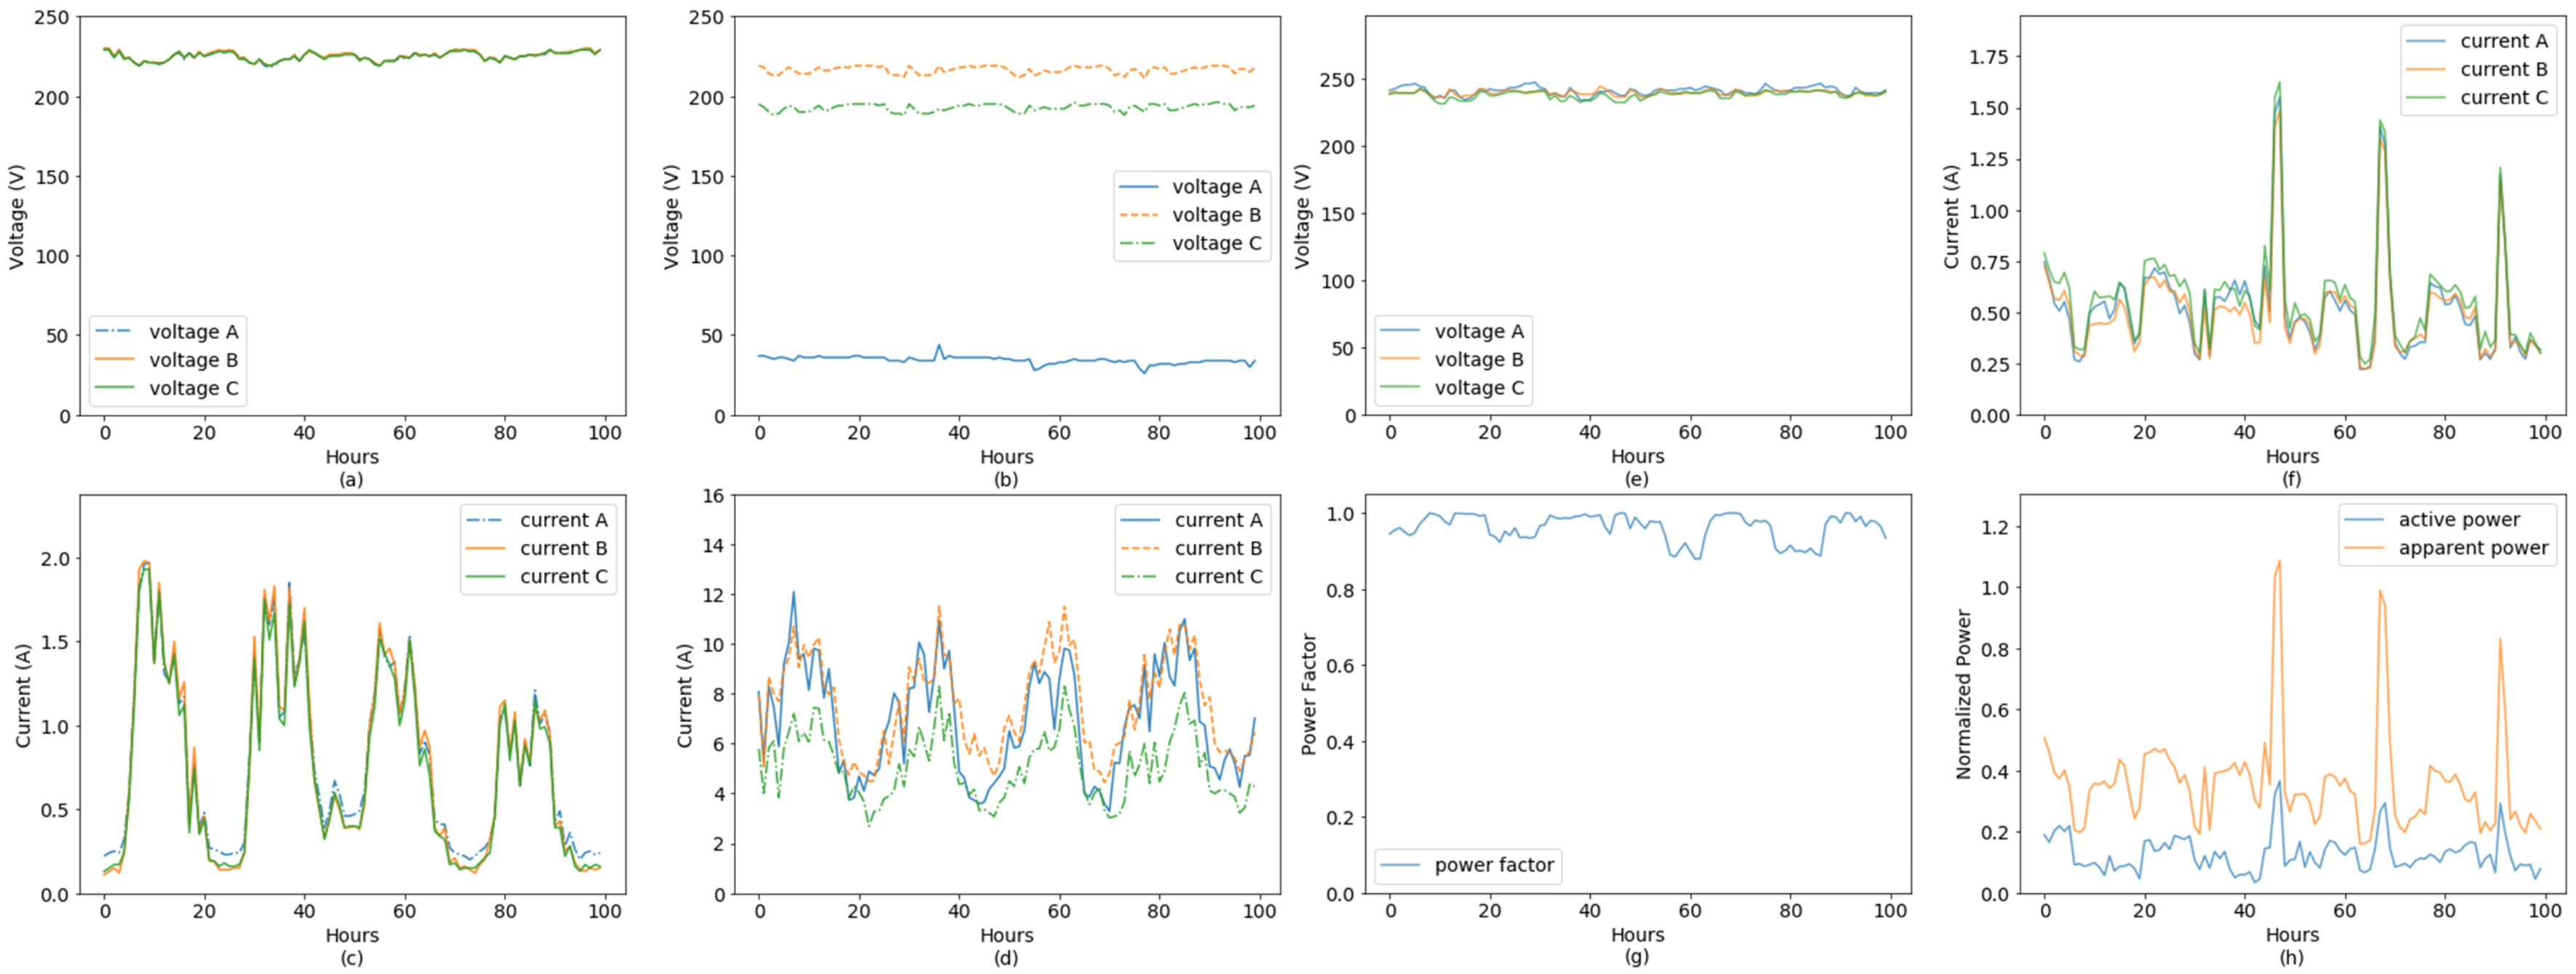
- Shunts: For a three-phase situation, the shunts is the outputs of PT or CT are shorted or injected a low-resistance path. In general, it would reduce the measured voltage or current. Commonly, voltages and currents of three-phase customers are almost balance [30], such as Figure 1a,c. The shunts will break the balance on voltages or currents, such as Figure 1b,d. In particular, the degree of imbalance about three-phase currents is related to customers’ load level, and is different among all customers. Shunts are the most complicated NTL because normal customers may also have similar phenomenon. In Figure 1c, the currents of a normal customer also have little imbalance when the load is low.
- Phase Shift: It means that the phase difference between voltage and current is changed artificially. Through increasing to reduce the power factor, and decrease the measured active power. There is a significant phenomenon that the power factor reduced obviously. Commonly, the power factor should close to 1.
- Phase disorder: The currents are coupled with the wrong voltages. Figure 1e–h presents a typical example of this case. The output of phase-A’s CT and PT are jointed mistakenly with the output of phase-B’s PT and CT. From the curves of Figure 1e–g, it can be found that the voltages and currents and power factor are almost normal respectively. However, there is a large gap between measured total active power and estimated total apparent power in Figure 1h.
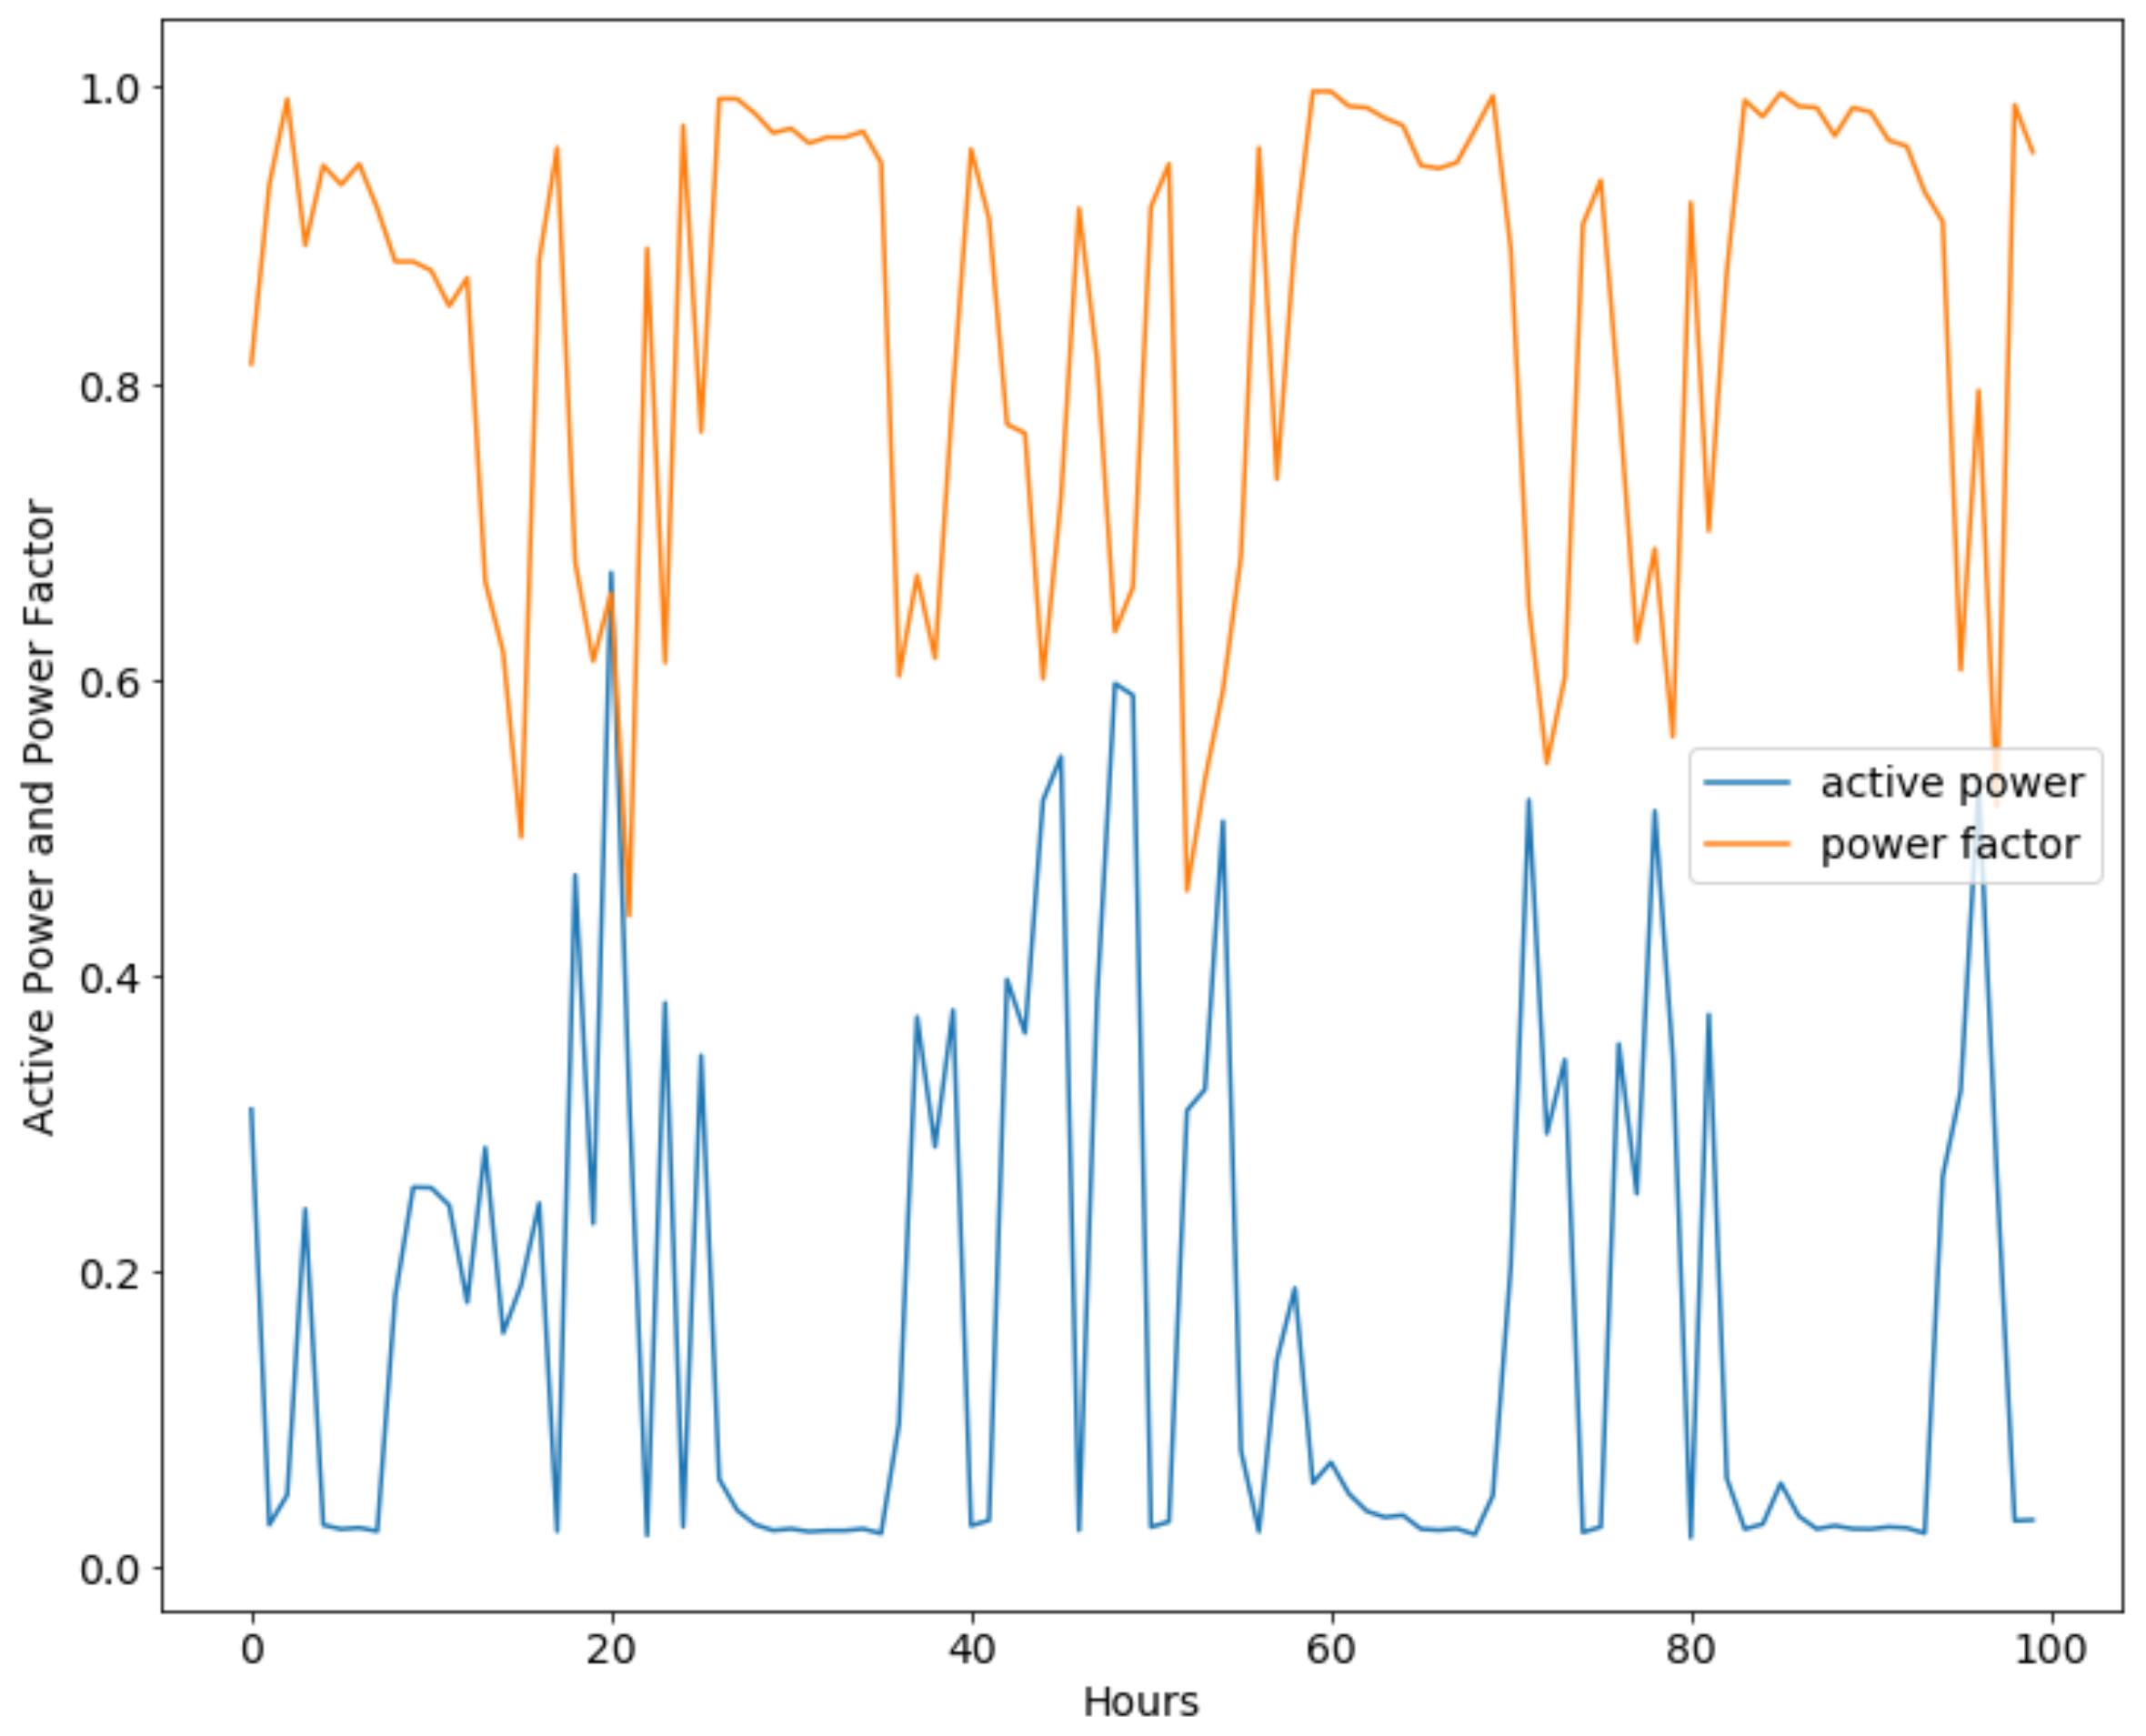
- Phase Inversion: The phase of voltage or current is inverse directly. The phase difference between voltage and current is changed from to . The smart meter will measure a negative active power of such wire and smaller total active power. Figure 2 shows a more complicated situation, all phases are inversion. This time, there is no abnormality in SM data, too. However, when we analyze active power and power factor jointly, it can be found that they are negative related rather than positive related.
3.4. Sample Model with Knowledge Embedding
3.5. Data Preprocess
4. Semi-Supervised AutoEncoder
4.1. Framework of SSAE
4.2. Losses and Training
- Reconstruction Phase: The autoencoder updates the encoder and the decoder to minimize the reconstruction error:where is the reconstruction of X, and is Euclidean distance.
- Regularization Phase: Firstly, SSAE updates discriminator to apart the real samples from the encoded samples. In addition, then, SSAE updates encoder to confuse the discriminator. This phase can be represented by:
- Classification Phase: SSAE updates classifier and encoder Simultaneously by minimizing CrossEntropy and the distance of latent vectors within same class.where is related to supervised feature clustering. It is defined as:where m is the margin between different classes. Due to the difference in the various customers’ SM data, is designed to ascend distance of latent features between diferent catergaries with a minimum distance m. It also can be regarded as regularizer to classifier. Refer to [28], the weight ramp-up function is defined as:where, T increases linearly with the number of iterations from zero to one, in the first 40% (refer to [28]) of the total iterations.
| Algorithm 1 Mini-batch training of SSAE |
| Require:x = training inputs |
| Require:y = labels for labeled inputs in L |
| Require: = random number from |
| Require: = encoder with trainable parameters |
| Require: = decoder with trainable parameters |
| Require: = discriminator with trainable parameters |
| Require: = classifier with trainable parameters |
| Require: = stochastic input augmentation function |
| Require: = weight of consistency loss |
| 1: for t = 1 to do |
| 2: Draw a minibatch from unlabeled samples randomly |
| 3: |
| 4: |
| 5: |
| 6: update using Adam |
| 7: |
| 8: update using Adam |
| 9: Draw a balanced minibatch from labeled samples randomly |
| 10: |
| 11: Construct S, pairs of (, ) with their labels, from |
| 12: |
| 13: update using Adam |
| 14: end for |
5. Experiments and Discussion
5.1. Experiment Setting
5.1.1. Dataset
5.1.2. Baseline
- SVM: The kernel is set as Radial Basis Function(RBF), penalty parameter is 0.01. Due to normal and abnormal are imbalance, we give them proper weight(normal:1, abnormal:2).
- KNN: As same as [3], the best results were produced by KNN with 16 neighbors and euclidean distance.
- XGBoost: The number of trees are 1200, the max depth of each tree is 7, minimum child weight equals 1 and the learning rate is configured as 0.01.
- MLP-3(MultiLayer Perceptron): Three fully connected layers, with 1000, 500 and 250 perceptrons and an additional classifier with 2 perceptrons. Between the 2nd layer and the 3rd, there is a dropout layer with a probability of 0.5. The first three layers all equipped l2 regulars and activated by ReLU. The learning rate is configured as 0.001.
5.1.3. Metrics
5.2. Results
5.2.1. Effect of Knowledge Embedded Sample Model
5.2.2. Study of SSAE
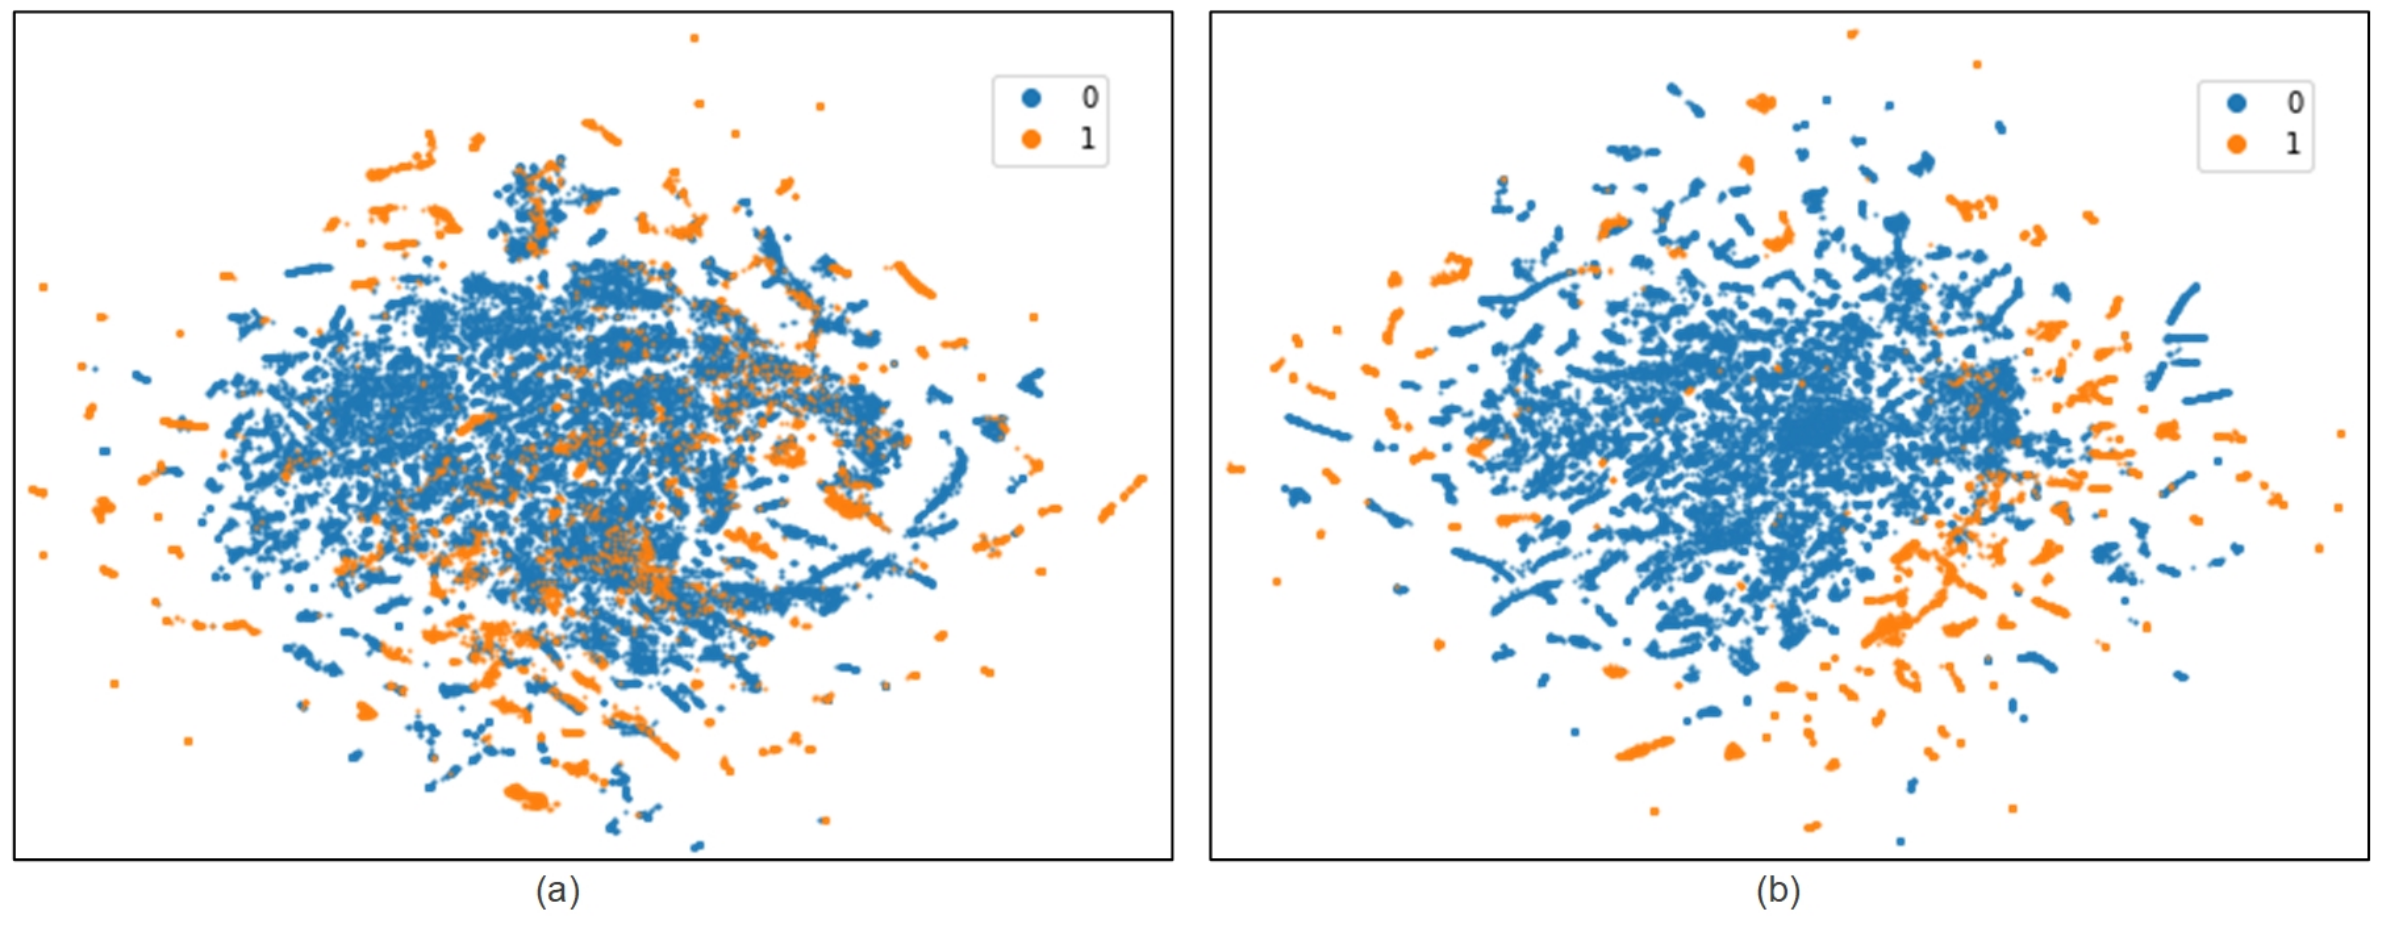
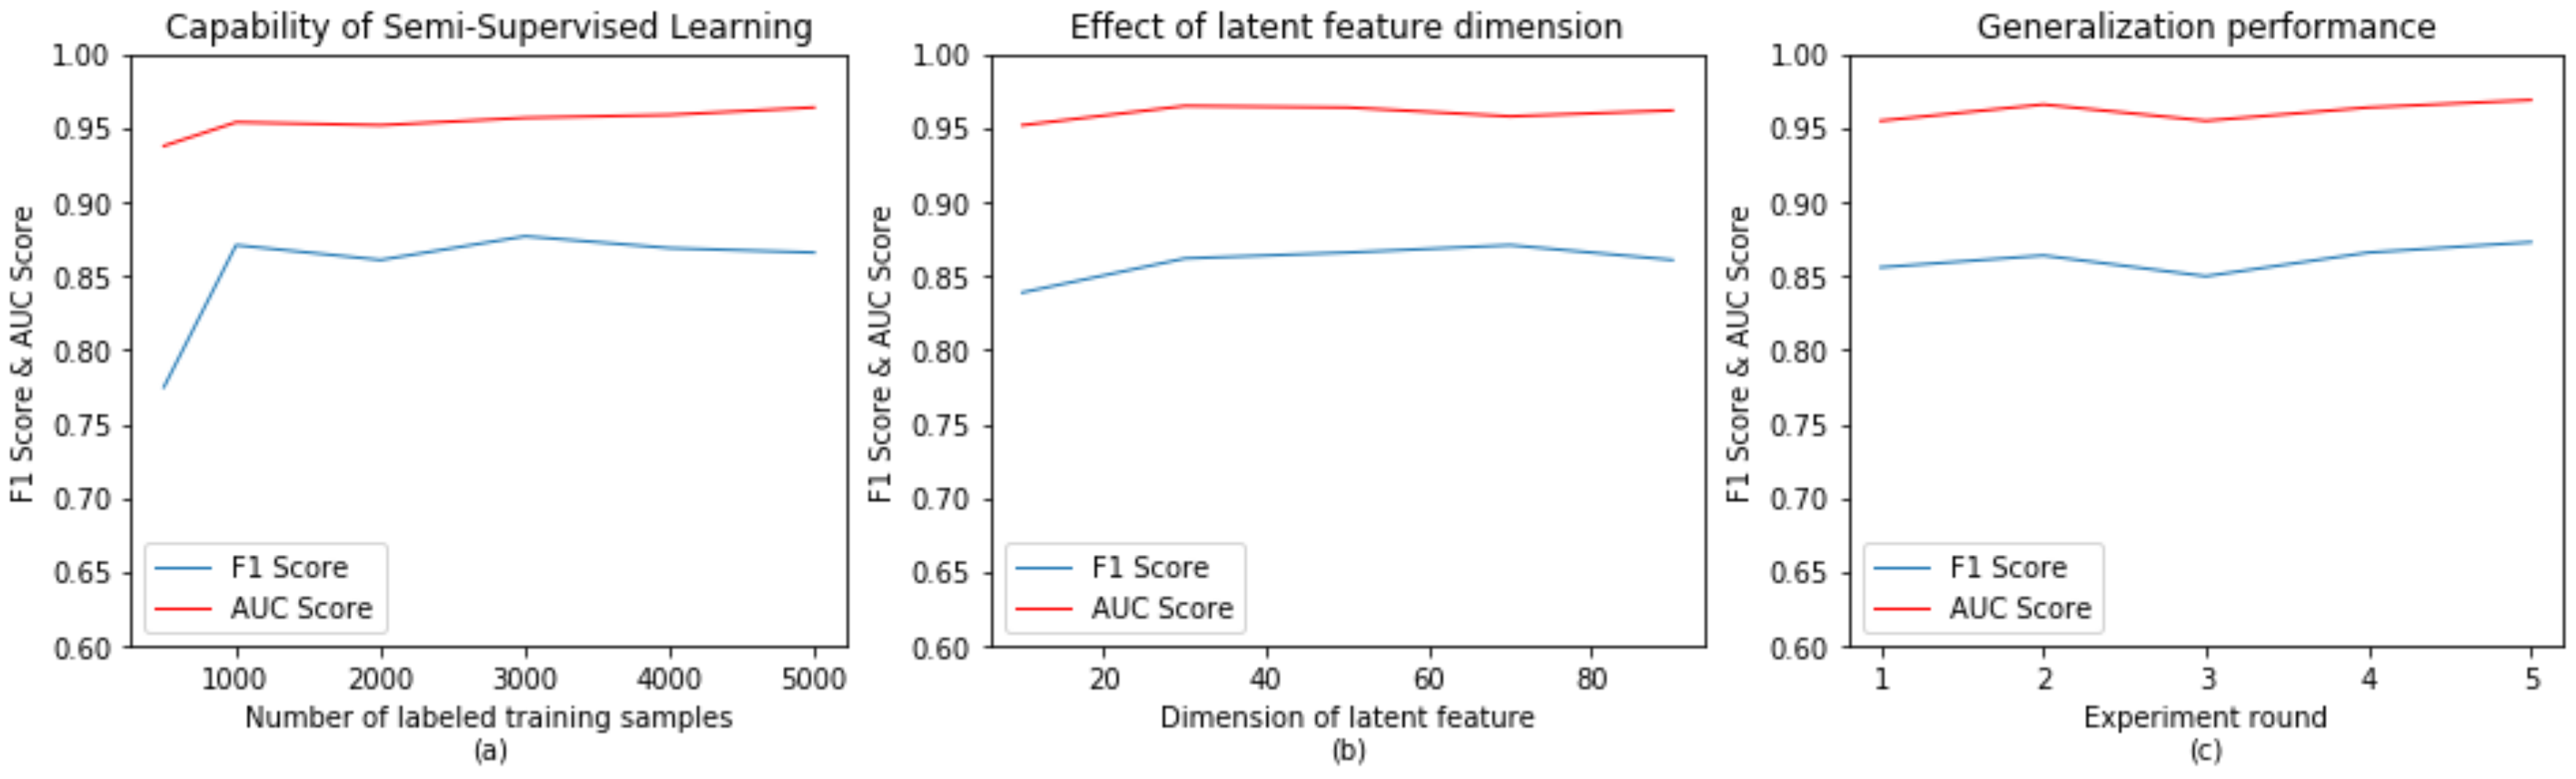
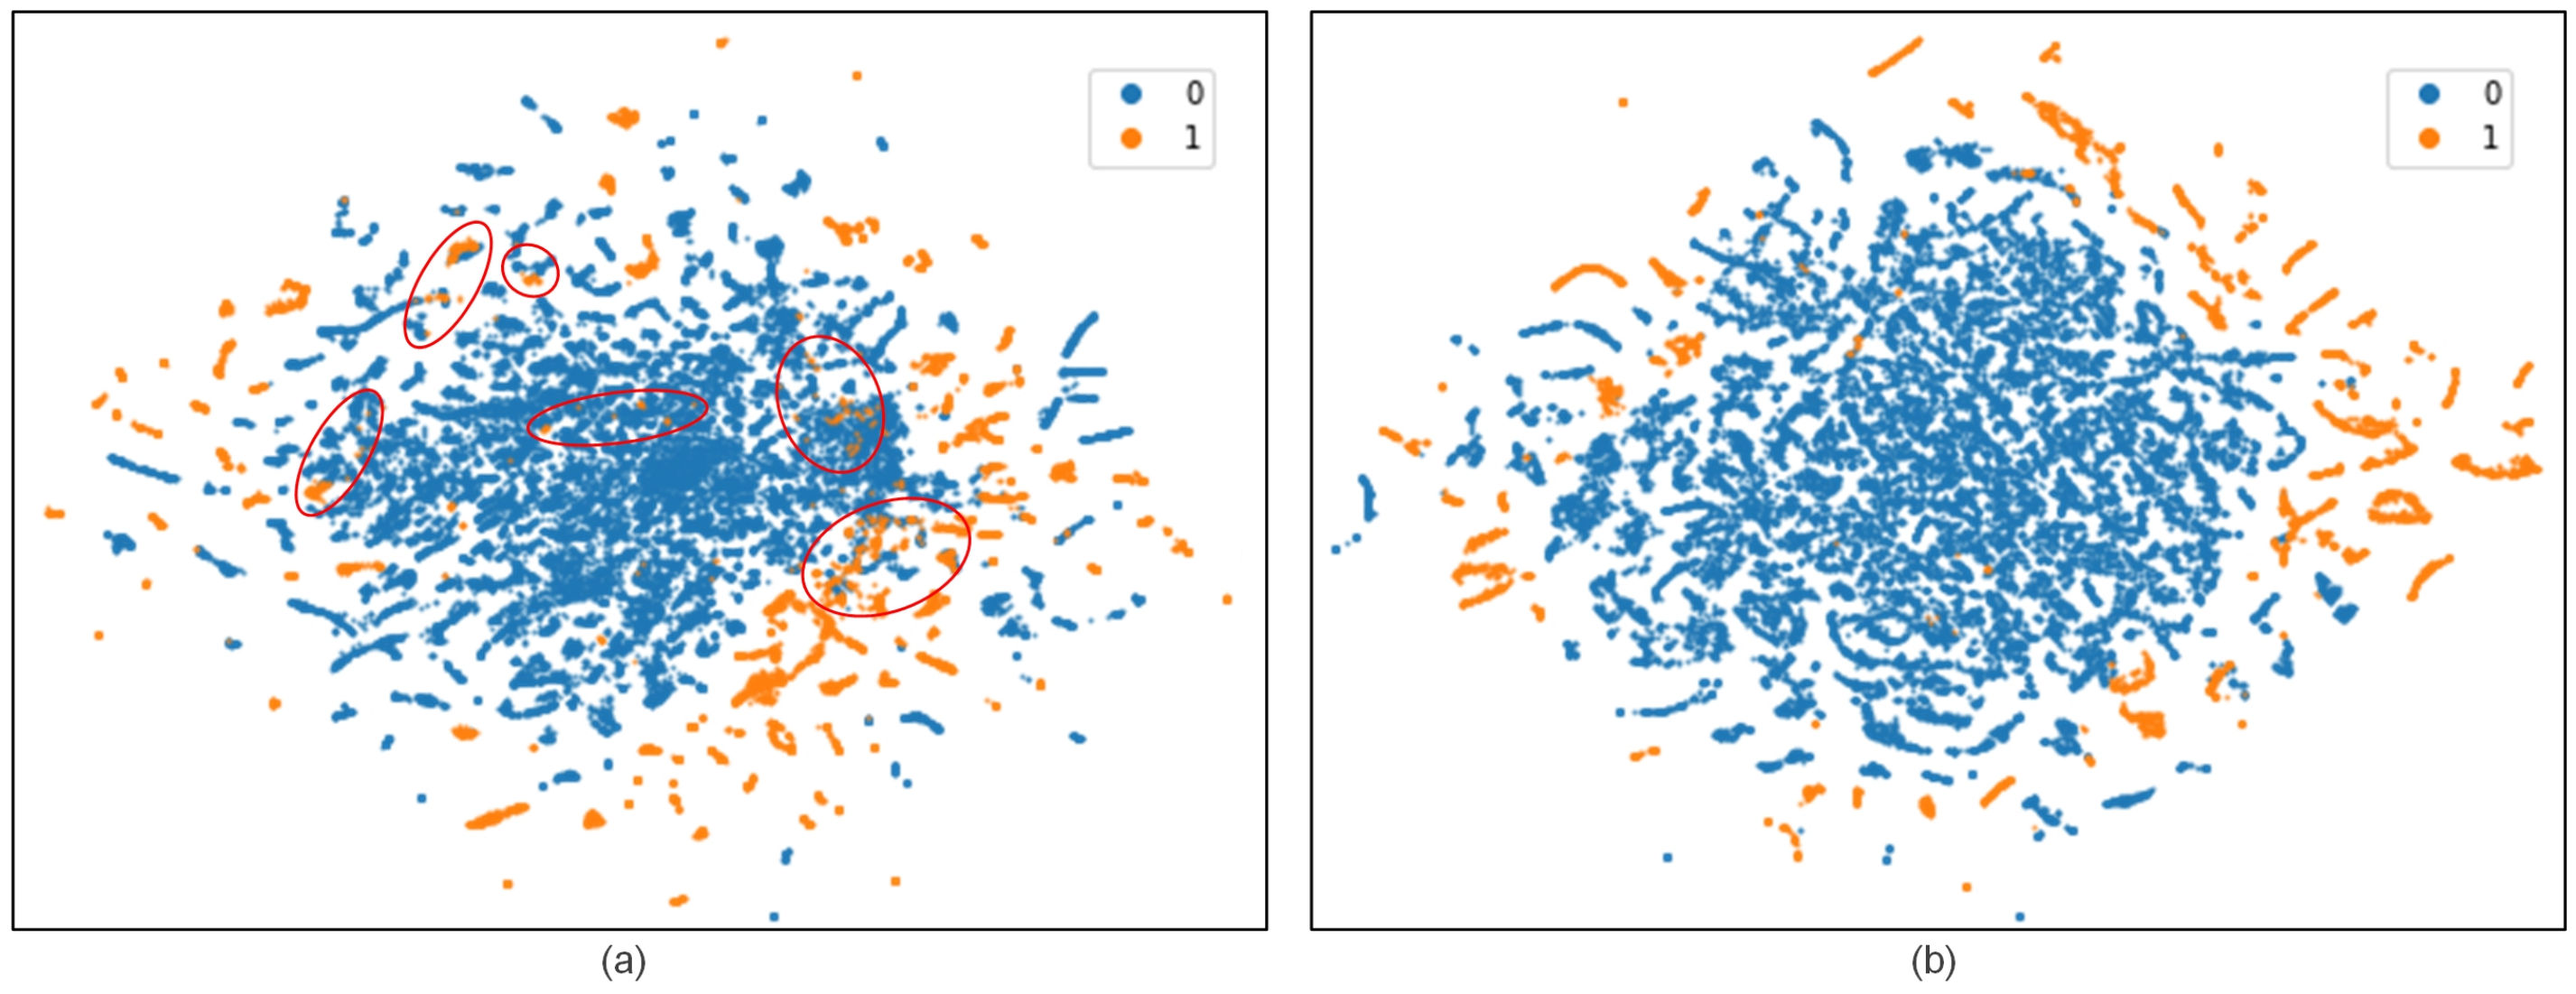
- Capability of semi-supervised learning: As mentioned earlier, semi-supervised learning requires only a small number of labeled sample to complete the training of deep neural network and achieve ideal performance. Figure 7a provides the NTL detection effect of SSAE obtained with varying numbers of labeled samples. The results show that the SSAE can still obtain the F1 score of 0.775 and the AUC score of 0.938 with only 500 labeled samples. SSAE achieves the best results when the labeled sample reached 5000. Figure 8 further shows the feature learning ability of SSAE. By comparing two images, the overlapping regions of the features learned by SSAE in different categories become very small. It improves the linear separability of samples obviously.
- Effect of latent feature dimension: The dimension of latent feature is a very important hyperparameter for SSAE. Figure 7b studied the effect of the dimension in the performance of SSAE. It can be seen from the results in Figure 7b, too small dimension will excessively cut down valid features, resulting in a decrease in the NTL detection performance. With the increase of the latent feature dimension, especially after more than 50, the effect will not continue to increase, but will decrease a little. The main reason is the latent features in larger dimension contains partial redundant information, which reduces its linear separability. By contrast, the best latent feature dimension is 50.
- Generalization performance: In order to verify the generalization performance of SSAE, this paper launched the experiment with same parameters five times by randomly splitting the training set, validation set and testing set. The result of Figure 7c shows that the F1 score and the AUC score are between the ranges of [0.86, 0.883] and [0.965, 0.979], respectively. It is proved that SSAE has achieved remarkable generalization performance. In order to reflect the fairness of the comparison, the median results of SSAE were selected in subsequent subsections for comparison.
- Convergence analysis: For semi-supervised learning, the number of epochs is a very important parameter to avoid underfitting and overfitting. In this paper, the epoch is defined by training all labeled samples rather than unlabeled samples. Too small or too large an epoch value will lead to underfitting or overfitting, respectively. Figure 9 provides losses and scores with the epoch from 1 to 100. Between 40 and 60 epochs, losses and scores are relatively flat and stable. Before 40 epochs and after 60 epochs, there are large fluctuations. Especially after 60 epochs, the training loss continued to fall, the validation loss began to rise. At same time, the AUC score and the F1 score both decreased slightly, and SSAE is over-fitting obviously. Moreover, in Figure 9, the AUC score and F1 score reach 0.9738 and 0.8763 at the 50th epoch, respectively. Therefore, the epoch value of all experiments in this paper is fixed at 50.
5.2.3. Comparison and Discussion
6. Conclusions
Author Contributions
Funding
Conflicts of Interest
References
- Antmann, P. Reducing technical and non-technical losses in the power sector. In Background Paper for the WBG Energy Strategy; Technical Report; The World Bank: Washington, DC, USA, 2009. [Google Scholar]
- PR Newswire. World Loses $89.3 Billion to Electricity Theft Annually, $58.7 Billion in Emerging Markets. 2014. Available online: http://www.prnewswire.com/news-releases/world-loses-893-billion-to-electricity-theft-annually-587-billion-in-emerging-markets-300006515.html (accessed on 25 May 2019).
- Buzau, M.-M.; Tejedor-Aguilera, J.; Cruz-Romero, P.; Gomez-Exposito, A. Detection of Non-Technical Losses Using Smart Meter Data and Supervised Learning. IEEE Trans. Smart Grid 2019, 10, 2661–2670. [Google Scholar] [CrossRef]
- CEC. Monthly Statistics of China Power Industry. 2018. Available online: http://english.cec.org.cn/No.110.1737.htm (accessed on 25 May 2019).
- Messinis, G.M.; Hatziargyriou, N.D. Review of non-technical loss detection methods. Electr. Power Syst. Res. 2018, 158, 250–266. [Google Scholar] [CrossRef]
- Ahmad, T.; Chen, H.; Wang, J.; Guo, Y. Review of various modeling techniques for the detection of electricity theft in smart grid environment. Renew. Sustain. Energy Rev. 2018, 82, 2916–2933. [Google Scholar] [CrossRef]
- Wu, S.; Ji, C.; Sun, G.Q. A Clustering Algorithm Based on CUDA Technology for Massive Electric Power Load Curves. Electr. Power Eng. Teachnol. 2018, 37, 5–70. (In Chinese) [Google Scholar]
- Yang, X.; Zhang, X.; Lin, J.; Yu, W.; Zhao, P. A Gaussian-mixture model based detection scheme against data integrity attacks in the smart grid. In Proceedings of the 2016 25th International Conference on Computer Communication and Networks (ICCCN), Waikoloa, HI, USA, 1–4 August 2016; pp. 1–9. [Google Scholar]
- Glauner, P.; Meira, J.A.; Dolberg, L.; State, R.; Bettinger, F.; Rangoni, Y. Neighborhood features help detecting non-technical losses in big data sets. In Proceedings of the 2016 IEEE/ACM 3rd International Conference on Big Data Computing Applications and Technologies (BDCAT), Shanghai, China, 6–9 December 2016; pp. 253–261. [Google Scholar]
- Zanetti, M.; Jamhour, E.; Pellenz, M.; Penna, M.; Zambenedetti, V.; Chueiri, I. A Tunable Fraud Detection System for Advanced Metering Infrastructure Using Short-Lived Patterns. IEEE Trans. Smart Grid 2019, 10, 830–840. [Google Scholar] [CrossRef]
- Messinis, G.M.; Rigas, A.E.; Hatziargyriou, N.D. A Hybrid Method for Non-Technical Loss Detection in Smart Distribution Grids. IEEE Trans. Smart Grid 2019. [Google Scholar] [CrossRef]
- Zheng, Z.; Yang, Y.; Niu, X.; Dai, H.-N.; Zhou, Y. Wide and deep convolutional neural networks for electricity-theft detection to secure smart grids. IEEE Trans. Ind. Inform. 2018, 14, 1606–1615. [Google Scholar] [CrossRef]
- Jindal, A.; Dua, A.; Kaur, K.; Singh, M.; Kumar, N.; Mishra, S. Decision tree and SVM-based data analytics for theft detection in smart grid. IEEE Trans. Ind. Inform. 2016, 12, 1005–1016. [Google Scholar] [CrossRef]
- Coma-Puig, B.; Carmona, J.; Gavalda, R.; Alcoverro, S.; Martin, V. Fraud detection in energy consumption: A supervised approach. In Proceedings of the 2016 IEEE International Conference on Data Science and Advanced Analytics (DSAA), Montreal, QC, Canada, 17–19 October 2016; pp. 120–129. [Google Scholar]
- Nagi, J.; Yap, K.S.; Tiong, S.K.; Ahmed, S.K.; Mohamad, M. Nontechnical loss detection for metered customers in power utility using support vector machines. IEEE Trans. Power Deliv. 2009, 25, 1162–1171. [Google Scholar] [CrossRef]
- Jokar, P.; Arianpoo, N.; Leung, V.C. Electricity theft detection in AMI using customers’ consumption patterns. IEEE Trans. Smart Grid 2015, 7, 216–226. [Google Scholar] [CrossRef]
- Ramos, C.C.O.; de Souza, A.N.; Falcao, A.X.; Papa, J.P. New insights on nontechnical losses characterization through evolutionary-based feature selection. IEEE Trans. Power Deliv. 2011, 27, 140–146. [Google Scholar] [CrossRef]
- Monedero, I.; Biscarri, F.; León, C.; Guerrero, J.I.; Biscarri, J.; Millán, R. Detection of frauds and other non-technical losses in a power utility using Pearson coefficient, Bayesian networks and decision trees. Int. J. Electr. Power Energy Syst. 2012, 34, 90–98. [Google Scholar] [CrossRef]
- Krishna, V.B.; Weaver, G.A.; Sanders, W.H. PCA-based method for detecting integrity attacks on advanced metering infrastructure. In Proceedings of the 2015 12th International Conference on Quantitative Evaluation of Systems, Madrid, Spain, 1–3 September 2015; pp. 70–85. [Google Scholar]
- Júnior, L.A.P.; Ramos, C.C.O.; Rodrigues, D.; Pereira, D.R.; de Souza, A.N.; da Costa, K.A.P.; Papa, J.P. Unsupervised non-technical losses identification through optimum-path forest. Electr. Power Syst. Res. 2016, 140, 413–423. [Google Scholar] [CrossRef]
- Guerrero, J.I.; León, C.; Monedero, I.; Biscarri, F.; Biscarri, J. Improving knowledge-based systems with statistical techniques, text mining, and neural networks for non-technical loss detection. Knowl. Based Syst. 2014, 71, 376–388. [Google Scholar] [CrossRef]
- Wei, L.; Keogh, E. Semi-supervised time series classification. In Proceedings of the 12th ACM SIGKDD International Conference on Knowledge Discovery and Data Mining, Philadelphia, PA, USA, 20–23 August 2006; p. 748. [Google Scholar]
- Tacón, J.; Melgarejo, D.; Rodríguez, F.; Lecumberry, F.; Fernández, A. Semisupervised Approach to Non Technical Losses Detection. Phys. Lett. B 2014, 378, 698–705. [Google Scholar]
- Russakovsky, O.; Deng, J.; Su, H.; Krause, J.; Satheesh, S.; Ma, S.; Huang, Z.; Karpathy, A.; Khosla, A.; Bernstein, M.; et al. ImageNet Large Scale Visual Recognition Challenge. Int. J. Comput. Vis. (IJCV) 2015, 115, 211–252. [Google Scholar] [CrossRef]
- Deng, L.; Hinton, G.; Kingsbury, B. New types of deep neural network learning for speech recognition and related applications: An overview. In Proceedings of the 2013 IEEE International Conference on Acoustics, Speech and Signal Processing, Vancouver, BC, Canada, 26–31 May 2013; pp. 8599–8603. [Google Scholar]
- Wu, Y.; Schuster, M.; Chen, Z.; Le, Q.V.; Norouzi, M.; Macherey, W.; Krikun, M.; Cao, Y.; Gao, Q.; Macherey, K.; et al. Googles Neural Machine Translation System: Bridging the Gap between Human and Machine Translation. arXiv 2016, arXiv:1609.08144. [Google Scholar]
- Makhzani, A.; Shlens, J.; Jaitly, N.; Goodfellow, I.; Frey, B. Adversarial autoencoders. arXiv 2015, arXiv:1511.05644. [Google Scholar]
- Laine, S.; Aila, T. Temporal Ensembling for Semi-Supervised Learning. arXiv 2017, arXiv:1610.02242. [Google Scholar]
- Luo, Y.; Zhu, J.; Li, M.; Ren, Y.; Zhang, B. Smooth Neighbors on Teacher Graphs for Semi-Supervised Learning. In Proceedings of the IEEE/CVF Conference on Computer Vision and Pattern Recognition, Salt Lake City, UT, USA, 18–22 June 2018; pp. 8896–8905. [Google Scholar]
- Wang, R.C. Influence of Distribution Network Three-phase Unbalanceon Line Loss Increase Rate and Voltage Offset. Electr. Power Eng. Teachnol. 2017, 36, 131–136. (In Chinese) [Google Scholar]
- Maaten, L.V.D.; Hinton, G. Visualizing data using t-SNE. J. Mach. Learn. Res. 2008, 9, 2579–2605. [Google Scholar]
- Kingma, D.; Ba, J. Adam: A Method for Stochastic Optimization. arXiv 2014, arXiv:1412.6980. [Google Scholar]
- He, K.M.; Zhang, X.; Ren, S.; Sun, J. Deep residual learning for image recognition. In Proceedings of the IEEE Conference on Computer Vision and Pattern Recognition, Las Vegas, NV, USA, 26 June–1 July 2016; pp. 770–778. [Google Scholar]
- Pedregosa, F.; Varoquaux, G.; Gramfort, A.; Michel, V.; Thirion, B.; Grisel, O.; Blondel, M.; Prettenhofer, P.; Weiss, R.; Dubourg, V.; et al. Scikit-learn: Machine learning in Python. J. Mach. Learn. Res. 2011, 12, 2825–2830. [Google Scholar]
- Zheng, K.; Chen, Q.; Wang, Y.; Kang, C.; Xia, Q. A Novel Combined Data-Driven Approach for Electricity Theft Detection. IEEE Trans. Ind. Inf. 2018, 15, 1809–1819. [Google Scholar] [CrossRef]
- Coma-Puig, B.; Carmona, J. Bridging the Gap between Energy Consumption and Distribution through Non-Technical Loss Detection. Energies 2019, 12, 1748. [Google Scholar] [CrossRef]


| Magnitude | Description |
|---|---|
| , , | average voltage of each wire |
| , , | average current of each wire |
| total active power | |
| total reactive power | |
| total power factor | |
| ts | time-stamp |
| Type of NTL | Number of Customers | Number of Samples |
|---|---|---|
| Shunts of voltage | 14 | 1321 |
| Shunts of current | 32 | 3609 |
| Phase Shift | 16 | 1798 |
| Phase Disorder | 25 | 2681 |
| Phase Inversion | 58 | 6374 |
| Normal customer | 316 | 35,506 |
| unlabeled | 4539 | 500,000 |
| Methods | Precision | Recall | F1 Score | AUC Score | General Accuracy |
|---|---|---|---|---|---|
| XGBoost + raw SM data | 0.911 | 0.538 | 0.676 | 0.917 | 0.905 |
| XGBoost + knowledge embedded sample | 0.846 | 0.700 | 0.766 | 0.951 | 0.921 |
| ResNet-20 + raw SM data | 0.913 | 0.578 | 0.708 | 0.916 | 0.909 |
| ResNet-20 + knowledge embedded sample | 0.891 | 0.732 | 0.804 | 0.951 | 0.943 |
| SSAE + raw SM data | 0.882 | 0.565 | 0.689 | 0.907 | 0.898 |
| SSAE + knowledge embedded sample | 0.944 | 0.804 | 0.866 | 0.964 | 0.951 |
| Methods | Precision | Recall | F1 Score | AUC Score | General Accuracy |
|---|---|---|---|---|---|
| SVM | 0.726 | 0.676 | 0.700 | 0.908 | 0.903 |
| KNN | 0.828 | 0.627 | 0.714 | 0.866 | 0.907 |
| XGBoost | 0.846 | 0.700 | 0.766 | 0.951 | 0.921 |
| MLP-3 | 0.844 | 0.734 | 0.785 | 0.946 | 0.926 |
| ResNet-20 | 0.891 | 0.732 | 0.804 | 0.951 | 0.934 |
| SSAE | 0.944 | 0.804 | 0.866 | 0.964 | 0.951 |
© 2019 by the authors. Licensee MDPI, Basel, Switzerland. This article is an open access article distributed under the terms and conditions of the Creative Commons Attribution (CC BY) license (http://creativecommons.org/licenses/by/4.0/).
Share and Cite
Lu, X.; Zhou, Y.; Wang, Z.; Yi, Y.; Feng, L.; Wang, F. Knowledge Embedded Semi-Supervised Deep Learning for Detecting Non-Technical Losses in the Smart Grid. Energies 2019, 12, 3452. https://doi.org/10.3390/en12183452
Lu X, Zhou Y, Wang Z, Yi Y, Feng L, Wang F. Knowledge Embedded Semi-Supervised Deep Learning for Detecting Non-Technical Losses in the Smart Grid. Energies. 2019; 12(18):3452. https://doi.org/10.3390/en12183452
Chicago/Turabian StyleLu, Xiaoquan, Yu Zhou, Zhongdong Wang, Yongxian Yi, Longji Feng, and Fei Wang. 2019. "Knowledge Embedded Semi-Supervised Deep Learning for Detecting Non-Technical Losses in the Smart Grid" Energies 12, no. 18: 3452. https://doi.org/10.3390/en12183452
APA StyleLu, X., Zhou, Y., Wang, Z., Yi, Y., Feng, L., & Wang, F. (2019). Knowledge Embedded Semi-Supervised Deep Learning for Detecting Non-Technical Losses in the Smart Grid. Energies, 12(18), 3452. https://doi.org/10.3390/en12183452