1. Introduction
System integrity protection schemes (SIPS) are schemes that can, under potentially hazardous conditions, prevent a complete blackout of endangered parts of an electrical power system (EPS). Paper [
1] highlights the need for providing research on impacts of renewables on EPSs and the corresponding protection and control strategies in order to mitigate the various negative effects. These requirements are trying to be reached with the development of smart transmission grid (STGs). An STG implies performance of automated processes based on measurement, control, protection, and telecommunication systems supported by smart technologies in order to maintain a secure power network state. According to [
2] one of the solutions for large-scale renewable integrations is to increase the flexibility of the EPS by using SIPS. Advanced control and SIPS are specific areas where significant improvements can be achieved using PMU technology according to [
3]. The mentioned technology was developed back in the 1980s [
4,
5] and has been implemented in different aspect of EPS operation, including an extension of the local relay protection functions and some advanced system protection functions (e.g., out of step [
6], all frequencies protection [
7], and reduction of the excessive standing phase angle difference during the system restoration process [
8]).
Development of smart technologies has placed increasing demand on the speed of data exchange and processing [
9]. The biggest advantage of PMU technology is the capability to transfer large amounts of data that are synchronized with GPS timestamps from different parts of the EPS in real time. The undertaken research within the presented paper refers to several related problems identified in the literature:
Solutions to the specified research problems are being looked at with the application of PMU technology in the form of developing SIPS [
13]. The main contribution of this work is merging SIPS with the additional capabilities that PMU measurements can bring. PMU placement is a well-researched and developed area, as it appeared in the initial use of PMU technology [
14,
15]. Paper [
16] introduces complete and incomplete system observability placement techniques. Incomplete observability is described with the concept of unobservability depth that directly affects the total number of required PMUs. Paper [
17] introduces a critical location method together with the observability method. The critical locations method consists of determining the buses with a large number of elements or with limited voltage values that may affect the security of the system. These papers conclude that PMU technology application in SIPS requires PMU placement that allows complete system observability.
Large modern EPSs have become vulnerable to overload problems due to their interconnectedness. The impact of line disconnections in one part of the network must sometimes be observed in several neighbouring power systems. Accurate, but perhaps unnecessary, operation of local overload protection in one part of the network can lead to significant consequences for the entire interconnection. Overload protection is typically adjusted conservatively to preserve the asset it protects. Such conservative parameters have their reasons, but they usually do not take into account the importance of overload in relation to the security of the whole system. Without use of SIPS that will protect a larger part of the EPS, and thus improve the coordination of local overload protections, it is not possible to eliminate potential large blackouts.
This paper presents the results and experience from the development process of a SIPS method for a real operation problem utilizing the availability of full PMU coverage of the observed transmission system. The research hypothesis is defined as follows: development and use of SIPS, supported by PMU technology, can maintain the integrity of a larger part of an electric power system, improve coordination of local relay protection systems, and mitigate potential congestions in the power network.
Optimal bus-splitting schemes together with overload and congestion mitigation schemes are studied within this paper. This paper describes contributions in the field of congestion management and enhancement of security with the usage of SIPS supported by PMU measurements. It is structured as follows:
Section 1 provides the introduction, followed by
Section 2, which describes SIPS in general.
Section 3 describes the developed method, while in
Section 4, a mathematical description of an optimal bus-splitting problem is given. Next is
Section 5 where an IEEE 14 bus case study is described, and the conclusions are finally drawn in
Section 6.
2. System Integrity Protection Scheme (SIPS)
In 1996 a report on special protection schemes was published [
18]. This report included more than 100 protection schemes used around the world. In 2010 a report on SIPS was published [
19]. According to the report, SIPS deals with congestion, thermal overload, and voltage, frequency, and angular instability problems. These stated problems can be mitigated using different types of protection schemes.
The use of transmission switching as a corrective action for resolving congestion was first mentioned in 1980 [
20,
21]. An overview of works dealing with transmission-switching analyses from 1980 to 1999 are presented in [
22]. Line and transformer switching, together with bus-splitting actions, are described in the given literature as models for network topology changes. The developed optimal transmission switching protection scheme in this paper uses only bus-splitting mechanisms, whose search for a solution is far more mathematically demanding than the search for individual, disconnected elements, as stated in [
23].
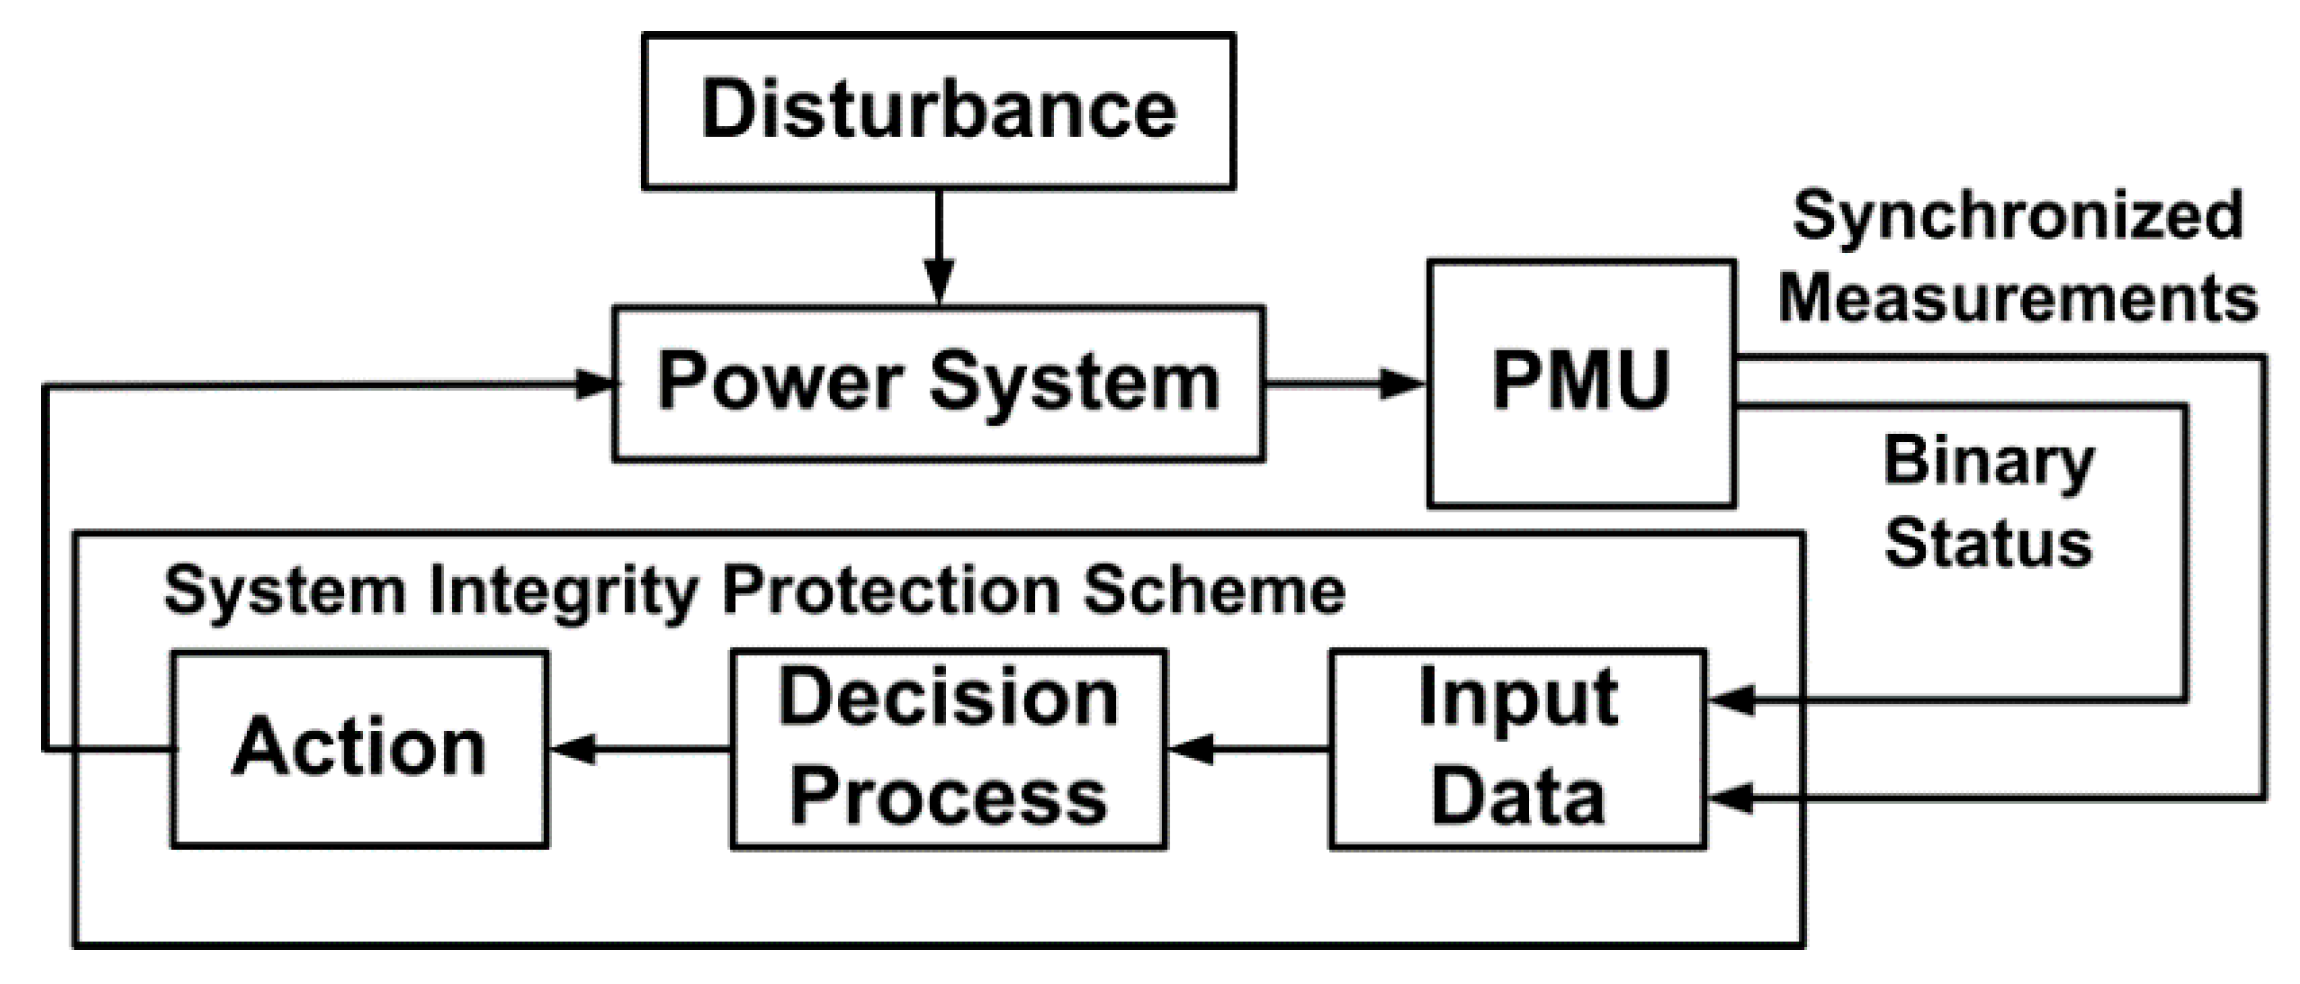
Special protection schemes are defined in [
18] as schemes designed to identify specific events that can cause unusual problems in the operation of the EPS and to undertake advanced, predefined measures that will neutralize the detected events. SIPS, supported by PMU technology and applied to a wide area, are developed in this paper, and a general description is depicted in
Figure 1.
3. System Integrity Protection Scheme Development Method
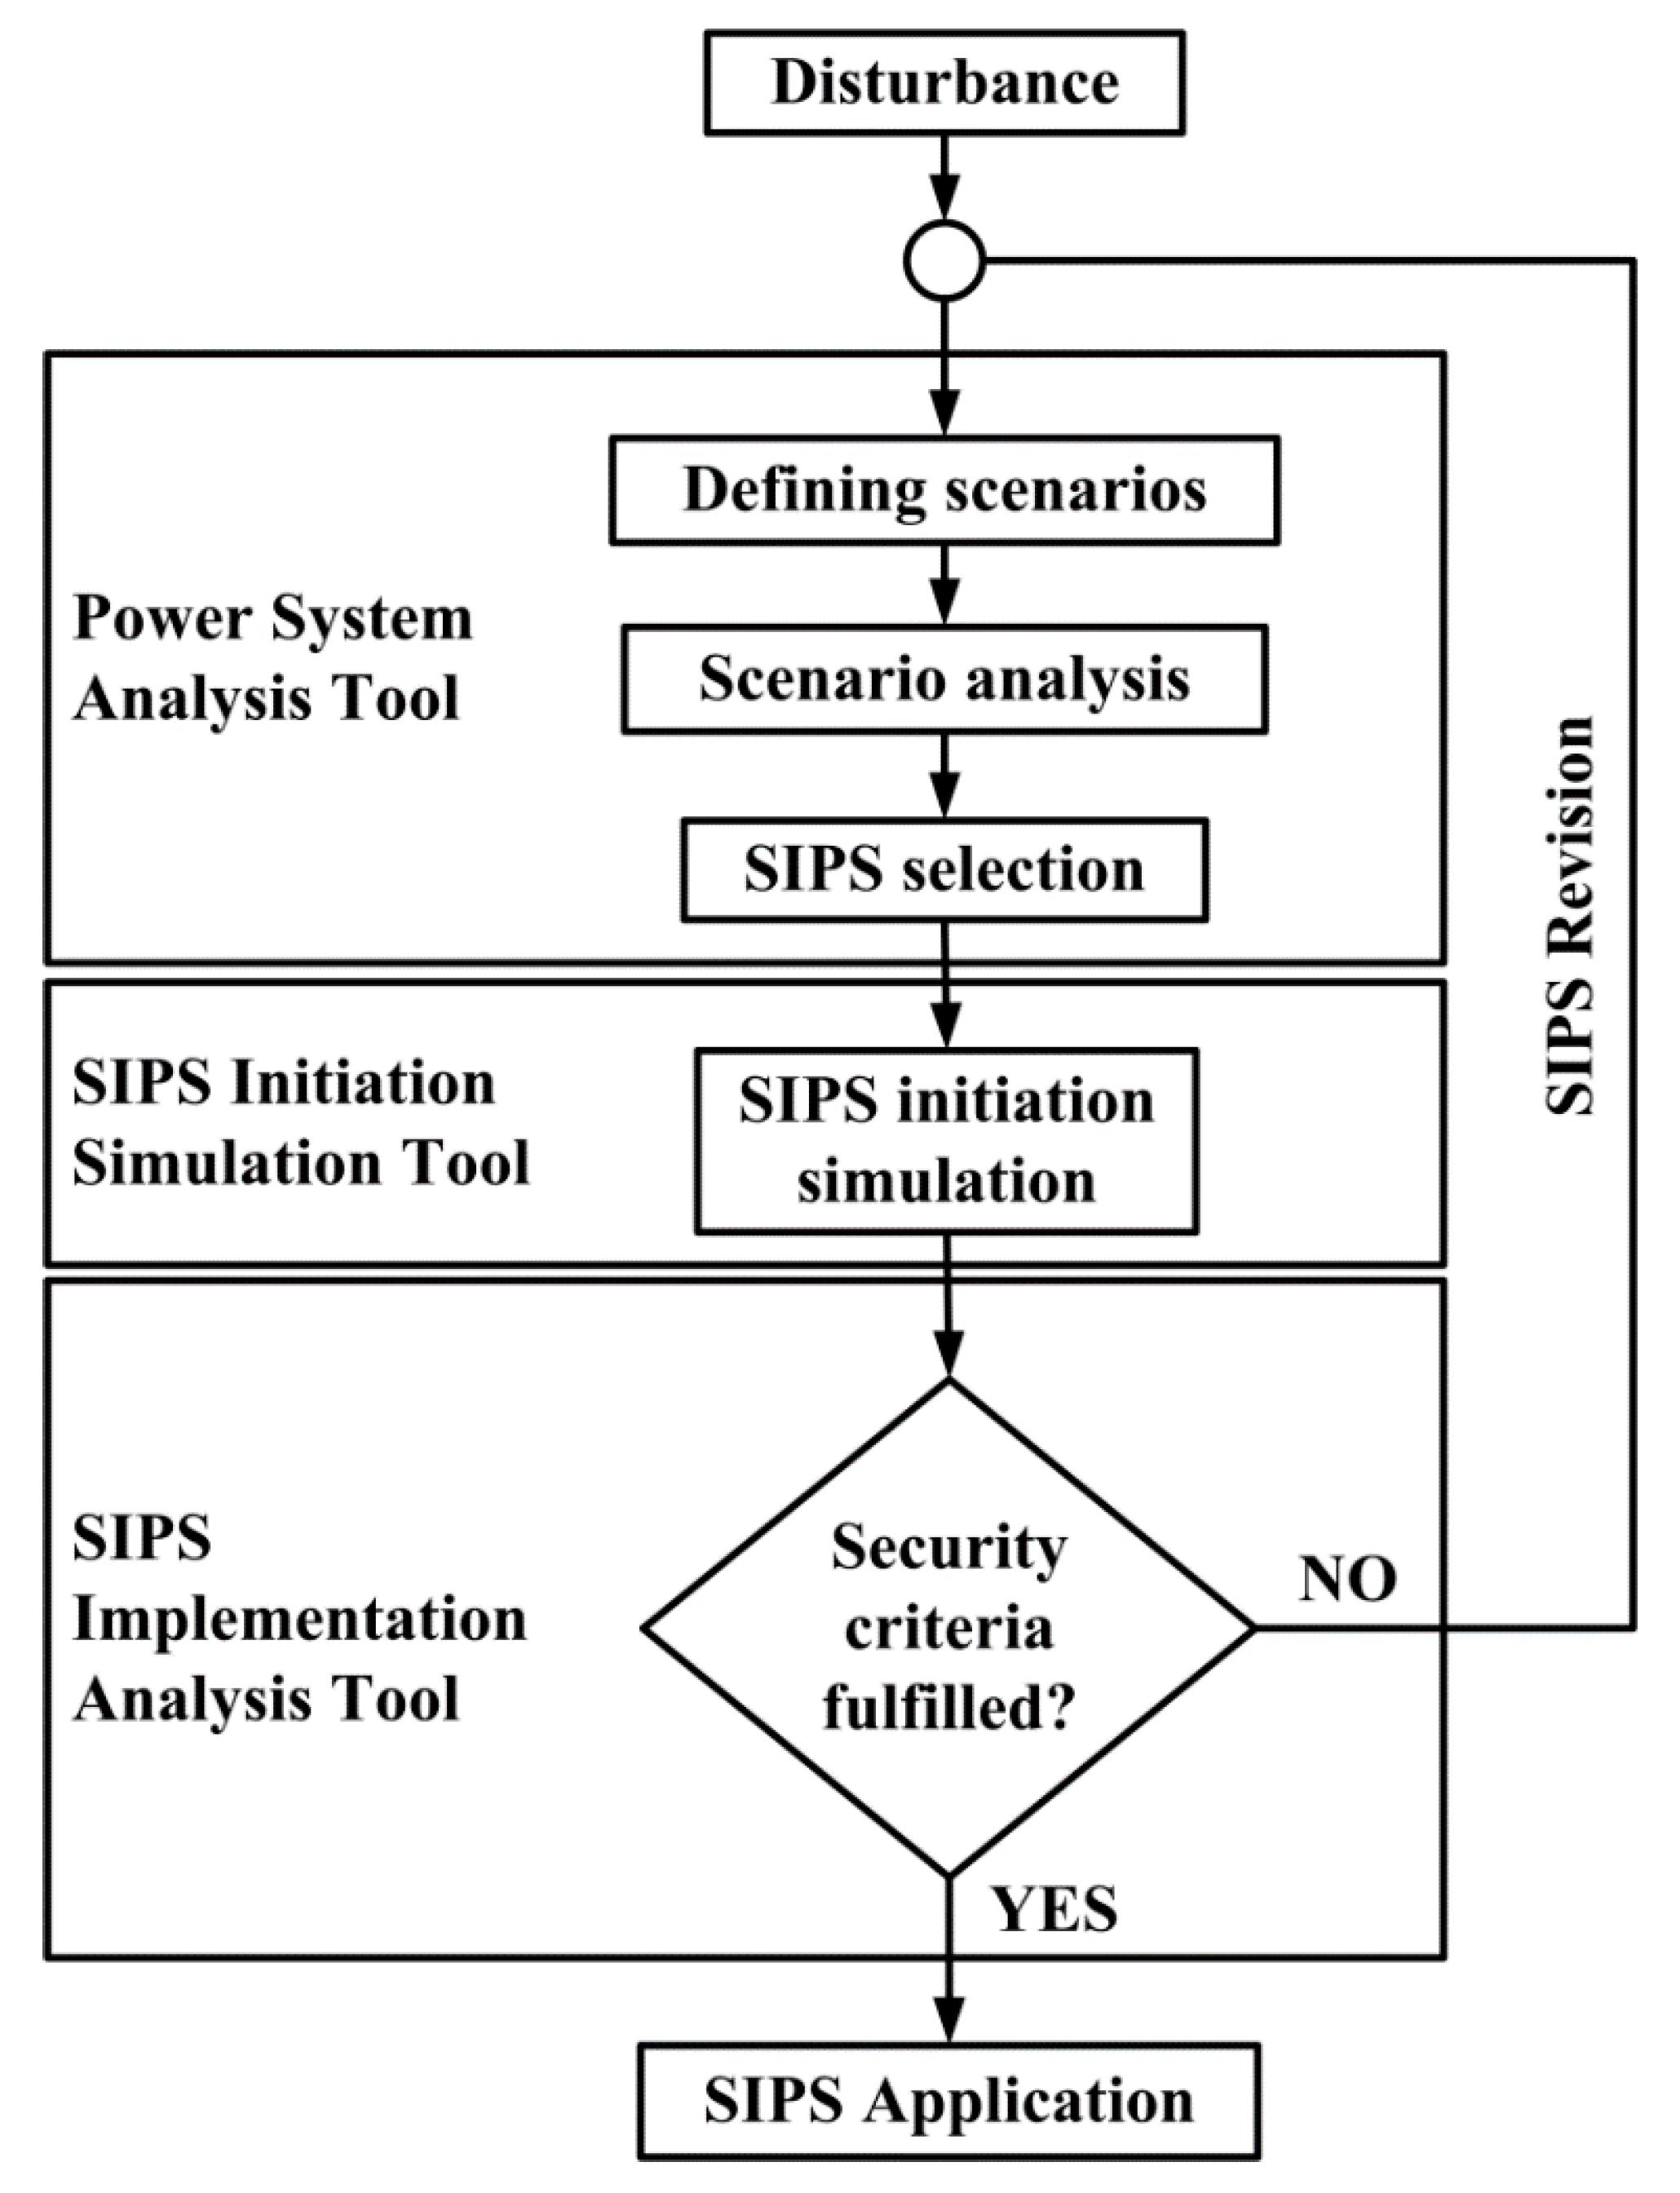
SIPS are designed based on power system analysis by defining requirements that they must meet. They are made based on a power system’s response to the recorded events or congestions, security assessment, heuristic methods, and AC power flow analysis. A flowchart of the proposed SIPS development method is shown in
Figure 2. The flowchart is described in the following
Section 3.1,
Section 3.2,
Section 3.3,
Section 3.4,
Section 3.5 and
Section 3.6.
3.1. Disturbance
Unpredictable disturbances or events in the network indicate the need for a detailed analysis of the power system. For such disturbances or events, it is required to record all input parameters and system responses that can be analysed using the specialized tools for power system analysis. Large disturbances or events in the power network can surely serve as idea originators for the making of SIPS.
3.2. Scenario Definition for Power System Analysis
The first step in SIPS development is to define a number of scenarios that include representative disturbances in the observed part of the system. There are different principles for determining scenarios in the analysis of power networks. Principles can be applied to seasonal (summer/winter), hydrological (good/bad hydrology), or temporal criteria (night/day) depending on many different network factors: the location of the generating units, topology and scheduling of the transmission network, load distribution, and so on. Selection criteria for defining the analysis scenarios depend on experience and expert knowledge of the observed part of the power system.
3.3. Scenario Analysis
The second step in SIPS development relates to a detailed analysis of the power system. Performing an AC power flow analysis is suggested because current applications of the described method are designed to perform offline analyses that are not time critical, unlike some faster analysis that can be used in real-time applications like DC power flow analyses [
24]. It is recommended to analyse the basic conditions of each individual scenario defined in the previous step. These analyses will indicate the initial potential risks of the observed part of the network. It is necessary to analyse in detail each potential initial risk (i.e., high network load or voltage and angular deviations).
After analysing the basic conditions of each scenario and defining the initial potential risks, in terms of high loading or voltage and angular deviations of the observed parts of the network, N-1 analyses can be accessed. Contingency analyses (N-1) can be extended to multiple element outages if necessary in the form of N-k analyses, where k denotes the number of excluded elements.
It is recommended to perform N-1 analyses of each scenario for all elements in proximity to the endangered elements, defined as the initial potential risks. In the analysing process it is necessary to record all the N-1 or N-k analyses that have caused significant load increases of individual network elements.
3.4. SIPS Selection
During selection of any kind of protection scheme it is necessary to have expert knowledge of the existing local relay protection system in order not to unnecessarily disturb its coordination by implementing new protection schemes. Mutual local relay protection and SIPS coordination will lead to successful mitigation and prevention of possible disturbances over a wide area and will maintain the security and integrity of the system.
SIPS proposed in this paper are focused on corrective bus-splitting schemes that maintain the existing level of power system generation and load. SIPS that do not maintain the existing level of power system generation and load, like load shedding and generation reduction schemes, will be studied in future works where there is no possibility of using bus-splitting schemes.
Bus-splitting schemes are characterized by retaining all elements connected to the power network. They use the principle of load redistribution in order to mitigate the load in the endangered parts of the network. In case of their usage there should be no consequences for participants connected to the network.
Mitigating congestion by changing the network topology essentially refers to the separation or integration of the EPS in differently connected network parts. System separation or integration is performed by separating or integrating different bus systems or their sections in parts where their primary and secondary equipment design allows it. It is important to emphasize that any separation or integration of the system will impact the power flow and voltage conditions in the observed part of the network. In case of implementing any considered measure, it is important to carry out detailed system security analyses.
While developing bus-splitting schemes, it is possible that none of the analyses indicates the possibility of mitigating any bus-splitting actions. This can happen for various reasons if the primary system is not built flexibly enough or the secondary systems cannot adequately respond to the requirements of the developed model. In these cases, it is recommended to seek mitigation solutions in other SIPS, even those that do not maintain the existing load and level of power system generation.
While defining SIPS it is necessary to assign each scheme a unique label. This description implies defining substations and highlighting the type of SIPS applied. If the bus-splitting scheme is chosen, it is necessary to exactly define which element needs to be connected to which bus. A template for defining the bus-splitting scheme is given in
Table 1.
3.5. SIPS Initiation Conditions
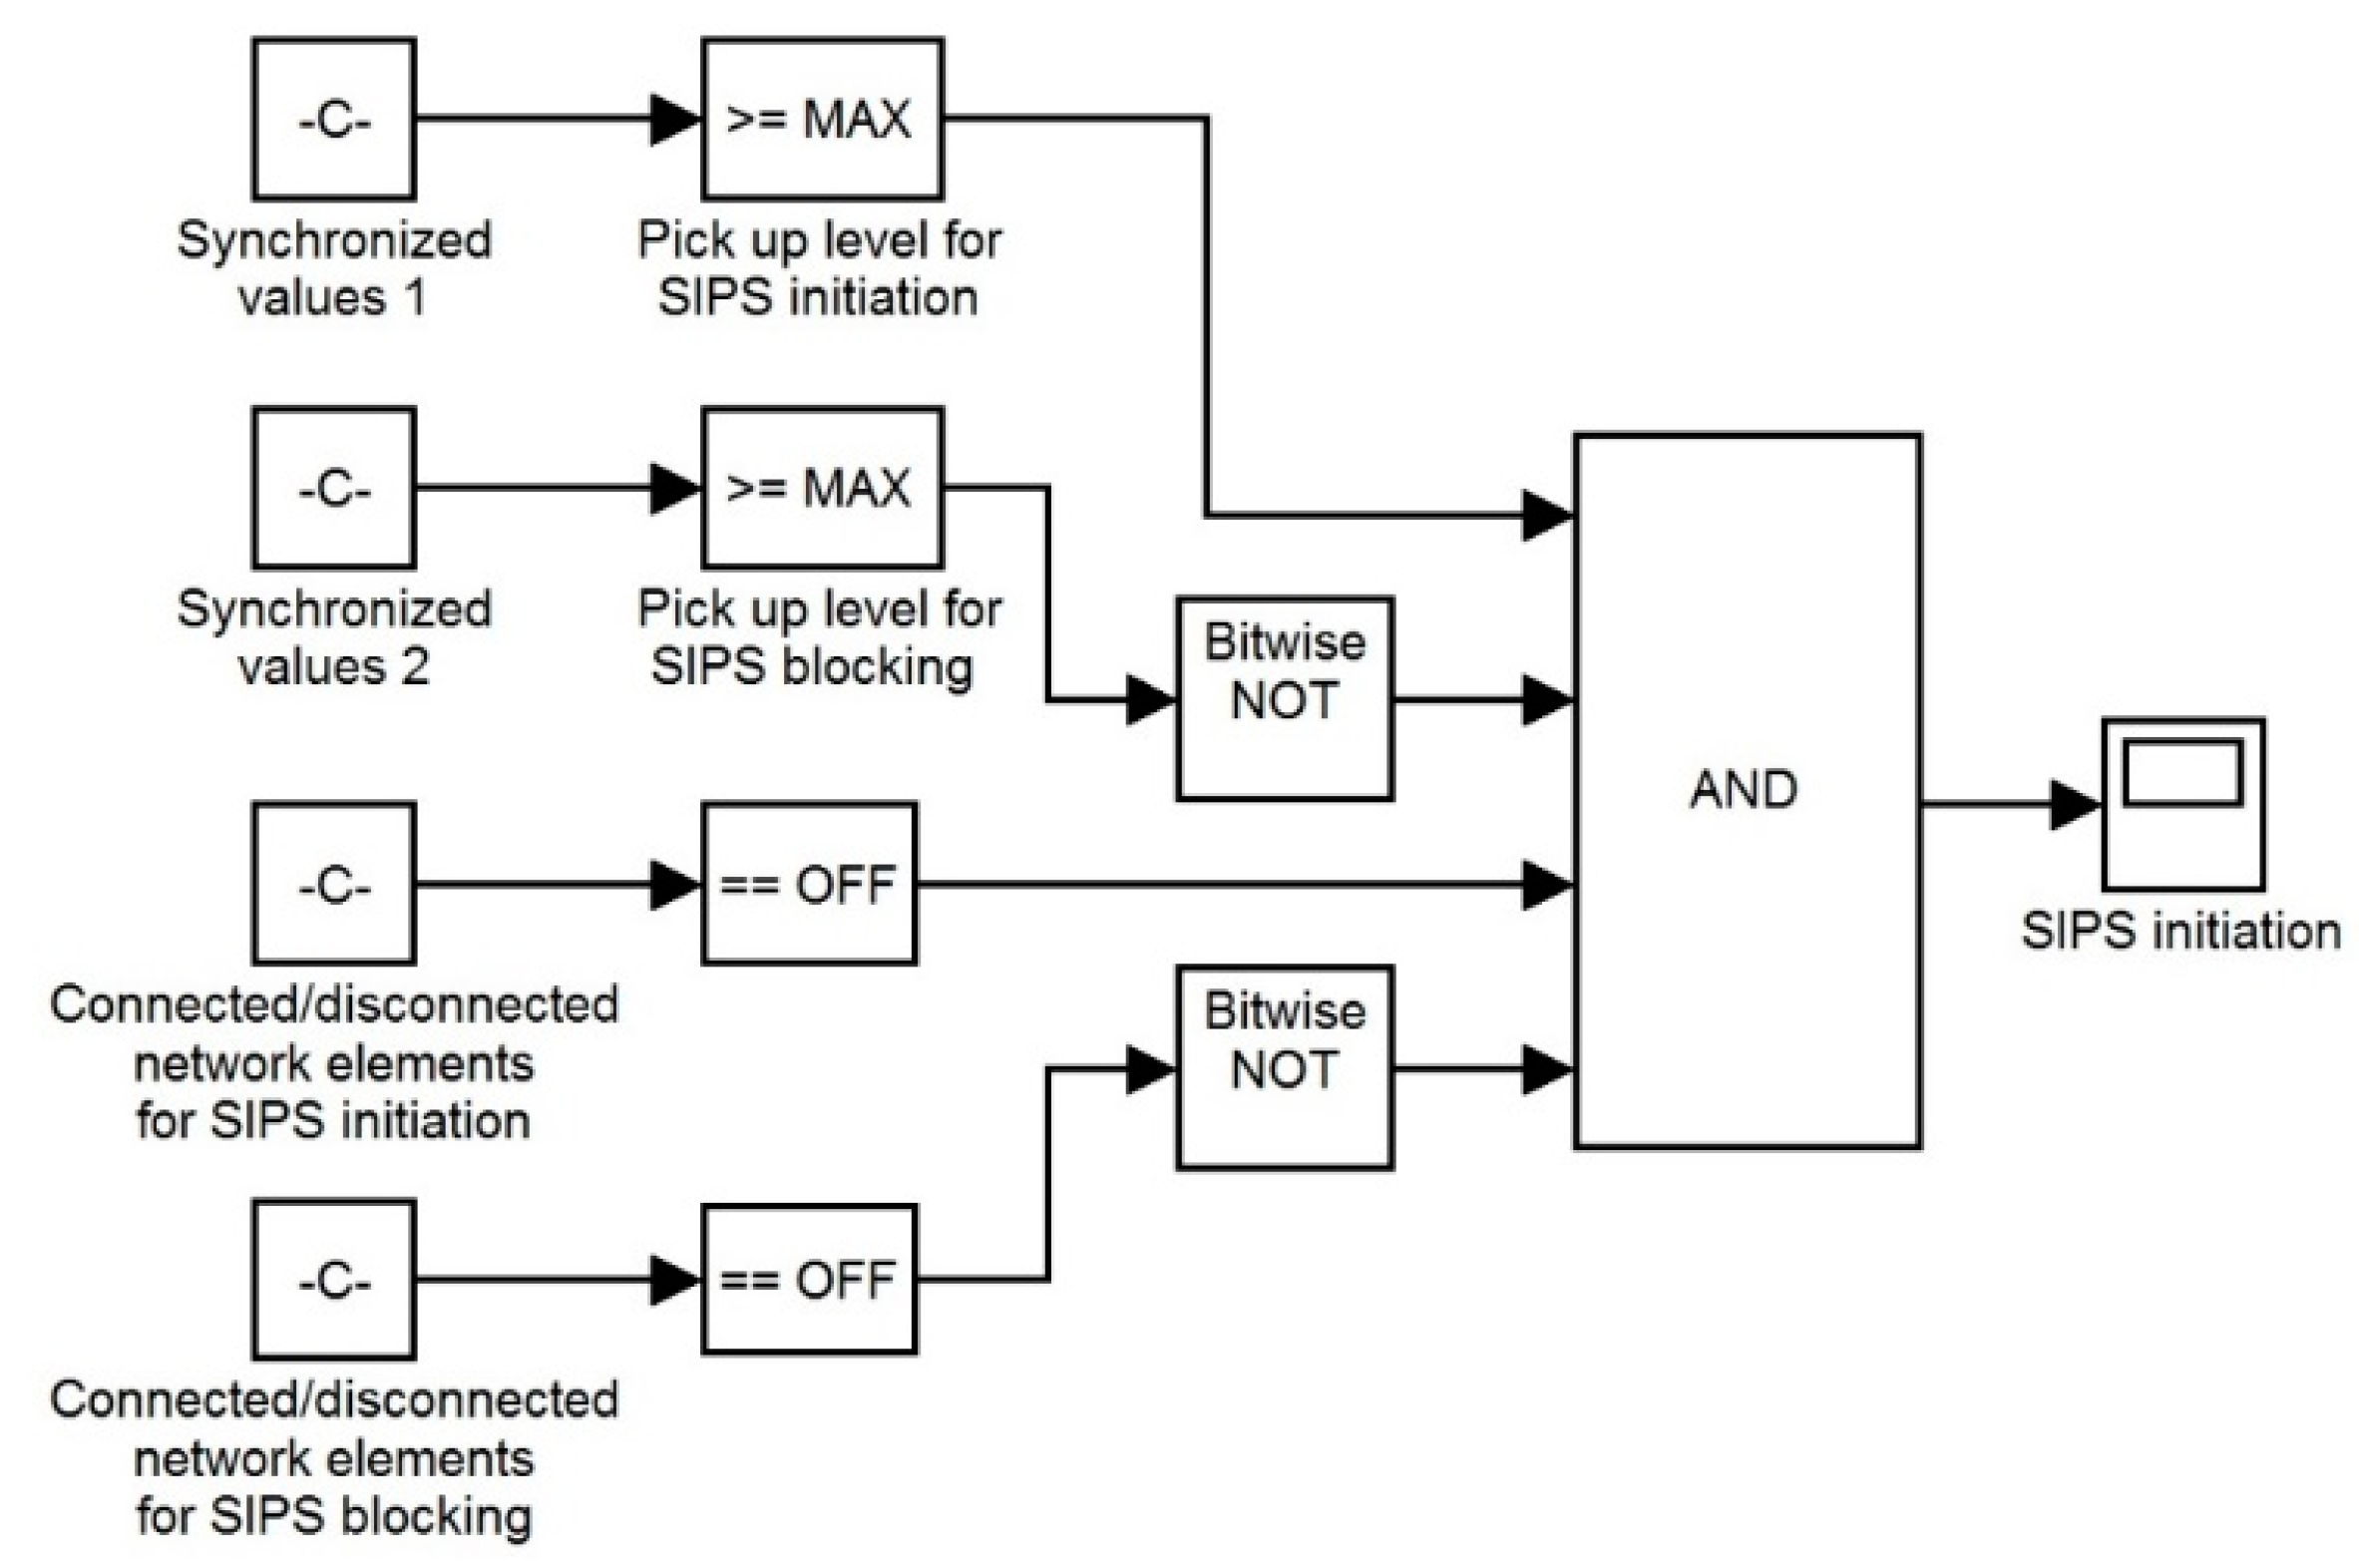
Defining SIPS initiation conditions consists of defining two sets of conditions that will uniquely determine the initiation of necessary actions. The first group of conditions refers to the comparison of actual analogue measured values obtained using synchronized phasor measurement units with predefined values that are specified based on a detailed analysis. Another group of conditions refers to the comparison of the required connected or disconnected status of individual elements in a network with predefined ones also based on detailed analyses. Both sets of conditions consist of their elements for starting or blocking SIPS. The launching principle of a single scheme lies in the fact that all conditions must be satisfied in order to run it.
The SIPS simulation can be initiated and accessed after defining the preliminary activities and design requirements. The Matlab [
25] environment was used as a simulation tool. After the simulation phase it is possible to revise the designed SIPS with the defined requirements if certain irregularities in their functioning are noticed during the simulation step.
Figure 3 shows a block scheme for initiating the SIPS simulation in Matlab.
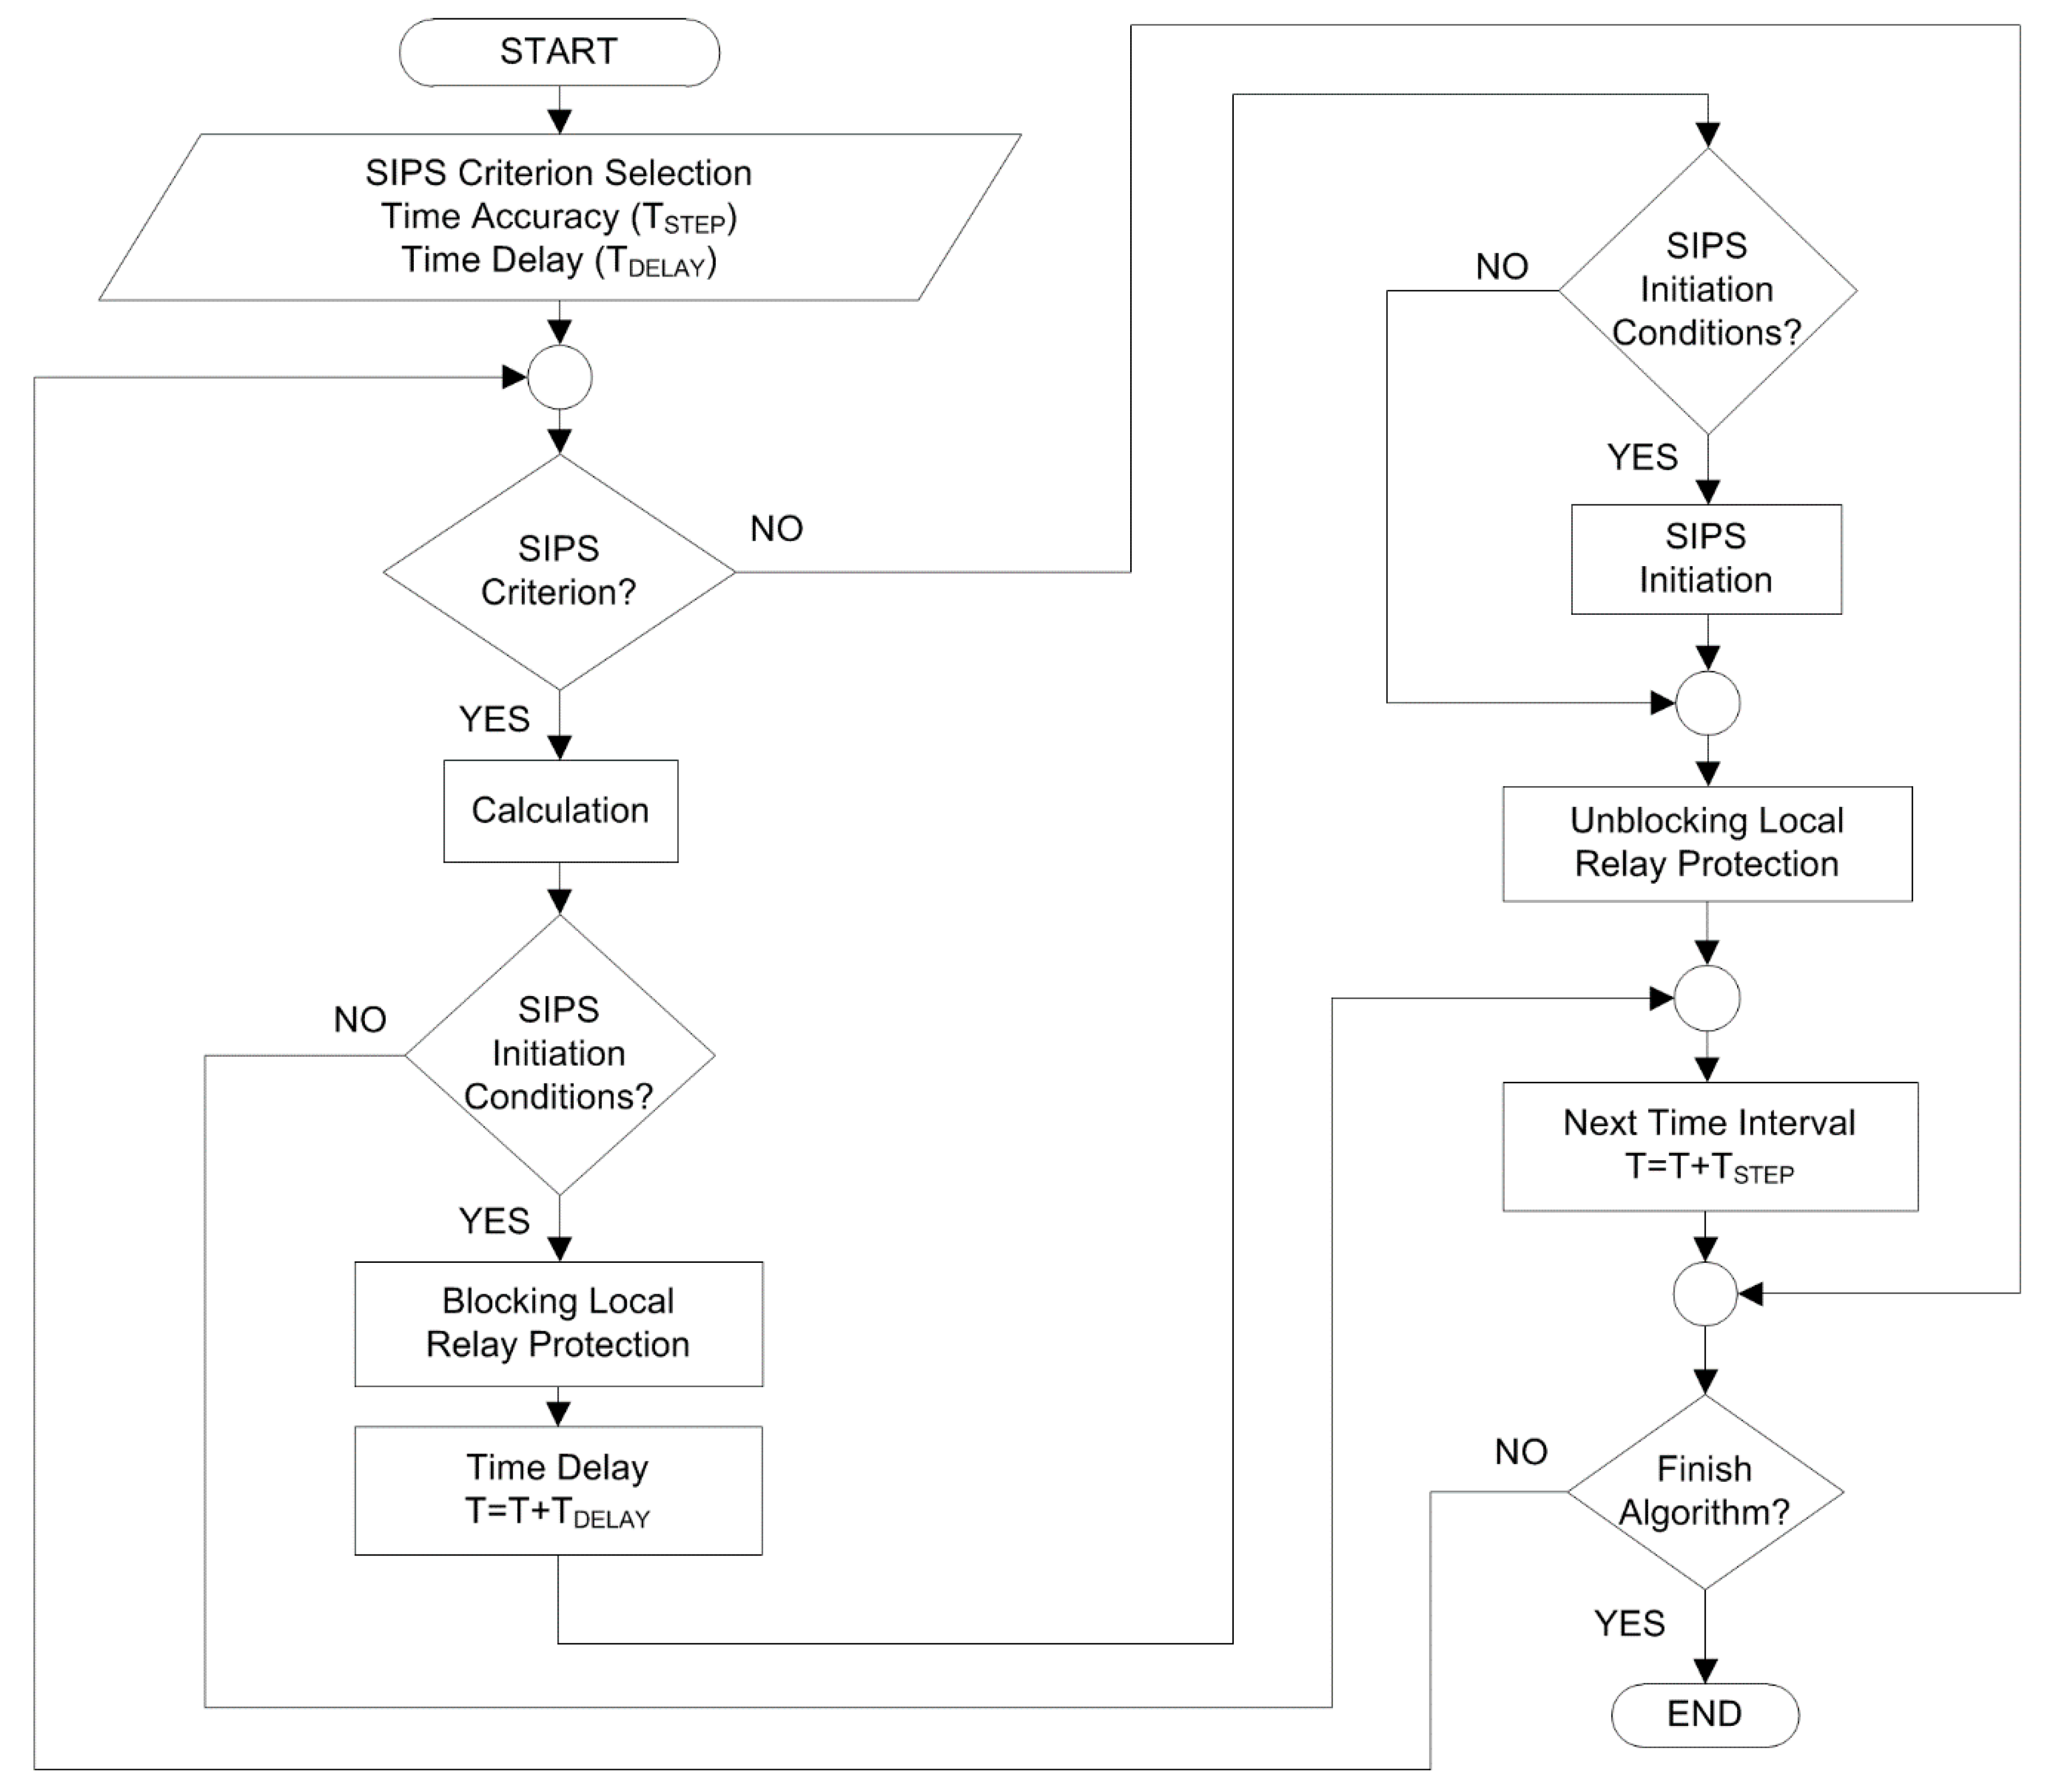
After developing SIPS and describing the bus-splitting scheme, an algorithm for SIPS initiation is developed. The algorithm has a high reliability and start-up accuracy, based on a double check of the start-up conditions separated by time delay execution. After verifying the switch state of the network elements and double checking the start-up conditions, the algorithm launches the selected SIPS based on defined activities. Upon execution, the algorithm continues with its work by checking the termination of the start-up conditions. Afterwards, unblocking of the local relay protection backup stages is issued, the data sampling time is moved to the next data sample according to the defined time step, and the algorithm returns to the beginning of the loop where it re-checks the switch state of the network elements and verifies the collected measured value. A flow diagram of the developed algorithm for SIPS initiation is presented in
Figure 4.
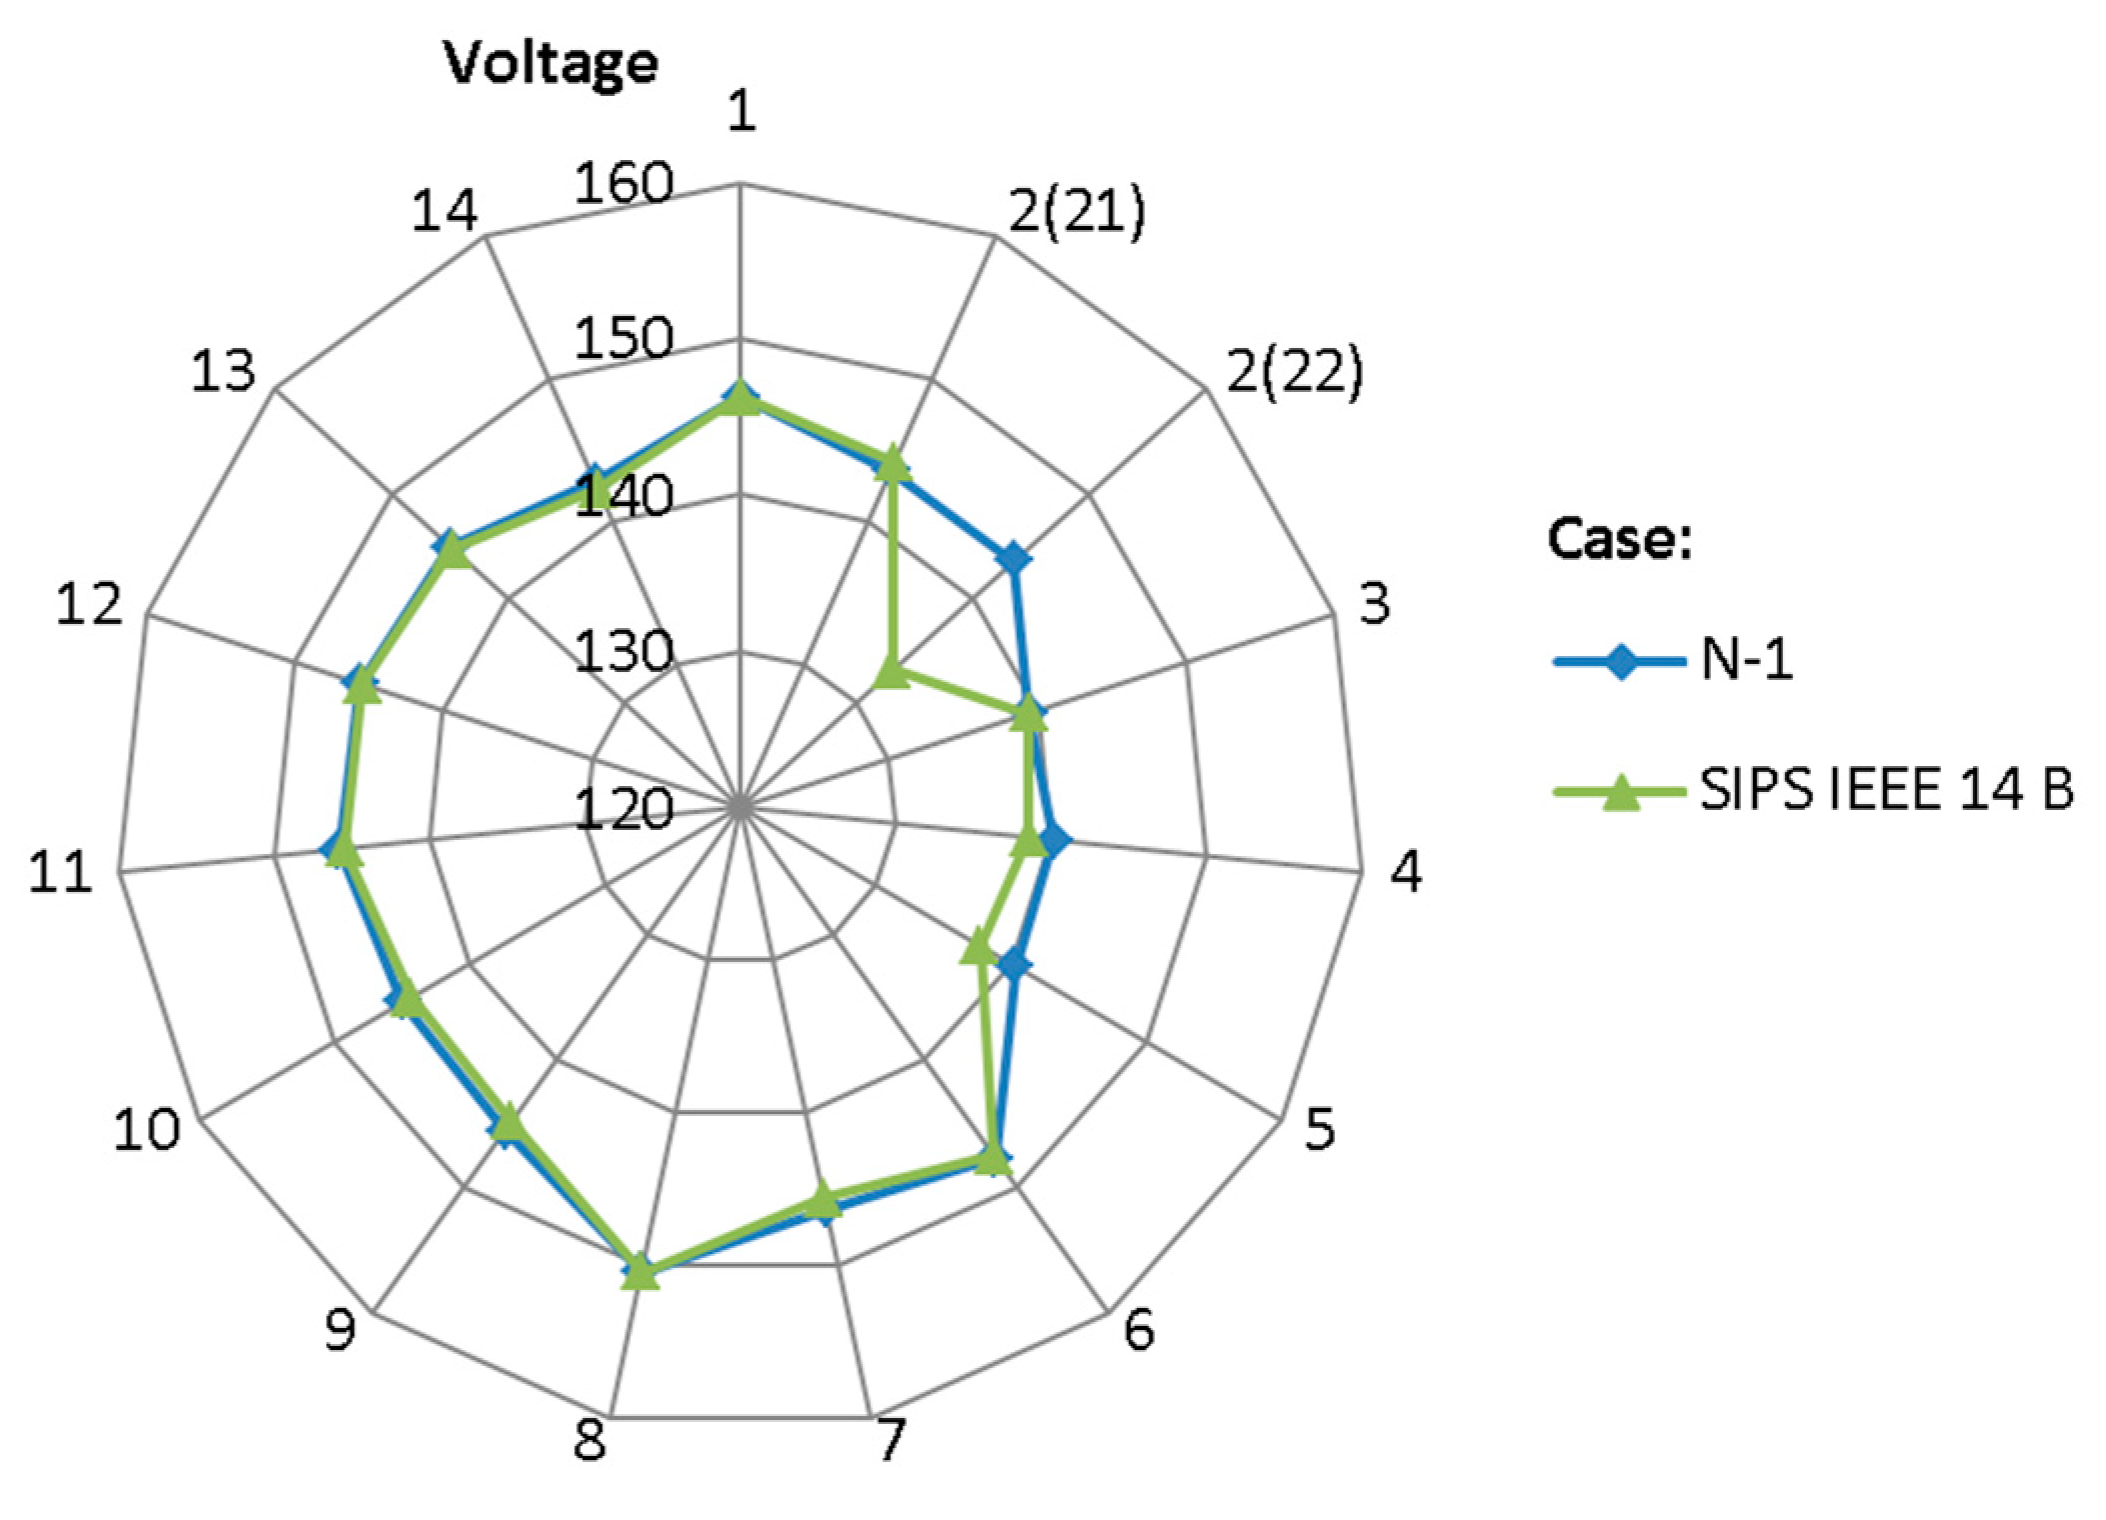
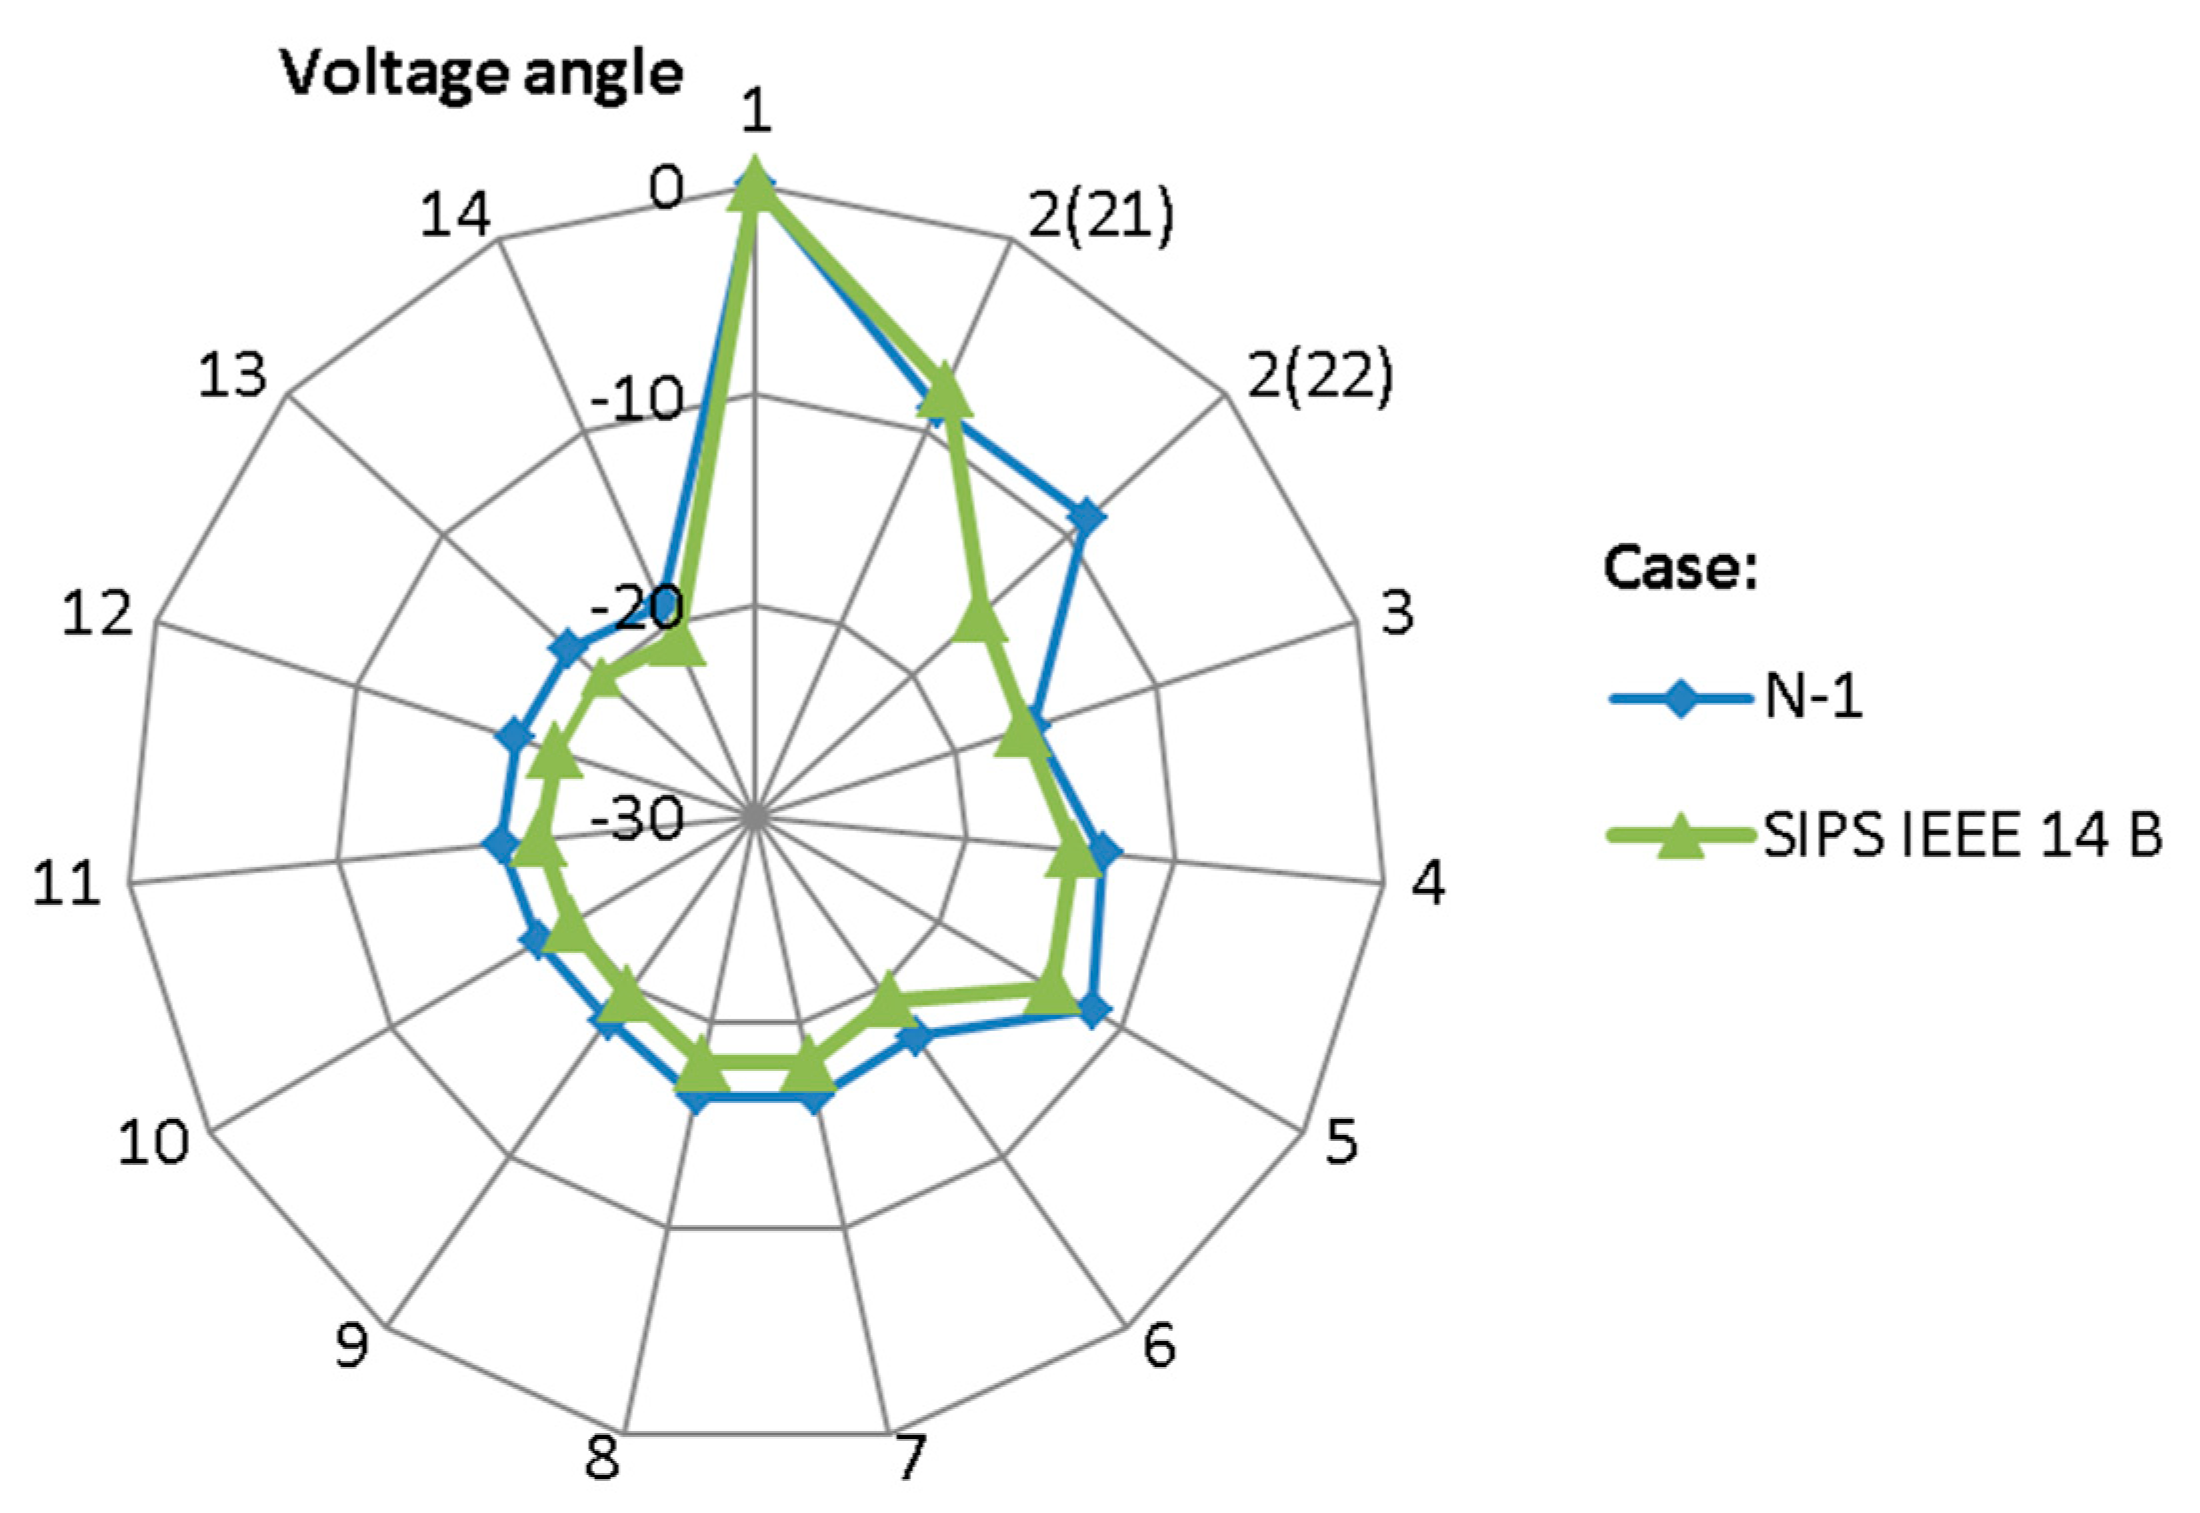
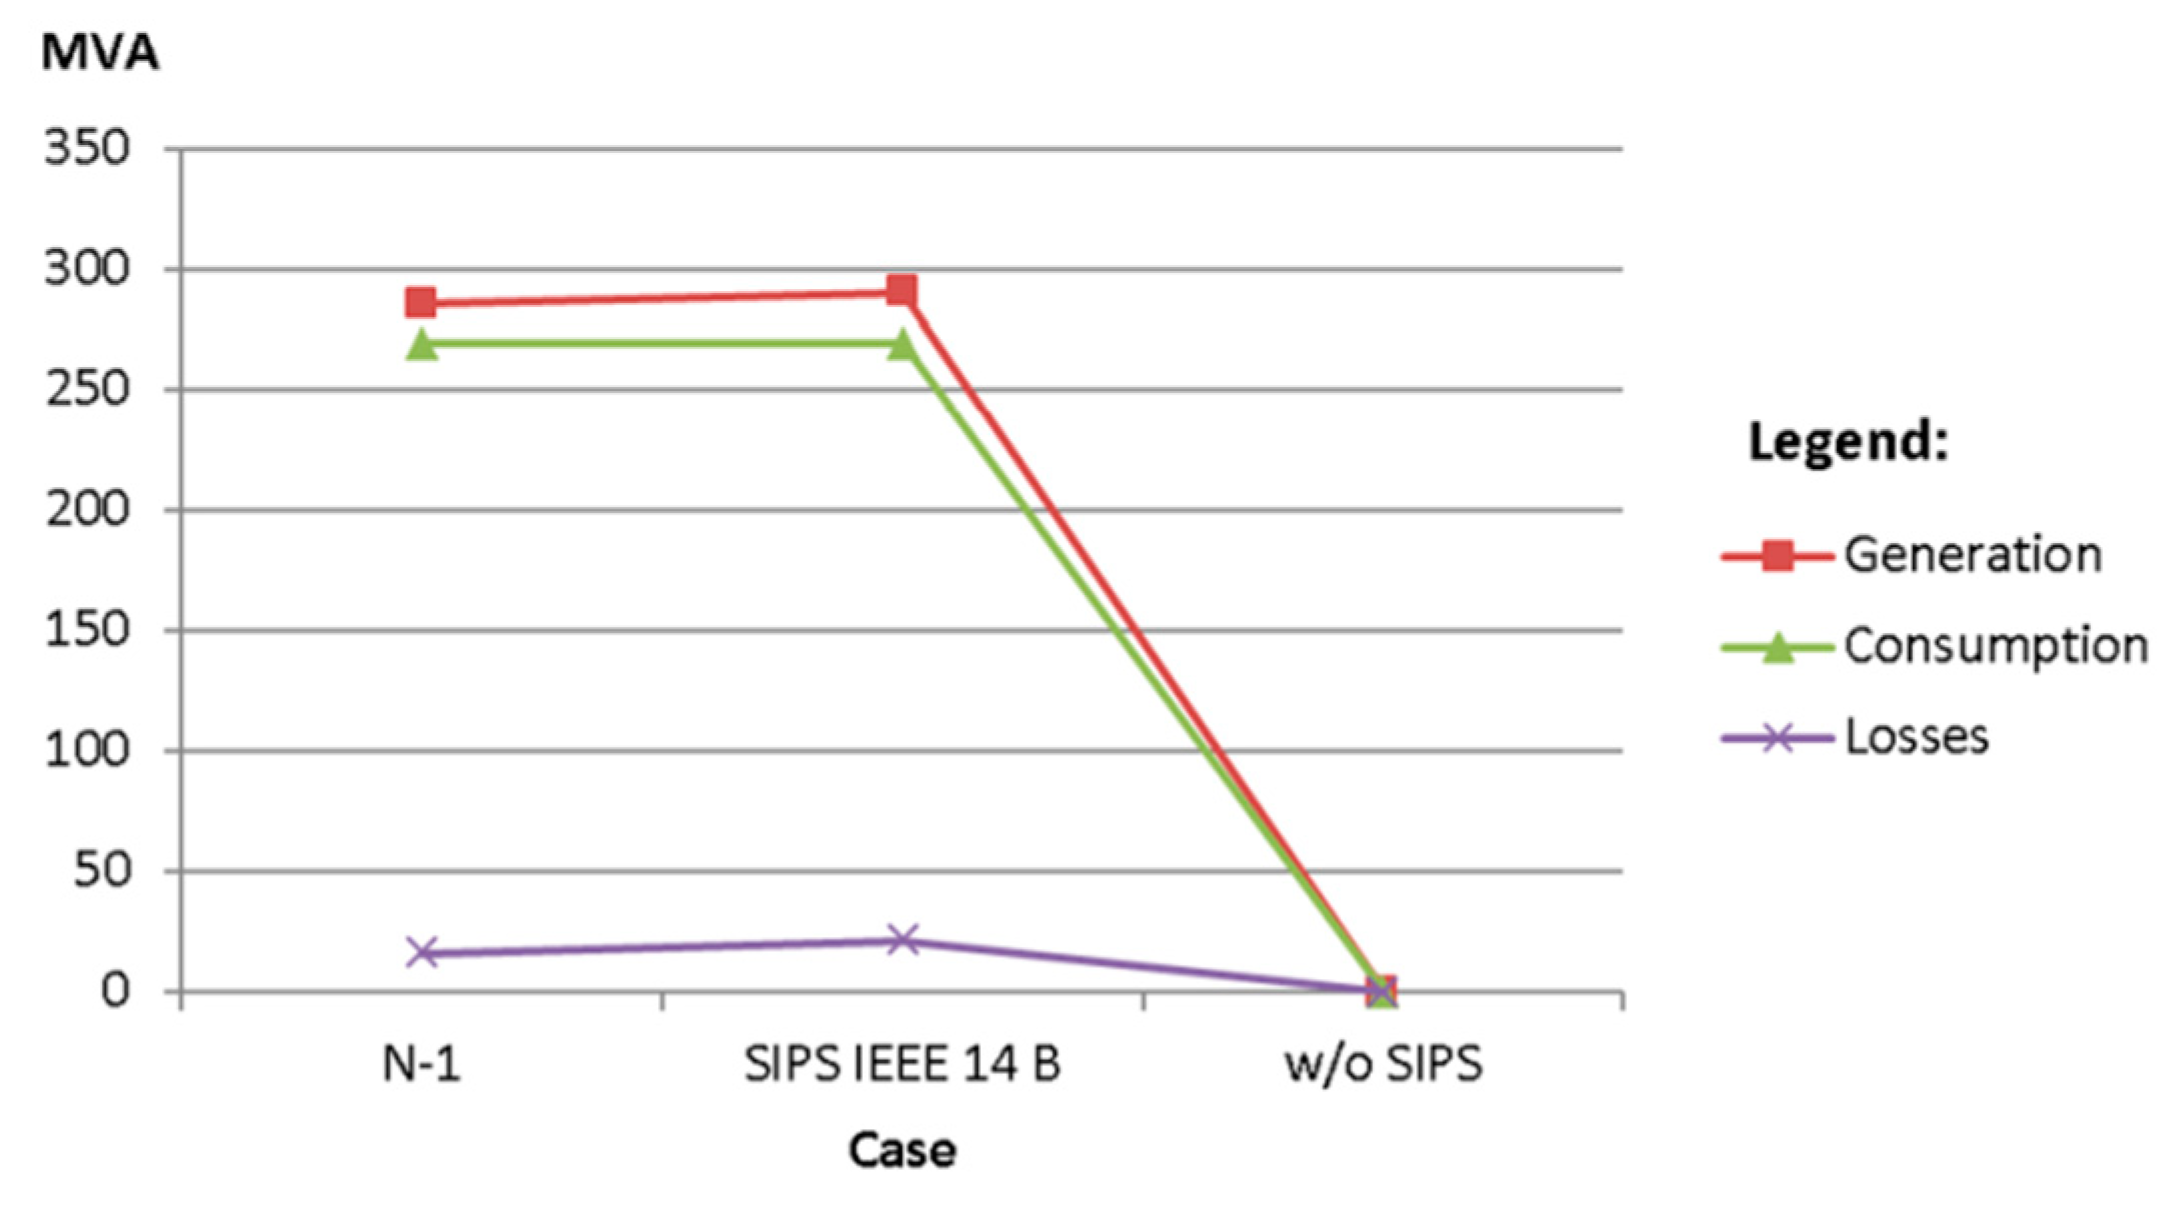
3.6. Power Network Security Assessment with and without SIPS Implementation
Each SIPS application influences the power flows and the voltage conditions in the observed part of the transmission network. For this reason, it is important to carry out a detailed analysis of the entire system after the implementation of SIPS. Analyses presented in this paper include comparisons of voltage conditions and power flows paired together with the generation, consumption, and levels of loss for the system, with and without the use of the designed SIPS. Each of the mentioned comparisons is presented as a graphical chart, from which it is possible to extract the advantages and disadvantages of any particular scheme. Choosing the final scheme is based on set criteria that can best fit the needs, for example, a scheme that causes the least losses in the observed network part without endangering any segment of the network or a scheme that allows for maximum evacuation of the produced wind energy.
4. Mathematical Description of the Optimal Bus-Splitting Problem
The developed algorithm uses mixed integer linear programming (MILP) based on branching and bounding methods when searching for an optimal solution. MILP explores optimization problems within the given constraints of the observed system. Optimization can be based on finding the maximum or minimum of the set objective function. The decision-making process is made based on the given constraints in the form of equations or inequalities. In MILP, decisions can take values from a set of real or integer numbers. The method of branching and bounding is based on the principle of successfully resolving the objective function until the decision values reach the optimal solution. The mathematical model of the used algorithm is based on the DC power flow calculation, which has three assumptions:
line resistance
RL is negligible in relation to line reactance
XL,
per unit voltage |
VN| is the same for all nodes,
voltage angles difference
δi −
δj of the adjacent nodes is small, which derives:
Taking into account these assumptions will affect the accuracy of the DC model. According to [
26], the rough total error of the DC model is 5% compared to the more accurate nonlinear AC model. Though the accuracy of the DC model is smaller than that of the AC model, it is characterized by the simplicity and speed of the calculation conditioned by its linearity, which is why it is proposed in making SIPS.
Unlike the load-shedding or generation reduction schemes, the goal of transmission-switching protection schemes is to maintain the existing level of production and consumption in the observed power system. An optimal bus-splitting protection scheme based on a linear DC power flow model and synchronized phasor measurements is given below. The main contribution of developed algorithm is the introduction of an adjustment factor kPe in order to replace the inequality of the DC network model with respect to the actual state of the power system. The adjustment factor is calculated in real time using synchronized phasor measurements. The model features exceptional performance speeds that enable its use in SIPS and, consequently, preserves the security of the power system in its entirety.
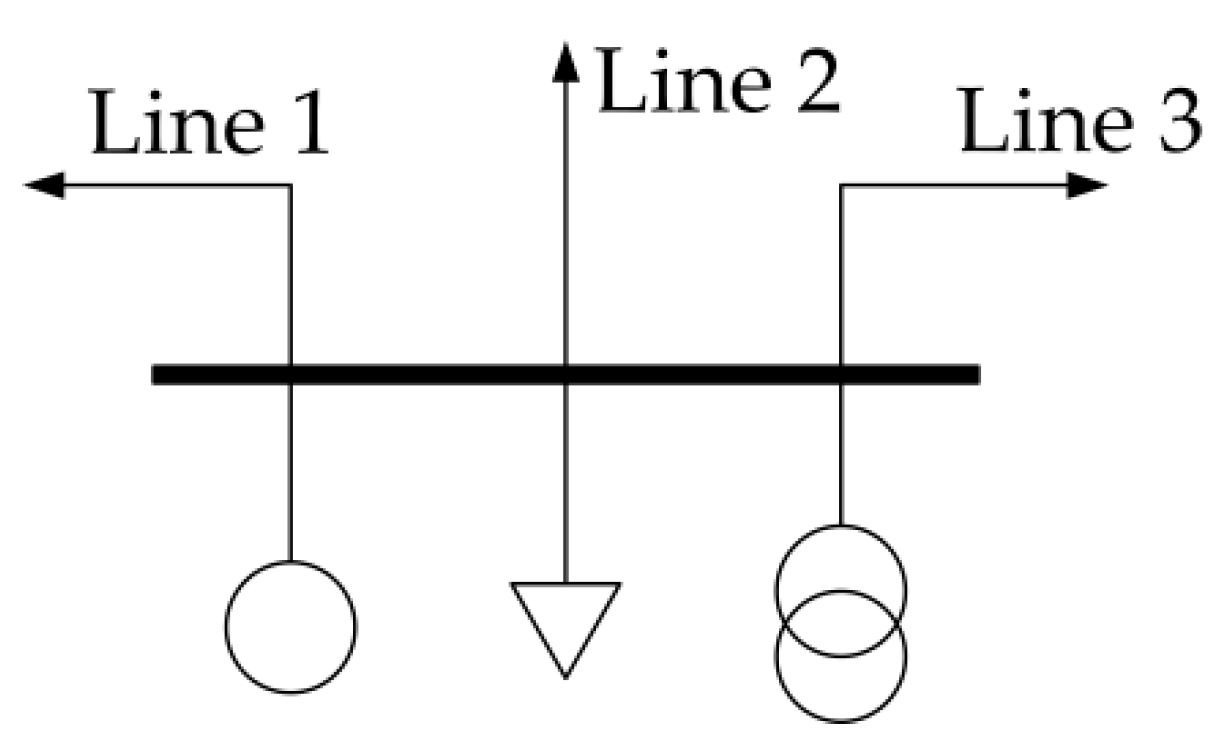
Note the example of a substation with six initially defined elements in
Figure 5. The substation consists of one generator, one load, one transformer, and three lines. All of the above elements are connected to one bus.
In order to mathematically describe the optimal bus-splitting problem it is necessary to create an equivalent model for each substation. The equivalent substation model consists of
N newly created buses, where
N is the total number of initially defined elements associated with the observed substation. The total number of initially defined elements represents the total number of all connected generators, loads, transformers, and lines to the observed substation. After creating
N new buses, it is necessary to create
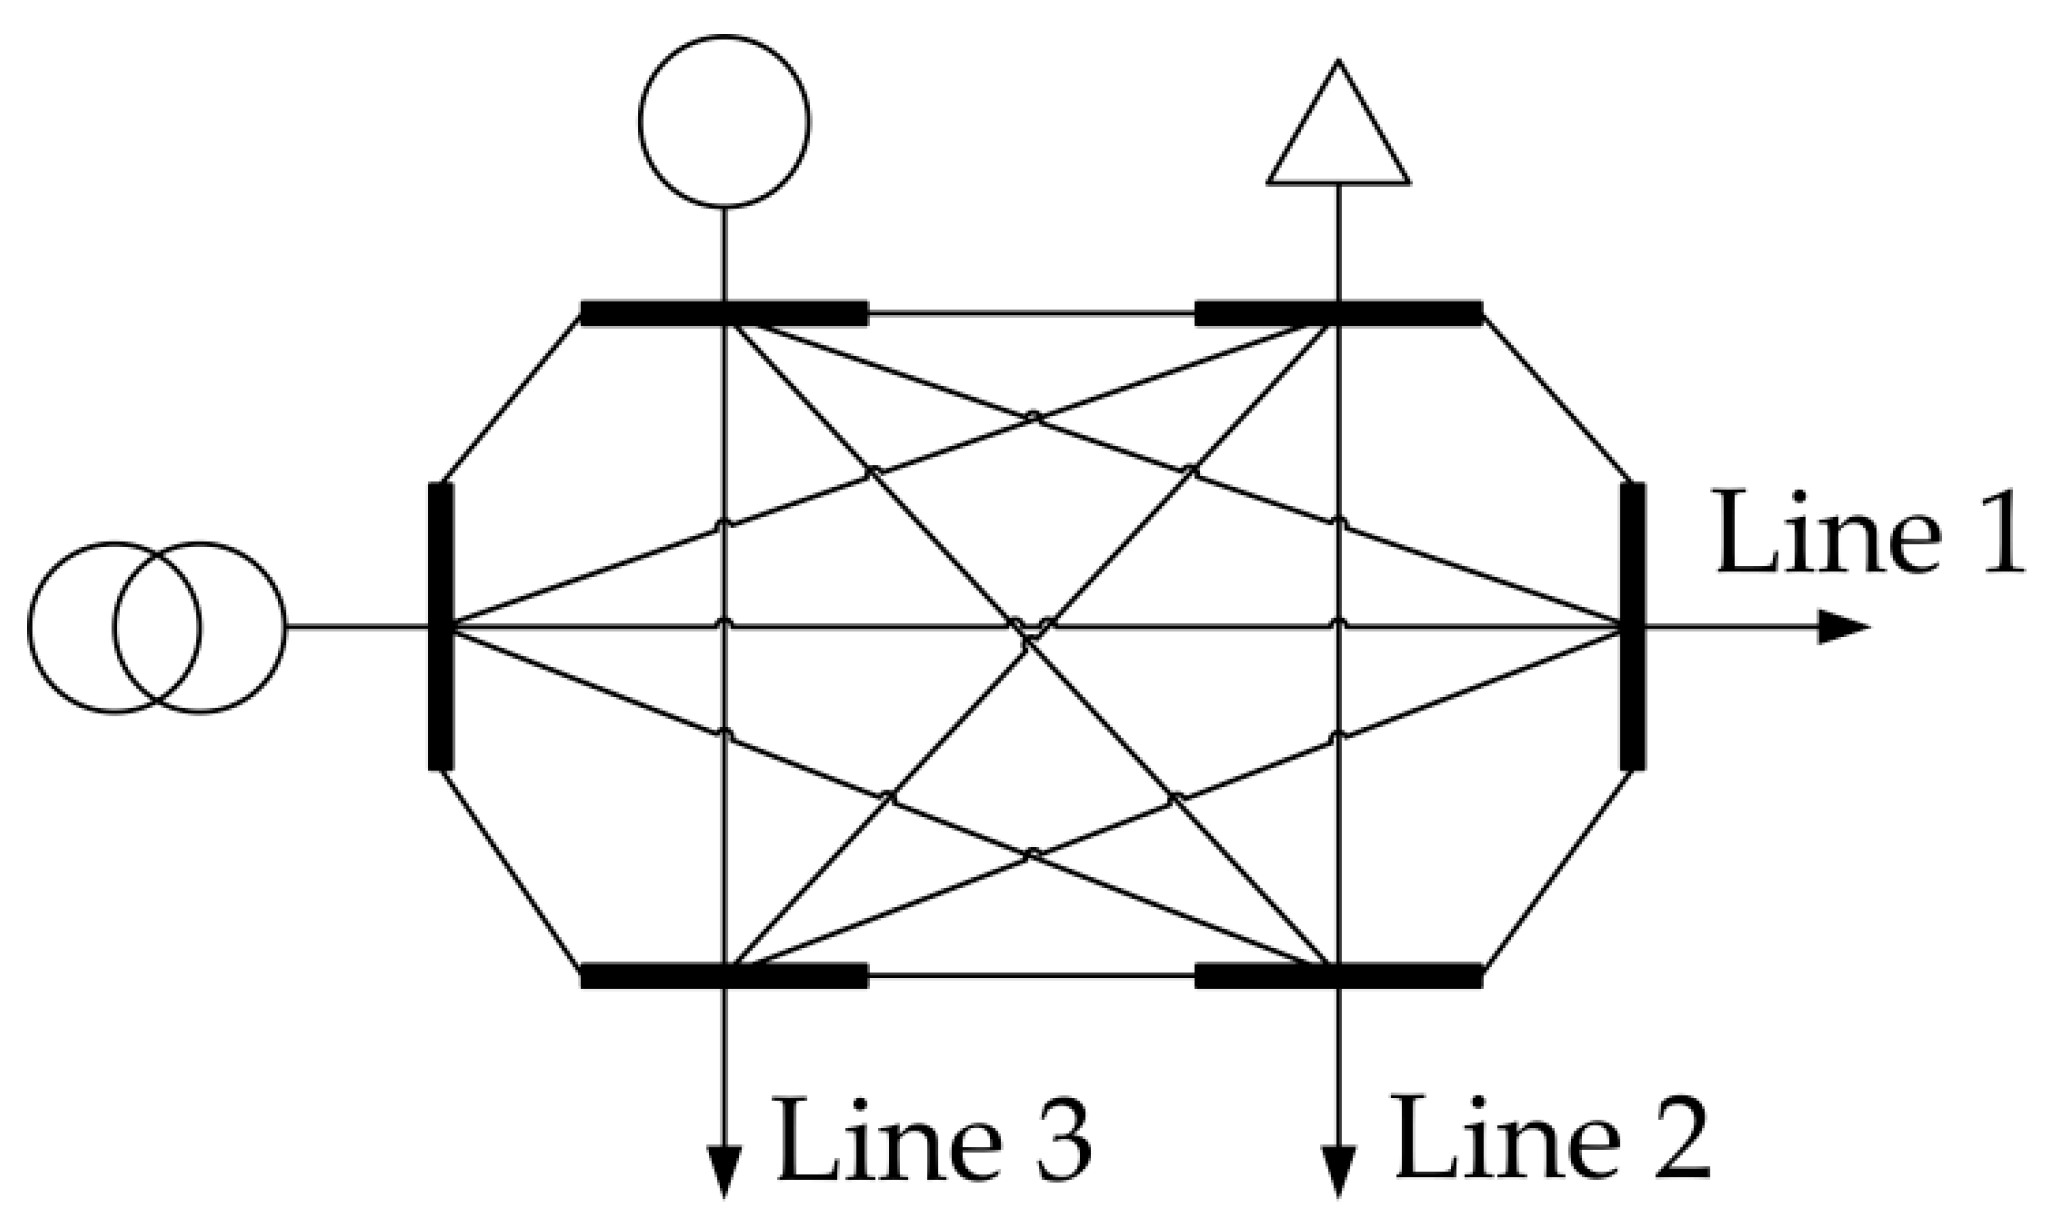
E new elements, with extremely low impedance, which connect new buses in all possible combinations. New elements, with extremely low impedance, can be called zero-impedance elements. Each new element, connecting the two new buses, is assigned with a decision variable that represents its closed or open state. The total number of new zero-impedance elements per substation is defined by the following expression:
For the given example of a substation with six initially defined elements, according to
Figure 5, the total number of new zero-impedance elements is fifteen, as shown graphically in
Figure 6.
Calculation of the DC power flow model for the described equivalent system can be described by the following nonlinear expression:
where:
e—element tag,
i, j—node tag,
Pe—active power flow for element e,
δi, δj—voltage phase angle for node i and j,
Xe—element e reactance,
VAREe—decision variable which represents element e in the closed or open state, defined as binary value 0 for open or 1 for closed state,
E—number of elements,
N—number of nodes, and
δREF—reference voltage phase angle.
Expression (5) needs to be linearized according to the terms below in order to the solve optimization problem with MILP methods:
where:
Linearization is achieved by introducing value
M defined by the following expression:
where:
If the decision variable, which represents element
e in the closed or open state, is equal to one, then Expressions (6) and (7) result in
which corresponds to the definition of the DC power flow calculation when element
e is closed. If the decision variable, which represents element
e in the closed or open state, is equal to zero, then the active power of the observed element is also equal to zero, and the difference of voltage angles in nodes
i and
j is limited by the calculated
Me value.
The node sum is defined by the following expression:
where:
The active power flow constraint of element
e with respect to its maximum permissible apparent power is defined by the following expression:
where:
kPe—adjustment factor that is calculated in real time during the overload state, defined by Expression (12),
SMAXe—maximum permissible apparent power of element e.
Adjustment factor
kPe is introduced in order to compensate for the inaccuracy of the DC power flow model. It is calculated in real time using synchronized phasor measurements
where:
ks—safety coefficient with selected value 1.2,
PREALe—real-time measured active power of element e during the overload period using the PMU device, and
PDCe—calculated active power flow of element e based on the DC model during the overload period.
In order to ensure an optimal and safe bus-splitting solution, it is necessary to set constraints that do not allow initially modelled lines or transformers to be disconnected. Constraints that ensure the connected state of at least two elements on all modelled buses are also mandatory in addition to the above restriction.
The objective function of the described optimization algorithm is to minimize total production according to the following expression:
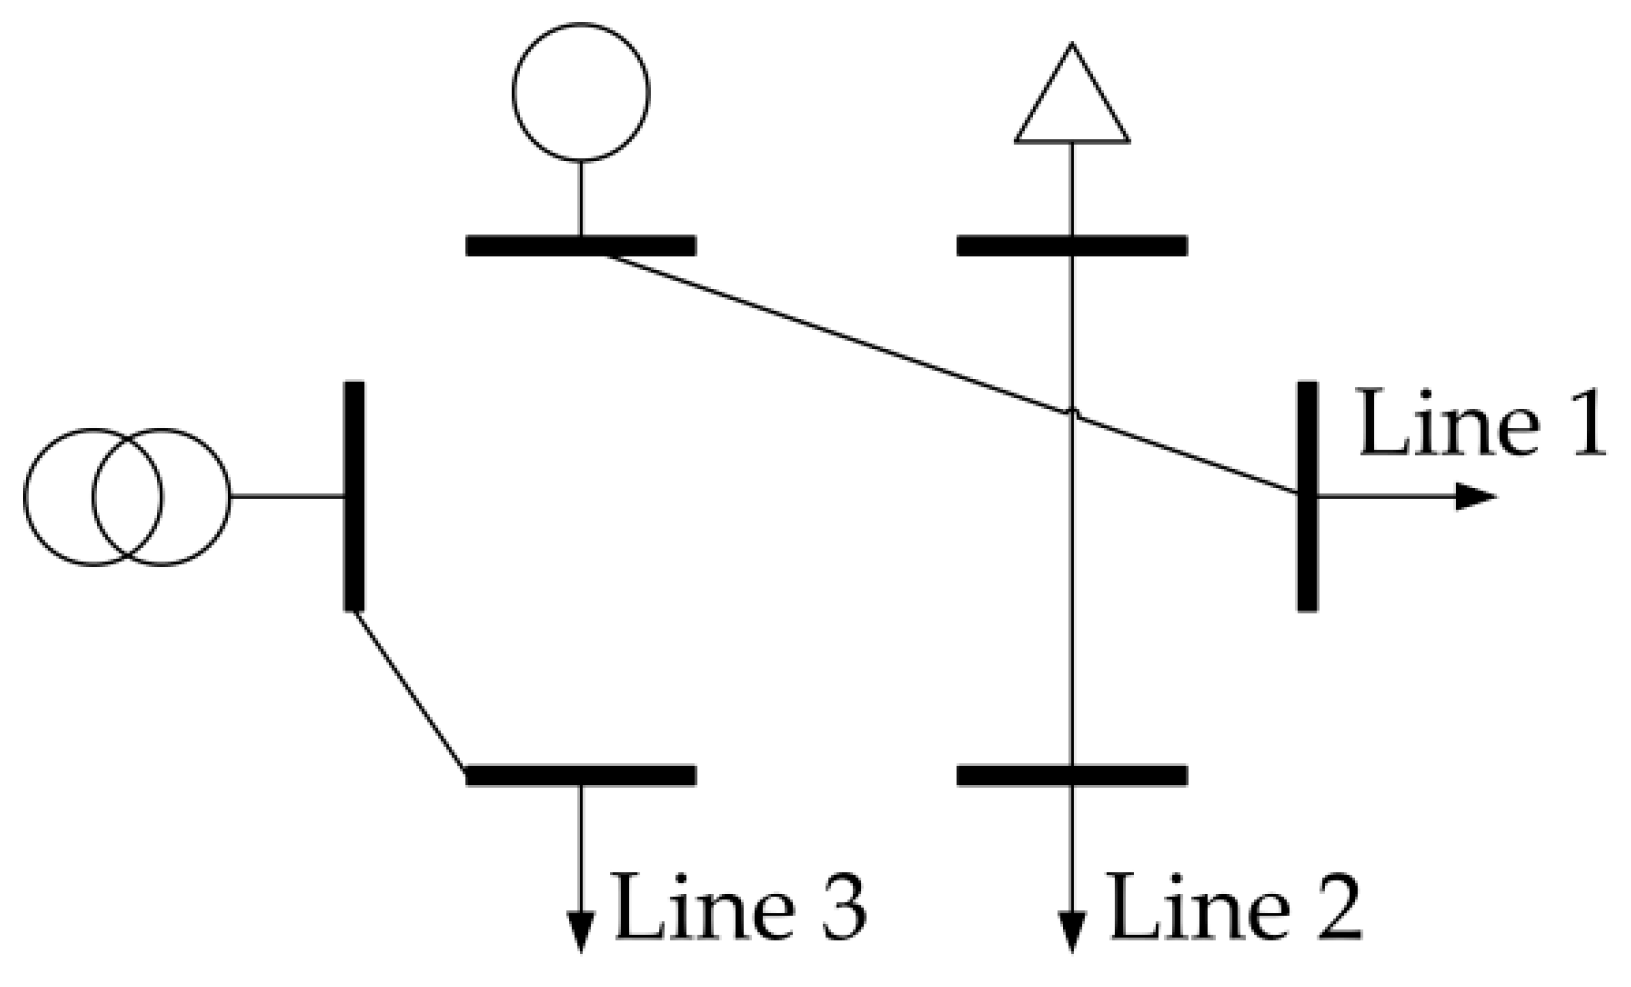
The described optimization algorithm finds the optimal bus-splitting combination by taking into consideration the maximum permissible power flow limits on the network elements. Fulfilment of the assigned constraints has the effect of mitigating initial element overloading.
Figure 7 shows a symbolic example of a bus-splitting combination for a bus with six initially defined elements. The equivalent bus model is split on three bus systems, each linking two elements.


