Article

A Two-Stage Dispatch Mechanism for Virtual Power Plant Utilizing the CVaR Theory in the Electricity Spot Market

1
School of Electric Power, South China University of Technology, Guangzhou 510640, China
2
Guangdong Key Laboratory of Clean Energy Technology, South China University of Technology, Guangzhou 510640, China
3
School of Mechanical Engineering and Automation, Harbin Institute of Technology, Shenzhen 518055, China
4
Electric Power Research Institute, China Southern Power Grid, Guangzhou 510663, China
5
National-Local Joint Engineering Laboratory for Wind Power Control and Integration Technology, Guangzhou 510640, China
*
Authors to whom correspondence should be addressed.
Energies 2019, 12(17), 3402; https://doi.org/10.3390/en12173402
Submission received: 26 July 2019 / Revised: 23 August 2019 / Accepted: 27 August 2019 / Published: 3 September 2019
(This article belongs to the Section F: Electrical Engineering)

Abstract

:
The electricity spot market is now being implemented in China. Demand response, as a kind of flexible resource, is also being studied and explored for the constructed power market. Among the many demand response applications, the virtual power plant (VPP) as an aggregator of distributed energy resources (DERs), receives ever-increasing attention. However, the participation manner and related impacts of the VPP to the electricity spot market are still unknown within the current power market rules. Under this background, obeying the present trading rules of China’s electricity spot market, a two-stage dispatching model with optimized bidding and operating strategy in the day-ahead (DA) and real-time (RT) market for the VPP is proposed. In the designed model, the conditional risk value (CVaR) is adopted to address the risk encountered by the uncertainty of the electricity spot market price. The impact of the user-side over-deviated revenue mechanism (UORM) of the China spot market on the income of the VPP in the DA and RT market is also analyzed. For a full evaluation, different coefficients for the influence of DA and RT risk, UORM, and energy storage system (ESS) are tested to investigate their respective impacts on the revenue of the VPP. The simulation cases prove that the proposed method is helpful for the VPP to optimize DERs’ output in the electricity spot market according to its own risk preference.

1. Introduction

The power trading volume of China is constantly increasing, and exceeds 200 billion kWh, accounting for 30.2% of total electricity consumption in 2018 [1]. However, the transaction was mainly transacted in medium and long-term contracts with no electricity spot market. To solve the problem of power deviation caused by inconsistent power purchase and consumption, and also explore the commodity value of electricity, the National Development and Reform Commission issued the Basic Rules for the operation of the electricity market in 2015 [2]. This document puts forward the basic framework and has released implemented instructions on the construction of the electricity spot market. Currently, the spot market of the Zhejiang province is at its initial stage with the goal of having the same market system as PJM (Pennsylvania—New Jersey—Maryland, a regional power market organization in USA) [3], and Guangdong province has allowed the market participants to bid on the spot market and settled with node price [4].
In China, the electricity market is regulated by government departments, such as South China Energy Regulatory Office of National Energy Administration, which is responsible for formulating power market operation rules and determining parameters, such as upper and lower bounds of generation bidding [5]. As the electricity spot market is being developed, various new market elements, such as ancillary service, demand response, etc., are applied. Among the many demand response applications, the VPP (Virtual power plant) receives ever-increasing attention. As a kind of distributed energy aggregator, the VPP can make higher utilization of renewable energy resources, demand response (DR) and ESSs (Energy storage systems), through advanced measurement, communication, and control technologies [6,7]. The VPP also improves the overall economic benefits under spot market price. Currently, the research on the VPP mainly focuses on directions, including the uncertainty processing of renewable energy, multi-time scale dispatching, multiple energy forms, and objective functions considering internal resource consumption and economic optimization. To solve the intermittency and fluctuation of renewable energy, methods such as stochastic and robust scheduling are used to address the uncertainty in the determining model in [8,9,10]. With advanced VPP dispatch, the operation cost and renewable energy consumption can be reduced through the coordination of the ESS and DR [11,12,13]. In [14], weekly prediction of market price and renewable energy output was proposed to solve the mid-term VPP dispatch problem, where the model is built as a mixed integer programming (MIP) problem and solved with CPLEX [13]. With multiple energy forms in the VPP, such as heat, power, and gas, the model of multi-energy transformation and transmission is proposed in [15,16,17] to improve multi-energy consumption or reduce the operational cost.
Meanwhile, the participation manner and related impacts of the VPP to the electricity spot market are still unknown. Generally, the electricity spot market always includes multiple markets, such as the DA (Day-ahead) market and RT (Real-time) market. However, among the emerging researches, many mainly focus on the VPP DA market bidding strategy and distributed energy resources’ (DERs) aggregation with little attention on the scheduling problem involving multiple markets [18,19,20]. In [21], under the DA market environment, the model of renewable energy and bidding strategy of the VPP was proposed to optimize the 24-h scheduling problem. In [22], the VPP DA market bidding strategy and distributed algorithm aimed at improving the solving efficiency and speed were proposed. In [23], the intraday demand response market, DA market, and bidding preference were considered in the model of the VPP. The method proposed can ensure economic income and renewable energy consumption. While in the China spot market, the UORM (user-side over-deviated revenue mechanism) is a unique mechanism. In brief, the UORM sets an allowable ratio to limit the behavior of participants via over-bidding or under-bidding in the DA market [24]. Nevertheless, the application of the VPP to the spot market, especially under the UORM, is rarely studied and needs to be further explored.
In this work, the aim is to investigate VPP behaviors under the electricity spot market structure of China. To achieve this goal, a two-stage dispatching model with optimized bidding and operating strategy in the DA and RT market for the VPP is proposed. For the electricity spot market, the spot market price tends to fluctuate and is difficult to predict, which can lead to trading risks for the market participants. Therefore, the uncertainty of market price is also studied. Generally, portfolio theory is an effective way to solve the problem of price fluctuation risks and is adopted to deal with the spot market price uncertainty. In the designed method, the CVaR (Conditional risk value) which originated from the portfolio optimization model, which satisfies the consistency risk measurement condition, is applied [25].
The specific goals and contributions of this paper are identified as follows:
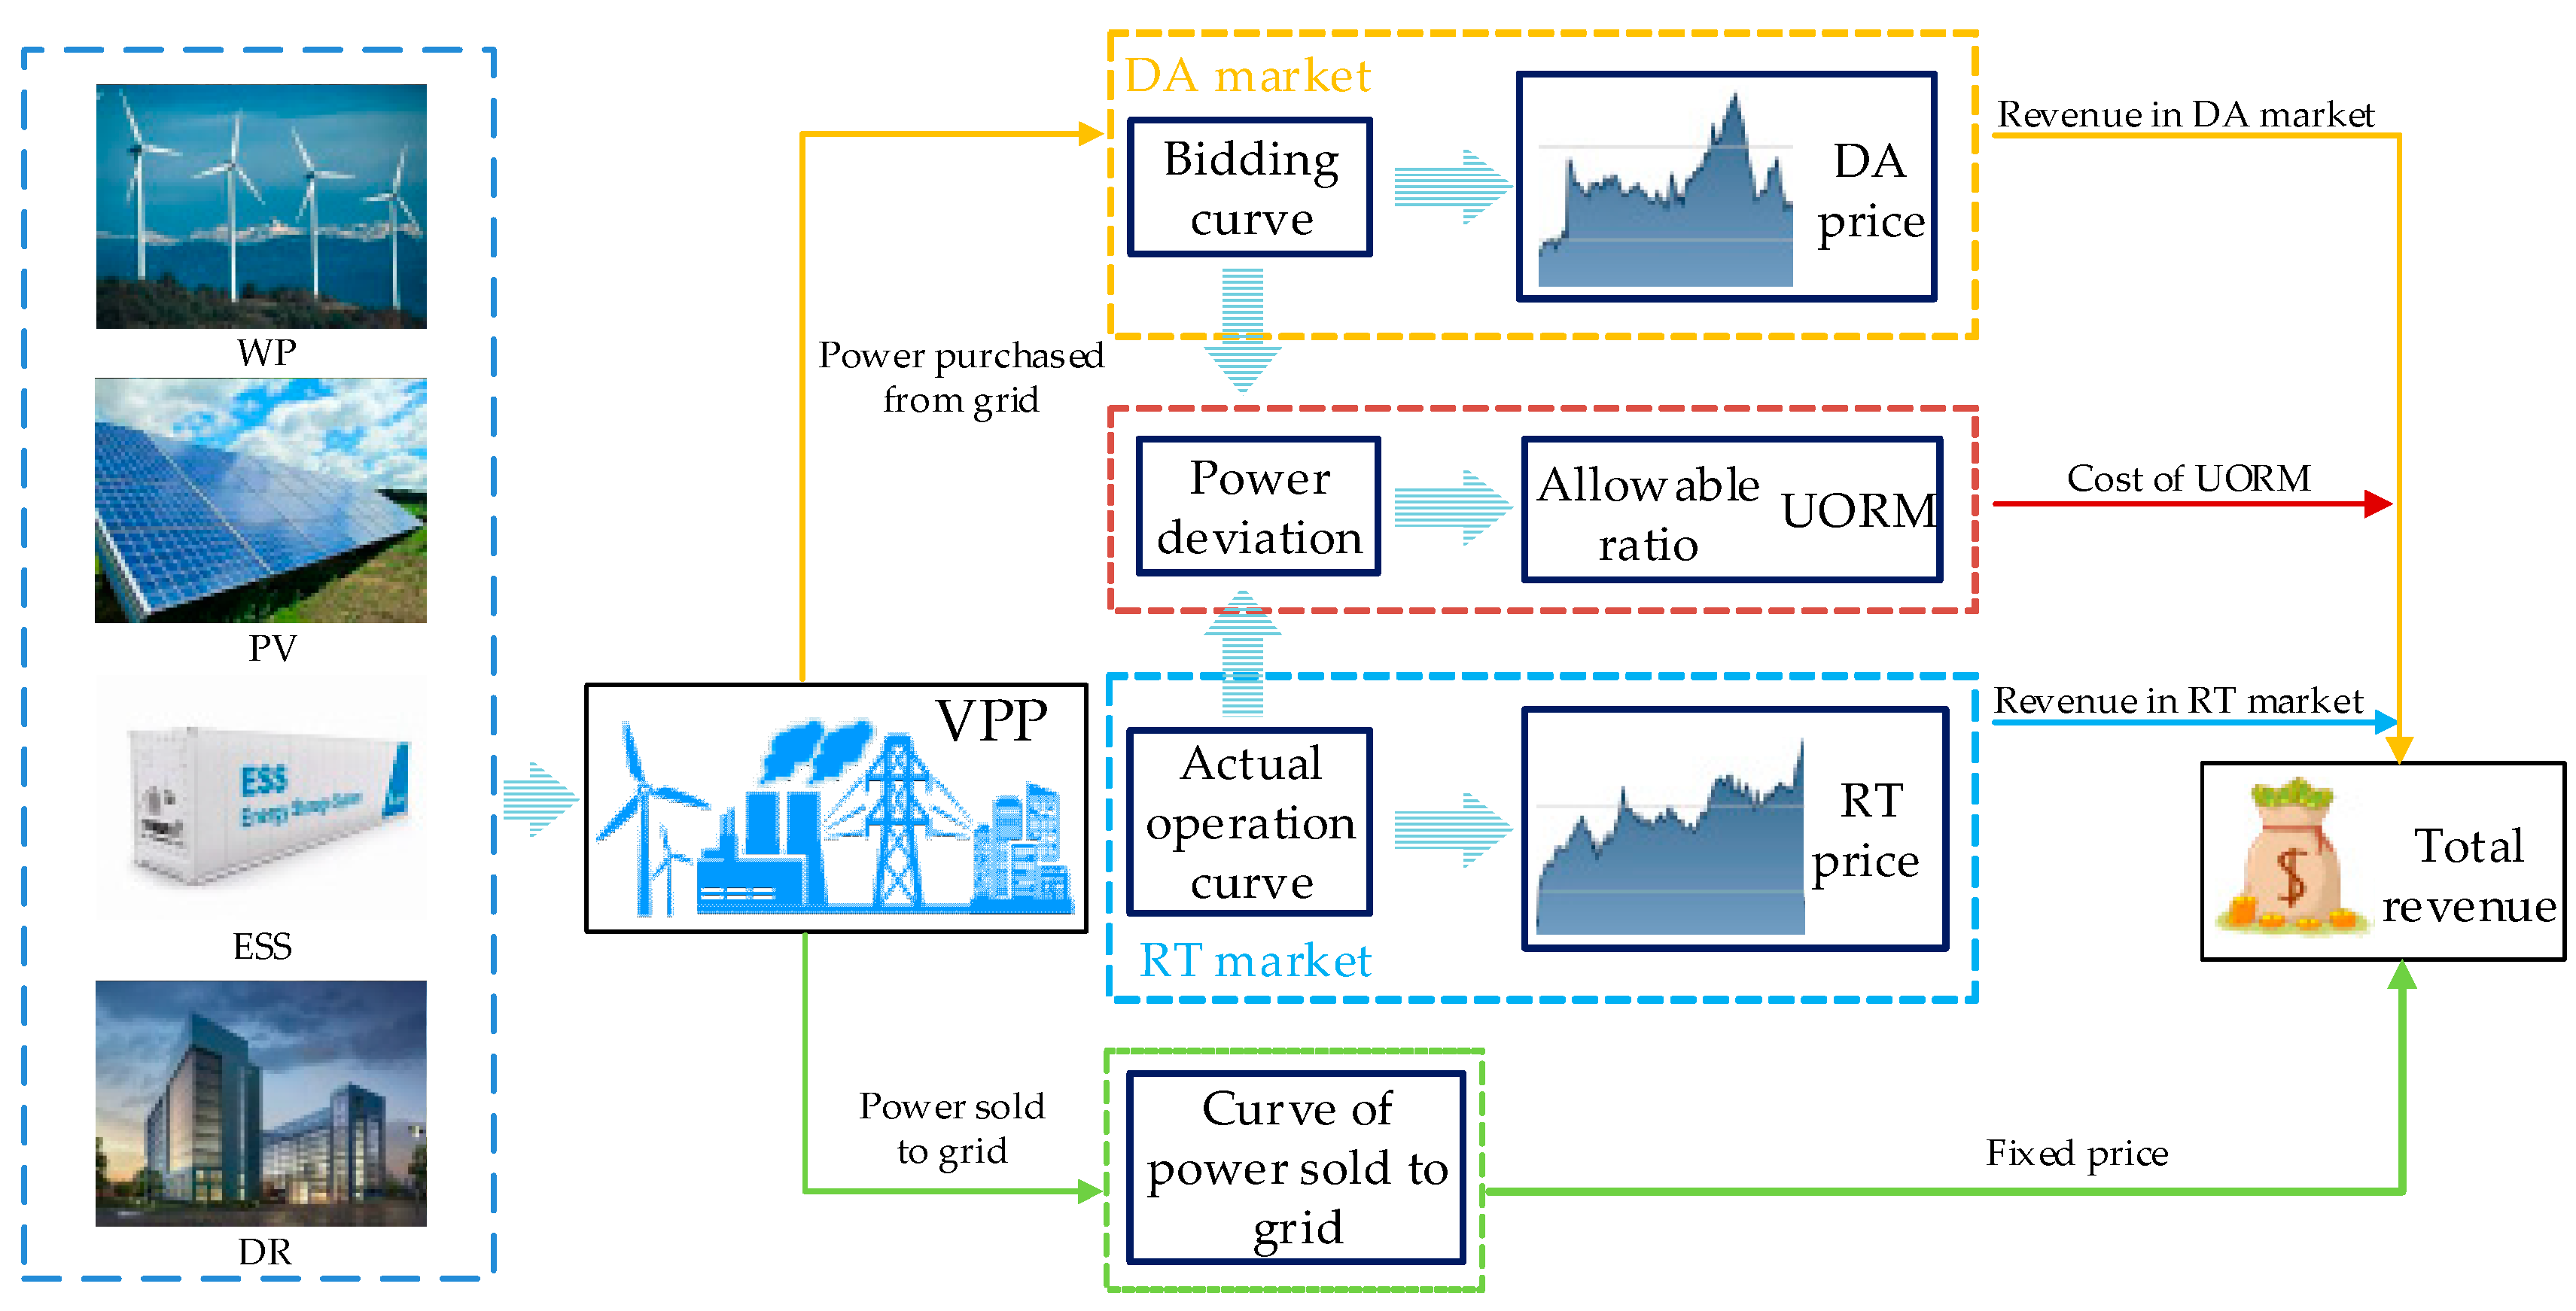
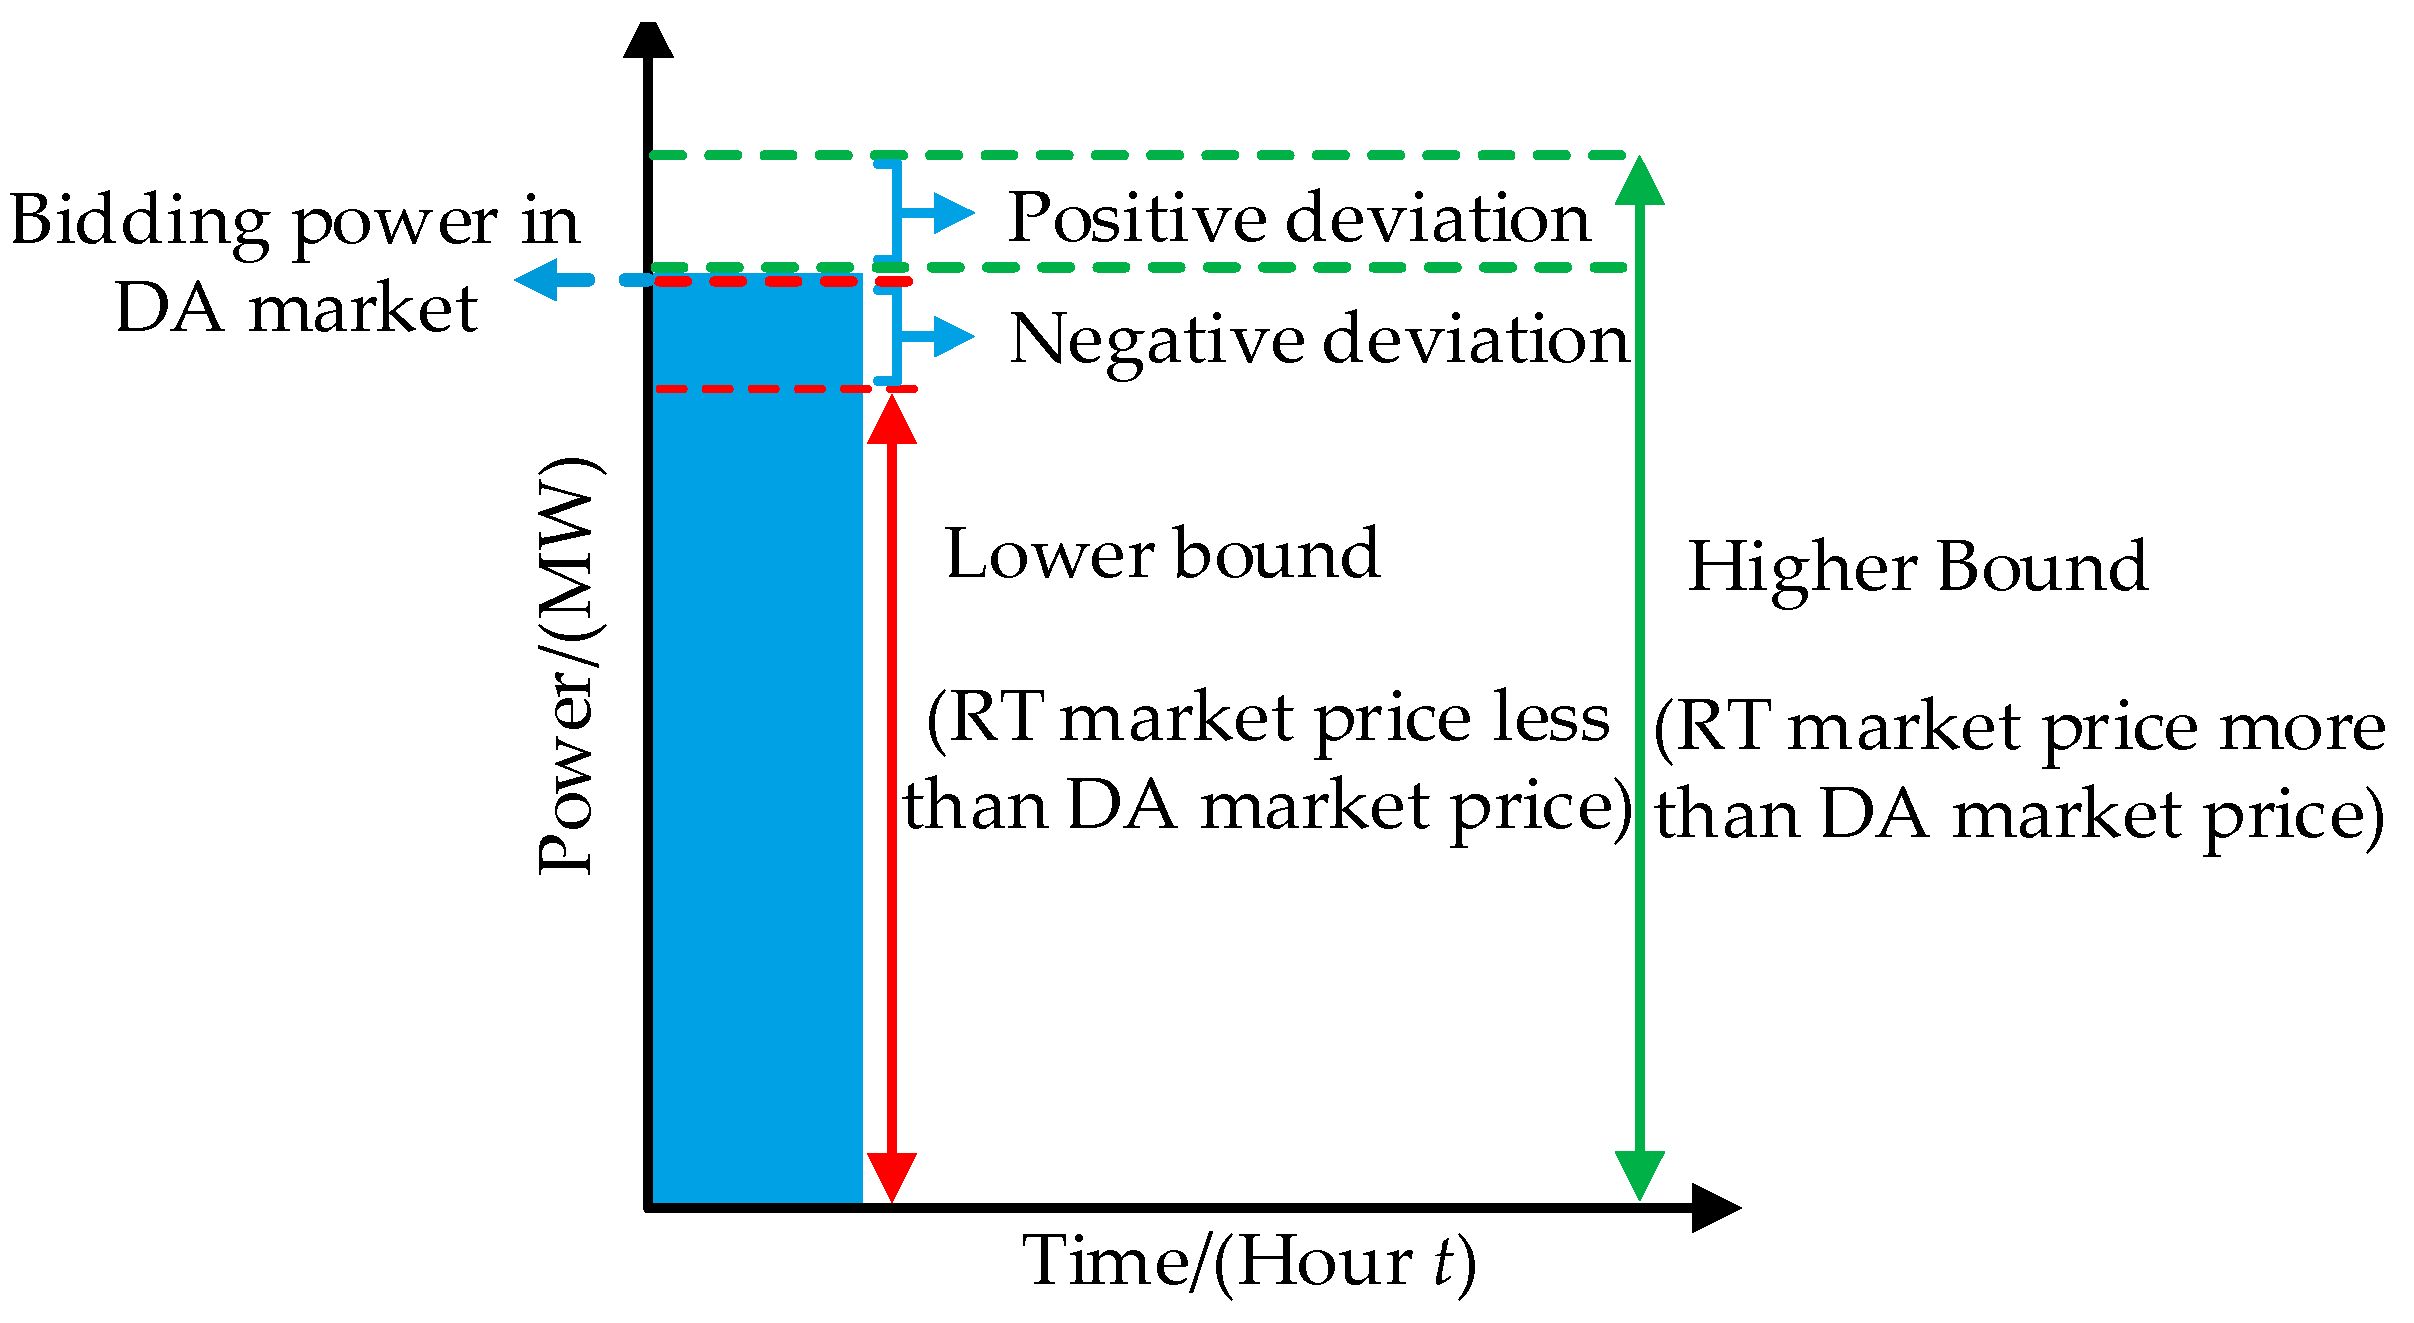
  • The trading mechanism of China’s electricity spot market is introduced. Specifically, the DA and RT markets together with the UORM trading rule, are illustrated in detail to elaborate on the China electricity spot market.
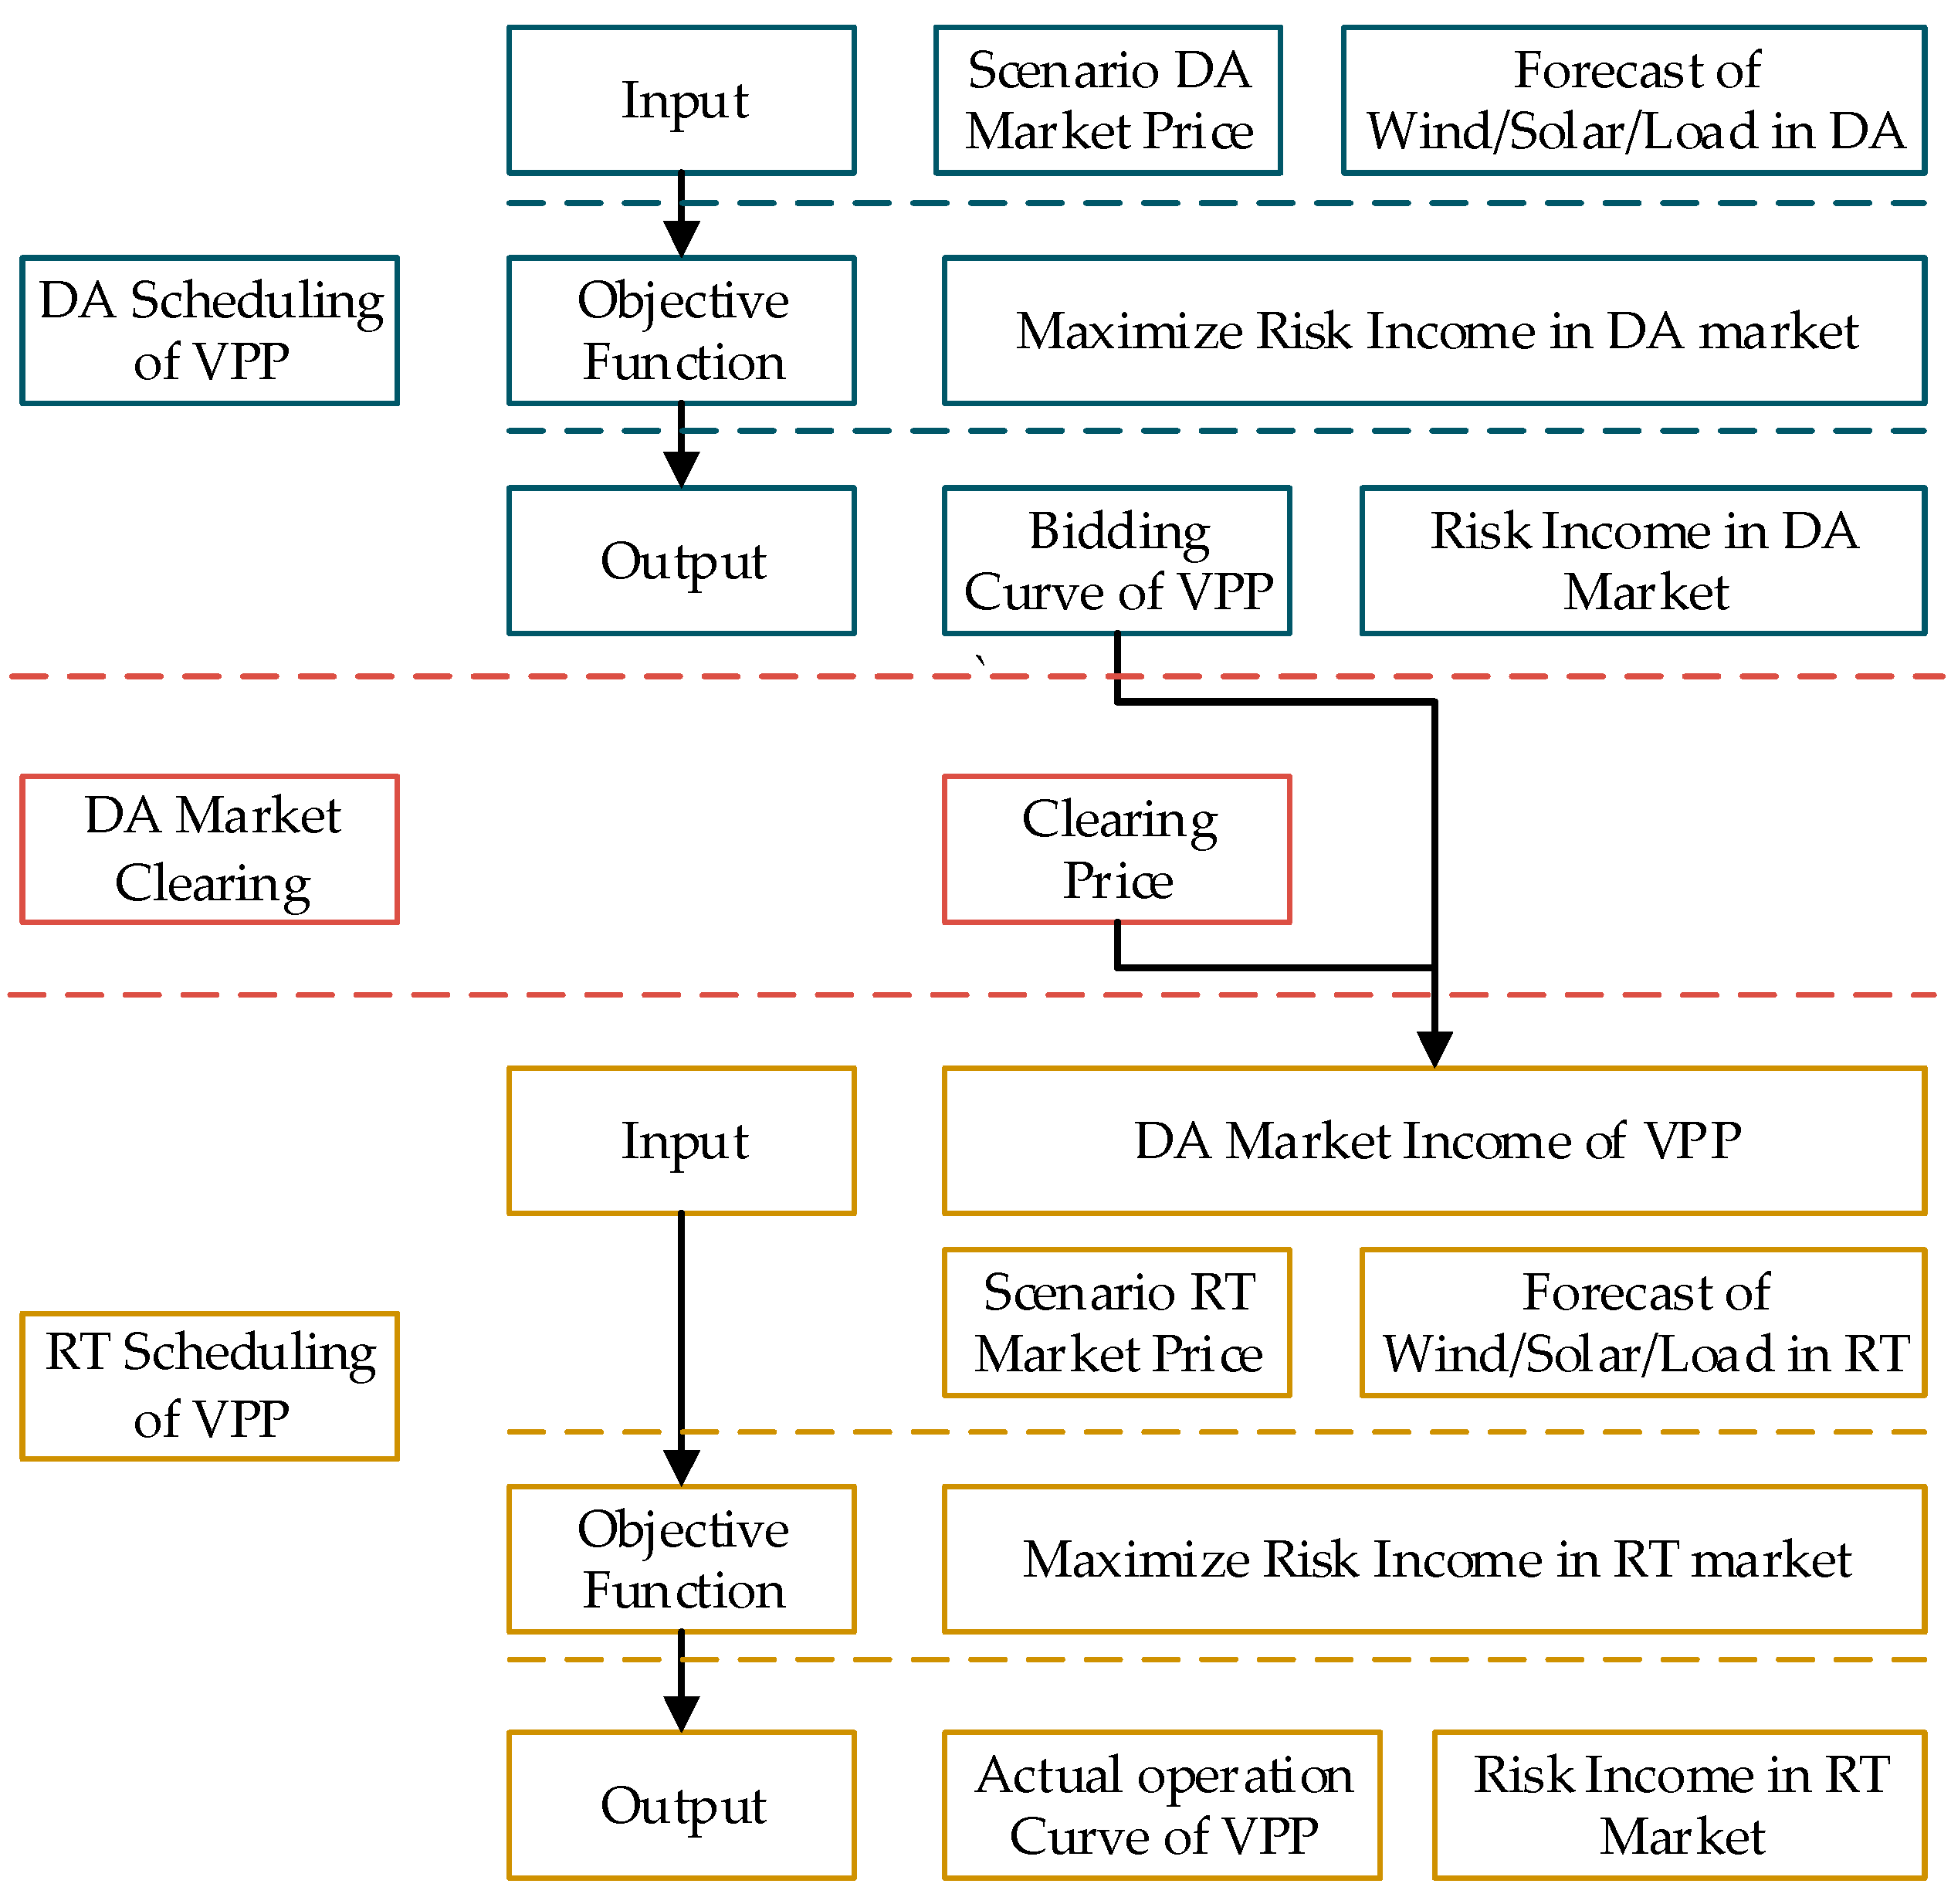
  • A two-stage scheduling model of the VPP incorporating the market rules of China’s electricity spot market is proposed. In detail, the first stage of the model decides the bidding curves of VPP in the DA market while the second stage regulates its actual operation curve in the RT market. Via the proposed mechanism, the behaviors of VPP internal resources and its overall output in the DA/RT market can be optimized.
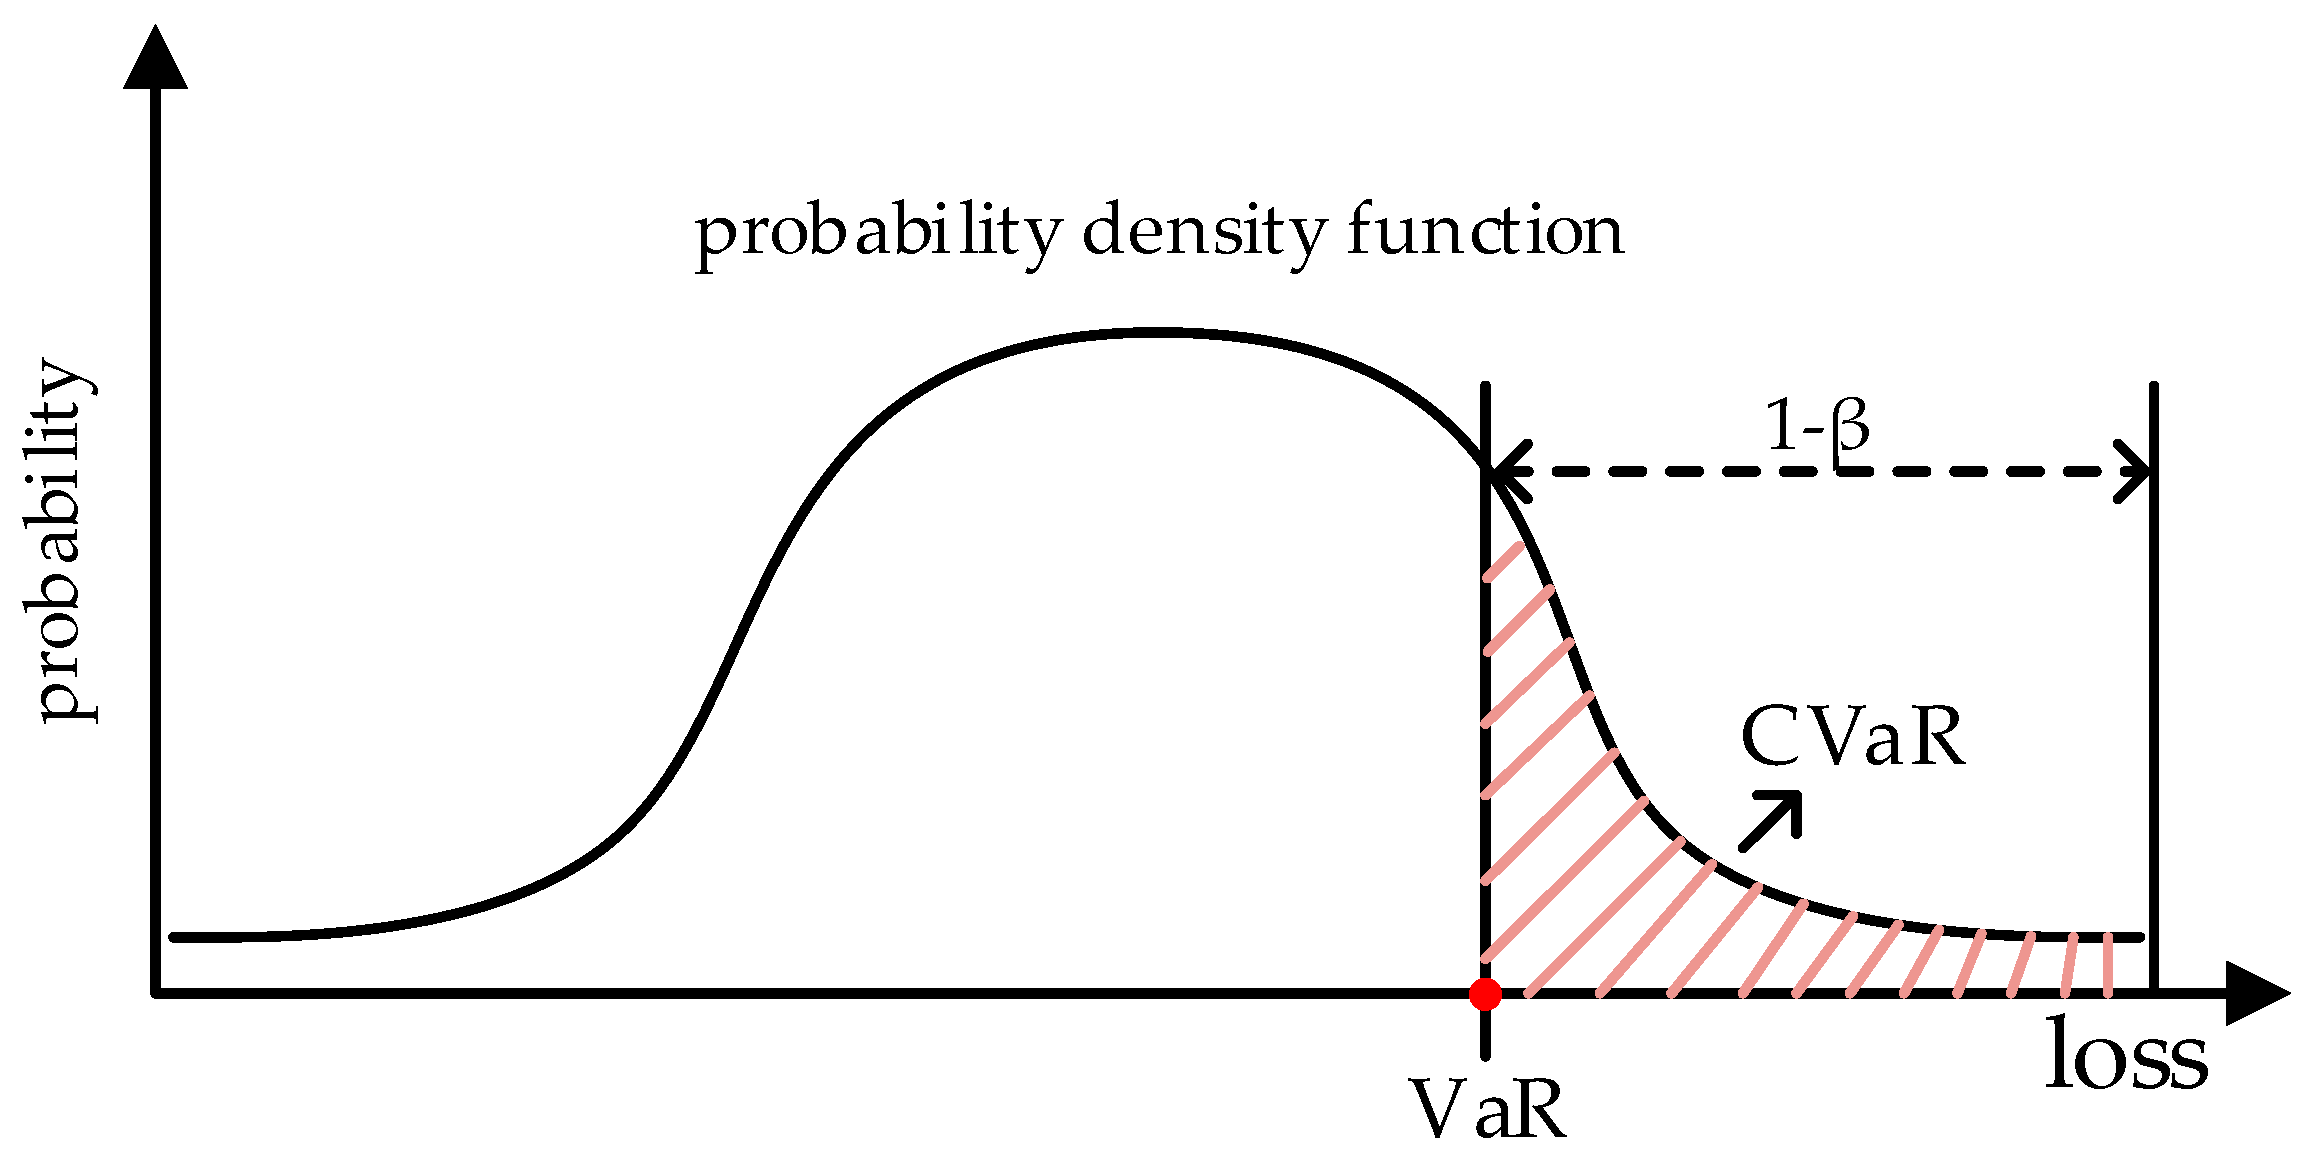
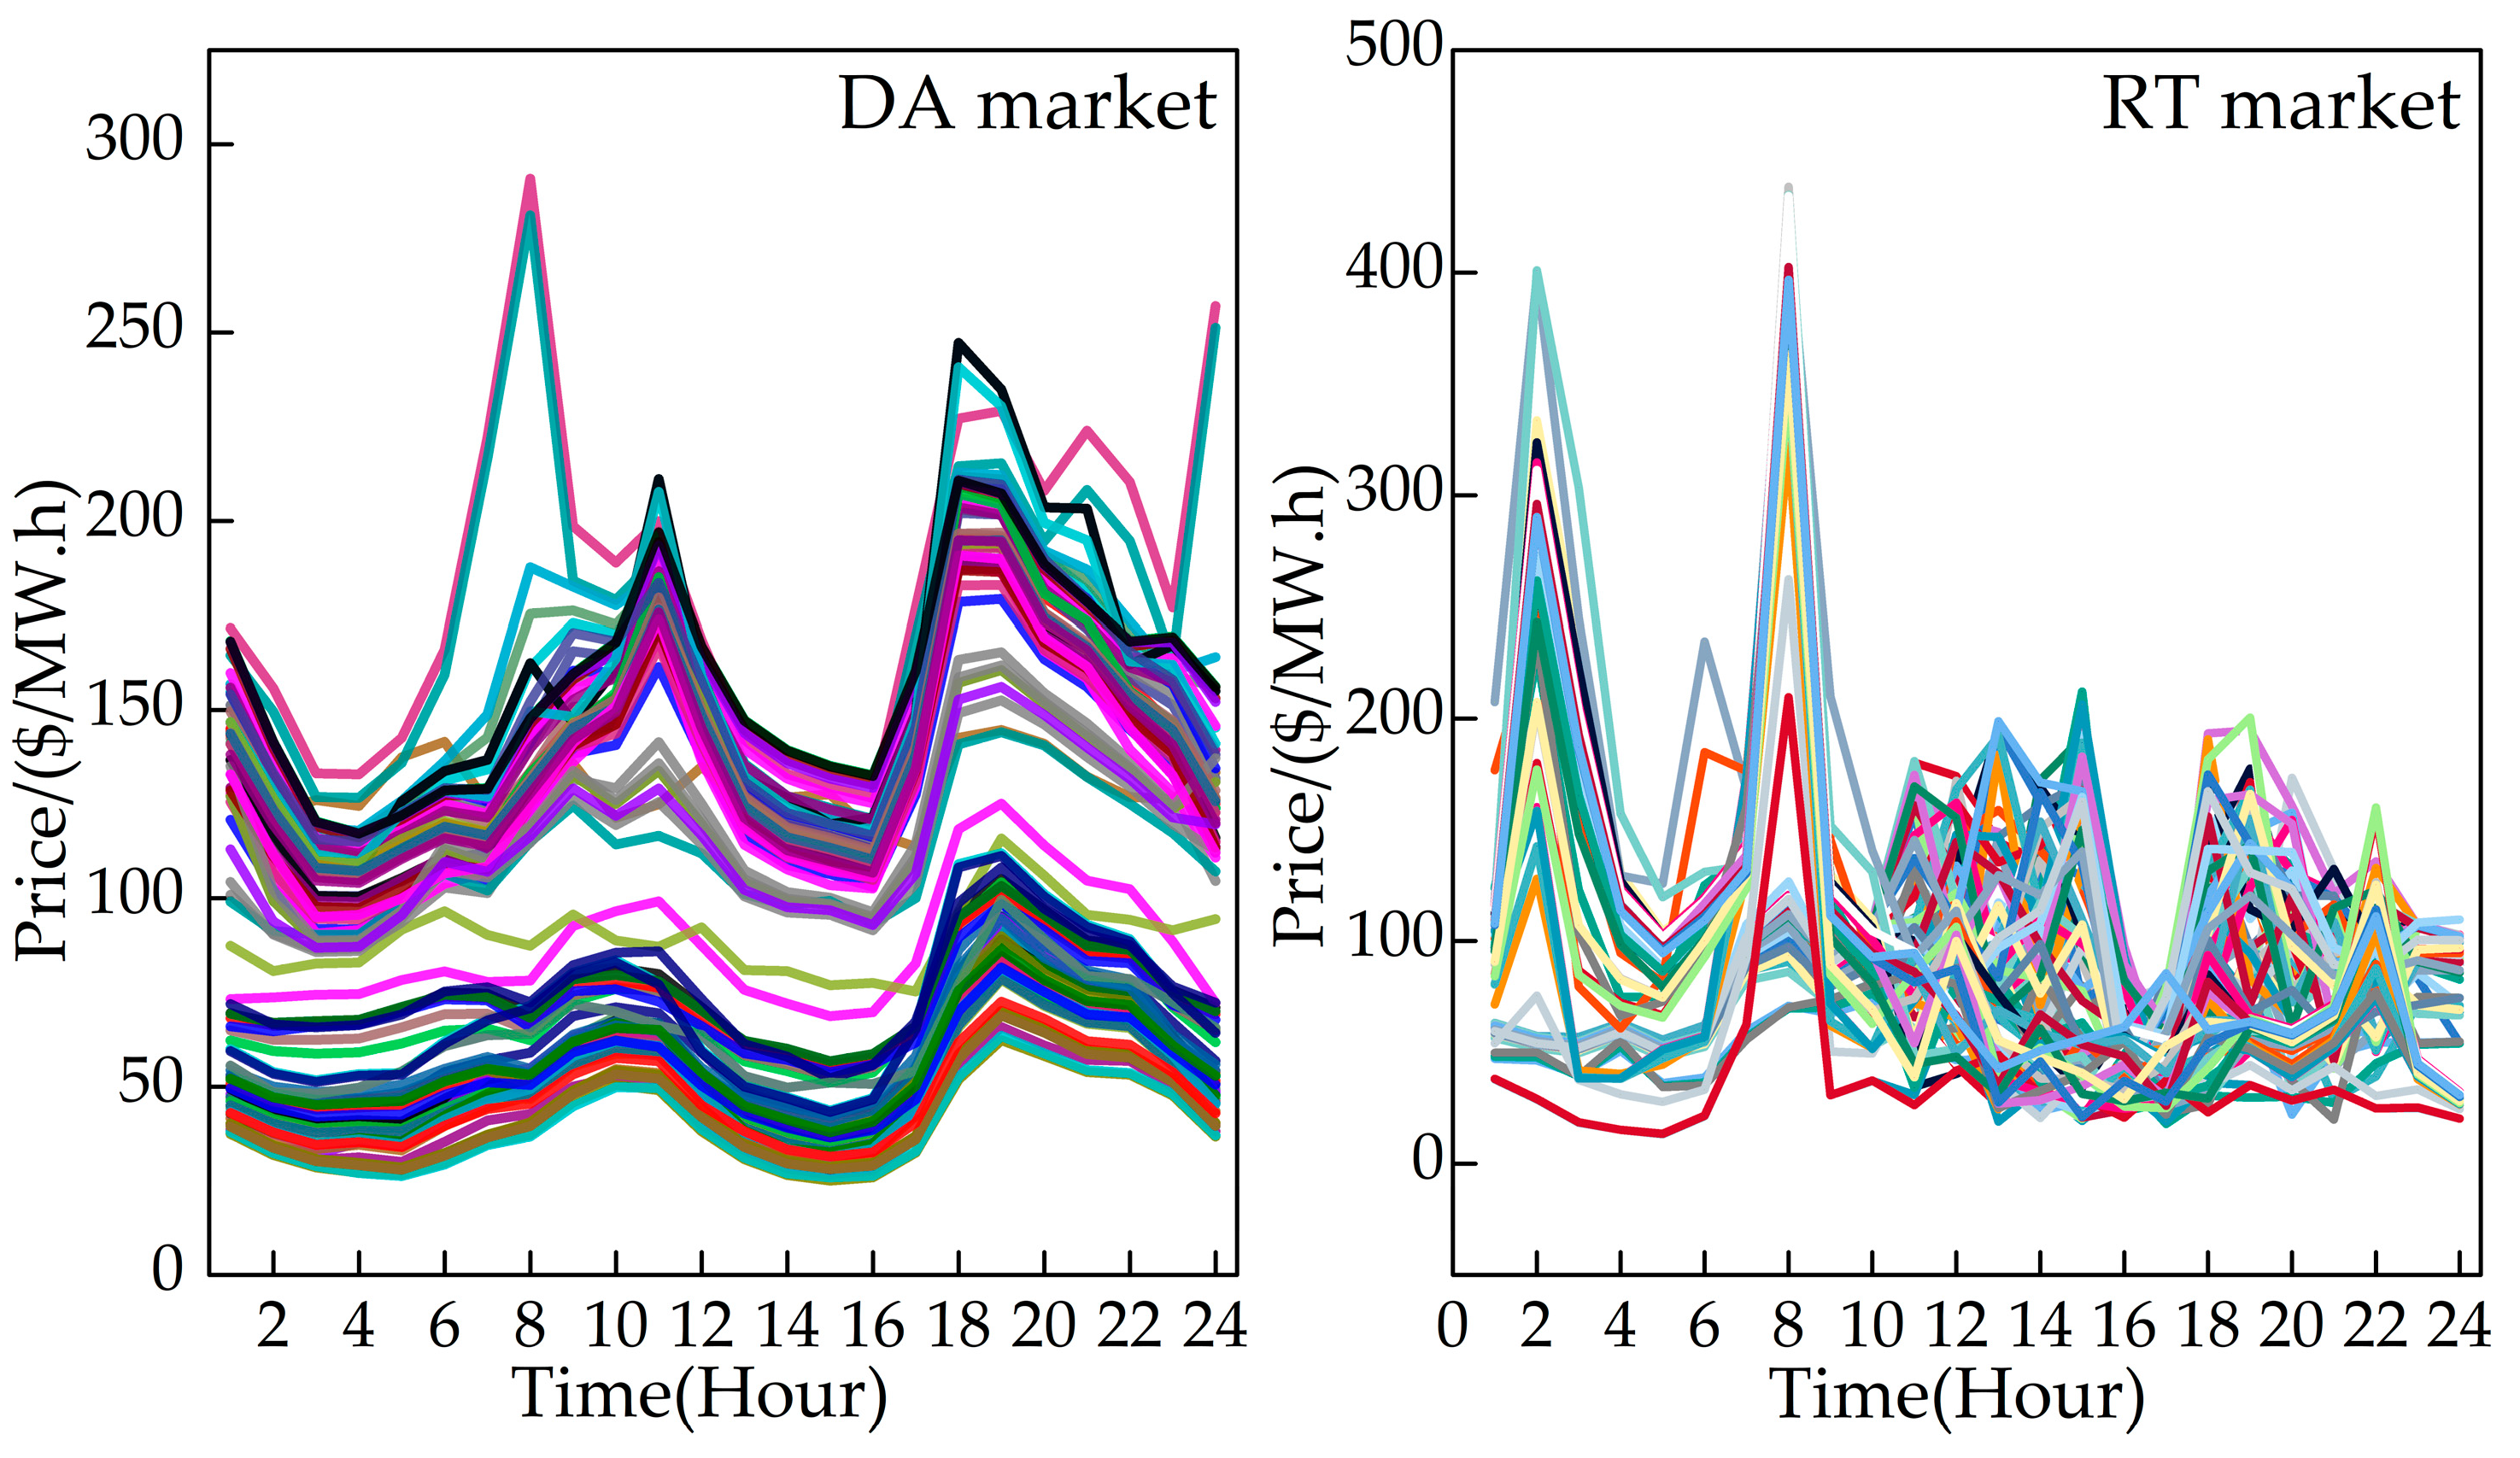
  • The uncertainty of market price is studied. Specifically, the CVaR is adopted to investigate the influence of price uncertainties on VPP behaviors, and the income considering price uncertainty and VPP output and have been comprehensively evaluated.
  • The influence of the UORM on the revenue of the VPP is also analyzed. This gives more insights into user behaviors and demonstrates that the VPP can help mitigate the deviation between the bidding curve and the actual operation curve.
The remainder of this paper is organized as follows: Section 2 describes the trading mechanism of China’s electricity spot market. Section 3 puts forward the participation framework of VPP and its two-stage scheduling model. Section 4 introduces the theory of the CVaR. Section 5 presents a case study and simulation results. Finally, Section 6 concludes the paper.

2. Trading Mechanism of China Electricity Spot Market

Currently, the Chinese power market includes an energy market and an auxiliary service market. The “spot market” discussed in the paper refers to the energy market, and it consists of the DA and RT market. The characteristics of the electricity spot market are introduced below.
(1) Centralized optimization of market power
The market participants must bid for their plan of power production and consumption in the DA market, meaning that all the electricity must be traded on the spot market. The electricity would then be settled based on the 24-h prices calculated by the system control center, rather than the traditional mode where the difference in power between the long-term contract and spot market is settled in the spot market.
(2) Nodal price
The spot market price is formulated by the control center of the grid based on the method of “SCUC (Security Constrained Unit Commitment)” and “SCED (Security Constrained Economic Dispatch)”, considering constraints such as network security, load forecast, etc. [26]. When calculating a market price, the SCUC is the first step and applied to arrange the start-up condition of generation. Then the SCED is used to calculate node price based on the result of the SCUC. Instead of price formulation through free trading, the nodal price can reflect the value of power in both space and time, considering operational constraints of the power grid. Specifically, electricity retailers, such as the VPP, are assumed to be price takers in China, which means their bids contain only the amount of electricity without price. Furthermore, the virtual settlement node is set as their price node, and the price is weighted by all the power nodes in the traded area.
(3) DA market + RT market
The electricity spot market contains the DA market and RT market with 24-h prices. Spot market trade begins in the DA market, i.e., the participants should submit their bid before 13:00 pm a day ahead and their bidding curves will be settled according to the clearing price of the DA market. In the RT market, the node prices will be recalculated according to the latest power grid status and short-term load forecasting data. The deviation between the actual consumption of the participants and the bidding curves of the DA market is then settled with the RT market price.
(4) UORM
Since the power market is not mature in China and is in the early construction stage of the electricity spot market, the price difference between the DA market and the RT market can be great without a virtual bidding mechanism. Therefore, the UORM is proposed to avoid over-bidding or under-bidding for the DA and RT markets. The UORM contains two situations, and can be expressed as below:
C re , l ( t ) = ( E RT ( t ) E DA ( t ) ) ( P buy DA ( t ) P buy RT ( t ) ( 1 + λ ) ) P buy DA ( t ) > P buy RT ( t ) ( 1 + λ ) E RT ( t ) > E DA ( t )
C re , m ( t ) = ( E DA ( t ) E RT ( t ) ) ( P buy RT ( t ) ( 1 λ ) P buy DA ( t ) ) P buy DA ( t ) < P buy RT ( t ) ( 1 λ ) E RT ( t ) < E DA ( t )
where λ denotes the allowable deviation ratio; E DA ( t ) and E RT ( t ) denote the DA market price and the RT market price; C re , l ( t ) and C re , m ( t ) denote the cost caused by the less and more bidding quantity with the allowable ratio at time t, respectively. Formula (1) can be elaborated as below: When the RT market price is higher than the DA market price at hour t , the income caused by the bidding quantity which is higher than the actual consumption by 1 + λ times shall be confiscated. Conversely, Formula (2) elaborates that when the RT market price is lower than the DA market price at hour t , the income caused by the bidding quantity which is lower than the actual consumption by 1 − λ times shall be confiscated. In brief conclusion, the mechanism uses the method of income control to balance the arbitrage of the participants in the spot market and regulate the market behavior. The framework of this mechanism is shown in Figure 1.

3. VPP Model Formulation

The VPP participants in this paper include load, wind plants (WP), PV (Photovoltaic) plants, ESS and DR. As an electricity retailer, the VPP contracts and provides the DR service with its internal load; as a spot market participant, the VPP needs to bid in the DA market and operates its DERs to improve its economic income in the RT market. With DERs, the VPP will face a two-way flow. When its internal power production is more than the power consumption, power flows from the VPP to the power grid, which is settled with fixed prices. Conversely, when its internal power production is lower than the power consumption, power flows from the power grid to the VPP, which is bought and settled with spot market prices. The framework of VPP participating in the spot market is shown in Figure 2.
The detail models considered for the VPP are given below:
(1) Load model
Load refers to the power load of the end-users managed by the VPP. It consists of load with no elasticity and demand response. As an electricity retailer, the VPP supplies electricity to the load and obtains profit, while the model is given below:
R load DA , RT = P load DA , RT ( t ) E sell load ,
where R load DA , RT and P load DA , RT ( t ) denote the income and output of power load in the DA/RT market, respectively; E sell load denotes the electricity price of the VPP contracts with the end-users; t denotes the timeslot t in this paper.
(2) Demand response model
The demand response is modeled as part of the load in this paper and is given below:
0 P dem DA , RT ( t ) θ ( t ) P load DA , RT ( t ) ,
where θ ( t ) and P dem DA , RT ( t ) denote the max allowed load ratio of demand response, and the demand response scheduling amount in the DA/RT market, respectively.
Demand response will cause load reduction and reduce electricity profit of the VPP. The profit of the DR is formulated as below:
C dem DA , RT = t = 1 24 ( C dem op + E sell load ) P dem DA , RT ( t ) ,
where C dem op and C dem DA , RT denote the operating cost and profit of DR in DA/RT market, respectively.
(3) Diesel generation model
The constraint for the diesel generation output is given as below:
P die , min P die DA , RT ( t ) P die , max ,
where P die , min and P die , max denote the maximum and minimum allowed limits of diesel; P die DA , RT ( t ) denotes the output of diesel generation in the DA/RT market.
Diesel generation operating cost includes the operating cost and maintenance cost, and is given as below:
C die DA , RT = C oil op t = 1 24 P die DA , RT ( t ) Q + C pol op t = 1 24 P die DA , RT ( t ) ,
where Q , C oil op , and C pol op denote the unit power diesel consumption, unit diesel consumption cost, and unit pollution cost, respectively; C die DA , RT denotes the operating cost of diesel generation in the DA/RT market.
(4) ESS model
The operation of the ESS includes limits for the state of charge, discharge, and charge output, and can be modeled as below:
P st DA , RT ( t ) = η st P cha DA , RT ( t ) δ cha DA , RT ( t ) P dis DA , RT ( t ) η st δ dis DA , RT ( t ) ,
S OC st DA , RT ( t ) = S OC st DA , RT ( t 1 ) + P st DA , RT ( t ) S st ,
where P cha DA , RT ( t ) and P dis DA , RT ( t ) denote the ESS charge and discharge output in the DA/RT market, respectively; δ cha DA , RT ( t ) and δ dis DA , RT ( t ) are binary variables of the ESS representing charge and discharge status, respectively; S OC st DA , RT ( t ) and P st DA , RT ( t ) denote the state of charge and ESS output in the DA/RT market, respectively. Parameter η st and S st are charge/discharge efficiency of the ESS and its capacity, respectively.
The ESS constraints include charge and discharge limit, state of charge limit, the contradictory limit for charging and discharging status, and they are given below:
0 P cha DA , RT ( t ) P st , max ,
0 P dis DA , RT ( t ) P st , max ,
0 S OC st DA , RT ( t ) S OC max ,
0 δ cha DA , RT ( t ) + δ dis DA , RT ( t ) 1 ,
where P st , max denotes the ESS maximum charge/discharge output; S OC max denotes the maximum state of charge limit of the ESS.
The ESS operating cost is given as below:
C st DA , RT = t = 1 24 C st op P st DA , RT ( t ) ,
where C st op denotes the ESS unit operating cost and C st DA , RT denotes the operating cost in the DA/RT market, respectively.
(5) VPP energy balance constraint
The VPP exchanges energy with the power grid. When electricity production is surplus, the VPP sells power to the grid; conversely, the VPP purchases power from the grid. The model is given below:
P cha DA , RT ( t ) δ cha DA , RT ( t ) + P load DA , RT ( t ) P dem DA , RT ( t ) + P buy DA , RT ( t ) = P pv DA , RT ( t ) + P wind DA , RT ( t ) + P die DA , RT ( t ) + P dis DA , RT ( t ) δ dis DA , RT ( t ) + P sell DA , RT ( t )
where, P buy DA , RT ( t ) , P sell DA , RT ( t ) , P wind DA , RT ( t ) , and P pv DA , RT ( t ) denote the power bought from the grid, the power sold to the grid, the WP and PV output in the DA and RT market, respectively.
(6) VPP backup constraint
The VPP needs a certain capacity in case of emergency to ensure the reliability of power supply. The constraint is given as below:
P die , max P die DA , RT ( t ) + K ( t ) P load DA , RT ( t ) P dem DA , RT ( t ) R ( t ) ,
where R ( t ) and K ( t ) denote the requirement of backup and backup coefficients, respectively.

4. Two-Stage Scheduling CVaR Model

4.1. CVaR Theory

The CVaR is a popular tool of risk measurement [27,28]. Compared with the VaR (risk value), it only considers the risk information under confidence level, while the risk information behind the confidence level is ignored. The CVaR measures the average loss behind the confidence level, and the inclusion of tail risks can better reflect the portfolio risks. The framework of the CVaR is demonstrated in Figure 3.
Denote the loss function as f ( x , y ) , where x and y denote the probability density function of the decision variable and the random variable, respectively. The probability density function of y is defined as ρ ( y ) , then the VaR value at confidence level β is given as below:
α β ( x ) = min { α R ; f ( x , y ) α ρ ( y ) d y β } .
The CVaR is defined as the conditional mean of the loss of the VaR over the same confidence level β and is denoted as ϕ β ( x ) . The calculation of the CVaR is given below:
ϕ β ( x ) = E [ f ( x , y ) | f ( x , y ) α β ( x ) ] = 1 1 β f ( x , y ) α β ( x ) f ( x , y ) ρ ( y ) d y
To ease the calculation for the solution, a relatively simple function is normally used to represent the CVaR value as:
F β ( x , α ) = α + 1 1 β y R [ f ( x , y ) α ] + ρ ( y ) d y ,
[ f ( x , y ) α ] + = max [ 0 , f ( x , y ) α ] ,
where α denotes the VaR value under confidence level β . Generally, the probability density function ρ ( y ) is difficult to formulate, and the historical data of random variables can be utilized to estimate the above equation with discretization. Then the equation can be changed as
F ˜ β ( x , α ) = α + 1 m ( 1 β ) k = 1 m [ f ( x , y k ) α ] + ,
where F ˜ β ( x , α ) denotes the estimated value of CVaR; and y k denotes the k set of sample data of y , with m groups in total.

4.2. DA Dispatch Model

The VPP needs to decide its 24-h bidding curve in the DA market, and the proposed VPP model combines the expected return and risk. The objective is to maximize the VPP economic benefit, and the “risk income” is introduced to represent the goal of VPP dispatch. The risk income equals the summation of the average income of the VPP under a scenario price and the CVaR value, considering both risk and economic income. The objective function of risk income in the DA market is given in (22); Formula (23) is the total income of the VPP in the DA market; Formula (24) represents the total cost of the VPP in the DA market; and Formula (25) denotes the auxiliary equation. These formulas are given as below:
max : g DA = 1 N ω = 1 N ( R DA ( ω ) C DA ( ω ) ) + μ DA ( ζ 1 N ( 1 β ) ω = 1 N z ω ) ,
R DA ( ω ) = P sell DA ( t ) E sell grid + R load DA + ( P wind DA ( t ) + P pv DA ( t ) ) γ ,
C DA ( ω ) = C st DA + C die DA + C dem DA + E buy DA ( t ) P ω DA ( t ) ,
ζ ( R DA ( ω ) C DA ( ω ) ) z ω z ω 0 ,
where g DA denotes the risk income function of the DA market, γ denotes the subsidy of renewable energy; N , β and μ DA denote the scenario number, confidence level, and risk preference coefficient in the DA market, respectively; ζ and z ω denote the auxiliary variables. In addition, the model is subject to the constraints (1), (2), (4), (6), (8), (9)–(13), (15) and (16).

4.3. RT Dispatch Model

After DA market clearing, the income and bidding curve are determined. The RT market dispatch is based on clearing results of the VPP in the DA market. The income of the VPP after clearing in the DA market is given below:
R clear DA = t = 1 24 ( P sell DA ( t ) E sell grid P buy DA ( t ) E clear DA ( t ) + P load DA ( t ) P sell load ) C st DA C die DA C dem DA ,
where R clear DA denotes the VPP income after clearing in DA market; E clear DA ( t ) denotes the price in the DA market.
The cost caused by the UORM is given in Formula (27), and Formula (28) is an auxiliary equation. These two formulas are given below:
C dev ( ω ) = t = 1 24 abs ( E ω DA ( t ) E ω RT ( t ) ) l ω ( t ) ,
l ω ( t ) sign ( E DA ( t ) E RT ( t ) ) ( P buy RT ( t ) P buy DA ( t ) ) λ E buy RT ( t ) l ω ( t ) 0 ,
where C dev ( ω ) denotes the cost caused by the UORM under scenario ω , abs ( x ) denotes the absolute value function; sign ( x ) denotes the symbol judgment function, which equals 1 when x is greater than zero and equals -1 when x is less than zero; and l ω ( t ) is an auxiliary variable.
The objective is to maximize the VPP risk income in RT market and is given in (29); Formula (30) denotes the total income of the VPP in the RT market; Formula (31) represents the total cost of the VPP in the RT market; and Formula (32) is the auxiliary equation. These formulas are given below:
max : g RT = 1 N ω = 1 N ( R RT ( ω ) C RT ( ω ) C dev ( ω ) ) + μ RT ( ε 1 N ( 1 β ) ω = 1 N q ω ) R clear DA ,
R RT ( ω ) = P sell RT ( t ) E sell grid + R load RT + ( P wind RT ( t ) + P pv RT ( t ) ) γ ,
C RT ( ω ) = C st RT + C die RT + C dem RT + E buy RT ( t ) ) P ω RT ( t ) ,
ε ( R RT ( ω ) C RT ( ω ) C dev ( ω ) ) q ω q ω 0 ,
where g RT and μ RT denote the risk income function and risk preference coefficient in the RT market; ε and q ω are two auxiliary variables. In addition, the model is subject to the constraints (1), (2), (4), (6), (8), (9)–(13), (15) and (16), (26)–(28).

4.4. Solving Mechanism

The two-stage dispatch model proposed includes DA scheduling and RT scheduling. In DA scheduling stage, the VPP decides its bidding curve according to the DA market scenario and forecast data of DA. After DA market clearing, the DA market price is released, so the income of the VPP in the DA market is determined. In the RT scheduling stage, the VPP regulates its actual operation curve according to the bidding curve and income of the DA market, the RT market scenario, and forecast data of RT. Based on the above analyses, the solving framework of the optimization model is given in Figure 4.

5. Case Study

The simulation was set to study the scheduling problem of VPP in China spot market and includes the scheduling behavior of VPP in DA and RT market; the impact of the risk preference coefficient; the impacts of the allowable deviation ratio and ESS on the scheduling results of VPP. The simulation cased were executed using CPLEX under MATLAB (MATLAB 2016b, Natick, Massachusetts, USA), on an Intel Core i5-46300 computer with 8 GB of RAM 4.

5.1. VPP Parameters

A VPP consists of load, DR, a PV, a WP, and an ESS was considered. The scenario prices of the DA and RT market adopted in the CVaR model are presented in Figure 5, and the number of scenarios was 100 for the DA and RT market. The parameters of E sell , γ , C dem op , θ ( t ) and β were set as 50 $/MWh, 15 $/MWh, 20 $/MWh, 0.2 and 0.95, respectively. The electricity price of the VPP was set to be 45 $/MWh. Considering the condition of actual power system operation, it was assumed the price fluctuation of the RT market tends to be more intense than the DA market. The parameters of the ESS, diesel generation, forecasting outputs of wind/solar/load in the DA and RT markets are given in Table 1 and Figure 6.

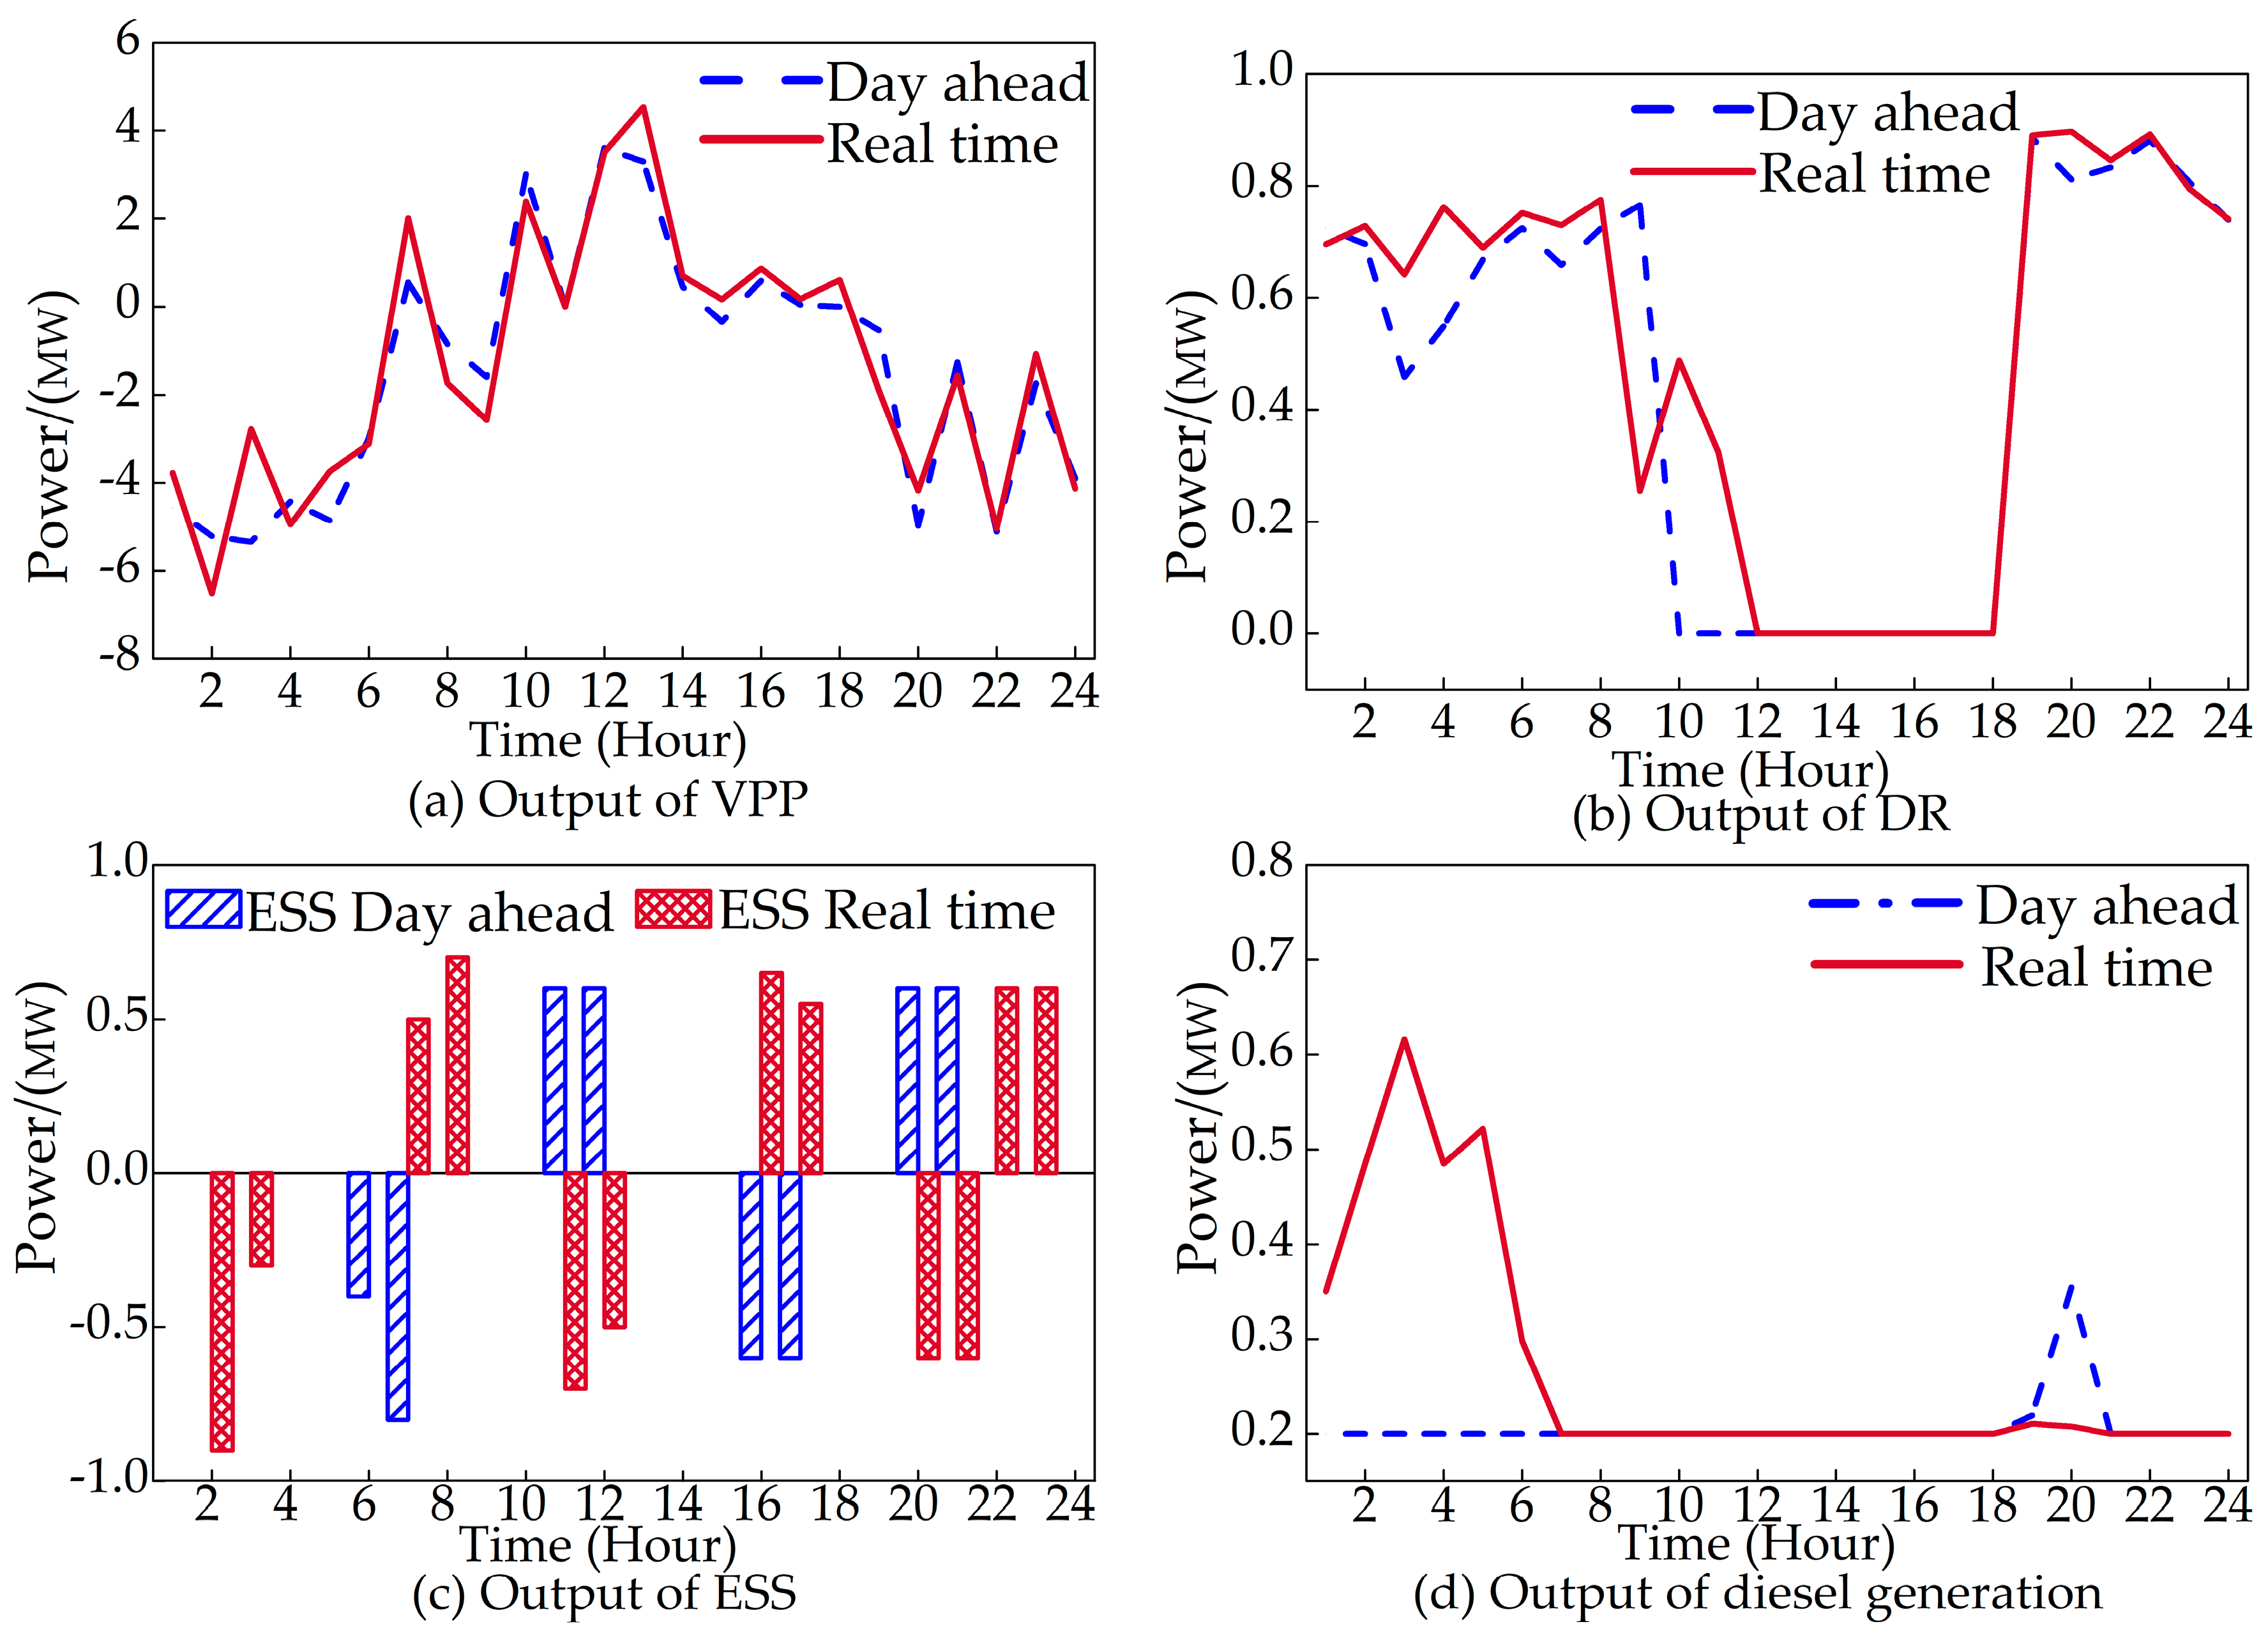
5.2. VPP Scheduling Outcome

The clearing price in the DA market used in (24) is presented in Figure 7.
The scheduling for the VPP in DA and RT market bidding were performed, and the outcome of the different VPP participants is given in Figure 8.
The results show that the proposed two-stage dispatch mechanism can optimize the behaviors of VPP internal resources and its overall output under DA/RT price signals. As demonstrated, in the RT market, the output of ESS, Diesel, DR, and VPP were fluctuated more than the bidding curve in the DA market. Meanwhile, the times of ESS charge and discharge have changed from two to three. Diesel generation maintained its lowest output level in the DA market but increased its output from 1:00 to 7:00 in the RT market. The above output changes of the DERs in the DA and RT market were caused by the fluctuation price of the RT market prices. The above outcome can be explained according to Figure 9.
In Figure 9, the average price of 100 scenarios price of RT Market is displayed. As can be seen, the price differences at hour 1–10 and 18–24 were relatively high. With the varying prices, the DR and diesel generation were motivated to change their outputs from the DA bidding curve, and ESS was promoted to improve its charge/discharge times. Moreover, the price differences of the scenario RT market price were higher than the DA market, which promoted the DERs of the VPP to adjust their DA bidding curve in the RT market to improve its economic income. With the above response, the risk income of VPP has increased from 11,233$ (DA market) to 12,262.4$ (RT market).

5.3. Impact of the Allowable Deviation Ratio

The allowable deviation ratio reflects the fluctuation range allowed between the DA market bidding curve and the actual operation curve, i.e., it denotes the tolerance degree of the regulation department to the arbitrage of the participants between the DA and RT markets. In this part, the impacts of different allowable deviation ratios on the RT market scheduling and the cost caused by the proposed mechanism are explored. For the simulations, μ RT and μ DA were set to be 1, and the results are listed in Table 2.
The outcome shows that the allowable deviation ratio has a negative impact on the risk income of VPP dispatching, but the effect was small. It can be observed from Table 2, the cost only accounts for 0.5% of total risk income. The reasons lie in:
  • The return cost with the allowable ratio was calculated via the price deviation between the DA market and RT market multiplied by the energy deviation of the DA and RT market. The power deviation was generally small. Meanwhile, the product of power deviation and the price difference was also small, so the cost caused by the allowable deviation ratio was not high.
  • The VPP had a variety of DERs, such as the ESS, which can accurately adjust their outputs to cope with the error lead by the prediction values.

5.4. Impact of the Risk Preference Coefficient

The risk preference coefficient directly affects the scheduling outcome of VPP, which impacts its economic income greatly. In the simulations, the parameter γ was set as 0.1. The risk income results with different risk preference coefficients for the RT market and DA market are shown in Figure 10 and Figure 11.

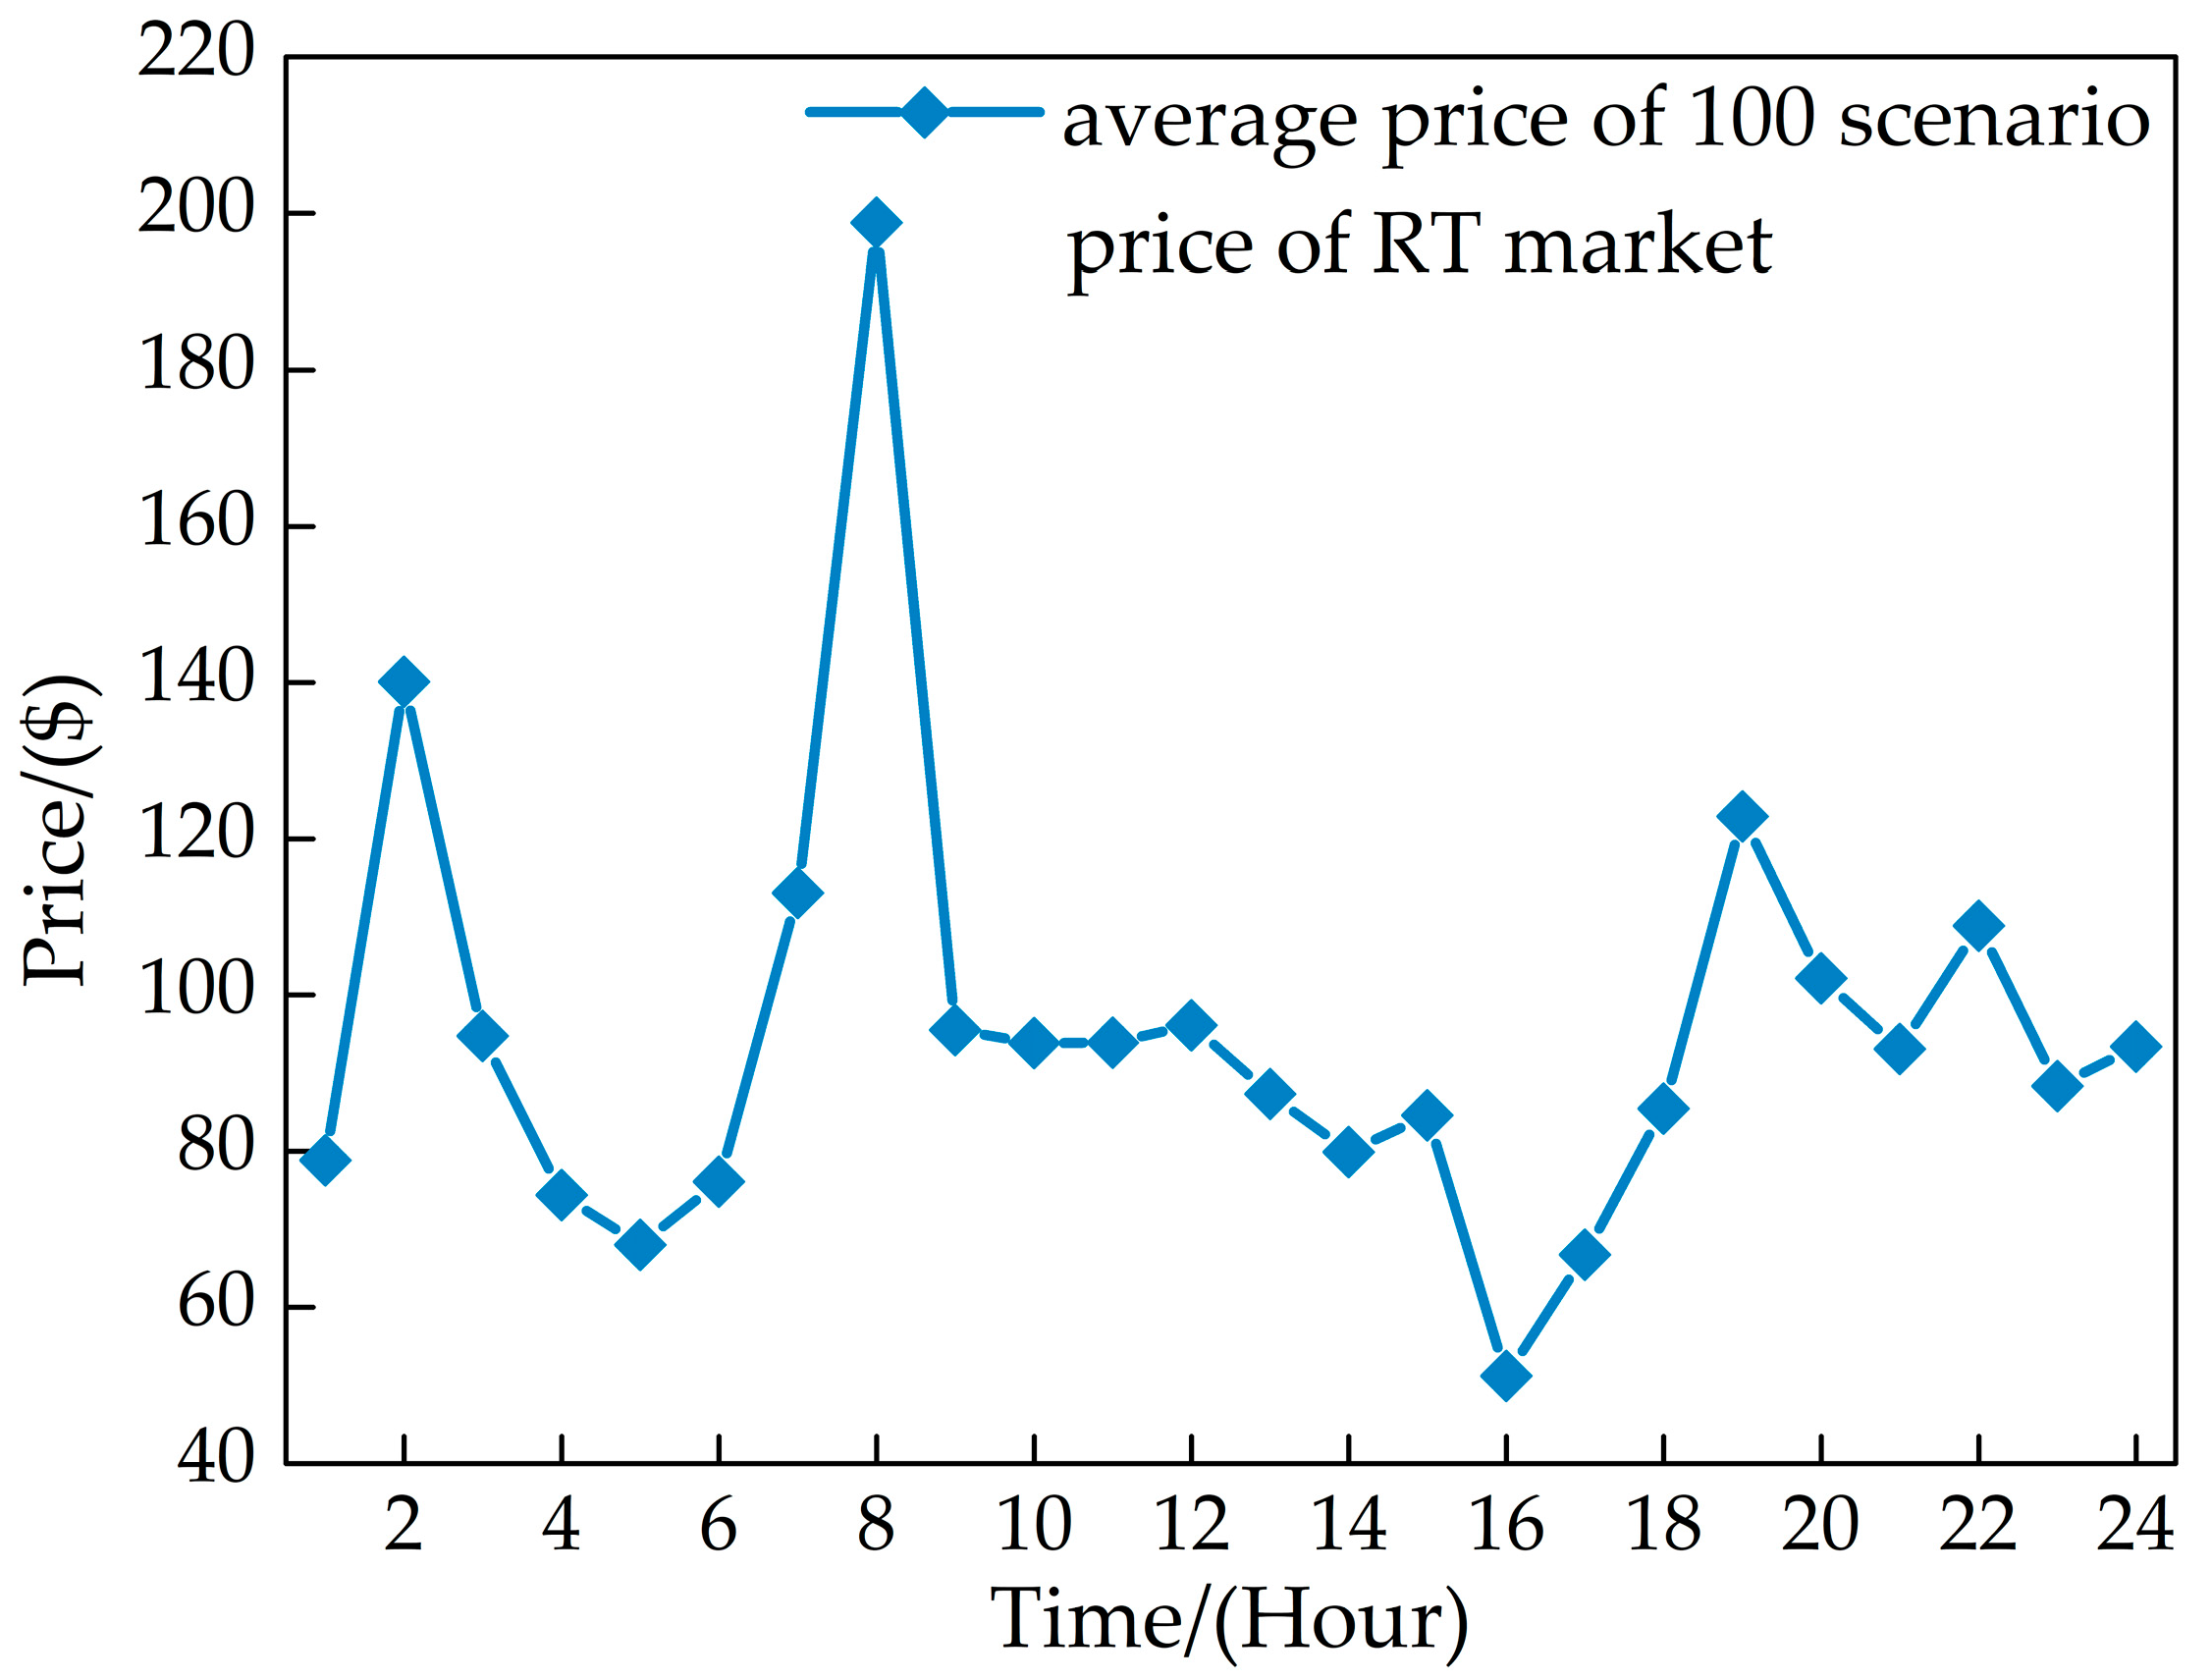
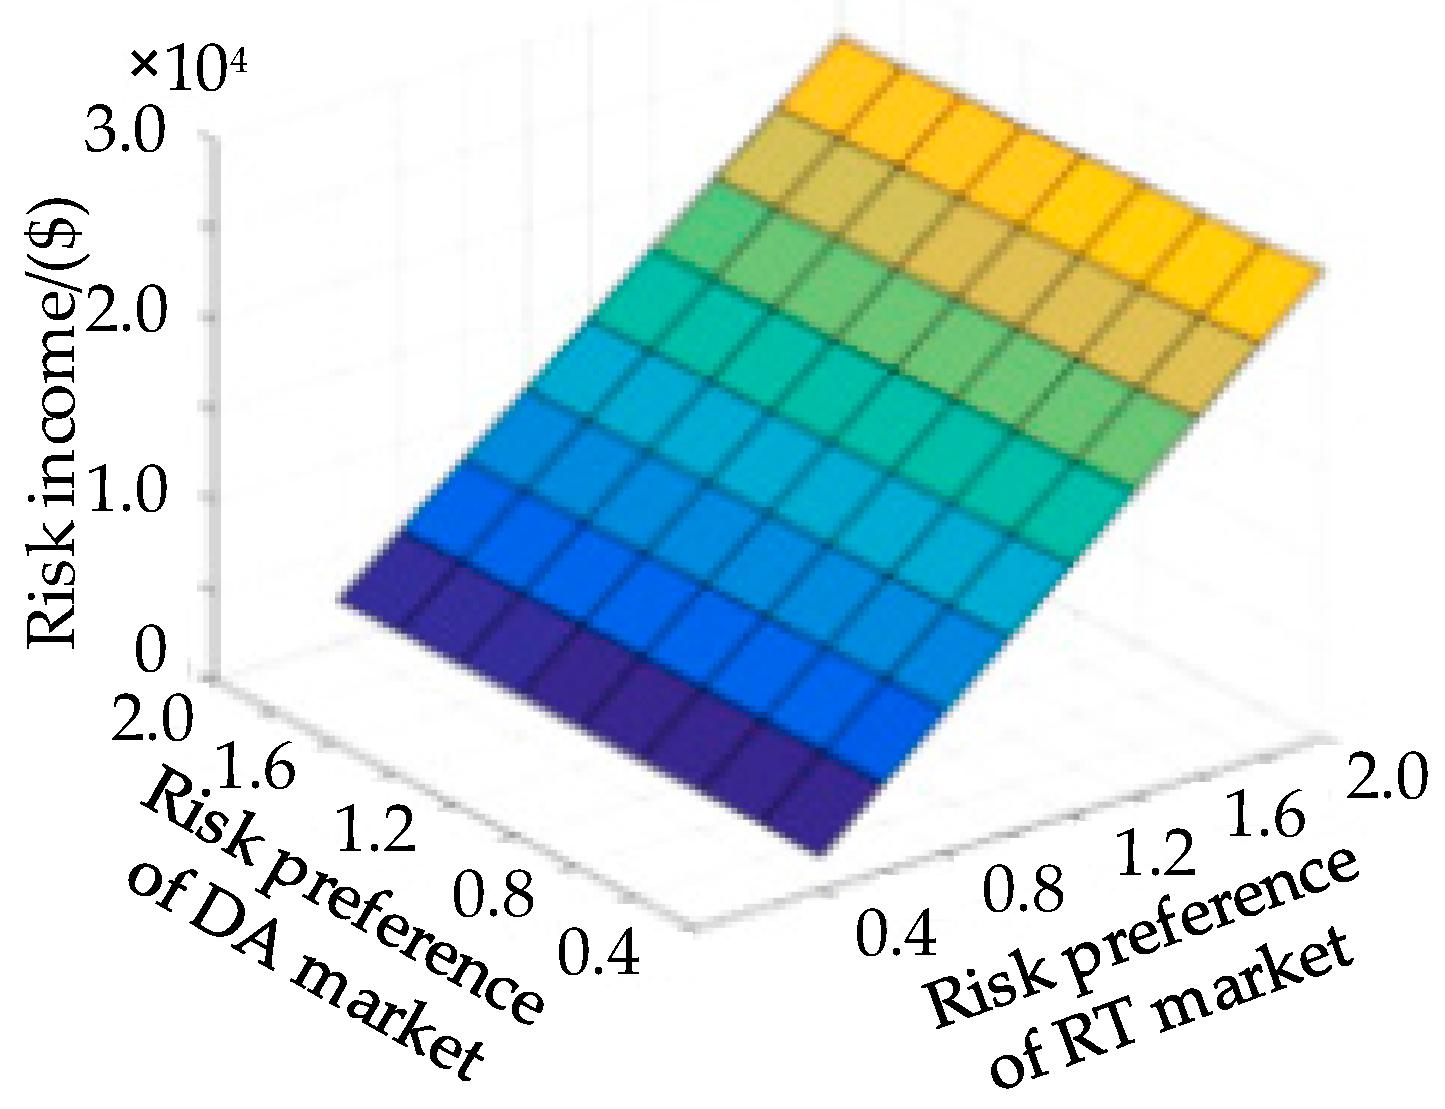
5.4.1. Risk Income of the RT Market

The risk preference coefficients of DA and RT market ranged from 0.4 to 2. As shown in Figure 10, with the same risk preference coefficient of the RT market, the change of the market risk factor had little impact on the risk income of the RT market. The reason lies in that the cost caused by the allowable deviation ratio was small, and different bidding curves brought by the different risk coefficients of the DA market did not have much impact on VPP scheduling in the RT market. The above phenomenon, therefore, coincides with the outcome and conclusion of Section 4.2. With same risk preference coefficient of the DA market, the risk income of RT market was positively correlated with the risk preference coefficient of the RT market, which demonstrates that the greater the risk tolerance, the higher the risk income. It also reflects the most significant impact on the VPP revenue is its RT market scheduling behavior. Therefore, the result can be concluded that the relationship of the VPP in the DA and RT market is not strong and is nearly decoupled based on the CVaR.

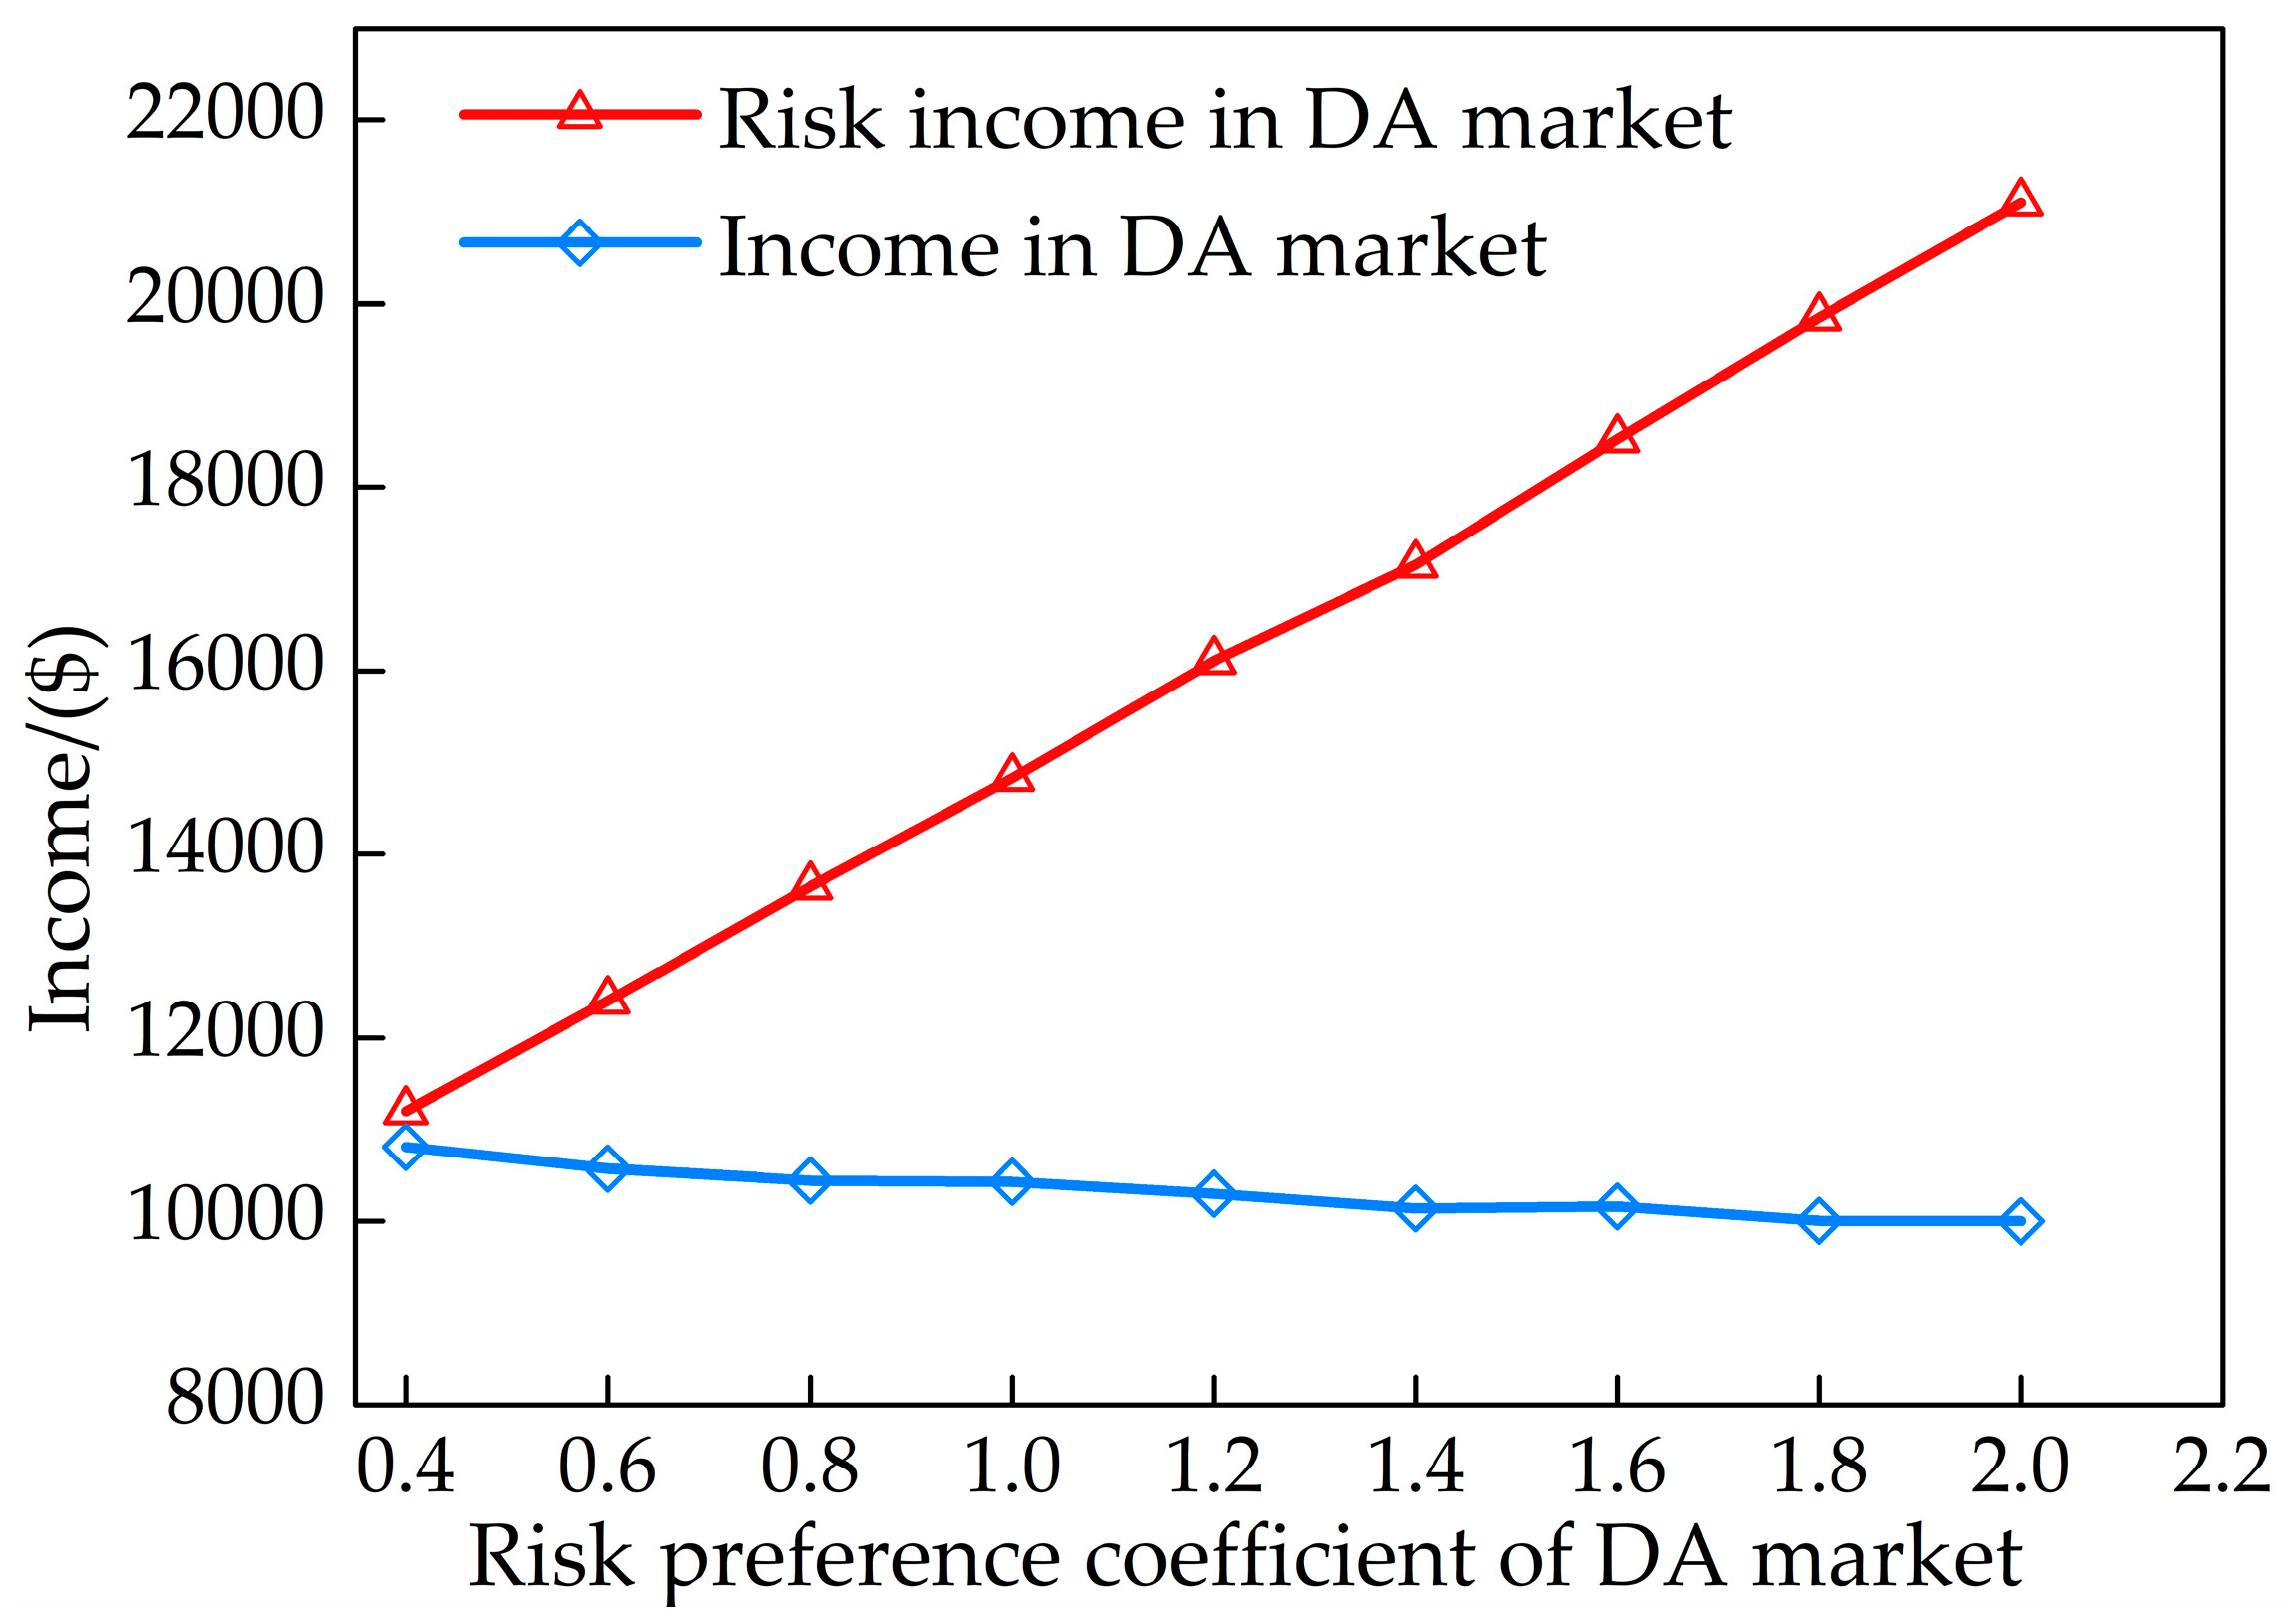
5.4.2. Income of the DA Market

The scheduling in RT market was performed after the DA market, which could not impact the income of the DA market. Therefore, the risk preference coefficient of the DA market is an important variable for the income of the DA market.
As shown in Figure 11, the risk income had a negative correlation with the risk preference, and the income of the DA market was inversely correlated with the risk preference. The reason can be found in Figure 12. The increase in the risk preference coefficient promoted the VPP to sell power to the grid with less energy purchased from the market. This was because the average cost of electricity produced by the VPP was more expensive than the energy sold to the grid under the 100 scenarios for the DA market prices. However, when calculating the income of the DA market, the basis data adopted was the DA market clearing price. Under this condition, the income of purchasing power from the grid was lower than the cost of selling power to the grid, leading to a decrease in the income in the DA market.

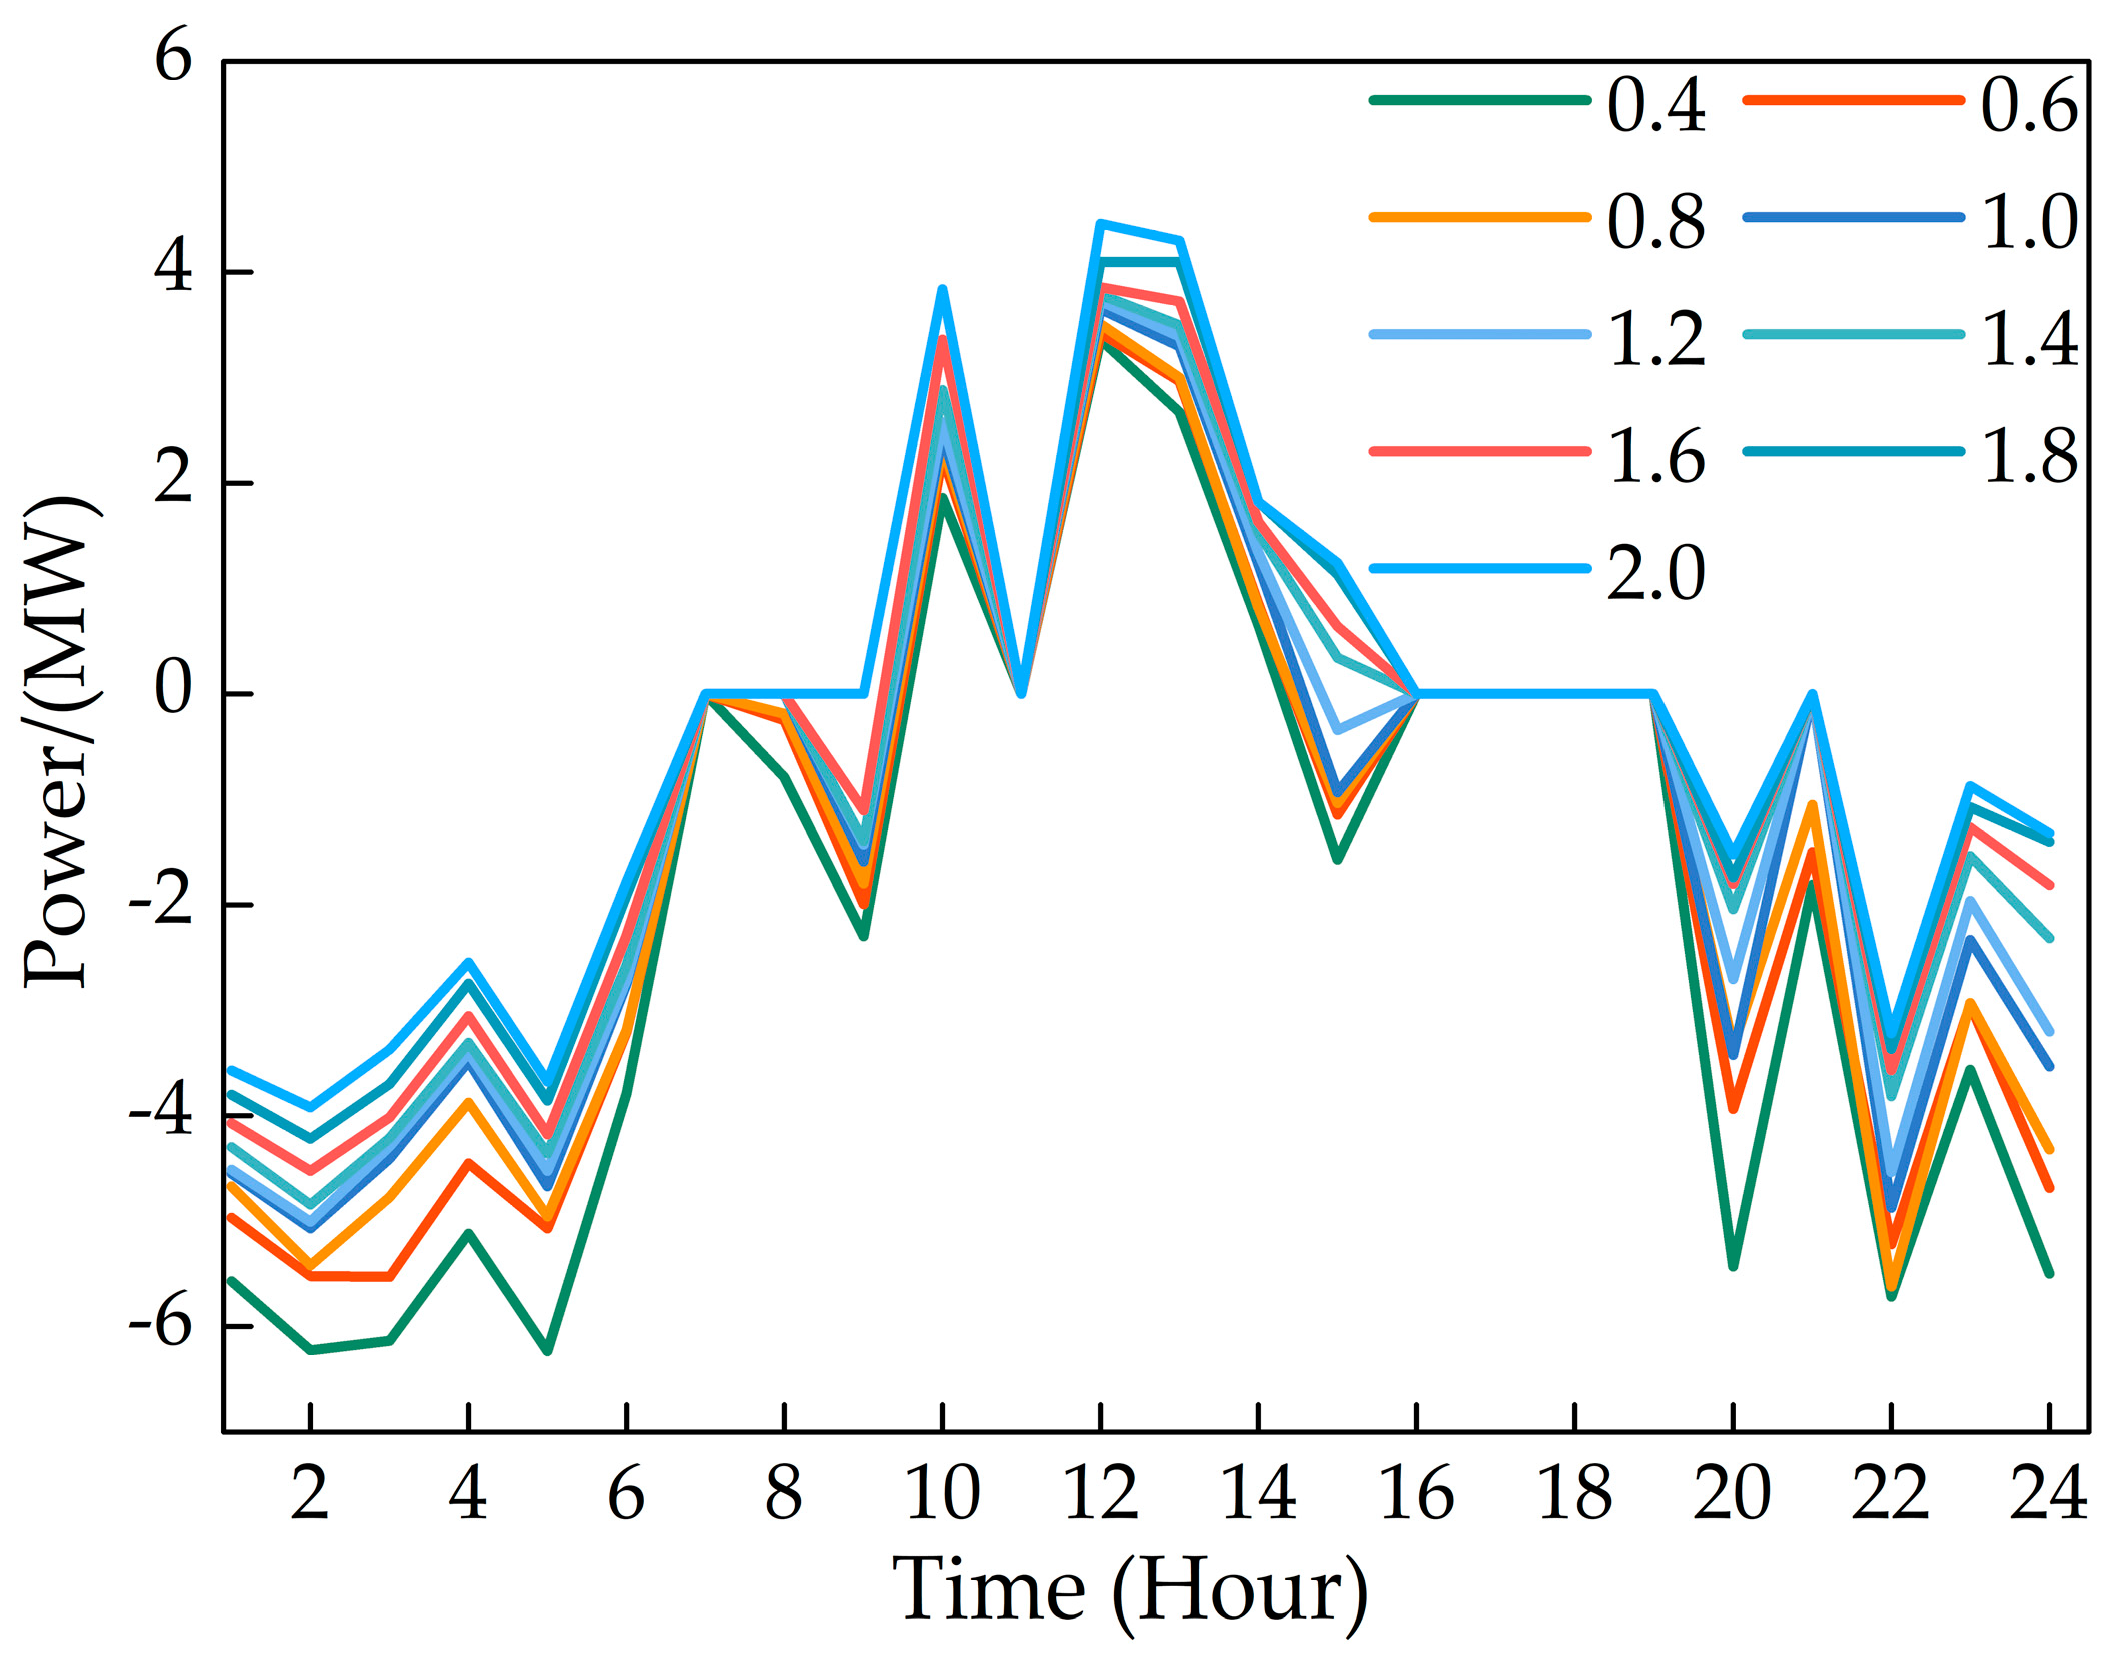
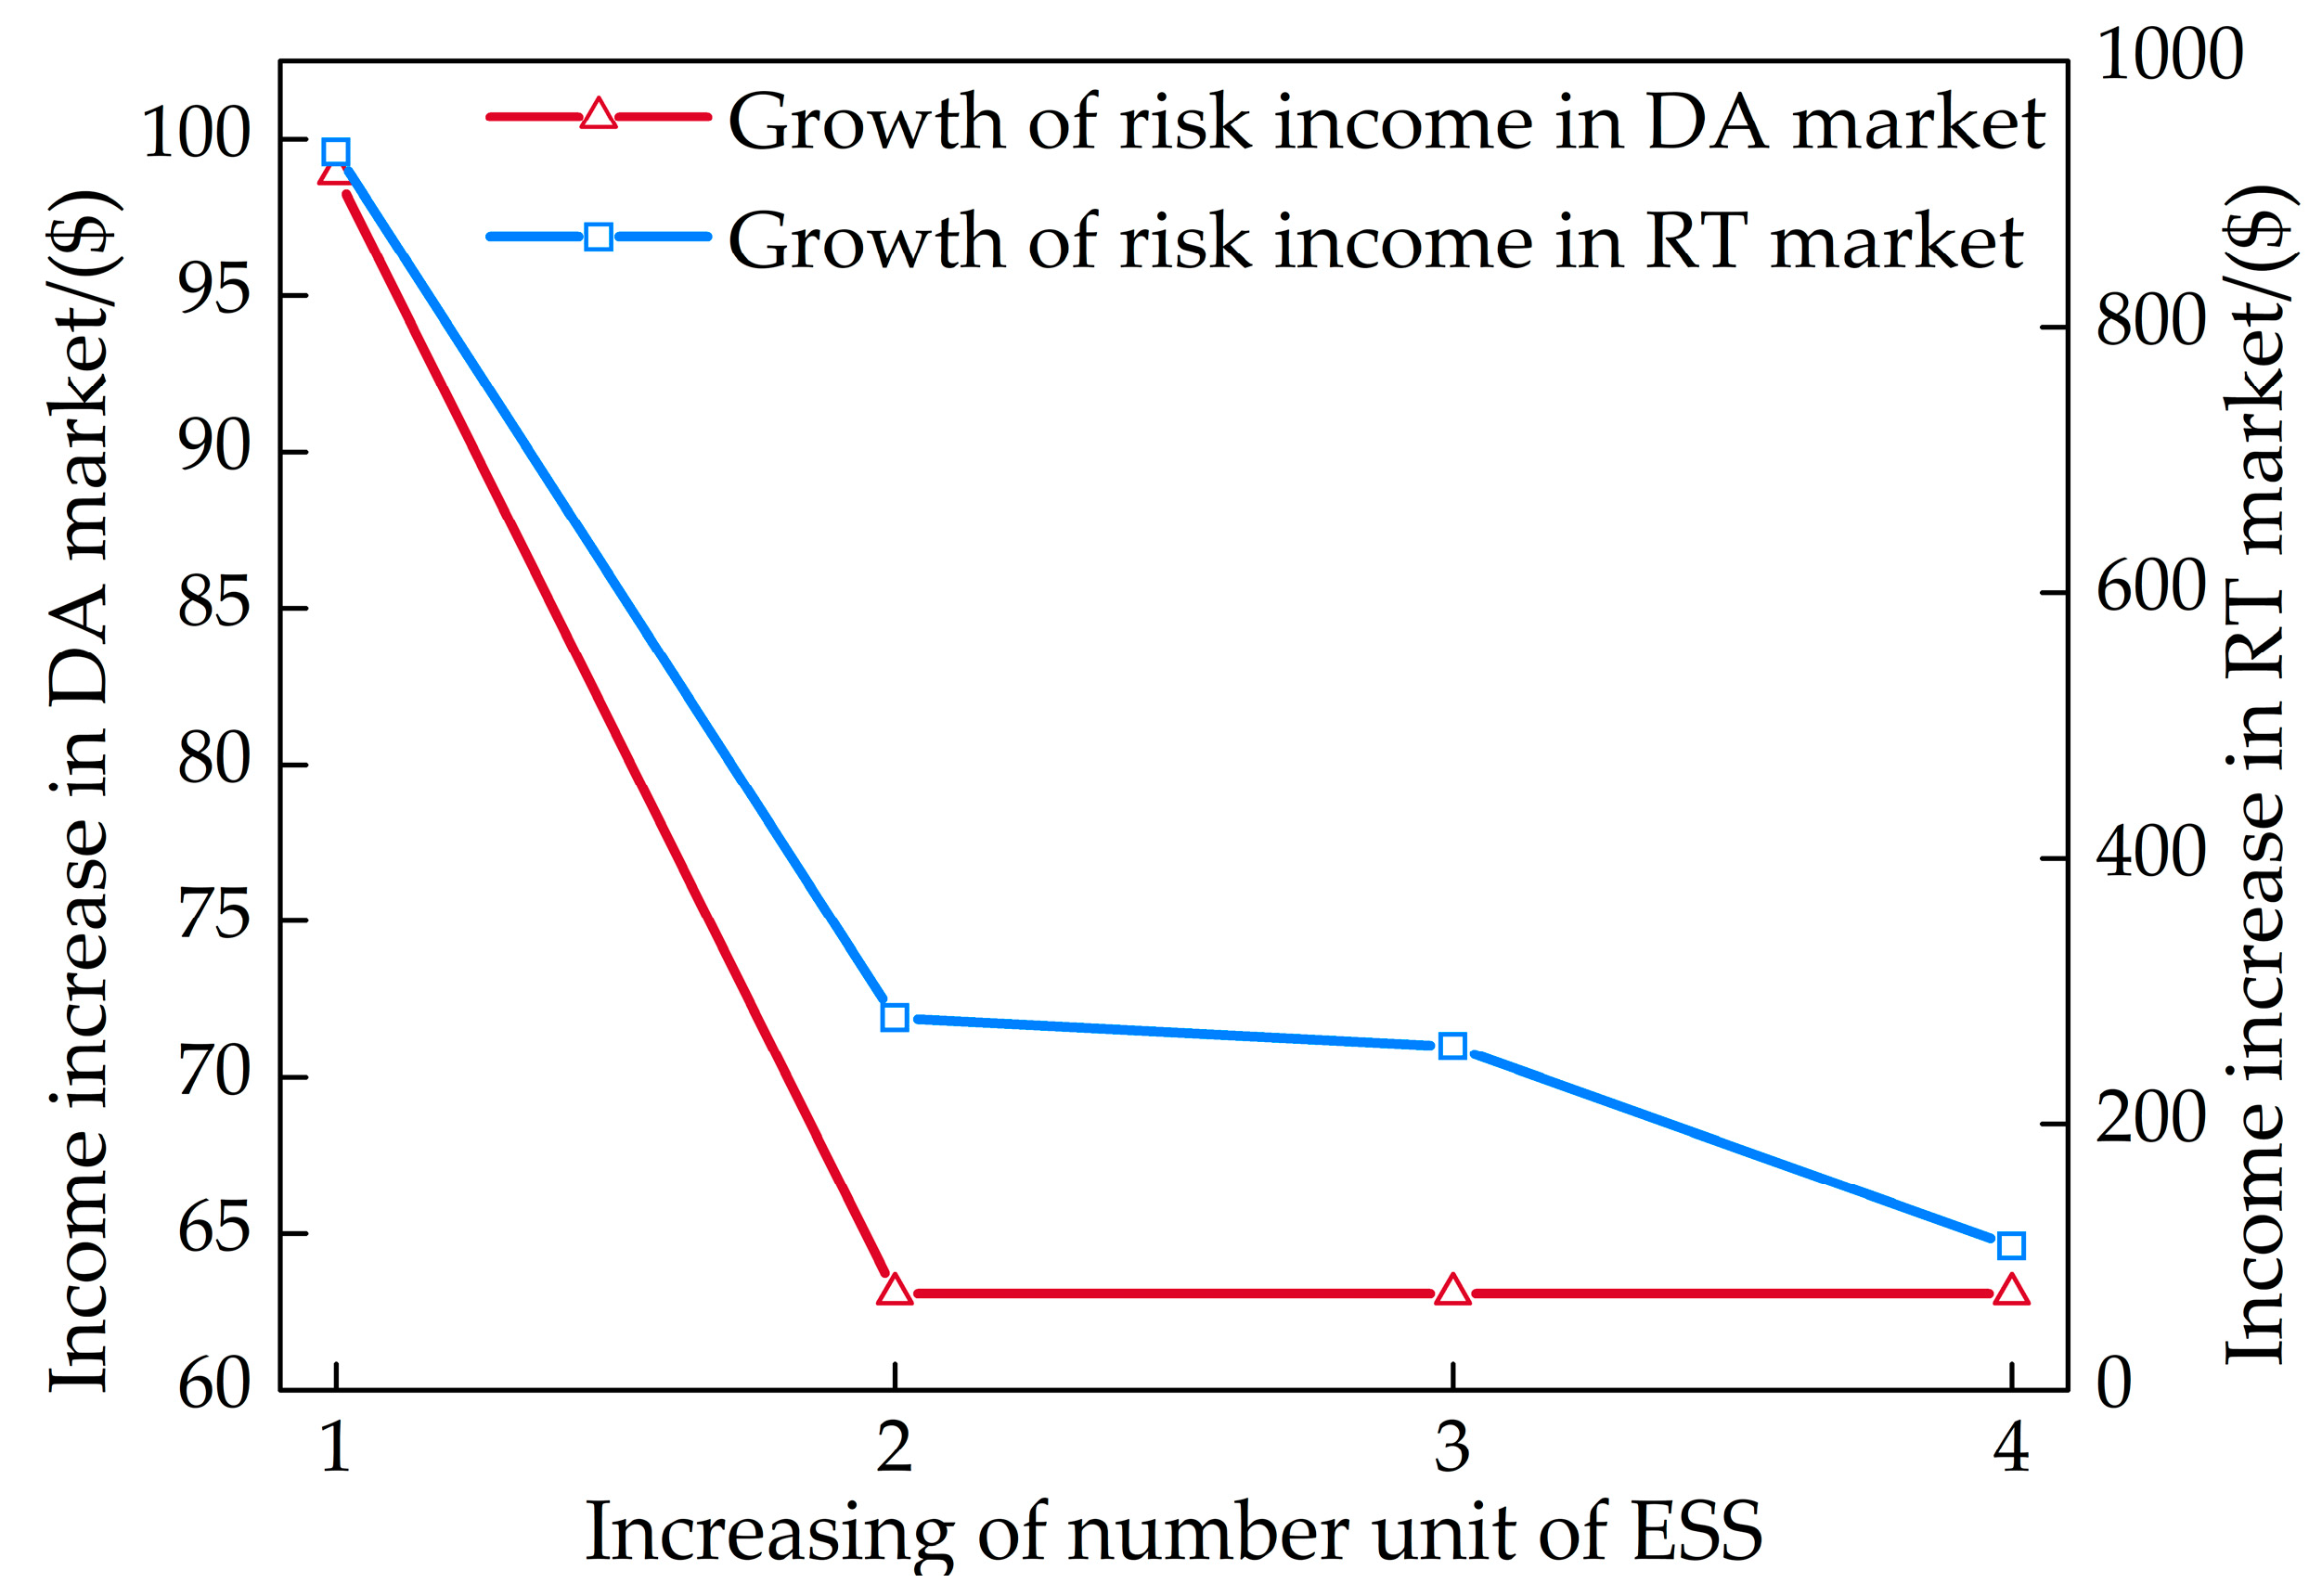
5.5. Impact on the ESS

The ESS is an important resource for future power market due to its high flexibility. To study the impact of the ESS on the scheduling of VPP in the spot market, different ESS capacities were explored. The basic unit of the storage capacity was set as 1 MW/2 MWh, and 1–5 ESSs were selected for simulation. The parameters λ , μ DA and μ RT were set as 0.1, 0.4, and 0.4, respectively. The outcome is displayed in Figure 13.
In Figure 13, the label of Y-axis denotes the income increment; the label of X-axis denotes the unit increment of the ESS. As demonstrated, ESS could effectively increase the risk income of the VPP, but its growth was not proportional to ESS unit numbers. With the increased capacity of the ESS, the risk income of VPP increased significantly, but the growth magnitude began to decline as it kept growing. Although ESS could help improve VPP profit, it showed that the increment of VPP risk income will gradually become saturated. Meanwhile, the outcome of increasing the RT market was more obvious with the increase in the ESS than in the DA market. This was because the price difference in the RT market scenario was relatively high, while ESS could respond to the price difference for arbitrage in the RT market and increase the revenue of the VPP.

6. Conclusions

According to the rules and regulations of the electricity spot market in China, a two-stage scheduling model of VPP was developed. Meanwhile, the uncertainty of the DA and RT market prices was also explored by utilizing the CVaR theory. The main conclusions are as follows.
  • A two-stage dispatching model with optimized bidding and operating strategy in DA and RT market for VPP was proposed. As demonstrated, the mechanism can optimize the behaviors of VPP internal resources and its overall output under DA/RT price signals.
  • The influence of UORM on the revenue of VPP was studied. As can be seen, the UORM did not result in too much cost to the VPP. The reason lies in that the price difference between DA and RT market at the same hour being small, and the VPP can change the output of its controlled DERs to mitigate the deviation between the bidding curve of the DA market and the actual operation curve in the RT market.
  • The uncertainty of market price on VPP was investigated via the CVaR theory. As a result, the VPP tended to sell more electricity to the grid with an increase in the risk preference coefficient. Since the average cost of the electricity purchased from the grid was lower than the selling price to the grid under the DA market clearing price, the income of the DA market decreased with the increase in the risk preference coefficient.
  • For a full evaluation, the participation of ESS was detailly analyzed. The outcome showed that ESS can effectively improve the risk income of VPP, but its growth was not proportional to the ESS unit numbers. With the increased capacity in the ESS, the risk income of VPP increased significantly but began to saturate as it kept growing. The outcome also demonstrated that the ESS has limited effect on improving the VPP profit.
Future works can be focused on incorporating more power components, such as EV, air conditioner, etc., into the VPP modeling. The internal mechanism of the VPP, including inner pricing policy, power exchange between multi-users, and so on, can be further explored. In addition, it is also meaningful to study VPP involvements with other market scenarios, such as ancillary and capacity markets.

Author Contributions

R.G. and T.M. were responsible for the design of the methodology and completing the original draft. H.G. and Q.X. conducted the investigation. R.Z. was responsible for research activity planning, paper review, and editing. B.Z. and P.Y. gave the suggestions on the proposed idea and simulation case. R.G. and T.M. revised the paper based on comments from the reviewers.

Funding

This work was supported by the National Natural Foundation of China, through Project 51607144.

Conflicts of Interest

The authors declare no conflict of interest.

References

  1. China Electricity Council. National Electricity Market Transactions in 2018. Available online: http://www.cec.org.cn/guihuayutongji/dianligaige/2019-03-04/189190.html (accessed on 28 May 2018).
  2. National Development and Reform Commission. Several Opinions on Further Reform of Power System. Available online: http://tgs.ndrc.gov.cn/zywj/201601/t20160129_773852.html (accessed on 25 May 2018).
  3. Zhejiang Provincial Development and Reform Commission. Comprehensive Pilot Program for the Reform of the Electric Power System in Zhejiang Province. Available online: http://www.zjdpc.gov.cn/art/2018/1/5/art_8_1739097.html (accessed on 15 May 2018).
  4. South China Energy Regulatory Office of National Energy Administration. The South China Energy Regulatory Office of National Energy Administration Conducts Comprehensive Guidance and Supervision on the Daily Spot Settlement Work of the Southern Power Market (Starting in Guangdong). Available online: http://nfj.nea.gov.cn/adminContent/initViewContent.do?pk=7344988 (accessed on 7 June 2018).
  5. South China Energy Regulatory Office of National Energy Administration. Introduction to South China Energy Regulatory Office of National Energy Administration. Available online: http://nfj.nea.gov.cn/frontIndex/indexJggk.do (accessed on 4 June 2018).
  6. National Development and Reform Commission, and National Energy Administration. Notice on Printing Supporting Documents for Power System Reform. Available online: http://www.ndrc.gov.cn/zcfb/zcfbtz/201511/t20151130_760016.html (accessed on 28 May 2018).
  7. Nosratabadi, S.M.; Hooshmand, R.A.; Gholipour, E. A comprehensive review on microgrid and virtual power plant concepts employed for distributed energy resources scheduling in power systems. Renew. Sustain. Energy Rev. 2017, 67, 341–363. [Google Scholar] [CrossRef]
  8. Othman, M.M.; Hegazy, Y.; Abdelaziz, A.Y. A Review of virtual power plant definitions, components, framework and optimization. Int. Electr. Eng. J. 2015, 6, 2010–2024. [Google Scholar]
  9. Li, P.; Liu, Y.; Xin, H.; Jiang, X. A robust distributed economic dispatch strategy of virtual power plant under cyber-attacks. IEEE Trans. Ind. Inform. 2018, 14, 4343–4352. [Google Scholar] [CrossRef]
  10. Huang, C.; Yue, D.; Xie, J.; Li, Y.; Wang, K. Economic dispatch of power systems with virtual power plant based interval optimization method. CSEE J. Power Energy Syst. 2016, 2, 74–80. [Google Scholar] [CrossRef]
  11. Shabanzadeh, M.; Sheikh-El-Eslami, M.K.; Haghifam, M.R. The design of a risk-hedging tool for virtual power plants via robust optimization approach. Appl. Energy 2015, 155, 766–777. [Google Scholar] [CrossRef]
  12. Giuntoli, M.; Poli, D. Optimized thermal and electrical scheduling of a large scale virtual power plant in the presence of energy storages. IEEE Trans. Smart Grid 2013, 4, 942–955. [Google Scholar] [CrossRef]
  13. Ko, R.; Kang, D.; Joo, S.K. Mixed Integer Quadratic Programming Based Scheduling Methods for Day-Ahead Bidding and Intra-Day Operation of Virtual Power Plant. Energies 2019, 12, 1410. [Google Scholar] [CrossRef]
  14. Luo, F.; Dong, Z.Y.; Meng, K.; Qiu, J.; Yang, J.; Wong, K.P. Short-term operational planning framework for virtual power plants with high renewable penetrations. IET Renew. Power Gener. 2016, 10, 623–633. [Google Scholar] [CrossRef]
  15. Pandžić, H.; Kuzle, I.; Capuder, T. Virtual power plant mid-term dispatch optimization. Appl. Energy 2013, 101, 134–141. [Google Scholar] [CrossRef]
  16. Xu, Z.Y.; Qu, H.N.; Shao, W.H.; Xu, W.S. Virtual power plant-based pricing control for wind/thermal cooperated generation in China. IEEE Trans. Syst. Man Cybern. Syst. 2015, 46, 706–712. [Google Scholar] [CrossRef]
  17. Zamani, A.G.; Zakariazadeh, A.; Jadid, S.; Kazemi, A. Stochastic operational scheduling of distributed energy resources in a large scale virtual power plant. Int. J. Electr. Power Energy Syst. 2016, 82, 608–620. [Google Scholar] [CrossRef]
  18. Ghavidel, S.; Li, L.; Aghaei, J.; Yu, T.; Zhu, J. A review on the virtual power plant: Components and operation systems. In Proceedings of the 2016 IEEE International Conference on Power System Technology (POWERCON), Wollongong, Australia, 28 September–1 October 2016. [Google Scholar]
  19. Shayegan-Rad, A.; Badri, A.; Zangeneh, A. Day-ahead scheduling of virtual power plant in joint energy and regulation reserve markets under uncertainties. Energy 2017, 121, 114–125. [Google Scholar] [CrossRef]
  20. Liang, Z.; Alsafasfeh, Q.; Jin, T.; Pourbabak, H.; Su, W. Risk-constrained optimal energy management for virtual power plants considering correlated demand response. IEEE Trans. Smart Grid 2017, 10, 1577–1587. [Google Scholar] [CrossRef]
  21. Dabbagh, S.R.; Sheikh-El-Eslami, M.K. Risk-based profit allocation to DERs integrated with a virtual power plant using cooperative Game theory. Electr. Power Syst. Res. 2015, 121, 368–378. [Google Scholar] [CrossRef]
  22. Kasaei, M.J.; Gandomkar, M.; Nikoukar, J. Optimal management of renewable energy sources by virtual power plant. Renew. Energy 2017, 114, 1180–1188. [Google Scholar] [CrossRef]
  23. Zhang, G.; Jiang, C.; Wang, X.; Li, B.; Zhu, H. Bidding strategy analysis of virtual power plant considering demand response and uncertainty of renewable energy. IET Gener. Transm. Distrib. 2017, 11, 3268–3277. [Google Scholar] [CrossRef]
  24. South China Energy Regulatory Office of National Energy Administration. Trading Rule of Spot Electricity Market. Available online: http://nfj.nea.gov.cn/adminContent/initViewContent.do?pk=402881e56579be6301658d7123c2001a (accessed on 30 May 2018).
  25. Nguyen, H.T.; Le, L.B.; Wang, Z. A Bidding Strategy for Virtual Power Plants with the Intraday Demand Response Exchange Market Using the Stochastic Programming. IEEE Trans. Ind. Appl. 2018, 54, 3044–3055. [Google Scholar] [CrossRef]
  26. Ding, T.; Bo, R.; Gu, W.; Guo, Q.; Sun, H. Absolute value constraint based method for interval optimization to SCED model. IEEE Trans. Power Syst. 2013, 29, 980–981. [Google Scholar] [CrossRef]
  27. Korn, R.; Zeytun, S. Solving optimal investment problems with structured products under CVaR constraints. Optimization 2009, 58, 291–304. [Google Scholar] [CrossRef]
  28. Rockafellar, R.T.; Uryasev, S. Optimization of conditional value-at-risk. J. Risk 2000, 2, 21–42. [Google Scholar] [CrossRef]
Figure 1. Framework of the user-side over-deviated revenue mechanism (UORM).
Energies 12 03402 g001
Figure 2. Framework of the virtual power plant (VPP) in the spot market.
Energies 12 03402 g002
Figure 3. Framework of the conditional risk value (CVaR).
Energies 12 03402 g003
Figure 4. Solving framework of the optimization model.
Energies 12 03402 g004
Figure 5. Scenario prices of the day-ahead (DA) and real-time (RT) market.
Energies 12 03402 g005
Figure 6. Forecasting outputs of wind/solar/load in the DA and RT market.
Energies 12 03402 g006
Figure 7. DA market clearing price.
Energies 12 03402 g007
Figure 8. Operational status of the VPP.
Energies 12 03402 g008
Figure 9. Average price of 100 scenarios price of the RT Market.
Energies 12 03402 g009
Figure 10. Relationship between the risk preference coefficient and the risk income of the RT market.
Energies 12 03402 g010
Figure 11. Risk income and actual income under different risk preference coefficients of the DA market.
Energies 12 03402 g011
Figure 12. Bidding curve of the VPP in the DA market under different risk preference coefficients of the DA market.
Energies 12 03402 g012
Figure 13. Risk income of the VPP with different ESS units.
Energies 12 03402 g013
Table 1. Parameters of the Diesel generation and energy storage system (ESS).
DieselESS
P die , max 1.50 MW P st , max 1 MW
P die , min 0.2 MW S st 2 MWh
Q 180 kg/(MWh) C st op 27.5 $/(MWh)
C oil op 1 $/kg S OC max 0.6
C pol op 1 $/(MWh) η st 0.95
Table 2. Risk income of DA market with different allowable deviation ratios.
Allowable Deviation RatioReturn Cost with the Allowable Ratio/$Risk Income in DA Market/$
0.0113.2410,913.72
0.0512.5810,884.50
0.111.4310,785.78
0.211.0410,771.61
0.310.2410,633.15
0.48.9410,609.03
0.58.5110,581.24

