1. Introduction
The rational use of energy and raw materials is a problem of vital importance for most complex chemical and metallurgical plants and provides an ecologically sound approach that reduces the environmental impact and the necessity of wastewater treatments or of remediation procedures. This is particularly true for manufacture energy-intensive industrial products using thermal treatments. In this paper, the process of roasting a moving multilayer mass of phosphate pellets in a horizontal grate apparatus (a widely used equipment in the chemical industries [
1,
2]) is considered.
The markets for phosphates include important sectors such as fertilizers, foods, detergents, water treatment chemicals and others. In particular, the production of phosphorous requires the phosphate pellets to be dried before remelting, otherwise the functioning of the ore-thermal furnace would be seriously impaired and the consumption of energy would be higher than the one necessary to dry the phosphate pellets before entering the furnace.
A complex multistage roasting process is a combination of drying processes, dissociation of carbonates and sintering of grains in the pellet, which provides the final strength of the pellets formed [
3]. Flow conditions and heat treatment characterize the quality of the final products [
3,
4].
A change in the technical specifications of the process or in the granulometric composition of mineral raw materials requires expensive experimental studies to reconfigure the operation parameters of the horizontal grate machine [
5,
6]. Therefore, the mathematical modeling and the computer-aided simulation of the drying of a moving, dense multilayer mass of phosphate pellets in conveyors combined with an optimization algorithm to minimize the energy consumption constitutes a problem of considerable theoretical significance and practical importance [
2,
7].
The overall resulting algorithm includes an objective function based on the minimization of energy consumption subject to equality constraints provided by the theoretical mathematical model in the form of partial differential equations and to inequality constraints (bounds) that correspond to both product quality constraints and technical operation mode limitations. Therefore, the problem can be regarded as a dynamic optimization with respect to the operation variables (controls) that determine the energy consumption subject to differential constraints on physical properties (state variables) and inequality constraints on both state and control variables. The presence of inequality constraints on state variables is one of the most difficult problems in dynamic optimization [
8]. Additionally, since the differential equations defining state variables are partial differential equations, available algorithms and codes cannot be used, rather, special algorithms are to be developed and their robustness and efficiency has to be tested, as shown in the following sections.
The article is organized as follows:
Section 2 develops the theoretical model and the resulting optimization problem,
Section 3 provides structure and details of the algorithm proposed and shows the numerical results obtained,
Section 4 provides a discussion and shows the limitations of the approach used, and
Section 5 concludes.
2. Materials and Methods
The theoretical physical model and the resulting optimization problem include several steps that are described by the following equations:
1. Drying of single pellets, the state variables of the drying process depending on one spatial coordinate (the pellet radius) and one temporal variable.
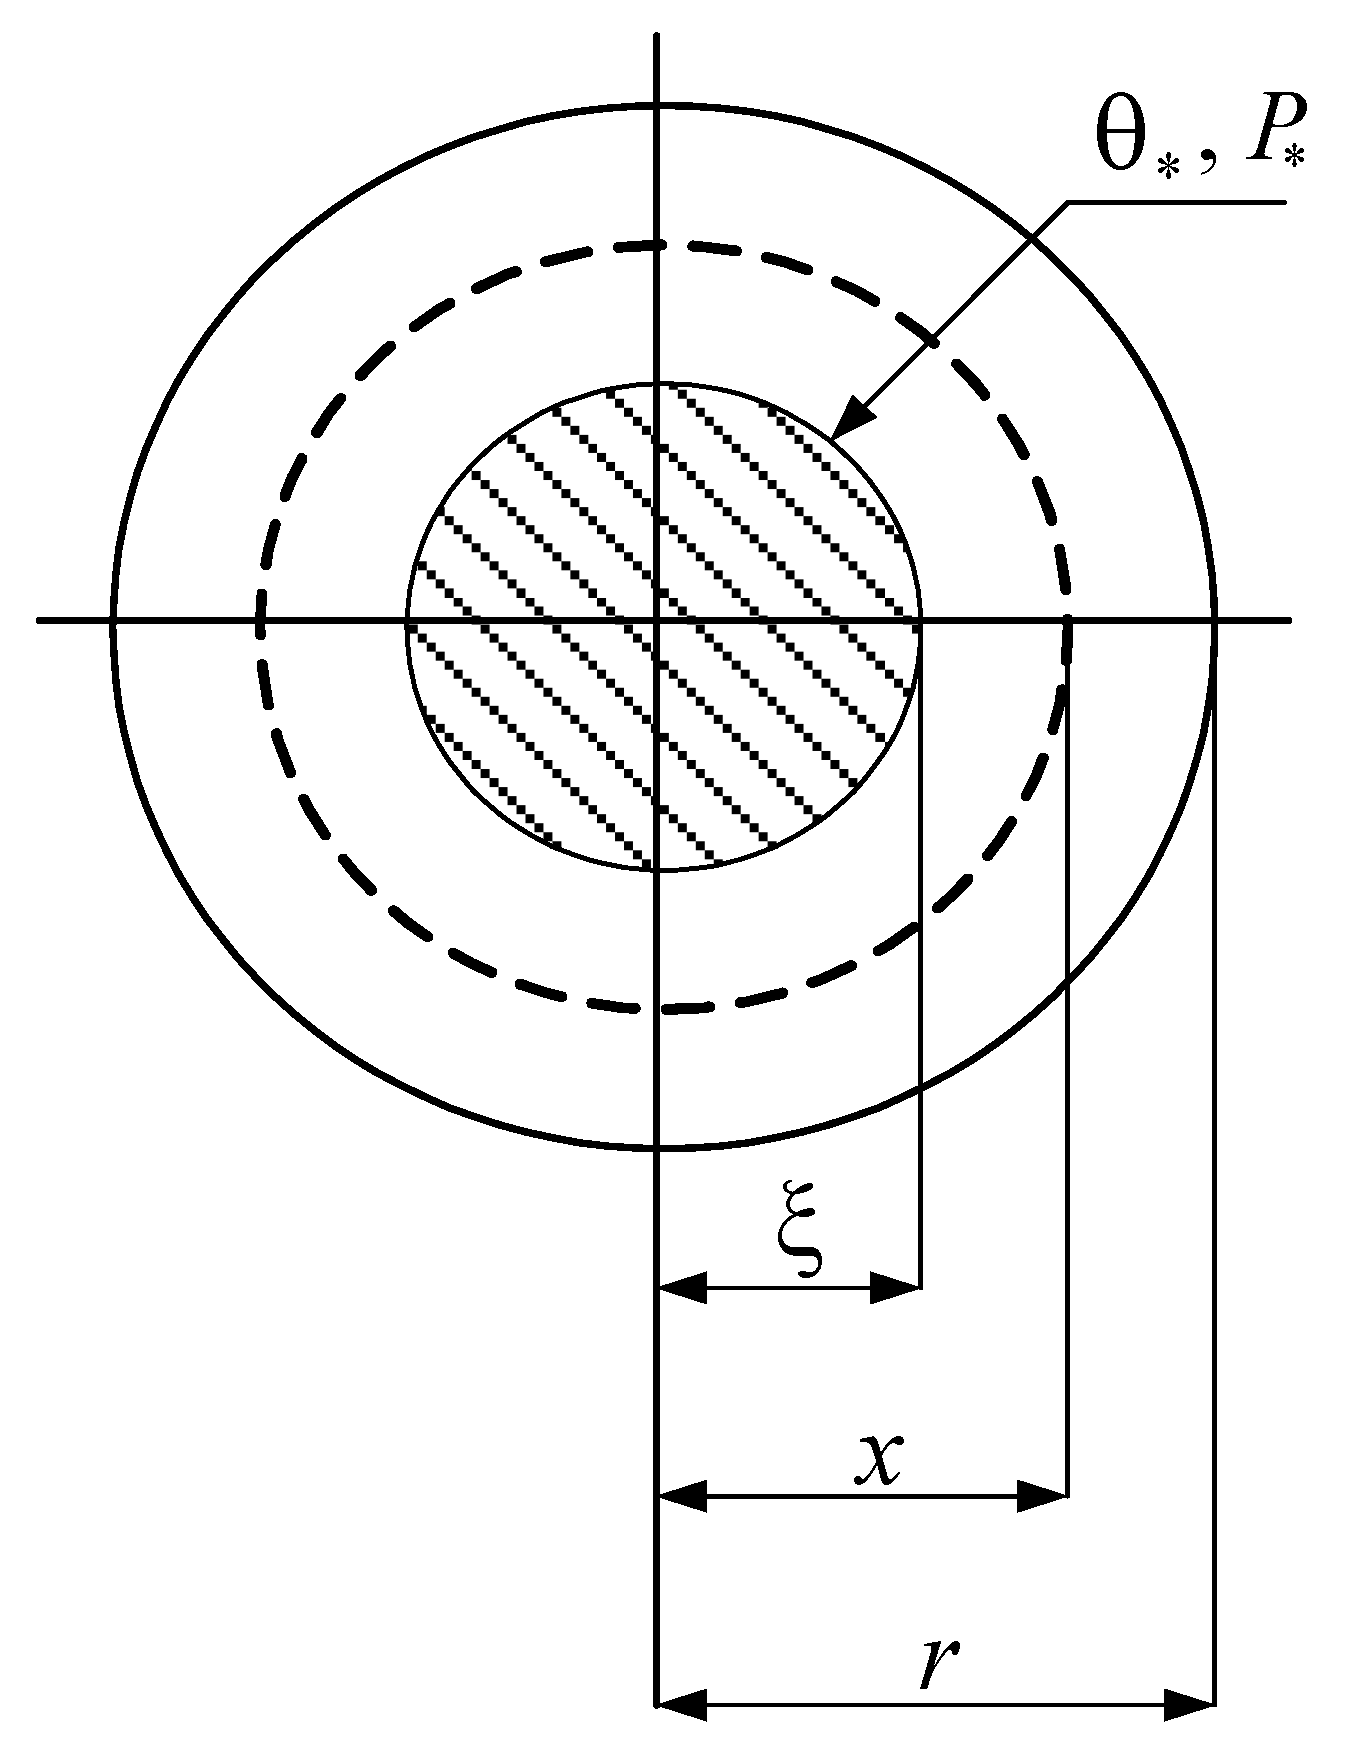
In the model of drying of a single pellet, it is assumed that as drying progresses, the localized front of moisture evaporation deepens (
Figure 1). Heat is supplied to the evaporation front due to the thermal conductivity of the dry layer of material, where heat is used to convert the liquid into vapour. As a result of evaporation, an overpressure is created inside the porous structure of the pellet, under the action of which the formed vapours diffuse from the evaporation front to the outer surface of the wet pellet. Therefore, the rate of moisture removal depends on two resistances in series, i.e., heat transfer and diffusion [
9]. The vapour pressure and the temperature at the evaporation front are established during the drying process and follow the usual saturated vapour pressure law [
10]. This model of localized evaporation front is most appropriate for large porous wet materials (such as raw phosphate pellets [
11,
12,
13]).
The corresponding mathematical model is provided by Equation (1). It was established that during the drying of a separate spherical pellet, heat transfer is carried out by heat conduction with endothermic effect of heat absorption on the phase transition during evaporation:
where:
Tm is the temperature, ρ
m the density and
cm the specific heat at a distance
x from the center of the pellet; λ is the coefficient of thermal conductivity of the material; τ is the time;
q is the heat of evaporation in a spherical shell of radius x per unit of time due to phase transition, and
where
.
As shown in
Appendix A, the relative degree of the spherical pellet drying is equal to:
where:
QS is the latent heat of evaporation;
the saturation temperature;
T0 the temperature at the external surface of the pellet
.
2. Heat and mass exchange between the heat-carrier gas flow and the multilayer vertical stacking of pellets in the direction of the flow.
The heat transfer is provided by a convection mechanism described by the equation:
where:
Tg, ρ
g,
cg and
Wg are temperature on the pellet surface, density, specific heat and velocity of the heat-carrier gas;
y is the coordinate along the height of the pellets layer;
= ,
being the heat transfer coefficient from the surface and
the specific surface area of the pellets in the layer.
The pressure in the gas flow varies along the y axis according to Reference [
14]:
where:
P is the pressure and ε is the porosity of the layer;
r is the pellet radius; μ
g is the dynamic viscosity of the heat-carrier gas.
The process of the moisture mass transfer between the pellet and the gas flow is given by:
where:
u is the moisture content in the pellet;
xw is the moisture content of the gas;
PVR is the vapour pressure of moisture on the surface of the pellet;
PV is the vapour pressure of moisture in the gas and β
W is the mass transfer coefficient. The functional form of these equations depend on the definition of β
W from the following equation of mass transfer [
15]
where NuM = β
w(2r)/D
The initial and boundary conditions for of differential Equations (1)–(6) which describe the drying process of the entire moving multi-layer mass of pellets are:
where:
xw0 is the moisture content;
Tg0 is the gas temperature at the inlet to the layer;
Tm0 is the initial temperature of the pellets;
P0 is the atmospheric pressure.
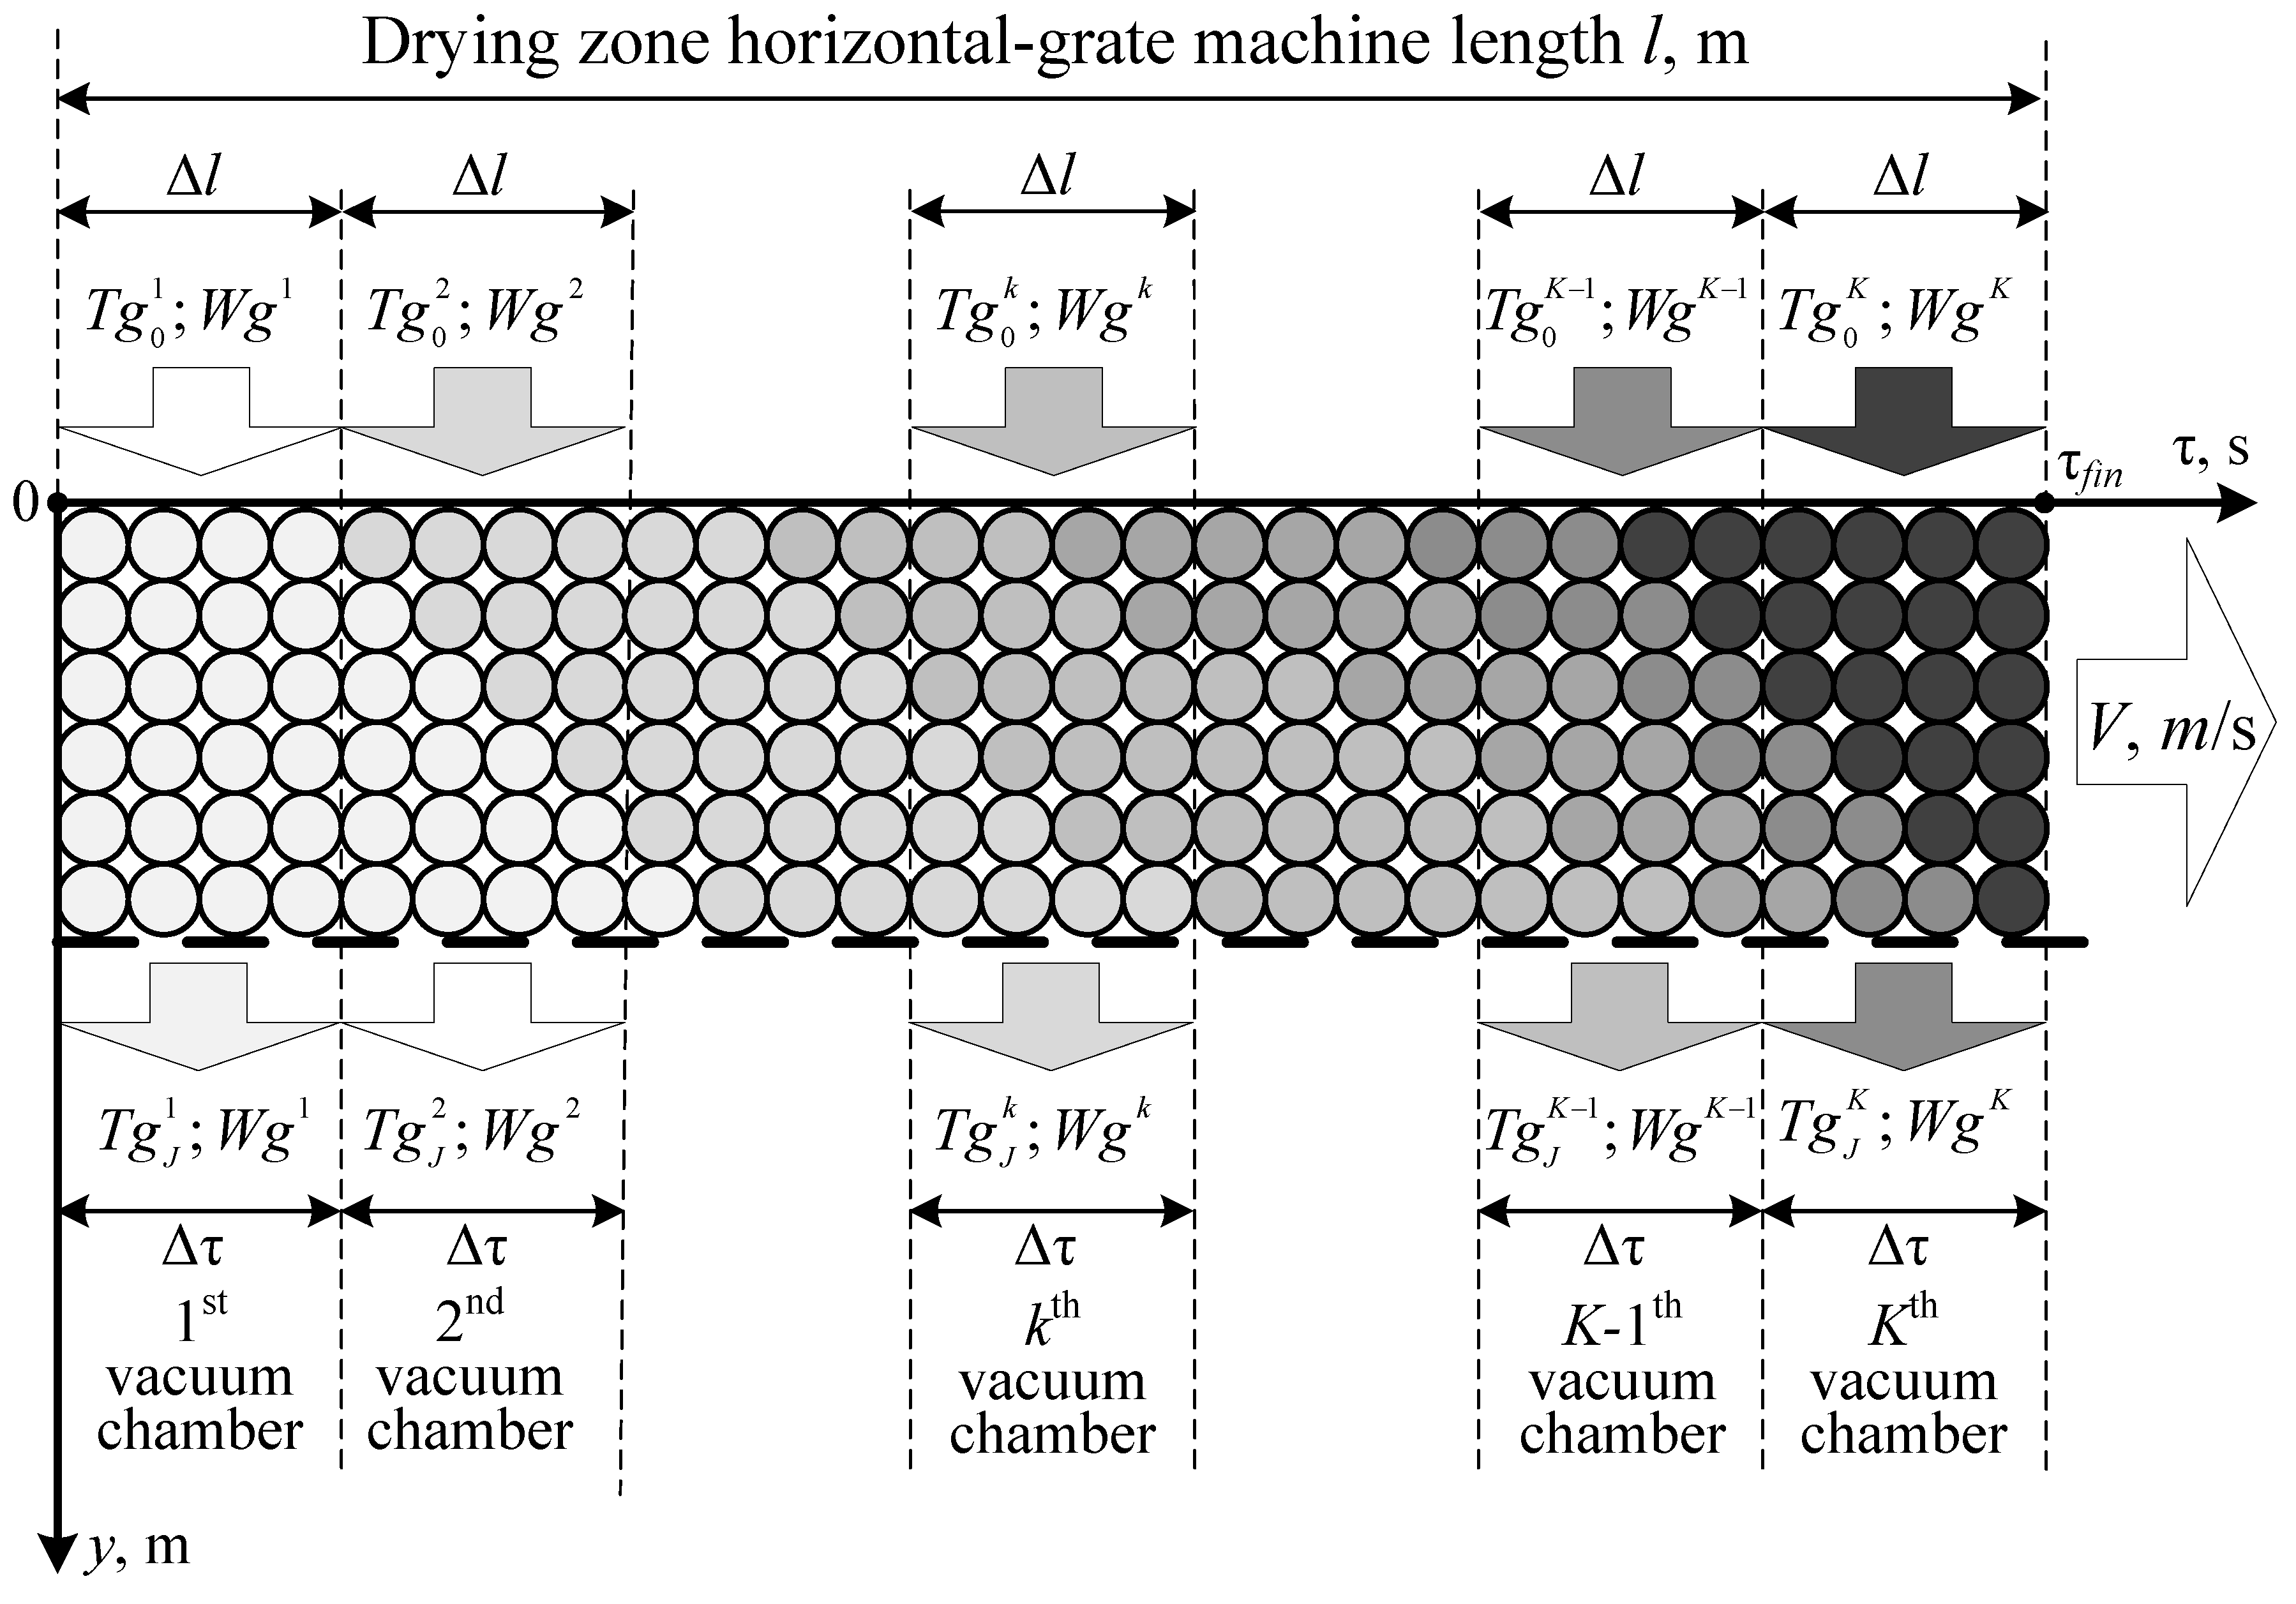
3. Process optimization.
The dense multilayer mass of pellets is moving on the conveyor of length l at a speed of V and passes through separate (i = 1, 2, …, k) vacuum chambers of length Δl. Correspondingly, the permanence time in each chamber is Δτ = Δl/V.
The heat-carrier gas is supplied with a certain temperature
Tg0(τ) and speed
Wg(τ). Diffusing with a turbulent motion through the multi-layered mass of pellets, it releases heat to them, leaving the layer with a temperature
Tgh(τ) (
Figure 2).
The resulting optimization task is given by the minimization of the overall amount Q of electric (
Qel) and thermal (
Qheat) energy consumption necessary to attain the drying level required, where
Qel is the amount of electrical energy spent on the formation of the heat-carrier gas flow at a rate
Wg and
Qheat is the amount of thermal energy of fuel combustion spent on heating the heat-carrier gas to the initial temperature
Tg in each vacuum chamber. Since electric energy is approximately four times more expensive than thermal energy (generated by the burning of fuel), electric energy is used only to operate the blowers. The drying level is given by the equation
where
h is the height of the roasting bed and
τfin =
l/
V. While it is required that
, its exact value is a matter of trade-off with energy consumption.
Considering the specific cost Sel of electric energy Qel and the specific cost Sheat of heat energy Qheat, the energy consumption S costs are given by the equation: S = Sel·Qel + Sheat·Qheat.
The relation between heat and electric energy specific costs vary depends on region, country and other factors. In our calculations Sel/Sheat = 4.
The goal of the optimization is to find the value of the vector of control variables (Tg0, Wg) so that the average moisture content and cost of energy consumption S reach a minimum value: , .
Therefore, the resulting bi-objective optimization has been cast into the form
where α
1 and α
2 are the weights of the trade-off.
The optimization problem (8) is subject to several constraints:
- (a)
equality constraints resulting from the physical model (Equations (1)–(6))
- (b)
inequality constraints on the independent variables (controls) subject to upper bounds WgMAX and TgMAX, due to the technical features of the horizontal grate machine
- (c)
inequality constraints on variables of the model (state variables). They must be included due to considerations on material properties [
16,
17]:
gas temperature at the exit from the pellet layer
moisture transfer intensity
The optimal controls (the profiles of
and
) could be computed numerically either using Pontryagin’s maximum principle or Bellman’s dynamic programming. However, while the dynamic programming approach scans the entirety of the state space to detect an optimum control, the solution obtained is both necessary and sufficient for the controls to be optimal, the maximum principle provides only a necessary condition [
18,
19]. Due to the complexity of the model employed, local optimizers cannot be ruled out and consequently an algorithm based on dynamic programming has been developed.
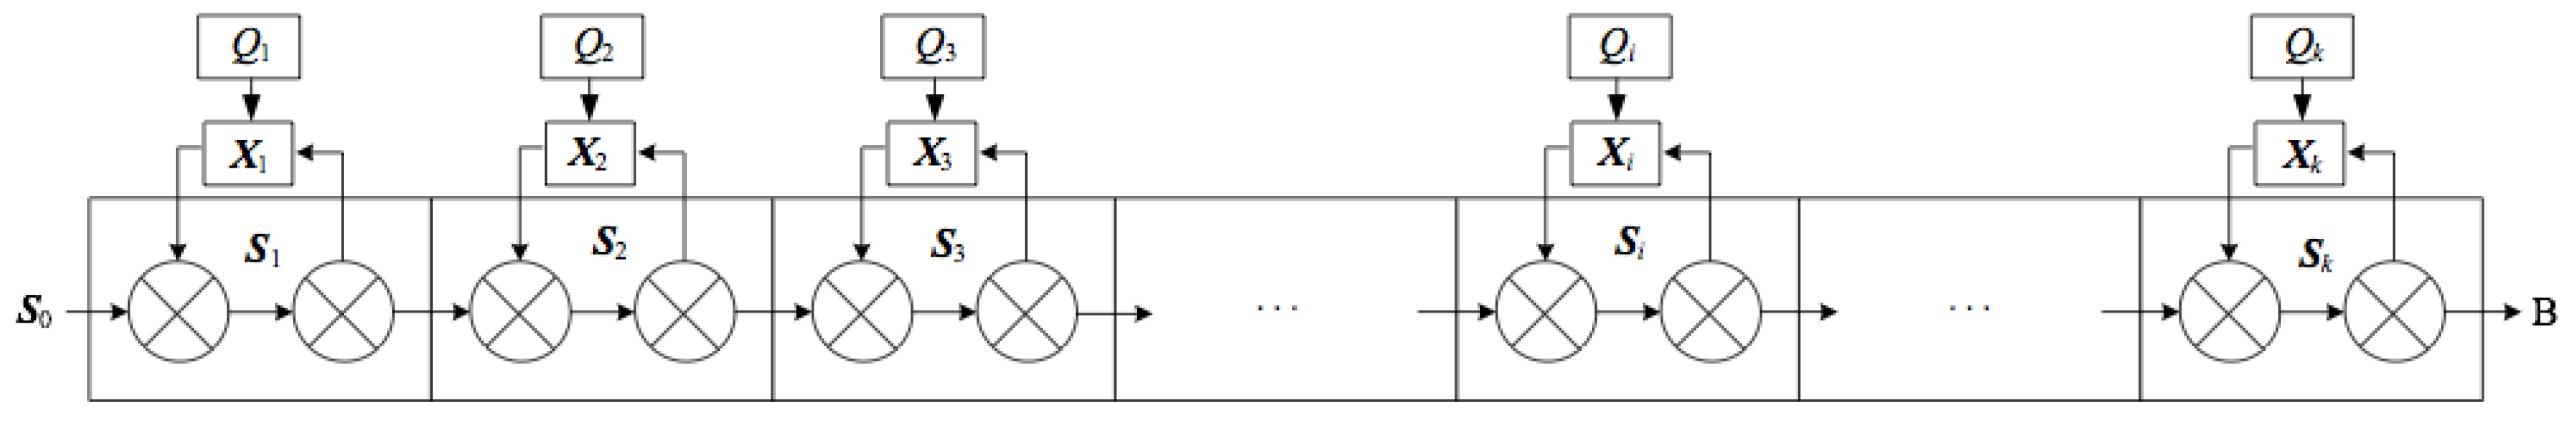
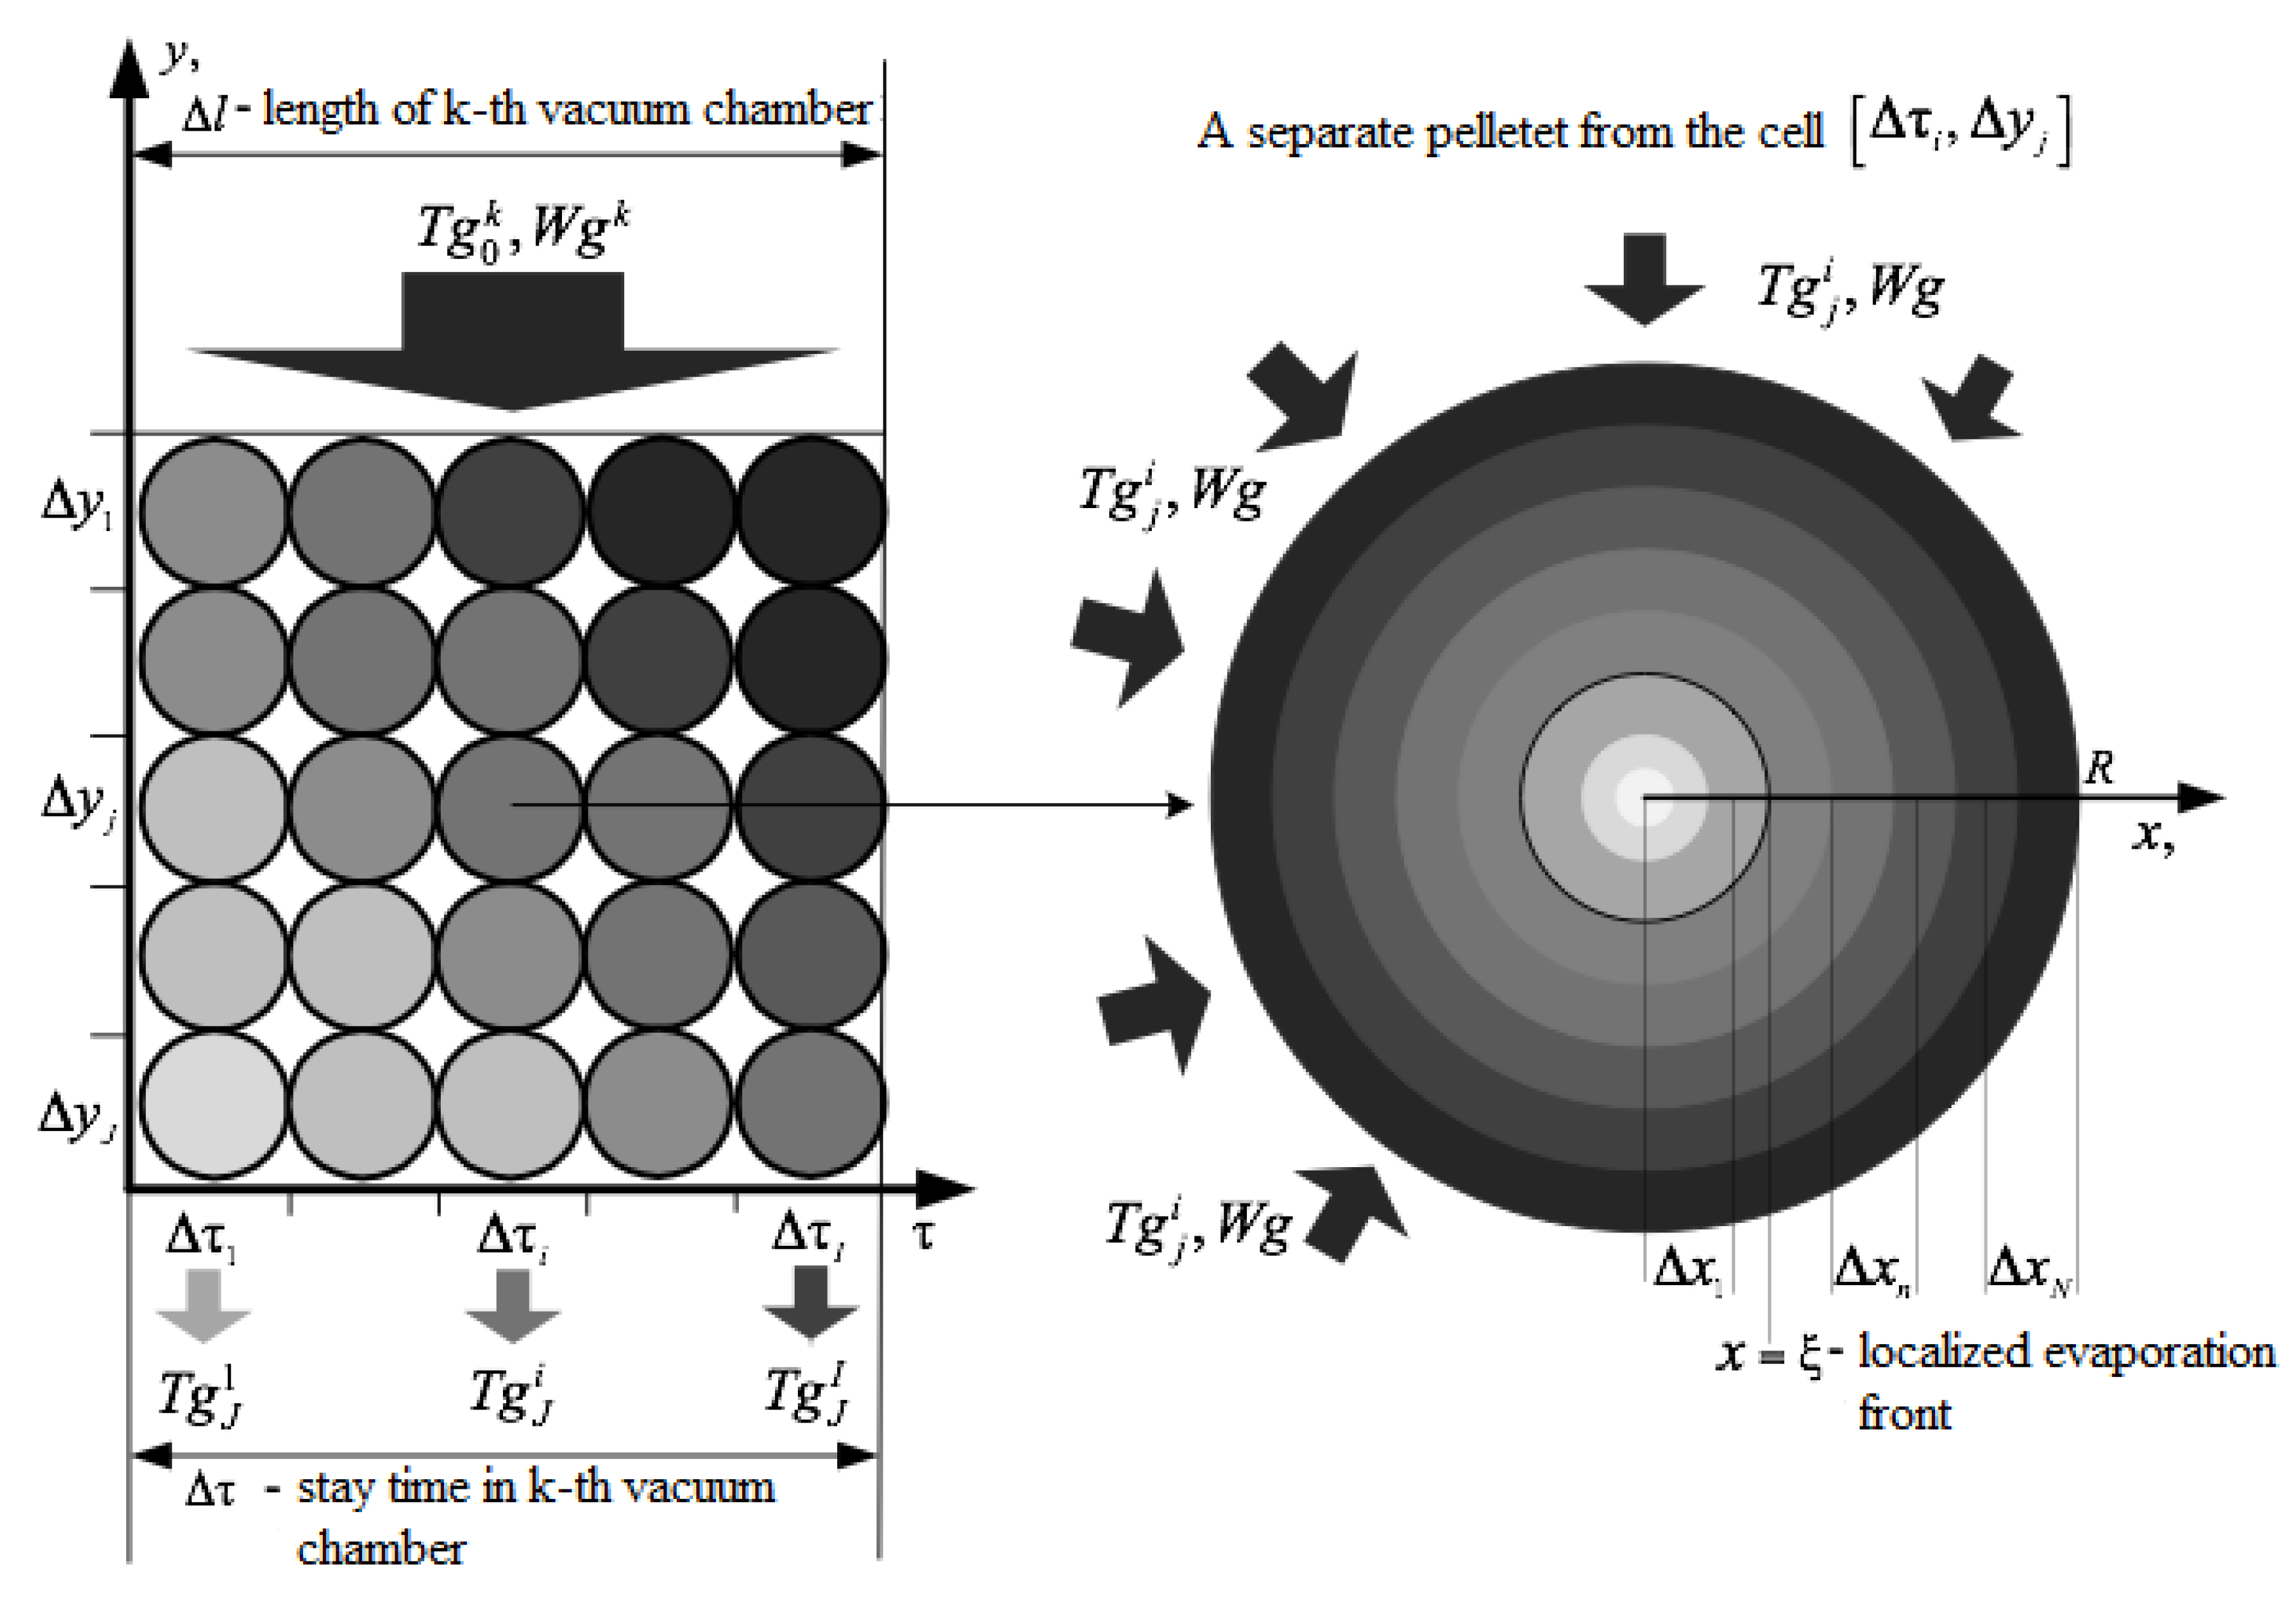
To this purpose. the pellet grate length is discretized into k sections to which Bellman’s recursive principle of optimality is applied, as shown in
Figure 3.
The objective function can be rewritten as
, where
Controls and state variables in each stage are related through the partial differential Equations (1)–(6) and can be expressed through the relationship
Expression (14) can be determined by discretizing the
domain into
intervals and solving, for each space-time interval, the heat equation for each separate pellet using an implicit finite-difference scheme obtained by splitting the radius
R into
N intervals Δ
xn,
n = 1, …,
N, as shown in
Figure 4.
Heat conductivity between pellets has been neglected because of the small contact surface and of the turbulence of the flow which strongly enhances heat convection.
The set of equations makes it possible to determine the temperature values of the pellets
, and consequently of the temperature gradient
and heating rate
, the temperature of the heat-carrier gas at the exit of the vertical multilayer laying of pellets
, the moisture content
, moisture transfer intensity
and the relative degree of drying
can be determined from the solution of the entire system of partial differential equations (PDE) using the drying process computer simulation developed by the authors [
20].
The solution of the dynamic programming problem begins with the last stage. In this case, the conditional minimum will be determined by the formula:
where
is the conditional optimal control at the last step
i =
k.
According to Bellman’s recursive formula, the procedure is iterated for each stage according to the formula
subject to constraints (9)–(13) for all state variables and controls present in the stage considered.
The minimization algorithm developed to solve this step is based on the Nelder–Mead optimization method and uses penalty functions to handle the constraints.
Since feasible values of the controls are known, their initial values are selected inside the interior domain and constraints on them are dealt with using barrier functions that become arbitrarily large as the values of the control variables exceed the upper bounds. Since Nelder–Mead method does not use derivatives, the resulting discontinuities do not impair the minimization procedure.
The penalty functions on state variables used are of the type
where
includes the variables
,
,
,
U, I, and
the relevant upper bounds.
This procedure provides the sequences and .
Then, using the known initial vector of state parameters, we determine the state S0 and consequently both the minimum F1 and the optimal control X1.
Iterating in this procedure the optimal values of the parameters
Tg0i,
Wgi at each stage of the decomposition provides the optimal sought-after sequence {
Xi (
Tg0i,
Wgi)} that optimizes the drying process of the multi-layer mass of pellets throughout the horizontal grate machine [
21,
22].
3. Results
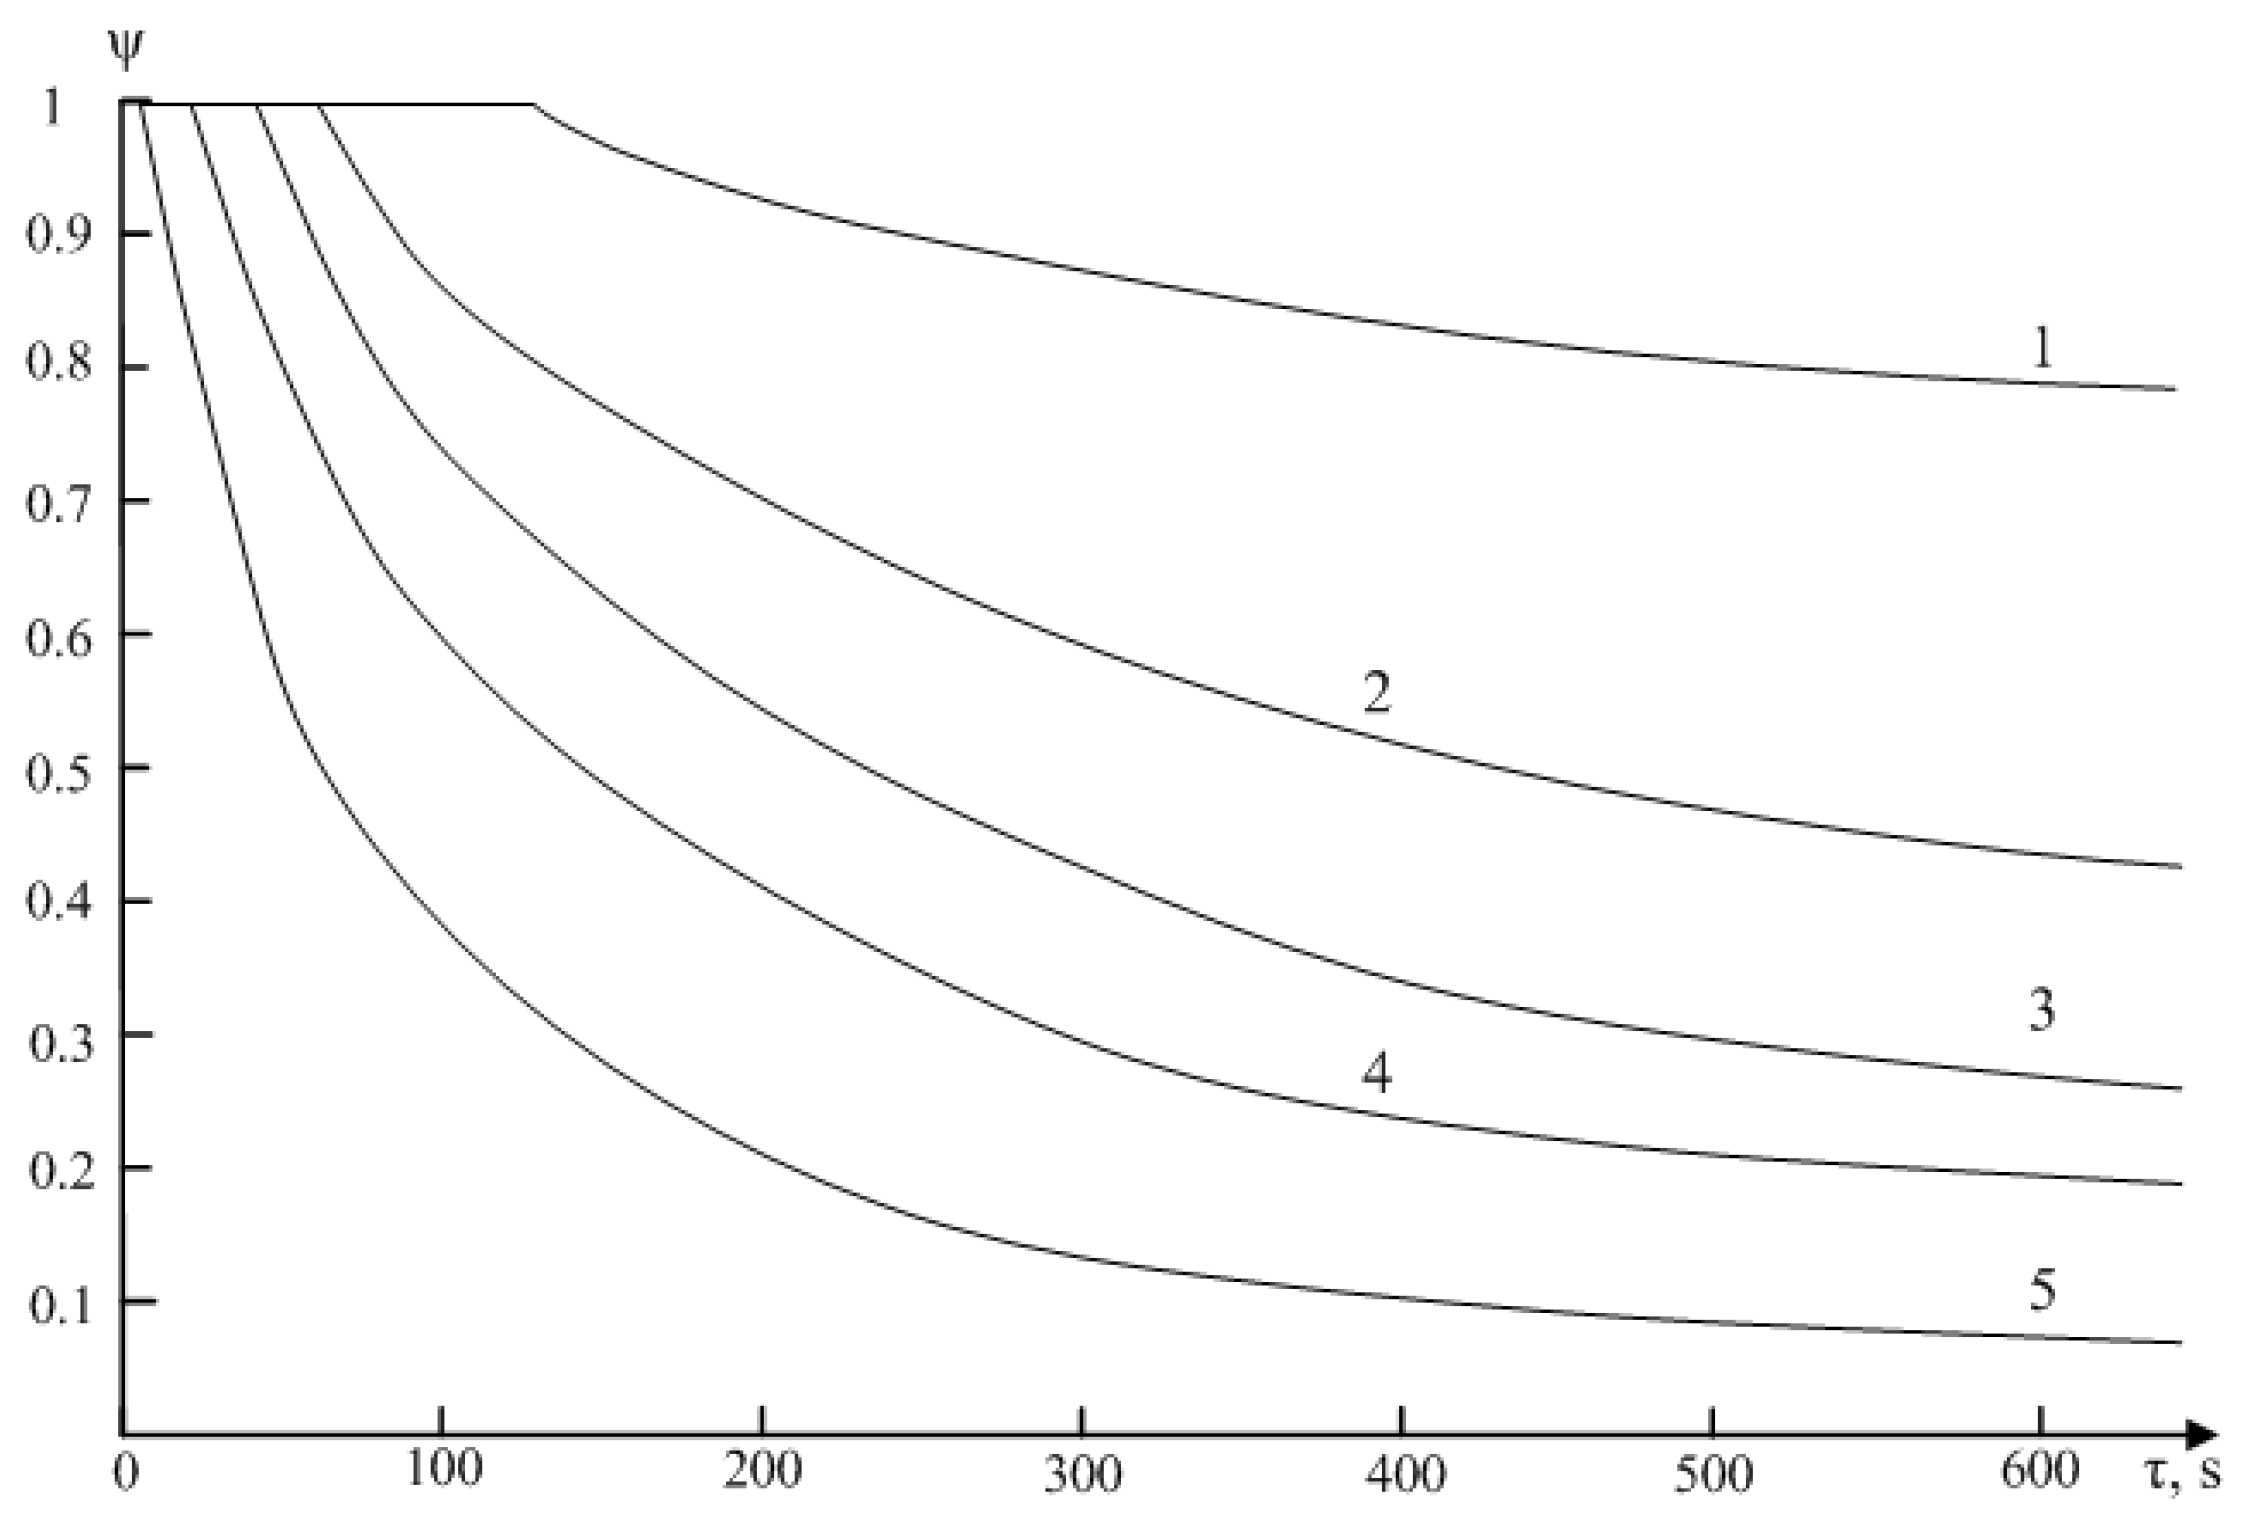
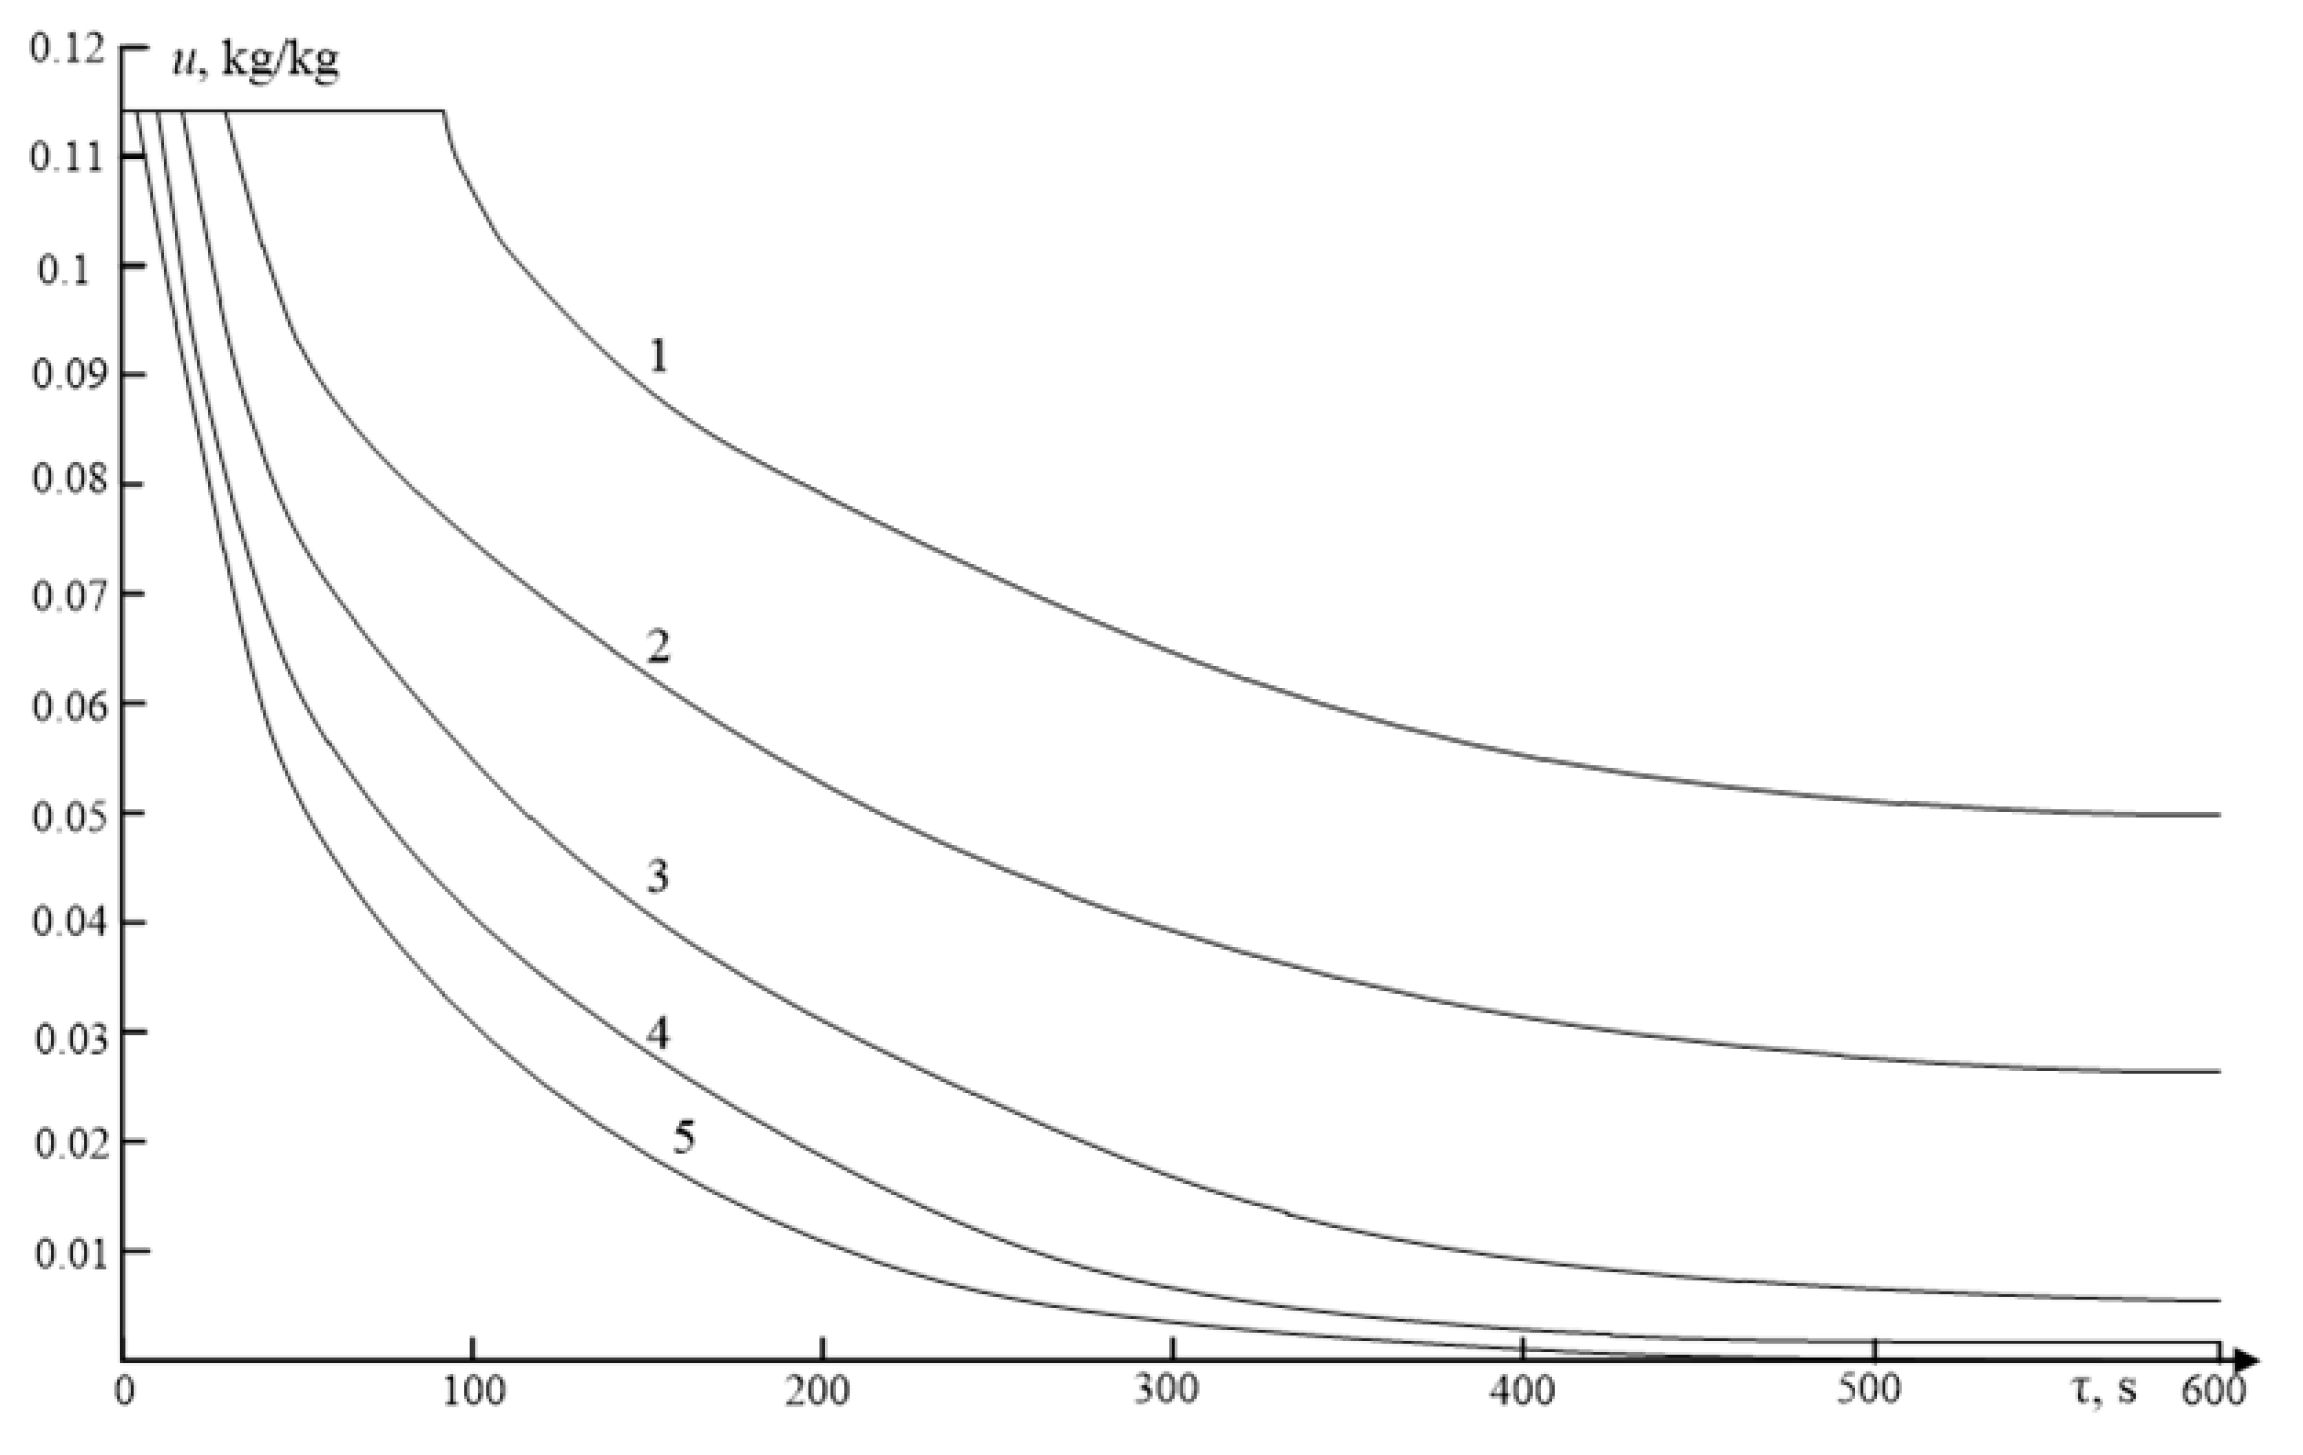
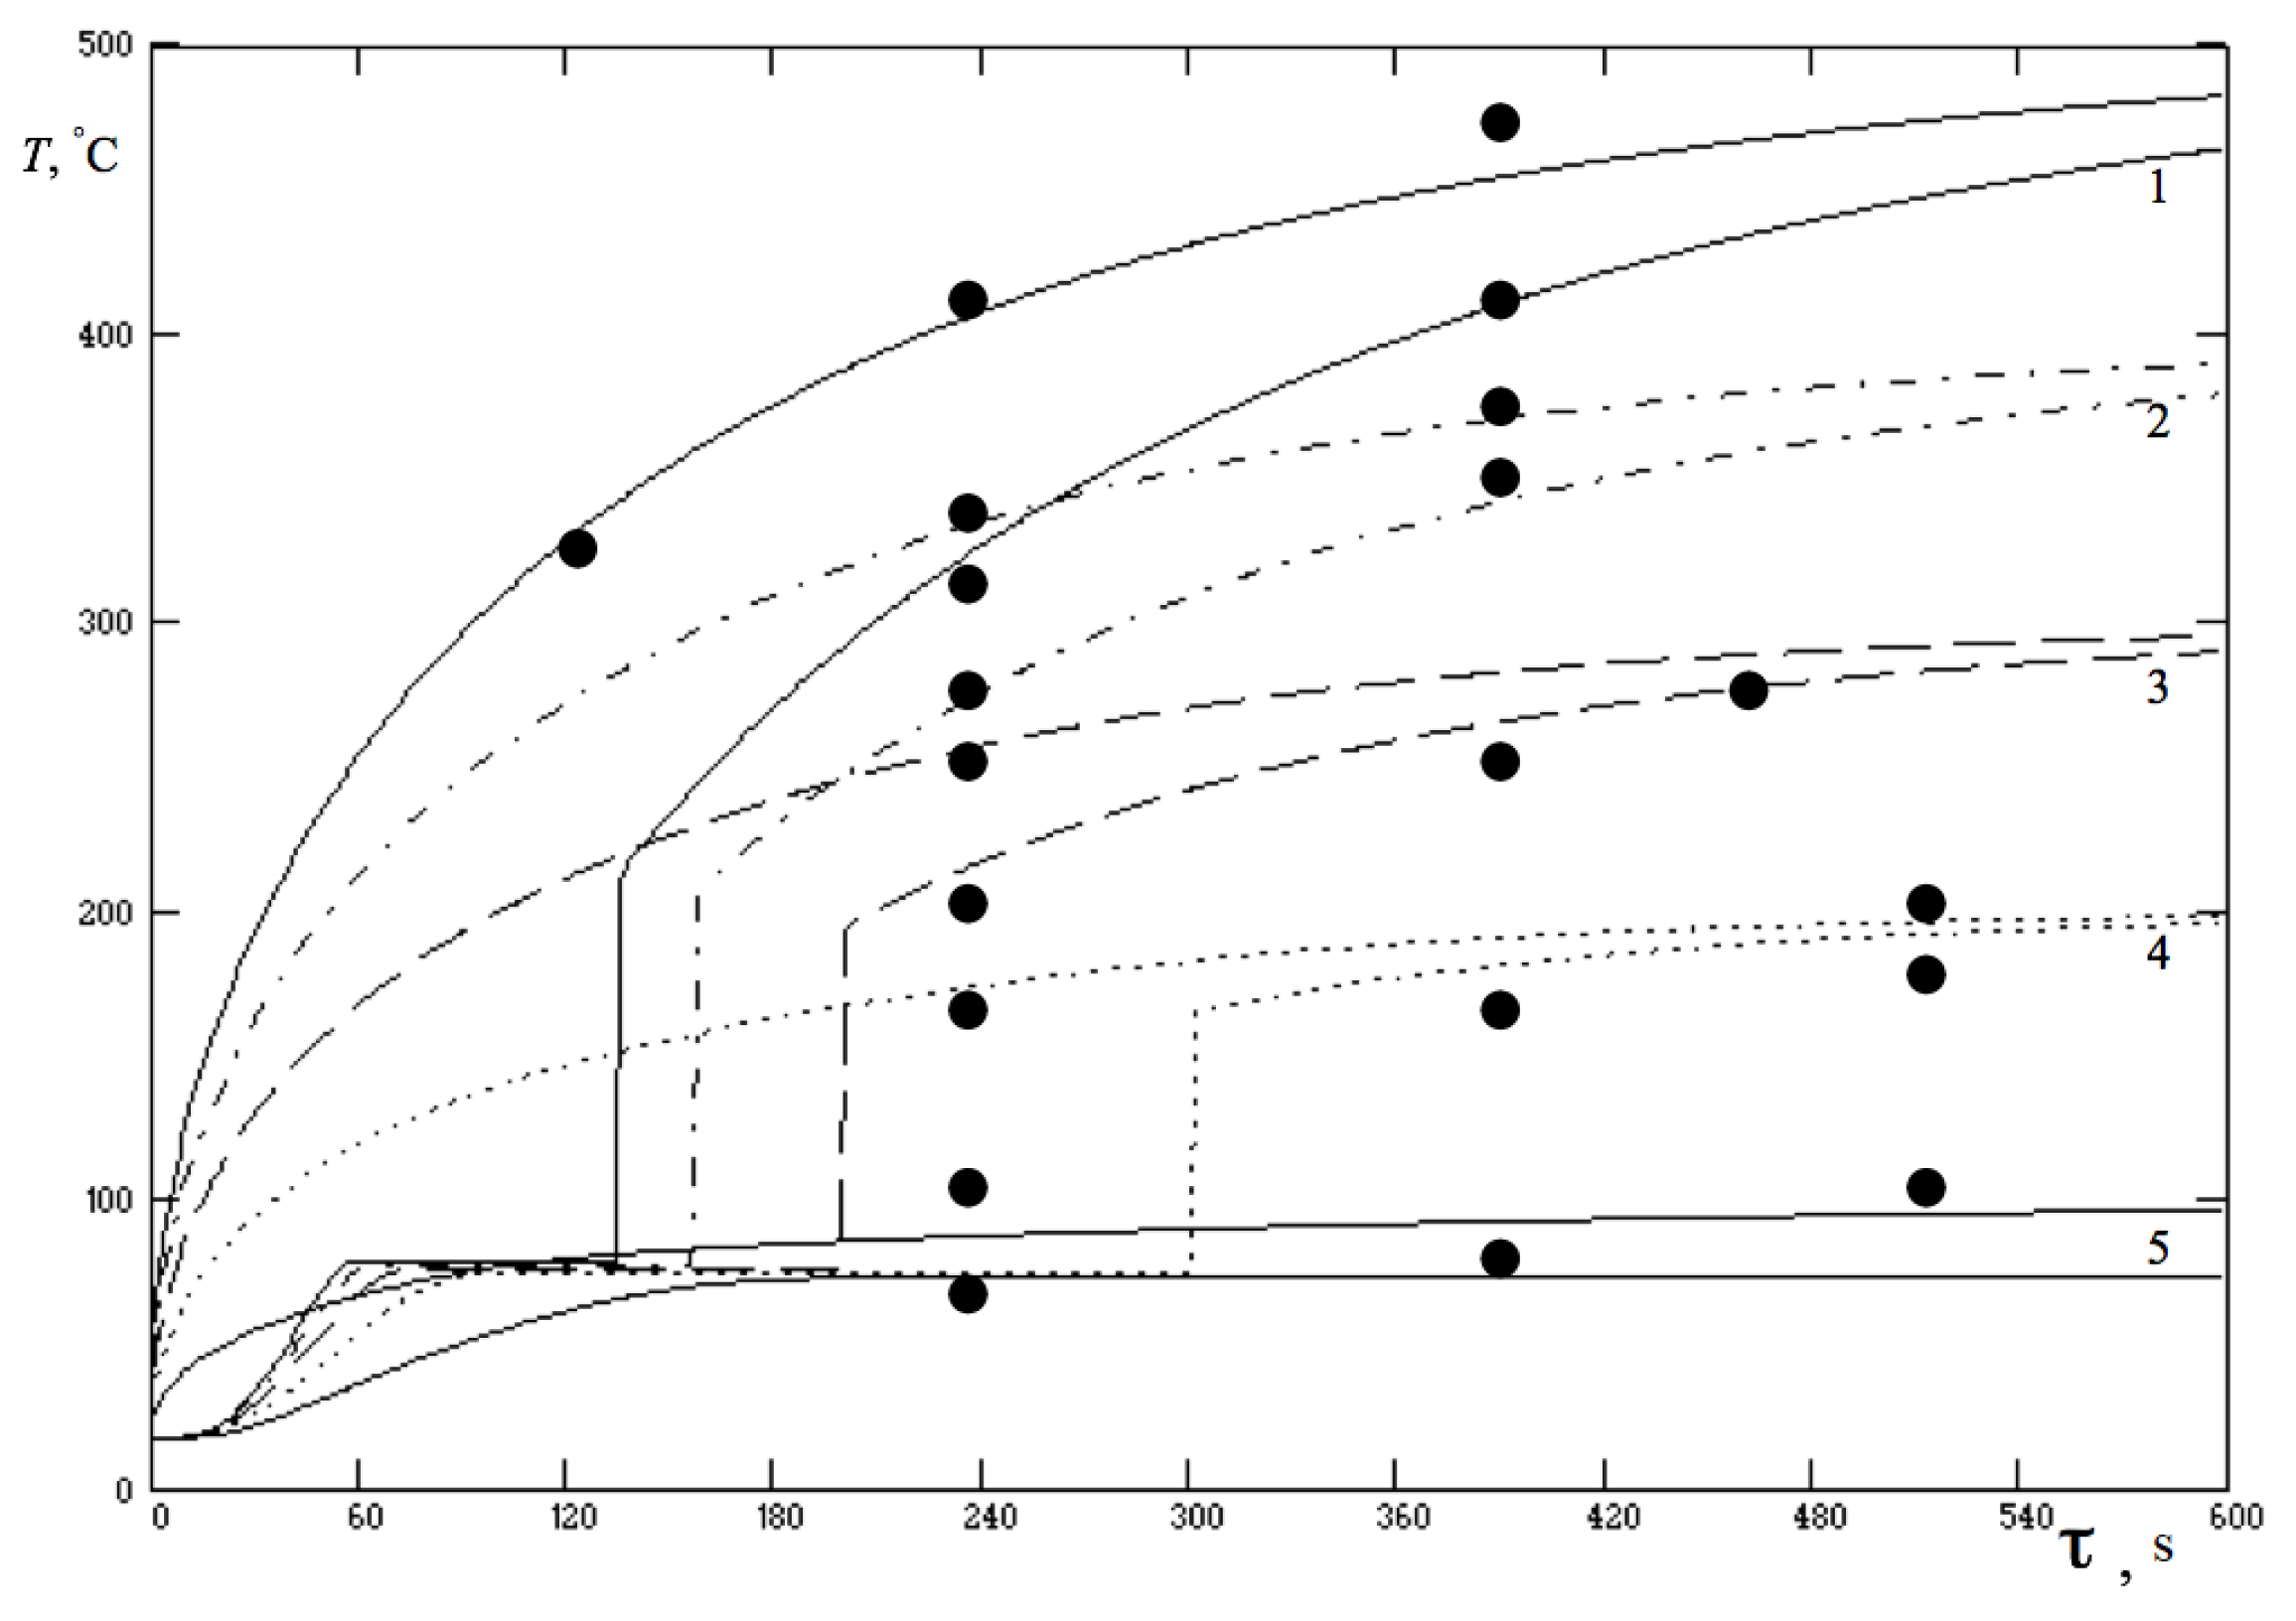
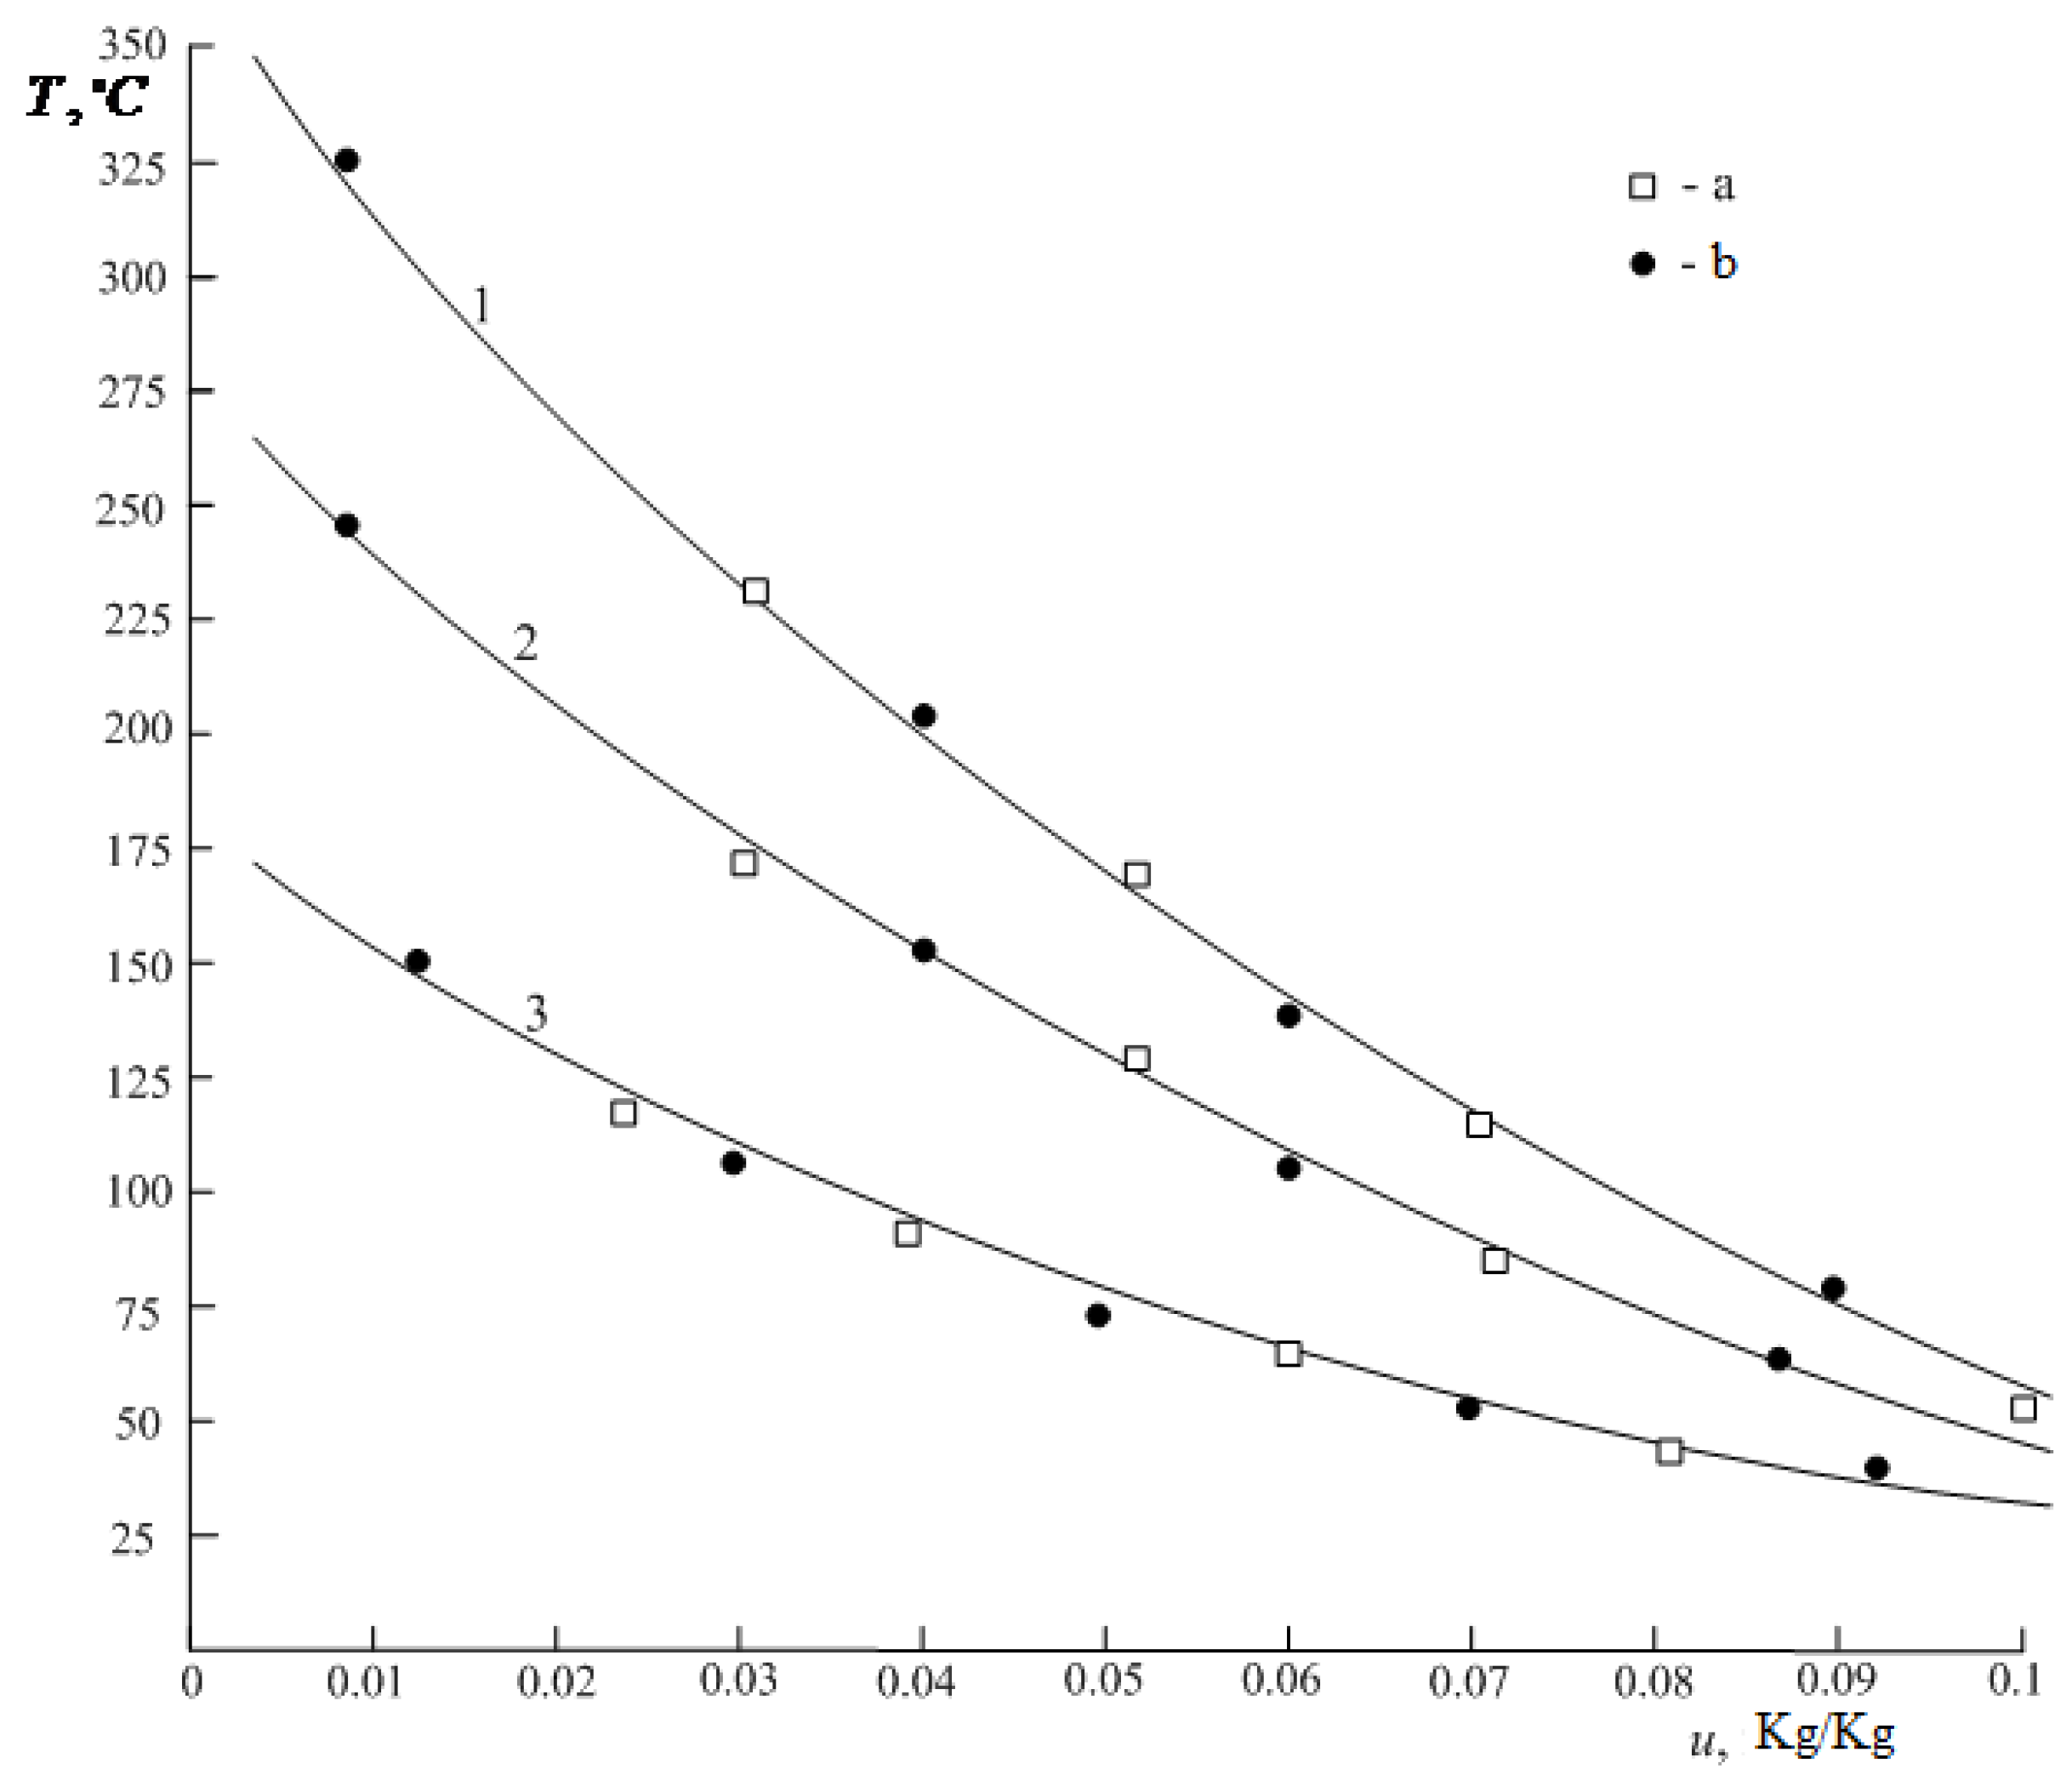
Preliminarily, the model consisting of Equations (1) and (2) only was considered. To confirm the adequacy of the proposed model, we used the boundary conditions: (the pressure at the outer boundary of the pellet sphere is equal to the total ambient pressure) and and (at the evaporation front, vapour pressure and temperature are related by the saturated vapour law) to carry out some numerical experiments to validate Equation (1). The pellet diameter considered was 2 cm, the initial moisture content in the pellet u0 = 10 ÷ 10.5% (which corresponds to the moisture of the raw pellet coming down from the disk granulator), whereas several initial temperatures (temperatures of the drying agent) were considered.
The results obtained (
Figure 5,
Figure 6,
Figure 7 and
Figure 8) match well with experimental data and known qualitative dependencies. The results have proven to be very stable with changing mesh sizes which were allowed to range in the interval (0.5–2.0) with respect to the values given in the
Appendix B. In this range, relative discrepancies were below 1% while execution time increased by less than 50% as the lower step size was selected.
Figure 5 and
Figure 6 show that, as expected, the more intense the drying process, the higher the temperature of the drying agent. At a temperature of 100 °C the drying process does not proceed until the temperature of the material reaches the saturation temperature. The good agreement of computed values with experimental data seems to validate the mathematical model developed for the moving front of evaporation.
Figure 7 shows a pronounced acceleration of the drying process in the first minutes, followed by a slowing down, due to the fact that at first moisture is removed from the surface layers of the pellet, and then the evaporation front moves inward, heat being supplied through the dried layer of material.
Furthermore, the temperature of the wet pellet core, reaching the saturation temperature, remains constant, and the temperature of the dried outer layers increases and approaches the temperature of the drying agent as shown in
Figure 8. Therefore, inside the pellet around the perimeter of the evaporation front, the temperature gradient is especially pronounced, and the larger it is, the higher the temperature of the heat-carrier gas, which can lead to the thermal gradient destruction of the pellet. In addition, the moisture vapour formed at the front of the evaporation diffuses through the dried layer of the pellet, which makes it necessary to take into account the amount of moisture flux
I (kg/(m
2⋅s)). On the basis of experimental data on heat transfer in the process of single pellets drying, critical (limiting) parameters of the heat-carrier gas for pellets of various sizes were determined. For pellets of size 1 ÷ 2 cm and temperature range 150 ÷ 600 °C the moisture flux
I varies from 4 ÷ 16 10
−3 kg (m
2⋅s).
The solution of the combined set of Equations (1)–(6), which correspond to a simple simulation with fixed values of the control variables, has been carried out using finite differences algorithms. The computational scheme is presented in
Appendix B.
The overall algorithm including the dynamic programming step to evaluate the optimal values of the control variables has then been implemented in the Borland C++ environment. Several calculations were carried out using different values of the ratio α1/α2. The parameters of the model were assigned the following values: initial moisture content = 0.114 kg/kg = 10.5%, porosity = εc = 0.35, pellet radius r = 10 mm, conveyor length l = 55 m , , , , = 11%, , , which correspond to sensible assumptions for the multilayer drying process of phosphate pellets in horizontal grate machine systems. The heat-carrier gas is generated in the hearth of the grate machine as a result of fuel combustion, its temperature being regulated by the amount of air excess supplied to the combustion. The physical and chemical input data include water and water vapour properties in the gas phase that are assumed to follow the law of ideal gases, as well as the properties of the phosphate material, i.e., porosity, density, specific heat capacity and heat conductivity.
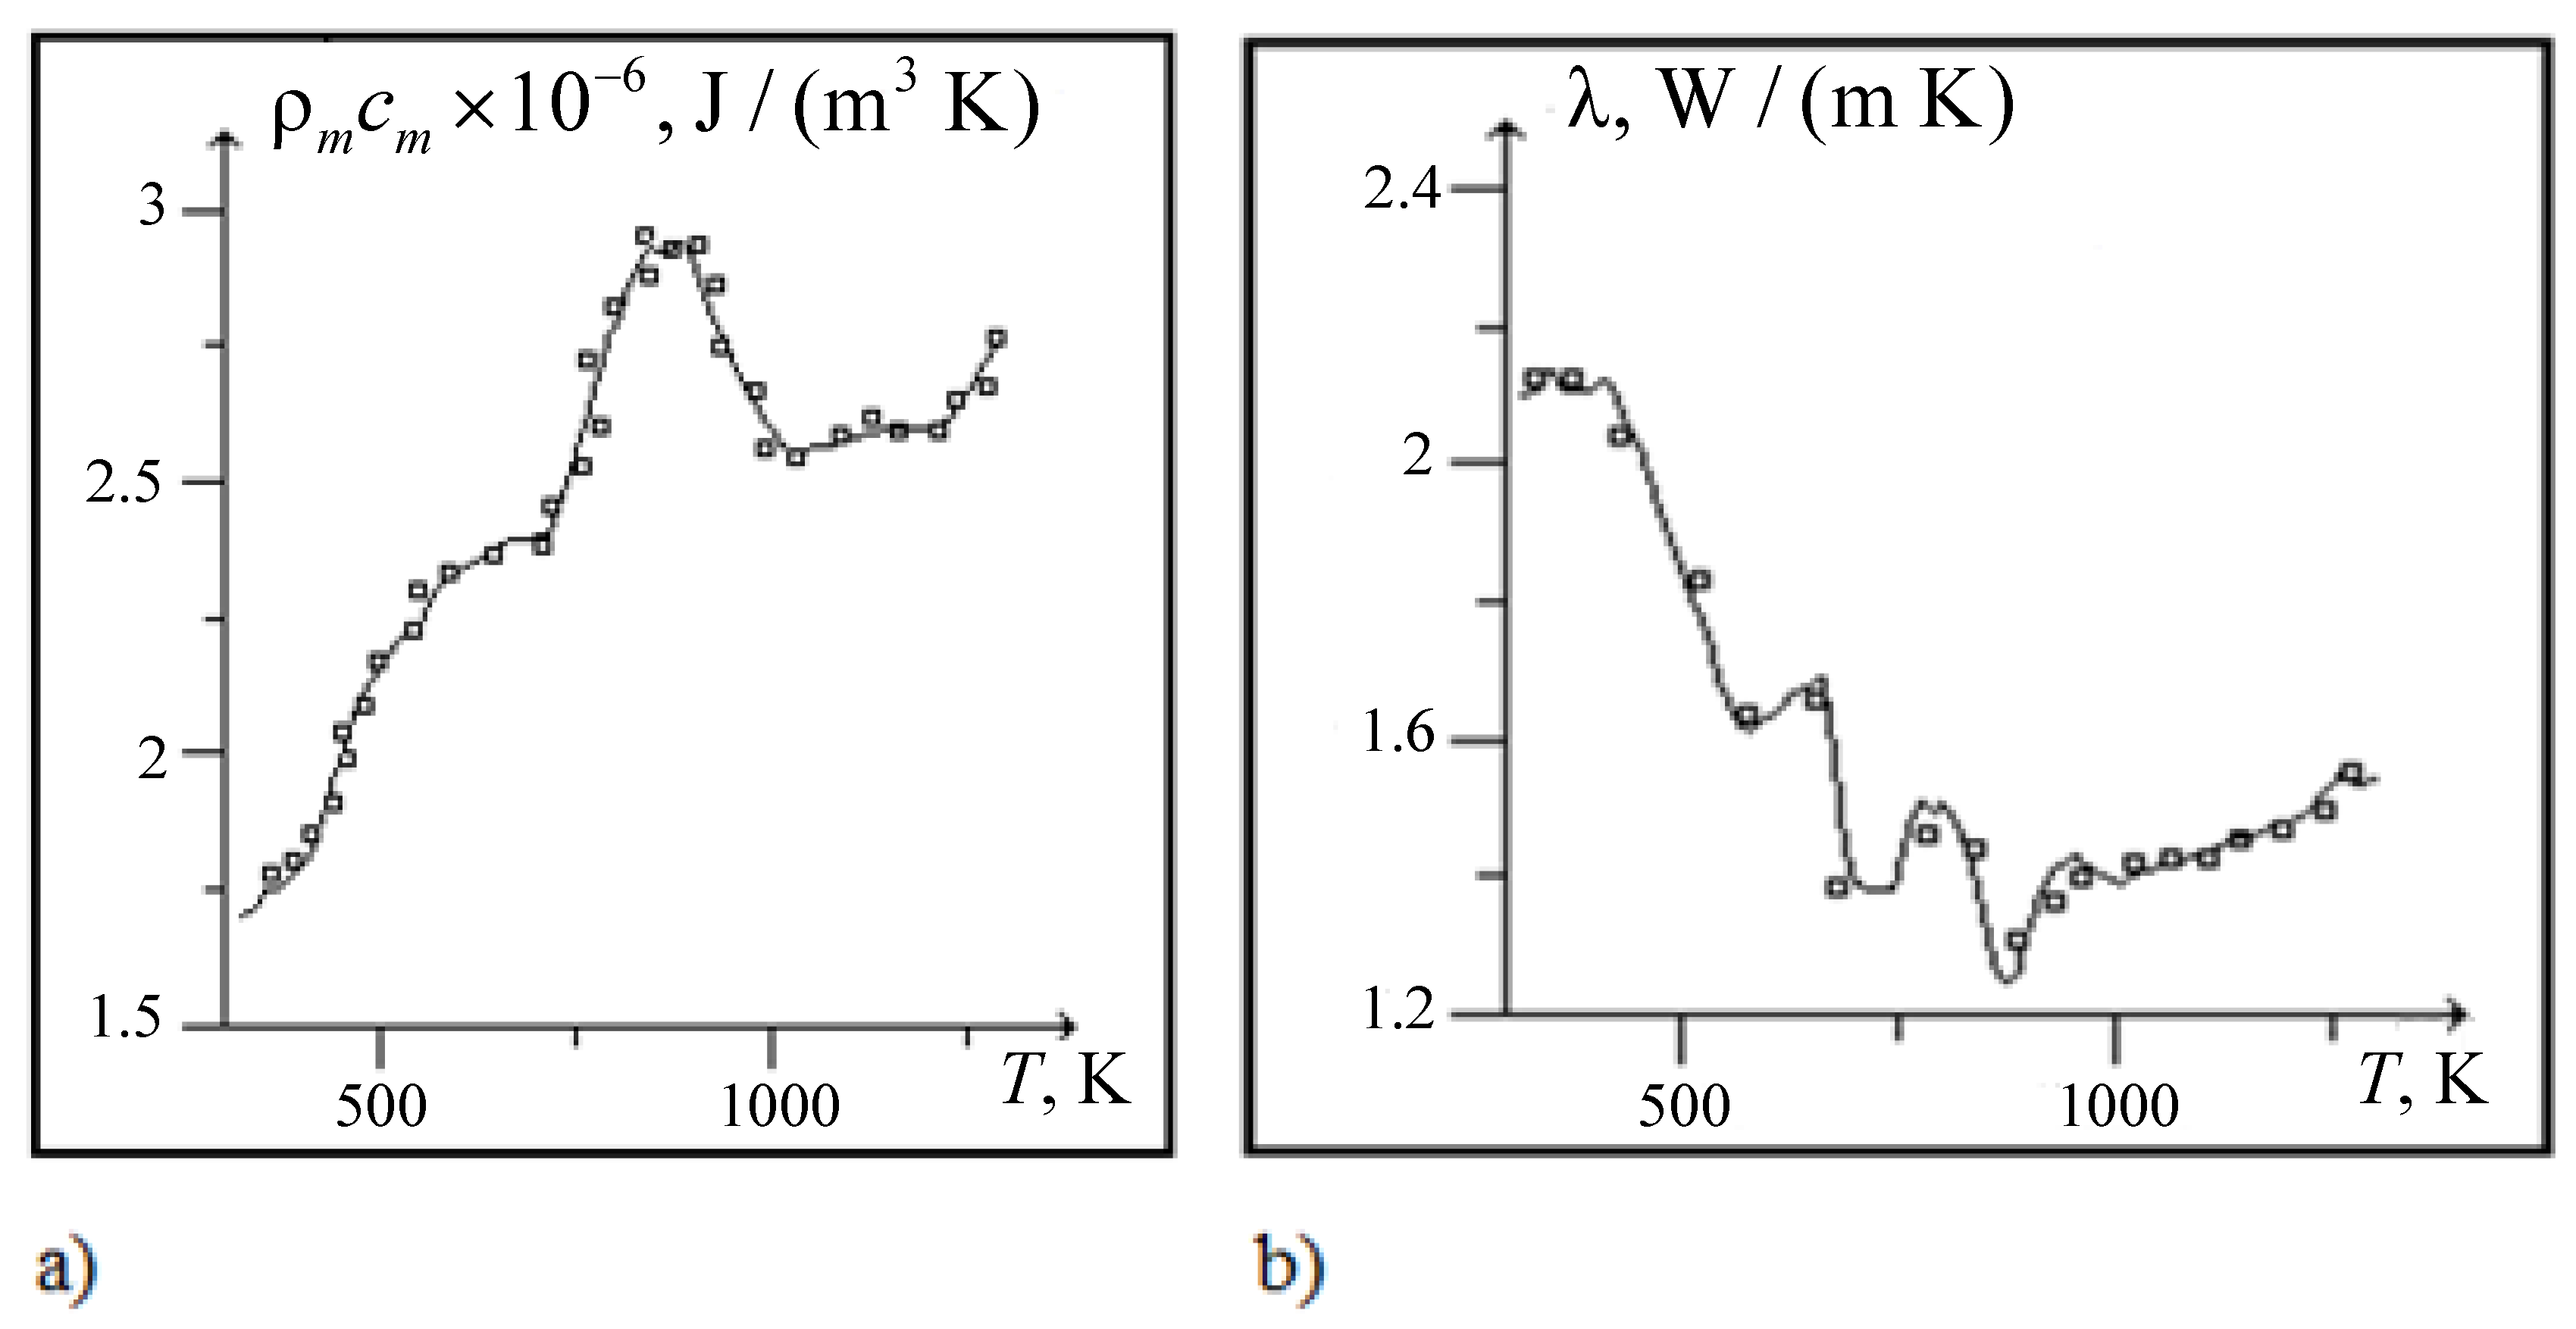
Specific heat capacity and heat conductivity were allowed to change with temperature and their values were obtained by interpolation of the following graphs (
Figure 9).
The results of the numerical simulation for
α1/
α2 = 0.01 are presented in
Figure 10,
Figure 11,
Figure 12 and
Figure 13, this ratio corresponding to a sensible ratio between energy saving and average moisture. Different values could be chosen depending on operating conditions.
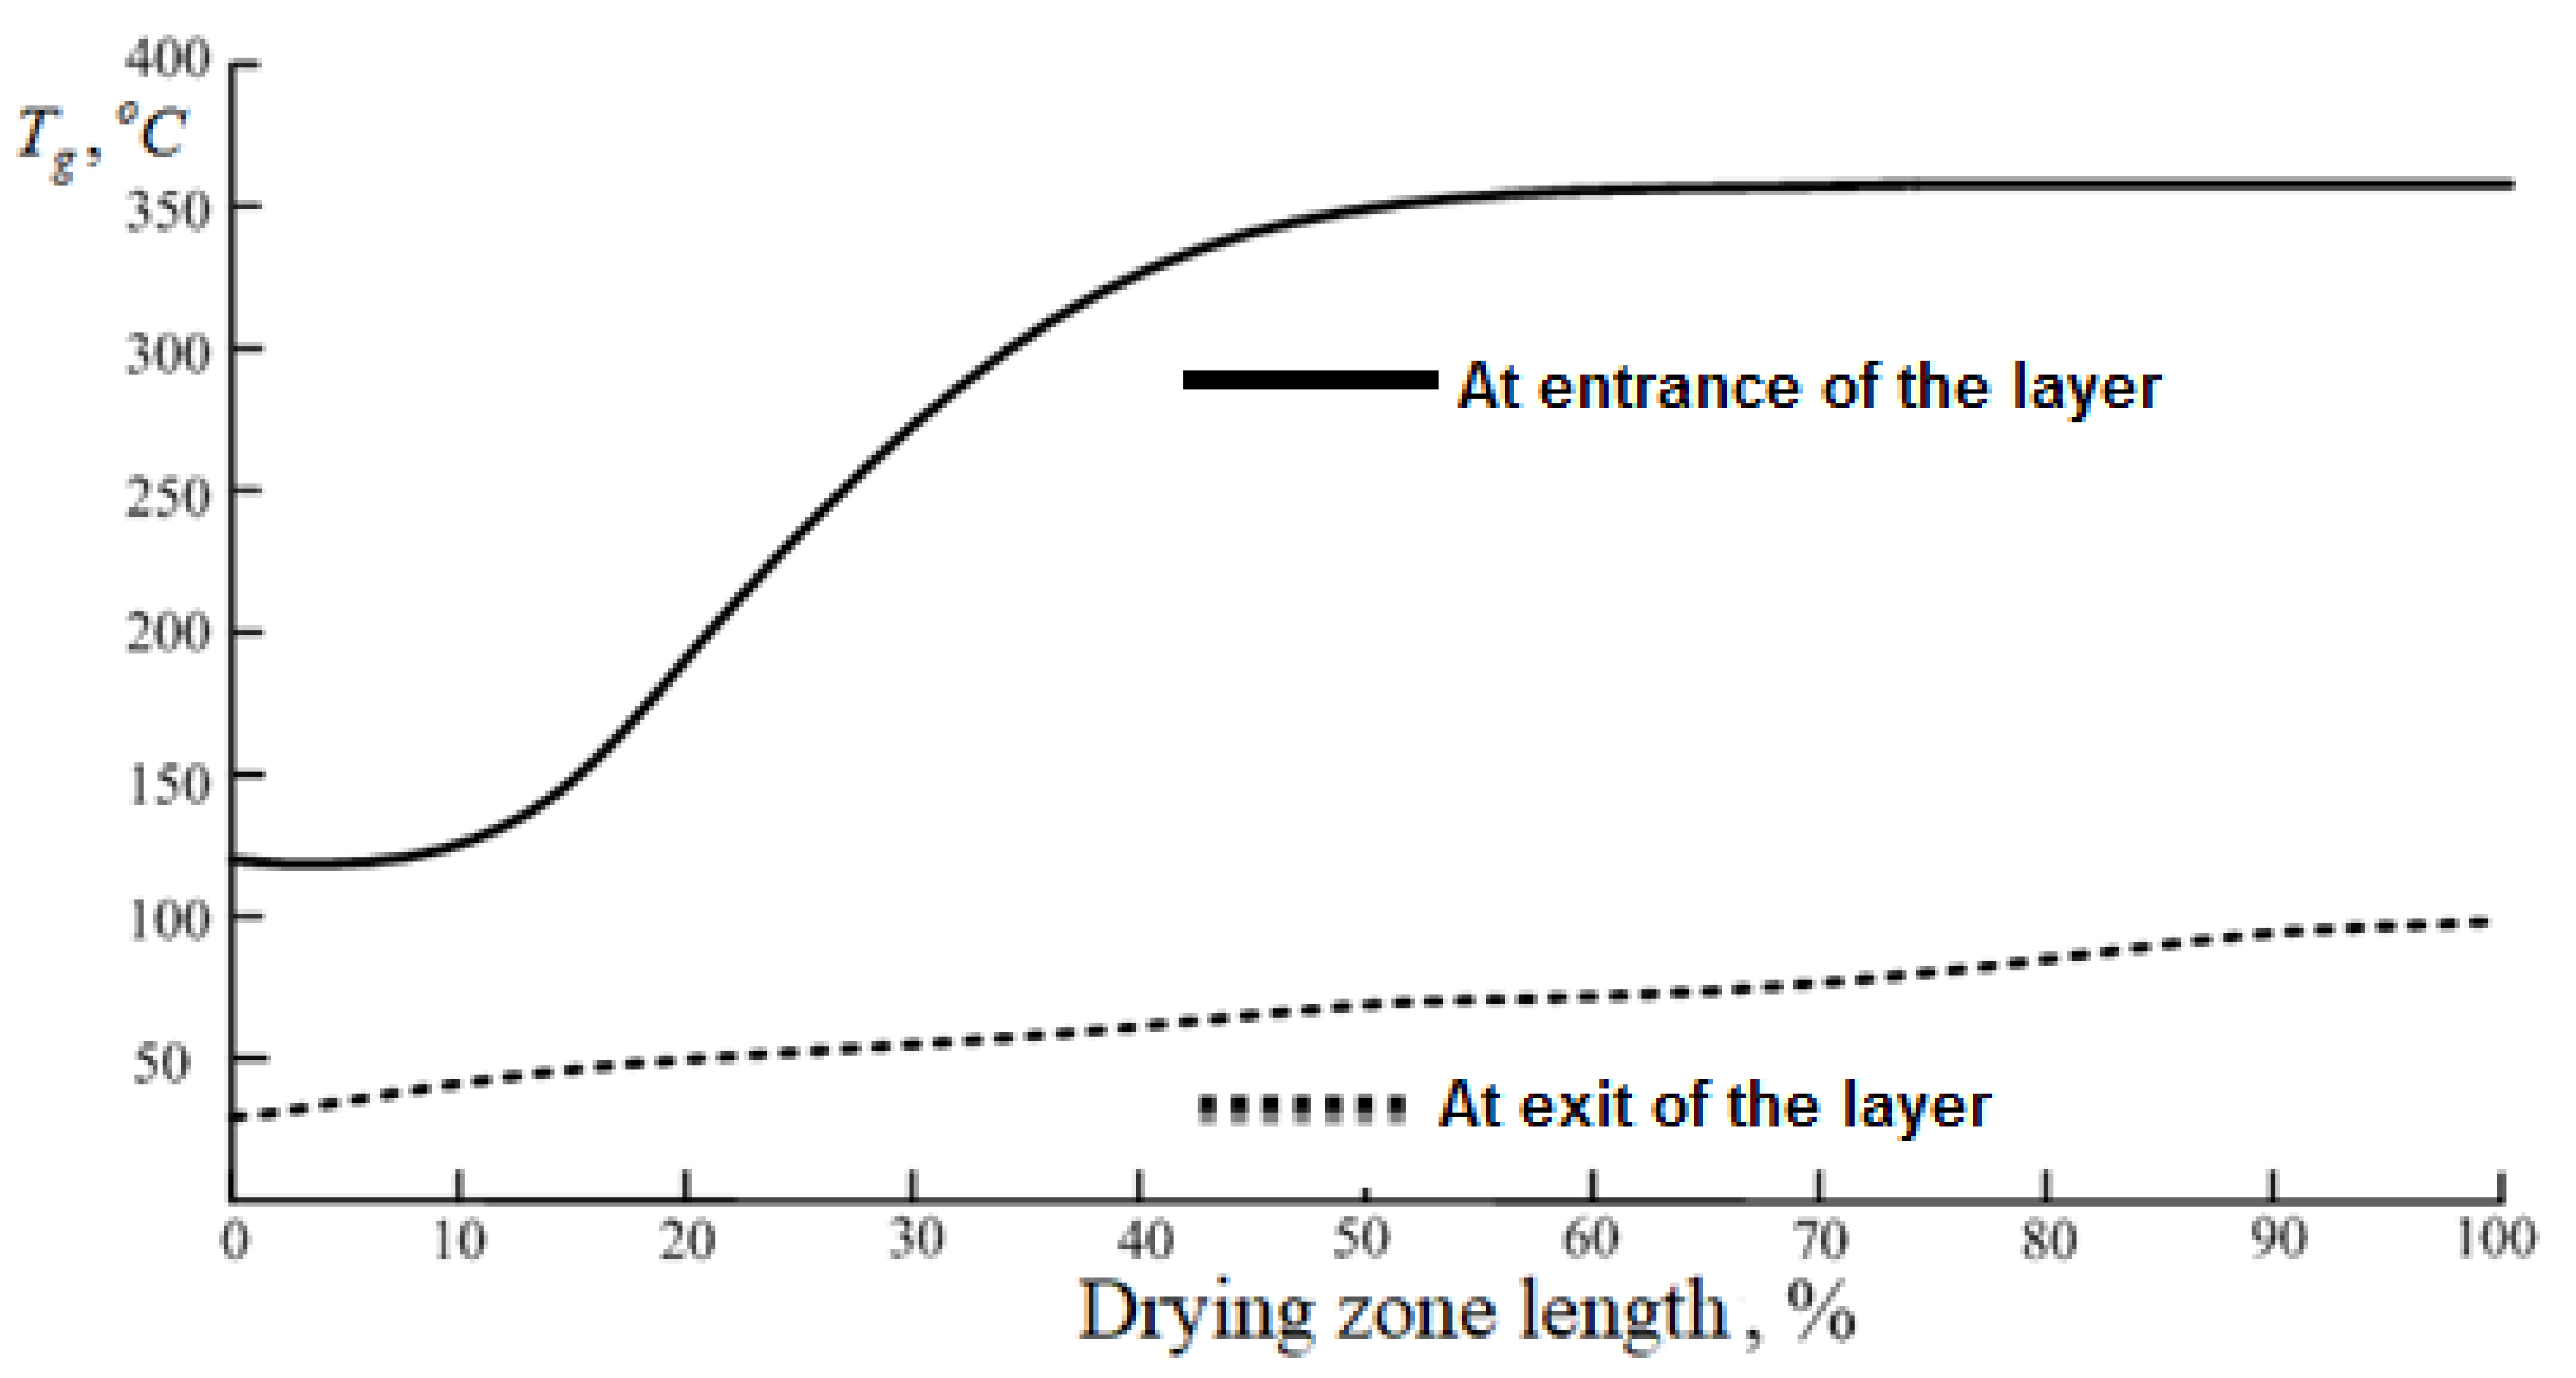
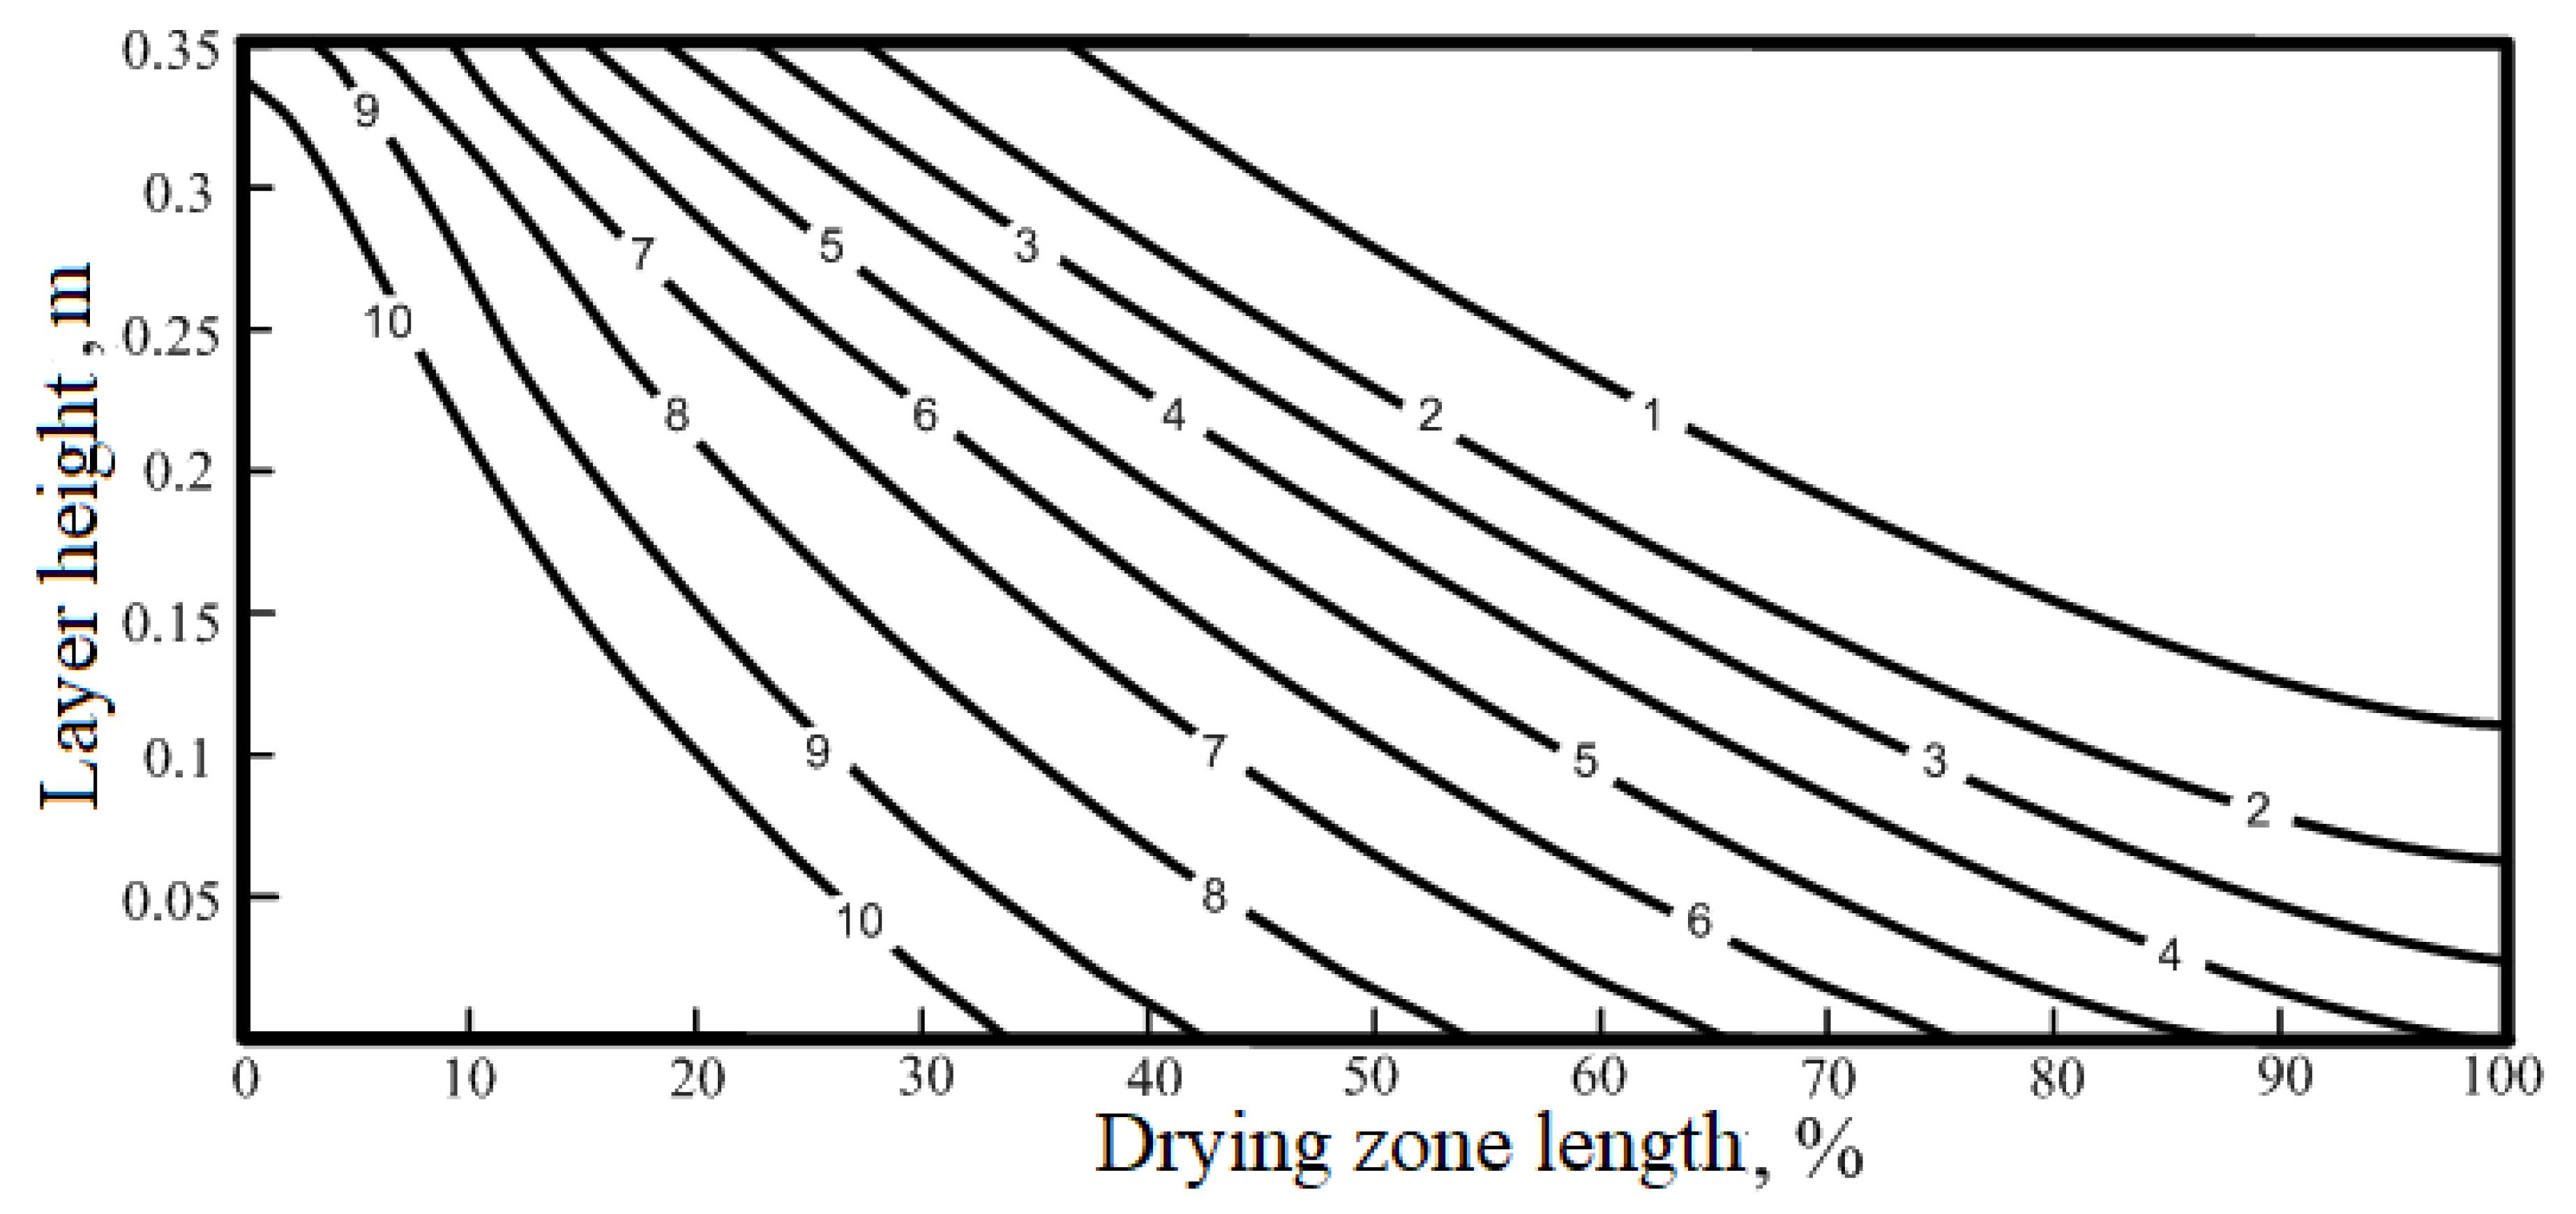
Figure 10 shows that the optimal inlet temperature of the drying gas increases rapidly in the first part of the conveyor due to the growing layer of the dry region in the pellet which generates a temperature gradient. Since the temperature of the drying gas at the moving front has to provide a good heat transfer at all positions of the conveyor, the presence of the gradient requires a higher value of the drying gas entering the layer.
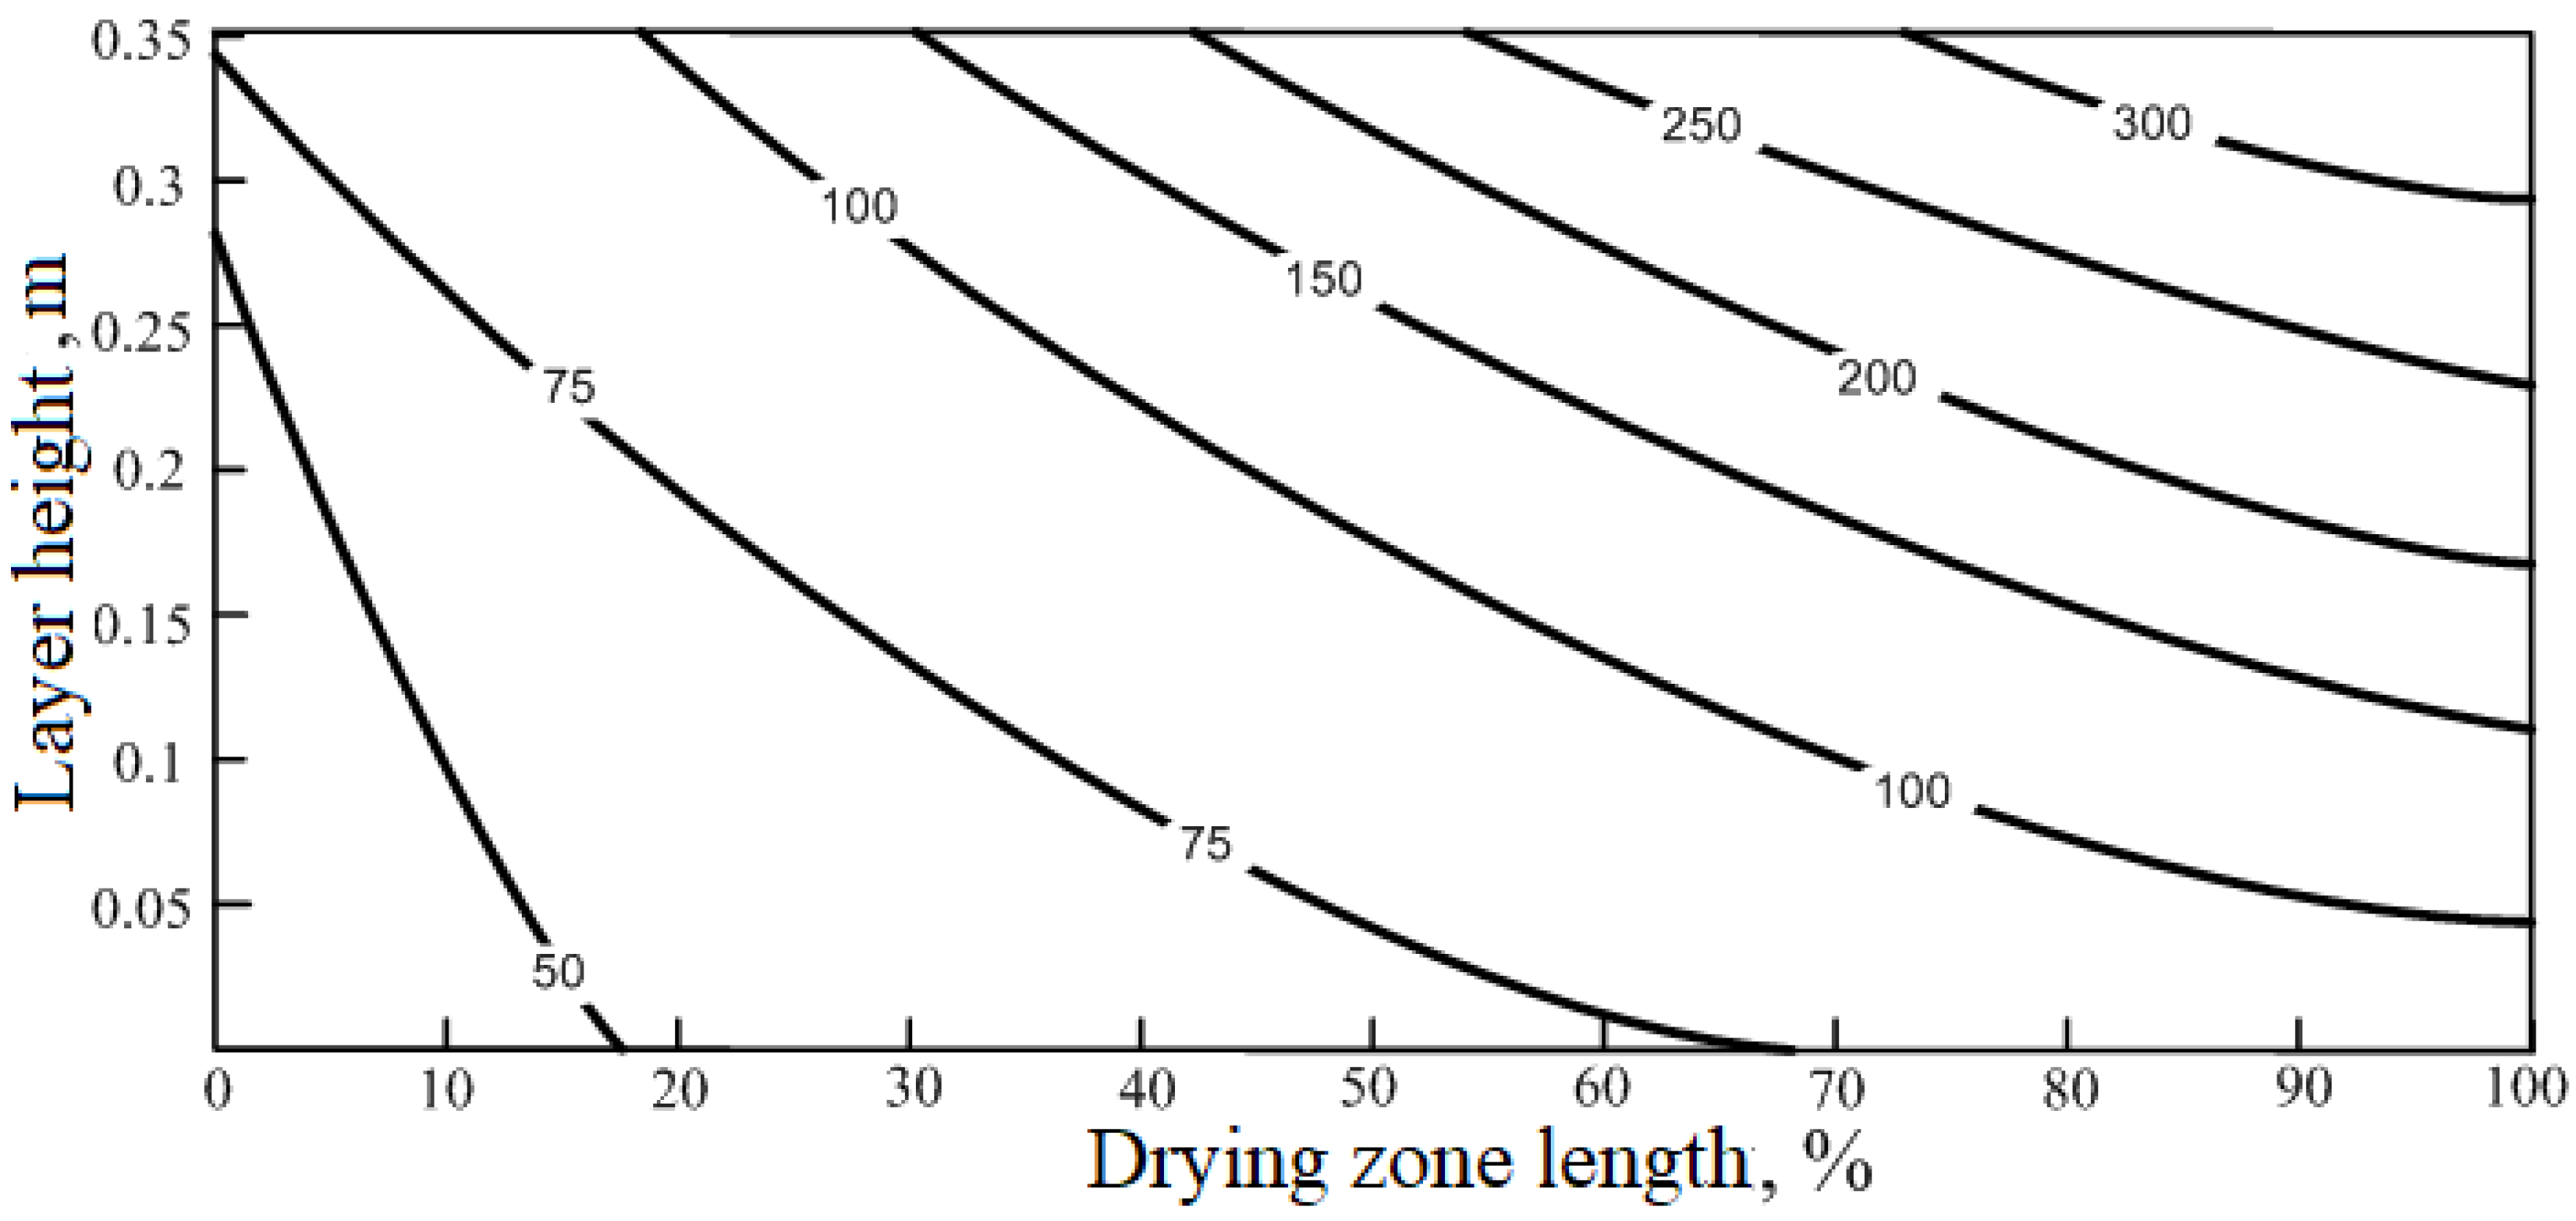
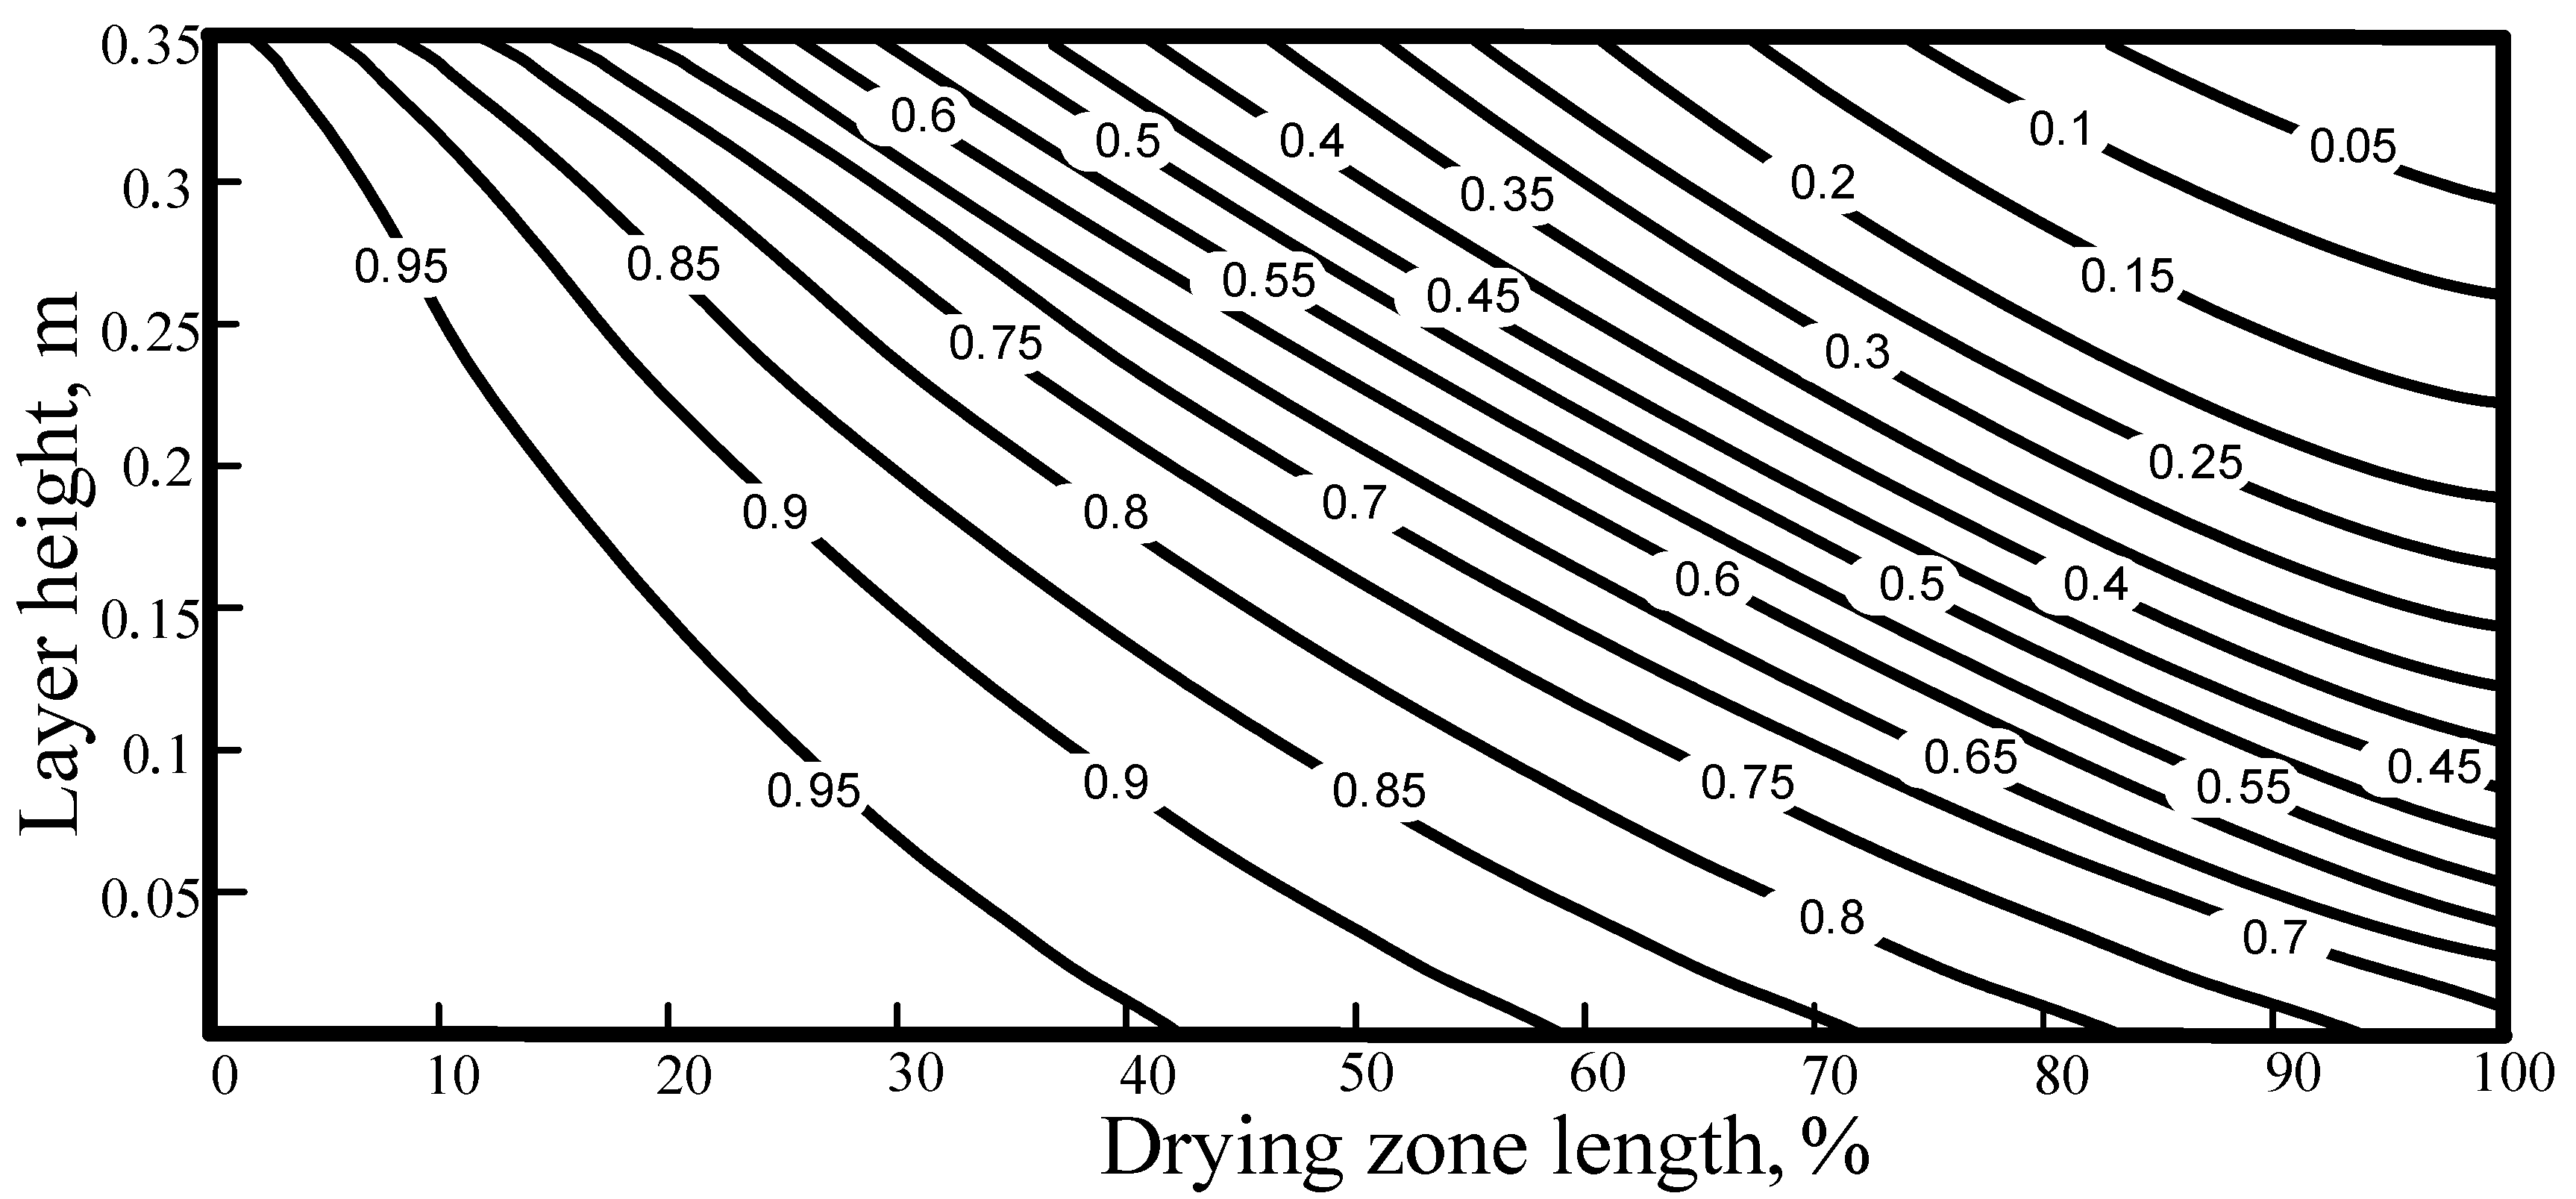
Figure 11,
Figure 12 and
Figure 13 show how the basic variables that characterize the drying process (temperature, position of evaporation front and moisture content) vary with both the progression along the conveyor belt and the distance from the top of the layer. Their values, resulting from the overall optimization procedure, confirm the expected reduction of moisture content and radius of the wet zone, and the simultaneous increase of the temperature of the pellets with increasing distance travelled along the conveyor and with increasing nearness to the top of the layer.
4. Discussion
In this section, an interpretation of the results displayed graphically in the previous section. is provided.
The obtained results were used to calculate the optimal mode of drying of the pelleted raw materials on the OK-520/536F horizontal grate machine.
In all cases examined, the speed of the drying agent throughout the entire drying process remains constant at the highest allowed value of 1.3 ms
−1. The heat-carrier temperature increases slowly, its rate of change being limited by the restrictions on the heating rate, the temperature gradient in the pellet, the proportion of waterlogging and the intensity of moisture transfer [
10]. Furthermore, the growth rate of the heat-carrier temperature is considerably higher in the initial period than in the later stages. Indeed, after reaching a certain limiting temperature, drying takes place at a constant temperature of the heat carrier (
Figure 11). This is due to the fact that the drying process starts only when the temperature of the material reaches the saturation temperature, and the temperature rise of the heat carrier is related only to the temperature gradient in the pellet and the heating transfer rate. After the surface of the material reaches the saturation temperature, the evaporation of moisture begins and the intensity of moisture transfer is the highest (
Figure 12), because the outer layers have a larger surface and volume. After the outer layers of the pellet have dried, the front of evaporation moves into the interior of the pellet. Since the surface of the moving front decreases, so does the intensity of drying.
As the drying agent moves through the layer from top to bottom, it is moistened in the upper hotter layers, where the drying of the material is most intense. Moving down to less heated layers of the multilayer mass, the heat-carrier gas cools down and, when it reaches the dew point, moisture condensation onto the surface of the pellets begins. Therefore, an increase in the temperature of the upper layers of the pellets and the intensification of their drying does not provide the best overall drying throughout the multilayer mass. Moreover, the process of overwetting the pellets by more than a certain amount (≈14%) would be unacceptable in the technology of heat treatment of the pellets and would require an increase of the ratio
α1/
α2. Therefore, the optimization algorithm provides a strategy in which the temperature of the heat carrier increases moderately, intensifying the average drying process over the layer, and preventing overwetting of the material [
23], while removing the maximum possible amount of moisture from the layer, depending on the properties of the heat carrier and the material of the pellets. The moisture content of the material varies fairly evenly (
Figure 13) and the relative degree of drying increases, so as to ensure the maximum possible wetting of the drying agent due to an increase in the speed of advance of the evaporation front in the pellet (
Figure 12).
The reduction of the environmental impact of the operating conditions identified by the optimal design described in this paper provide energy saving (approximately 1.1 tonne of fuel equivalent/tonne of finished product in the example considered using the same input data), and intensification of the drying process, while satisfying all the technological limitations which results in improved quality of the finished product as well as in resource saving due to the reduced amount of the material that has to be returned.
5. Conclusions
Optimization tools have long been used in the design and operation of chemical processes. They have constantly been evolving in an attempt to provide more and more efficient manufacturing plants capable of reducing both production costs and development time in a growingly competitive business context while complying with increasingly strict environmental regulations.
While the case examined in this paper was limited to a specific industrial process, i.e., the roasting of phosphorous pellets, the general methodology considered can be applied to a large number of industrial models. Indeed, the usual mass and energy transport phenomena that take place in chemical processes give rise to complex systems of partial differential equations whose solutions are to be interfaced to suitable optimization algorithms for the determination of optimal control variables. The more sophisticated the physical-chemical model used to describe the transport phenomena, the more reliable the resulting optimization configuration.
Therefore, the new challenges include presently an analysis of the reliability of the constitutive equations employed, frequently subjected to simplifications to reduce their complexity such as linearization, as well as of the accuracy of the parameters contained in them.
On the other hand, the use of rigorous, complex physical-chemical models is often hampered by the necessity of keeping the computational burden within bounds. Indeed, the optimization algorithm to which these models are interfaced require a high number of onerous iterations due to the impossibility of using derivatives and to the possible presence of non-convexity and discontinuities. Similarly, a high level of accuracy in the identification of the parameters present in the models may require a costly experimental campaign, so that a trade-off between accuracy and costs is frequently accepted.
The assumption of quasistationarity of fields of temperature and pressure in the dried zone of the pellets, the absence of heat exchange between pellets and the use of parameters taken from the literature in this paper are examples of the necessity of this trade-off and constitute the main limitations of the procedure developed.
Suggestions for further work include precisely the attenuation of these limitations by improving the accuracy of both models and parameters to investigate their impact on the overall optimization strategy.
