Article

ATR-FTIR Model Development and Verification for Qualitative and Quantitative Analysis in MDEA–H2O–MEG/TEG–CO2 Blends

Department of Chemical Engineering, Norwegian University of Science and Technology (NTNU), 7491 Trondheim, Norway
*
Author to whom correspondence should be addressed.
Energies 2019, 12(17), 3285; https://doi.org/10.3390/en12173285
Submission received: 26 June 2019 / Revised: 2 August 2019 / Accepted: 20 August 2019 / Published: 26 August 2019

Abstract

:
A Fourier transform infrared (FTIR) spectroscopy method was developed to identify and quantify various components in an amine-based combined acid gas and water removal process. In this work, an attenuated total reflectance (ATR) probe was used. A partial least-squares (PLS) regression model was also developed using up to four components (methyl diethanolamine (MDEA)-H2O-CO2-ethylene glycol/triethylene glycol (MEG/TEG)), and it was successfully validated. The model was applied on thermally degraded CO2-loaded MDEA blends to predict the weight percentages of MDEA, H2O, CO2, and MEG or TEG to test the performance spectrum. The results confirmed that FTIR could be used as a simpler, quicker and reliable tool to identify and quantify various compounds such as MDEA, MEG/TEG, H2O and CO2 simultaneously in a combined acid gas and water removal process.

Graphical Abstract

1. Introduction

Norway produced 124.16 million Sm3 oil equivalents of natural gas (NG) in 2017, which is 5.96% higher than in 2016 (Source: The Norwegian Petroleum Directorate (https://www.norskpetroleum.no/en/facts/production/)). Natural gas has impurities such as acid gases (hydrogen sulfide (H2S) and carbon dioxide (CO2)), water vapor, and mercury, etc. CO2 in the presence of water vapors can cause corrosion, and it can also reduce the heating value of natural gas [1,2,3]. H2S is a poisonous gas and can cause instant death at concentrations over 500 parts per million (ppm) [4,5]. Moreover, water vapor and methane can form ice-like solids called hydrates, increasing the corrosion rate and/or plug gas pipelines [6]. Conventionally, acid gases and water vapor are removed separately from natural gas before its use; this two-step process increases the investment and operational costs [7,8]. Absorption by using alkanolamines is the most commonly used technology for natural gas sweetening and CO2 capture processes, while tertiary amines (like methyldiethanolamine) are known to absorb H2S selectively [9]. Ethylene glycol (MEG) and triethylene glycol (TEG) are used for H2O removal and hydrate control [10]. Norway natural gas production mostly comes from offshore facilities. Therefore, developing combined subsea selective acid gas (H2S/CO2) removal along with water vapor will reduce both the environmental footprint and the operational costs. Hutchinson, McCartney, and Chapin studied combined acid gas and water removal [11,12,13,14]. A blend of MEA and diethylene glycol was the first system used for combined acid gas removal and dehydration, but it is no longer considered competitive due to high amine degradation and severe corrosion at a high reboiler temperature [9]. Tertiary amine systems, like a blend of methyl diethanolamine (MDEA) with glycols (MEG/TEG), have lower amine degradation and corrosion rates [9,15]. Therefore, MDEA blends with MEG/TEG were also recently explored for simultaneous acid gas and water removal [16,17].
Fourier transform infrared (FTIR) spectroscopy has previously been used as an analytical technique to monitor online reaction chemistry [18]. Molecules’ dipole movements due to molecular deformations are measurable in the mid-IR region (4000–400 cm−1), which allows many chemical compounds to be identified and quantified [19]. FTIR with a partial least-squares (PLS) model has been used as an alternative calibration technique for real-time performance monitoring. It requires calibration and validation datasets, which cover a full range of process gas pressures and amine concentrations, however, this combination does not provide accurate results outside the calibration and validation dataset [19]. The FTIR and PLS combination has been used successfully to extract process information data from the CO2 absorption system [20] and also from the simultaneous absorption of the CO2 and SO2 in a pilot plant [21]. Furthermore, FTIR was used to measure both inorganic and organic compounds in amine-based post-combustion carbon capture (PCCC) in flue gas [22,23,24] and also in an ammonia-based CO2 capture process [25]. Also, it was used to measure the concentrations in the simultaneous absorption of CO2 and H2S in the aqueous methyldiethanolamine (MDEA) system [26]. Cuccia et al. reviewed the data available in the literature where FTIR was used to analyze degradation byproducts in the liquid phase for post-combustion CO2 capture processes [27]. Handojo et al. [28] used FTIR to identify thermal degradation byproducts in aqueous MDEA degradation at 120 °C with continuous CO2 absorption and verified it with GC-MS. Haghi et al. [29] used a PLS model with both near-infrared and ultraviolet spectroscopy to determine the concentration of both MEG and sodium chloride in solutions. A combined acid gas and water removal system solvent can consist of amine and MEG/TEG, and during the regeneration step it will also have absorbed water and acid gas, which need to be stripped for the regeneration of the solvent. To the best of the authors’ knowledge, there are no published data available on the use of FTIR to measure the concentrations of individual components in the MDEA–glycol–water–acid gas system. Therefore, in this study, we investigated the potential of FTIR spectroscopy along with the partial least-squares (PLS) method to predict the amount of glycols (MEG/TEG), MDEA, CO2 and H2O, where they are present in the system, in a simultaneous acid gas and water removal process. The model was successfully tested on thermally degraded CO2-loaded MDEA-MEG/TEG-H2O blends to confirm its performance spectrum.

2. Materials and Methods

2.1. Materials

All the chemicals were bought in the highest available commercial concentration from Sigma Aldrich Norway, except carbon dioxide gas which was purchased from AGA Norway. These chemicals were used without any further purification. The full names, chemical abstracts service (CAS) numbers, purity, and structures of the chemicals used in this study are given in Table 1.

2.2. Methodology

In this work, two-, three- and four-component systems were studied. A description of each system, along with calibration solution concentration ranges, is given in Table 2. In the first step, solutions and calibrations for two-component systems (MDEA-H2O, MEG-H2O, and TEG-H2O) were made and validated for each component; in the second step, a third component was added and validated along with the first two components; in the third step, after adding the fourth component, i.e., CO2, total spectra were used to make a final calibration curve and all the individual components were also validated.

2.2.1. Calibration Solution Preparation

The calibration solution sets of each system were made to cover the complete concentration range of all components. All solutions were prepared in wt%/wt% using the Mettler–Toledo scale, model MS6002S, with an accuracy of ±0.0001 g. In the case of two-component solutions, 5 wt% steps were used except in the boundary regions (1–10 wt% and 90–99 wt%), where the ratio was varied in 1 wt% steps. For the three-component systems, one component was kept constant at 30 wt%, while the other two were changed. In the four-component systems, only CO2 loading was varied. A 20 wt% MDEA solution in 50 wt% water and 30 wt% glycol (MEG or TEG) was loaded with CO2 using a washing flask. Then, fresh and CO2-loaded solutions were mixed to make multiple solutions for the calibration set and titration [15,30,31] was used to determine the exact amine and CO2 amounts in all solutions. In total, 371 calibration solutions for various training sets were prepared—37 each for two- and four-component systems and 31 each for three-component systems—to cover the whole range of concentration (0–100 wt%) of each component in each system. Large training sets in each system were used to increase the accuracy of the model in lower concentration ranges of the individual components (<5 wt%).

2.2.2. FTIR Analysis

An ABB FTLA2000 Series Laboratory FTIR Spectrometer with PIKE MIRacleTM diamond attenuated total reflection (ATR) crystal cell in combination with the Protea Analyzer software (PAS) was used to collect spectra of each solution in the spectral region of 700–4000 cm−1 with 4-cm−1 increments and 4 co-added scans. Continuous purging with clean and dry compressed air with a CO2 concentration <1 ppm and dewpoint of −73 °C was used to minimize the influence of CO2 and H2O on the system. All the spectra were collected at room temperature and millipore distilled water spectra were used as a background.

2.2.3. Multivariate Analysis

GRAMS IQ™ Spectroscopy software from Thermo Fisher Scientific was used to make calibration curves. The partial least square (PLS) regression model was used to minimize the overlapping interference of spectral information. It can be described as follows:
X =   T P T + E
Y =   U Q T + F
where X is the predictor matrix and Y is the response matrix; T and U are projection matrixes, and P and Q are loading matrixes of X and Y, respectively, while E and F are independent and identically distributed residuals [32]. Regression is only applied to informative regions in the fingerprint area to construct a better model and to minimize the effect of absorbance overlapping [33]. A similar method was used in all systems, i.e., in the two-, three- and four-component systems.
Spectral data were randomly divided into a training set, which was used for internal validation (cross-validation) and a validation set used to verify the model for external validation before applying the model to measure unknown concentrations. The preprocessing of data was performed by making it mean-centered by subtracting the mean absorbance and concentration from its original value. This increased the accuracy of the calibration curve by removing the common information from the spectra and improved the smaller spectral differences [34,35]. The number of factors (loading vectors) was based on the standard error of cross-validation (SECV), which corresponds to the predictive error obtained at the cross-prediction stage, root mean square error (RMSE), and maximum possible correlation coefficient (R2) for each component to generate calibration curves. Outliers in the calibration dataset were detected by calculating residuals with a 95% confidence level during the development of the model [29,36,37]. Equation (3) was used to measure RMSE, Equation (4) was used for SECV and standard error (SE) and Equation (6) was used to calculate the validation number (VN) of each component in a system. The standard error of the PLS model was calculated for each component in a system after incorporating bias and the validation number was estimated to find the model accuracy, where, if the VN <2, the model does not work accurately and if VN = 2–5, the model does work, but it works best for VN >5.
R M S E   =   i = 1 i = n x i y i 2 n
S E   =   i = 1 i = n x i y i b i a s 2 n 1
b i a s   = i = 1 i = n x i y i n
V N = 0.25   × x m a x x m i x S E
In the equations, xi is the actual value and yi is its respective predicted value by the PLS model of sample i, and n is the number of samples. IQ Predict™ was used to measure the unknown concentrations of individual components in solution by using spectra of the solution and calibration files generated from GRAMS IQ™.

2.2.4. Thermal Degradation

Thermally degraded solutions were used to test the performance range of the model. Solutions of 30 wt% MDEA in MEG/TEG and 20 wt% MDEA in 60 wt% MEG/TEG and 20 wt% H2O were prepared gravimetrically and loaded with CO2 by using a washing flask. Approximately 9 g of each solution, along with its duplex, was filled in stainless steel cylinders with both ends closed with Swagelok® end caps. The cylinders were stored in a thermostat chamber at 135 °C in the upright position and samples were taken after week 1, 3, 5 and 7. MDEA and CO2 chemical weight (%) were also quantified by using titration [15,30,31] while ion chromatography (IC) was also used to measure the concentration of amine. Complete experimental details on amine thermal degradation are presented in our previous works [15,38]. The IC analyses of amine samples confirmed that the titration quantified the MDEA within ±3 wt%. Therefore, both the MDEA and CO2 concentrations measured by titration were used to calculate actual weight percentages of MDEA and CO2 as discussed in the section below.

3. Results and Discussion

3.1. Model Development

Identifying and quantifying the correct individual component in each system is critical. All the spectra of each component MDEA, MEG, H2O, and CO2 are shown in Figure 1, and the spectra of each component MDEA, TEG, H2O and CO2 are shown in Figure 2. In both figures, water spectra as a background was used for spectra collection and subtracting this from sample spectra caused major negative peaks (~1650 cm−1 and >3000 cm−1). Other small negative peaks in the fingerprint regions could be due to impurities in the system.
The infrared (IR) spectrophotometer generated a spectrum that consisted of two main regions: (a) the fingerprint region (800–1800 cm−1), where absorption bands can be assigned to individual functional groups [35,39], and (b) the region between 2500 and 4000 cm−1, which usually comes from hydrogen stretching vibrations between hydrogen and other atoms (N–H, C–H and O–H)—this region does not provide useful information [19,39]. Also, diamond absorption happens within the 1950–2250 cm−1 region [19,39,40]. It is only the information from the fingerprint region that is used in all systems for model development.
The MEG, TEG and MDEA peaks overlap each other in most of the fingerprint region (800–1200 cm−1). MEG twin peaks can be found at approximately 850–900 cm−1 and 980–1120 cm−1, TEG twin peaks at approximately 980–1160 cm−1 and 880–960 cm−1 and MDEA peaks at approximately 1000–1100 cm−1 and 870–900 cm−1 due to C–N stretching. CO2 is present in the solutions as carbonate (maximum at 1385 ± 5 cm−1) and bicarbonate (maximum at 1360 ± 3 cm−1) at approximately 1300–1400 cm−1, and this region is attributed to the asymmetric and symmetric C–O stretching [19,41,42,43].

3.1.1. Two-Component Systems

Figure 3 shows the predicted (wt%) as a function of the actual (wt%) of two components, MDEA-H2O, MEG-H2O, and TEG-H2O, respectively. Each system used 37 samples of the training set and predicted the concentration after cross-validation. A summary of the results is given in Table 3, showing low standard errors <0.01 wt%, and the number of factors remains constant at three for all systems. One outlier was found in each glycol–H2O system. Seventeen samples were used to cross-validate the dataset. The data variance was completely reproducible with R2 > 0.999. In Figure 4, the residuals of the predicted values for two-component systems are shown. The average residual was <0.1% in glycol–H2O systems and <0.5% in MDEA–H2O systems, which shows good data fit.

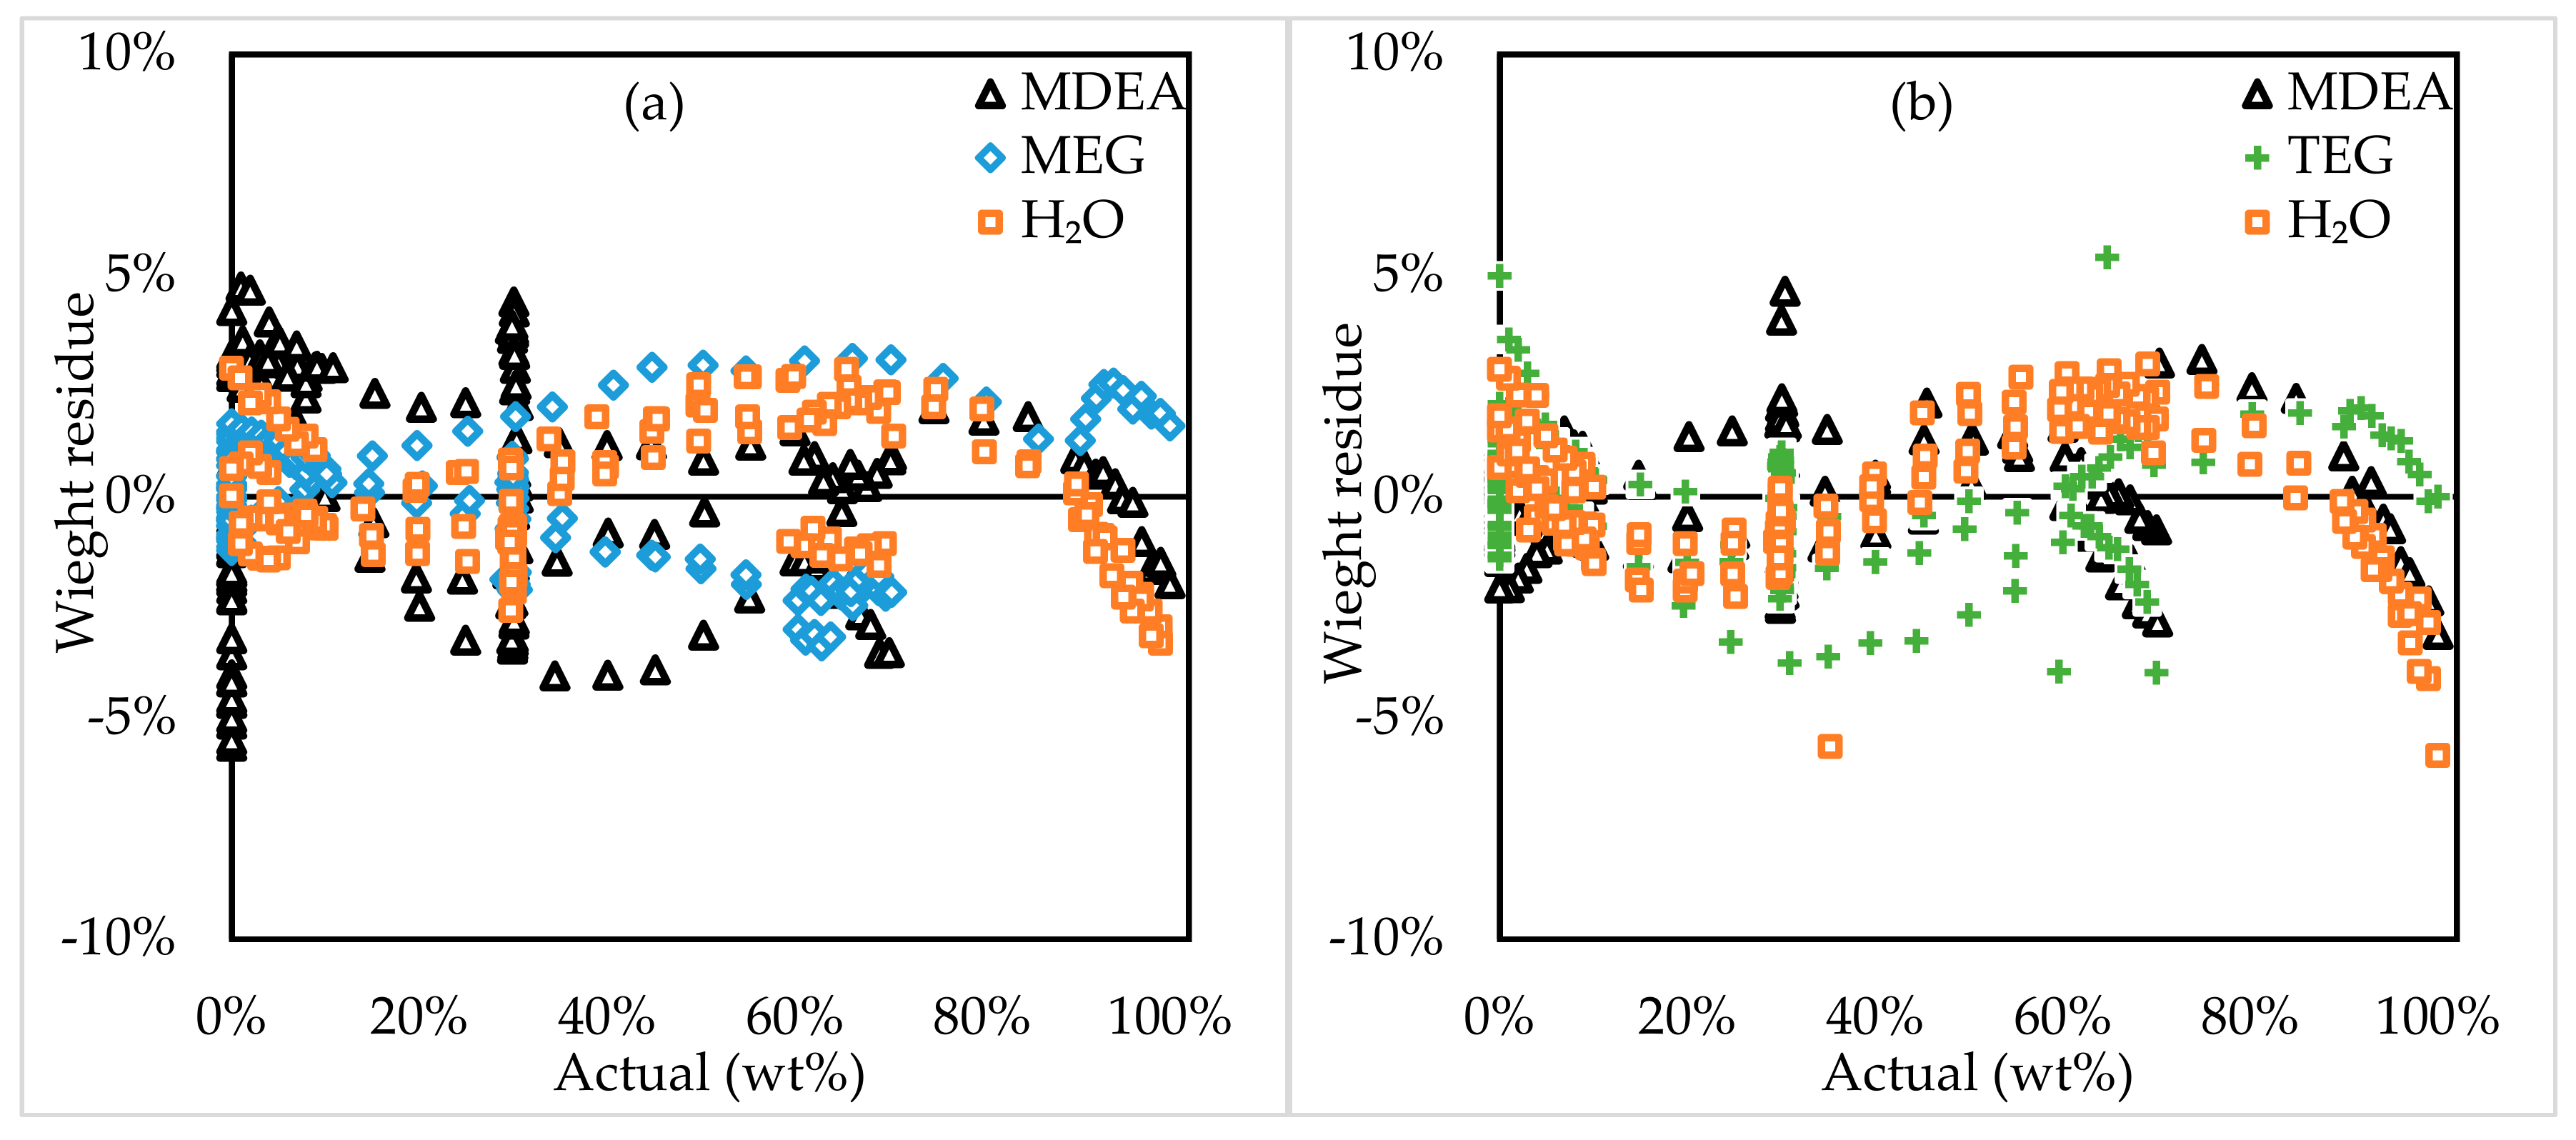
3.1.2. Three-Component Systems

Three-component system calibration curves were developed on the basis of the previous two-component systems. Outliers identified at an earlier step were removed from the curves. Similar wavelength regions were used for PLS model development. In total, 163 and 166 samples were used for MDEA-MEG-H2O and MDEA-TEG-H2O, respectively. The results are shown in Figure 5. A summary of the results for three-component systems is shown in Table 4. For each component, the standard error was different but remained <0.03 wt% excluding MDEA, for which it was <0.017 wt%. The dataset showed a good fit with R2 < 0.99. The addition of one extra component in the system affected model accuracy and increased the SE of the other two components. The average standard error of all the two-component systems was 0.011% points while, for the three-component systems, it was 0.018% points.
The residuals as a function of actual (wt%) for three-component systems are given in Figure 6. The systems showed higher variations in the region where actual wt% was <5% of all the components. A low concentration of one component influenced the results of other components as well, which was more visible in the higher concentration range (>90%) of the other components. The overlapping of the absorbance peaks of components in the fingerprint regions caused an increase in error [35]. The residuals were random with average deviations of <1.3% for all the components in both systems except MDEA in the MDEA-MEG-H2O system (2.2%).

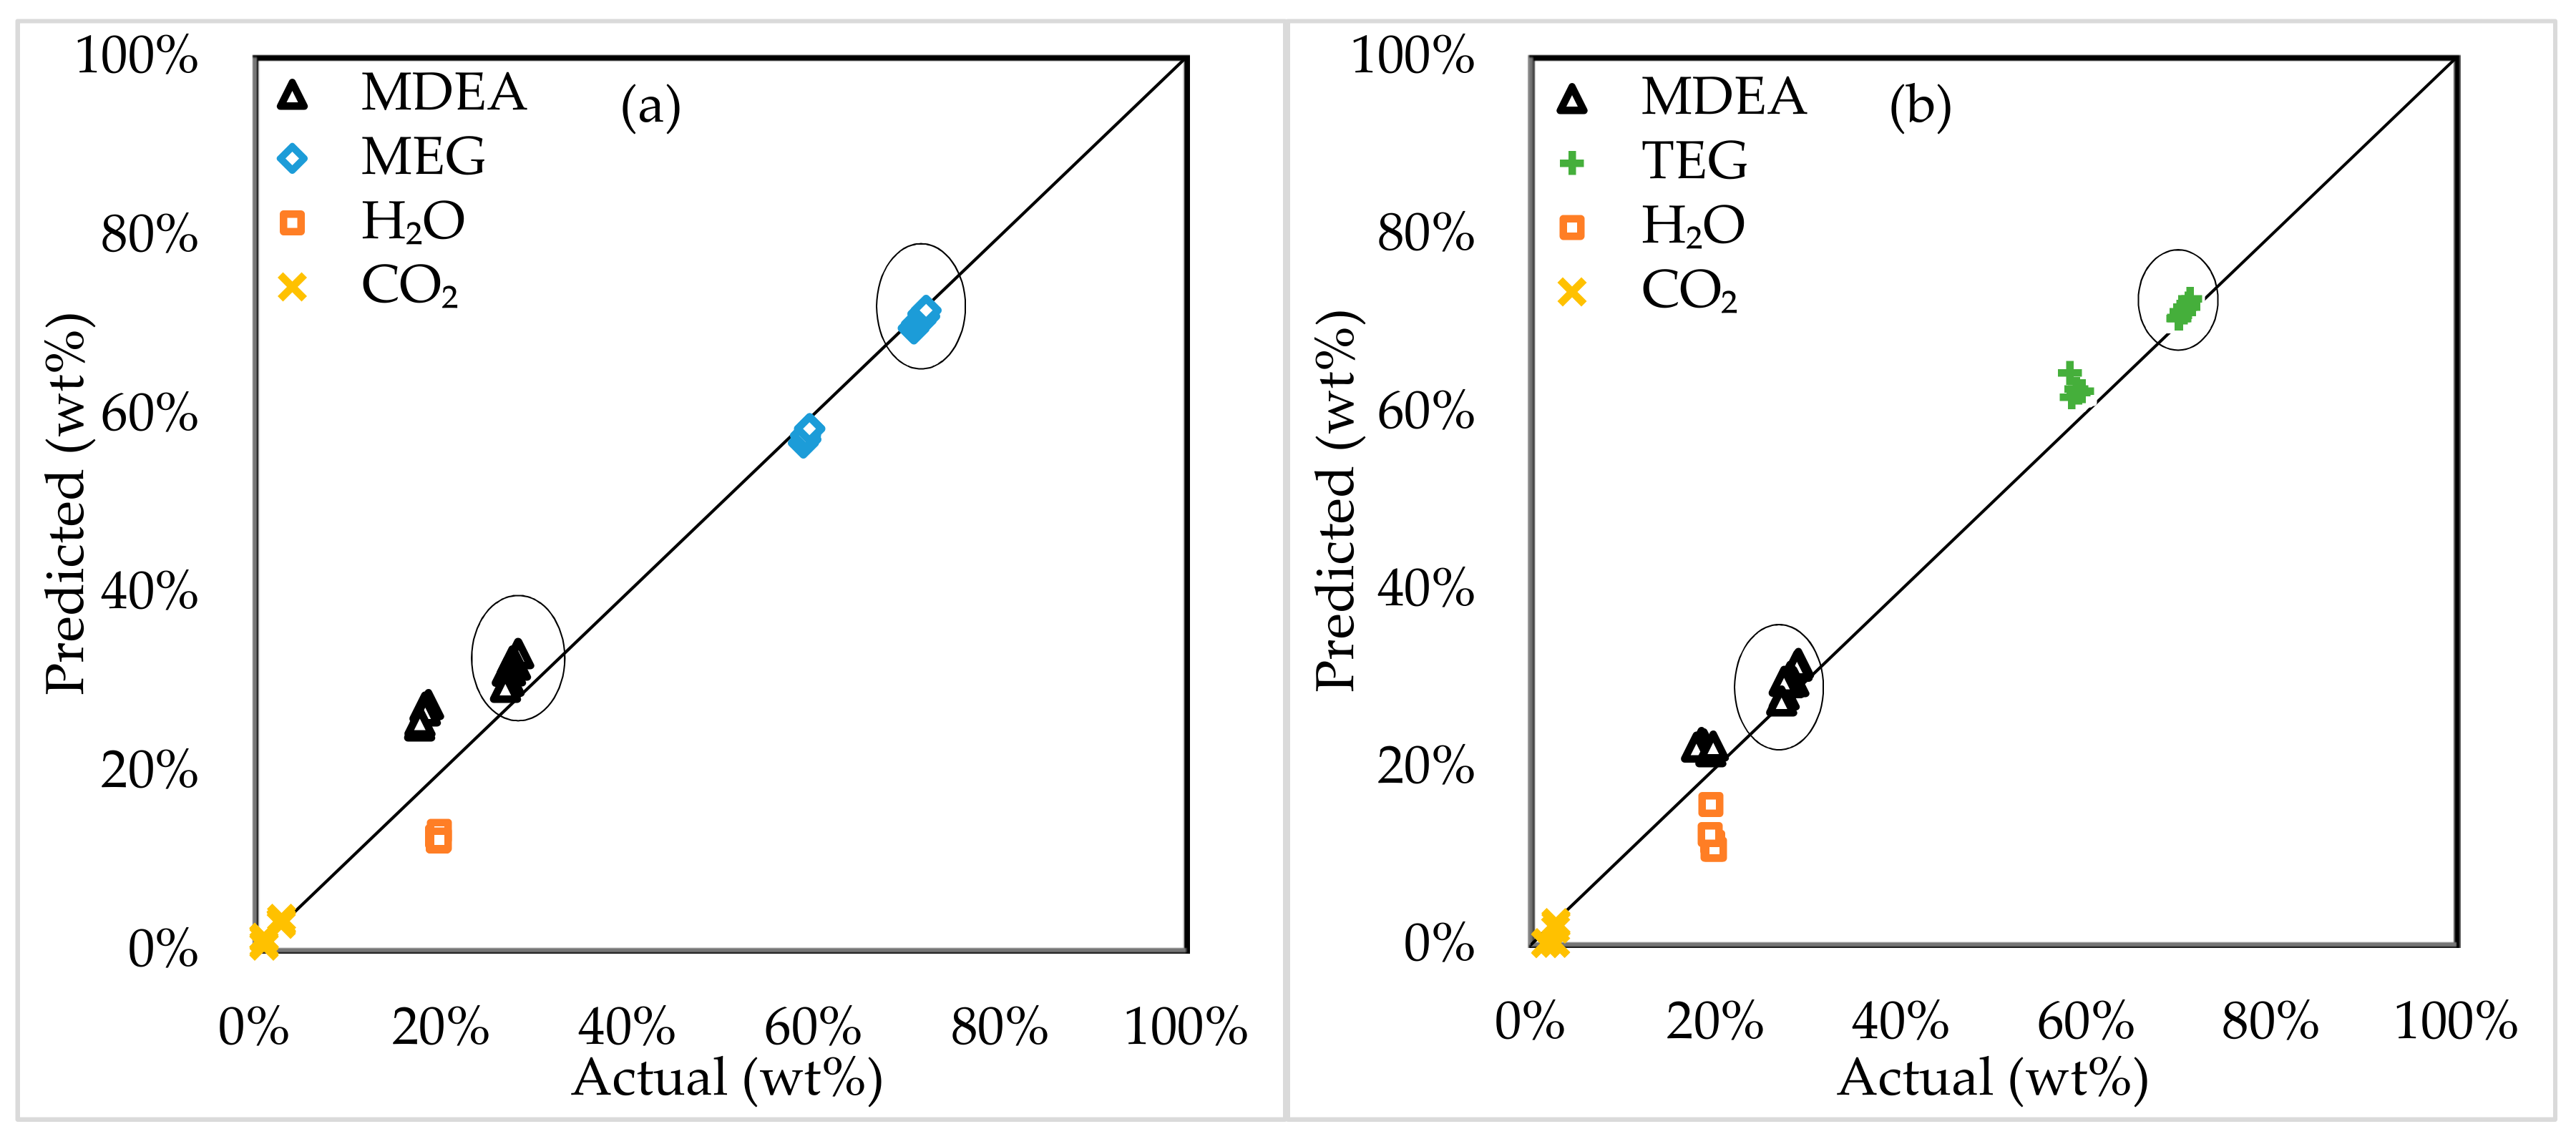
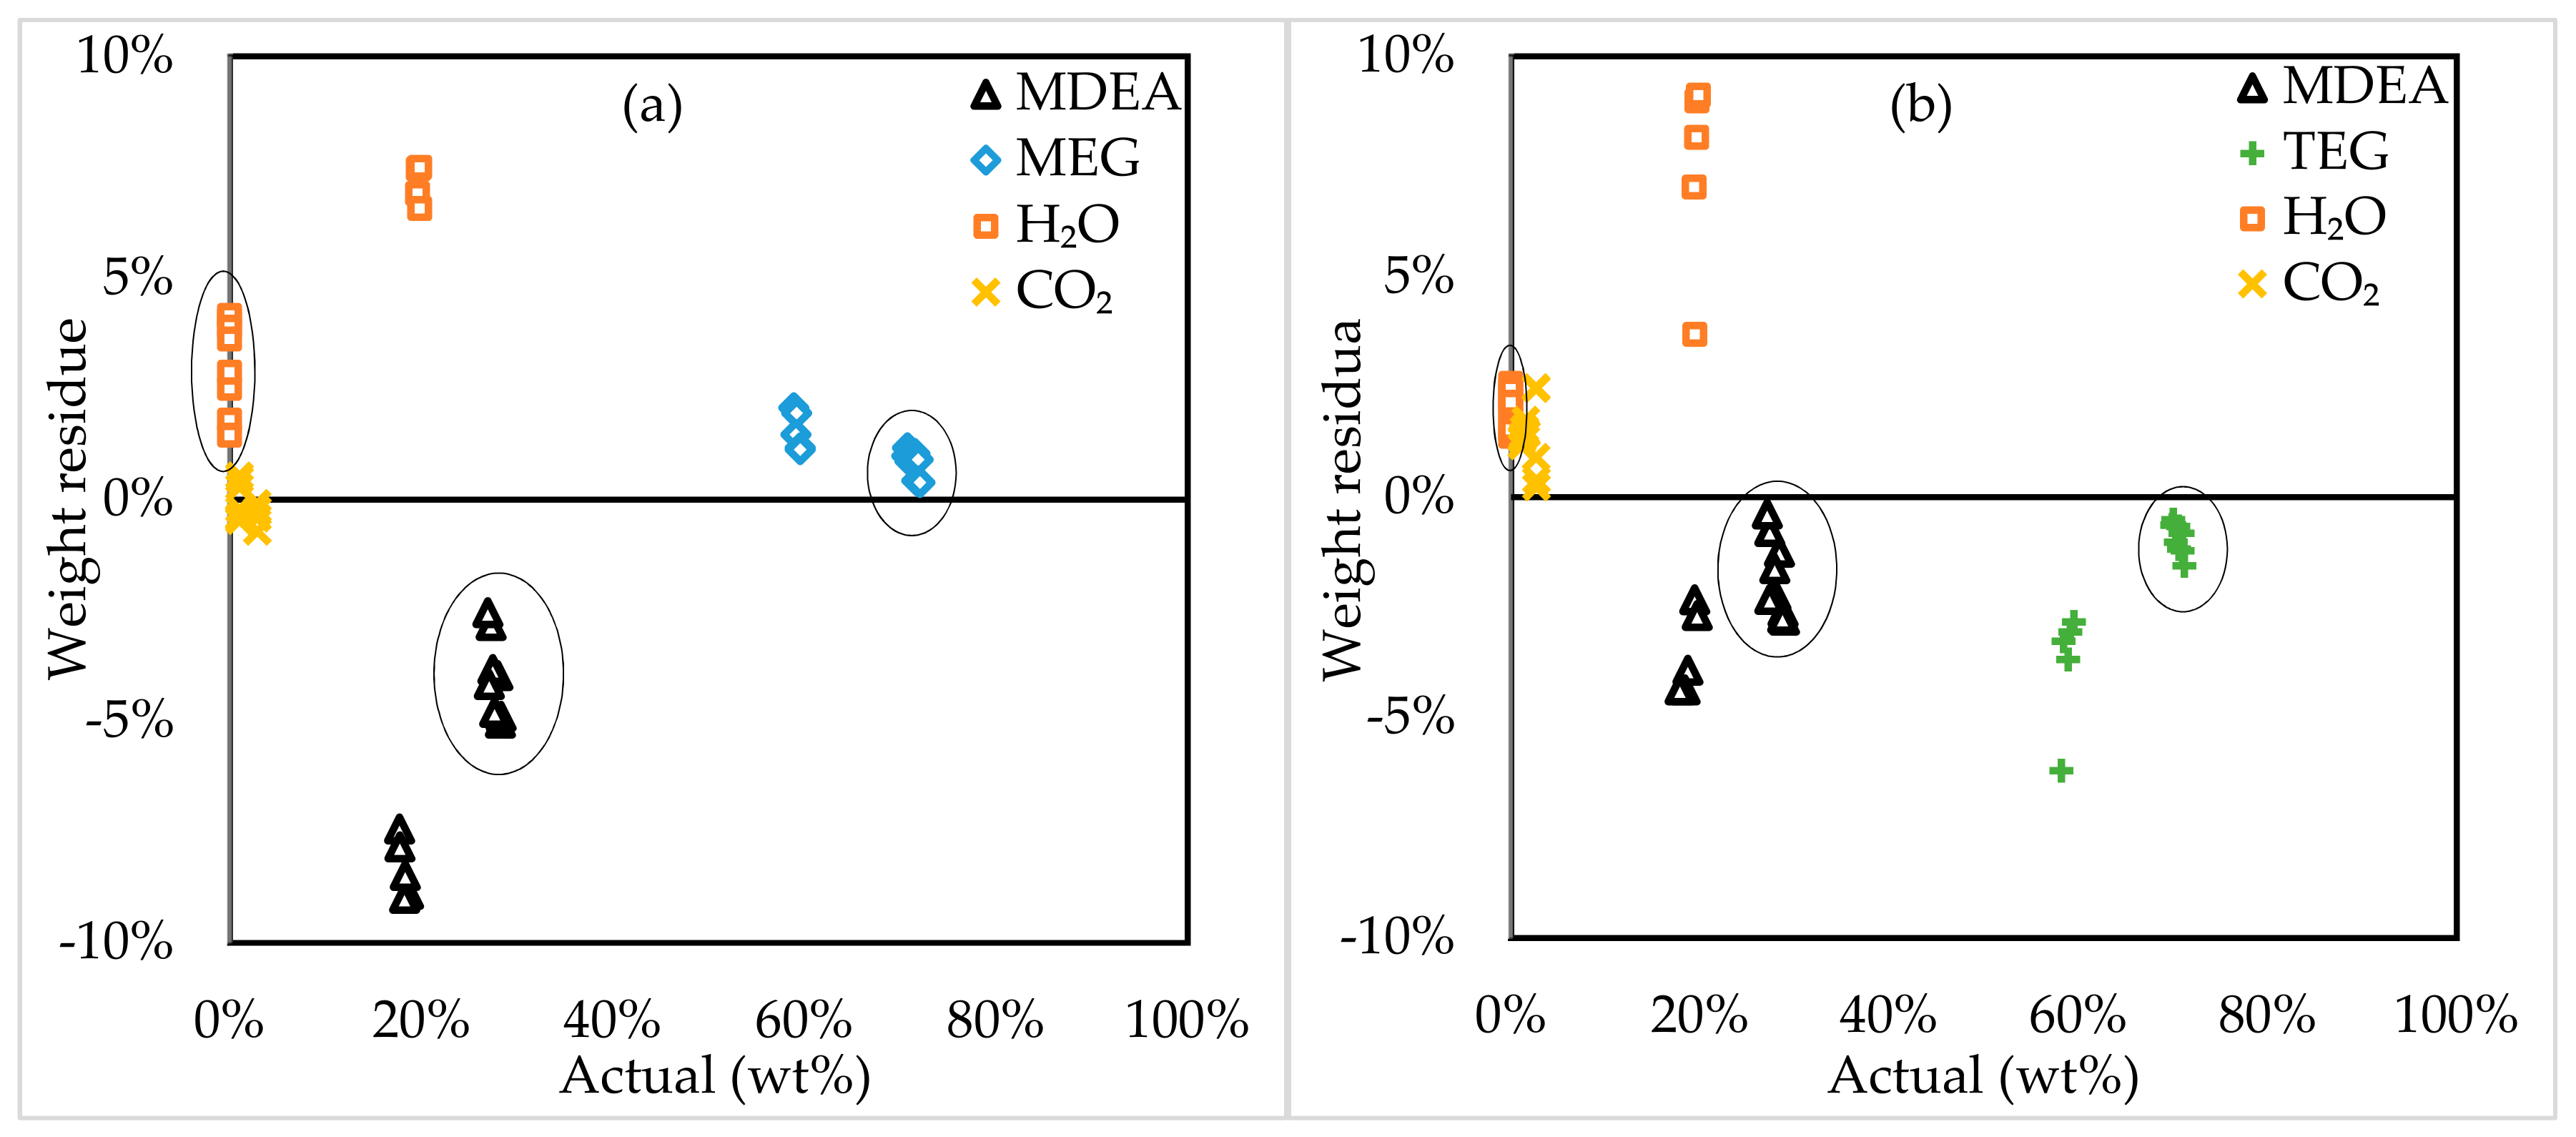
3.1.3. Four-Component Systems

Finally, CO2-loaded solution spectra (31 for each system) were added to their respective previously developed model of MDEA-glycol-H2O to generate the calibration curves. At this point, carbonate and bicarbonate absorbance regions were also added to the PLS model to determine absorbed CO2 concentrations. The results are shown in Figure 7 and the summary is given in Table 5. The results generally agreed with the two- and three-component systems and the validation numbers were >5, except for CO2 in the MDEA-TEG-H2O-CO2 system, suggesting that the model works with reasonable accuracy for all components. The addition of a fourth component (CO2) affected the standard errors of the other components and a relatively smaller difference was observed between three- and four-component systems than between two- and three-component systems because the absolute wt% of the fourth component (CO2) always remained at <0.4 in all four-component system samples, while the absolute wt% of the third component was ≥1 in all three-component system samples.
Figure 8 shows the weight residuals of four component models. Similar to the three-component systems, residuals were random with more variation in boundary regions, mainly due to the addition of CO2. The four-component system models were able to predict the actual concentrations with >95% accuracy except for boundary regions (1–10 wt% and 90–99 wt%). A similar precision was obtained by Geers et al. [21] for three-component systems; attaining the same precision for four-component systems confirms the accuracy of the model. A periodical pattern can be observed in the results of weight residuals as a function of actual wt% because the total sum of wt% remained 100 for each sample in all systems. Therefore, when one component’s wt% increased from 0–100, the other component’s wt% decreased from 100–0, causing this periodical pattern. The pattern visibility decreased with the increase in the number of components in a system.

3.2. Model Assessment

Both four-component models were assessed with left-out sample spectra from the calibration curves. Figure 9 and Figure 10 show model validation and residual weight results, respectively. The maximum weight residual was 3.35% for the MDEA-MEG-H2O-CO2 system, and the overall RMSE was 0.0158 wt%. For the MDEA-TEG-H2O-CO2 system, the maximum weight residual was 4.7% and the RMSE was 0.0238 wt%. Both models identified and quantified individual components with good accuracy and the assessment results were in agreement with the model development results.

3.3. Model Application

Amine-based acid gas removal processes consist of two steps, absorption, and stripping, where temperature swing is used to regenerate acid gas in stripping [9]. Thermal degradation takes place at the stripping stage due to high temperatures [44,45] and can cause various problems such as an increase in solvent viscosity, foaming, fouling, corrosion and a reduction in the absorption capacity of the solvent [46,47,48,49,50,51]. In the case of using an amine solution in glycol, simultaneous acid gas and water removal are possible [11,12,13,14], and at the stripping stage, the amine-glycol solutions will also contain acid gas and water. Therefore, the developed model was tested as a potential analytical technique by applying it on the thermally degraded blends of CO2-loaded MDEA-MEG/TEG and MDEA-H2O-MEG/TEG to identify and quantify MDEA, H2O, CO2, MEG/TEG. The concentrations quantified by titration were used to calculate the actual wt% of MDEA and CO2. MEG/TEG remained thermally stable at 135 °C. Therefore, the values analyzed with FTIR were compared to the initial amounts of MEG/TEG. The concentration of water was calculated by using the concentrations of MDEA, CO2 and MEG/TEG. Finally, it should be noted that MDEA is a stable amine, and over the seven weeks, the maximum amine loss was 5%-points in weight for CO2-loaded MDEA-MEG/TEG systems. In MDEA-H2O-MEG/TEG systems, the maximum amine loss was 8%-points. Also, the usage of large training sets during model development to cover the whole range of component concentrations, along with the selection of specific peaks of each component in the fingerprint region also helped to reduce the effect of degradation byproducts on the model.
The FTIR-analyzed values, after all, thermal degradation experiments are compared to the expected values are presented in Figure 11. The results of non-aqueous CO2-loaded blends of MDEA in MEG or TEG are shown inside the black circles in both Figure 11 and Figure 12. The remaining MDEA and MEG/TEG values are from the CO2-loaded MDEA-H2O-MEG/TEG system. The figures show that the developed model detected and quantified CO2-loaded MDEA–MEG/TEG blends more precisely as compared to the aqueous blends. The addition of water increased the number of components and reduced the overall accuracy as already seen earlier in the model development section. Overall, the RMSE for three components, in the absence of water, was <0.0265 wt%, and for four components, with the addition of water, the RMSE increased to 0.0557 wt%. MEG and TEG were predicted to be better than MDEA and H2O, because of a higher concentration on weight. The RMSE for both MEG and TEG in CO2-loaded MDEA-MEG/TEG blends was <0.0098 wt% and in CO2-loaded MDEA-H2O-MEG/TEG blends, it was 0.016 wt% and 0.0401 wt%, respectively.
The thermal degradation of MDEA was low and the change in MDEA spectra was in agreement with Handojo et al. [28], and the predicted values of MEG/TEG were close to the initial chemical values, which verified that MEG/TEG did not degrade at 135 °C. The largest deviations were seen for H2O. Even though the water was not predicted as accurately as the rest, the overall results are acceptable. It can be seen from Figure 12 that at a higher concentration of an individual component, its corresponding weight residual decreased and subsequently made model predictability better, which is in agreement with both model development and the assessment results. The developed model can be used to analyze the samples containing MDEA, MEG, TEG, H2O and CO2 to measure each component but one should be careful when using it in the low weight-based concentration regions of each component (>10 wt%).

4. Conclusions

The application of the spectroscopy method as a possible analytical technique to identify and quantify individual components in combined acid gas and water removal was investigated. PLS regression models using FTIR spectra were successfully developed and validated to identify and quantify components in four-component systems. The developed model predicted individual component weight percentages best when the concentrations of MDEA, MEG, TEG and water were between 5 and 95 wt%. Furthermore, the model predicted three-component systems more accurately as compared to four-component systems. Finally, the model was applied on thermally degraded blends and it predicted the component concentrations with reasonable accuracy. On average, in thermally degraded solutions, the model predicted the CO2-loaded MDEA-MEG blends system 52% better than the CO2-loaded MDEA-MEG-H2O blends system and the CO2-loaded MDEA-TEG blends system 65% better than the CO2-loaded MDEA-TEG-H2O blends system.

Author Contributions

Conceptualization, H.K.K. and U.S.; methodology, U.S. and E.B.; writing—original draft preparation, U.S.; writing—review and editing, H.K.K.; supervision, H.K.K.

Funding

This work was carried out with funding provided by the NTNU-SINTEF Gas Technology Centre (GTS) and Faculty of Natural Sciences, Norwegian University of Science and Technology (NTNU), Trondheim, Norway.

Acknowledgments

We would like to thank the Department of Chemical Engineering (IKP) and Faculty of Natural Sciences, Norwegian University of Science and Technology (NTNU), Trondheim, Norway for their support.

Conflicts of Interest

The authors declare no conflict of interest.

Abbreviations

ATRAttenuated total reflectance
CO2Carbon dioxide
FTIRFourier transform infrared
H2OWater
MDEAN-Methyldiethanolamine
MEGEthylene glycol
PLSPartial least-squares
R2Correlation factor
RSMERoot square mean error
SEStandard error
SECVStandard error of cross-validation
TEGTriethylene glycol
VNValidation number
Wt%Weight percent
xiActual value of chemical component
yiPredicted value of chemical component

References

  1. Schmeal, W.R.; MacNab, A.J.; Rhodes, P.R. Corrosion in amine/sour gas treating contactors. Chem. Eng. Prog. 1978, 74, 37–42. [Google Scholar]
  2. Rennie, S. Corrosion and materials selection for amine service. Mater. Forum 2006, 30, 126–130. [Google Scholar]
  3. Wasiu, A.B.; Aziz, A.R.A.; Heikal, M.R. The Effect of Carbon Dioxide Content-natural Gas on the Performance Characteristics of Engines: A Review. J. Appl. Sci. 2012, 12, 2346–2350. [Google Scholar] [CrossRef] [Green Version]
  4. Doujaiji, B.; Al-Tawfiq, J.A. Hydrogen sulfide exposure in an adult male. Ann. Saudi Med. 2010, 30, 76–80. [Google Scholar] [CrossRef] [PubMed]
  5. Amosa, M.; Mohammed, I.; Yaro, S. Sulphide scavengers in oil and gas industry—A review. Nafta 2010, 61, 85–92. [Google Scholar]
  6. Kohl, A.L.; Nielsen, R.B. Absorption of Water Vapor by Dehydrating Solutions. In Gas Purification, 5th ed.; Kohl, A.L., Nielsen, R.B., Eds.; Gulf Professional Publishing: Houston, TX, USA, 1997; Chapter 11; pp. 946–1021. [Google Scholar]
  7. Stewart, C.; Hessami, M.A. A study of methods of carbon dioxide capture and sequestration—The sustainability of a photosynthetic bioreactor approach. Energy Convers. Manag. 2005, 46, 403–420. [Google Scholar] [CrossRef]
  8. Neill, B.C.; Oppenheimer, M. Dangerous Climate Impacts and the Kyoto Protocol. Science 2002, 296, 1971. [Google Scholar] [CrossRef]
  9. Kohl, A.L.; Nielsen, R.B. Alkanolamines for Hydrogen Sulfide and Carbon Dioxide Removal. In Gas Purification, 5th ed.; Gulf Professional Publishing: Houston, TX, USA, 1997; Chapter 2; pp. 40–186. [Google Scholar]
  10. Netusil, M.; Ditl, P. Comparison of three methods for natural gas dehydration. J. Nat. Gas Chem. 2011, 20, 471–476. [Google Scholar] [CrossRef]
  11. Hutchinson, A.J. Process for Treating Gases. U.S. Patent 2,177,068, 24 October 1939. [Google Scholar]
  12. McCartney, E.R. Gas Purification and Dehydration Process. U.S. Patent 2,435,089, 27 January 1948. [Google Scholar]
  13. Chapin, W.F. Purification and Dehydration of Gases. U.S. Patent 2,518,752, 15 August 1950. [Google Scholar]
  14. McCartney, E.R. Extraction of Acidic Impurities and Moisture from Gases. U.S. Patent 2,547,278, 3 April 1951. [Google Scholar]
  15. Shoukat, U.; Fytianos, G.; Knuutila, H.K. Thermal stability and corrosion studies of amines for combined acid gas removal and hydrate control for subsea gas treatment systems. In Proceedings of the 2016 Techno-Ocean (Techno-Ocean), Kobe, Japan, 6–8 October 2016; pp. 176–180. [Google Scholar]
  16. Shoukat, U.; Pinto, D.D.D.; Knuutila, H.K. Study of Various Aqueous and Non-Aqueous Amine Blends for Hydrogen Sulfide Removal from Natural Gas. Processes 2019, 7, 160. [Google Scholar] [CrossRef]
  17. Eimer, D. Simultaneous removal of water and hydrogen sulphide from natural gas. In Department of Chemical Engineering; Norwegian University of Science and Technology: Trondheim, Norway, 1994. [Google Scholar]
  18. Carter, C.F.; Lange, H.; Ley, S.V.; Baxendale, I.R.; Wittkamp, B.; Goode, J.G.; Gaunt, N.L. ReactIR Flow Cell: A New Analytical Tool for Continuous Flow Chemical Processing. Org. Process. Res. Dev. 2010, 14, 393–404. [Google Scholar] [CrossRef]
  19. Richner, G.; Puxty, G. Assessing the Chemical Speciation during CO2 Absorption by Aqueous Amines Using in Situ FTIR. Ind. Eng. Chem. Res. 2012, 51, 14317–14324. [Google Scholar] [CrossRef]
  20. Einbu, A.; Ciftja, A.F.; Grimstvedt, A.; Zakeri, A.; Svendsen, H.F. Online Analysis of Amine Concentration and CO2 Loading in MEA Solutions by ATR-FTIR Spectroscopy. Energy Procedia 2012, 23, 55–63. [Google Scholar] [CrossRef]
  21. Geers, L.F.G.; Van De Runstraat, A.; Joh, R.; Schneider, R.; Goetheer, E.L.V. Development of an Online Monitoring Method of a CO2 Capture Process. Ind. Eng. Chem. Res. 2011, 50, 9175–9180. [Google Scholar] [CrossRef]
  22. Morken, A.K.; Nenseter, B.; Pedersen, S.; Chhaganlal, M.; Feste, J.K.; Tyborgnes, R.B.; Ullestad, Ø.; Ulvatn, H.; Zhu, L.; Mikoviny, T.; et al. Emission Results of Amine Plant Operations from MEA Testing at the CO2 Technology Centre Mongstad. Energy Procedia 2014, 63, 6023–6038. [Google Scholar] [CrossRef]
  23. Mertens, J.; Knudsen, J.; Thielens, M.L.; Andersen, J. On-line monitoring and controlling emissions in amine post combustion carbon capture: A field test. Int. J. Greenh. Gas Control 2012, 6, 2–11. [Google Scholar] [CrossRef]
  24. Chahen, L.; Huard, T.; Cuccia, L.; Cuzuel, V.; Dugay, J.; Pichon, V.; Vial, J.; Gouedard, C.; Bonnard, L.; Cellier, N.; et al. Comprehensive monitoring of MEA degradation in a post-combustion CO2 capture pilot plant with identification of novel degradation products in gaseous effluents. Int. J. Greenh. Gas Control 2016, 51, 305–316. [Google Scholar] [CrossRef]
  25. Milella, F.; Mazzotti, M. Estimating speciation of aqueous ammonia solutions of ammonium bicarbonate: Application of least squares methods to infrared spectra. React. Chem. Eng. 2019, 4, 1284–1302. [Google Scholar] [CrossRef]
  26. Rogers, W.J.; Bullin, J.A.; Davison, R.R. FTIR measurements of acid-gas–methyldiethanolamine systems. AIChE J. 1998, 44, 2423–2430. [Google Scholar] [CrossRef]
  27. Cuccia, L.; Dugay, J.; Bontemps, D.; Louis-Louisy, M.; Vial, J. Analytical methods for the monitoring of post-combustion CO2 capture process using amine solvents: A review. Int. J. Greenh. Gas Control 2018, 72, 138–151. [Google Scholar] [CrossRef]
  28. Handojo, L.; Prihartoni, M.D.; Susanti, R.F.; Yaswari, Y.; Raksajati, A.; Indarto, A. Non-oxidative thermal degradation of amines: GCMS/FTIR spectra analysis and molecular modeling. Sep. Sci. Technol. 2018, 53, 2259–2266. [Google Scholar] [CrossRef]
  29. Haghi, R.K.; Yang, J.; Tohidi, B.; Haghi, R.K. Integrated Near Infrared and Ultraviolet Spectroscopy Techniques for Determination of Hydrate Inhibitors in the Presence of NaCl. Ind. Eng. Chem. Res. 2018, 57, 11728–11737. [Google Scholar] [CrossRef]
  30. Ma’Mun, S.; Svendsen, H.F.; Hoff, K.A.; Juliussen, O. Selection of new absorbents for carbon dioxide capture. Energy Convers. Manag. 2007, 48, 251–258. [Google Scholar] [CrossRef]
  31. Monteiro, J.G.S.; Pinto, D.D.; Zaidy, S.A.; Hartono, A.; Svendsen, H.F. VLE data and modelling of aqueous N,N-diethylethanolamine (DEEA) solutions. Int. J. Greenh. Gas Control 2013, 19, 432–440. [Google Scholar] [CrossRef] [Green Version]
  32. Maitra, S.; Yan, J. Principle Component Analysis and Partial Least Squares: Two Dimension Reduction Techniques for Regression. Appl. Multivar. Stat. Model 2008, 79, 79–90. [Google Scholar]
  33. Du, Y.; Liang, Y.; Jiang, J.; Berry, R.; Ozaki, Y. Spectral regions selection to improve prediction ability of PLS models by changeable size moving window partial least squares and searching combination moving window partial least squares. Anal. Chim. Acta 2004, 501, 183–191. [Google Scholar] [CrossRef]
  34. Dupuy, N.; Galtier, O.; Ollivier, D.; Vanloot, P.; Artaud, J. Comparison between NIR, MIR, concatenated NIR and MIR analysis and hierarchical PLS model. Application to virgin olive oil analysis. Anal. Chim. Acta 2010, 666, 23–31. [Google Scholar] [CrossRef] [PubMed]
  35. Zanone, A.; Tavares, D.T.; De Paiva, J.L. An FTIR spectroscopic study and quantification of 2-amino-2-methyl-1-propanol, piperazine and absorbed carbon dioxide in concentrated aqueous solutions. Vib. Spectrosc. 2018, 99, 156–161. [Google Scholar] [CrossRef]
  36. Bro, R.; Smilde, A.K. Principal component analysis. Anal. Methods 2014, 6, 2812–2831. [Google Scholar] [CrossRef] [Green Version]
  37. Ballabio, D.; Consonni, V. Classification tools in chemistry. Part 1: Linear models. PLS-DA. Anal. Methods 2013, 5, 3790. [Google Scholar] [CrossRef]
  38. Shoukat, U.; Baumeister, E.; Pinto, D.D.; Knuutila, H.K. Thermal stability and corrosion of tertiary amines in aqueous amine and amine-glycol-water solutions for combined acid gas and water removal. J. Nat. Gas Sci. Eng. 2019, 62, 26–37. [Google Scholar] [CrossRef]
  39. Ciftja, A.F. Quantitative characterization of absorbents for CO2 capture. In Depart of Chemical Engineering; Norwegian Unversity of Science and Technology: Trondheim, Norway, 2013. [Google Scholar]
  40. Jackson, P.; Robinson, K.; Puxty, G.; Attalla, M. In situ Fourier Transform-Infrared (FT-IR) analysis of carbon dioxide absorption and desorption in amine solutions. Energy Procedia 2009, 1, 985–994. [Google Scholar] [CrossRef] [Green Version]
  41. Falk, M.; Miller, A.G. Infrared spectrum of carbon dioxide in aqueous solution. Vib. Spectrosc. 1992, 4, 105–108. [Google Scholar] [CrossRef]
  42. Diab, F.; Provost, E.; Laloué, N.; Alix, P.; Souchon, V.; Delpoux, O.; Fürst, W. Quantitative analysis of the liquid phase by FT-IR spectroscopy in the system CO2/diethanolamine (DEA)/H2O. Fluid Phase Equilibria 2012, 325, 90–99. [Google Scholar] [CrossRef]
  43. Robinson, K.; McCluskey, A.; Attalla, M.I. An ATR-FTIR Study on the Effect of Molecular Structural Variations on the CO2 Absorption Characteristics of Heterocyclic Amines, Part II. ChemPhysChem 2012, 13, 2331–2341. [Google Scholar] [CrossRef] [PubMed]
  44. Davis, J. Thermal Degradation of Aqueous Amines Used for Carbon Dioxide Capture; University of Texas Libraries: Austin, TX, USA, 2009. [Google Scholar]
  45. Islam, M.S.; Yusoff, R.; Ali, B.S.; Islam, M.N.; Chakrabarti, M.H. Degradation studies of amines and alkanolamines during sour gas treatment process. Int. J. Phys. Sci. 2011, 6, 5883–5896. [Google Scholar]
  46. Gouedard, C.; Picq, D.; Launay, F.; Carrette, P.L. Amine degradation in CO2 capture. I. A review. Int. J. Greenh. Gas Control 2012, 10, 244–270. [Google Scholar] [CrossRef]
  47. Da Silva, E.F.; Grimstvedt, A.; Vevelstad, S.J.; Vernstad, K.; Lepaumier, H.; Einbu, A.; Svendsen, H.F.; Zahlsen, K. Understanding 2-Ethanolamine Degradation in Postcombustion CO2 Capture. Ind. Eng. Chem. Res. 2012, 51, 13329–13338. [Google Scholar] [CrossRef]
  48. Zhou, S.; Wang, S.; Chen, C. Thermal Degradation of Monoethanolamine in CO2 Capture with Acidic Impurities in Flue Gas. Ind. Eng. Chem. Res. 2012, 51, 2539–2547. [Google Scholar] [CrossRef]
  49. Zoannou, K.S.; Sapsford, D.J.; Griffiths, A.J. Thermal degradation of monoethanolamine and its effect on CO2 capture capacity. Int. J. Greenh. Gas Control 2013, 17, 423–430. [Google Scholar] [CrossRef]
  50. Rao, A.B.; Rubin, E.S. A Technical, Economic, and Environmental Assessment of Amine-Based CO2 Capture Technology for Power Plant Greenhouse Gas Control. Environ. Sci. Technol. 2002, 36, 4467–4475. [Google Scholar] [CrossRef]
  51. Freeman, S.A.; Davis, J.; Rochelle, G.T. Degradation of aqueous piperazine in carbon dioxide capture. Int. J. Greenh. Gas Control 2010, 4, 756–761. [Google Scholar] [CrossRef]
Figure 1. All spectra from the calibration solutions for the MDEA-H2O, MEG-H2O, MDEA-MEG-H2O, and MDEA-MEG-H2O-CO2 systems.
Energies 12 03285 g001
Figure 2. All spectra from the calibration solutions for the MDEA-H2O, TEG-H2O, MDEA-TEG-H2O, and MDEA-TEG-H2O-CO2 systems.
Energies 12 03285 g002
Figure 3. Actual vs. predicted values of two-component systems; the MDEA-H2O system (a), MEG-H2O system (b), and TEG-H2O system (c).
Energies 12 03285 g003
Figure 4. Weight residual of two-component systems; the MDEA-H2O system (a), MEG-H2O system (b), and TEG-H2O system (c).
Energies 12 03285 g004
Figure 5. Actual vs. predicted values of three-component systems; the MDEA-MEG-H2O system (a) and MDEA-TEG-H2O system (b).
Energies 12 03285 g005
Figure 6. Weight residual of three-component systems; the MDEA-MEG-H2O system (a) and MDEA-TEG-H2O system (b).
Energies 12 03285 g006
Figure 7. Actual vs. predicted values of four-component systems; the MDEA-MEG-H2O-CO2 system (a) and MDEA-TEG-H2O-CO2 system (b).
Energies 12 03285 g007
Figure 8. Weight residual of four-component systems; the MDEA-MEG-H2O-CO2 system (a) and MDEA-TEG-H2O-CO2 system (b).
Energies 12 03285 g008
Figure 9. Validation with left-out spectra; the MDEA-MEG-H2O-CO2 system (a) and MDEA-TEG-H2O-CO2 system (b).
Energies 12 03285 g009
Figure 10. Weight residual of left-out spectra; the MDEA-MEG-H2O-CO2 system (a) and MDEA-TEG-H2O-CO2 system (b).
Energies 12 03285 g010
Figure 11. Actual vs. predicted values of experimental data; the MDEA-MEG-H2O-CO2 system (a) and MDEA-TEG-H2O-CO2 system (b).
Energies 12 03285 g011
Figure 12. Weight residual of experimental data; the MDEA-MEG-H2O-CO2 system (a) and MDEA-TEG-H2O-CO2 system (b).
Energies 12 03285 g012
Table 1. Full names, chemical abstracts service (CAS) numbers, purity, and structures of the chemicals.
ChemicalCASPurityChemical Structure
Carbon dioxide (CO2)124-38-9≥99.9% Energies 12 03285 i001
Ethylene glycol (MEG)107-21-1≥99.5% Energies 12 03285 i002
N-Methyldiethanolamine (MDEA)105-59-9≥99.0% Energies 12 03285 i003
Triethylene glycol (TEG)112-27-6≥99.8% Energies 12 03285 i004
Table 2. The set of calibration solutions for each system.
SystemNameRange of the Components (wt%)
MDEA (wt%)H2O (wt%)MEG (wt%)TEG (wt%)CO2 Loading (mol CO2/mol MDEA)
Two component systemMDEA-H2O0–1000–100---
MEG-H2O-0–1000–100--
TEG-H2O-0–100-0–100-
Three component systemMDEA-MEG-H2O0–700–7030--
300–700–70--
0–70300–70--
MDEA-TEG-H2O0–700–70-30-
300–70-0–70-
0–7030-0–70-
Four component systemMDEA-MEG-H2O-CO2205030-0–0.5
MDEA-TEG-H2O-CO22050-300–0.4
Table 3. Summary of results for two-component systems.
ComponentFactorsStandard Error of Cross-Validation (SECV) (wt%)Root Mean Square (RMSE) (wt%)Maximum Possible Correlation Coefficient (R2)Bias (wt%)Standard Error (SE) (wt%)Validation Number (VN)
MDEA30.01220.01220.9990.00020.010922.96
H2O30.01220.01220.9990.00890.010922.96
MEG30.01200.002710.00070.002693.85
H2O30.01200.00271−0.00090.002693.85
TEG30.00730.00980.9990.00220.013618.36
H2O30.00730.00980.9990.00680.013618.36
Table 4. Summary of results for three-component systems.
ComponentFactorsSECV (wt%)RMSE (wt%)R2Bias (wt%)SE (wt%)VN
MDEA40.02640.02610.9920.00330.02988.38
MEG40.01570.01570.9970.00050.017114.56
H2O40.01490.01490.9980.00090.015116.36
MDEA40.01360.01410.9980.0010.014117.65
TEG40.01550.01510.9970.0010.015216.47
H2O40.01660.01650.9970.00110.016615.09
Table 5. Summary of results for four-component systems.
ComponentFactorsSECV (wt%)RMSE (wt%)R2Bias (wt%)SE (wt%)VN
MDEA50.02590.02590.9910.00310.02599.64
MEG50.01620.01620.9960.0010.015416.26
H2O50.01280.01290.9980.00120.012919.16
CO250.0010.00120.9820.0000040.00127.38
MDEA40.01670.01670.9960.00120.016714.95
TEG40.01540.01540.9970.0010.015416.23
H2O40.02010.02010.9940.00220.020112.41
CO240.0020.00190.9360.00020.00204.04

