Abstract
The lighting environment is a factor that significantly affects the physical and psychological aspects of occupants of a building. In particular, educational facilities should be designed to provide adequate natural lighting because it has a profound impact on students’ health and learning performance. Although environmental certification systems include evaluation items for improving the indoor light environment, there is a lack of evaluation criteria regarding the corresponding issue of glare. Therefore, this study aims to help visualize areas where indoor glare problems occur, and to improve the evaluation scale of discomfort glare in environmental certification systems. A standard high school classroom in Seoul was analyzed to study glare issues in the educational space. DIVA for Rhino—Grasshopper, a light environment simulation program based on Radiance and DAYSIM program, was used to obtain reliable light analysis simulation results, and the daylight glare probability (DGP) measure was used to calculate discomfort glare. The results of the simulation and analysis suggest this is a method for improving glare evaluation measures that are lacking in indoor environmental certification standards. The visualized frequency of discomfort glare data is useful for planning the layout of the indoor space, opening, and shading design of a building to prevent glare problems.
1. Introduction
The lighting environment is a factor that has a significant influence on the body and psychology of building occupants [1]. In educational facilities, the lighting environment has a substantial effect on students because they spend a large portion of their school days working under a combination of artificial and natural lighting. Natural light still acts on students’ health and learning performance in indoor environments. Therefore, it is necessary to obtain proper illumination through natural lighting to satisfy certain quantitative aspects of light and to meet qualitative elements of light, such as considering the occurrence of glare [2,3,4,5,6]. Educational facilities should be designed to offer a comfortable light environment by providing adequate illumination in the interior space. Thus, it is important to design elements, such as windows and shades, to prevent unpleasant glare occurring [7,8]. Green building certification systems include evaluation items for improving the indoor light environment. However, there is no standard or clear criteria for the prevention of discomforting glare [9].
This research aims to visualize areas where indoor glare problems occur and demonstrate a method to improve the evaluation scale of discomfort glare that may be applied in environmental certification systems. In this study, a standard high school classroom in Seoul was analyzed to examine the glare situation in a real educational space. To improve the current situation, it was first necessary to understand how much glare appears in an internal space by using a scale that can measure the degree of glare. In this study, the daylight glare probability (DGP), one of the glare rating scales proposed by Wienold and Christoffersen [10], was used. DIVA for Rhino—Grasshopper [11], a light environment simulation program based on Radiance and DAYSIM program, was used to obtain reliable light analysis results [12,13]. This program has been used in studies aimed at deriving optimized results for various parameters [14,15]. Through the use of this program, this study tried to understand the overall visual comfort of the indoor space. The target school in this study was a girls’ high school affiliated with Hongik University, located in Seoul. This school was selected for the glare simulation because it contained typical Korean south-facing classrooms. The DGP values generated by the simulation were summarized to indicate the frequency of the occurrence of discomfort glare through the year. Based on these results, this study suggests an improvement in the evaluation scale of discomfort glare in educational facilities.
2. Literature Review
2.1. Influence of Natural Light and Discomfort Glare on Occupants
Natural light coming through the windows of a building is an important factor because the light affects not only the psychology but also the health of the people who use the indoor space. Küller and Lindsten [16] argue that natural light coming through a window has a positive effect on health and behavior by changing the amount of hormones secreted by students in the classroom. Natural lighting has been shown to positively affect students’ academic performance and attendance [3]. Nicklas and Bailey [4] found that natural light has a strong effect in improving learning efficiency. Moreover, natural light coming through windows helps relieve depressive emotions of occupants and helps motivate them to concentrate and learn [17]. Overall, natural lighting has a positive impact on students when indoors; therefore, when designing educational facilities, architects should carefully design and control the flow of natural light.
The Illuminating Engineering Society of North America (IESNA) [18] defined glare as “the sensation produced by luminance within the visual field that is sufficiently greater than the luminance to which the eyes are adapted to cause annoyance, discomfort, or loss in visual performance and visibility.” Natural lighting is an important factor for creating a pleasant indoor environment, but if the windows are too large, excessive light may come in, which can cause discomfort glare. Discomfort glare can cause significant visual problems [19]. Osterhaus [7] argued that glare is an essential factor to consider when designing educational facilities. Exposure to discomfort glare may degrade task performance due to fatigue and reduced concentration. Therefore, it is very important to plan for a minimum of discomfort glare in interior spaces.
2.2. Content of Assessment Items for the Green Building Certification System and Evaluating Glare
In South Korea, the environmental certification system is the Green Standard for Energy and Environmental Design (G-SEED) [20]; comparable international systems include the Leadership in Energy and Environmental Design (LEED) program in the United States [21], the Building Research Establishment Environmental Assessment Method (BREEAM) in the United Kingdom [22], and the Comprehensive Assessment System for Built Environment Efficiency (CASBEE) in Japan [23]. Lee et al. [9] compiled the evaluation criteria for indoor light environments for each of these certification systems in order to examine and enhance the assessment process, including those items related to glare that are applicable to educational facilities. However, when examining issues associated with glare, there are also other factors contributing to glare problems, such as the illuminance level and the amount of direct sunlight entering the interior space. In addition, simple evaluation criteria only assess the horizontal depth of the shading device.
A wide variety of studies have been conducted to provide a more clear assessment of glare problems in indoor areas in order to improve the accuracy of glare analysis [24]. However, some studies have analyzed glare at only a few fixed points, where the most severe glare problem was expected to be observed or simulated [25,26]. Glare can occur at multiple locations in the interior of a building and not just at one point, but often studies do not identify the occurrence of discomfort glare problems throughout the indoor area or assess the visual comfort in the interior space. Therefore, guidelines are needed to perform quantitative assessments of glare problems throughout the space.
2.3. Means for Analyzing Glare
2.3.1. Daylight Glare Index (DGI)
The daylight glare index (DGI) was proposed by Hopkinson [27] and supplemented by Chauvel et al. [28]. It is calculated as follows:
where is the luminance of the source in cd/m2 is the background luminance in cd/m2, is the angular size of the source, and is the solid angle of the source.
Depending on the size of the windows of the building, the brightness of the sky through the windows, and the brightness of the interior, the DGI value indicates the visual uncomfortability of people in the space. However, limitations of the DGI that result in lower analytical accuracy have been pointed out by several studies [29,30].
2.3.2. Daylight Glare Probability (DGP)
The daylight glare probability (DGP) is a method proposed by Wienold and Christoffersen [31]. It is calculated as follows:
where is the vertical eye illuminance (lux), constant ; is the luminance of the source ; is the solid angle of the source, constant ; and P is the position index, and constant
DGP is an improved formula that borrows part of the DGI function and introduces vertical eye illuminance and the position index that considers the field of view and position of an observer, respectively. Wienold and Christoffersen [10] also confirmed an improvement in the accuracy of glare analysis results with this formula.
2.3.3. Simplified Daylight Glare Probability (DGPs)
The simulation processing time in the simulation for DGP significantly increases when the analysis covers a large time interval. This is because a DGP analysis uses high dynamic range (HDR) images that appear at each point of time. A less processing-intensive method, simplified daylight glare probability (DGPs), was proposed by Wienord [32] to address this shortcoming. However, this method has a disadvantage in that it provides a reliable analysis only if a bright light source, such as the sun, is not directly visible [33]. The formula for this method is as follows (the variable definition is the same as for DGP):
2.3.4. Enhanced Simplified Daylight Glare Probability (eDGP)
DGPs reduced the computational time of DGP but has a disadvantage in that it cannot consider very bright glare elements, such as the sun. Wienord [33] proposed an improved simplification method to address both shortcomings at the same time. The enhanced simplified daylight glare probability (eDGP) is divided into Term1 and Term2. Because Term2 is the section that requires an HDR image, Term1 uses the DAYSIM program to obtain the virtual eye image for each time unit and substitutes the results for the function to reduce the calculation time. In most cases, results close to the DGP are shown. However, some situations may not be appropriate because this method ignores ambient indirect reflective light. The formula for this method is as follows (the variable definitions are the same as for DGP):
3. Methodology
To study the glare situation in an educational space, a school classroom was selected for analysis. In South Korea, classrooms are generally oriented with windows facing south, so adjacent classrooms are in a row running to the east and west. Hongik University Girls’ High School was selected as a typical case for the glare study because the school has south-facing standard-sized classrooms. The location of the selected classroom can be seen in Figure 1.
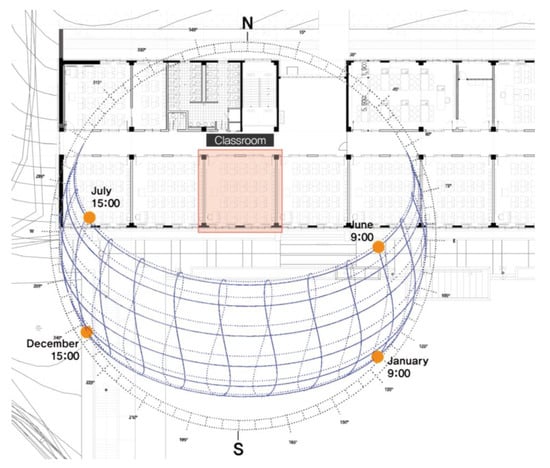
Figure 1.
Hongik University Girls’ High School, Seoul, South Korea. (37.57° N, 127.98° E).
In this study, the analysis was conducted using the DGP measure. To identify discomfort glare, Wienord has proposed other methods [10,31,32,33] but also suggested several modified measures based on the DGP and set the criteria for analysis accuracy as the DGP. In addition, the DGP is considered a reliable representative glare analysis method and has been used in several studies of glare [24,34]. Therefore, in this study, the DGP was adopted as an analytical scale to identify the frequency of discomfort glare throughout the indoor space.
To create a three-dimensional (3D) base model of the selected classroom space, the modeling program Rhino 3D was used. The classroom was 8.1 m wide, 7.8 m deep, and 3.6 m high, and there was a blackboard on the western wall. Also, for the purposes of the study, three different shading devices were considered for the windows on the southern wall. The shading devices would be installed at the top of each window (Figure 2). The options were: No device, 600 mm of horizontal shading, and 900 mm of horizontal shading. The purpose of introducing the devices was to determine the influence of the shading depth on the glare occurrence. There were 36 analysis planes defined by dividing the inner plane into a 6 × 6 grid using DIVA for Rhino—Grasshopper. A rendering image (Figure 3) that could replace the HDR image in the direction looking at the blackboard at 1.1 m (eye-level height of a person sitting on a chair at each point) was produced in order to perform an analysis of the discomfort glare with DGP calculations, which was then totaled into monthly and annual discomfort glare (Figure 4). Figure 3 shows the size, shape, and analysis location of the classroom. Table 1 shows the types of classroom materials, which are typical in South Korea, and that were applied in the simulation.
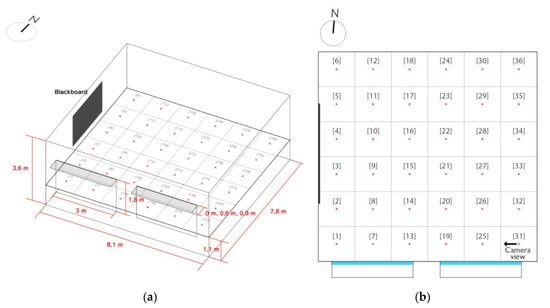
Figure 2.
(a) Rhino 3D base model of the classroom; (b) Grids and location of points, including the camera view for analyzing discomfort glare.
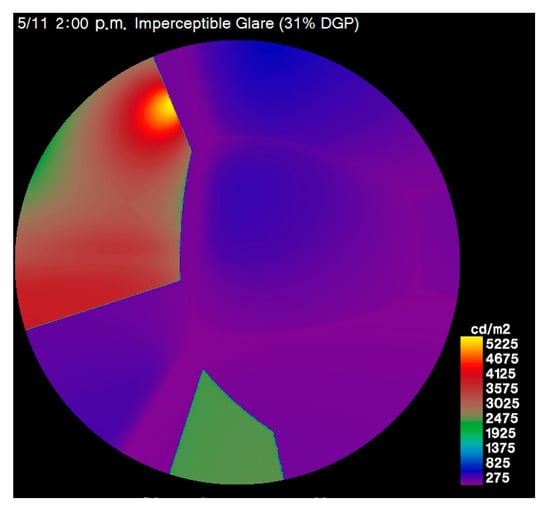
Figure 3.
Luminance map of the rendering image by DIVA for Rhino—Grasshopper.
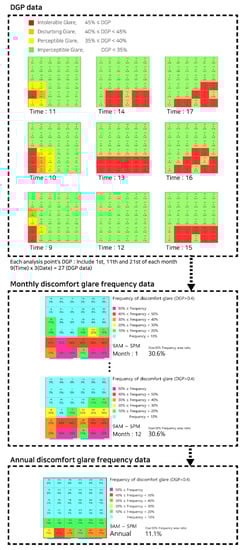
Figure 4.
Visualization and synthesis of monthly and annual DGP data.

Table 1.
Materials used in the classroom.
For the analysis, the 1st, 11th, and 21st of each month were sampled to cover the entire year. The analysis was performed every simulated hour from 9:00 am to 5:00 pm (when the school would be occupied). For comparison and analysis, this study used two types of sky conditions: A clear sky and a Perez sky. The clear sky models a sunny sky as defined by the International Commission on Illumination (CIE) [35]. The Perez sky [36] is a model that is close to the actual sky conditions. In the case of the Perez sky, this study used the Incheon EnergyPlus Weather File (EPW). Because the EPW file contained weather conditions that had been observed for several years at the observatory, it was possible to apply the most representative weather for each date in the simulation, resulting in typical weather conditions.
The combination of three window shading options (none, 600 mm, or 900 mm) and two sky conditions (clear sky or Perez sky) resulted in six classroom types in which the simulation was run. These numbered types are described in Table 2. The results are organized around these designations.
Table 2.
Types of classrooms and parameters for analysis.
This study also organizes the results of the discomfort glare that occurred inside the classroom and compares them to the useful daylight illuminance (UDI) analysis to examine any tradeoffs. The UDI, proposed by Nabil and Mardaljevic [37], was used to investigate how the light environment changed in the classroom according to the depth of the horizontal shading device. The LEED v4 [21] standard of 300 to 3000 lux was set as a good lighting condition, and it was evaluated through the illuminance of the working height standard. Therefore, the analysis height was set as 0.7 m above the classroom floor, which was considered a standard desk height.
Analysis of the Frequency of the Occurrence of Discomfort Glare through the DGP
This study proposed an indicator of the discomfort glare rate of time over the set value in a year based on UDI using dynamic daylight metrics. Therefore, 9 DGP values were collected for each of the 36 study points from 9:00 am to 5:00 pm for each of three days, on the 1st, 11th, and 21st of each month, covering an entire year. Consequently, each of the study points had 27 DGP values for each month to analyze discomfort glare in the classroom.
The scale of DGP values can be expressed as four categories, indicating the extent to which people would typically feel uncomfortable with the glare. These are: Imperceptible, perceptible, disturbing, and intolerable. These values are divided into 5% intervals [38]. Exceeding the DGP value of 0.4 is the threshold at which one tends to feel discomfort [39]. This study also adopted this proposed scale range, and the frequency of occurrence of the DGP for each month is visualized in Figure 4. The annual incidence is also shown (Figure 5, Figure 6, Figure 7, Figure 8, Figure 9 and Figure 10). The frequency of the occurrence of discomfort glare was divided into six color-coded steps, using a 10% ratio increase. This allows easy visual recognition of how discomfort glare occurred in the interior space (Figure 4). The percentage of the internal space area per frequency is summarized in Table 3, Table 4, Table 5, Table 6, Table 7 and Table 8, and the annual frequency of the occurrence of discomfort glare is also expressed as a graph, to identify this trend. The study was divided into two parts based on a 30% frequency of occurrence. Each table shows 30% or more items in red and 30% or less in green, using the heat map method to determine which parts of the table have higher values (Table 3, Table 4, Table 5, Table 6, Table 7 and Table 8).
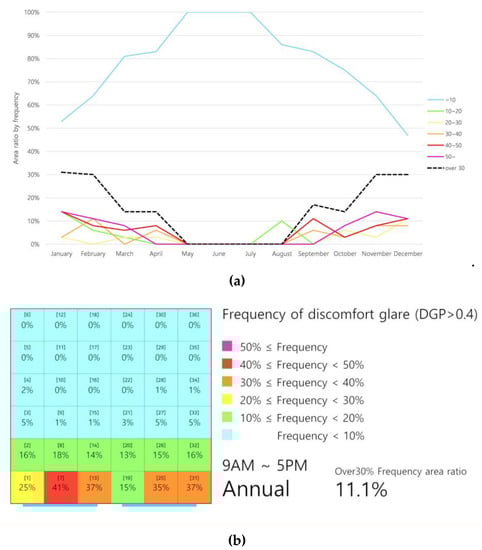
Figure 5.
(a) Graph of discomfort glare frequency for the type 1 classroom; (b) Visualization of the annual frequency of discomfort glare for the type 1 classroom.
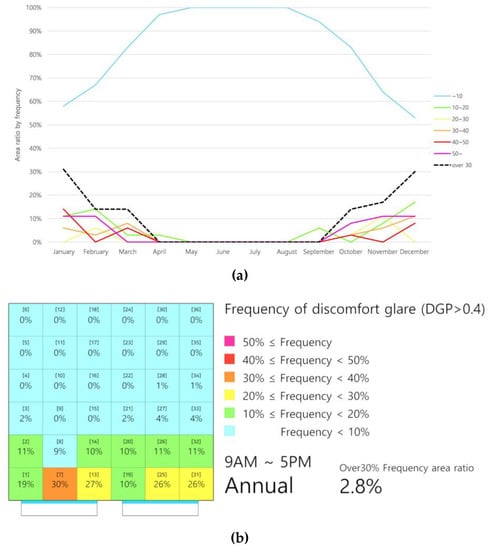
Figure 6.
(a) Graph of the discomfort glare frequency for the type 2 classroom; (b) Visualization of the annual frequency of discomfort glare for the type 2 classroom.
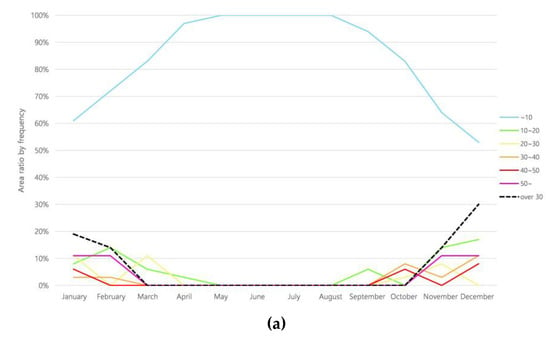
Figure 7.
(a) Graph of discomfort glare frequency for the type 3 classroom; (b) Visualization of the annual frequency of discomfort glare for the type 3 classroom.
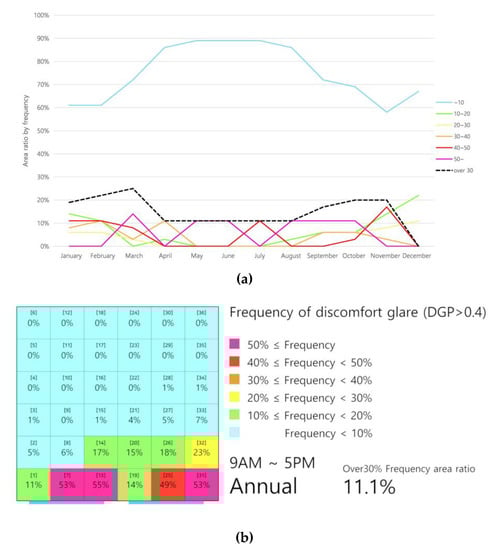
Figure 8.
(a) Graph of discomfort glare frequency for the type 4 classroom; (b) Visualization of the annual frequency of discomfort glare for the type 4 classroom.
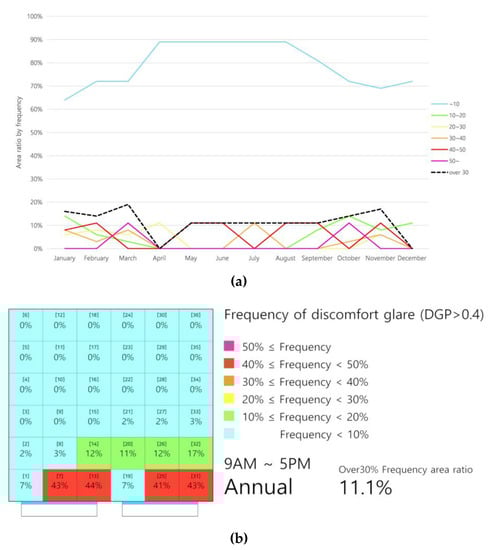
Figure 9.
(a) Graph of discomfort glare frequency for the type 5 classroom; (b) Visualization of the annual frequency of discomfort glare for the type 5 classroom.
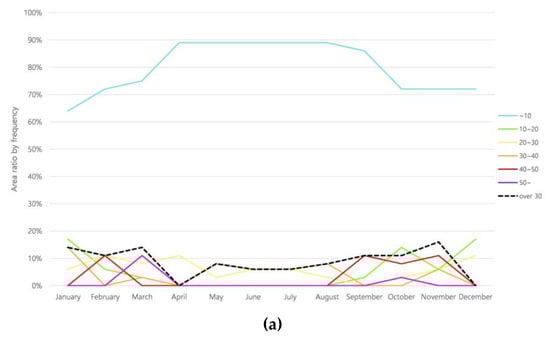
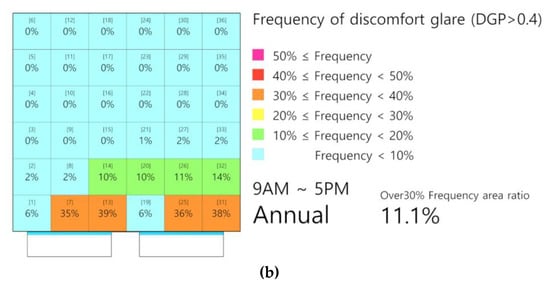
Figure 10.
(a) Graph of the discomfort glare frequency for the type 6 classroom; (b) Visualization of the annual frequency of discomfort glare for the type 6 classroom.
Table 3.
The discomfort glare frequency according to the area ratio of the type 1 classroom.
Table 4.
The discomfort glare frequency according to the area ratio for the type 2 classroom.
Table 5.
The discomfort glare frequency according to the area ratio for the type 3 classroom.
Table 6.
The discomfort glare frequency according to the area ratio for the type 4 classroom.
Table 7.
The discomfort glare frequency according to the area ratio for the type 5 classroom.
Table 8.
The discomfort glare frequency according to the area ratio for the type 6 classroom.
4. Results
4.1. Analysis of the Type 1 Classroom
In this study, six different types of classrooms were used for the simulation. As with typical work plane simulations, the sensor grid was set 1.1 m off the floor, and the classroom was divided into a 6 x 6 grid. Each analysis grid had an analysis node at its center, which contained 27 synthesized DGP values to show the monthly and annual frequency of the occurrence of discomfort glare. In addition, each table shows 30% or more items in red and 30% or less in green, using the heat map method to determine which parts of the table have higher values.
For the type 1 classroom, the sky condition was a clear sky, and there was no shading device. Table 3 and Figure 5 show that discomfort glare occurred less during the period from May to August. The month with the highest incidence of discomfort glare was January. The incidence of discomfort glare was also high in February, November, and December because discomfort glare mostly occurred in winter. From November to February, the space area ratio exceeding 30% of the occurrence rate for discomfort glare was constant at 30% to 31%. This means that discomfort glare occurred in almost 1/3 of the area, which means that the glare suitability of the interior space deteriorated considerably during those four months.
The annual incidence of discomfort glare, which was analyzed monthly, is shown in Figure 5. This visualization image makes it easy to see where the discomfort glare problem occurred in the classroom space. The incidence of discomfort glare was very high in the vicinity of the windows. Analysis points 7, 13, 25, and 31 were 41%, 37%, 35%, and 37%, respectively. These four points contained more than 30% of the frequency of discomfort glare and 11.1% of the internal space area. Glare problems in the west location were generally more severe than in the east location. In the west, the highest analysis point was 7, which was higher than analysis points 25 and 31 in the east.
4.2. Analysis of the Type 2 Classroom
For the type 2 classroom, the sky condition was a clear sky, and the horizontal shading device was 600 mm deep at the top of the window. Table 4 and Figure 6 show that in January and December, the area ratio exceeding 30% of the discomfort glare occurrence rate was 31% and 30% as in the type 1 classroom. However, the proportion according to the area ratio of the discomfort glare occurrence rate exceeding 50% was lower than that of the type 1 classroom. The incidence of discomfort glare was not high from April to September. During that period, the incidence of discomfort glare was improved to less than 20% compared with the type 1 classroom due to the shading device. Also, in February and November, the area ratio of the occurrence of discomfort glare exceeding 30% decreased considerably, from 30% to 14% and 30% to 17%, respectively, when compared with the type 1 classroom.
The annual frequency of discomfort glare for the type 2 classroom is shown in Figure 6. The frequency of discomfort glare was high in the vicinity of the windows, and analysis points 7, 13, 25, and 31 were 30%, 27%, 26%, and 26%, respectively. The west analysis points showed higher values than the east analysis points. At the same analysis points in the type 1 classroom, a high discomfort glare occurred, but this figure shows reduced values of about 10%. The area ratio exceeding 30% of the occurrence rate of discomfort glare was 2.8%, which shows that the glare problem was significantly improved by the shading device.
4.3. Analysis of the Type 3 Classroom
For the type 3 classroom, the sky condition was a clear sky, and the horizontal shading device was 900 mm deep at the top of the window. Table 5 and Figure 7 show that the frequency of discomfort glare was low in March through to October. The highest frequency of discomfort glare was in December. The incidence of discomfort glare was lower than that of the type 1 classroom with no shading device and of the type 2 classroom with the 600 mm horizontal shading device. Unlike type 1 and 2, there was no exceeding of the 30% of the discomfort glare occurrence in March and October. Also, in January and November, the area ratio of the occurrence of discomfort glare exceeding the 30% decreased from 31% to 19% and from 17% to 14%, respectively, when compared to the type 2 classroom.
Figure 7 shows the frequency of the yearly incidence of discomfort glare. Analysis points 7, 13, 25, and 31 located near the windows showed a relatively high incidence of discomfort glare: 25%, 25%, 24%, and 24%, respectively, as in the other types of classroom. The ratio of space area exceeding 30% of the annual discomfort frequency of the type 3 classroom was 0%, which means that discomfort glare rarely occurred throughout the interior space of the classroom in this condition.
4.4. Analysis of the Type 4 Classroom
For the type 4 classroom, the sky condition was the Perez sky, and there was no shading device. Table 6 and Figure 8 show that the incidence of discomfort glare was relatively low from April to August and in December but frequently occurred from January to March and from September to November. The month with the lowest incidence of discomfort glare was December, and there was no area beyond this frequency of 30%. In March, the highest incidence of discomfort glare was shown, and the area ratio exceeding the 30% frequency was 25%. In the absence of a shading device, as in the type 1 classroom, there was a lack of visual comfort in the interior space. Figure 8 shows the frequency of annual discomfort glare. The analysis points 7, 13, 25, and 31 near the windows had high values of 53%, 55%, 49%, and 53%, respectively. When analysis points 7 and 13 in the west and 25 and 31 in the east were compared, the eastern points were somewhat lower. The area ratio exceeding 30% frequency of discomfort glare was 11.1%, which was the same as for the type 1 classroom.
4.5. Analysis of the Type 5 Classroom
For the type 5 classroom, the sky condition was the Perez sky, and the horizontal shading device was 600 mm deep at the top of the window. Table 7 and Figure 9 show that the incidence of discomfort glare was relatively low from April to September and in December, and discomfort glare was relatively high in January through March and in October and November. Compared to the type 4 classroom with no shading device, the area with more than 30% discomfort glare decreased from 11% to 0% in April, and the glare problem was partially improved in the remaining months as the frequency of discomfort glare was reduced.
The annual incidence of glare incidents is shown in Figure 9. The frequency of discomfort glare was high near the windows. The analysis points 7, 13, 25, and 31 were quite high at 43%, 44%, 41%, and 43%, respectively. The ratio of space area exceeding 30% of the annual discomfort frequency of the type 4 classroom was 11.1%, the same as for the type 4 classroom, but the analysis points 7, 13, 25, and 31 with high occurrence frequencies of discomfort glare were reduced from 53%, 55%, 49%, and 53% to 43%, 44%, 41%, and 43%, respectively. The values decreased by 8% to 11%.
4.6. Analysis of the Type 6 Classroom
For the type 6 classroom, the sky condition was the Perez sky, and the horizontal shading device was 900 mm deep at the top of the window. Table 8 and Figure 10 show that the frequency of discomfort glare was low in April through to September and in December and was relatively high in the remaining months. The incidence of discomfort glare was lower than that of the type 4 classroom with no shading device and the type 5 classroom with the 600 mm horizontal shading device. Also, in comparison with the type 5 classroom, the space area ratio exceeding 30% of the discomfort glare occurrence period from May to August decreased from 11% to 8%, 11% to 6%, 11% to 6%, and 11% to 8%, respectively.
Figure 10 shows the frequency of the yearly incidence of discomfort glare. Similar to the other types of classroom, the analysis points 7, 13, 25, and 31 located near the windows showed a relatively high incidence of discomfort glare: 35%, 39%, 36%, and 38%, respectively. The ratio of space area exceeding 30% of the annual discomfort frequency of the type 6 classroom was 11.1%, which was the same as that for the type 5 classroom, but there were no analysis points with over a 40% occurrence frequency of discomfort glare, and all decreased to the 30% range, indicating that the glare problems were improved.
The well-lit area ratios were 82.91% (0 mm, no device), 85.19% (600 mm), and 81.91% (900 mm) for the horizontal shading devices of the indicated depths. The 600 mm deep horizontal shading device showed the best result. The 900 mm deep shading device showed worse results than the case of no shading device. As the length of the shading device increased, the over-lit ratio decreased, but if the depth of the shading device increased too much, the under-lit ratio increased, resulting in a decrease in the well-lit ratio. The results of the analysis are summarized in Table 9.
Table 9.
Results of the UDI analysis according to the depth of the shading device.
5. Discussion
5.1. Comparisons According to the Presence or Absence of A Shading Device
The comparison of the type 1 and type 2 classrooms showed that the frequency of the yearly discomfort glare was reduced overall due to the shading device. The area ratio exceeding 30% of the discomfort glare was significantly lowered, from 11.1% to 2.8%. The 600 mm deep horizontal overhang shading device had a significant effect on reducing discomfort glare in the clear sky condition. Also, when the overhang shading device was extended from 600 to 900 mm, there was 0% in the area ratio exceeding 30% of the occurrence rate for discomfort glare. Thus, in the clear sky condition, a 900 mm deep overhang shading device was enough to solve the problem of the discomfort glare occurrence.
The comparison of the type 4 and type 5 classrooms showed that the frequency of the annual discomfort glare of the type 5 classroom was lower than that of the type 4 classroom because of the added 600 mm deep overhang shading device. However, the area ratio exceeding 30% of the occurrence rate for discomfort glare was still 11.1%. The overall incidence was low, but the values were still high; thus, the area ratio remained unchanged. In the Perez sky condition, the 600 mm deep horizontal shading device reduced the incidence of discomfort glare, but there was still a high frequency of discomfort glare. Therefore, the occurrence rate of discomfort glare was reduced more by extending the depth of the horizontal shading device from 600 to 900 mm.
5.2. Comparison of the Glare Simulation Results According to the Sky Conditions
The type 1 classroom that had the clear sky condition had almost no discomfort glare from April to August, but the type 4 classroom that differed only in having the Perez sky condition confirmed that discomfort glare occurred at a very high frequency in some areas. The reason is that the luminance distribution seen at the same analysis point was quite different (Figure 11). In the clear sky condition, it was good to simulate the light environment of clear weather because it is based on sunny weather throughout a year. In terms of glare, this is a “worst” case in that it will simulate the most exposure that would be possible. However, as the light distribution along the vertical direction may not be accurate in the clear sky condition, it is possible that the luminance pattern will not appear correctly when compared to that of the actual sky [40]. Because of this, different DGP values appear in the same area when comparing the clear sky and the Perez sky.
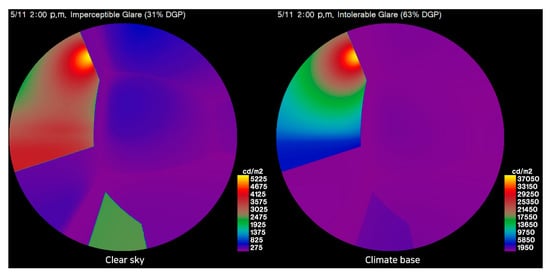
Figure 11.
Comparison of the luminance map between the clear sky and the Perez sky (climate base) at the same analysis point.
In the comparison of the frequency of annual discomfort glare in the interior space of the type 1 and type 4 classrooms, the type 4 classroom showed relatively high values (Figure 5 and Figure 8). Notably, at analysis point number 13 near the windows, the difference in the frequency of the annual discomfort glare was 28%. This is because when the simulation was performed under the Perez sky condition, the luminance map of the rendered image was higher than that of the clear sky condition.
The Perez sky should be used in an analysis to find out the near-real glare situation so that it is possible to establish the most realistic glare prevention plan. However, as the Perez sky adopts a representative weather condition for each date, there are some disadvantages. In a simulation, glare problems may not be detected, since the analysis is not performed in clear weather throughout a year when glare easily occurs. Also, when simulating the clear sky condition, the problem of the inaccuracy of luminance-rendering images may be present in some areas near the windows. This may cause some differences in the frequency of discomfort glare compared to that of actual weather conditions, i.e., the Perez sky. However, the graphs of the clear sky classrooms (Figure 5, Figure 6 and Figure 7) clearly show how the glare problem changed each month when compared to the graphs of the Perez sky classrooms (Figure 8, Figure 9 and Figure 10). Therefore, given the options, it seems to be best to analyze and contrast the glare problems with both of these sky conditions.
5.3. Utilization of Annual and Monthly Glare Analysis
The analysis of the annual frequency of the occurrence of discomfort glare has an advantage in that it can easily show how discomfort glare occurs in an internal space for a one-year cycle of conditions. However, it is difficult to understand the case when severe glare occurs in a particular month and plan how to prevent or mitigate it since a one-year analysis is based on the average occurrence frequency of discomfort glare in a year. Therefore, it would be desirable to set up rough measures to prevent glare from the annual glare analysis and make more detailed plans by analyzing the frequency of monthly discomfort glare.
5.4. Comparison of Seasonal DGP Values
In the graphs of the discomfort glare frequency (Figure 5, Figure 6, Figure 7, Figure 8, Figure 9 and Figure 10), the occurrence of discomfort glare in winter was higher than in summer. The reason for this result is the difference in solar altitude between the winter and summer solstice. In Korea, the highest meridian altitude is approximately 75 degrees on June 21 to 22, and the lowest is about 28 degrees on December 21 to 22. One of the main reasons for the discomfort glare is the direct exposure of light sources, such as the sun, to the eyes (Figure 12). Because winter has a lower solar altitude than summer, the proportion of area where the sun can be directly exposed to the eyes increases in the classroom. The amount of time that the sun is exposed to the eyes also increases in winter at the same location. Therefore, the frequency of the occurrence of discomfort glare is higher in winter than in summer. Since DGP values are related to solar altitude, the results of the analysis will vary depending on the latitude of the region.
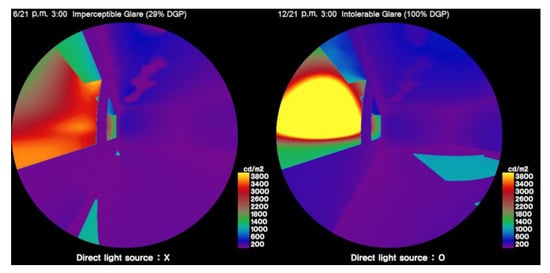
Figure 12.
Comparison of the DGP values at the same study point between June and December 21 at 3 pm.
5.5. Comparison of UDI Analysis and Glare Analysis
The incidence of discomfort glare in the indoor area decreased as the depth of the horizontal shading device increased. However, when the indoor light environment was analyzed through the UDI, the best results were obtained with a horizontal shading device with a depth of 600 mm. When the length was 900 mm, the overall illuminance of the classroom was lower than that of the other shading device depth. When only the glare problem is considered, it is better to extend the depth of the shading device to as long as possible, but too much extension results in excessive blocking of natural light entering the classroom. Therefore, proper shade design should be planned to create the best indoor light environment considering both the problem of glare and the needs of indoor lighting.
6. Conclusions
In this study, the DGP was used as a practical example, and the glare situation in the classroom space of a school was analyzed. The results of the simulation and analysis were summarized to propose a method for improving glare evaluation measures that are lacking in indoor environmental certification standards. The results of this study are summarized as follows.
First, this study tried to establish the foundation to grasp the occurrence of discomfort glare inside the classroom objectively by using the DGP. In the evaluation of the indoor light environment of the environmental certification systems, assessment items related to glare are scored according to the type or number of shading devices installed in the windows, or there is no glare evaluation item. In the case of other indoor light environment evaluation items, with the exception of glare, there are measurements, such as the daylight factor (DF), uniformity ratio, annual sunlight exposure (ASE), DA, and UDI, in which a score is graded according to some steps. Similarly, glare evaluation items should also be applied in a stepwise manner through specific scales and numerical values.
Second, this study identified the location and frequency of discomfort glare over a DGP of 0.4 in the classroom’s indoor area. The visualized data can help plan the indoor space and certification evaluation for the indoor light environment to prevent glare problems. By dividing the internal space of each type of classroom into 36 analysis grids, it was possible to identify the positions where discomfort glare primarily appeared. Planning can complement the weak areas where the severe glare occurred. Also, the proposed method identified annual and monthly incidence frequencies of discomfort glare by 10% intervals with different colored indices. Therefore, by using this method, for example, one can clearly present which month has the highest frequency of discomfort glare and average occurrence frequency of discomfort glare throughout a year. The proposed method will help reduce the occurrence of discomfort glare when planning educational facilities.
Third, this study demonstrated that there is a difference between a shade design that can reduce the glare problem and a shade design that can improve the natural light environment. When the depth of the horizontal shading device installed on the window increases, the frequency of discomfort glare decreases, and the indoor visual environment is continuously improved. However, a horizontal shading device over a certain depth excessively blocks the inflow of natural light, and the indoor space can become too dark so that the indoor illumination environment becomes worse than a case without the shading device. Therefore, horizontal shading devices with the proper length should be installed to improve the visual environment and the illuminance environment quality. The limitation of this study is that only horizontal shading devices were used in the simulation. Further research in simulations will be needed to determine how much the discomfort glare is reduced by using different types of shades.
Fourth, frequency data for discomfort glare occurrence can be used for planning the layout of the indoor space of a building. It is also possible to plan a reduction in the frequency of discomfort glare occurring in an indoor area through additional shading devices or window plans. In addition, by identifying the areas with discomfort glare occurrences, we can plan detailed layouts for enhancing problematic areas or excluding those parts from the workspace. This placement plan will provide a better light environment for people using the indoor space, which in the end will contribute to their health and productivity.
Author Contributions
K.S.L. conceived and designed the experiments; S.L. performed the simulations. K.S.L. and S.L. analyzed the data; K.S.L. and S.L. wrote the paper. Both authors approved the final manuscript.
Funding
This work was supported by the National Research Foundation of Korea (NRF) grant funded by the Korea government (MSIT) (No. NRF-2018R1A2B6005938). This work was also supported by the 2018 Hongik University Research Fund.
Conflicts of Interest
The authors declare no conflict of interest. The funding sponsors had no role in the design of the study; in the collection, analyses, or interpretation of data; in the writing of the manuscript, and in the decision to publish the results.
References
- Edwards, L.; Torcellini, P. Literature Review of the Effects of Natural Light on Building Occupants; National Renewable Energy Lab: Golden, CO, USA, 2002; pp. 4–38.
- Liberman, J. Light: Medicine of the Future: How We Can Use It to Heal Ourselves Now; Inner Traditions/Bear & Company: Rochester, VT, USA, 1990; pp. 58–77. [Google Scholar]
- Hathaway, W.E. A Study into the Effects of Light on Children of Elementary School-Age—A Case of Daylight Robbery (ED343686); ERIC: Ipswich, MA, USA, 1992; pp. 21–44.
- Nicklas, M.H.; Bailey, G.B. Daylighting in schools: Energy costs reduced… student performance improved. Strategic. Plann. Energy Environ. 1997, 17, 41–61. [Google Scholar] [CrossRef]
- Chen, L.Y.; Chen, S.; Dai, S.J.; Kuo, C.T.; Wang, H.C. Spectral design and evaluation of OLEDs as light sources. Org. Electron. 2014, 15, 2194–2209. [Google Scholar] [CrossRef]
- Huang, Y.S.; Luo, W.C.; Wang, H.C.; Feng, S.W.; Kuo, C.T.; Lu, C.M. How smart LEDs lighting benefit color temperature and luminosity transformation. Energies 2017, 10, 518. [Google Scholar] [CrossRef]
- Osterhaus, W.K.E. Discomfort glare assessment and prevention for daylight applications in office environments. Sol. Energy 2005, 79, 140–158. [Google Scholar] [CrossRef]
- Chen, Y.; Lin, C.Y.; Yeh, C.M.; Kuo, C.T.; Hsu, C.W.; Wang, H.C. Anti-glare LED lamps with adjustable illumination light field. Opt. Express 2014, 22, 5183–5195. [Google Scholar] [CrossRef]
- Lee, S.; Lee, K.S.; Kim, S. A study on the improvement method of indoor light environment items in environmental certification for educational facilities-focusing on G-SEED, LEED, BREEAM, CASBEE. J Archit. Inst. Korea Plan. Des. 2018, 34, 61–69. [Google Scholar]
- Wienold, J.; Christoffersen, J. Evaluation methods and development of a new glare prediction model for daylight environments with the use of CCD cameras. Energy Build. 2006, 38, 743–757. [Google Scholar] [CrossRef]
- Solemma LLC|DIVA. Available online: http://solemma.net/Diva.html (accessed on 15 May 2019).
- Reinhart, C.F.; Walkenhorst, O. Validation of dynamic RADIANCE-based daylight simulations for a test office with external blinds. Energy Build. 2001, 33, 683–697. [Google Scholar] [CrossRef]
- Reinhart, C.F.; Andersen, M. Development and validation of a Radiance model for a translucent panel. Energy Build. 2006, 38, 890–904. [Google Scholar] [CrossRef]
- Bechthold, M.; King, N.; Kane, A.O.; Niemasz, J.; Reinhart, C. Integrated Environmental Design and Robotic Fabrication Workflow for Ceramic Shading Systems. In Proceedings of the 28th ISARC, Seoul, Korea, 29 June–2 July 2011; pp. 70–75. [Google Scholar]
- Lee, K.S.; Han, K.J.; Lee, J.W. Feasibility study on parametric optimization of daylighting in building shading design. Sustainability 2016, 8, 1220. [Google Scholar] [CrossRef]
- Küller, R.; Lindsten, C. Health and behavior of children in classrooms with and without windows. J. Environ. Psychol. 1992, 12, 305–317. [Google Scholar] [CrossRef]
- Slopack, M. The Impact of A Window in the Classroom on Learning as Perceived by Students and Teachers. Capstone Course Thesis, Central Michigan University, Mount Pleasant, MI, USA, 2011. Available online: https://archive.georgebrown.ca/bitstream/10299/255/1/MSlopack_Final_Capstone_Report.pdf (accessed on 22 August 2019).
- Rea, M.S. Lighting Handbook: Reference & Application, 9th ed.; Illuminating Engineering Society of North America: New York, NY, USA, 2000; pp. 970–1378. [Google Scholar]
- Velds, M. Assessment of Lighting Quality in Office Rooms with Daylighting Systems. Ph.D. Thesis, Delft University of Technology, Delft, The Netherlands, 2000. [Google Scholar]
- Korea Institute of Construction Technology. Available online: https://www.gbc.re.kr/app/data/regulation/view.do (accessed on 15 May 2019).
- LEED v4 for Building Design and Construction. Available online: http://www.usgbc.org/resources/leed-v4-building-design-and-construction-current-version (accessed on 15 May 2019).
- BREEAM UK New Construction 2018. Available online: https://tools.breeam.com/filelibrary/Consultations/SD5078_DRAFT-UK_nondom_NC_2018-manual.pdf (accessed on 15 May 2019).
- CASBEE-BD(NC)e_2014 manual. Available online: http://www.ibec.or.jp/CASBEE/english/downloadE.htm (accessed on 15 May 2019).
- Carlucci, S.; Causone, F.; De Rosa, F.; Pagliano, L. A review of indices for assessing visual comfort with a view to their use in optimization processes to support building integrated design. Renewable Sustainable Energy Rev. 2015, 47, 1016–1033. [Google Scholar] [CrossRef]
- Reinhart, C.F.; Wienold, J. The daylighting dashboard—A simulation-based design analysis for daylit spaces. Build. Environ. 2011, 46, 386–396. [Google Scholar] [CrossRef]
- Konstantzos, I.; Tzempelikos, A.; Chan, Y.C. Experimental and simulation analysis of daylight glare probability in offices with dynamic window shades. Build. Environ. 2015, 87, 244–254. [Google Scholar] [CrossRef]
- Hopkinson, R.G. Glare from daylighting in buildings. Appl. Ergon. 1972, 3, 206–215. [Google Scholar] [CrossRef]
- Chauvel, P.; Collins, J.B.; Dogniaux, R.; Longmore, J. Glare from windows: Current views of the problem. Lighting Res. Technol. 1982, 14, 31–46. [Google Scholar] [CrossRef]
- Waters, C.E.; Mistrick, R.G.; Bernecker, C.A. Discomfort glare from sources of nonuniform luminance. J. Illum. Eng. Soc. 1995, 24, 73–85. [Google Scholar] [CrossRef]
- Bellia, L.; Cesarano, A.; Iuliano, G.F.; Spada, G. Daylight Glare: A Review of Discomfort Indexes. In Proceedings of the Visual Quality and Energy Efficiency in Indoor Lighting: Today for Tomorrow, Rome, Italy, March 2008. [Google Scholar]
- Wienold, J.; Christoffersen, J. Towards a New Daylight Glare Rating. In Proceedings of the 10 Europäischer Lichtkongress, Berlin, Germany, 21 September 2005; pp. 157–161. [Google Scholar]
- Wienold, J. Dynamic Simulation of Blind Control Strategies for Visual Comfort and Energy Balance Analysis. In Proceedings of the International-Building-Performance-Simulation-Association, Beijing, China, October 2007; pp. 1197–1204. [Google Scholar]
- Wienold, J. Dynamic Daylight Glare Evaluation. In Proceedings of the Building Simulation 2009, Glasgow, Scotland, July 2009; pp. 944–951. [Google Scholar]
- Cantin, F.; Dubois, M.C. Daylighting metrics based on illuminance, distribution, glare and directivity. Lighting Res. Technol 2011, 43, 291–307. [Google Scholar] [CrossRef]
- Darula, S.; Kittler, R. CIE general sky standard defining luminance distributions. 2002. Available online: https://www.researchgate.net/publication/238782731_CIE_general_sky_standard_defining_luminance_distributions (accessed on 22 August 2019).
- Perez, R.; Seals, R.; Michalsky, J. All-weather model for sky luminance distribution—Preliminary configuration and validation. Sol. Energy 1993, 50, 235–245. [Google Scholar] [CrossRef]
- Nabil, A.; Mardaljevic, J. Useful daylight illuminance: A new paradigm for assessing daylight in buildings. Lighting Res. Technol. 2005, 37, 41–57. [Google Scholar] [CrossRef]
- Jakubiec, J.; Reinhart, C. The ‘adaptive zone’—A concept for assessing discomfort glare throughout daylit spaces. Lighting Res. Technol. 2012, 44, 149–170. [Google Scholar] [CrossRef]
- Konstantzos, I.; Tzempelikos, A.; Murchison, N.M.; Proctor, R.W. Daylight Glare Evaluation When the Sun is Within the Field of View Through Window Shades. Build. Environ. 2017, 113, 65–77. [Google Scholar] [CrossRef]
- Mardaljevic, J. Daylight Simulation: Validation, Sky Models and Daylight Coefficients. Ph.D. Thesis, De Montfort University, Leicester, UK, December 1999. [Google Scholar]


© 2019 by the authors. Licensee MDPI, Basel, Switzerland. This article is an open access article distributed under the terms and conditions of the Creative Commons Attribution (CC BY) license (http://creativecommons.org/licenses/by/4.0/).