Article

On the Kaiser Effect of Rock under Cyclic Loading and Unloading Conditions: Insights from Acoustic Emission Monitoring

State Key Laboratory for Geomechanics and Deep Underground Engineering, School of Mechanics and Civil Engineering, China University of Mining & Technology, Xuzhou 221116, China
*
Author to whom correspondence should be addressed.
Energies 2019, 12(17), 3255; https://doi.org/10.3390/en12173255
Submission received: 14 June 2019 / Revised: 12 August 2019 / Accepted: 14 August 2019 / Published: 23 August 2019
(This article belongs to the Special Issue Advanced Technologies for Energy Exploitation of Coals)

Abstract

:
The Kaiser effect reflects the memory of the loaded rock to the irreversible damage and deformation. The stress level, loading rate and lithology are the main factors affecting the Kaiser effect of the rock. To identify the accurate stress point of the Kaiser effect, the MTS 816 rock mechanics testing system and the DS5-A acoustic emission testing and analysis system were adopted. The uniaxial cyclic loading–unloading and acoustic emission characteristic test of 90 rock specimens from three types of rocks under different stress level and loading rate was carried out. The evolution of acoustic emission under uniaxial compression of the rock corresponds to the compaction stage, elastic stage, yield stage and post-peak stress drop stage of the rock deformation and failure process and is divided into the quiet period, transition period, active period and decay period of the acoustic emission. The larger the hardness of rock is, the earlier the stress point of the Kaiser effect appears. The loading stress level (σA) has appreciable influence on the Kaiser effect of the rock. When σA ≥ 0.7σc, the Kaiser effect disappears. Usually, the dilatancy stress (crack initiation stress) does not exceed 70% of the uniaxial compressive strength (σc) of the rock, and the stress point can be the threshold to determine whether the Kaiser effect occurs. The influence of loading rate (lr) on Felicity rate (FR) is relatively large when lr < 0.01 mm/s, and FR rapidly grows with increase of the loading rate. When lr ≥ 0.01 mm/s, the influence of the loading rate on FR is relatively small. The findings facilitate the future application of the Kaiser effect and improvement of the accuracy of the acoustic emission data interpretation.

1. Introduction

The acoustic emission (AE) of rock refers to the phenomenon of radiation of acoustic (elastic) waves due to the expansion of original fissures and defects and the initiation, evolution, expansion and fracturing of induced microcracks when a rock undergoes loading [1,2,3,4]. AE during the loading process of rock is irreversible and reflects the deformation and failure process of rock indirectly. The AE parameters can describe the degree of damage and failure of the rock. At present, the AE method is widely used to evaluate the degree of rock damage and unveil the highest stress level in rock history. Many scholars have revealed the acoustic emission characteristics of rock during loading and established the relationship between stress, strain and acoustic emission characteristics. The influence of the loading rate on AE through the uniaxial and triaxial compression acoustic emission of the rock has been investigated [5,6,7,8,9]. The rock damage and failure modes are assessed by acoustic emission parameters [10,11,12]. Therefore, the relationship between the rock deformation and failure process and AE parameters is studied in the test to explore the evolution of AE under different stress paths and experimental environment. This favors in-depth understanding of the evolution characteristics of rock failure and is significant in revealing the rock instability and engineering application of AE.
AE of the rock under loading is irreversible, i.e., it will not occur noticeably until the loading stress magnitude exceeds that of the maximum stress in the loading history. This feature is termed the Kaiser effect, which represents the memory of the rock to the loading history (maximum stress or strain) [13,14,15,16,17,18,19]. Many defects, such as cracks, pores and particles, exist in the rock. When the rock is submitted to loading, the closure of original fractures and the sliding of particles yield the friction-type AE with low frequency and energy. The microfracturing of rock stems from two failure modes, i.e., tension and shearing. Generation of the new microfracture produces rupture-type AE with high frequency and energy [20]. The rupture-type AE can memorize the effect of the history maximum stress on the rock, and the friction-type AE is an important factor that disturbs the identification point of the Kaiser effect. Currently, the uniaxial loading mode is usually adopted to determine the stress point of the Kaiser effect. However, in the single loading test (uniaxial compression test or uniaxial tension test) process, the stress point of the Kaiser effect is covered by the considerable AE activities due to the friction and slippage between the surfaces of the microstructures of the rock [21]. To accurately acquire the stress point of the Kaiser effect, Yoshikawa and Mogi [22] used the uniaxial double cyclic loading test, where the cyclic peak stress is prescribed to be higher than the previous estimated maximum stress. When the dilatancy stress (cyclic peak stress) is 30–80% of the uniaxial compressive strength (UCS), the Kaiser effect appears. Later, many scholars conducted the cyclic loading and unloading and acoustic emission characteristic test of the rock successively and found that: (1) The Kaiser effect is relevant to the level of the applied stress. When the dilatation of the rock occurs due to the applied stress, the Kaiser effect disappears. Usually the dilatancy stress (crack initiation stress) does not exceed 70–80% of the uniaxial compressive strength (σc) [23,24,25,26]. When the first loading stress level is less than 30% of σc in the compaction stage of stress-strain curve of the rock, the Kaiser effect can be easily misjudged due to the acoustic emission generated from closure of original fissures and sliding friction between particles in the rock. When the loading stress level is high, the value of the stress that the rock memorized previously is changed due to the high stress, for which the Kaiser effect in the subsequent reloading is not obvious [26]. Therefore, to obtain clear Kaiser effect, the appropriate stress range is determined. (2) To inhibit or eliminate the influence of the friction-type acoustic emissions on the identification of the stress point of the Kaiser effect, a certain period of time is maintained after the load is applied to the level of the designed loading stress. The influence of short delay duration on Kaiser effect is small. As time passes (long delay time), the Kaiser effect of some rocks will disappear gradually [23,24,25,26,27]. (3) The loading rate and lithology can affect the evolution of Felicity rate and occurrence of the Kaiser effect. However, at present, the factors influencing the acoustic emission characteristics and Kaiser effect are relatively simple. Comprehensive understanding of the influences of the stress level, loading rate and lithology on the acoustic emission characteristics is absent, and the existence of Kaiser effect of rock is further explored in this paper [28,29,30].
AE originates from the evolution of internal cracks in rocks, being consistent with the damage process of the rock under loading. Therefore, the evolution of initiation, expansion and penetration of internal cracks in rocks can be determined through the variation of AE parameters. The Kaiser effect reflects the memory of rock to irreversible damage under load. The stress level, loading rate and lithology also influence the Kaiser effect of the rock. For the rock of the same type, different stress levels cause different degrees of damage to the rock specimens. Therefore, different AE phenomena occur during testing, and different AE characteristics appear. The difference of the AE characteristics generated in different kinds of rocks in the same stress level is large. At the same time, the loading rate also affects the rock damage degree and causes different AE characteristics. To reveal the influences of stress level, loading rate and lithology on the acoustic emission characteristics, we employ the MTS 816 rock mechanics testing system and the DS5-A acoustic emission testing and analysis system to monitor the mechanical properties and AE characteristics of red sandstone, marble and granite subjected to uniaxial cyclic loading and unloading. The evolution of Felicity ratio is analyzed, and the existence of Kaiser effect is explored. The study provides the foundation for the future application of the Kaiser effect and improvement of the accuracy of the acoustic emission data interpretation.

2. Materials and Methods

Three types of rock, red sandstone, marble and granite, were used for experiments after they are seasoned naturally indoors. The density of the red sandstone, marble and granite were 2.39 g/cm3, 2.53 g/cm3, and 2.63 g/cm3, respectively. The polarizing microscope (PM) was used to examine the compositions and structures of red sandstone, marble and granite, and the scanning electron microscope (SEM) is adopted for analyzing the microstructures and compositions of the three types of rocks (Figure 1). The micro-examination shows: (1) Red sandstone, with the ultrafine-fine sand-like structure, mainly consists of the ultra-fine sand with the particle size of 0.06–0.12 mm and fine sand with the particle size of 0.12–0.25 mm. The main debris compositions include quartz and feldspar, the surface of the quartz is smooth, and some crystal surfaces are provided with undulatory extinction. The feldspar is plagioclase mainly and potash feldspar secondarily. The cement is mainly composed of evenly distributed calcite. The structure is relatively dense, and the development of pores is poor. (2) Marble exhibits granoblastic texture and massive structure. The composition is roughly 82% calcite and about 18% anhydrite. The crystalloblastic particles of the calcite are 0.15–2.0 mm. The anhydrite is in the board shape and column shape with the width of 0.01–0.8 mm and length of 0.1–3.0 mm, respectively. The calcite particles are closely inlaid with each other with dense structure. (3) Granite exhibits monzonitic texture, massive structure and comparatively dense structure. The main compositions are quartz, alkali feldspar and plagioclase. The quartz accounts for about 20% with the particle size of 0.6–3.6 mm, the alkali feldspar accounts for about 45% with the particle size of 0.8–6.0 mm, the longboard-shaped plagioclase accounts for about 32% with the width of 0.4–1.6 mm and the length of 1.4–4.2 mm and the biotite accounts for about 3% with the particle size of 0.5–1.6 mm. The standard-sized cylindrical rock samples with the diameter of 50 mm and height of 100 mm were prepared using coring machine, rock saw and grinder. The UCS of the red sandstone, marble and granite were 62.80 MPa, 93.72 MPa and 103.84 MPa, respectively.
The MTS 816 rock mechanics testing system (Figure 2c) is employed for the laboratory tests. The systems comprise loading, testing and control components. Different control modes such as force/stress control and displacement/strain control are available to satisfy the requirements of various types of tests. The rigidity of the testing machine is 2.6 × 10⁹ N/m, the axial load is 1459 kN, and the maximum strike of the axial actuator is 100 mm. The sensitivity of the servo valve is 290 Hz. The data acquisition frequency ranges from 5 kHz to 1 MHz. The loading strain rate varies from 10−7/s to 10−2/s. The minimum sampling time is 50 μs. The DS5-A acoustic emission testing and analysis system (Figure 2e) is adopted for AE monitoring. The system continuously stores the waveform data during the test with good stability and high accuracy. The continuous data storage speed is greater than 262 MB/s. The frequency is 10 MHz, the preamplifier gain is 40 dB, and the threshold value is 30 dB. To ensure the coupling between the AE sensor and the rock sample, Vaseline is applied to the ceramic end of the AE sensor that is fixed to the rock sample using hot melt adhesive (Figure 2d). Meanwhile, the position between the end surface of the rock sample and the bearing plate of the loading system is coated with Vaseline to reduce the influence of the end friction of the bearing plate on the AE of rocks. During the whole deformation and failure of rocks, the loading system and detection system for AE are operated synchronously.
Uniaxial cyclic loading and unloading tests of red sandstone, marble and granite under different stress levels and loading rates are conducted. The loading path of the uniaxial cyclic loading and unloading is illustrated in Figure 2b. Detailed experimental scheme can be found in Table 1. Each test consists of two stages. In the first stage, the stress control mode is adopted to apply the loading stress to a prescribed value (σA) at the rate of 1.0 MPa/s. σA are 50%, 60%, 70%, 80% or 90% of the UCS (σc) the rock, respectively. Then the load is kept constant for three minutes, which eliminates the influence of the AE events caused by the friction and slippage between the microstructure surfaces inside the rock on the subsequent experimental results [22,23,28,31]. The axial stress is then unloaded to 0.5 MPa at the rate of 1.0 MPa/s. Note that the axial stress is not zero, which ensures that the bearing plate of the loading system is completely contacted with the end surface of the rock sample during the test. In the second stage, the displacement control mode is utilised to avoid the sudden failure of the rock sample under the stress control mode. The loading rates (lr) are prescribed to be 0.001 mm/s, 0.005 mm/s, 0.01 mm/s, 0.05 mm/s and 0.1 mm/s, respectively. The corresponding strain rate is approximately 10−5/s to 10−3/s, belonging to the medium and low strain rate levels [29,32,33].

3. Results

Figure 3, Figure 4, Figure 5, Figure 6, Figure 7, Figure 8 and Figure 9 show the AE characteristics of the three types of rocks under uniaxial compression and uniaxial cyclic loading and unloading conditions, respectively.
The stress–time–AE curves of the three types of rocks subjected to uniaxial compression are divided into four stages, i.e., compaction stage, elastic stage, yield stage (both the stable and unstable expansion stages of cracks, respectively) and post-peak stress drop stage. Correspondingly, the deformation and failure of rock is divided into fracture closure stage, elastic stage, dilatancy stage (generation of new fractures) and macroscopic failure stage. The AE evolution is composed of quiet period, transition period, active period and attenuation period accordingly. Figure 3 shows the AE of the three types of rock during uniaxial compression features: (1) In the quiet period (OA), in correspondence with the compaction stage of the stress-strain curve, the primary microcracks, pores and joints in the rock sample close. Because the surfaces of microfissures are rough and particles in the rock sample slide against each other, a small number of low-energy AE events with appreciable fluctuations are observed. (2) The transition period (AB) corresponds to the elastic stage of the stress–strain curve. The stress applied to the rock sample in this stage is insufficient to form new cracks. Thus, the AE activity is not evident. After the compaction stage, the microfissures and joints in the rock sample are compacted and closed. However, the slippage of some closed cracks leads to the generation of a small amount of low-energy AE events. (3) The active period (BC) corresponds to the yield stage of the stress-strain curve. As the axial stress increases continuously, the microcracks in the rock sample are continually generated and expanded. The AE activity becomes active with an increasing number of AE events. When the stress peaks, the microfissures finally converge and interpenetrate to form the macroscopic fracture surface and fail the rock sample. At the point of failure, the AE activity is extremely active with the maximum number of AE events. (4) The decay period (CD) of AE corresponds to the failure stage of the stress–strain curve. The rock sample has some bearing capacity due to the friction between the fracture surfaces, which sustains continuous generation of AE. However, during the rapid stress drop, the number of AE events is gradually reduced.
The stress–time–AE relationships during the uniaxial cyclic loading and unloading test of the three types of rocks (Figure 4, Figure 5, Figure 6, Figure 7, Figure 8 and Figure 9) exhibit the following features. First, the FG section is the loading stage of the first cycle with a small number of AE events. As the stress increases continuously, the number of AE events grows. The stage GH is the load-sustain stage of the first cycle. In this stage, AE events are continuously generated due to the friction or crack slip on the surface of some microcracks. The stage HI is the unloading stage of the first cycle. In this stage, the expansion of original cracks and the formation of new cracks do not occur. Thus, only a small number of AE events are observed. The stage HJ is the loading stage of the second cycle. After the closure of the microfissures and joints in the rock sample in Stages FG and GH in the first cycle, few AE events appear in the initial loading stage due to small stress. Thus, the loading rate can effectively inhibit the generation of the friction-type AE, which favors the identification the stress point of the Kaiser effect in the subsequent reloading stage. The prescribed stress level of the first cycle (σA), however, affects more pronouncedly the occurrence of AE during the second cyclic loading stage. When σA is lower, the stress at which a large amount of AE events appears in the second loading cycle (σAE) is higher. Normally, when the stress exceeds σA of the first loading, noticeable AE events occur, and the Kaiser effect becomes obvious. When σA is greater, σAE is lower. Apparent AE events occur in the rock sample in the initial stage of the second loading. The Kaiser effect disappears whereas the Felicity effect occurs. The evolutions of the stress–time–AE characteristics of the three types of rock are generally consistent. The loading rate and the lithology affect the Kaiser effect of rock.

4. Discussion

The experimental results indicate that the Kaiser effect of rocks disappears and the Felicity effect appears when the influencing factors such as stress level, loading path and loading rate vary [21,26,27]. The Felicity effect is also called the anti-Kaiser effect, which means that during the cyclic loading testing, when the loading stress is less than the highest stress level in the loading history, the AE events occur noticeably. The Felicity effect represents the memory ability of the rock to damage, which is usually estimated through the Felicity rate (FR).
The definition of Felicity rate (FR):
FR = σAE/σm
where σAE is the stress point of the Kaiser effect, i.e., the stress at which a large number of AE events occurs during the second cyclic loading. σm is the maximum stress in the first cyclic loading.
The FR values of the three types of rocks under different stress levels and loading rates are obtained through Equation (1) (see Table 2). The values of FR of the three types of rocks are shown in Figure 10 and Figure 11. The occurrence conditions of the Kaiser effect and the Felicity effect of the three types of rocks are discussed in the following by analyzing the effect of stress level and loading rate on the variation of FR.

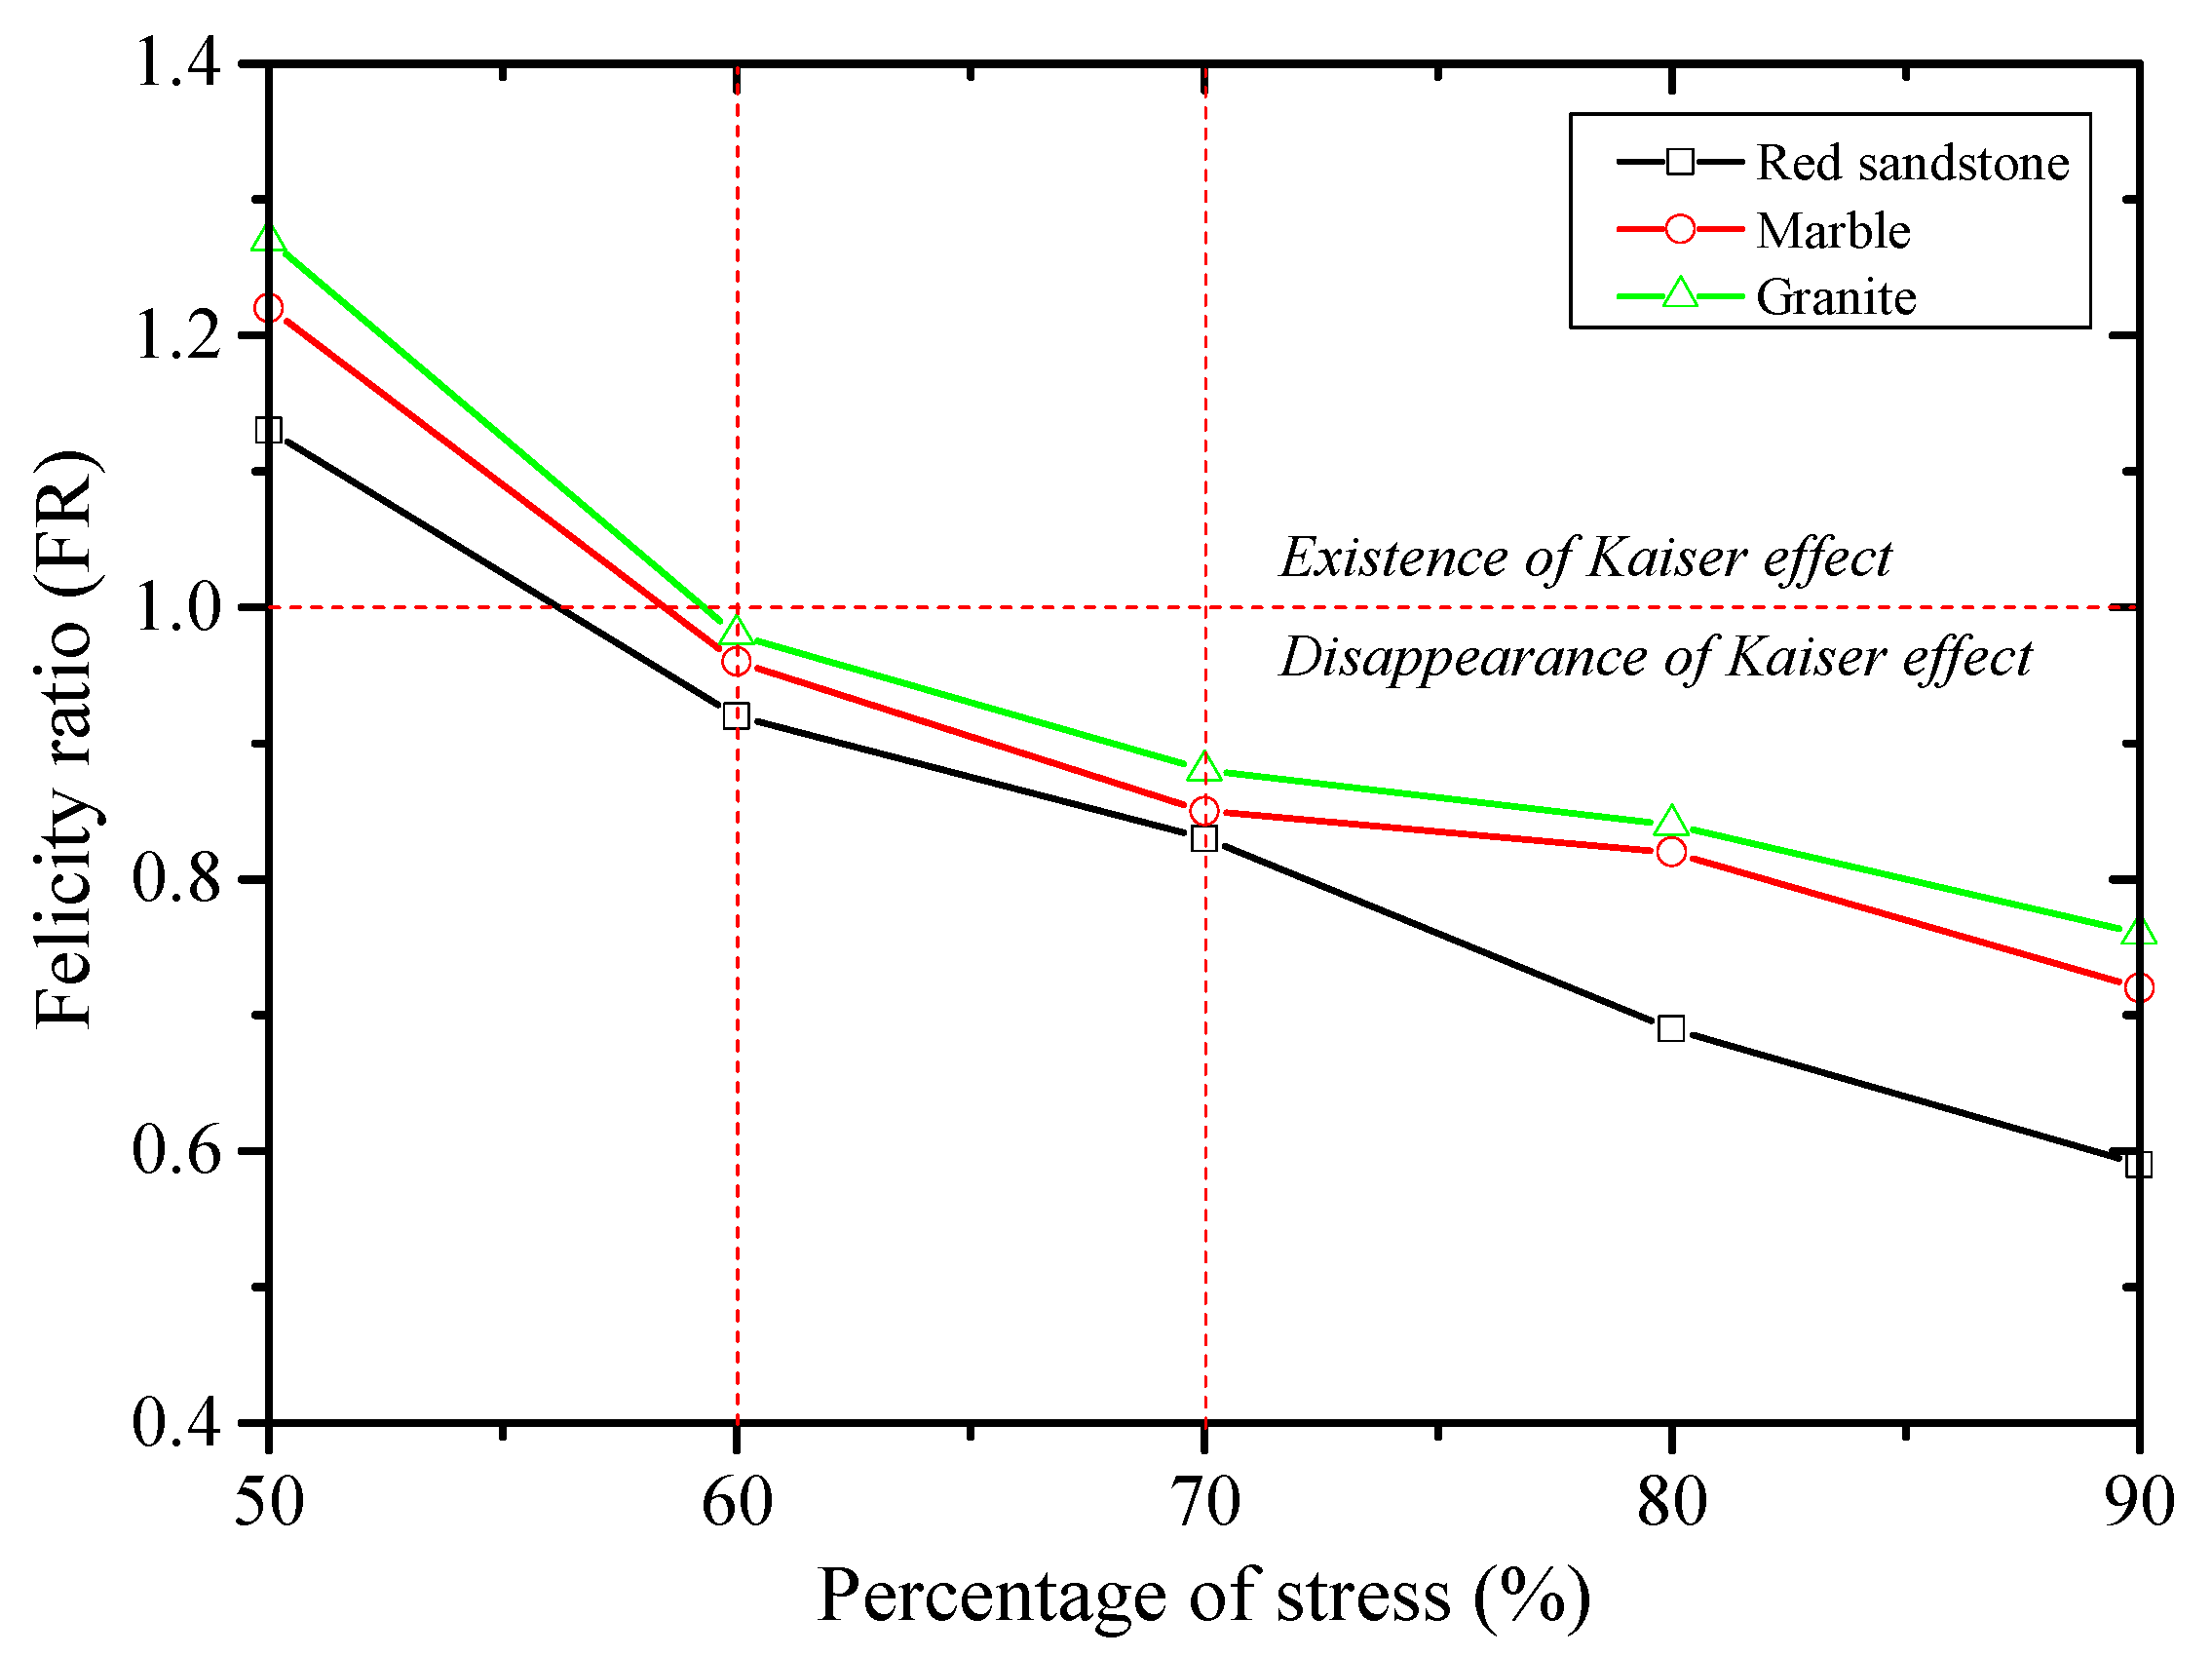
4.1. Effect of Stress Level on the Kaiser Effect

Figure 4, Figure 5, Figure 6 and Figure 10 and Table 2 show that: (1) when σA equals 0.5 σc, σA falls between the compaction stage (OA) and the elastic stage (AB). Only when the stress exceeds the stress level of the first loading cycle, AE events occur remarkably, and the Kaiser effect is apparent. The FR values of red sandstone, marble and granite are all greater than 1.0, being 1.11–1.14, 1.21–1.23 and 1.26–1.28, respectively. Thus, the Kaiser effect occurs during reloading. (2) When σA equals 0.6 σc, σA is between the elastic stage (AB) and the stable expansion stage (BE). The FR values of red sandstone, marble and granite are 0.90–0.95, 0.95–0.97 and 0.97–0.99, respectively. That is, the Kaiser effect is not clear since the FR values all approximate 1.0. Under this stress level, the occurrence of the Kaiser effect is closely related to the lithology. The higher the rock strength, the closer the FR value is to 1.0, and the clearer the Kaiser effect. (3) When σA is no less than 0.7 σc, σA is between the stable expansion stage (BE) and the unstable expansion stage (EC). The FR values of red sandstone, marble and granite are 0.83–0.59, 0.85–0.72 and 0.88–0.76, respectively. Many AE events occur at the lower loading stress level. Under this circumstance, the Kaiser effect disappears, and the Felicity effect occurs.
Generally, the strength of the rock decreases as the stress level of the first loading cycle increases. The damage degree gradually increases, and the number of the generated AE events also increases. A large body of AE events occurs earlier, and the Kaiser effect gradually disappears accompanied by the advent of the Felicity effect. The appearance of the Kaiser effect is closely associated with the lithology. The higher the rock hardness and strength, the earlier the occurrence of the stress point of the Kaiser effect and the more obvious the stress point. The stress state is well recorded through the elastic deformation and brittle fracture of the rock. Consequently, the Kaiser effect of the brittle (mainly elastic deformation) rock is more obvious than that of the ductile (mainly plastic deformation) one. Moreover, the cyclic loading and unloading test mode outperforms the uniaxial loading mode in identifying the stress point of the Kaiser effect. In the cyclic loading and unloading test, not only is the influence of the friction-type AE eliminated, but the desired loading stress level (σA) is also used as the target value of the loading stress state. Thus, the stress point of the Kaiser effect is not artificially generated.
Kaiser effect of rocks strictly exists in the stable expansion stage of cracks (Stage BE in Figure 4) due to: (1) In the stage BE, original microcracks in the rock expand and new cracks develop, which leads to irreversible change to the rock structure. This change is memorized in the subsequent loading process [15]. (2) When the rock dilatancy occurs, the cracks in the rock exhibit a non-stable expansion. Under the influence of bifurcation and merging of the microcracks, cross, confluence and penetration occur to the cracks, and macroscopic cracks are formed. In this stage, even if the Kaiser effect still exists, it is covered by the remarkable AE events due to the crack expansion. The stress point of the Kaiser effect is not apparent. Experimental results show that usually the dilatancy stress (crack initiation stress) does not exceed 70% to 80% of the UCS of the rock [21,23,24,27,28,34,35,36]. (3) High loading stress alters the memory of the maximum stress (σm) in the loading history. When the stress (σA) is lower than the maximum stress (σm) in the loading history, the microelements in the rock deform and fail. However, the size of the rock crack keeps unvaried. Thus, the stress hardly affects the stress memory in the second cyclic loading. When σA is larger than σm, newly induced damage in the rock accumulates. Under this condition, the size of the crack corresponding to the previous maximum stress is changed to cross the internal cracks. Consequently, the stress memory of the rock is changed, which invalidates the Kaiser effect. When σA is a slightly greater than σm, the influence of the stress level on the stress memory effect of the rock is not obvious [22,23]. Generally, the mechanical nature of the Kaiser effect of rocks lies in the continuous accumulation (formation of new microcracks or expansion of original microcracks) of the internal damage after the rock is loaded. During reloading, new damage develops only after the previous maximum stress is exceeded. Existing cracks expand, connect and interpenetrate again. Consequently, the obvious AE events take place.

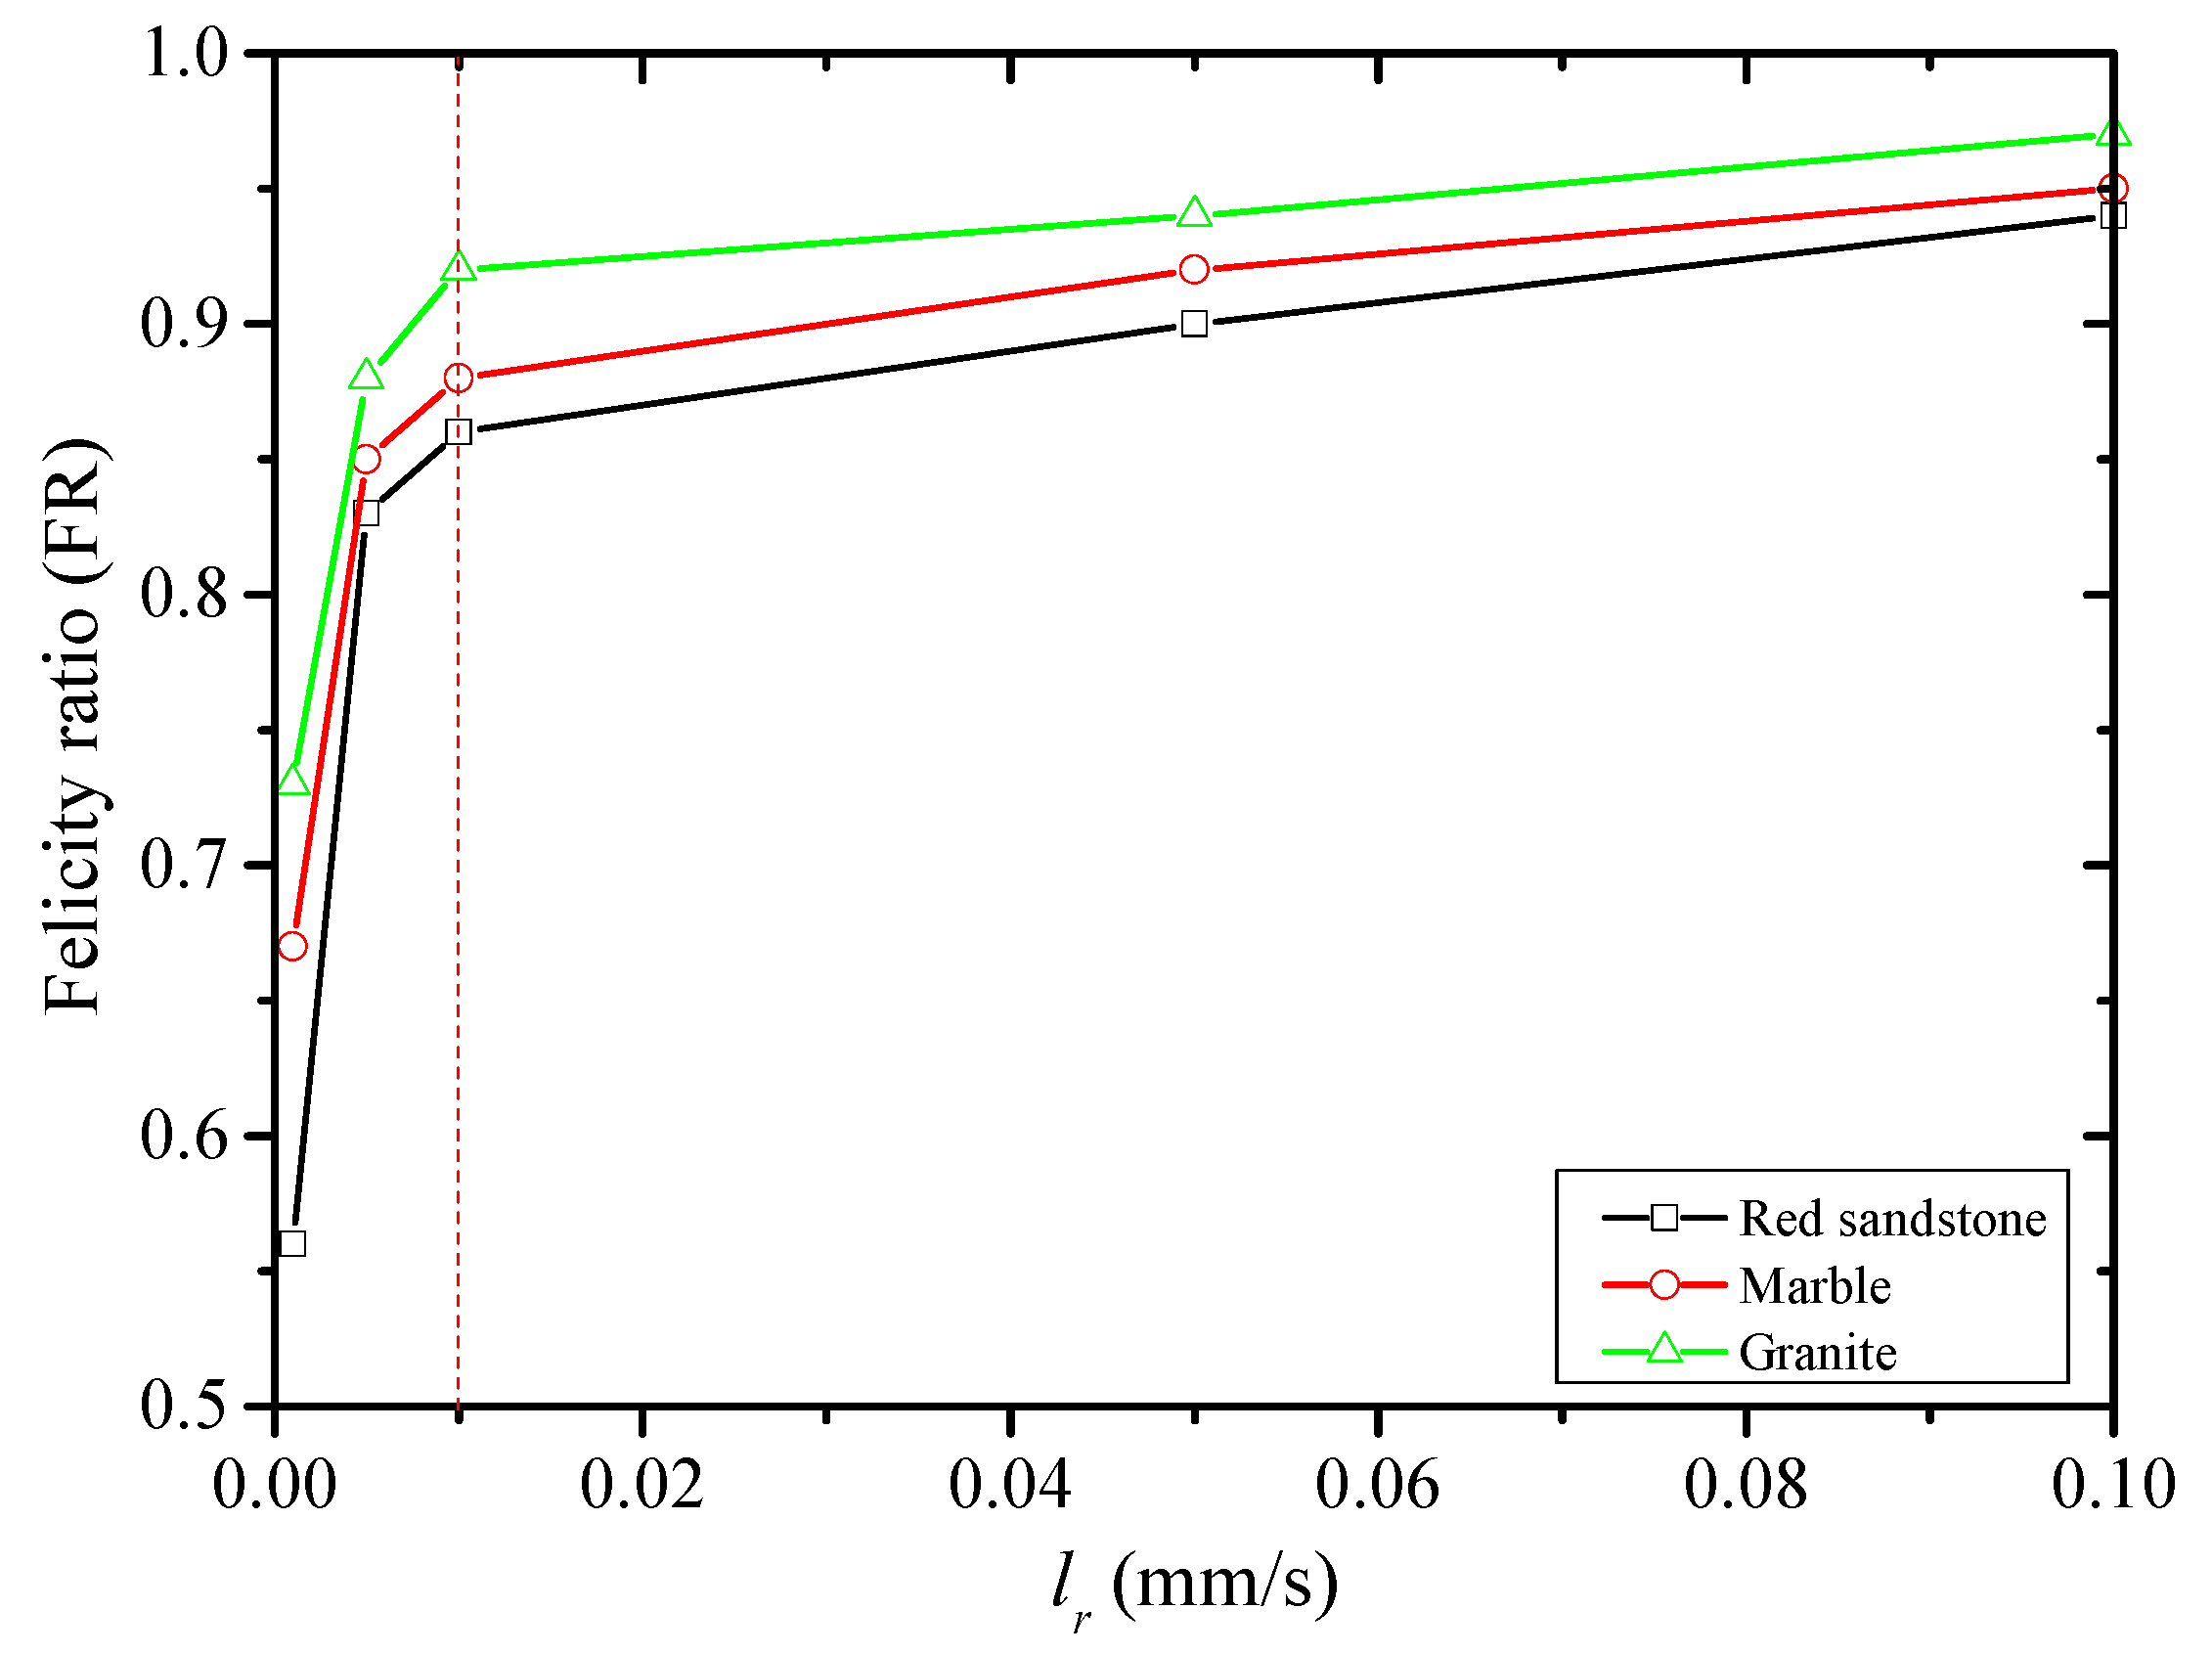
4.2. Effect of Loading Rate on the Kaiser Effect

The variation of FR of the three types of rocks under various the loading rates (lr) is illustrated in Figure 7, Figure 8, Figure 9, Figure 11 and Table 2. As lr is increased from 0.001 mm/s to 0.1 mm/s, FR values of red sandstone, marble and granite respectively increase from 0.56 to 0.94, from 0.67 to 0.95 and from 0.73 to 0.97 with the increase rates of 67.86%, 41.79% and 32.88%. When lr is increased from 0.001 mm/s to 0.01 mm/s, FR increases from 0.56 to 0.86, from 0.67 to 0.88 and from 0.73 to 0.92, with the increase rates of 53.57%, 31.34% and 26.03%, respectively. When lr arises to 0.1 mm/s, FR grows to 0.94, 0.95 and 0.97 with the increase rates of 9.30%, 7.96% and 5.44%, respectively. As the loading rate increases, FR is increased, and the Kaiser effect easily occurs. When lr is smaller than 0.01 mm/s, the influence of the loading rate on FR is greater, and FR is rapidly increased as the loading rate grows. When lr is no less than 0.01 mm/s, the influence of the loading rate on FR is less remarkable. The influence of the loading rate on the AE characteristics of rocks is shown by the variation of the AE rate (the number of AE events produced in a unit time) that represents the energy released by the rock due to the formation and expansion of internal cracks. Overall, the higher the AE rate, the quicker the damage to the rock sample. When the loading rate is lower (lr is less than 0.01 mm/s), the initiation and expansion time of the microfissures in the rock are longer. Although the AE events are pronounced, the AE rate is lower. When the loading rate is greater, i.e., no less than 0.01 m/s to 0.01 mm/s, new energy is fueled when the microfissures in the rock are not closed, which reduces the resistance required to open the crack. Therefore, the crack expansion is accelerated, and more energy is released. Although the number of AE events is slightly reduced, the AE rate is nevertheless higher.
The influence of the loading rate on the Kaiser effect of rocks originates from the following points: (1) The loading rate is closely related to the crack expansion. When the loading rate is smaller, the microcracks expand at the low stress level. The AE events are generated earlier in the second loading cycle. The occurrence of the stress point of the Kaiser effect is earlier, and the FR value is lower, which leads to the disappearance of the Kaiser effect. When the loading rate is higher, large cracks mainly participate in the deformation and failure of rock with fewer microcracks involved. Consequently, the microfissure cannot fully expand, which results in fewer rearranged particles. Hence, the number of AE events decreases. However, under a higher loading rate, the expansion speeds of existing microcracks and generation speed of new cracks in rocks also increase. The damage is gradually accumulated, and the number of the AE events increases. The AE rate is higher [37,38]. Additionally, the plastic strain rather than the elastic strain is affected by the loading rate. The plastic strain generated during loading cannot be fully developed, which enlarges the FR value and facilitates the occurrence of Kaiser effect [39]. (2) Red sandstone, marble and granite are dense, elastoplastic materials. Under a lower loading rate, the stress between the particles in the rock sample is continuously transferred and adjusted to initiate and fully develop damage and microfissures, which leads to a lower rock strength. Under a relatively higher loading rate, during the yield process, the stress between particles in the rock sample cannot be transferred or adjusted immediately, which results in a higher rock strength [29,40,41]. Thus, the stress (σAE) is increased when a large number of AE events are generated during the second loading cycle. Both the FR value and the occurrence possibility of the Kaiser effect are increased.

5. Conclusions

We systematically conducted the uniaxial cyclic loading and unloading test on red sandstone, marble and granite samples. The stress–time–AE relationships of the three types of rocks under different stress levels and loading rates were obtained. The stress point of the Kaiser effect in the reloading stage was determined. How the stress level and loading rate affected the Kaiser effect was investigated. The main conclusions in this paper are summarized:
(1)
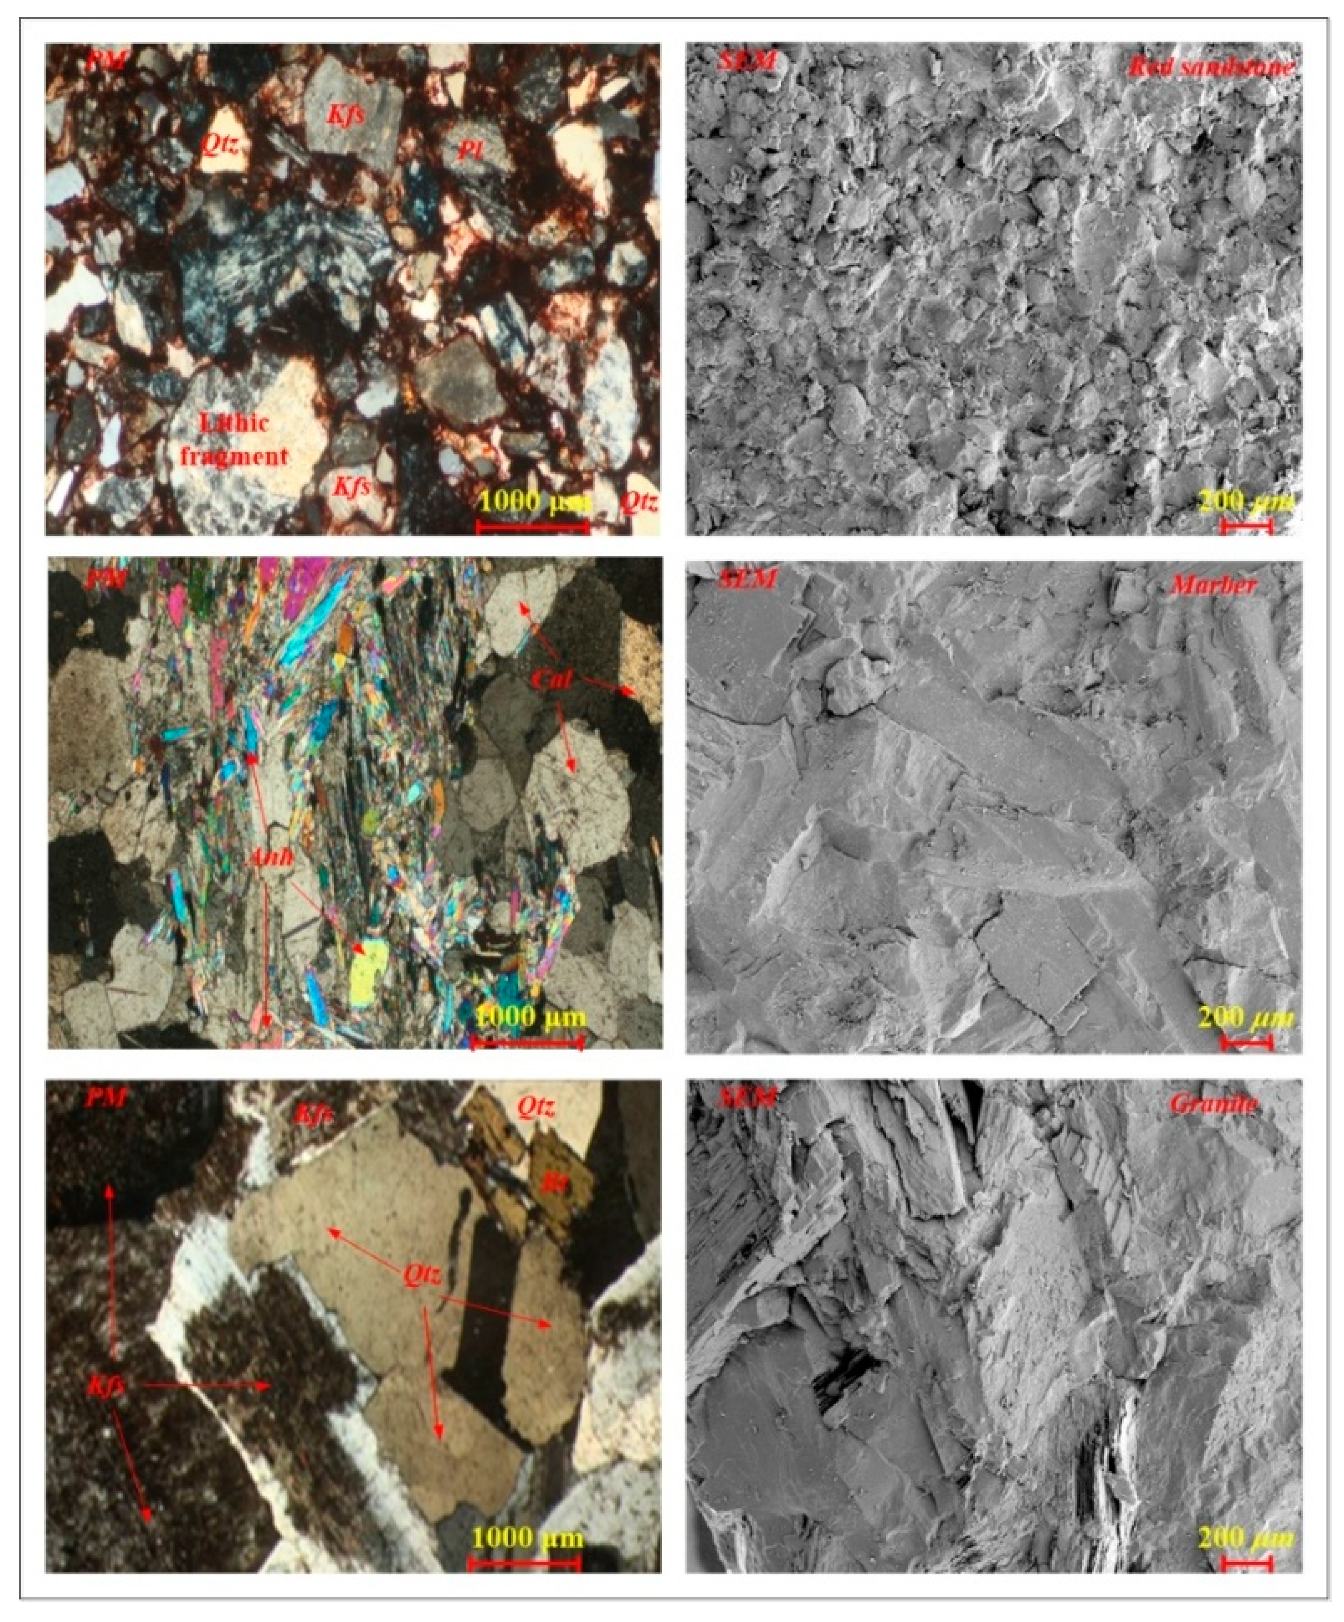
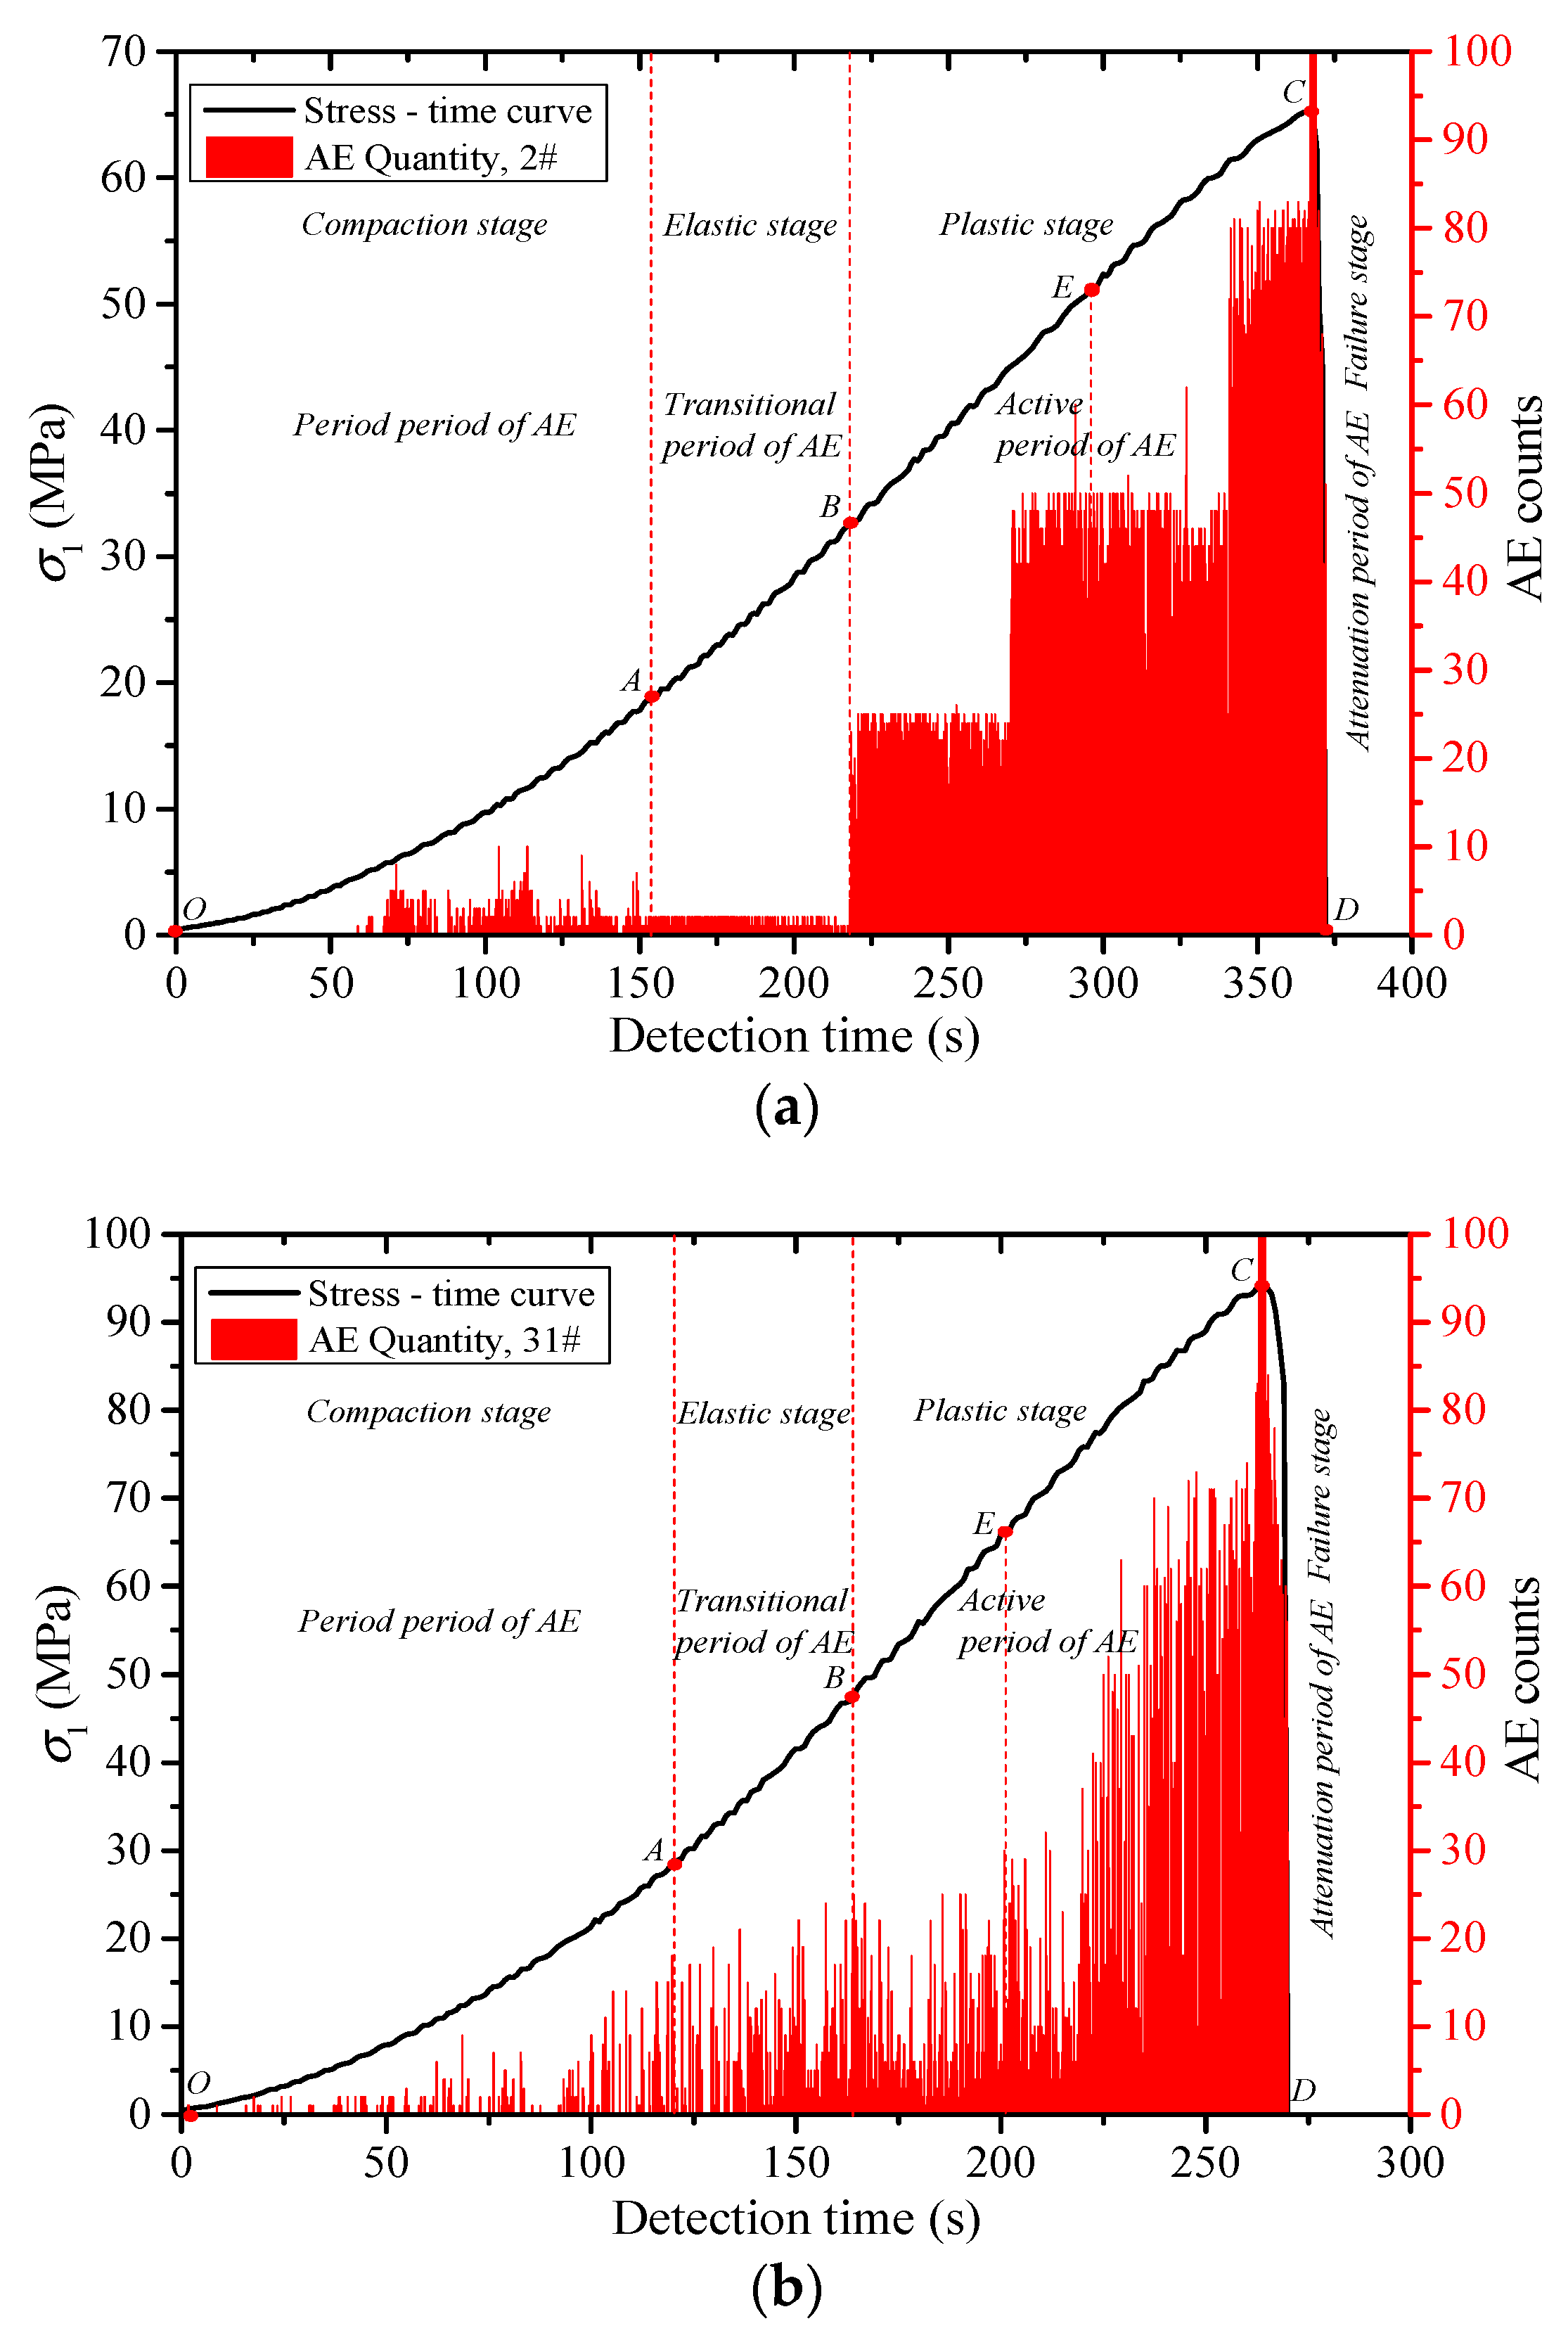
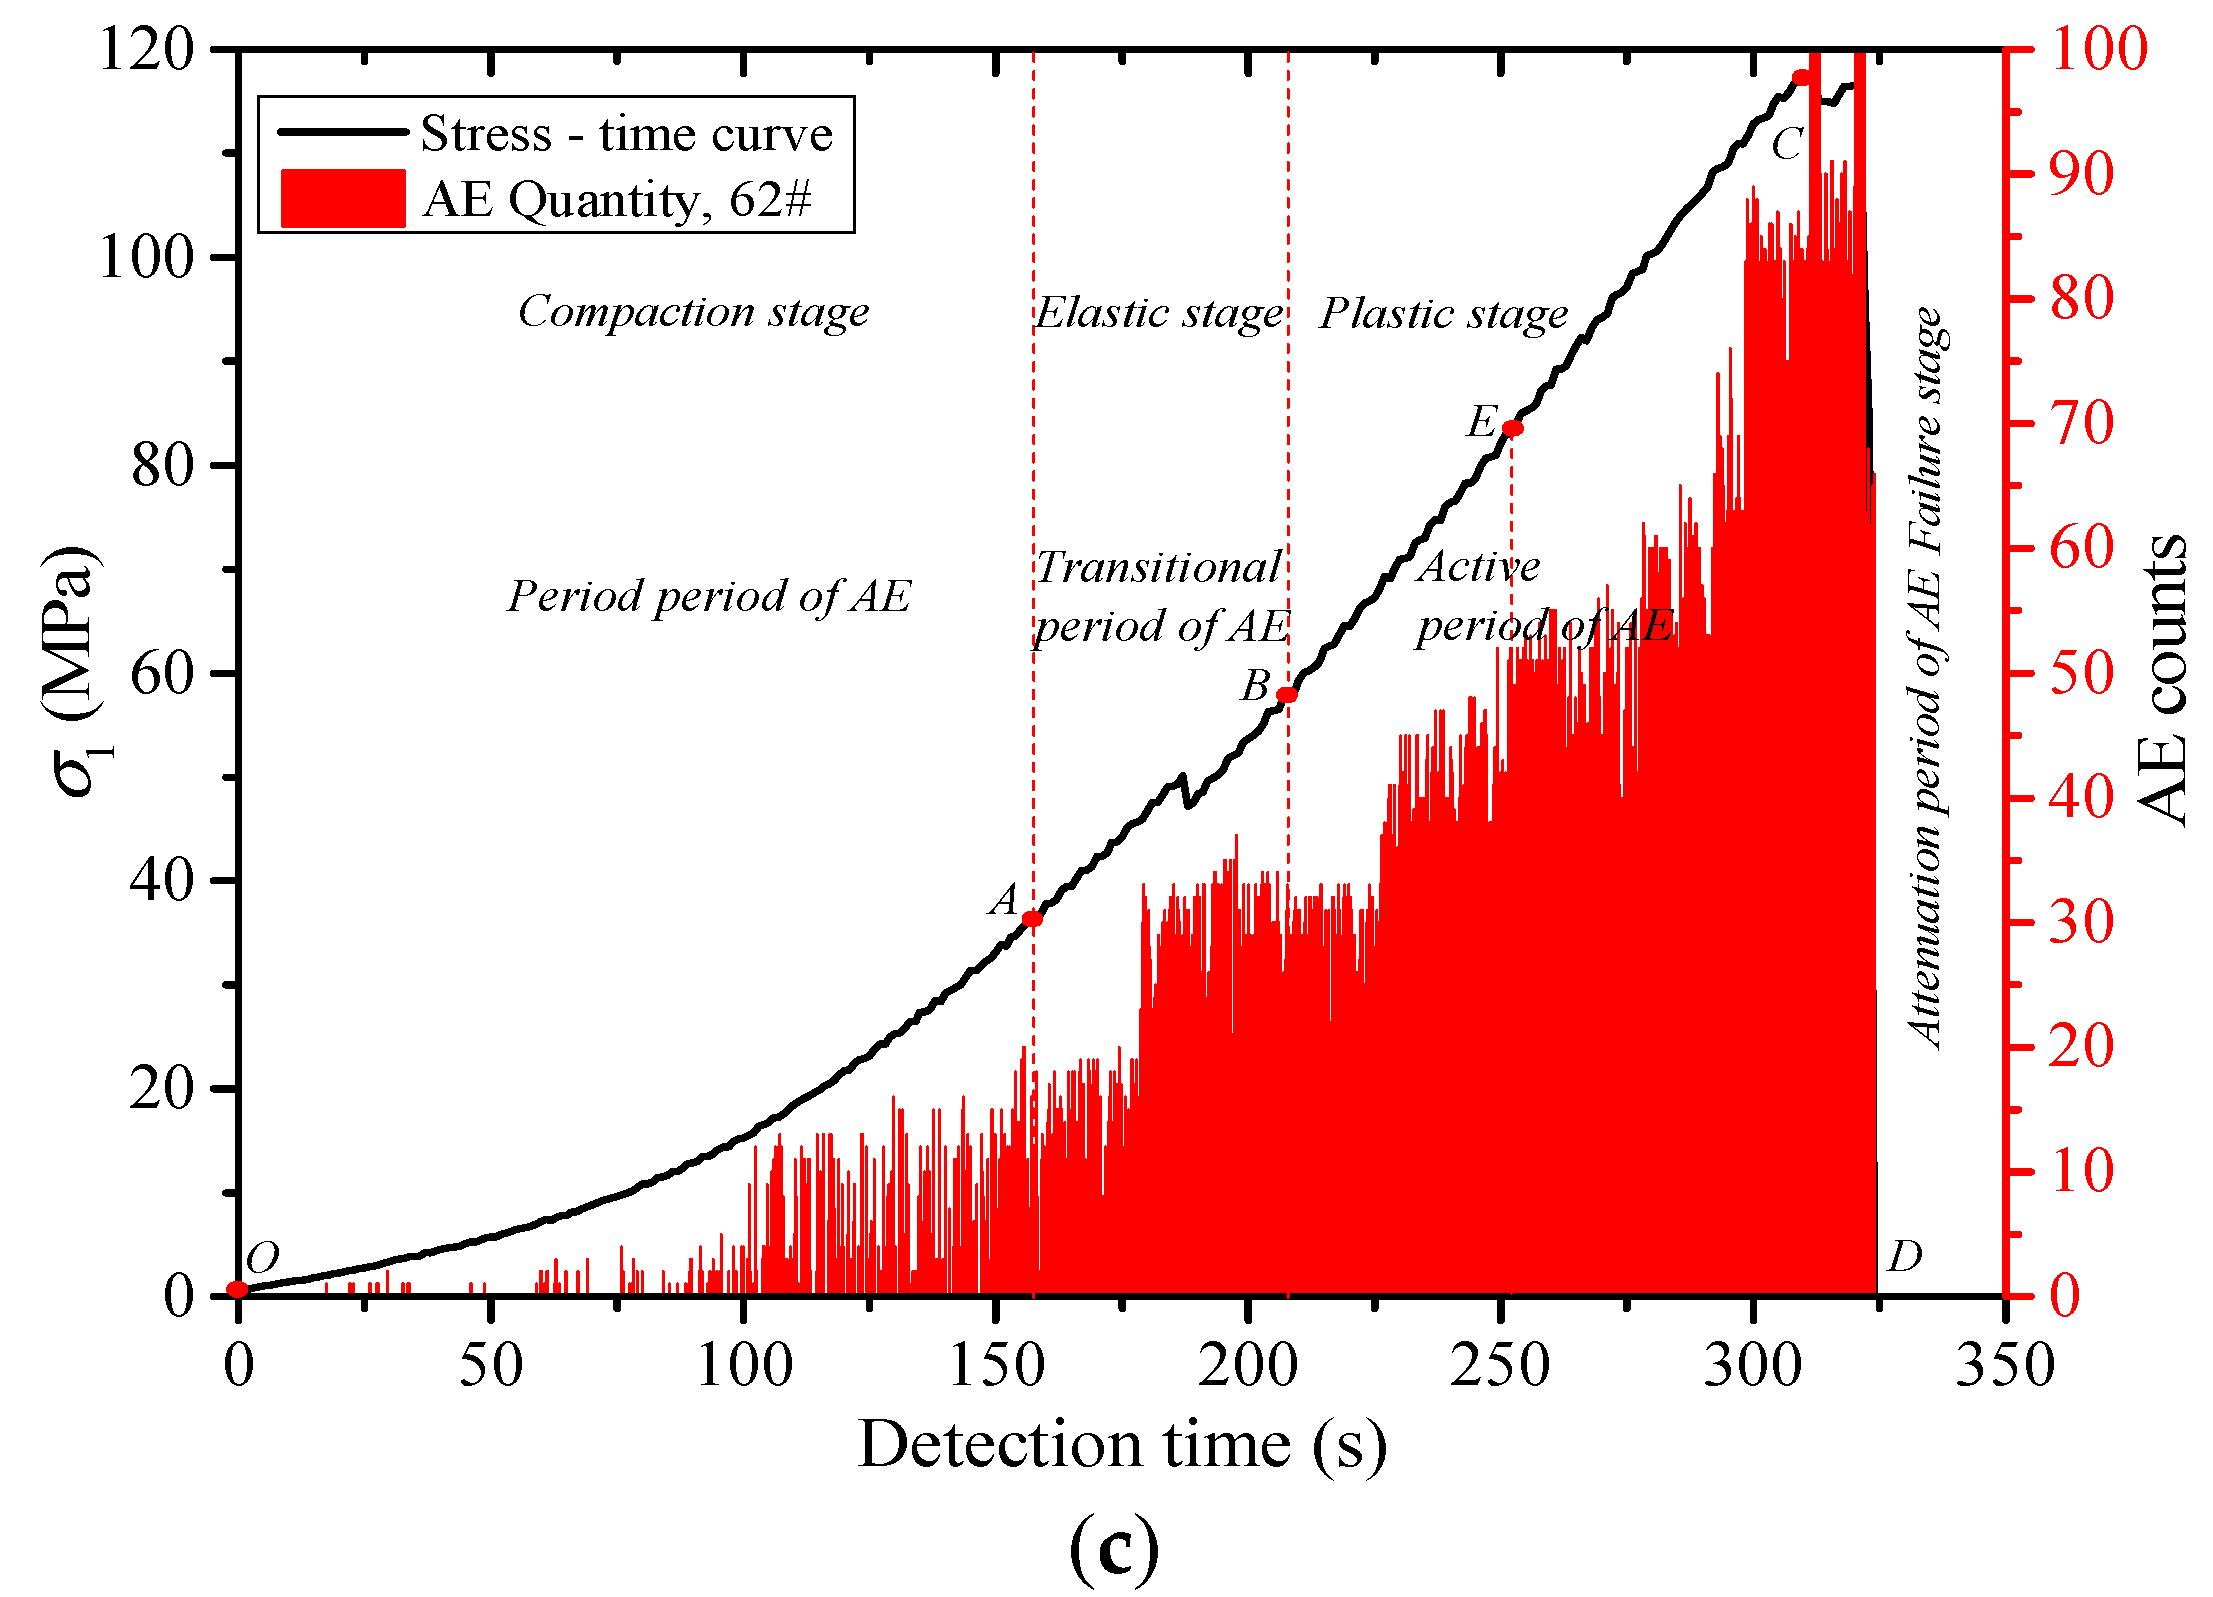
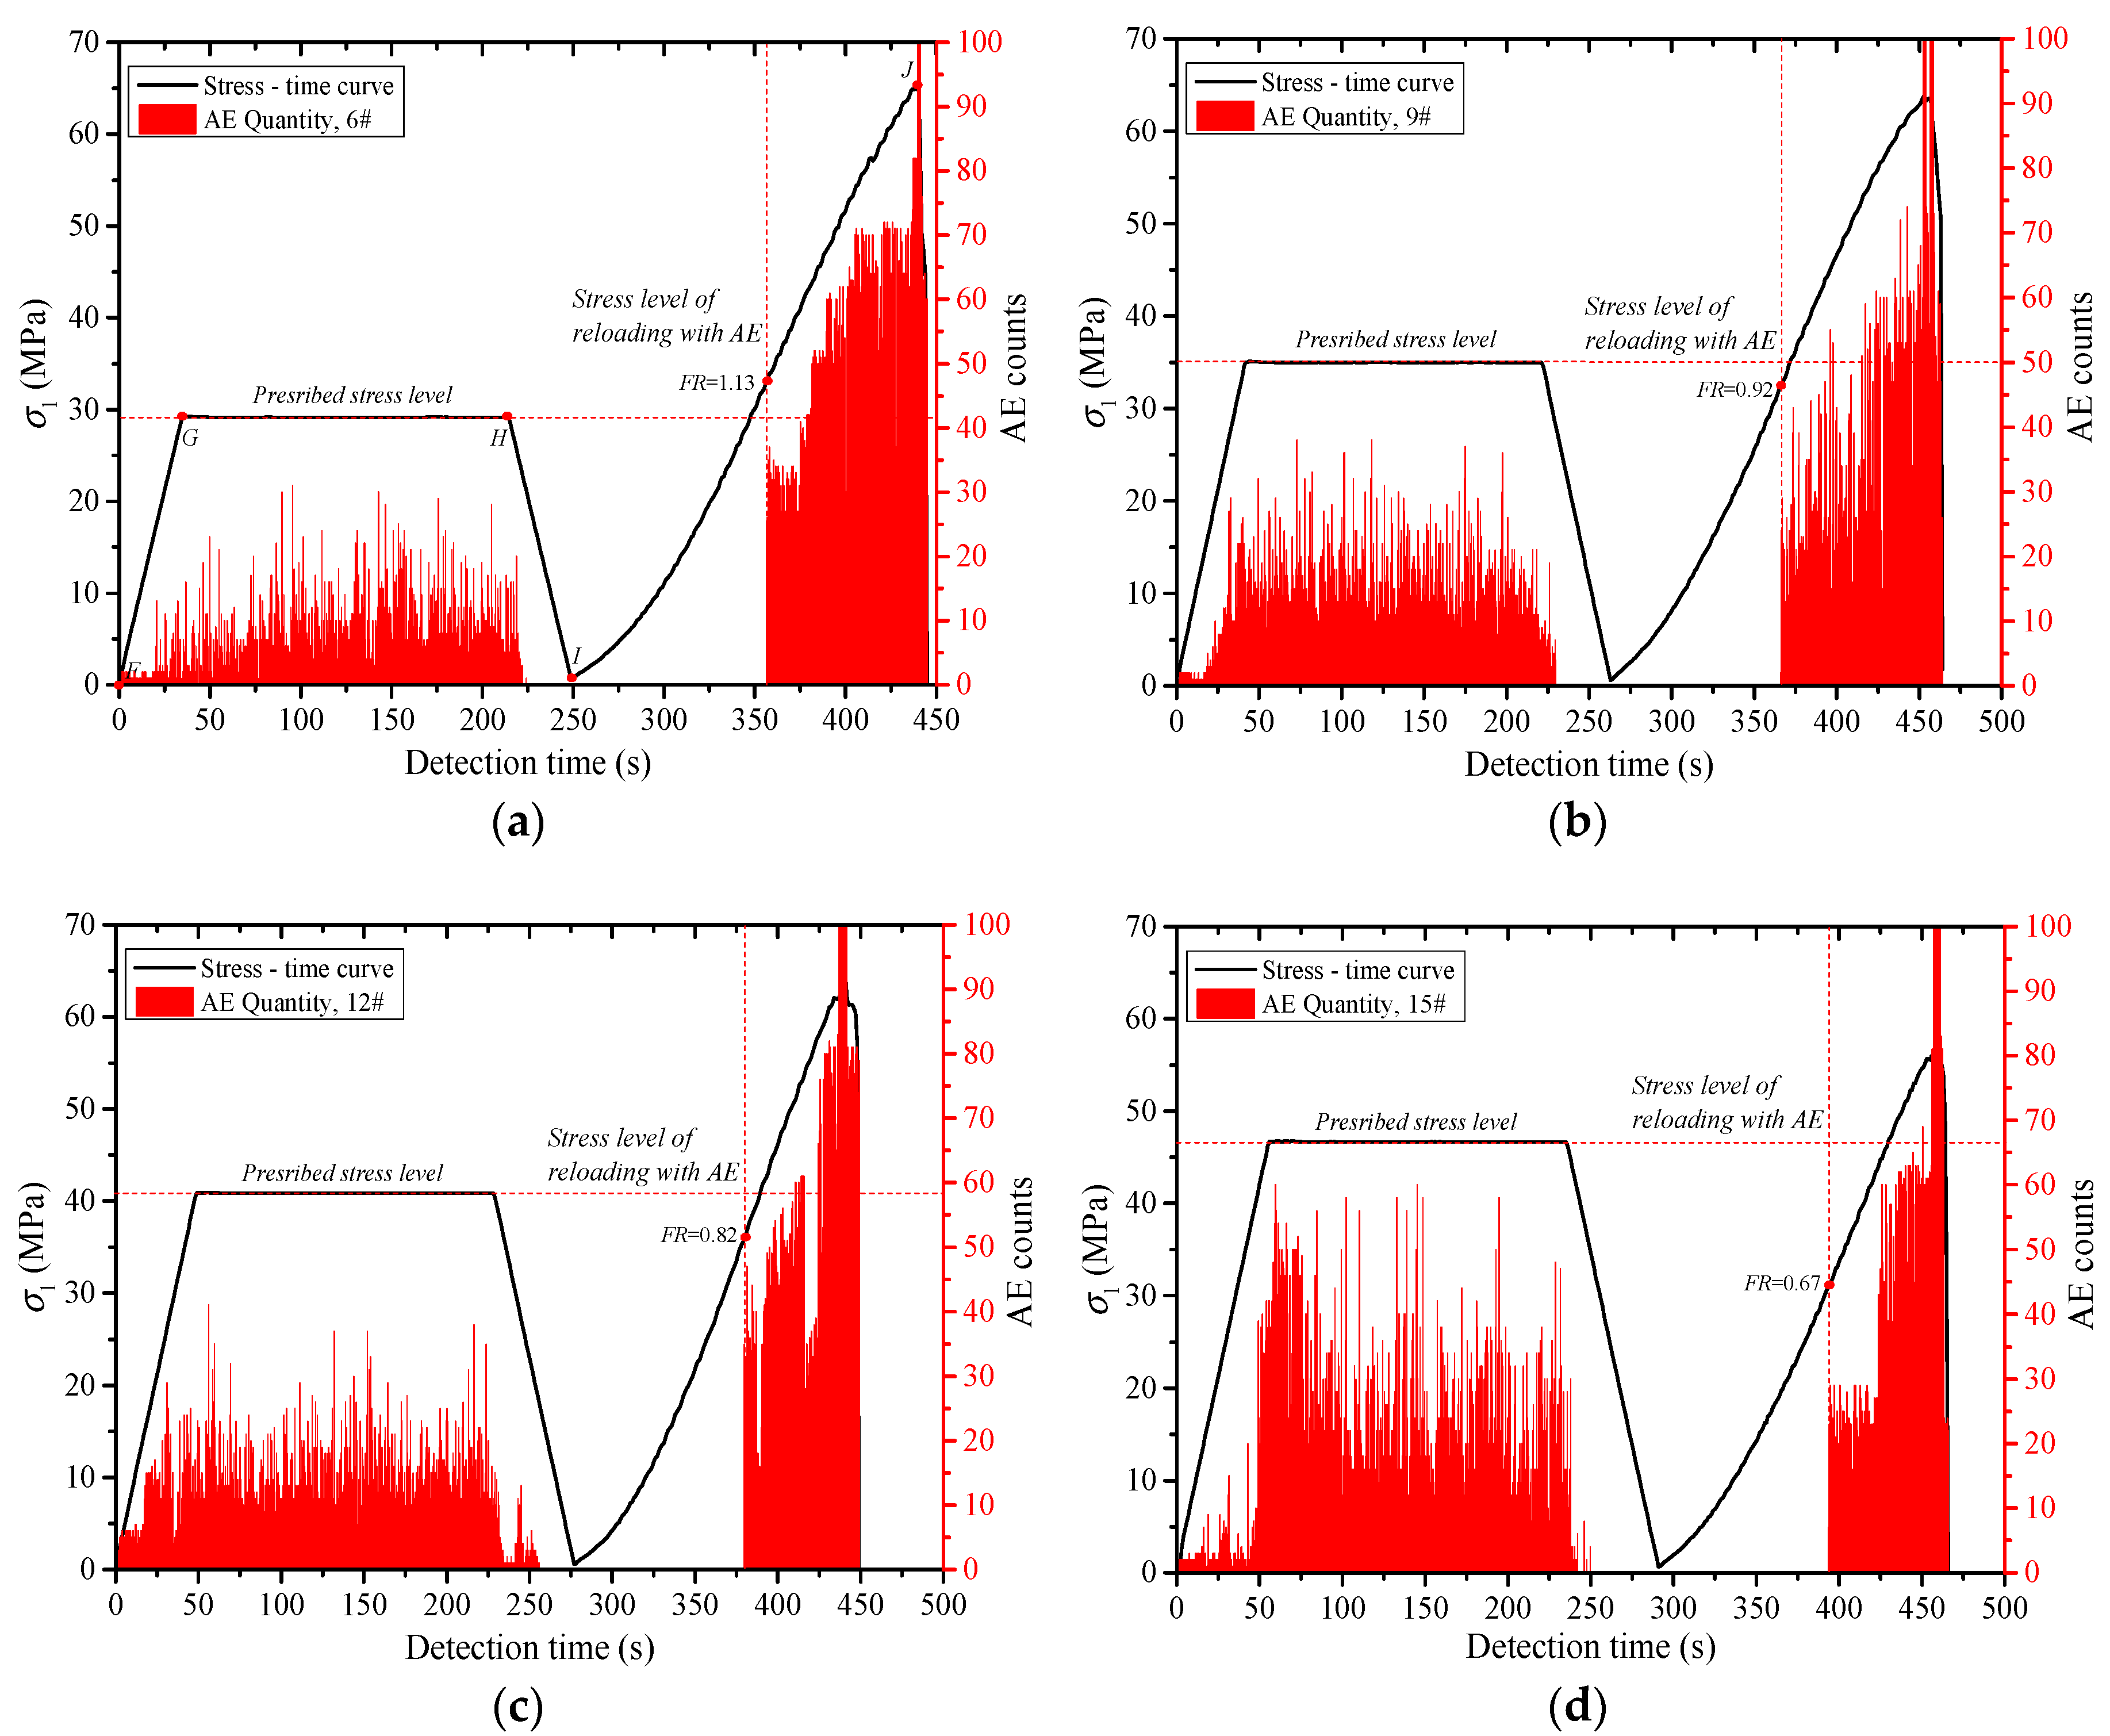
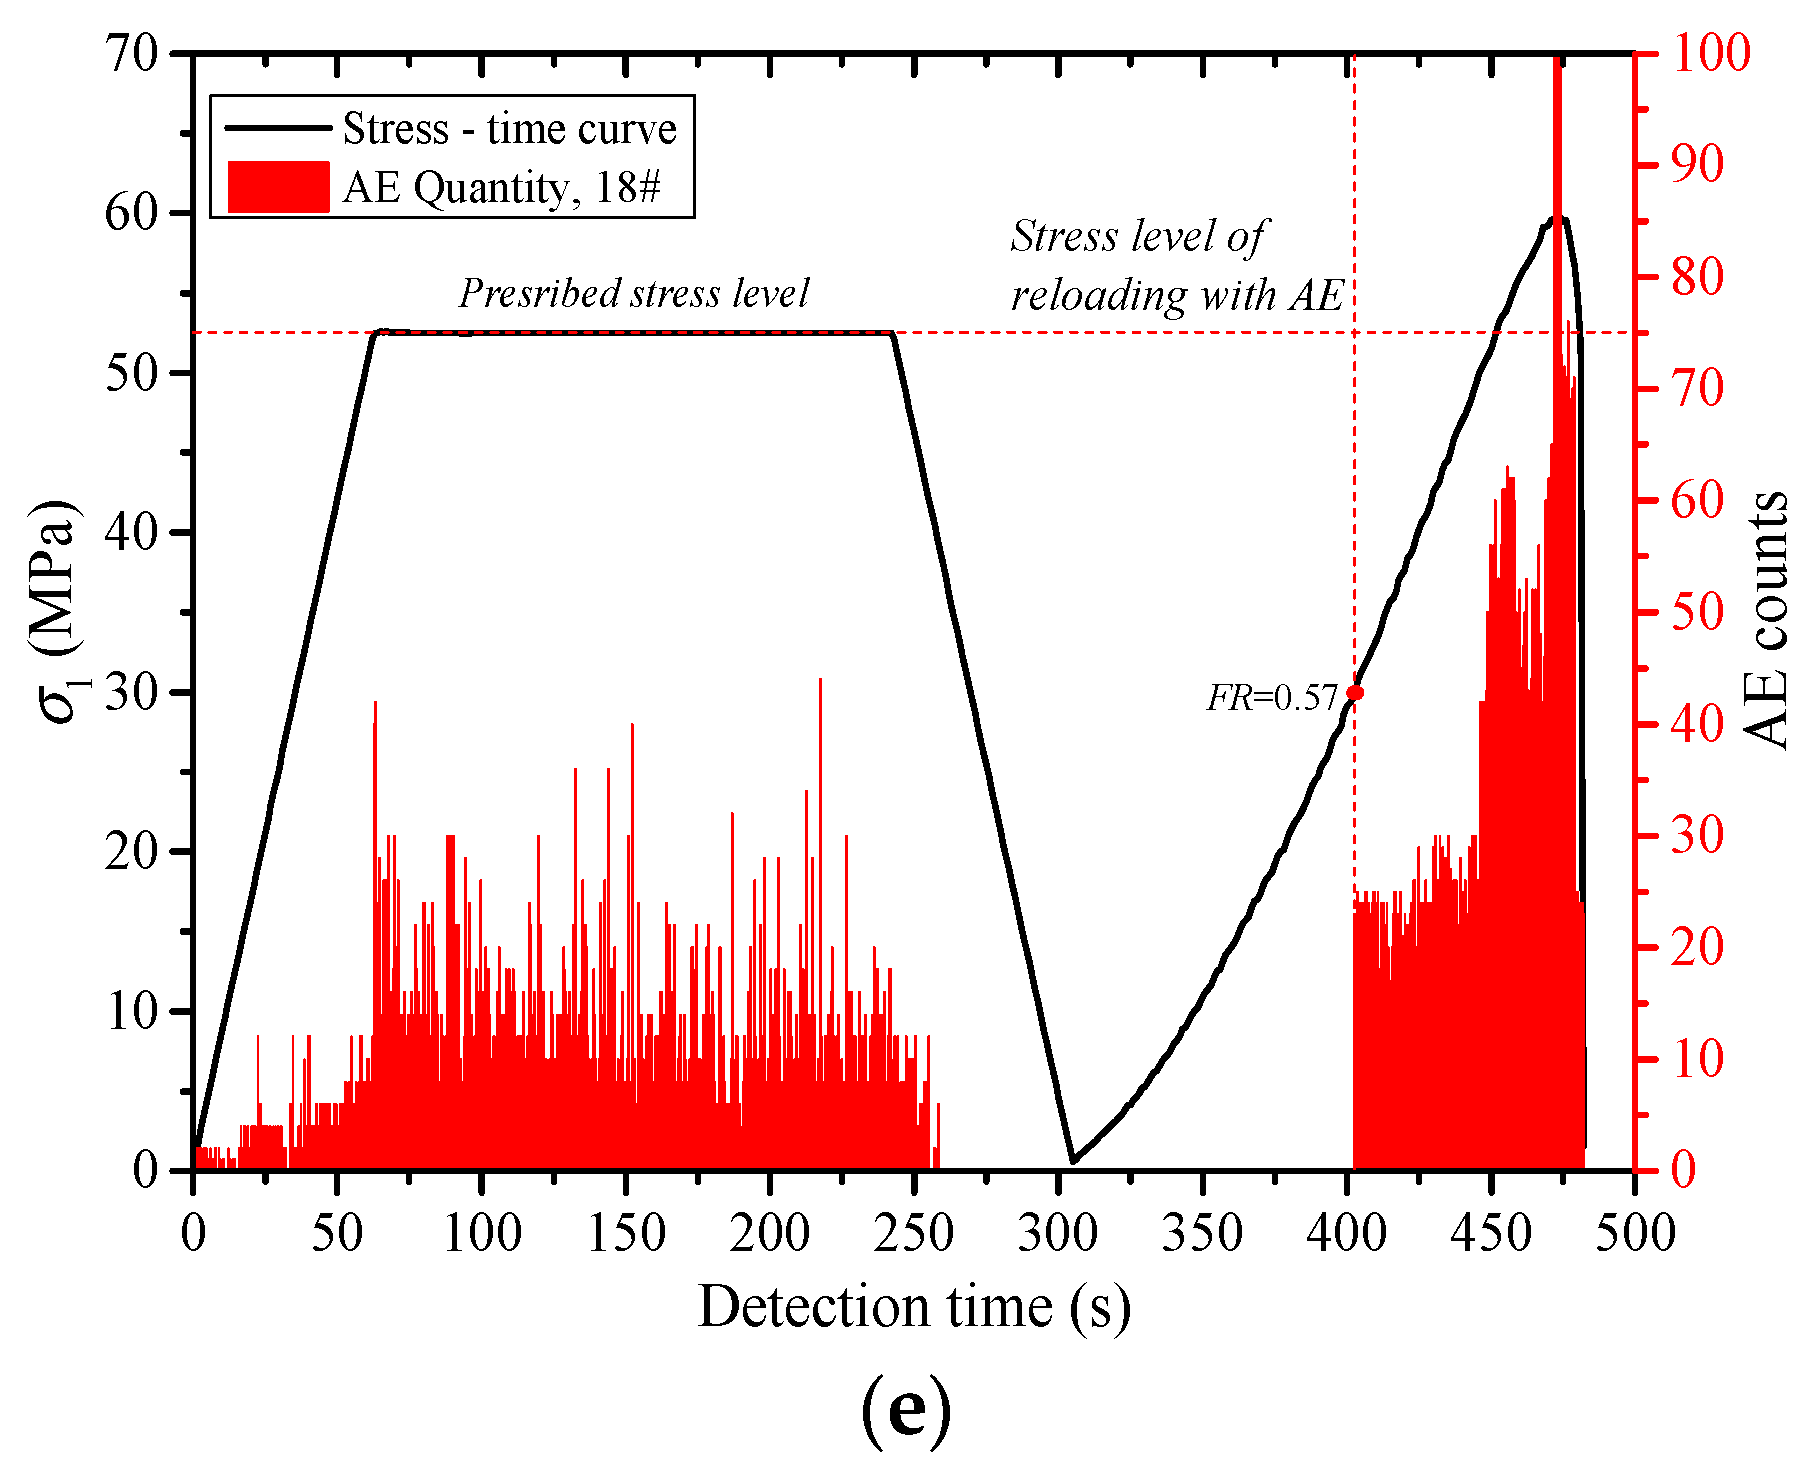
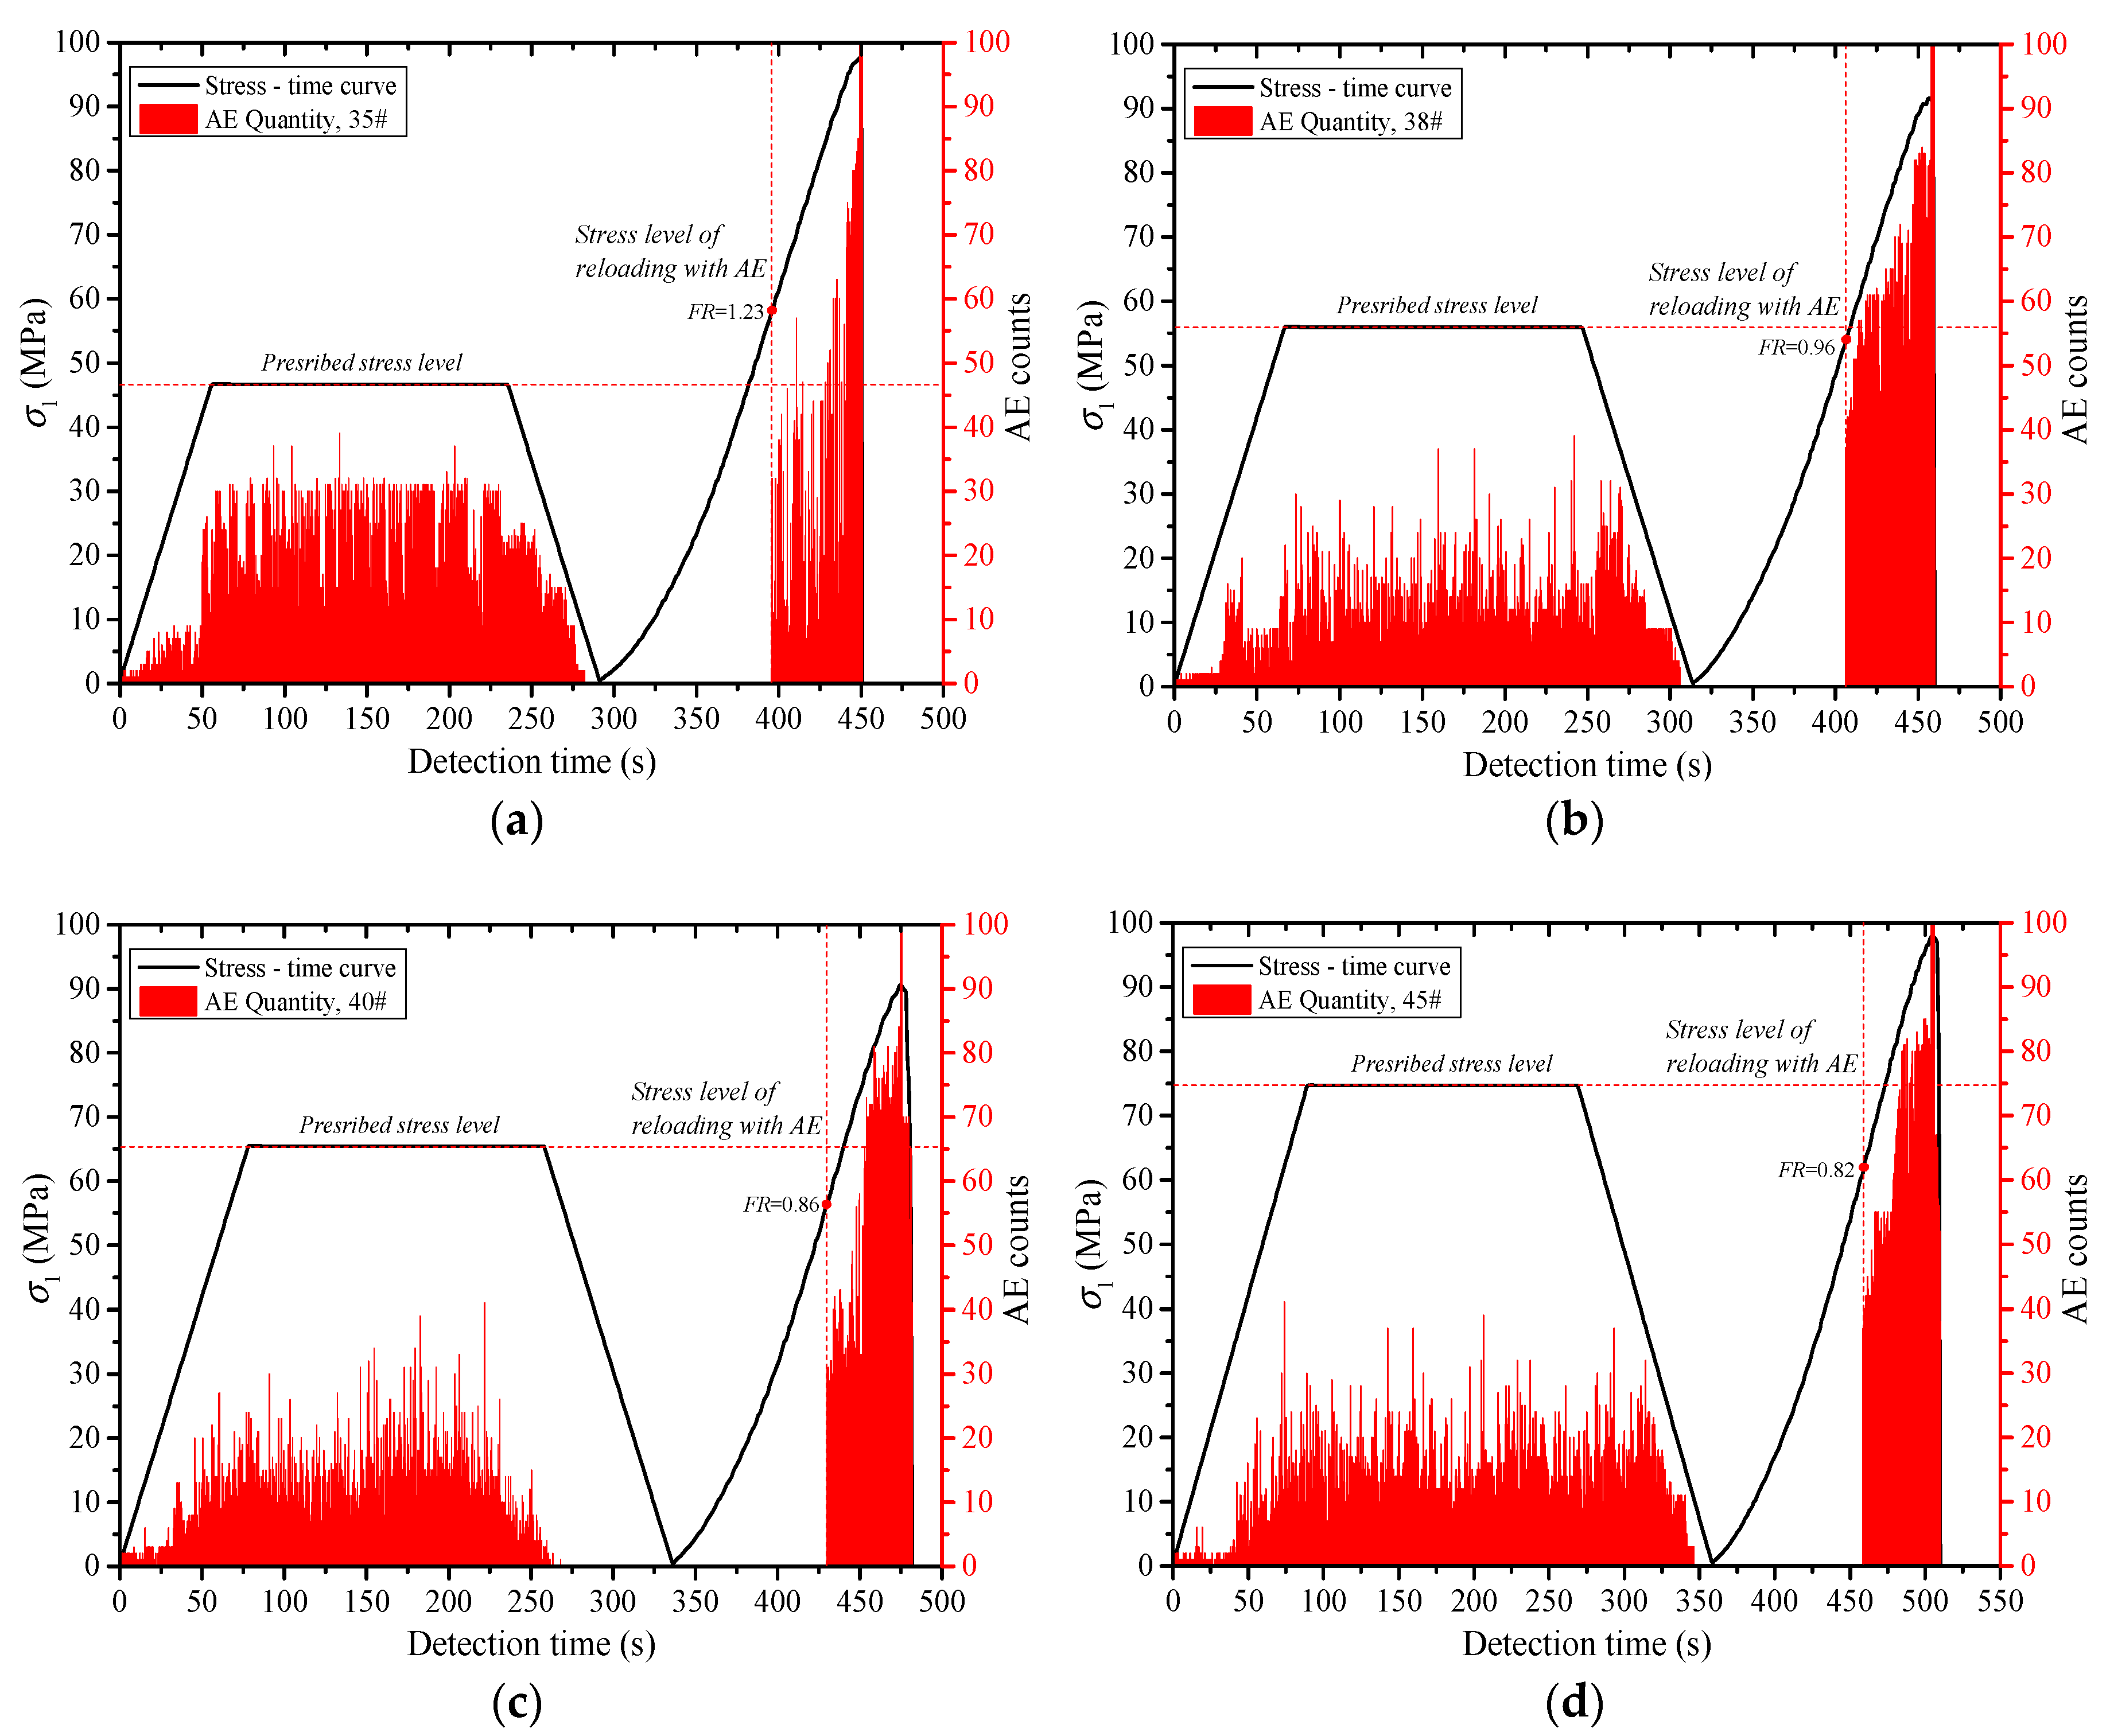
The acoustic emission under uniaxial compression displays obvious stages. The acoustic emission evolution of three types of rocks corresponds to the compaction stage, elastic stage, yield stage and post-peak stress drop stage of the rock deformation and failure process, which is divided into quiet period, transition period, active period and decay period of the acoustic emission. Through the cyclic loading test, the generation of the friction-type acoustic emission can be effectively inhibited, which is beneficial to the identification of the stress point of the Kaiser effect in the subsequent reloading stage.
(2)
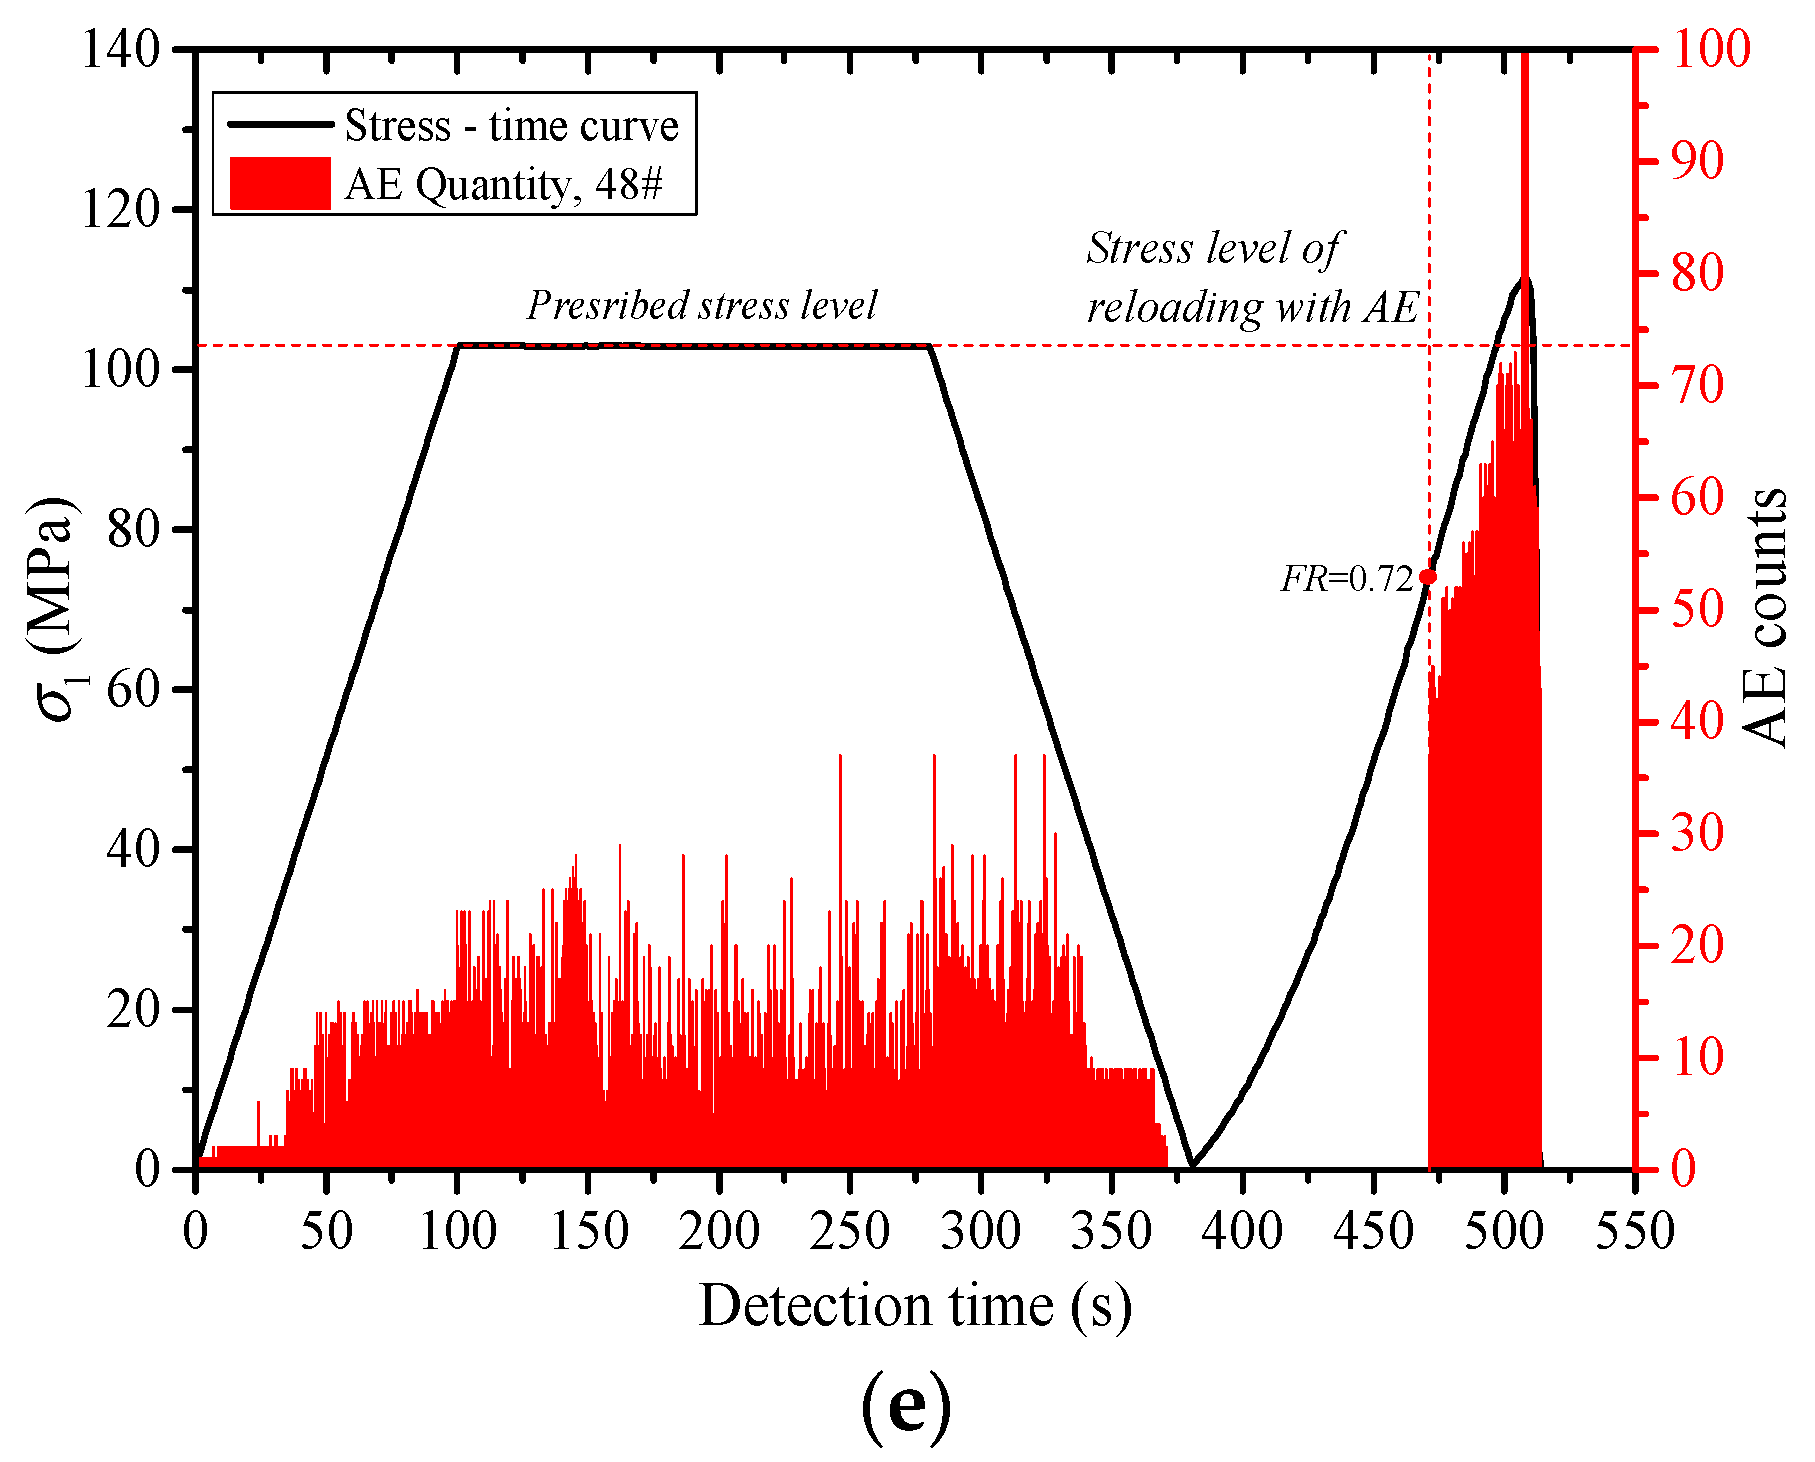
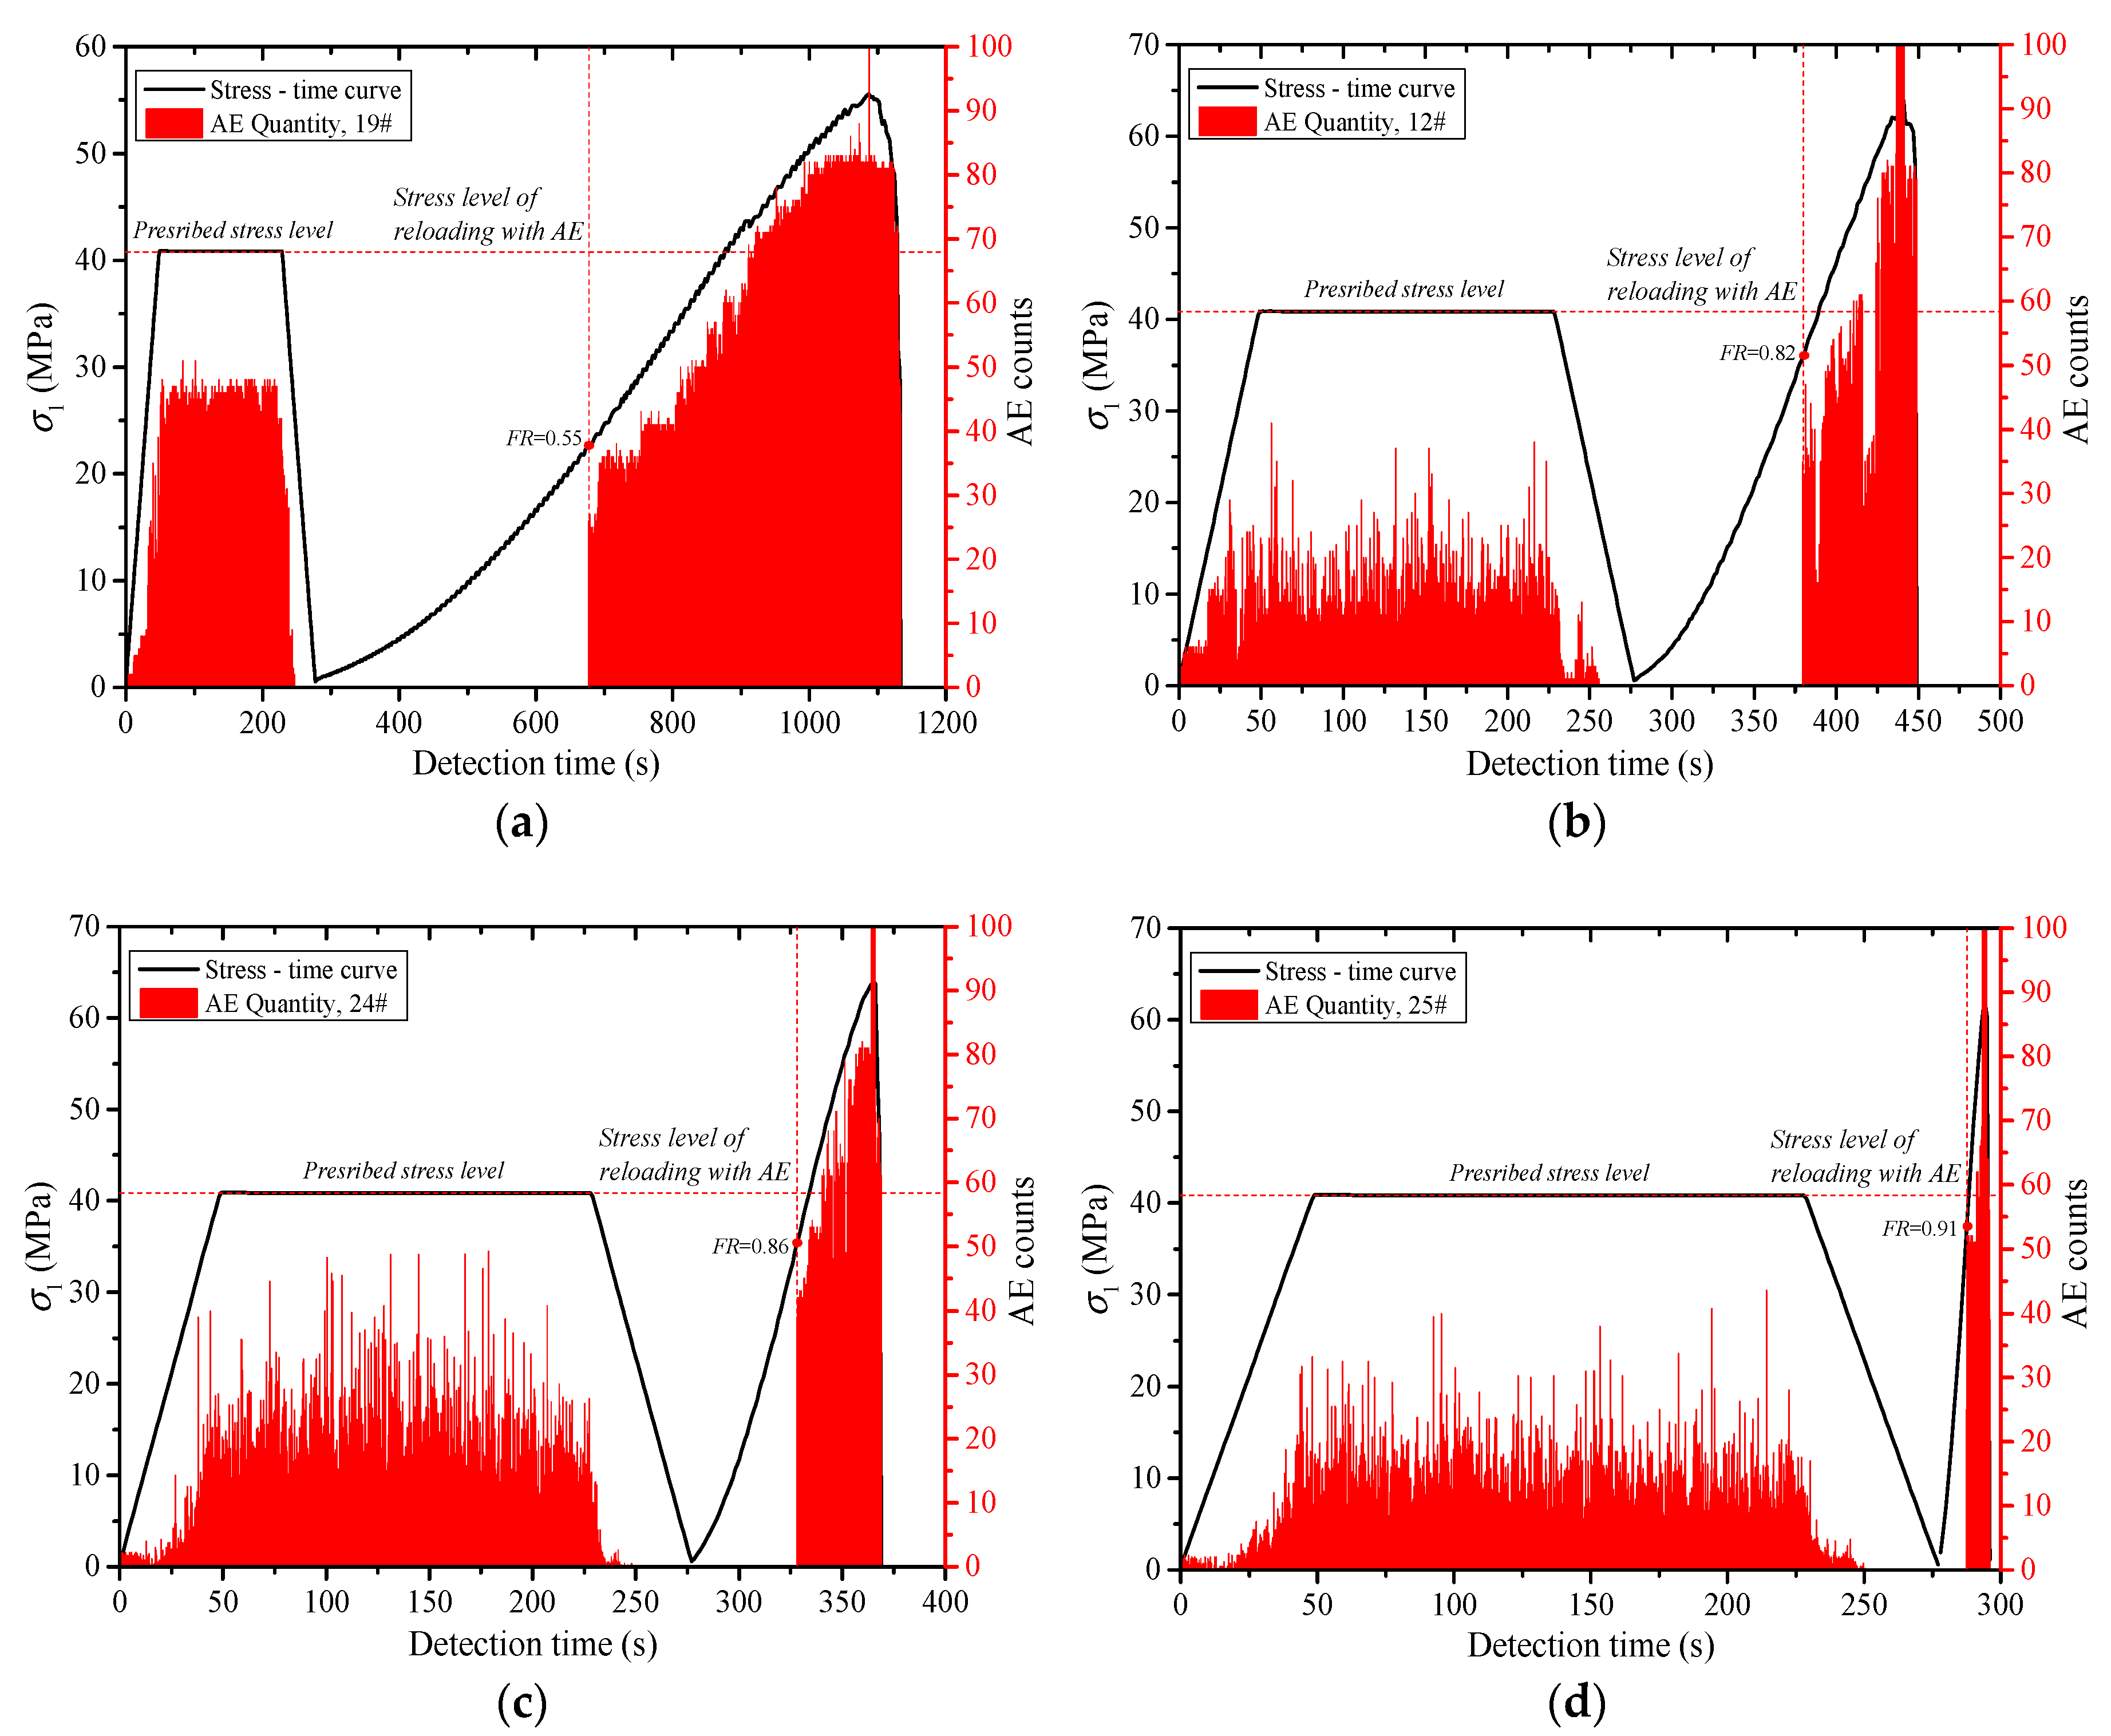
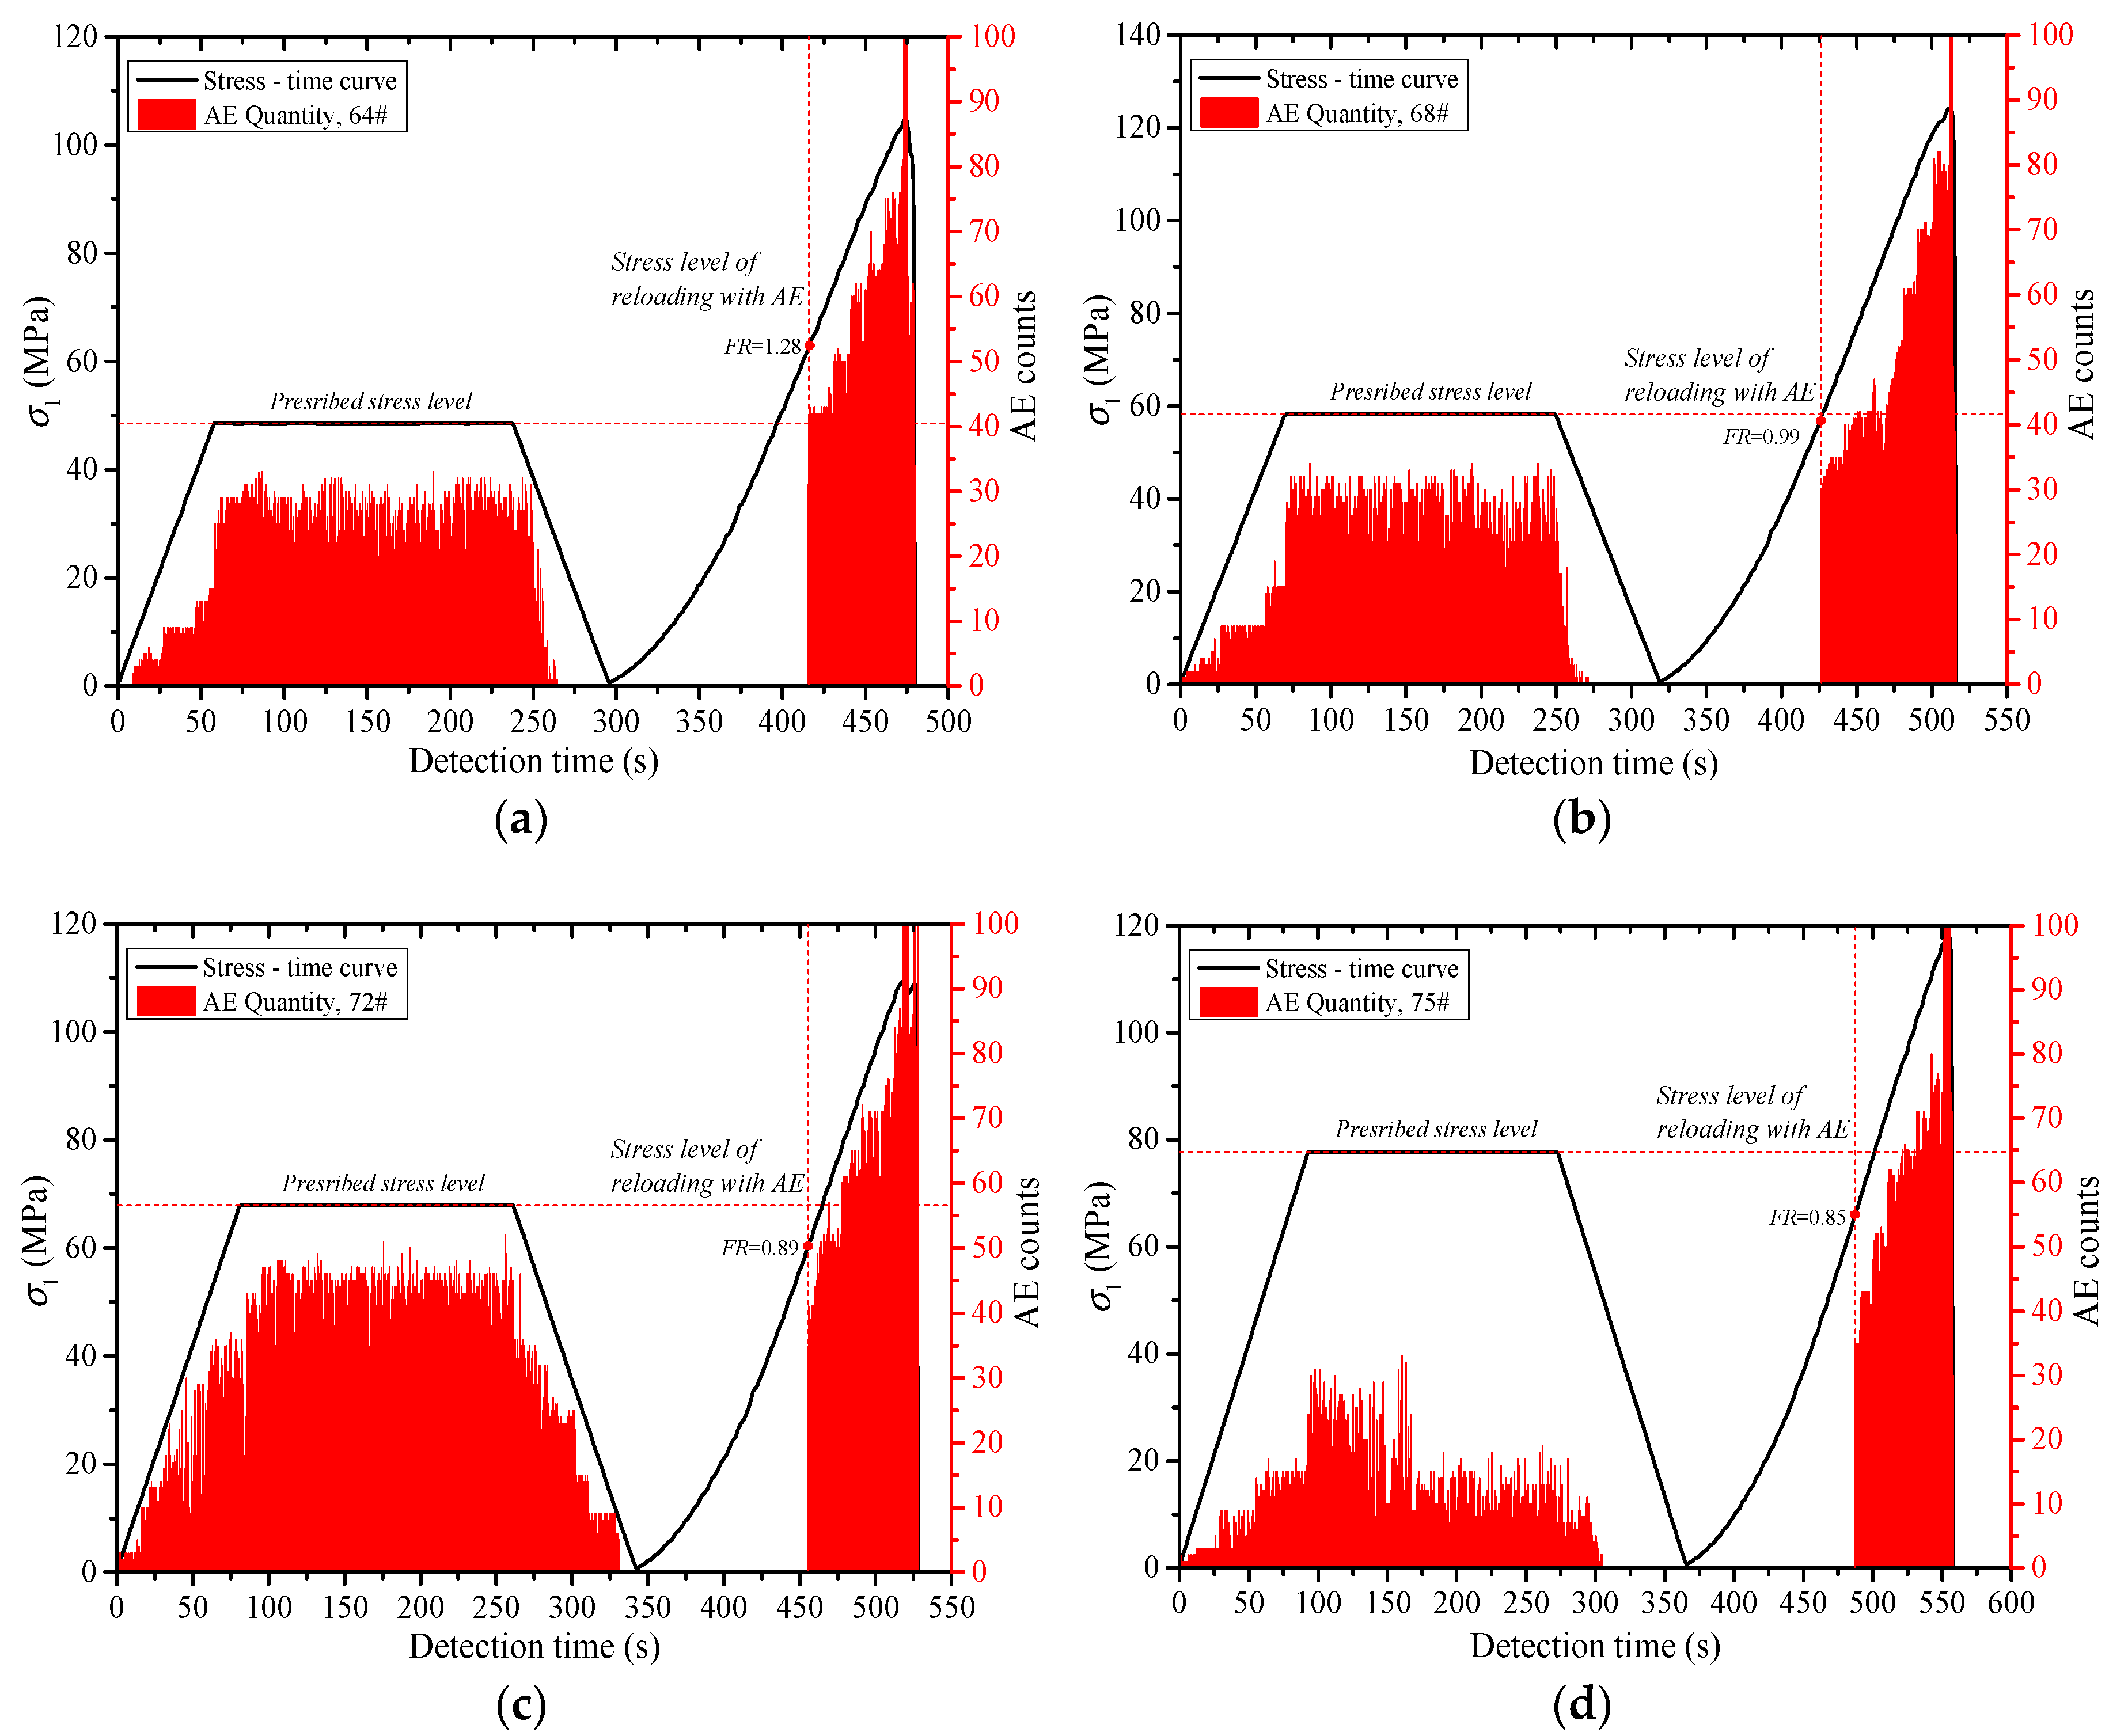
The Kaiser effect of the rock is greatly affected by the loading stress level (σA). When σA ≤ 0.5 σc, the Kaiser effect occurs obviously after the first loading stress level is exceeded during reloading. When σA = 0.6 σc, whether the Kaiser effect appears or not is closely related to lithology. The greater the hardness of the rock, the more obvious the Kaiser effect. When σA ≥ 0.7σc, the Kaiser effect disappears. Usually, the dilatancy stress (cyclic peak stress) does not exceed 70% of the uniaxial compressive strength (σc) of the rock, and the stress point can be the threshold to determine whether the Kaiser effect occurs.
(3)
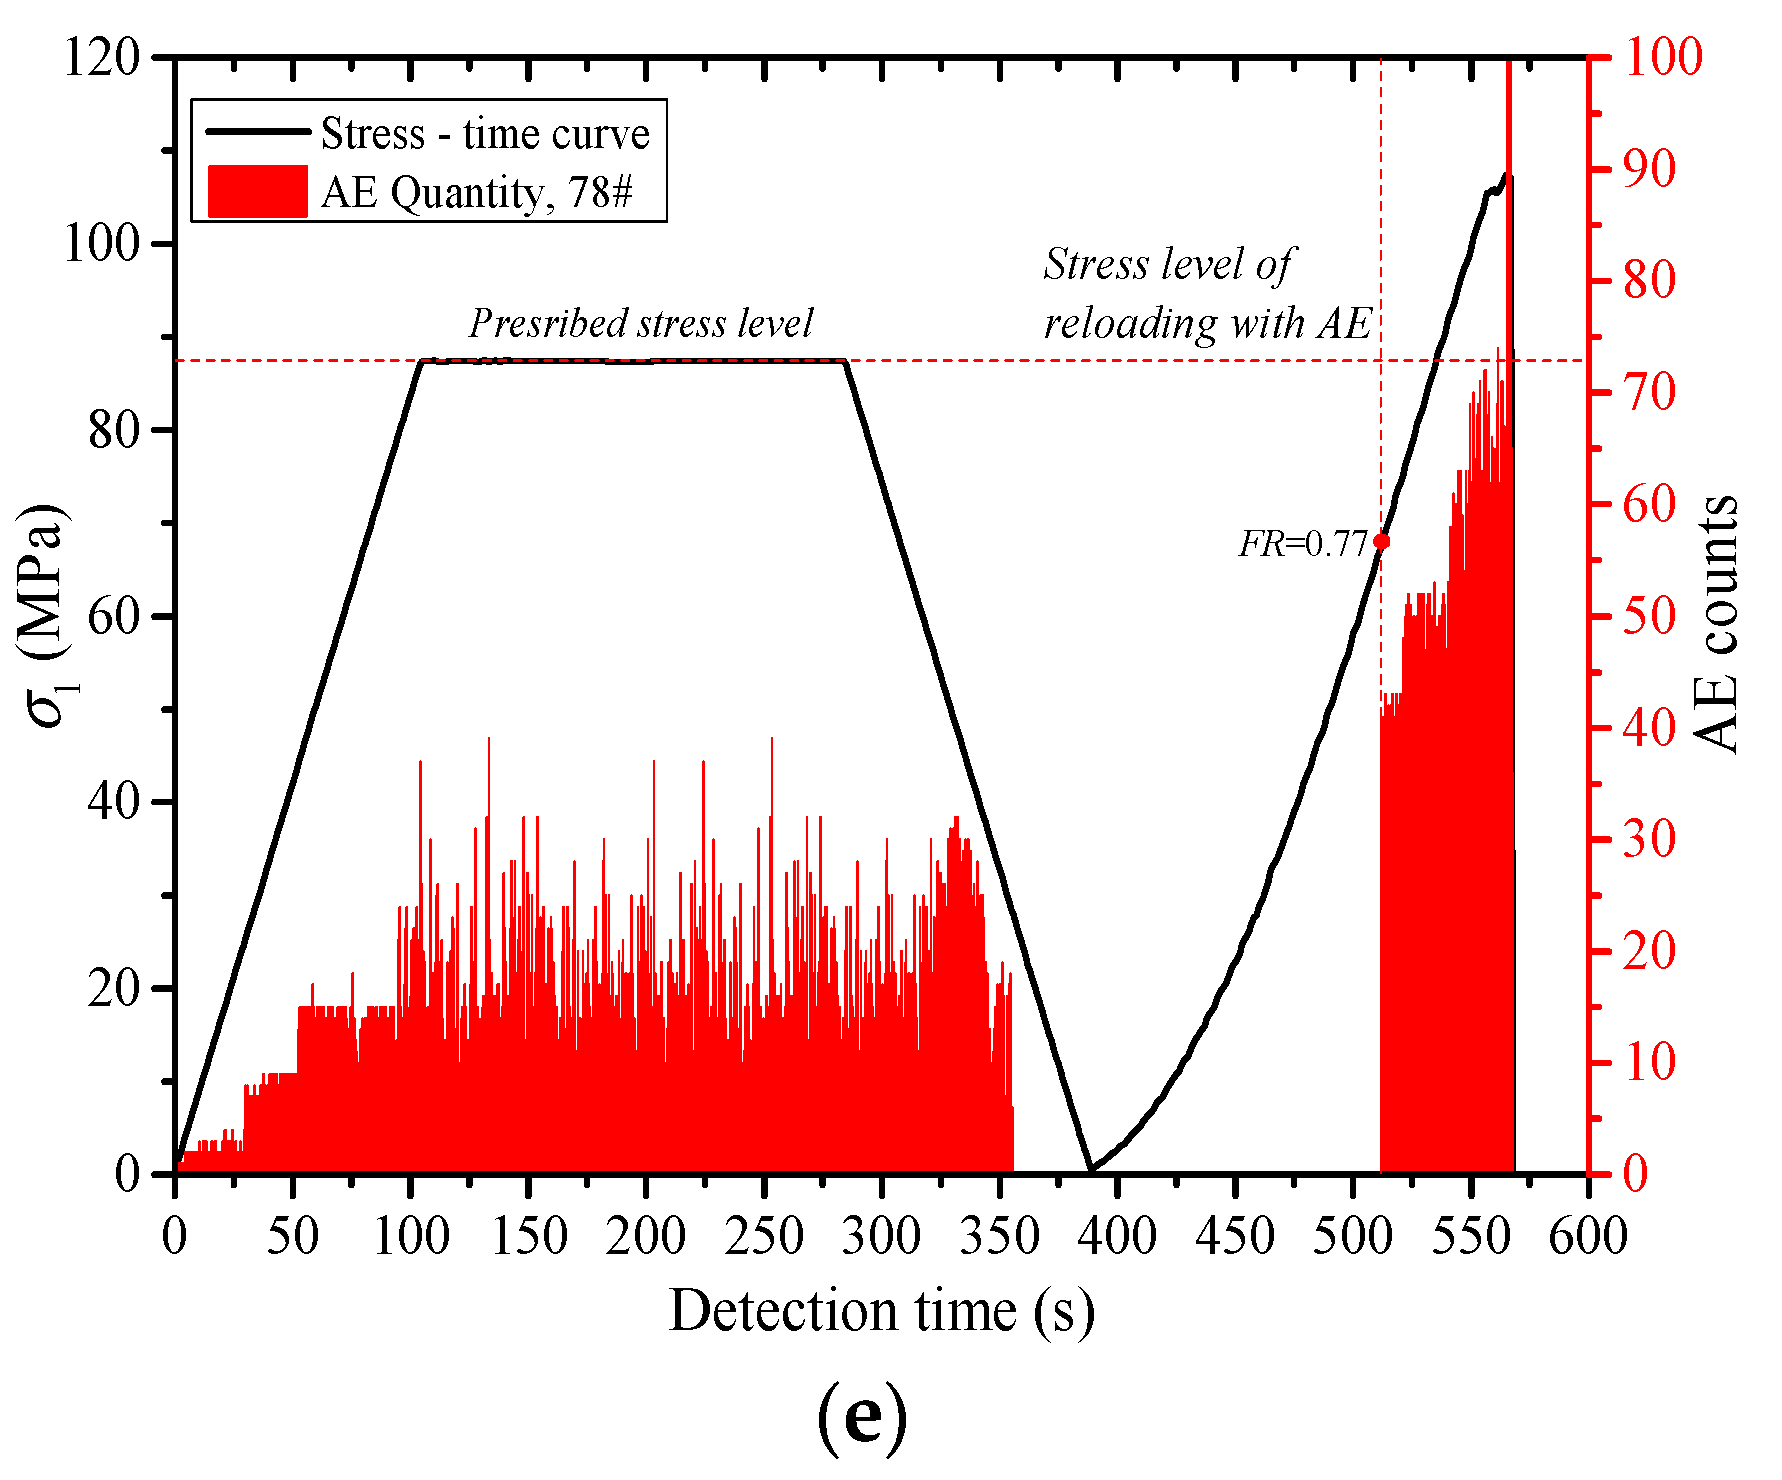
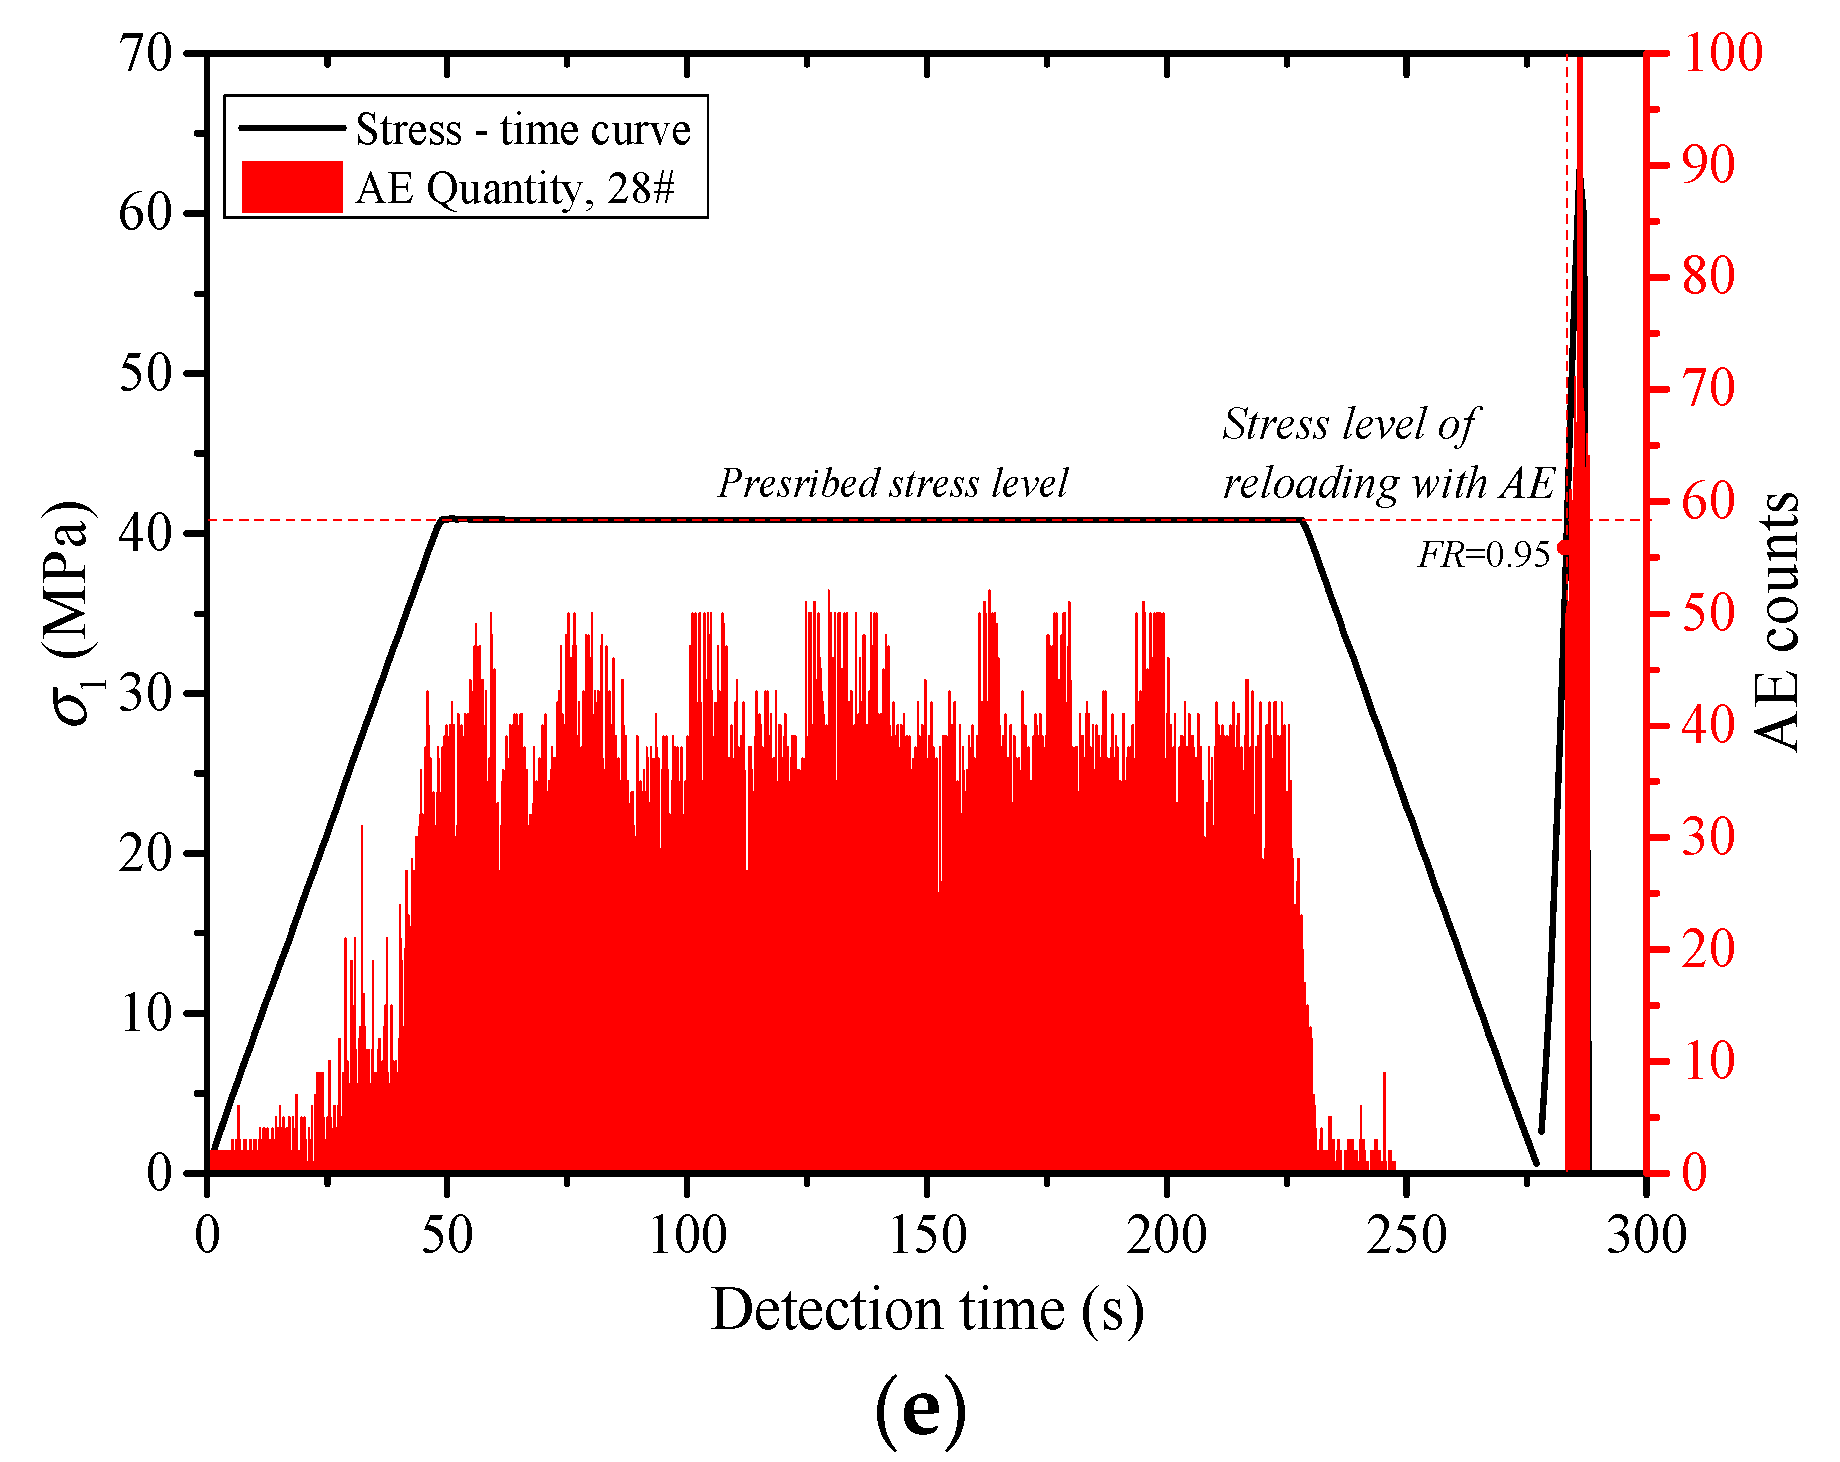
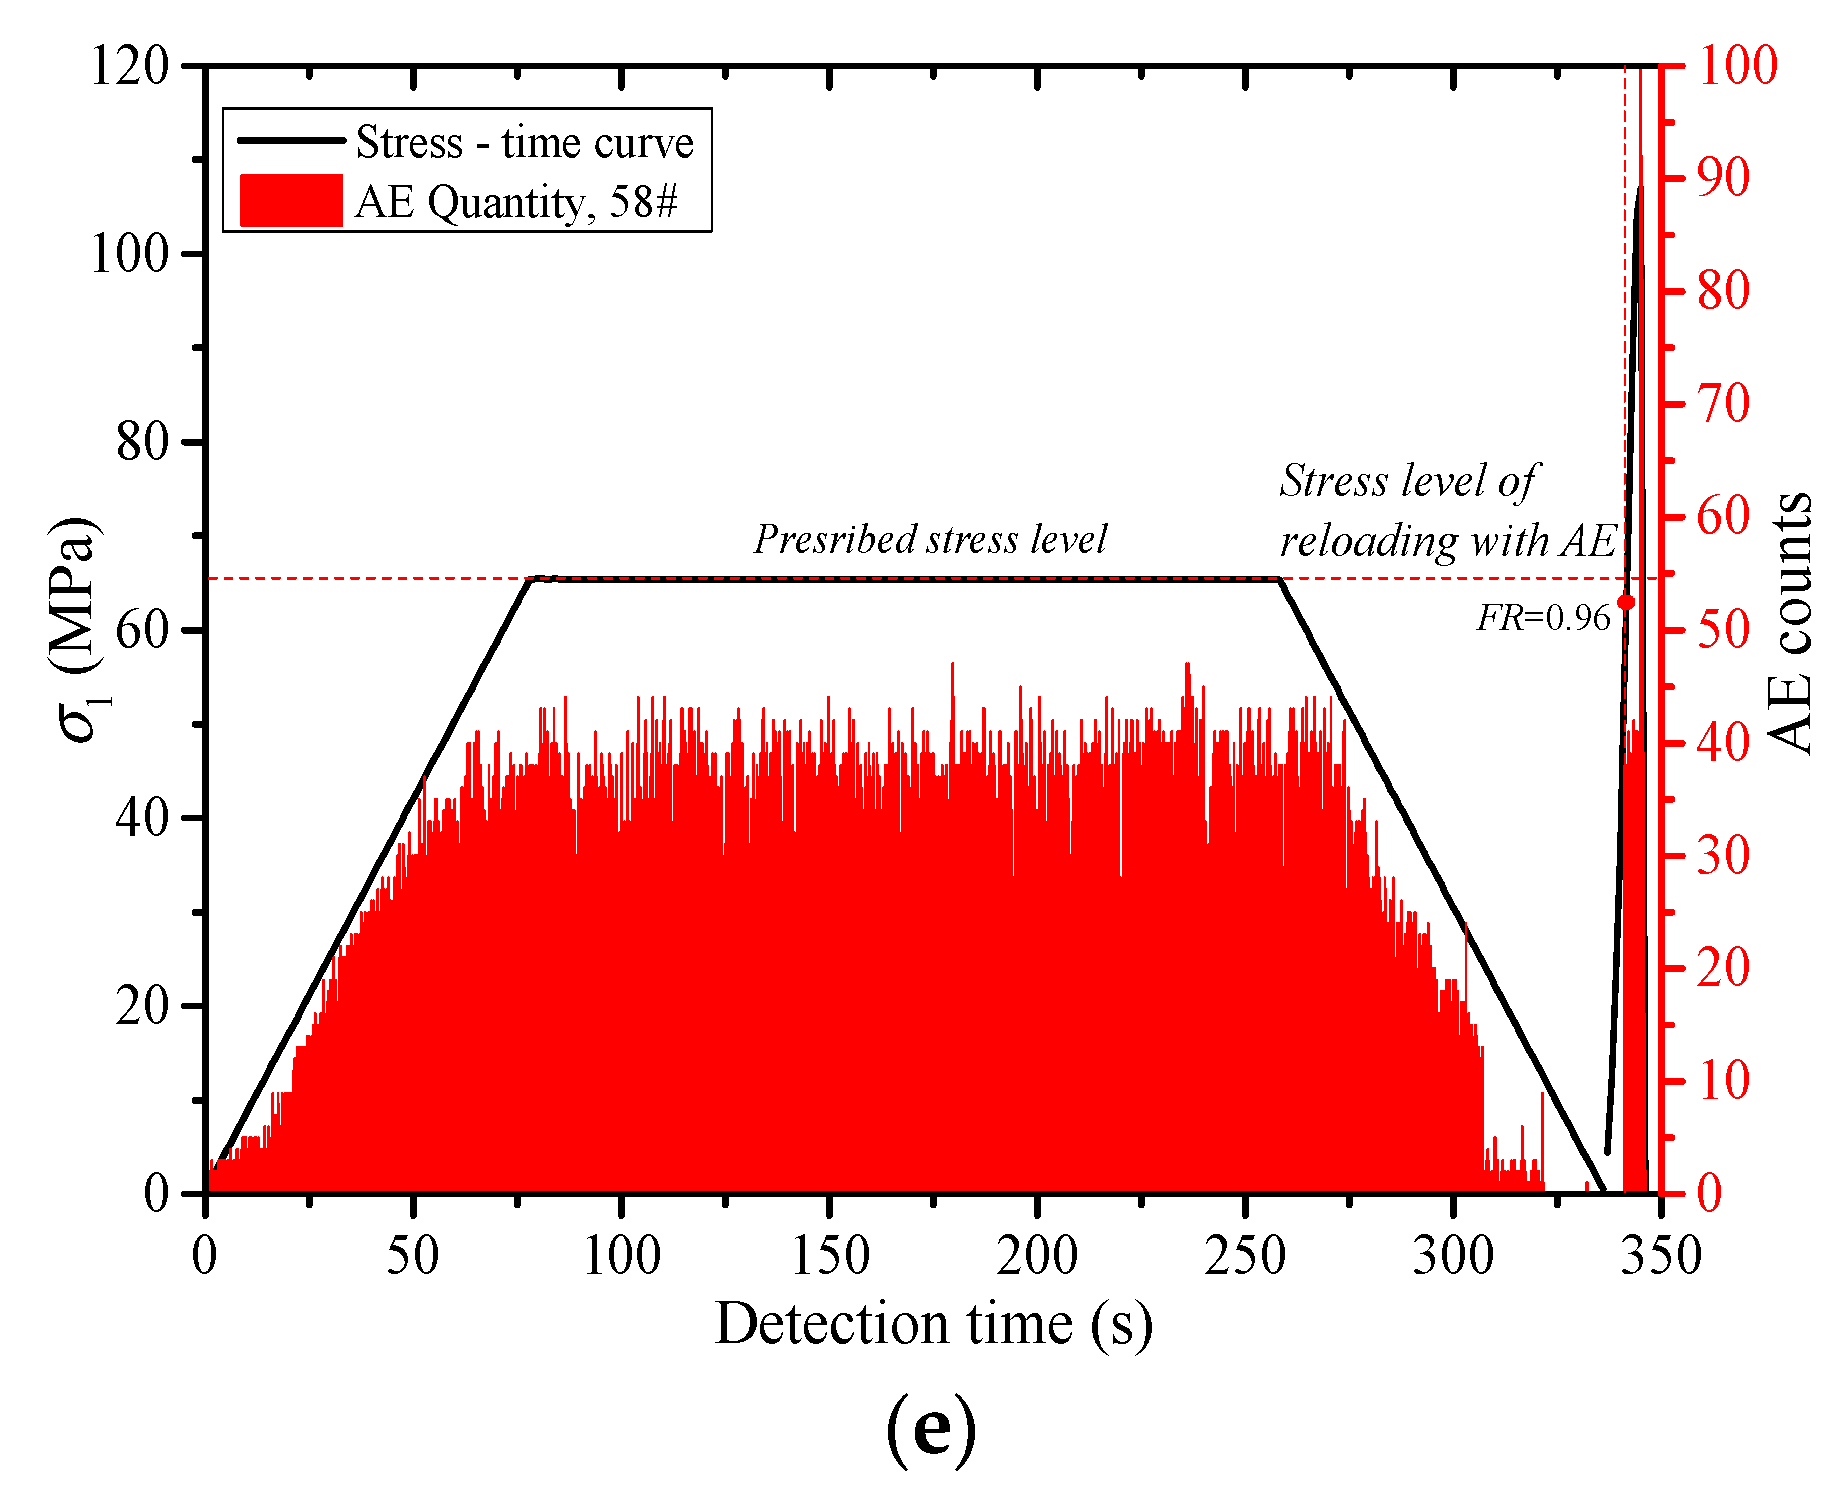
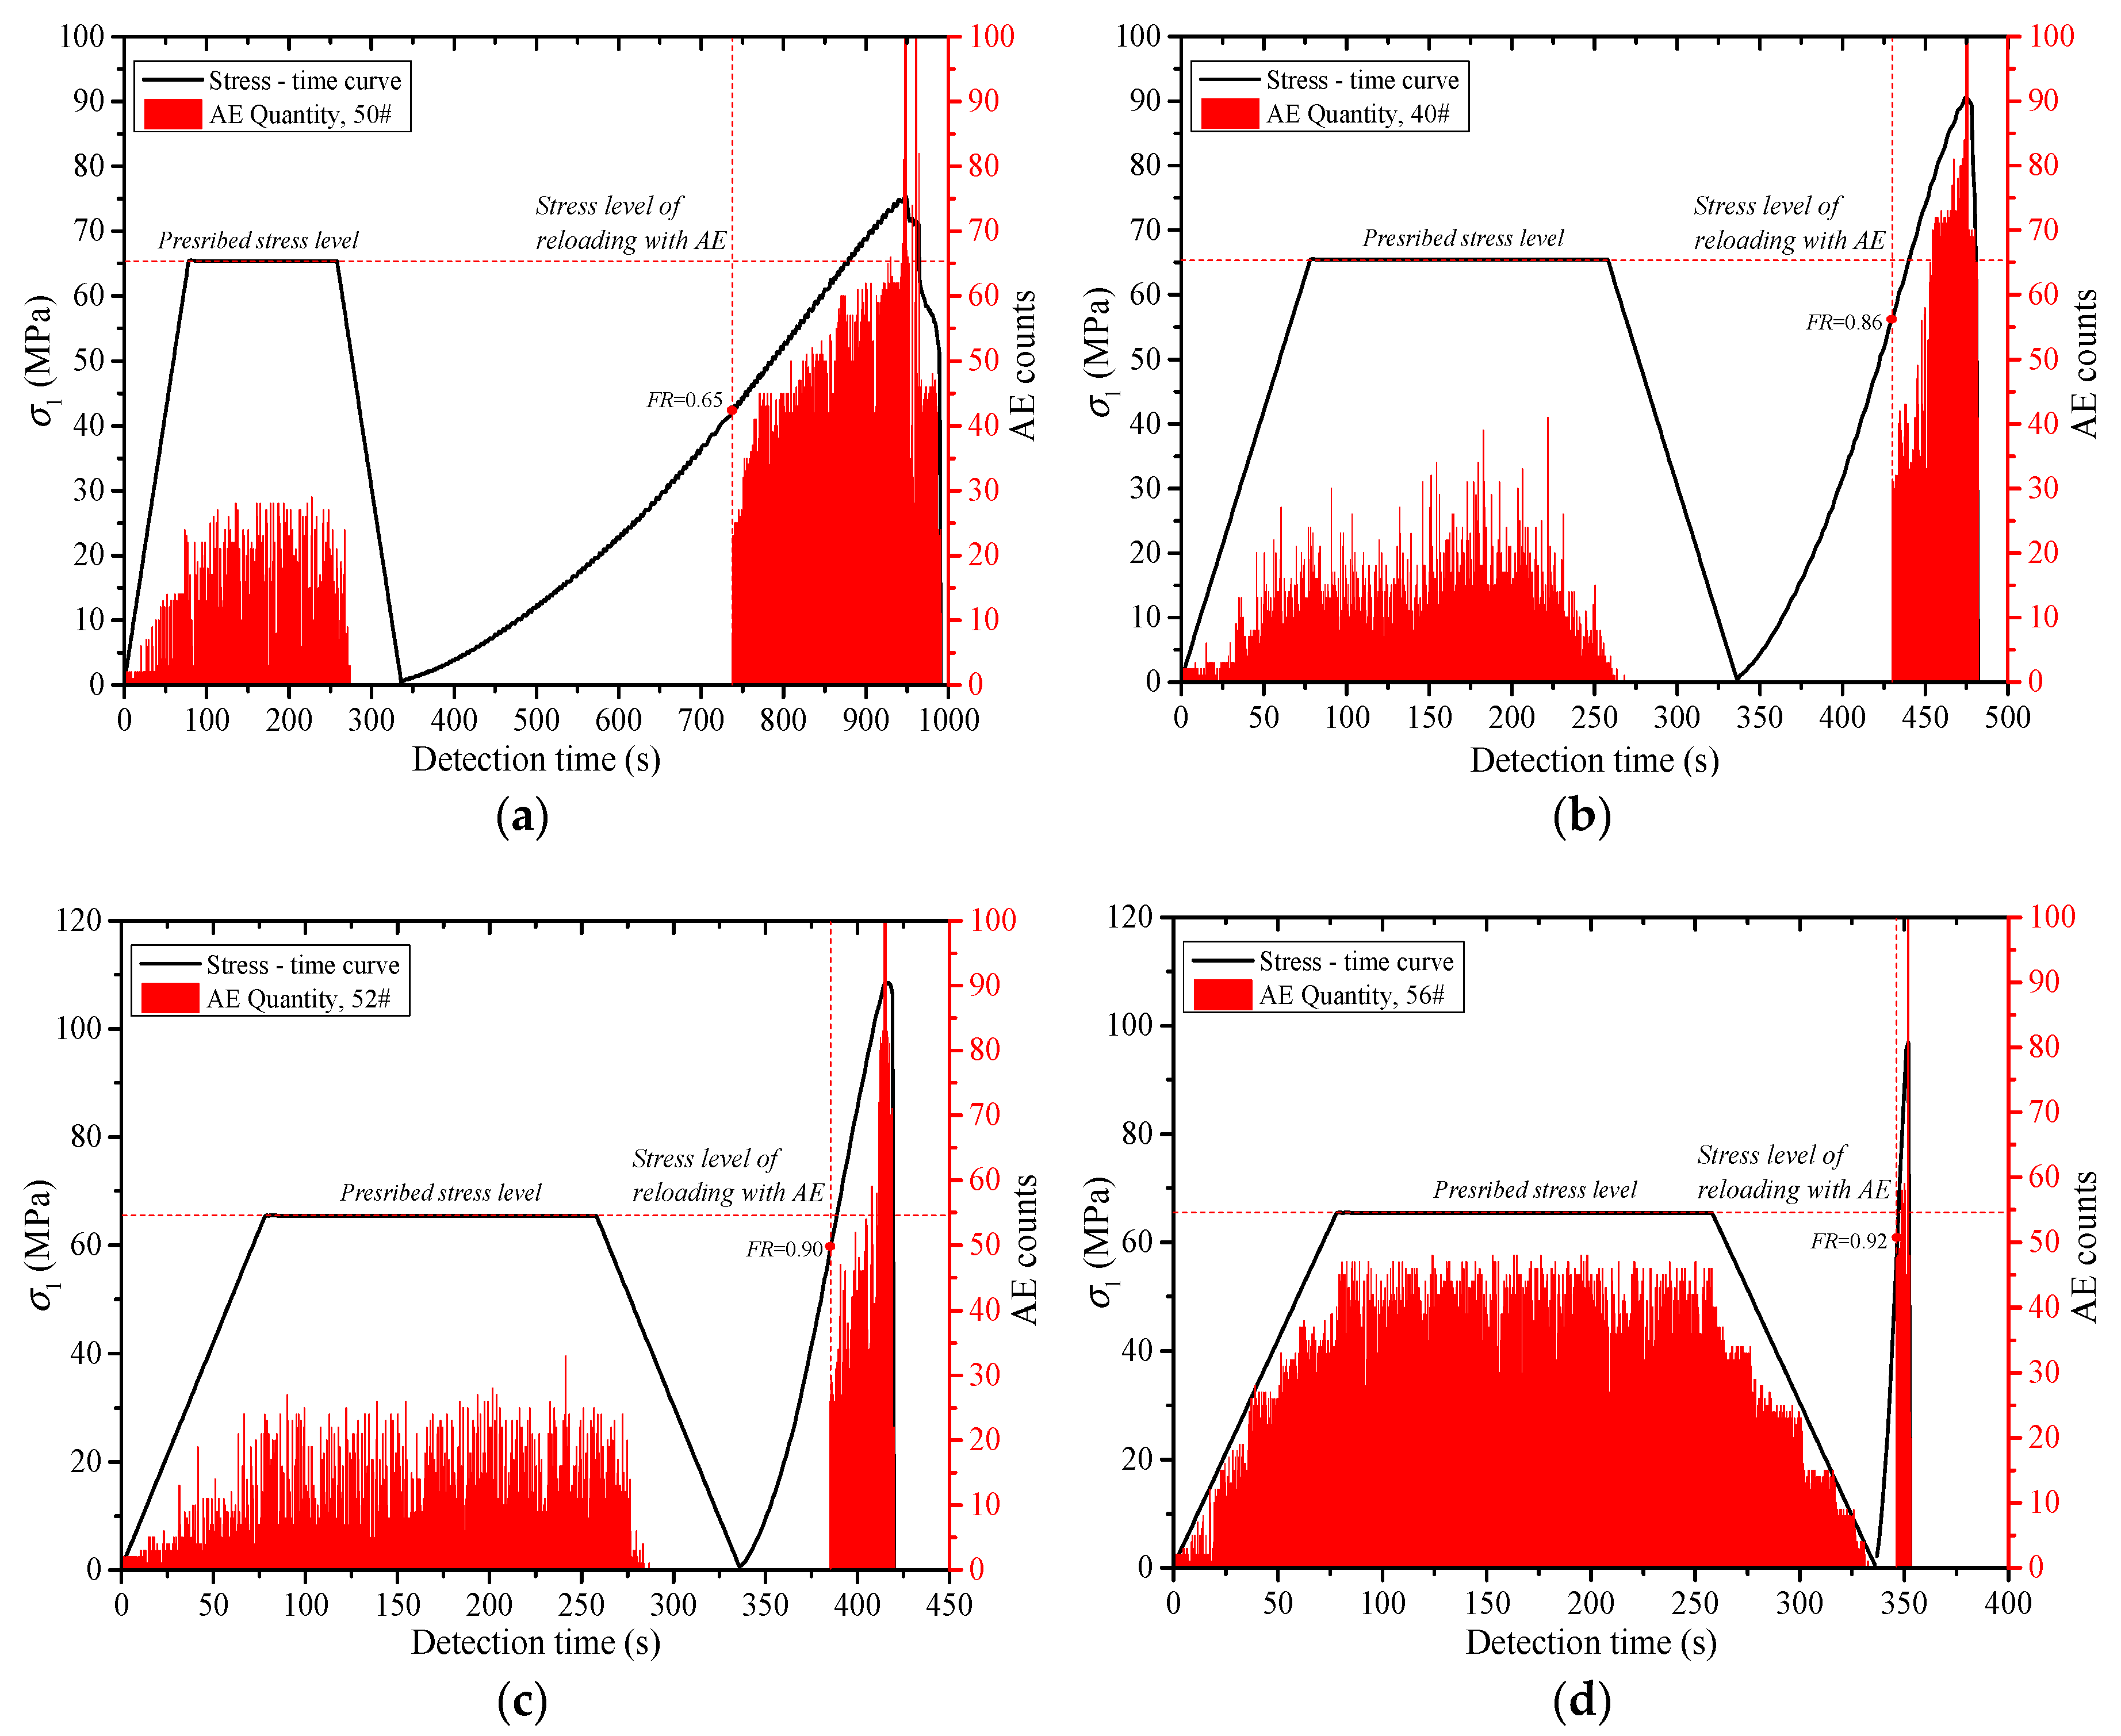
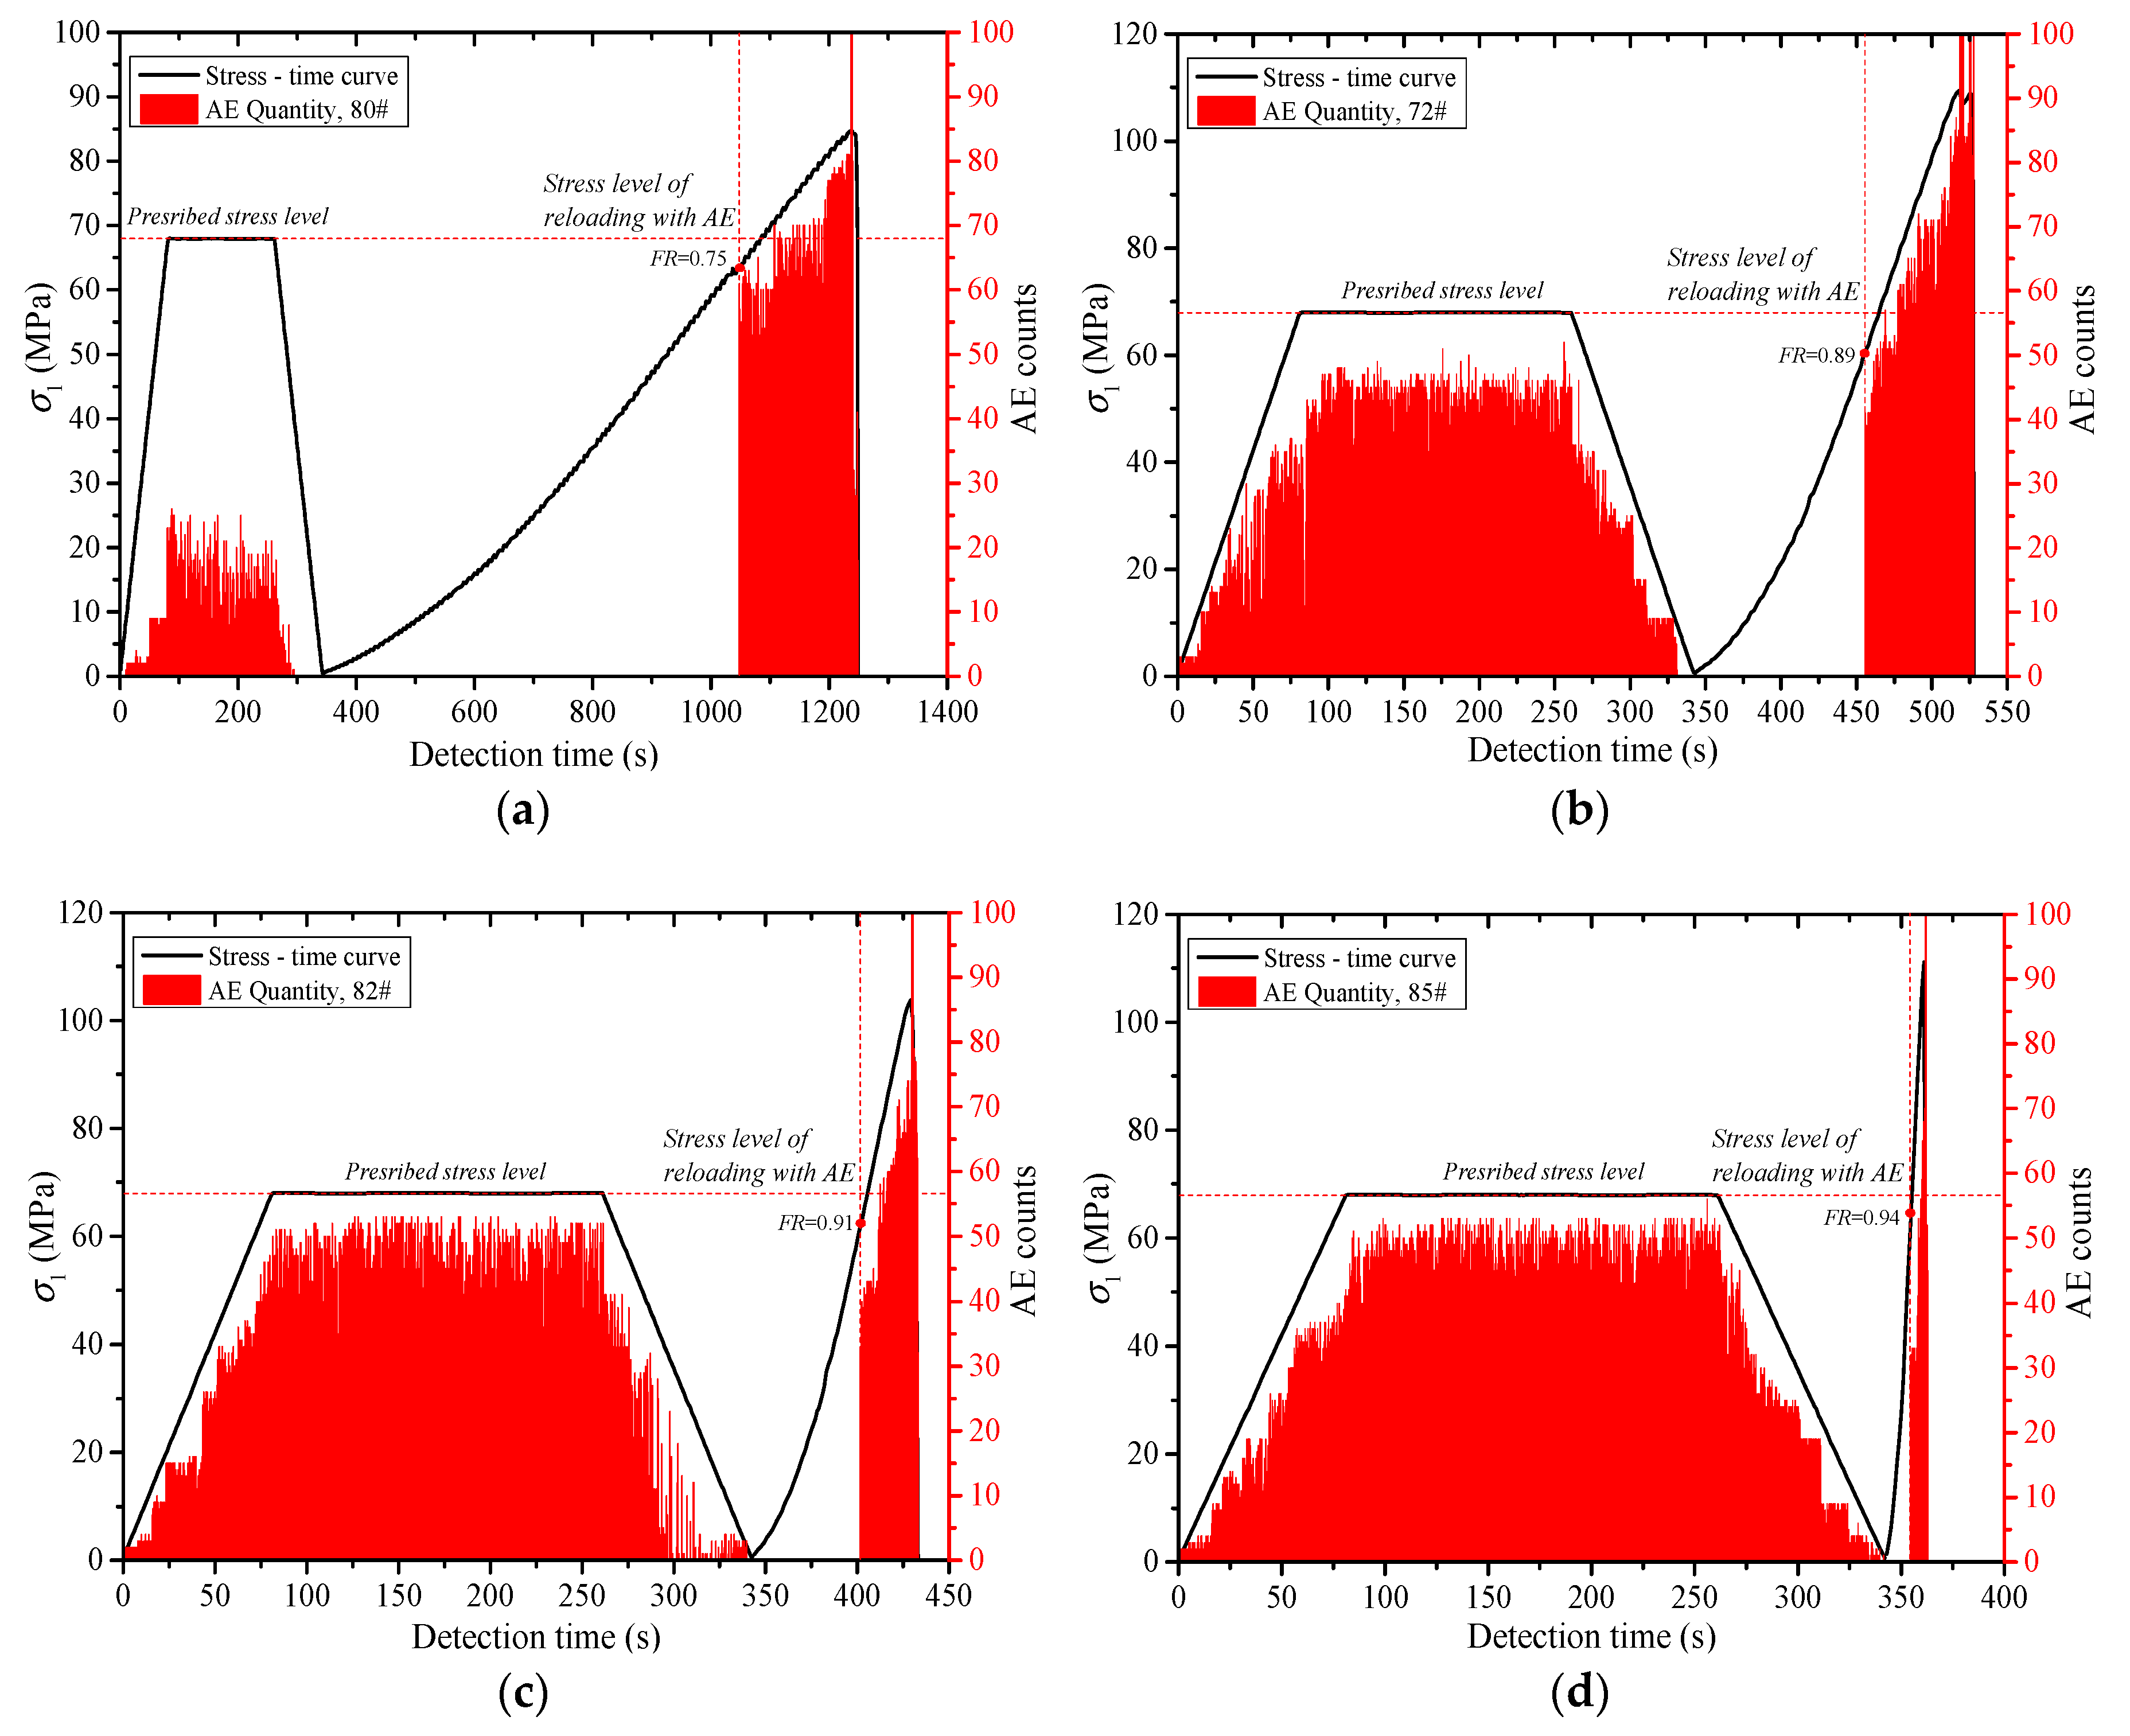
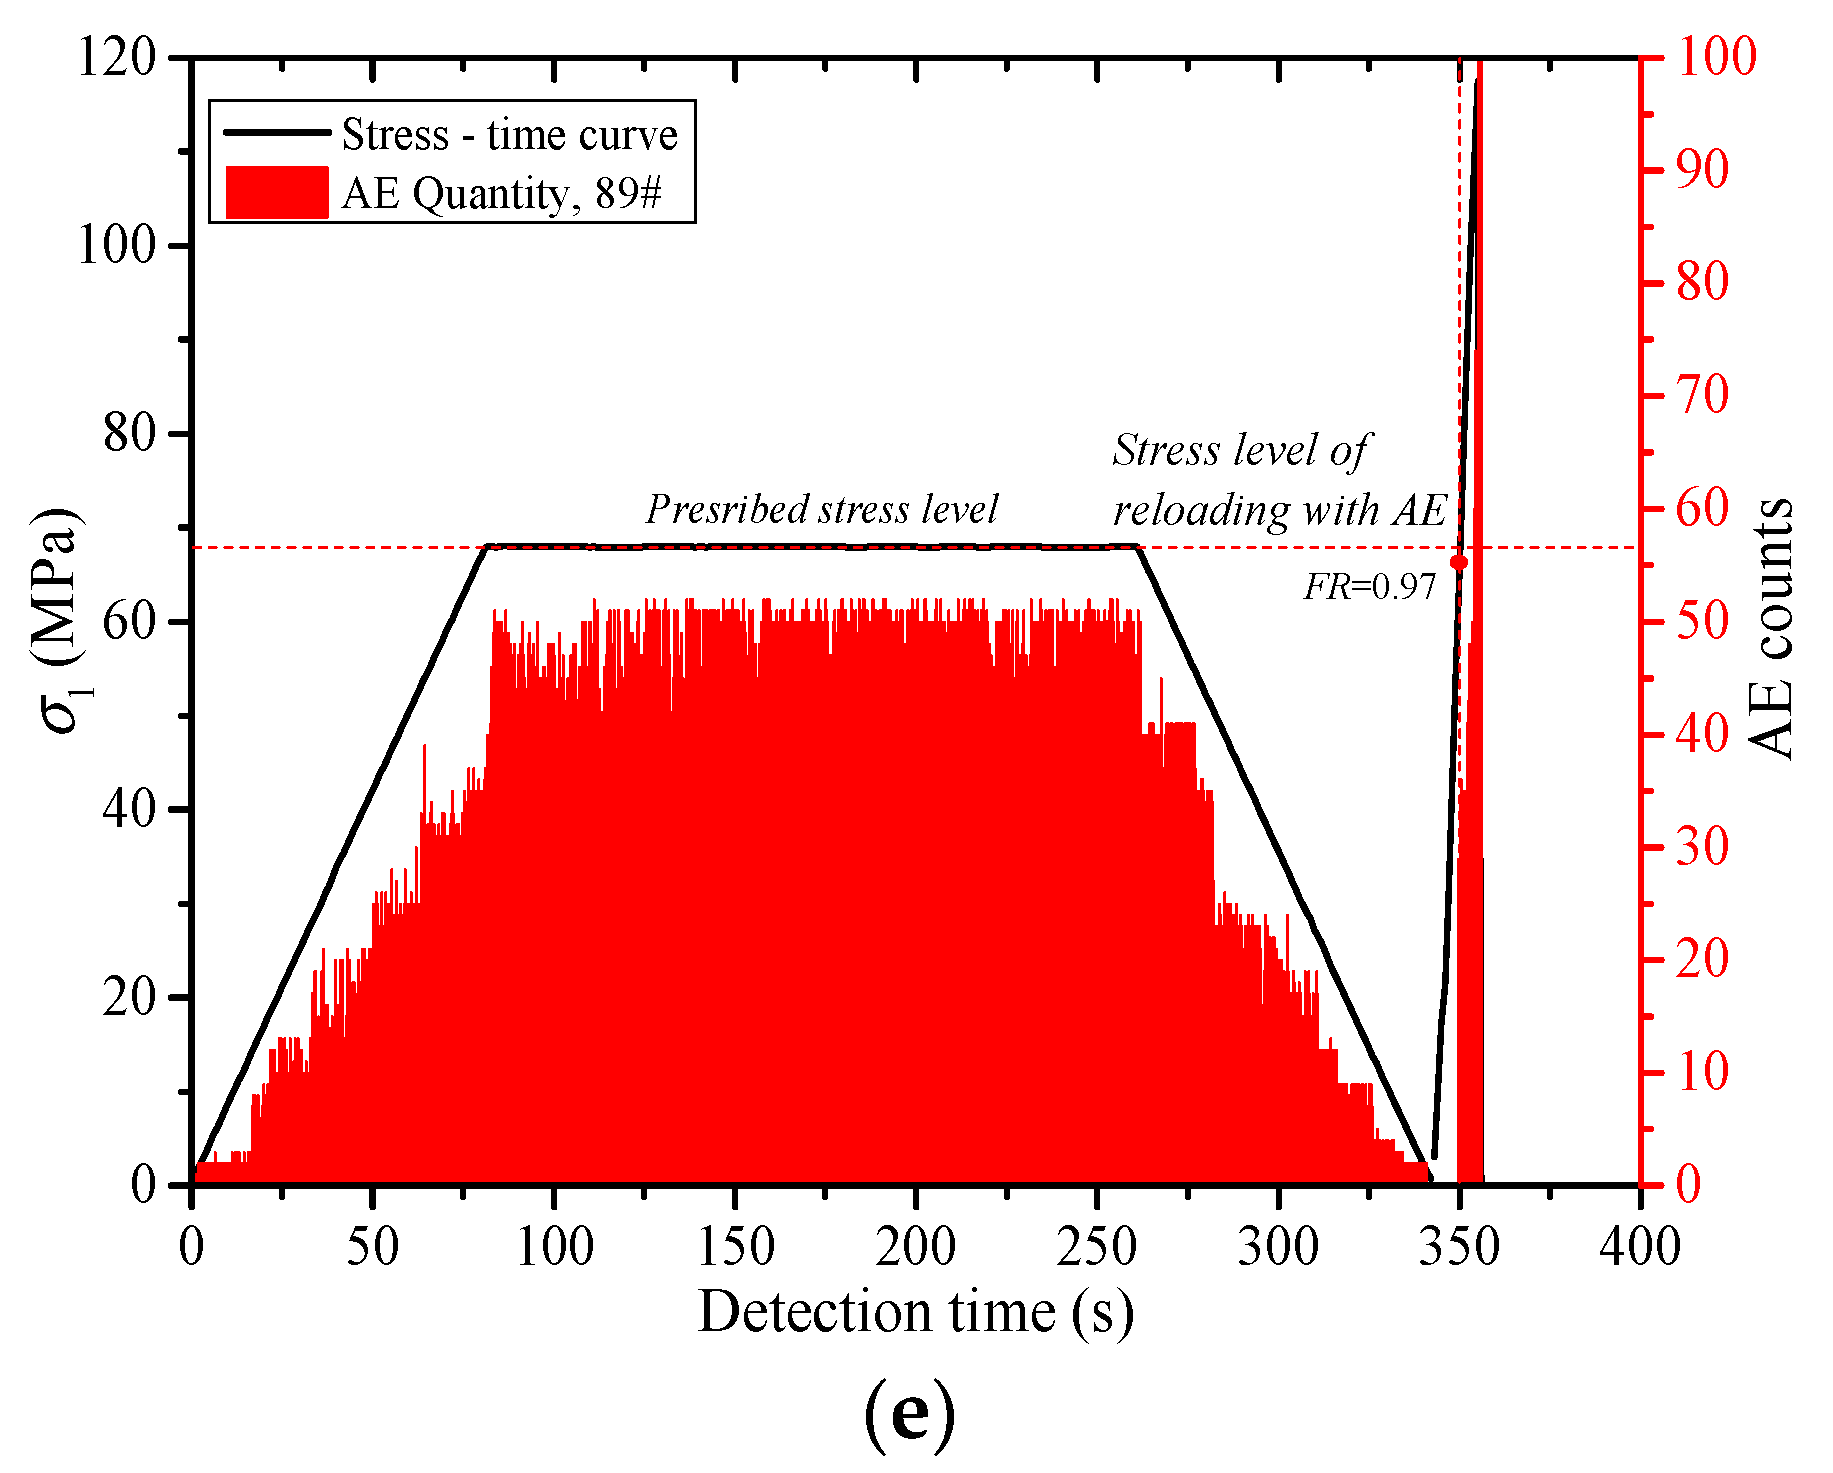
The higher the loading rate (lr) is, the larger the growth rate of the existing micro cracks and the new cracks in the rock specimens is. The greater the degree of the damage in the rock is, the more the quantity of the acoustic emissions is. With the increase of lr, the Felicity rate (FR) increases, and the Kaiser effect appears easily. When lr < 0.01 mm/s, the effect of lr on FR is relatively large. FR increased rapidly along with the increase of lr. When lr ≥ 0.01 mm/s, FR increased slowly as lr increased.

Author Contributions

Q.M. and Y.C. conceived and designed the experiments; M.Z., L.H., H.P. and J.L. performed the experiments and analyzed the data; Q.M. and Y.C. wrote the paper.

Funding

This research was funded by the Fundamental Research Funds for the Central Universities (No. 2019XKQYMS53).

Conflicts of Interest

The authors declare no conflict of interest.

References

  1. Seto, M.; Utagawa, M.; Katsuyama, K.; Nag, D.K.; Vutukuri, V.S. In situ stress determination by acoustic emission technique. Int. J. Rock Mech. Min. Sci. 2007, 34, 281–296. [Google Scholar] [CrossRef]
  2. Jin, Y.; Qi, Z.L.; Chen, M.; Zhang, G.Q.; Xu, G.Q. Time-sensitivity of the Kaiser effect of acoustic emission in limestone and its application to measurements of in situ stress. Pet. Sci. 2009, 6, 176–180. [Google Scholar] [CrossRef]
  3. Chmel, A.; Shcherbakov, I. A comparative acoustic emission study of compression and impact fracture in granite. Int. J. Rock Mech. Min. 2003, 64, 56–59. [Google Scholar] [CrossRef]
  4. Damani, A.; Sondergeld, C.H.; Rai, C.S. Experimental investigation of in situ and injection fluid effect on hydraulic fracture mechanism using acoustic emission in Tennessee sandstone. J. Pet. Sci. Eng. 2018, 171, 315–324. [Google Scholar] [CrossRef]
  5. Alkan, H.; Cinar, Y.; Pusch, G. Rock salt dilatancy boundary from combined acoustic emission and triaxial compression tests. Int. J. Rock Mech. Min. 2007, 44, 108–119. [Google Scholar] [CrossRef]
  6. Kim, J.S.; Lee, K.S.; Cho, W.J.; Choi, H.J.; Cho, G.C. A comparative evaluation of stress-strain and acoustic emission methods for quantitative damage assessments of brittle rock. Rock Mech. Rock Eng. 2015, 48, 495–508. [Google Scholar] [CrossRef]
  7. He, Q.Y.; Li, Y.C.; She, S. Mechanical Properties of Basalt Specimens Under Combined Compression and Shear Loading at Low Strain Rates. Rock Mech. Rock Eng. 2019, 1–12. [Google Scholar] [CrossRef]
  8. Li, Y.C.; Sun, S.Y.; Tang, C.A. Analytical prediction of the shear behaviour of rock joints with quantified waviness and unevenness through wavelet analysis. Rock Mech. Rock Eng. 2019, 1–13. [Google Scholar] [CrossRef]
  9. Li, N.; Zhang, S.C.; Zou, Y.S.; Ma, X.F.; Zhang, Z.P.; Li, S.H.; Chen, M.; Sun, Y.Y. Acoustic emission response of laboratory hydraulic fracturing in layered shale. Rock Mech. Rock Eng. 2018, 51, 3395–3406. [Google Scholar] [CrossRef]
  10. Khazaei, C.; Hazzard, J.; Chalaturnyk, R. Damage quantification of intact rocks using acoustic emission energies recorded during uniaxial compression test and discrete element modeling. Comput. Geotech. 2015, 67, 94–102. [Google Scholar] [CrossRef]
  11. Zhang, Z.P.; Zhang, R.; Xie, H.P.; Liu, J.F.; Were, P. Differences in the acoustic emission characteristics of rock salt compared with granite and marble during the damage evolution process. Environ. Earth Sci. 2015, 73, 6987–6999. [Google Scholar] [CrossRef]
  12. Zhang, J.; Ai, C.; Li, Y.W.; Che, M.G.; Gao, R.; Zeng, J. Energy-based brittleness index and acoustic emission characteristics of anisotropic coal under triaxial stress condition. Rock Mech. Rock Eng. 2018, 51, 3343–3360. [Google Scholar] [CrossRef]
  13. Goodman, R.E. Subaudible noise during compression of rocks. Geol. Soc. Am. Bull. 1963, 74, 487–490. [Google Scholar] [CrossRef]
  14. Yamshchikov, V.S.; Shkuratnik, V.L.; Lavrov, A.V. Memory effects in rocks (review). J. Min. Sci. 1994, 30, 463–473. [Google Scholar] [CrossRef]
  15. Filimonov, Y.L.; Lavrov, A.V.; Shafarenko, Y.M.; Shkuratnik, V.L. Memory effects in rock salt under triaxial stress state and their use for stress measurement in a rock mass. Rock Mech. Rock Eng. 2001, 34, 275–291. [Google Scholar] [CrossRef]
  16. Lavrov, A. Fracture-induced physical phenomena and memory effects in rocks: A review. Strain 2005, 41, 135–149. [Google Scholar] [CrossRef]
  17. Tuncay, E.; Ulusay, R. Relation between Kaiser effect levels and pre-stresses applied in the laboratory. Int. J. Rock Mech. Min. 2008, 45, 524–537. [Google Scholar] [CrossRef]
  18. Tuncay, E.; Obara, Y. Comparison of stresses obtained from acoustic emission and compact conical-ended borehole overcoring techniques and an evaluation of the Kaiser effect level. Bull. Eng. Geol. Environ. 2012, 71, 367–377. [Google Scholar] [CrossRef]
  19. Bai, X.; Zhang, D.M.; Wang, H.; Li, S.J.; Rao, Z. A novel in situ stress measurement method based on acoustic emission Kaiser effect: A theoretical and experimental study. R. Soc. Open Sci. 2018, 5, 1–17. [Google Scholar] [CrossRef]
  20. Manthei, G. Characterization of acoustic emission sources in a rock salt specimen under triaxial compression. Bull. Seismol. Soc. Am. 2005, 95, 1674–1700. [Google Scholar] [CrossRef]
  21. Rao, M.V.M.S.; Ramana, Y.V. A study of progressive failure of rock under cyclic loading by ultrasonic and AE monitoring techniques. Rock Mech. Rock Eng. 1992, 25, 237–251. [Google Scholar] [CrossRef]
  22. Yoshikawa, S.; Mogi, K. A new method for estimation of the crustal stress from cored rock samples: Laboratory study in the case of uniaxial compression. Tectonophysics 1981, 74, 323–339. [Google Scholar] [CrossRef]
  23. Kurita, K.; Fujii, N. Stress memory of crystalline rocks in acoustic emission. Geophys. Res. Lett. 1979, 6, 9–12. [Google Scholar] [CrossRef]
  24. Lockner, D.A. The role of acoustic emission in the study of rock fracture. Int. J. Rock Mech. Min. Geomech. Abstr. 1993, 30, 893–899. [Google Scholar] [CrossRef]
  25. Hsieh, A.; Dight, P.; Dyskin, A.V. The rock stress memory unrecoverable by the Kaiser effect method. Int. J. Rock Mech. Min. 2015, 75, 190–195. [Google Scholar] [CrossRef]
  26. Lavrov, A. The Kaiser effect in rocks: Principles and stress estimation techniques. Int. J. Rock Mech. Min. 2003, 40, 151–171. [Google Scholar] [CrossRef]
  27. Li, C.; Norlund, E. Experimental verification of the Kaiser effect in rocks. Rock Mech. Rock Eng. 1993, 26, 333–351. [Google Scholar] [CrossRef]
  28. Zhang, Y.; Chen, Y.L.; Yu, R.R.; Hu, L.Q.; Irfan, M. Effect of loading rate on the Felicity effect of three rock types. Rock Mech. Rock Eng. 2017, 50, 1673–1681. [Google Scholar] [CrossRef]
  29. Meng, Q.B.; Zhang, M.W.; Han, L.J.; Pu, H.; Nie, T.Y. Effects of acoustic emission and energy evolution of rock specimens under the uniaxial cyclic loading and unloading compression. Rock Mech. Rock Eng. 2016, 49, 3873–3886. [Google Scholar] [CrossRef]
  30. Meng, Q.B.; Zhang, M.W.; Han, L.J.; Pu, H.; Nie, T.Y. Acoustic emission characteristics of red sandstone specimens under uniaxial cyclic loading and unloading compression. Rock Mech. Rock Eng. 2018, 51, 969–988. [Google Scholar] [CrossRef]
  31. Lavrov, A. Kaiser effect observation in brittle rock cyclically loaded with different loading rates. Mech. Mater. 2001, 33, 669–677. [Google Scholar] [CrossRef]
  32. Cai, M.; Kaiser, P.K.; Suorineni, F.; Su, K. A study on the dynamic behavior of the Meuse/Haute-Marne argillite. Phys. Chem. Earth 2007, 32, 907–916. [Google Scholar] [CrossRef]
  33. Zhang, Q.B.; Zhao, J. A review of dynamic experimental techniques and mechanical behaviour of rock materials. Rock Mech. Rock Eng. 2014, 47, 1411–1478. [Google Scholar] [CrossRef]
  34. Martin, C.D. Seventeenth Canadian geotechnical colloquium: The effect of cohesion loss and stress path on brittle rock strength. Can. Geotech. J. 1997, 34, 698–725. [Google Scholar] [CrossRef]
  35. Ganne, P.; Vervoort, A.; Wevers, M. Quantification of pre-peak brittle damage: Correlation between acoustic emission and observed micro-fracturing. Int. J. Rock Mech. Min. 2007, 44, 720–729. [Google Scholar] [CrossRef]
  36. Yu, R.G.; Tian, Y.; Wang, X.X. Relation between stresses obtained from Kaiser effect under uniaxial compression and hydraulic fracturing. Rock Mech. Rock Eng. 2015, 48, 397–401. [Google Scholar] [CrossRef]
  37. Kranz, R.L. Crack growth and development during creep of Barre granite. Int. J. Rock Mech. Min. Sci. Geomech. Abstr. 1979, 16, 23–35. [Google Scholar] [CrossRef]
  38. Yamamuro, J.A.; Lade, P.V. Effects of strain rate on instability of granular soils. Geotech. Test. J. 2014, 16, 304–313. [Google Scholar]
  39. Chong, K.P.; Boresi, A.P. Strain rate dependent mechanical properties of new albany reference shale. Int. J. Rock Mech. Min. Sci. Geomech. Abstr. 1990, 27, 199–205. [Google Scholar] [CrossRef]
  40. Peng, S.S.; Podnieks, E.R. Relaxation and the behavior of failed rock. Int. J. Rock Mech. Min. Sci. Geomech. Abstr. 1972, 9, 699–700. [Google Scholar] [CrossRef]
  41. Blanton, T.L. Effect of strain rates from 10−2 to 10/s in triaxial compression tests on three rocks. Int. J. Rock Mech. Min. Sci. Geomech. Abstr. 1981, 18, 47–62. [Google Scholar] [CrossRef]
Figure 1. The microstructures and compositions of the three types of rock. Qtz—quartz, Pl—plagioclase, Kfs—potash feldspar, Cal—calcite, Anh—anhydrite, Bt—biotite.
Energies 12 03255 g001
Figure 2. Configuration of the uniaxial cyclic loading and unloading test. (a) Schematic diagram, 1—loading platens of the testing system, 2—pedestal, 3—rock sample, 4—acoustic emission (AE) sensor, 5—AE per-amplifier, 6—data analyzer; (b) stress loading path; (c) MTS 816 rock mechanics testing system; (d) installation of the rock sample and AE sensor; (e) DS5-A acoustic emission testing and analysis system.
Energies 12 03255 g002
Figure 3. Stress–time–acoustic–AE curves in uniaxial compression test of the three types of rocks. (a) Red sandstone; (b) marble; (c) granite.
Energies 12 03255 g003aEnergies 12 03255 g003b
Figure 4. Stress–time–AE curves in uniaxial cyclic loading and unloading test of red sandstone under different stress levels. (a) σA = 0.5 σc; (b) σA = 0.6 σc; (c) σA = 0.7 σc; (d) σA = 0.8 σc; (e) σA = 0.9 σc.
Energies 12 03255 g004aEnergies 12 03255 g004b
Figure 5. Stress–time–AE curves in uniaxial cyclic loading and unloading test of marble under different stress levels. (a) σA = 0.5 σc; (b) σA = 0.6σc; (c) σA = 0.7 σc; (d) σA = 0.8 σc; (e) σA = 0.9 σc.
Energies 12 03255 g005aEnergies 12 03255 g005b
Figure 6. Stress–time–AE curves in uniaxial cyclic loading and unloading test of granite under different stress levels. (a) σA = 0.5 σc; (b) σA = 0.6 σc; (c) σA = 0.7 σc; (d) σA = 0.8 σc; (e) σA = 0.9 σc.
Energies 12 03255 g006aEnergies 12 03255 g006b
Figure 7. Stress–time-AE curves in uniaxial cyclic loading and unloading test of red sandstone under different loading rates (σA = 0.7σc). (a) lr = 0.001 mm/s; (b) lr = 0.005 mm/s; (c) lr = 0.01 mm/s; (d) lr = 0.05 mm/s; (e) lr = 0.1 mm/s.
Energies 12 03255 g007aEnergies 12 03255 g007b
Figure 8. Stress–time–AE curves in uniaxial cyclic loading and unloading test of marble under different loading rates (σA = 0.7σc). (a) lr = 0.001 mm/s; (b) lr = 0.005 mm/s; (c) lr = 0.01 mm/s; (d) lr = 0.05 mm/s; (e) lr = 0.1 mm/s.
Energies 12 03255 g008aEnergies 12 03255 g008b
Figure 9. Stress–time–AE curves in uniaxial cyclic loading and unloading test of granite under different loading rates (σA = 0.7σc). (a) lr = 0.001 mm/s; (b) lr = 0.005 mm/s; (c) lr = 0.01 mm/s; (d) lr = 0.05 mm/s; (e) lr = 0.1 mm/s.
Energies 12 03255 g009aEnergies 12 03255 g009b
Figure 10. Felicity rate (FR) values of the three types of rocks under different stress level.
Energies 12 03255 g010
Figure 11. FR values of three types of rocks under different loading rate conditions.
Energies 12 03255 g011
Table 1. Uniaxial cyclic loading–unloading compression of rock samples.
Serial Number of Rock SamplePrescribed Stress (σA, MPa)
0.5 σc0.6 σc0.7 σc0.8 σc0.9 σc
Loading rate (lr, mm/s)Red sandstone0.0054–67–910–1213–1516–18
Marble34–3637–3940–4243–4546–48
Granite64–6667–6970–7273–7576–78
Serial Number of Rock SampleLoading Rate (lr, mm/s)
0.0010.0050.010.050.1
Prescribed stress (σA, MPa)Red sandstone0.7σc19–2110–1222–2425–2728–30
Marble49–5140–4252–5455–5758–60
Granite79–8170–7282–8485–8788–90
Note: The 1–3, 31–33 and 61–63 rock specimens are used for the uniaxial compression test, and σc is the UCS of the rock.
Table 2. Felicity rate values under different stress levels and loading rates.
Felicity Rate (FR)Loading Rate (lr, mm/s)
0.0010.0050.010.050.1
Loading rate (lr, mm/s)Red sandstone0.0050.55, 0.61, 0.530.83, 0.84, 0.820.87, 0.86, 0.860.91, 0.88, 0.910.95, 0.94, 0.93
Marble0.69, 0.65, 0.660.86, 0.85, 0.850.90, 0.88, 0.870.93, 0.92, 0.910.96, 0.95, 0.94
Granite0.73, 0.75, 0.710.88, 0.87, 0.890.91, 0.92, 0.920.94, 0.93, 0.950.97, 0.97, 0.98
Serial Number of Rock SampleLoading Rate (lr, mm/s)
0.0010.0010.0010.0010.001
Prescribed stress level (σA, MPa)Red sandstone0.7 σc1.14, 1.11, 1.130.95, 0.90, 0.920.83, 0.84, 0.820.71, 0.69, 0.670.60, 0.59, 0.57
Marble1.21, 1.23, 1.220.97, 0.96, 0.950.86, 0.85, 0.850.82, 0.81, 0.820.72, 0.72, 0.72
Granite1.28, 1.26, 1.270.97, 0.99, 0.980.88, 0.87, 0.890.84, 0.83, 0.850.76, 0.75, 0.77

