Abstract
The development of appropriate methods by which to assess the functioning of gas pipelines helps limits the consequences of disasters, in that way protecting users better. Assessment methods of this kind are presented in this paper, which advocates the integrated risk area identification method. The risk taken account of is understood to be a function of the probability or frequency of occurrence of undesirable events, and comes with parameters defining the consequences of these events, should they arise, in terms of their magnitude. The level of system vulnerability to events of these types is a factor considered, and the risk calculation is of a kind that encompasses both quantitative and qualitative aspects. The approach taken is regarded as a quick and simple risk-assessment tool applicable to the daily operation of gas networks for a gas company. Specifically, the framework of the research carried out extends to: (1) Estimation of the average cost of failure of gas pipelines in the case of an urban agglomeration in SE Poland; (2) assessment of the level of integrated risk facing the gas-supply subsystem, by reference to the risk area identification method; (3) failure forecasting by way of regressions with delay; and (4) conclusions regarding failure risk assessment in a gas-supply network, as well as a consideration of prospects. The framework referred here, thus constitutes the basis for both analysis and assessment of the safety of a gas-supply system.
1. Introduction
Natural gas is a fuel whose properties favor increased use. Relative environment-friendliness (e.g., a lack of particulate matter contributing to the occurrence of smog) ensures use in the heating of homes, the fueling of motor vehicles or various industrial production processes [1]. According to data from Statistics Poland (the Central Statistical Office) more people are also using natural gas from the network than did so a decade ago. The increase in the number of natural-gas consumers makes expansion of the system distributing natural gas imperative. Coming first and foremost: The construction of new gas pipelines [2,3]. According to the 10th Report of the European Gas Pipeline Incident Data Group, the 1970–2016 period brought a more-than 21% increase in the length of the gas transportation pipelines, whose length by 2016 had reached 149,000 km, and in case of the length of natural gas distribution length almost 2,200,000 km in Europe [4]. On the one hand, such a dynamic increase in the length of the gas network makes it possible for more consumers to use natural gas. On the other, the longer a network is, the greater the probability of its failing [5]. According to the EGIG report [4], the overall frequency of occurrences, characterizing the 1970–2016 period, is 0.31 failures per year per 1000 km. This might be contrasted with the figure for just the most-recent five years, which stands at just 0.134 per year per 1000 km. The historical analysis of accidents in the transportation of natural gas indicated, that the main causes for accidents were mechanical failure, as third party damage (TPD), and activities of workers, according to the report of Technical Association of the European Natural Gas Industry [6] and previous studies [7,8]. Such situations show the need for special trainings of operators of construction machinery [6]. The performed analyses [9,10] show, that pipeline failure can cause significant economic losses and fatalities as a result of domino effect; therefore, it is important to maintain safety level at proper level.
In most cases, the failure of a gas network is associated with leakage. Gas leaks bring with them the likelihood of fire, explosion or poisoning of people [11,12]. Furthermore, the effects of a failures of a network can be very serious, both economic and in relation to the health of the population [13,14]. This is enough to justify a search for new methods by which determine both the probability of failures and their consequences [15].
Contemporary risk assessment draws on current world trends, which entail an increased emphasis on safety [16,17]. For its part, European energy policy takes account of issues, such as the diversification of sources of supply and stability of the political situation, while also drawing attention to the geographical locations of sources [18,19].
Both economic and environmental reasons account for the ever-greater importance of natural gas [20,21]. Growing demand for the fuel helps sustain efforts to expand networks, with this also making it more probable that undesirable events will arise [22]. Each such undesirable event across the subsystem put in place to distribute natural gas causes disruptions in supply and poses a risk of an explosion ensuing [23]. That makes it very reasonable to seek to determine the operational level in the natural-gas distribution subsystem potentially associated with the occurrence of an undesirable event [24,25,26].
Safety can be defined in descriptive terms as a condition or property of an object or system that characterizes its ability to resist accidents [27,28]. With regard to consumers of a supply of gas, safety is the probability of avoiding the risk resulting from hazard occurrence or protection against hazard [29].
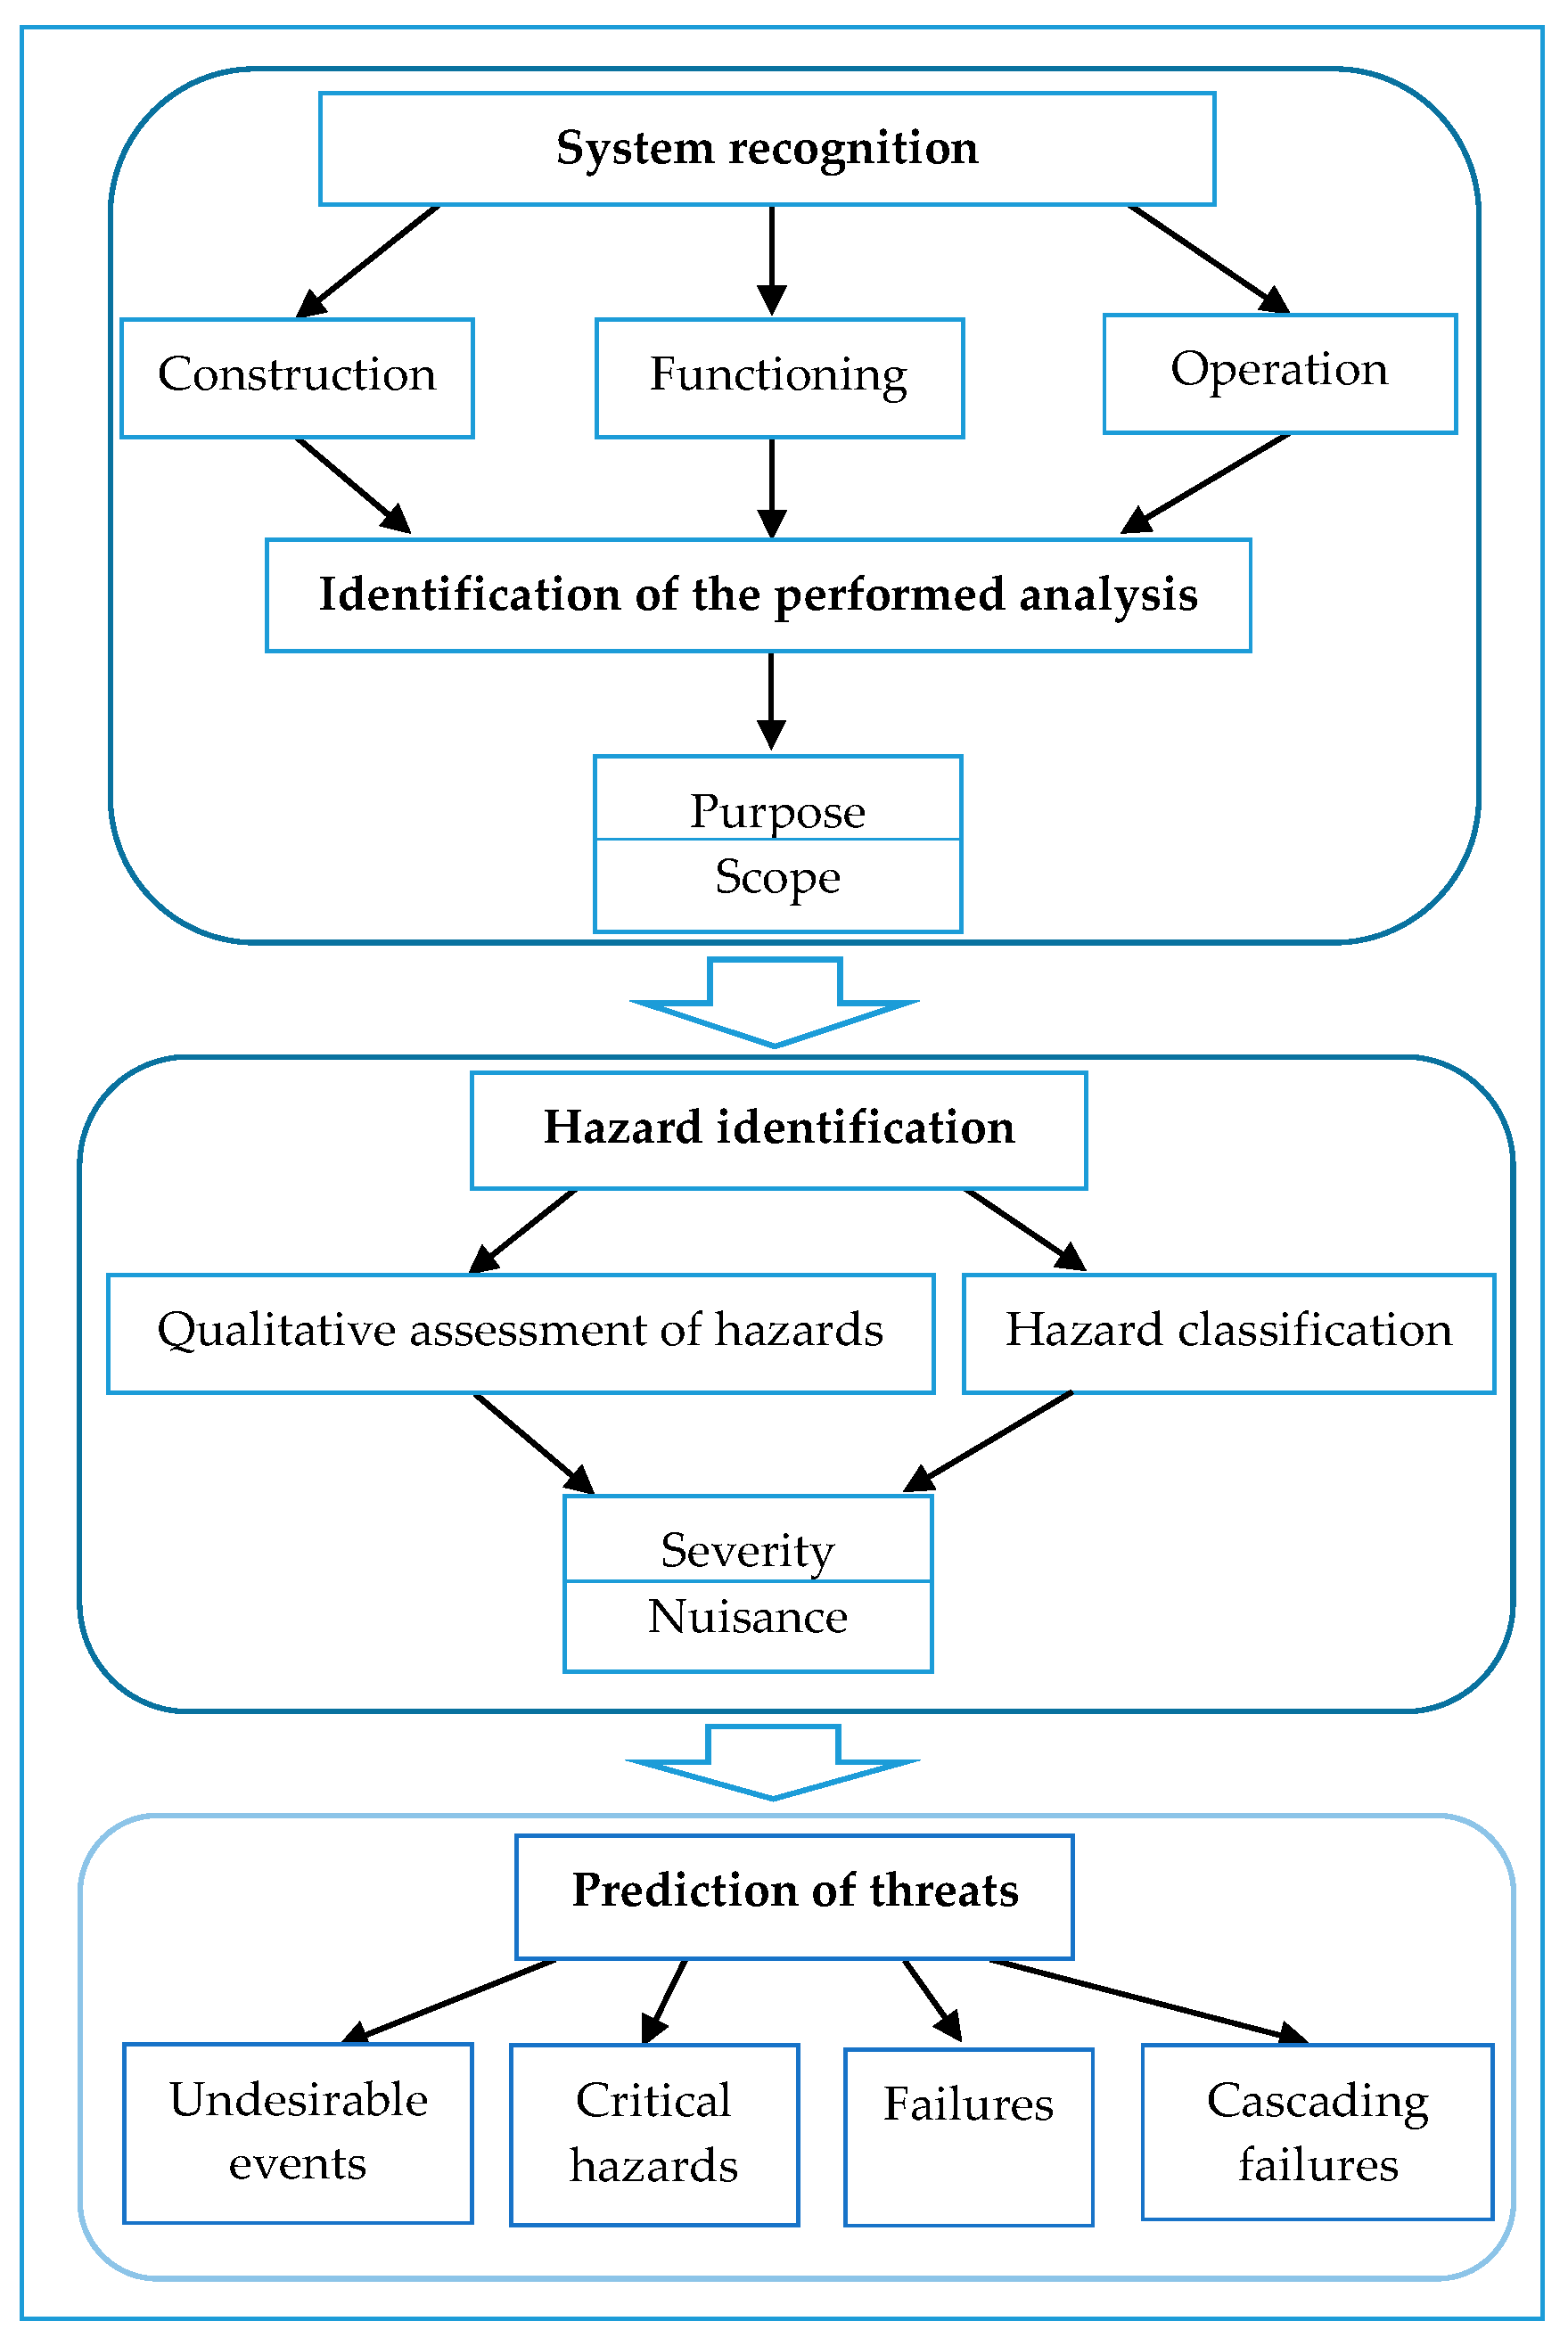
The analysis and assessment of the safety of a gas-supply system is performed in line with the following steps presented in Figure 1.
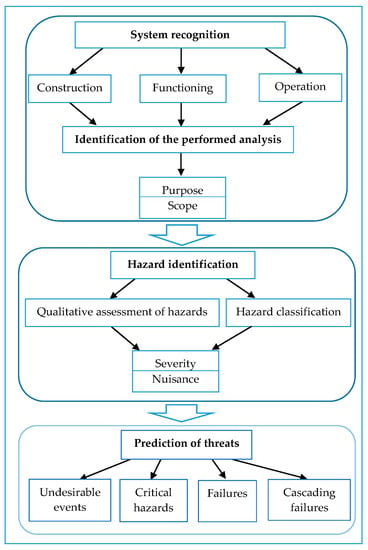
Figure 1.
Steps in the analysis and assessment of the safety of a gas-supply system.
An important step entails the estimation of possible losses for each group of threats by a determination of the number of residents using the gas-supply system, including an estimation of the probability of a certain value of losses being exceeded, and an estimation of the likelihood of undesirable events occurring [30]. Another issue includes the identification of safety barriers and the assessment of system vulnerability, through hazard classification in line with the degree of nuisance [31,32].
Next, the risk function is determined, and its parameters characterized, including via an assessment of the risk value, at the adopted scale, with a view of the acceptability of risk being determined [33,34]. The analysis conducted is helpful, as emergency-response plans are developed; and as decision-making is engaged in, with regards to the need to implement corrective actions and develop future goals in terms of modernization or system expansion, so that the safety of gas supply is assured [35,36]. A very important issue is to predict threats affecting the loss of system security, taking into account failures or undesirable events that could cause a domino effect, or so-called cascade failure [37,38], via implementations of economical and reliability criteria for the integrated safety assessment [39,40,41,42,43,44].
The analysis was performed using real data on failures of gas-supply networks supervised by the municipal gas company in a Polish city, as well as technical documentation and information obtained in regard to everyday operations. The analysis was performed using Statsoft software [45], through network failure forecasting through regressions with delay [46].
The case described here makes clear the need to ensure both safety and comfort of use where gas supplies are concerned, as shown in [45,46,47,48,49]. The main aim of this paper has thus been to present approaches to failure assessment in regard to the functioning of a gas network. Findings then act in support of the management of an urban gas network, above all when it comes to strategic modernization plans and rehabilitation techniques.
2. Estimation of the Average Failure Cost of Gas Pipelines
Prior to an analysis of the effect of an undesirable event C, components of the cost of liquidating a single failure were determined as cfi.
This cost consists of components as follows, and can be expressed as:
where clab represents labour costs, ctran transport costs, cmat material costs, cmes mark-up expenses supply, and cpm is mark-up profit and tax.
cfi = clab + ctran + cmat + cmes + cpm
In turn, costs due to losses of gas in the course of a failure cgl are estimated in line with the formula:
where ΔV is the amount of gas lost, in m3, and cgp the gas price in EUR/m3.
cgl = ΔV·cgp
The total cost is affected by the duration of the effort to rectify the failure, because personnel costs, and hence labor costs, are calculated in line with hourly rates. However, the average duration of a repair is in the range 7.9–9.3 h, and the time of failure protection is about 0.5 h, based on operating data obtained from a real gas supply system in a Polish city. The city is supplied by two high-pressure transmission lines, ϕ700 and ϕ400, of nominal pressure 6.4 MPa. The medium-pressure ring gas network is supplied from the high-pressure transmission bus through two reduction-measuring stations of the first stage, and reducing the high pressure of 6.4 MPa to an average of 0.4 MPa. To the main ring of medium pressure, a local natural gas mine was connected through the third reduction and measurement station of the first stage. The medium pressure network supplies 21 of the second stage reduction stations, reducing the average pressure of 0.4 MPa to the low 0.025 MPa and directly distributing to some of the buildings in the city.
Obtained Results
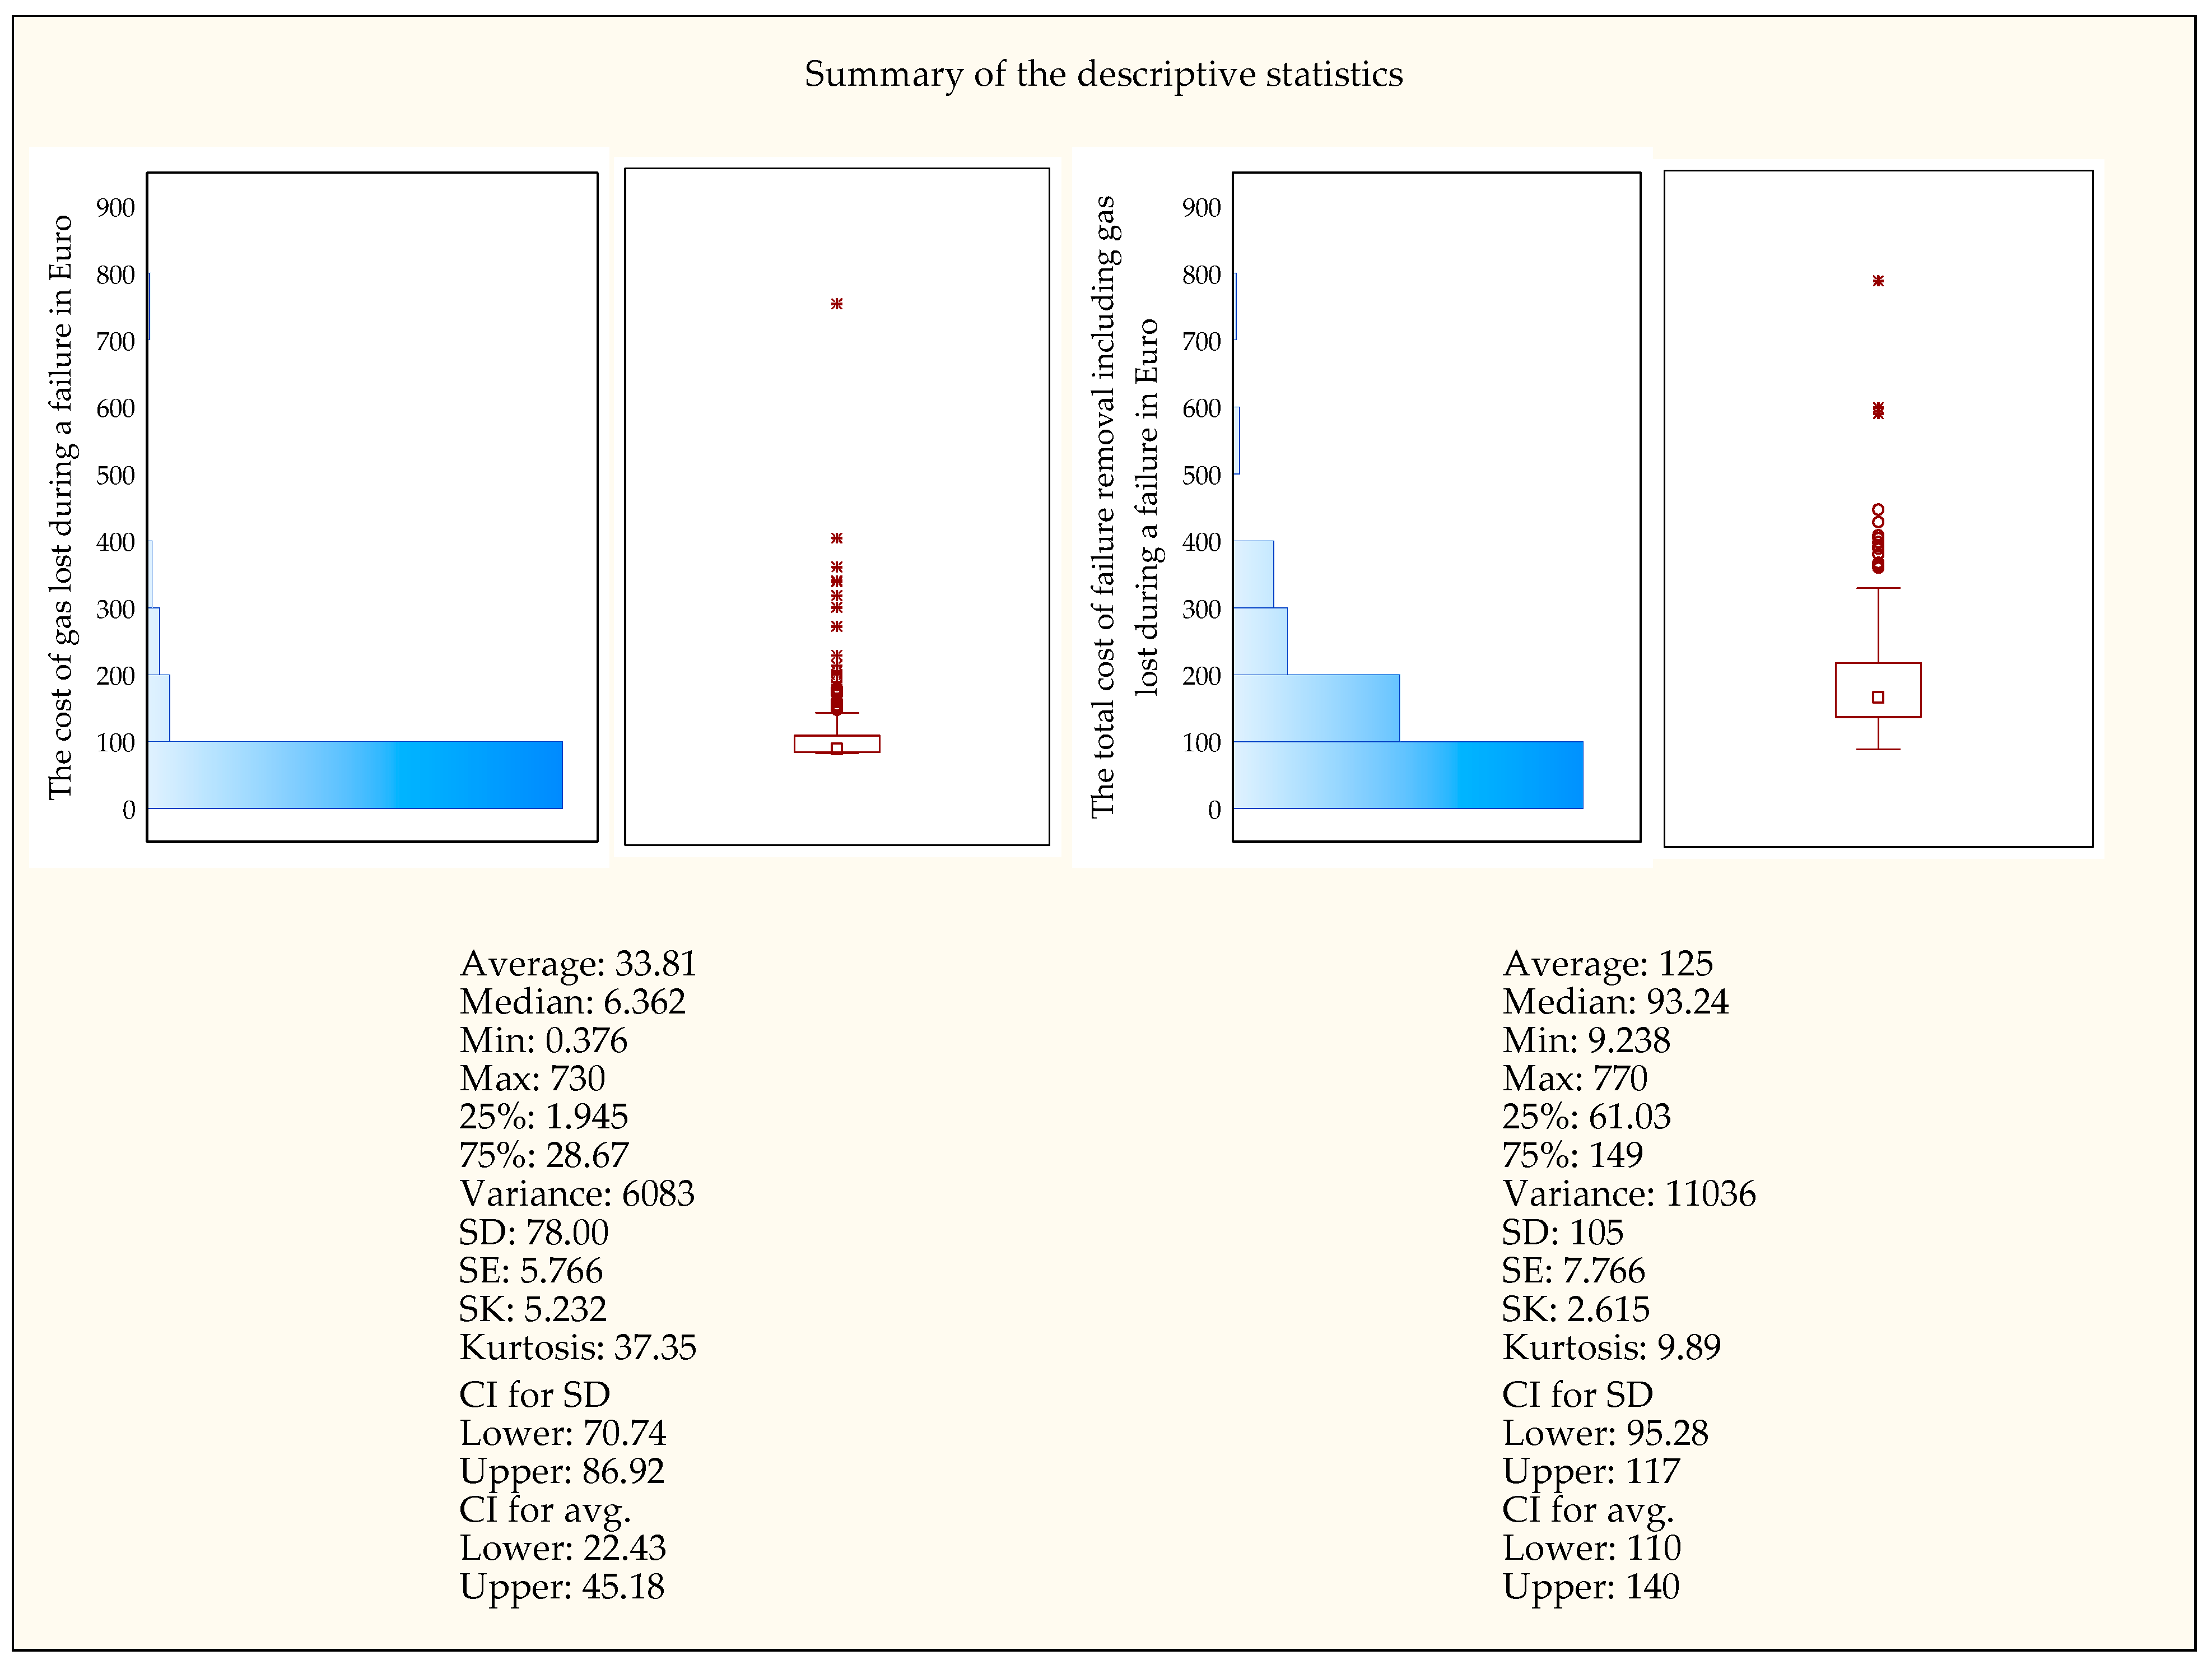
Lost gas relates directly related to the costs of putting right a failure. The cost of gas lost as a result of a failure is shown in Figure 2, as calculated in line with Equation (2).
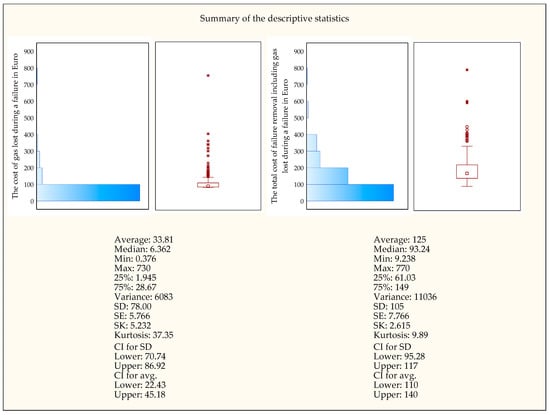
Figure 2.
Descriptive statistics regarding the cost of gas lost during a failure in Euros.
The total cost of a failure is seen to comprise the cost of lost gas (36%) and the cost of removing the failure (64%). Most gas-pipeline failures are caused by ongoing works in the vicinity. So to reduce the cost of failures, the number of failures should be reduced first and foremost. This in turn denotes that plans for gas pipelines should be developed and updated, as inaccurate plans quite often result in underground pipelines being damaged. Damage cost can be reduced where amounts of gas lost are curbed. This can be facilitated by appropriate training of employees whose work is of a kind that makes damaging gas pipelines very probable. An employee having received such training will have adequate knowledge on how to seal a damaged gas pipeline safely and quickly. This will definitely increase the level of safety, and reduce the amount of gas escaping.
3. Assessment of the Level of Integrated Risk to the Gas-Supply Subsystem Using the Risk Area Identification Method
Estimates of the risk level inherent in the subsystem involved in the distribution of natural gas should begin with the division of subsystem elements into groups of factors of the same type. The distinguished parameters involve the cooperation of designers, contractors and operators of the gas distribution network. The criteria were also based on the relevant cited literature. Experts’ opinions provide the opportunity of combining the experience, which allows taking into account all the most important factors affecting the risk values associated with failures in gas distribution networks. The method of doing this presented here entails assignment of the rank of a gas network to a group, as followed by assignment of a given weighting to the given factor. The integrated risk level r is then calculated using the formula:
where itgp is a coefficient depending on the type of gas pipeline, be this: Low-pressure (1), medium-pressure (2) or high-pressure (3); P is the coefficient determining the probability of occurrence of an failure event as (1) low—unlikely once in 10–50 years, (2) medium—quite likely once every 1–10 years, or (3) high—1–10 times a year or more often(3); and C is the effect of (loss induced by) the undesirable event.
where:
r = itgp·P·C
The effect of an undesirable event C is thus defined as: C = w·k·Σs
- w is a coefficient dependent on the gas leak:
- -
- No gas leak (with point weight 1);
- -
- A gas leak (with point weight 2).
- k is the location class for the gas pipeline according to the existing regulation concerning the technical conditions to be met by gas networks and their location:
- -
- First class of location—area with a shared residence and public utility buildings, single- or multi-family buildings, intensive vehicular traffic, and developed underground infrastructure, such as water supply, sewage, heating, gas, power and telecommunications, streets/roads, and mining areas (with point weight 3);
- -
- Second class of location—single-family and farm buildings, or developments with individual recreation buildings, as well as infrastructure necessary for them (with point weight 2);
- -
- Third class of location—an undeveloped area or an area where only single-family, farm and livestock buildings and the infrastructure necessary for them can be found (with point weight 1).
- s is a factor expressing the impact of the failure on the environment (s):
- -
- Little impact (with point weight 1);
- -
- Significant impact (with point weight 2);
- -
- Very significant impact (with point weight 3).
We can distinguish the following undesirable events connected with the functioning of a natural gas distribution subsystem:
- -
- Material ageing (compensator failure, leaks from fittings, pipe crack);
- -
- Improper performance (gas pipeline corrosion, pipe crack, formation of hydrates);
- -
- Material defect (compensator failure, leaks from fittings, pipe crack, gas pipeline corrosion);
- -
- Improper gas composition (gas pipeline corrosion, formation of hydrates, ice caps, false alarm);
- -
- Terrorist attack (pipe crack);
- -
- Investment works (pipe crack, false alarm);
- -
- Geological conditions (compensator failure, leaks from fittings, pipe crack).
The impact on the environment (s) can be distinguished as a result of a failure without a gas leak (w = 1), or with a gas leak (w = 2), as well as in relation to:
- -
- S1—the blocking of transport routes: Pipeline in non-urbanized areas (1), pipeline in pedestrian traffic, under pavements (2), or pipeline in the street (3),
- -
- S2—devastation of nature associated with the removal of the defect: Little or no impact, restitution time below 1 year, and the cost of restitution below 103 EUR (1); or local impact, restitution time over 1 year, and the cost of restitution over 103 EUR (2); and big, restitution time above 10 years, and the cost of restitution over 105 EUR (3),
- -
- S3—a break in the supply of thermal energy during heating season: Up to 4 h (1), from 4 to 6 h (2), or more than 6 h (3),
- -
- S4—devastation of infrastructure related to the removal of the defect: Financial loss of up to 103 EUR (1), financial loss from 103 to 104 EUR (2), or financial loss above 104 EUR (3),
- -
- S5—disturbed production processes in industrial plants: Financial loss of up to 103 EUR (1), financial loss from 103 to 104 EUR (2), or financial loss above 104 EUR (3),
- -
- S6—a break in the supply of electricity, up to 2 h (1), from 2 to 6 h (2), or more than 6 h (3),
- -
- S7—dissatisfaction on the part of individual recipients: No or incidental consumer complaints (1), numerous complaints and notifications in public media (2), broad information in local and national media (3).
Others effects associated only with an actual gas leak (w = 2):
- -
- S8—evacuation of residents: Evacuation of 100 inhabitants (1), evacuation of 101 to 300 inhabitants (2), or more than 301 residents evacuated (3);
- -
- S9—material losses caused by a gas explosion: Financial loss of up to 104 EUR (1), financial loss from 104 to 106 EUR (2), or financial loss above 106 EUR (3);
- -
- S10—losses of life and health caused by a gas explosion: Required medical assistance (1); required hospitalization (2); or fatal descent (3);
- -
- S11—toxic contamination due to the escape of gas: Local impact (1), national impact (2), or international impact (3),
- -
- S12—toxic contamination by combustion gases (gas explosion): Local impact (1), national impact (2), or international impact (3);
- -
- S13—contribution to the greenhouse effect: Negligible (1), significant (2), or critical (3).
After combining the probability and consequences categories, a risk matrix was obtained according to the Equations (3) and (4). The part of the obtained calculation was presented in the form of Table 1.

Table 1.
The part of the calculation of the risk matrix concerning risk the following risk levels: Insignificant risk (▆), controlled risk (▆), unacceptable level (▆).
The value of r obtained by performing the analysis helps with decision making, vis-à-vis the operation or modernization of a system. Overall, proposed integrated risk levels based on Equations (3) and (4) would be as follows:
- -
- In the case of an insignificant risk (also definable as tolerable) being obtained (r < 50), no further action is required and the system is being operated in a proper and reliable way;
- -
- A controlled risk (r from 51 to 115) means that the system is allowed to operate, but under the condition that modernization or repair work will be undertaken;
- -
- If risk at an unacceptable level has arisen (r above 116), immediate action will have to be taken to reduce this.
It should be noted, that the occurrence of losses related to death accidents should be considered as an unacceptable risk, independent of the final result obtained, and the transfer of the received risk to the unacceptable risk interval.
Application Example
The following threat characteristics related to network operation through investment works have been adopted, which causes pipe cracking. The probability of occurrence of an failure event was assumed as high.
A section of gas pipeline selected for analysis is characterized as follows:
- -
- Type depending on pressure—medium-pressure gas pipeline;
- -
- Gas pipeline material—PE (polyethylene);
- -
- Location—areas with single-family housing.
The characteristics of the gas network are then as summarized in Table 2.

Table 2.
Characteristics of the gas network under analysis concerning the effect of an undesirable event.
According to the adopted risk levels, for the r value = 720 the level of risk is at the unacceptable level. The estimation of the level of risk posed by the r should be supported by expert knowledge on the construction and design of gas pipelines, as well as the management of gas networks.
4. Network Failure Forecasting Through Regressions with Delay
To ascertain how important network failure forecasting might be, monthly occurrences over four years were taken account of.
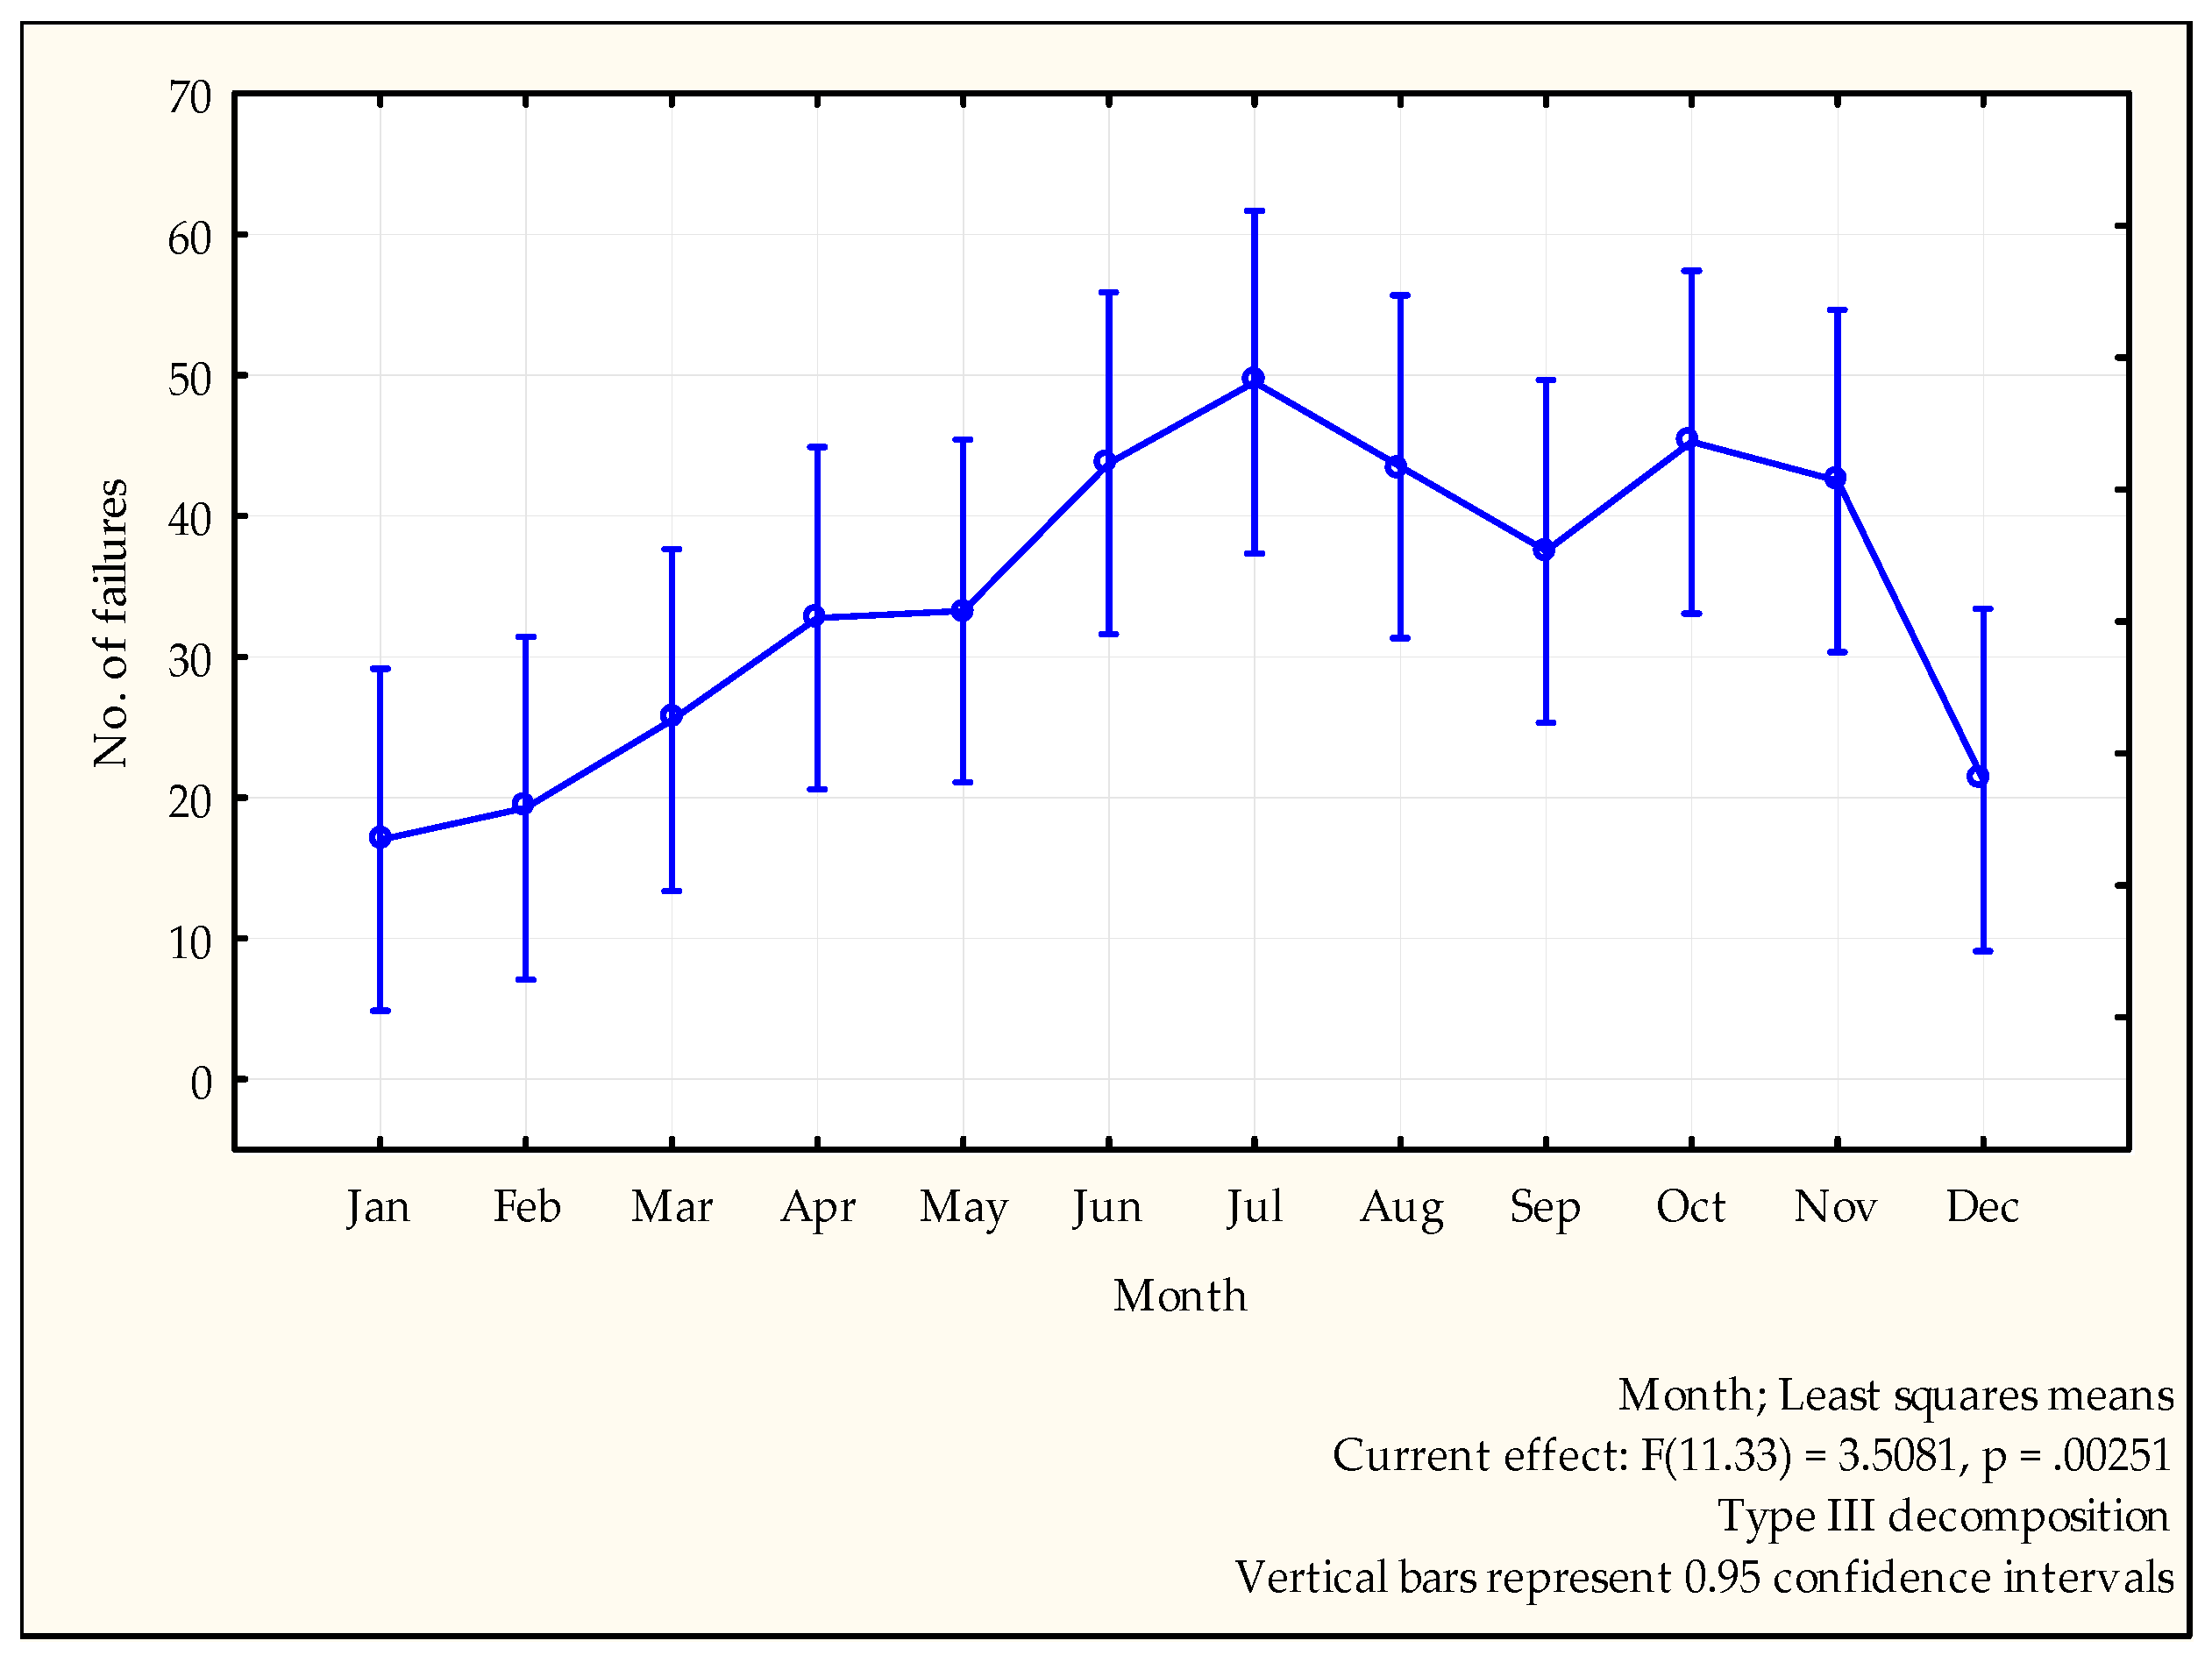
The first workspace is ANOVA, which shows that both years and months are important to the seasonality characterising network failures, as Figure 3 shows.
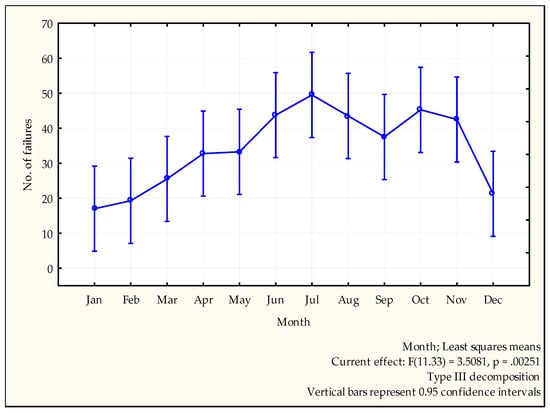
Figure 3.
Failure averages.
Analysis of the average values for failure in consecutive months shows that, in the three summer months culminating in July there is an increase in the incidence of failures that is clear and significant statistically (at p < 0.05).
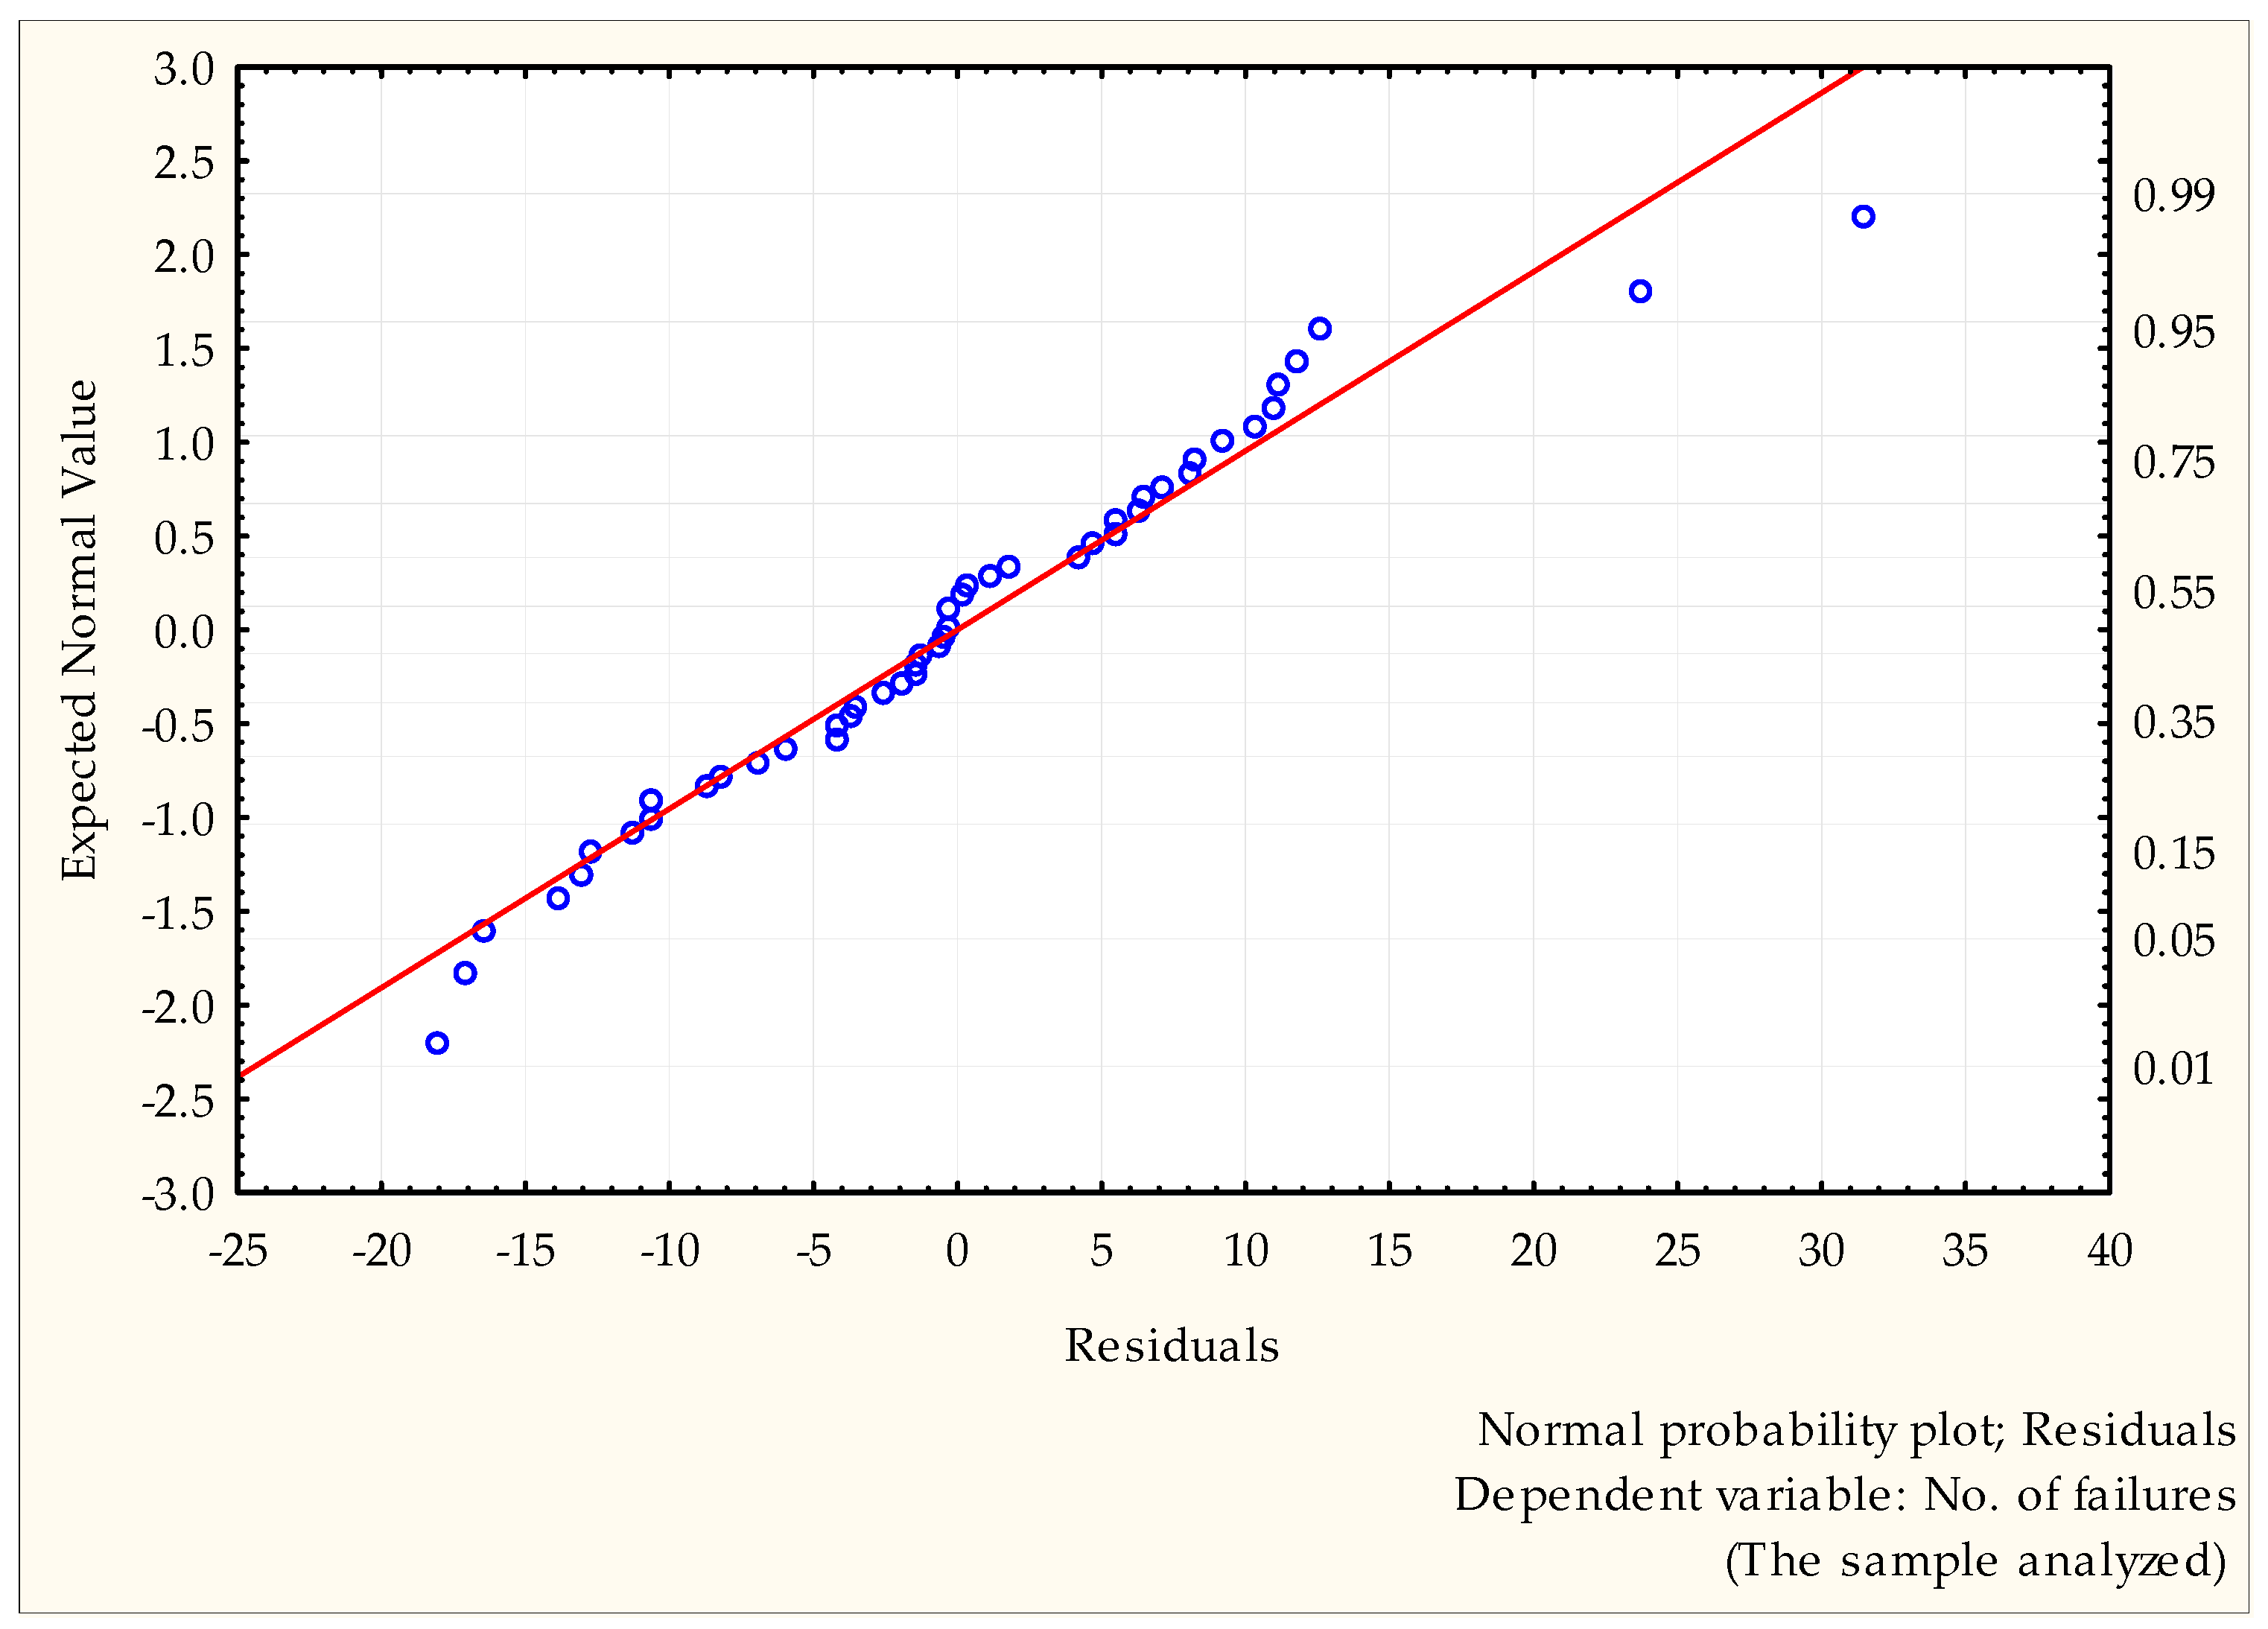
Prior to the running of further analysis and drawing of conclusions regarding the model, the basic assumptions underpinning the analysis of variance were checked, in line with the assumption of normality. This assessment was made using a normal probability plot (Figure 4). The appearance of the presented graph suggests that the assumption of normality has been met, as points are arranged along the crossed line.
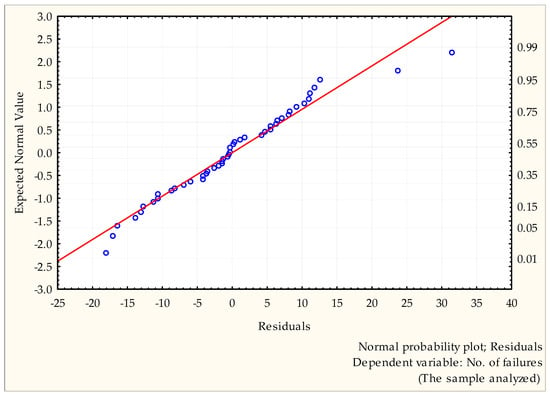
Figure 4.
Normal probability plot.
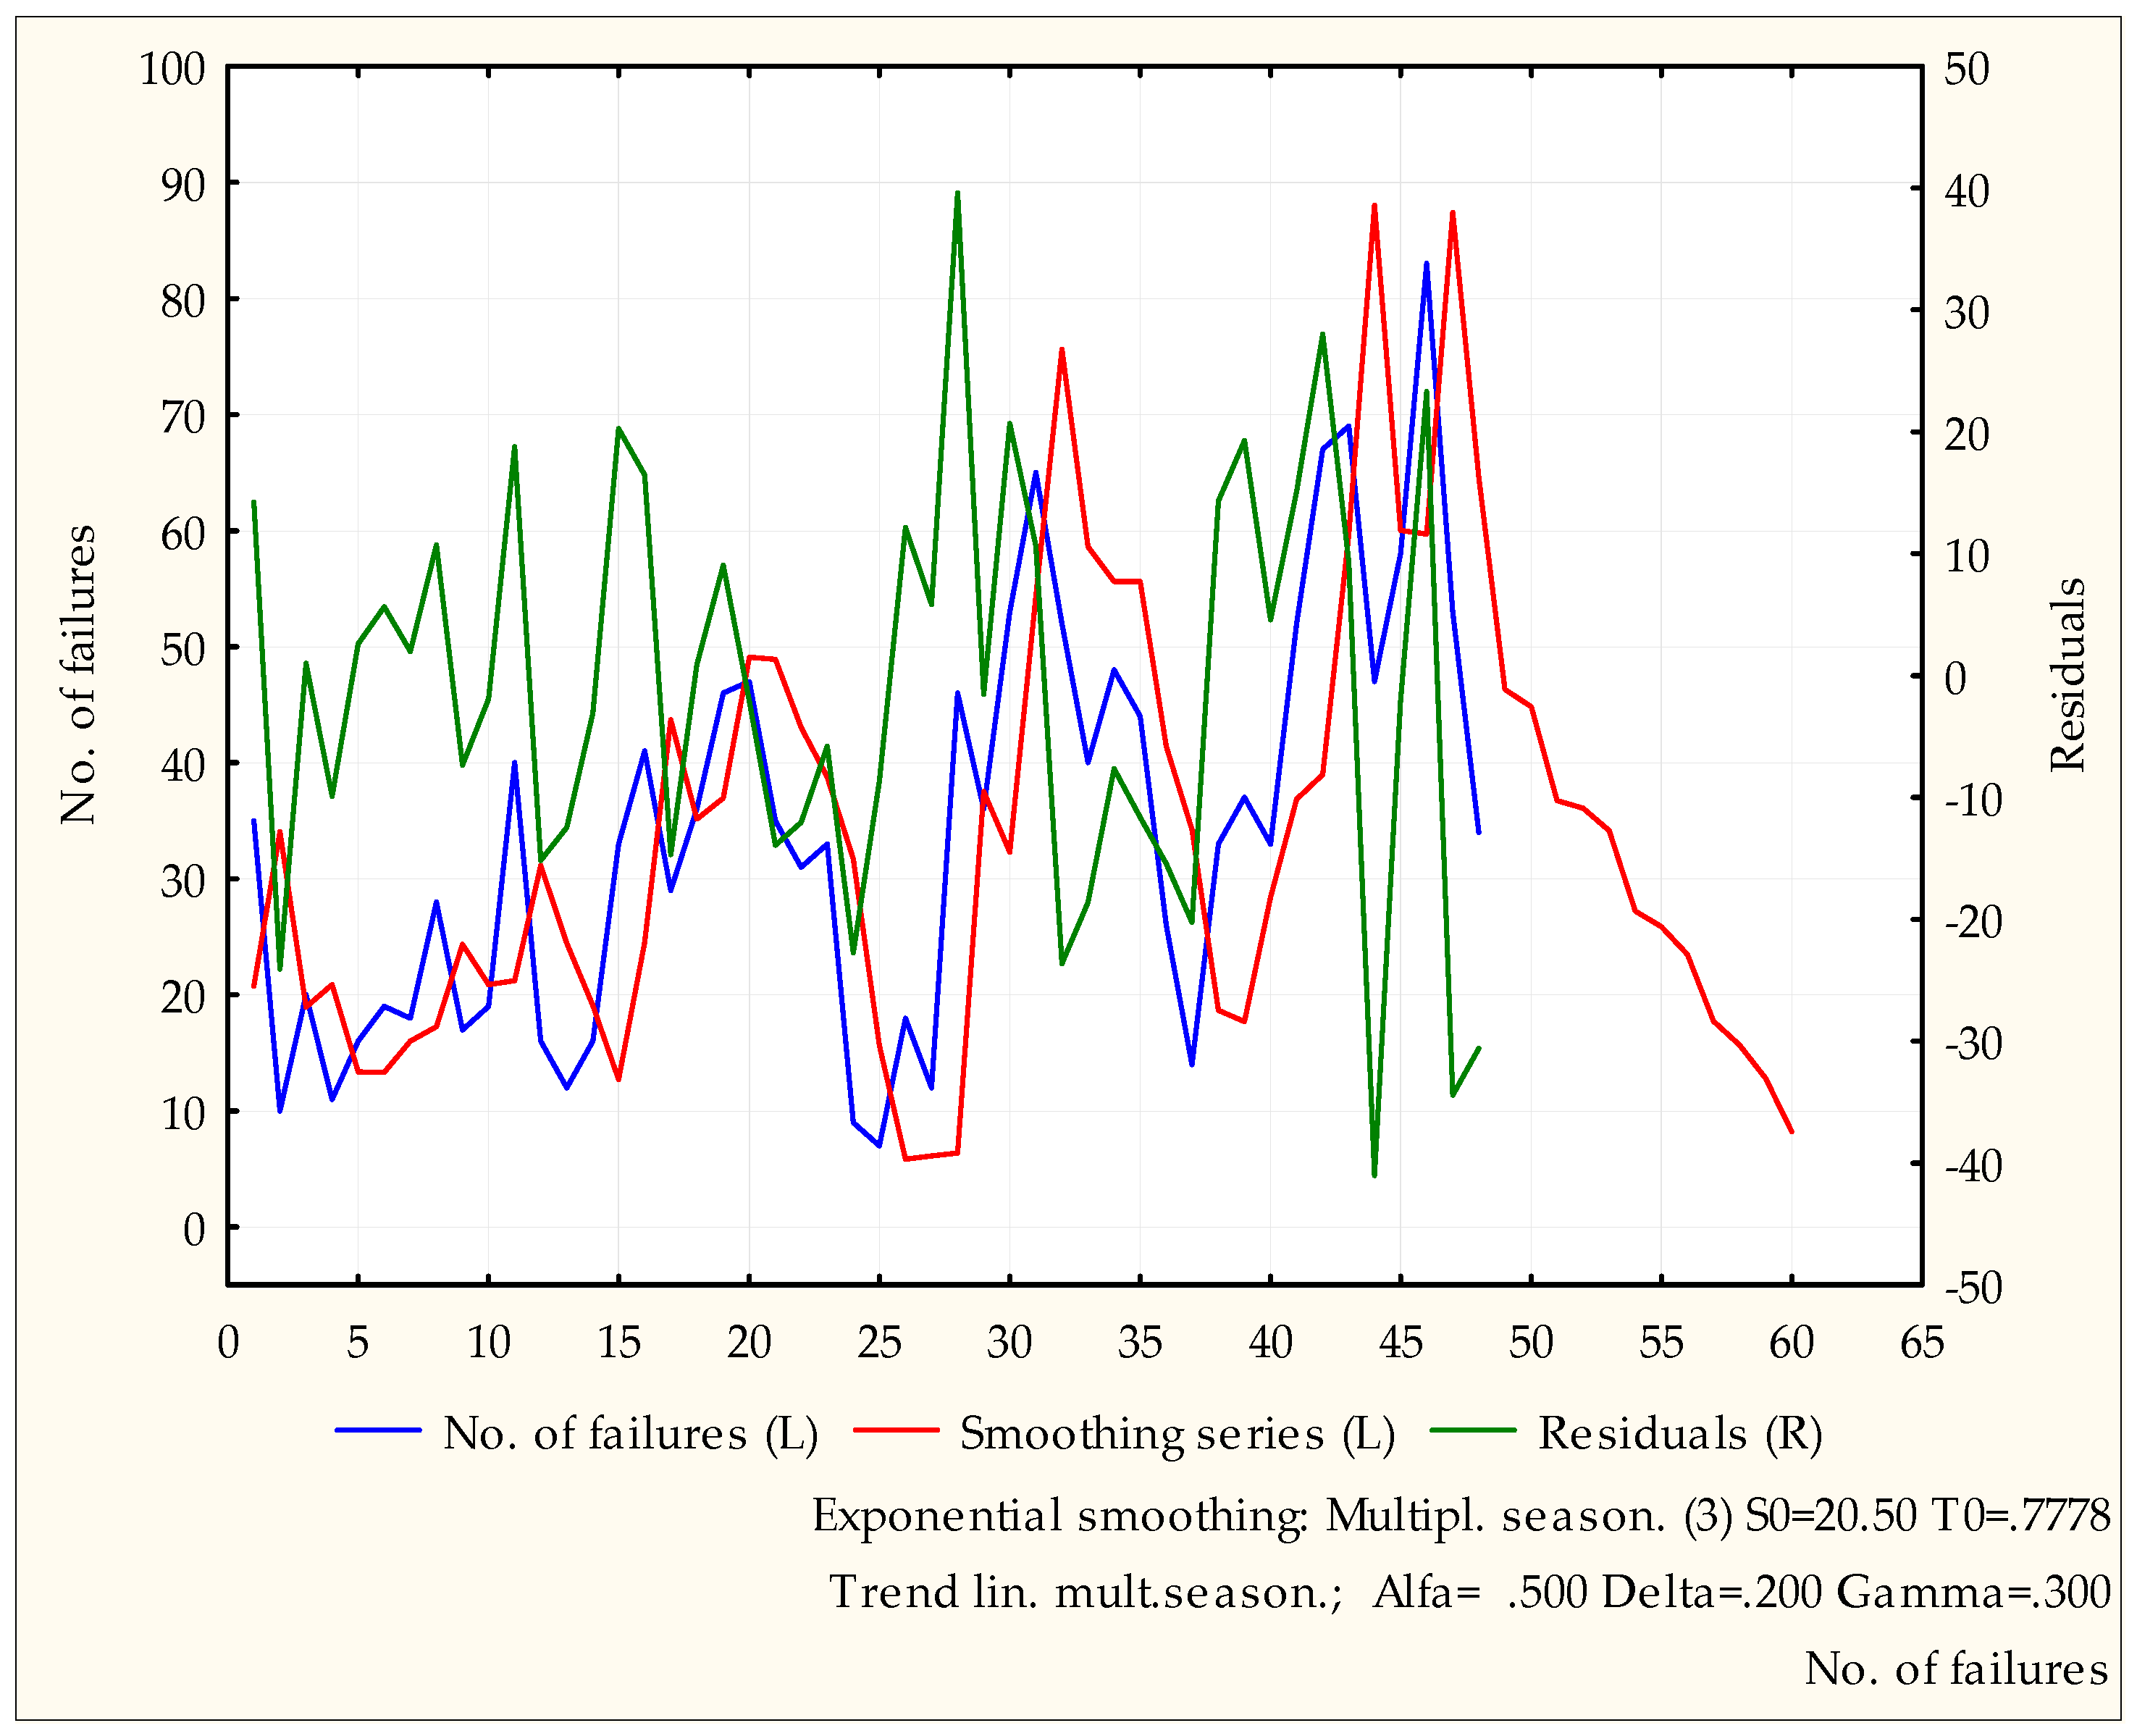
The model best-presenting a clear trend and increasing range of fluctuations over time entailed use of the model with a linear trend but multiplicative seasonal hesitantly; that is, a “combination” of the two versions (Figure 5), which can be described by the Equation (5). The explanation of the used dependences and variables are presented in the Appendix A.
where Xt is the observed series, t = 1, ..., n.
Xt = (b0 + b1t)It + εt
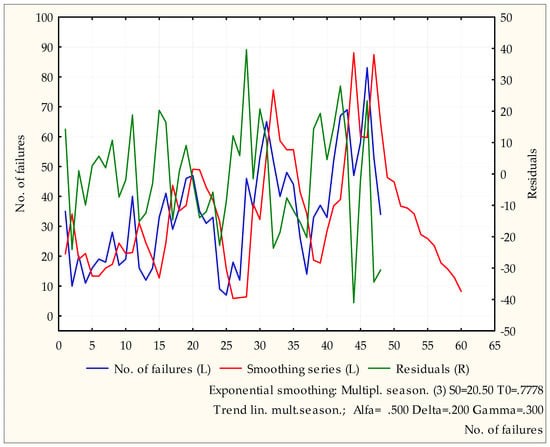
Figure 5.
Failure forecasting by exponential smoothing, with the trend and seasonality taken account of.
To produce a forecast for the next period, combinations of the last linear observation and previous forecast adjusted for seasonal fluctuations were made use of.
The formula was obtained from the least squares method. The logarithmic transformation of the dependent variable was used to obtain a better fit and meet the assumptions of the multiple regression model.
The presented model can be described by the following equation:
* Exp(0.41), taking into account seasonal adjustment for December and January when there are more failures every year
No. of failures = Exp(2.23 + 0.011 · no. of failures in the previous month + 0.019 · no. of months from beginning of the observation period + 0.41*)
The model is built for a logarithmic variable in forecasting, and is calculated on the basis of a linear trend over time. The delayed variable involving the number of failures in the previous month was included, because the data showed strong first-order autocorrelation. For such a case, the December–January variable was added—that necessitating a value of 1 for those months, as opposed to 0 in remaining months. In those months a clear increase in the number of failures could be seen, which was not explained by the other variables in the model.
5. Conclusions and Perspectives
In operational practice, gas networks are subject to various kinds of damage. Elements are exposed to various random factors while in operation. As the process of their exploitation includes work, downtime, service, and repair, the complex nature of the process is made clear. The work done in this paper has thus sought to achieve certain simplifications, in order to better illustrate the possibilities for Markov processes to be used in evaluating the operation of a gas net-work. National and global legal regulations require the adaptation and development of research methods relating to the safety of the gas supply. The terms safety and risk, made common use of in various aspects of everyday gasworks practice, are significant. All would seek to espouse a firm belief regarding the absence of risk, and the idea that effective controls against risk are in place. This then constitutes a challenge for science and technology, especially in the face of undesirable events that prove to be out of the ordinary, as well as terrorist threats of an unprecedented nature. In this sense, conclusions drawn from the history of individual failures offer signposting where active risk management is concerned. It becomes important for risk-reduction procedures and decision-support tools to be developed, on the basis of risk analyses and assessments that accompany the actual functioning of a gas network, and that also take account of sustainable development principles.
In practice, we are living in times in which gas networks are continuing to increase in length, with that almost inevitably denoting increases in incidences of failure. This leaves fully justified efforts to develop new research methods that will allow for determinations of potential risks along given sections of gas networks. Developed studies supported by experience and expert knowledge constitute more-effective methods of monitoring gas networks, and seeking to protect them against failure. The method proposed here is an alternative to others that assess and manage failure of gas pipe networks.
The considerations presented here in the process may constitute a basis for further research, proving helpful in a process of risk management that should start by determining priority problems, with the next step then being the formulation of management principles. Technical solutions adopted should then be optimized from the point of view of effects anticipated and sums invested. The chosen solution should be implemented, and its functioning monitored to provide for verification of the method, as well as the determination of limitations on risk that have been achieved.
The gas companies supervising gas networks should be in a position to estimate risk, to inform users of the magnitude thereof, to take appropriate actions to minimize risk and to initiate actions imperative where incidents actually arise. The risk analysis may also prove useful in the planning of preventive measures seeking to ensure that damage does not arise, as well as in the development of emergency scenarios.
Author Contributions
All authors equal contributed to the manuscript.
Funding
This research was funded by Faculty of Civil and Environmental Engineering and Architecture, Rzeszow University of Technology, 35-959 Rzeszow, Poland.
Acknowledgments
We thank the reviewers for their feedback, what helped to improve the manuscript quality.
Conflicts of Interest
The authors declare no conflict of interest.
Appendix A
For initial value for trend:
where ml is the mean for the/th cycle , p is the number of periods in one seasonal cycle, k is the number of complete cycles ([n/p]), and the initial value for series is:
then:
where et is tth residual (Xt − t−1).
St = St−1 + Tt−1 + α(et/It−p)
Tt = Tt−1 + αγ(et/It−p)
For initial values for seasonal factors I1−p, ..., I0:
It = It−p + δ(1−α)(et/St)
For forecast of one period ahead from time t:
where α, γ, δ are the model parameters that have been determined by the grid search method to obtain the best fit of the smoothed to real data.
References
- Kent Muhlbauer, W. Pipeline Risk Management; Gulf Publishing Company: London, UK, 1992. [Google Scholar]
- Lu, W.; Su, M.; Fath, B.D. A systematic method of evaluation of the Chinese natural gas supply security. Appl. Energy 2016, 165, 858–867. [Google Scholar] [CrossRef]
- Shalaby, H.M.; Riad, W.T.; Alhazza, A.A.; Behbehani, M.H. Failure analysis of fuel supply pipeline. Eng. Fail. Anal. 2006, 13, 789–796. [Google Scholar] [CrossRef]
- Dröge, M.T.; Kenter, R. European Gas Pipeline Incident Data Group (EGIG). In 9th Reports of the European Gas Pipeline Incident Data Group (Period 1970–2013); Doc. No EGIG 14.R.0403; European Gas Pipeline Incident Data Group (EGIG): Amsterdam, The Netherlands, 2015; Available online: https://www.egig.eu/startpagina/$61/$156 (accessed on 12 June 2019).
- Dieckhoener, C.; Lochner, S.; Lindenberger, D. Simulating the Effects of European Natural Gas Infrastructure Developments. Oil Gas-Eur. Mag. 2010, 36, 174–185. [Google Scholar]
- Tchórzewska-Cieślak, B.; Pietrucha-Urbanik, K.; Urbanik, M.; Rak, J.R. Approaches for Safety Analysis of Gas-Pipeline Functionality in Terms of Failure Occurrence: A Case Study. Energies 2018, 11, 1589. [Google Scholar] [CrossRef]
- Marcogaz—Technical Association of the European Natural Gas Industry; Report on European Gas Safety; Gas Distribution (EGAS B): Brussels, Belgium, 2017.
- Montiel, H.; Vilchez, J.A.; Amaldos, J.; Casal, J. Historical analysis of accidents in the transportation of natural gas. J. Hazard. Mater. 1996, 51, 77–92. [Google Scholar] [CrossRef]
- Bianchini, A.; Guzzini, A.; Pellegrini, M.; Saccani, C. Natural gas distribution system: A statistical analysis of accidents data. Int. J. Press. Vessel. Pip. 2018, 168, 24–38. [Google Scholar] [CrossRef]
- Giovanni Ramírez-Camacho, J.; Carbone, F.; Pastor, E.; Bubbico, R.; Casal, J. Assessing the consequences of pipeline accidents to support land-use planning. Saf. Sci. 2017, 97, 34–42. [Google Scholar] [CrossRef]
- Hemmatian, B.; Abdolhamidzadeh, B.; Darbra, R.M.; Casal, J. The significance of domino effect in chemical accidents. J. Loss Prev. Process Ind. 2014, 29, 30–38. [Google Scholar] [CrossRef]
- Chmielowski, K.; Bugajski, P.; Maziarz, J. Analysis of failure events occurring in the gas networks based on the example of the Gas Company in Jasło. Gas Water San. Tech. 2017, 4, 136–139. [Google Scholar]
- Brown, N.; Crate, J.M. Analysis of a failure in a polyethylene gas pipe caused by squeeze off resulting in an explosion. J. Fail. Anal. Prev. 2012, 12, 30–36. [Google Scholar] [CrossRef]
- Wilmott, M.J.; Diakow, D.A. Factors influencing stress corrosion cracking of gas transmission pipelines: Detailed studies following a pipeline failure. Part 2: Pipe metallurgy and mechanical testing. Proc. Int. Pipeline Conf. 2016, 1, 573–585. [Google Scholar]
- Mazur, R.; Bedla, D.; Chmielowski, K.; Nowak, A.; Mazurkiewicz, J. The effect of oxygen condition on effectiveness of sewage treatment in submersible technology of nonwoven filters. Przem. Chem. 2016, 95, 1513–1517. [Google Scholar]
- Directive 2009/73/EC of the European Parliament and of the Council of 13 July 2009 Concerning Common Rules for the Internal Market in Natural Gas and Repealing Directive 2003/55/EC. Available online: https://eur-lex.europa.eu/legal-content/EN/ALL/?uri=CELEX%3A32009L0073 (accessed on 12 May 2018).
- Matvienko, A.F.; Filippov, Y.I.; Sagaradze, V.V.; Pecherkina, N.L.; Baldin, A.V.; Grigor’ev, P.A. Stress-corrosion cracking of steels for gas-main pipelines: III. Failure of pipes in the heat-affected zone. Phys. Met. Metallogr. 2000, 90, 309–317. [Google Scholar]
- Mohsin, R.; Majid, Z.A. Erosive failure of natural gas pipes. J. Pipeline Syst. Eng. 2014, 5, 818–837. [Google Scholar] [CrossRef]
- Urbanik, M.; Tchórzewska-Cieślak, B. Approach to the Determination of Failure Risk Level Index on the Example of the Natural Gas Distribution Subsystem. JCEEA 2017, 64, 305–312. [Google Scholar]
- Biresselioglu, M.E.; Yelkenci, T.; Oz, I.O. Investigating the natural gas supply security: A new perspective. Energy 2015, 80, 168–176. [Google Scholar] [CrossRef]
- Xiangpeng, L.; Shunli, L.; Jianfeng, S.; Xiang, L.; Jinyang, Z. Numerical simulation of strength failure of buried polyethylene pipe under foundation settlement. Eng. Fail. Anal. 2015, 48, 144–152. [Google Scholar] [CrossRef]
- Ondrejka Harbulakova, V.; Zelenakova, M.; Purcz, P. Selection of the Best Alternative of Heating System by Environmental Impact Assessment-Case Study. Envirionments 2018, 2, 19. [Google Scholar] [CrossRef]
- Fernandes, M.P.; Viegas, J.L.; Vieira, S.M. Segmentation of Residential Gas Consumers Using Clustering Analysis. Energies 2017, 10, 2047. [Google Scholar] [CrossRef]
- Ondrejka Harbulakova, V.; Estokova, A.; Kovalcikova, M. Correlation Analysis between Different Types of Corrosion of Concrete Containing Sulfate Resisting Cement. Environments 2017, 4, 44. [Google Scholar] [CrossRef]
- Tchorzewska-Cieslak, B. Estimating the acceptance of bearing the cost of the risks associated with the management of water supply system. Ochr. Srod. 2007, 29, 69–72. [Google Scholar]
- Tchórzewska-Cieślak, B. Water supply system reliability management. Env. Prot. Eng. 2009, 35, 29–35. [Google Scholar]
- Mohsin, R.; Majid, Z.A.; Yusof, M.Z. Multiple failures of API 5L X42 natural gas pipe: Experimental and computational analysis. Eng. Fail. Anal. 2013, 34, 10–23. [Google Scholar] [CrossRef]
- Urbanik, M.; Tchórzewska-Cieślak, B. Ecological aspects of the natural gas use. JCEEA 2015, 62, 409–417. [Google Scholar] [CrossRef]
- Hao, Y.-M.; Zhang, C.-S.; Shao, H.; Wang, M.-T. Baye network quantitative risk analysis for failure of natural gas pipelines. J. Northeast. Univ. 2011, 32, 321–325. [Google Scholar]
- Kuliczkowska, E. Analysis of defects with a proposal of the method of establishing structural failure probability categories for concrete sewers. Arch. Civ. Mech. Eng. 2015, 4, 1078–1084. [Google Scholar] [CrossRef]
- Krolikowska, J.; Debowska, B.; Krolikowski, A. An evaluation of potential losses associated with the loss of vacuum sewerage system reliability. Environ. Eng. 2013, 4, 51–57. [Google Scholar] [CrossRef]
- Kowalski, D.; Kowalska, B.; Kwietniewski, M. Monitoring of water distribution system effectiveness using fractal geometry. Bull. Pol. Acad. Sci. 2015, 63, 155–161. [Google Scholar] [CrossRef]
- Pluvinage, G.; Capelle, J.; Schmitt, C.; Mouwakeh, M. Domain failure assessment diagrams for defect assessment of gas pipes. In Proceedings of the 19th European Conference on Fracture: Fracture Mechanics for Durability, Reliability and Safety, Kazan, Russia, 26–31 August 2012. [Google Scholar]
- Rak, J.; Tchórzewska-Cieślak, B. The Possible Use of the FMEA Method to Ensure Health Safety of Municipal Water. J. Konbin 2010, 3, 143–154. [Google Scholar] [CrossRef]
- Potocnik, P.; Govekar, E.; Grabec, I. Short-term natural gas consumption forecasting. In Proceedings of the 16th Iasted International Conference on Applied Simulation and Modelling, Palma de Mallorca, Spain, 29–31 August 2007; pp. 353–357. [Google Scholar]
- Tchórzewska-Cieślak, B. Method of assessing of risk of failure in water supply system. European safety and reliability conference (ESREL), Risk, reliability and societal safety. Taylor Francis 2007, 2, 1535–1539. [Google Scholar]
- International Association of Oil & Gas Producers (OGP). Operating Management System Framework for Controlling Risk and Delivering High Performance in the Oil and Gas Industry; International Association of Oil & Gas Producers (OGP): London, UK, 2014. [Google Scholar]
- Martini, A.; Troncossi, M.; Rivola, A. Automatic Leak Detection in Buried Plastic Pipes of Water Supply Networks by Means of Vibration Measurements. Shock Vib. 2015, 2015, 165304. [Google Scholar] [CrossRef]
- Bajer, J. Economical and reliability criterion for the optimization of the water supply pumping stations designs. Env. Eng. 2013, 4, 21–28. [Google Scholar] [CrossRef]
- Polaskova, K.; Hlavinek, P.; Haloun, R. Integrated approach for protection of an urban catchment area. Desalination 2006, 1, 51–59. [Google Scholar] [CrossRef]
- Martini, A.; Troncossi, M.; Rivola, A. Leak Detection in Water-Filled Small-Diameter Polyethylene Pipes by Means of Acoustic Emission Measurements. Appl. Sci. 2017, 7, 2. [Google Scholar] [CrossRef]
- Jedlikowski, A.; Anisimov, S.; Danielewicz, J.; Karpuk, M.; Pandelidis, D. Frost formation and freeze protection with bypass for counter-flow recuperators. Int. J. Heat Mass Transf. 2017, 108, 585–613. [Google Scholar] [CrossRef]
- Piegdon, I.; Tchorzewska-Cieslak, B.; Szpak, D. The use of geographical information system in the analysis of risk of failure of water supply network. Environ. Eng. 2017, 5, 7–16. [Google Scholar]
- Rak, J.; Boryczko, K. Assessment of water supply diversification using the Pielou index. Environ. Eng. 2017, 5, 53–58. [Google Scholar]
- StatSoft, Inc. STATISTICA (Data Analysis Software System). Version 12. 2014. Available online: www.statsoft.com (accessed on 12 June 2019).
- IBM Knowledge Center. Approaches to Algorithms. Available online: https://www.ibm.com (accessed on 12 June 2019).
- Majid, Z.A.; Mohsin, R.; Yaacob, Z.; Hassan, Z. Failure analysis of natural gas pipes. Eng. Fail. Anal. 2010, 17, 818–837. [Google Scholar] [CrossRef]
- Majid, Z.A.; Mohsin, R.; Yusof, M.Z. Experimental and computational failure analysis of natural gas pipe. Eng. Fail. Anal. 2012, 19, 32–42. [Google Scholar] [CrossRef]
- Regulation of the Minister of Economy of 26 April 2013 on technical conditions to be met by gas networks and their location, OJ 2013, item 640. Available online: http://prawo.sejm.gov.pl/isap.nsf/download.xsp/WDU20130000640/O/D20130640.pdf (accessed on 12 June 2019).
© 2019 by the authors. Licensee MDPI, Basel, Switzerland. This article is an open access article distributed under the terms and conditions of the Creative Commons Attribution (CC BY) license (http://creativecommons.org/licenses/by/4.0/).

