Article

Impact of Electrical Topology, Capacity Factor and Line Length on Economic Performance of Offshore Wind Investments

1
Department of Technology, University of Northern Iowa, Cedar Falls, IA 50614, USA
2
Marine and Renewable Energy Centre, University College Cork, P43 C573 Cork, Ireland
3
Department of Engineering Technology and Construction Management, University of North Carolina at Charlotte, Charlotte, NC 28223, USA
*
Authors to whom correspondence should be addressed.
These authors contributed equally to this work.
Energies 2019, 12(16), 3191; https://doi.org/10.3390/en12163191
Submission received: 10 July 2019 / Revised: 12 August 2019 / Accepted: 16 August 2019 / Published: 20 August 2019
(This article belongs to the Special Issue Renewable Energy in Marine Environment)

Abstract

:
In this study, an economic performance assessment of offshore wind investments is investigated through electrical topology, capacity factor and line length. First, annual energy yield production and electrical system losses for AC and DC offshore wind configurations are estimated by using Weibull probability distributions of wind speed. A cost model for calculating core energy economic metrics for offshore wind environment is developed by using a discount cash flow analysis. A case study is then conducted for a projected offshore wind farm (OWF) rated 100 MW and 300 MW sizes situated in the Aegean sea. Finally, a sensitivity analysis is performed for AC and DC OWFs with three different capacity factors (e.g., 45%, 55% and 60%) and various transmission line lengths ranging from 20 km to 120 km. The OWF is found to be economically viable for both AC and DC configurations with the estimated levelized cost of electricity (LCOE) ranging from 88.34 $/MWh to 113.76 $/MWh and from 97.61 $/MWh to 126.60 $/MWh, respectively. LCOEs for both options slightly change even though the wind farm size was increased three-fold. The sensitivity analysis reveals that, for further offshore locations with higher capacity factors, the superiority of AC configuration over the DC option in terms of LCOE reduces while the advantage of DC configuration over the AC option in terms of electrical losses is significant. Losses in the AC and DC configurations range from 3.75% to 5.86% and 3.75% to 5.34%, respectively, while LCOEs vary between 59.90 $/MWh and 113.76 $/MWh for the AC configuration and 66.21 $/MWh and 124.15 $/MWh for the DC configuration. Capacity factor was found to be more sensitive in LCOE estimation compared to transmission line length while line length is more sensitive in losses estimation compared to capacity factor.

1. Introduction

Technological developments and changes in lifestyles have driven significantly the increase in energy usage worldwide. Global energy consumption increased by 48.3% from 2002 to 2018 [1]. The use of energy is predicted to rise by 28% by 2040 [2]. Accordingly, global electrical energy use is expected to increase by 58% in the next two decades as well. The increase in electrical energy use contributes to CO 2 emissions and creates environmental concerns. Over the past two decades, renewable energy resources have provided alternatives for energy generation, specifically on electrical energy through solar and wind energy utilizations. The share of renewables for electrical energy generation reached 26% in 2018 [2]. Among the renewable energy resources, excluding conventional hydropower, wind energy has the highest share in terms of installed capacity [3]. Global installed wind power capacity has increased about 30 fold from 2000 to 2017, reaching a cumulative capacity of 591 GW at the end of 2018 [4]. Having higher wind energy potential due to less friction on water surfaces makes offshore wind farms more favorable over their onshore counterparts [5]. The global installed offshore wind power capacity has increased from 4177 MW to 23,140 MW from 2011 to 2018 [6]. The installed capacity of 4.5 GW in 2018 has broken the records on increase in a single year. The fast growth in the offshore wind sector deserves special attention with regard to technical, economical and efficient electric power delivery. From an economical point of view, the cost of offshore systems is higher [7] and varies from project to project since the cost of offshore installations is extremely dependent on their site conditions and location as opposed to their on-shore counterparts [8]. To maintain the offshore market growth given the expected increase in turbine sizes and efficiency, cost-effective solutions for the offshore wind energy sector need to be explored.
An offshore wind farm (OWF) configuration typically consists of collection and transmission systems at medium and high voltages, respectively, including an offshore and/or onshore substation. Most of the current offshore wind farms are all alternating current (AC) systems both at collection and transmission systems. Considering the 20% share of transmission system cost over the total cost figure, alternative solutions may reduce the overall cost [9]. One of the growing alternatives for delivering the generated wind power is using high voltage direct current (HVDC) instead of high voltage alternating current (HVAC) for the transmission system since situated further offshore distances started to become more common [10] and HVDC provides benefits over HVAC for longer distances. Even though less charging current occurs over the HVDC cables [11], the total system losses can be higher due to the additional losses associated with the power electronics components of OWFs [12]. Another alternative transmission that appeared is low frequency AC (LFAC) offshore wind systems, which are found to be more costly than their HVAC and HVDC counterparts for longer distances from the coast [13]. Among three alternatives of power transmission, HVDC becomes more attractive over LFAC and HVAC systems due to the higher transmission line losses and costs associated with the AC systems for far further situated offshore locations. While implementing the HVDC system to overcome these challenges, its economical performance assessment needs to be carefully studied [11]. Medium voltage collection system design starts with the micro sitting of wind turbines using optimization methods that consider many parameters such as wind direction and wake effect [14]. As for a high voltage transmission system, DC topology for collection system is being discussed to be an alternative to AC collection system as it may reduce cable losses and costs. The improvement in DC control and protection device technology also will make the DC collection system more attractive over AC collection in which the control and protection devices are well established and used [15]. Currently, there are no OWF with DC collection systems but a few prototypes are being investigated [15,16]. A detailed cost analysis is therefore needed for both complete AC and DC collection and transmission systems since the cost depends on various parameters such as rated power, wind capacity factor, losses, distance from the shore and so forth [5,12].
The cost of the above-mentioned alternative transmission systems is studied to better shape the future direction of OWF configurations. The economic benefits of various offshore network configurations, including HVAC and HVDC, for the coordinated development of interconnection energy flow are presented in Reference [10]. A comparison of incremental operational and investment costs is examined through a cost model using Monte Carlo approach. Results suggest that coordinated multi-terminal HVDC grid with H-grid configuration could offer operational benefits compared to radial connection. However, under certain circumstances the benefits may be reduced. The study is limited with considering only transmission system and focuses more on the interconnection of different configurations. A cost model for HVAC and HVDC cost comparison was redesigned in Reference [12] considering the losses. It is shown that OWFs installed in a larger size and situated further offshore result in reduced costs for HVDC transmission [17]. Xiangyu et. al in Reference [18] presented a techno-economic analysis of voltage source converter (VSC) based HVDC and HVAC transmission systems for OWFs. They showed that the VSC based HVDC is superior in terms of both economic and technical benefits over the HVAC while the latter includes higher electrical losses. A detailed cost-benefit analysis and power loss calculations were performed for HVAC and several HVDC configurations in Reference [11]. It was found that a critical transmission distance of 85 km makes the VSC based HVDC more economical. A cost analysis for three transmission systems (i.e., HVAC. HVDC, LFAC) is presented in Reference [19]. Results indicated that LFAC may become the cost effective option for shorter distances while HVDC is the most cost effective for longer transmission distances. Similar results are presented in Reference [13] in which the LFAC is found to be more competitive at medium distances between 50–200 km from shore compared to its HVDC counterpart. Instead of delivering power from offshore through HVDC, it is even considered to energize offshore oil industry platforms from an onshore power grid [20]. It is proved that receiving electrical energy through a HVDC transmission to offshore platforms can be more economical comparing to local diesel-fired electricity generation. Techno-economic comparison of HVDC and HVAC is presented in Reference [21]. A wind farm rated 300 MW is used for comparison of different wind turbine topologies, power losses, grid requirements and black start capacity of the two topologies. Results show that the break-even distance of the two systems is found to be 80 km and depends upon the wind turbine technology used, the economic superiority of one over another may be different. An economic comparison of HVAC and HVDC topologies for OWFs at varying rated power from 250 MW to 1500 MW in Great Britain is presented in Reference [22]. Unlike the previous literature, the results show that the break-even cost of the two systems can be only achieved for higher wind farm scales with further offshore locations (i.e., a rated power of 500 MW and a transmission line of 160 km). However, the impact of the collection system on the cost calculations is not considered. Technical and economic comparison of HVAC and HVDC, along with the HVDC market size and high-level comparison of HVDC system components, are presented in Reference [23]. It is concluded that HVDC transmission is beginning to dominate the market and multi-terminal DC networks are expected to play a significant role in the future. The economic analysis in this study is not presented in detail and mainly considers the comparison of some existing or case studies.
While the above-mentioned studies focus on the transmission system, few studies have presented the DC collection system for OWF [15,24]. Possible designs, topologies, converter types and platform configurations are given to provide an inside for the possible usage of DC collection systems together with the HVDC transmission [15]. In Reference [24], a new converter topology was proposed to decrease losses within the DC collection system as an alternative to AC topology. The study in Reference [25] presents a cost assessment for the collection system of an OWF. Since the collection system voltage level is not as high as that of transmission system, the AC and DC configurations may have different relations in terms of cost. The length of the collection system considered is very short. The comparison for overall cost and losses shows that the DC collection system has higher costs and losses compared to the AC collection counterpart. However, as the difference is found to be much less, a detailed cost and loss analysis is still needed for different OWF electrical topologies with practical offshore distances. Reference [16] focuses on a collection system with traditional AC and various DC configurations that are both connected to a power system through a HVDC transmission line. Results concluded that DC configuration for larger scale OWFs may not be economically feasible compared to AC systems due to the DC/DC converters’ size. Another study on optimizing OWF design and reducing cost is presented in Reference [26], in which different turbine foundations, AC collection and HVDC transmission for OWFs are considered in a sensitivity analysis. Results suggest that the cost factors mainly vary with the turbine size.
The feasibility of offshore wind investments requires a comprehensive analysis of possible electrical topologies in terms of loss and cost perspectives in a decision making process. HVDC transmission systems have been heavily investigated in search of a viable OWF for further offshore installations. However, the use of DC topology for a medium voltage collection system together with HVDC can bring a new approach to future OWFs for economic viability. This paper, therefore, presents a detailed techno-economic analysis for conventional all AC and emerging all DC OWF configurations. Radial AC and DC OWF topologies are proposed. Considering the Weibull probability distribution function for wind speed, annual energy yield and the losses of OWF electrical system components are estimated in detail and included in cost calculations. Energy economics metrics such as LCOE, net present value (NPV) and discounted pay-back period (DPBP) are calculated using a discounted cash flow analysis. The proposed analysis is implemented for a possible offshore site in the Aegean Sea, which was found to have the highest capacity factor among the 55 possible offshore locations in Turkey in an earlier study [4]. Two OWF sizes of 100 MW and 300 MW are studied to investigate the impact of electrical topologies on OWF economics in terms of installed capacity. A sensitivity analysis is finally performed for three offshore locations with various capacity factors and distances to shore. The rest of this paper is organized as follows. Section 2 describes the electrical topologies considered. Loss estimation is expressed in Section 3 while economic analysis is evaluated for the selected OWF in Section 4. Results and discussion are presented in Section 5. Finally, Section 6 provides the concluding remarks.

2. Description of Electrical Topologies Considered

Several solutions in terms of electrical topology (i.e., AC, DC and hybrid) have been proposed for both collection and transmission systems [11]. Since the best techno-economic solution for a given application depends on total wind power generated and distance from shore, AC and DC topologies will be considered separately for the configuration of OWF collection and transmission systems.
This offshore site is selected as a result of earlier extensive study based on a multi-criteria site selection work that considers many decision criteria in terms of technical (e.g., wind speed and sea depth), social and civil restrictions, that is, territorial waters, military areas, civil aviation, shipping and pipeline routes and environmental concerns [4]. It was also found in another earlier study [8] that the selected site is less favorable in terms of economics compared to other offshore sites in the Aegean sea since it is far from the point of common coupling which makes its electrical system investment cost higher. The examined OWF is considered to be rated 100 MW and 300 MW. It consists of an inner collection system with 25 and 75 turbine system sets, respectively, connected to an onshore substation in the island and high voltage (HV) submarine transmission cables between the onshore substation and the point of common coupling busbar in the mainland.

2.1. AC Offshore Wind Energy System

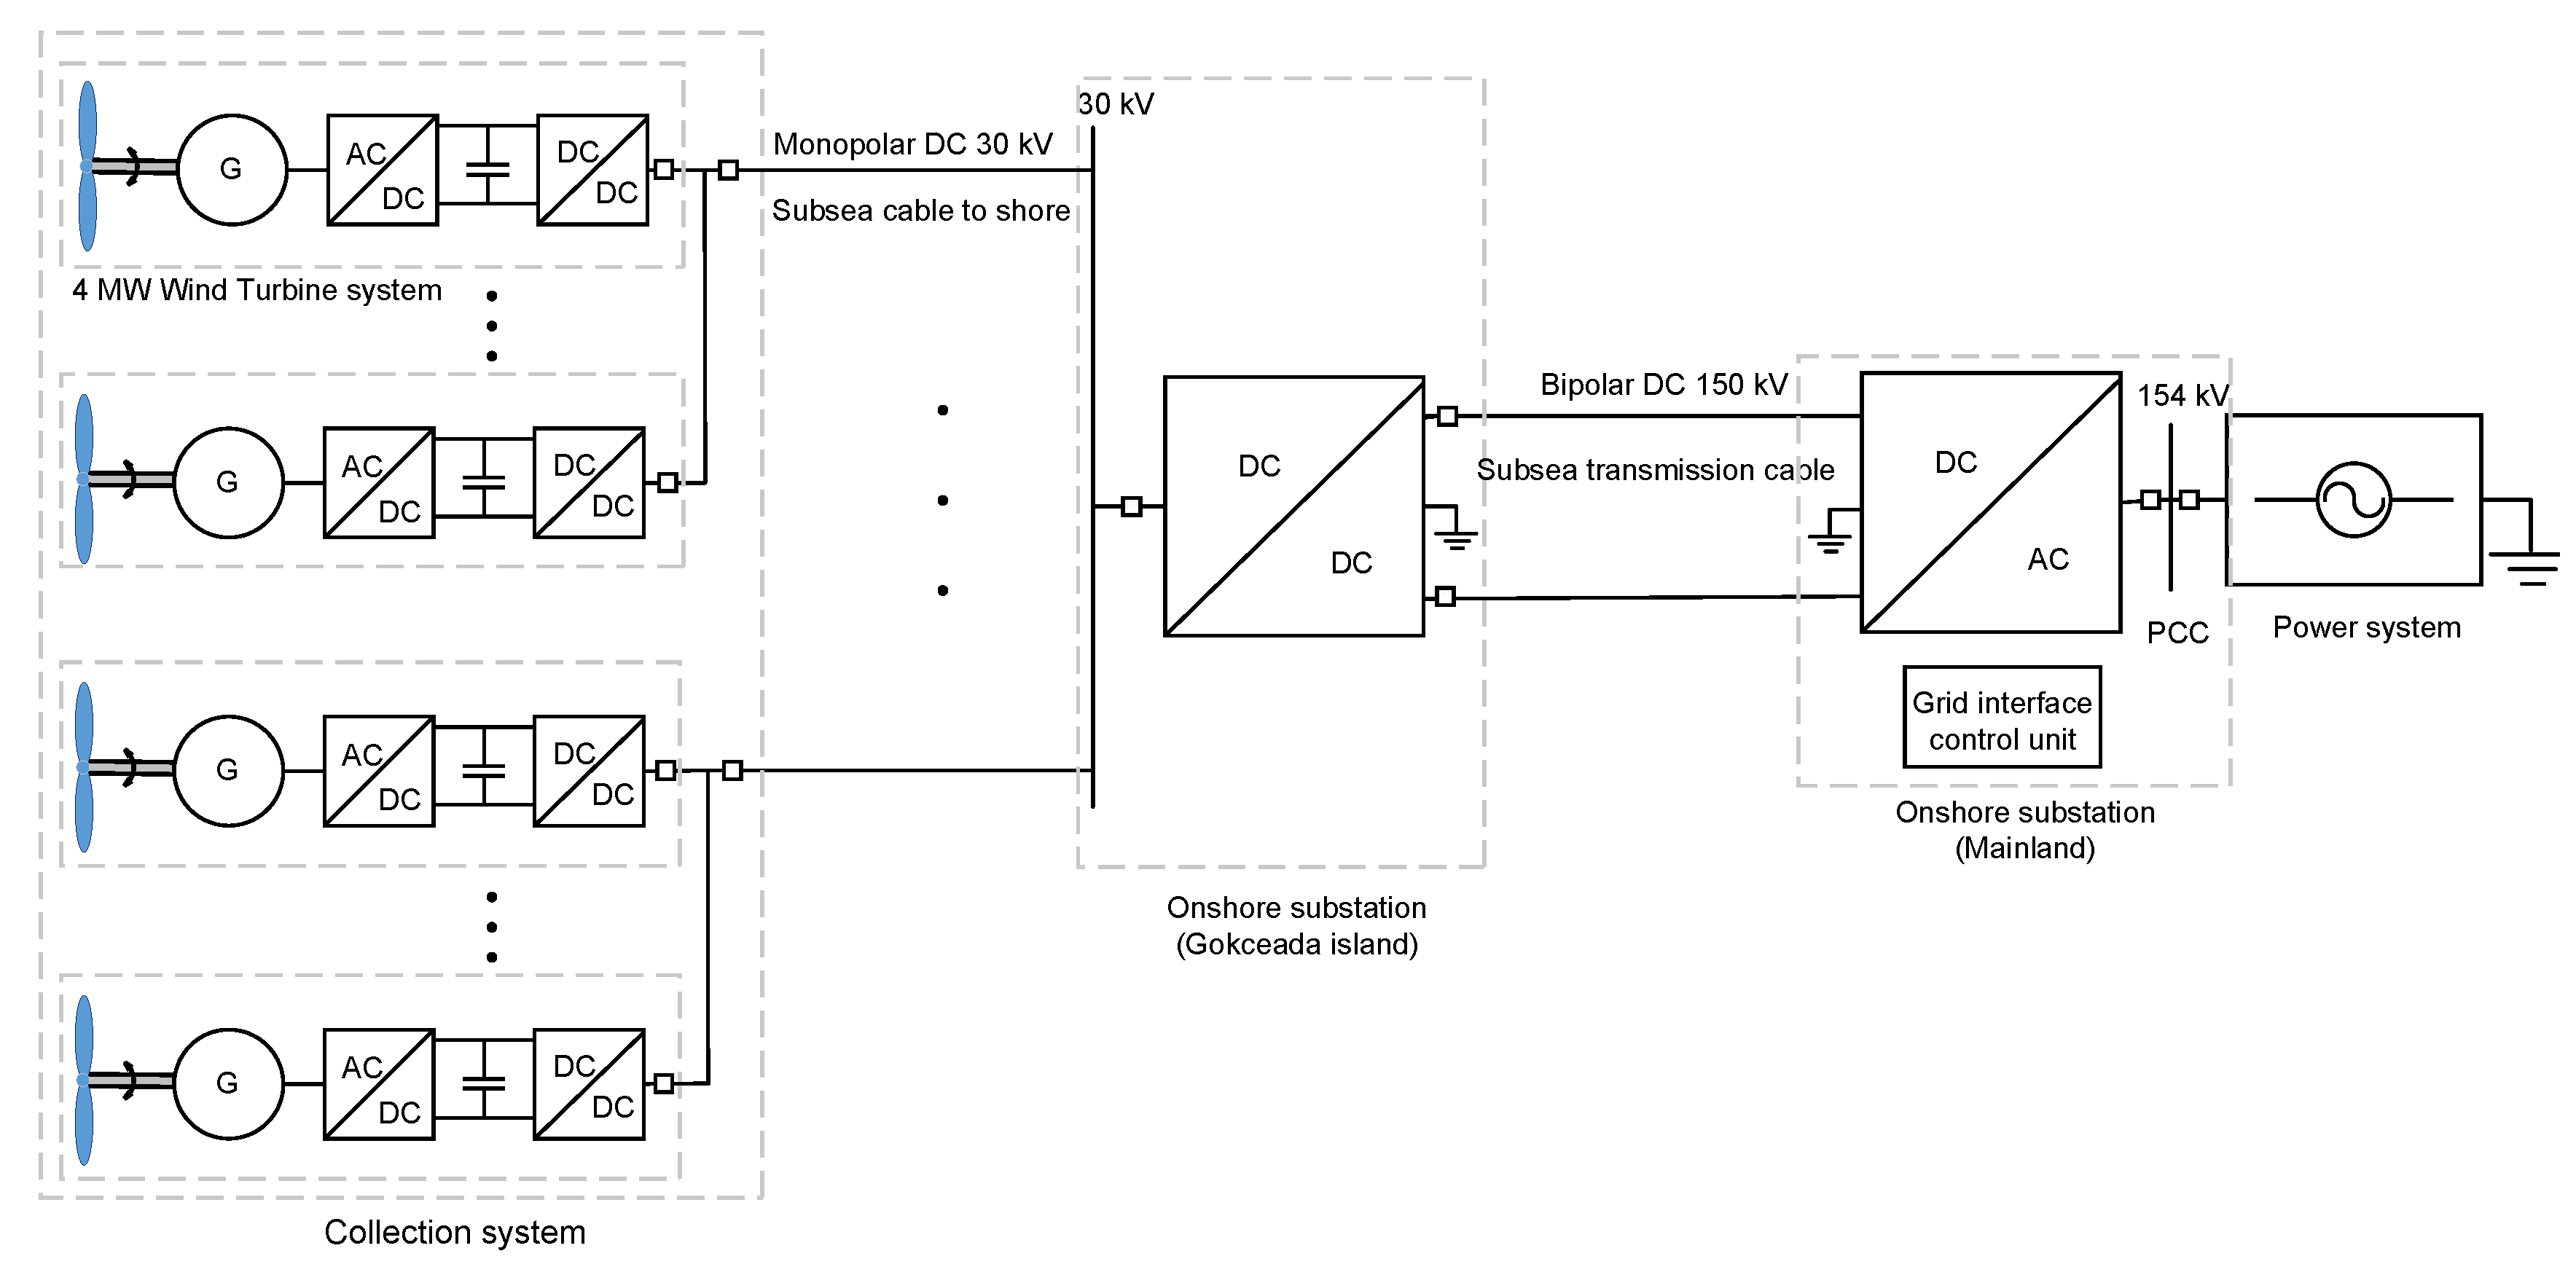
The AC OWF configuration considered in this study is shown in Figure 1. The collection system consists of several radial branches that are connected to an onshore substation via submarine cables. Each turbine set rated at 4 MW includes AC–DC and DC–AC converters and a step-up transformer rated 0.69 kV/33 kV, 4.5 MVA. The bus voltage at the AC collection system is thus 33 kV. An onshore substation is considered in the island. It consists of 1 and 3 step-up transformers rated 33 kV/154 kV, 100 MVA including reactive power compensation and grid interface control units. The transmission system includes a three-phase HVAC submarine cable that connects the OWF to the power system in the mainland.

2.2. DC Offshore Wind Energy System

The proposed DC OWF is shown in Figure 2. In this configuration, each turbine is coupled to AC-DC and DC-DC converters that creates a medium voltage (MV) DC bus in the collection system. The collection system is connected to another multi-level step-up DC–DC converter at an onshore platform through monopolar DC 30 kV submarine cables. The onshore platform DC converter is rated at 100 MW and 300 MW. The transmission system includes bipolar HVDC (e.g., 150 kV) submarine cables. Another onshore converter station is placed on the mainland to connect the OWF to the power system. This converter station consists of a multilevel cascaded DC-AC converter including DC capacitors, reactors and filters.

2.3. Electrical Design for Offshore Wind Farm Collection System

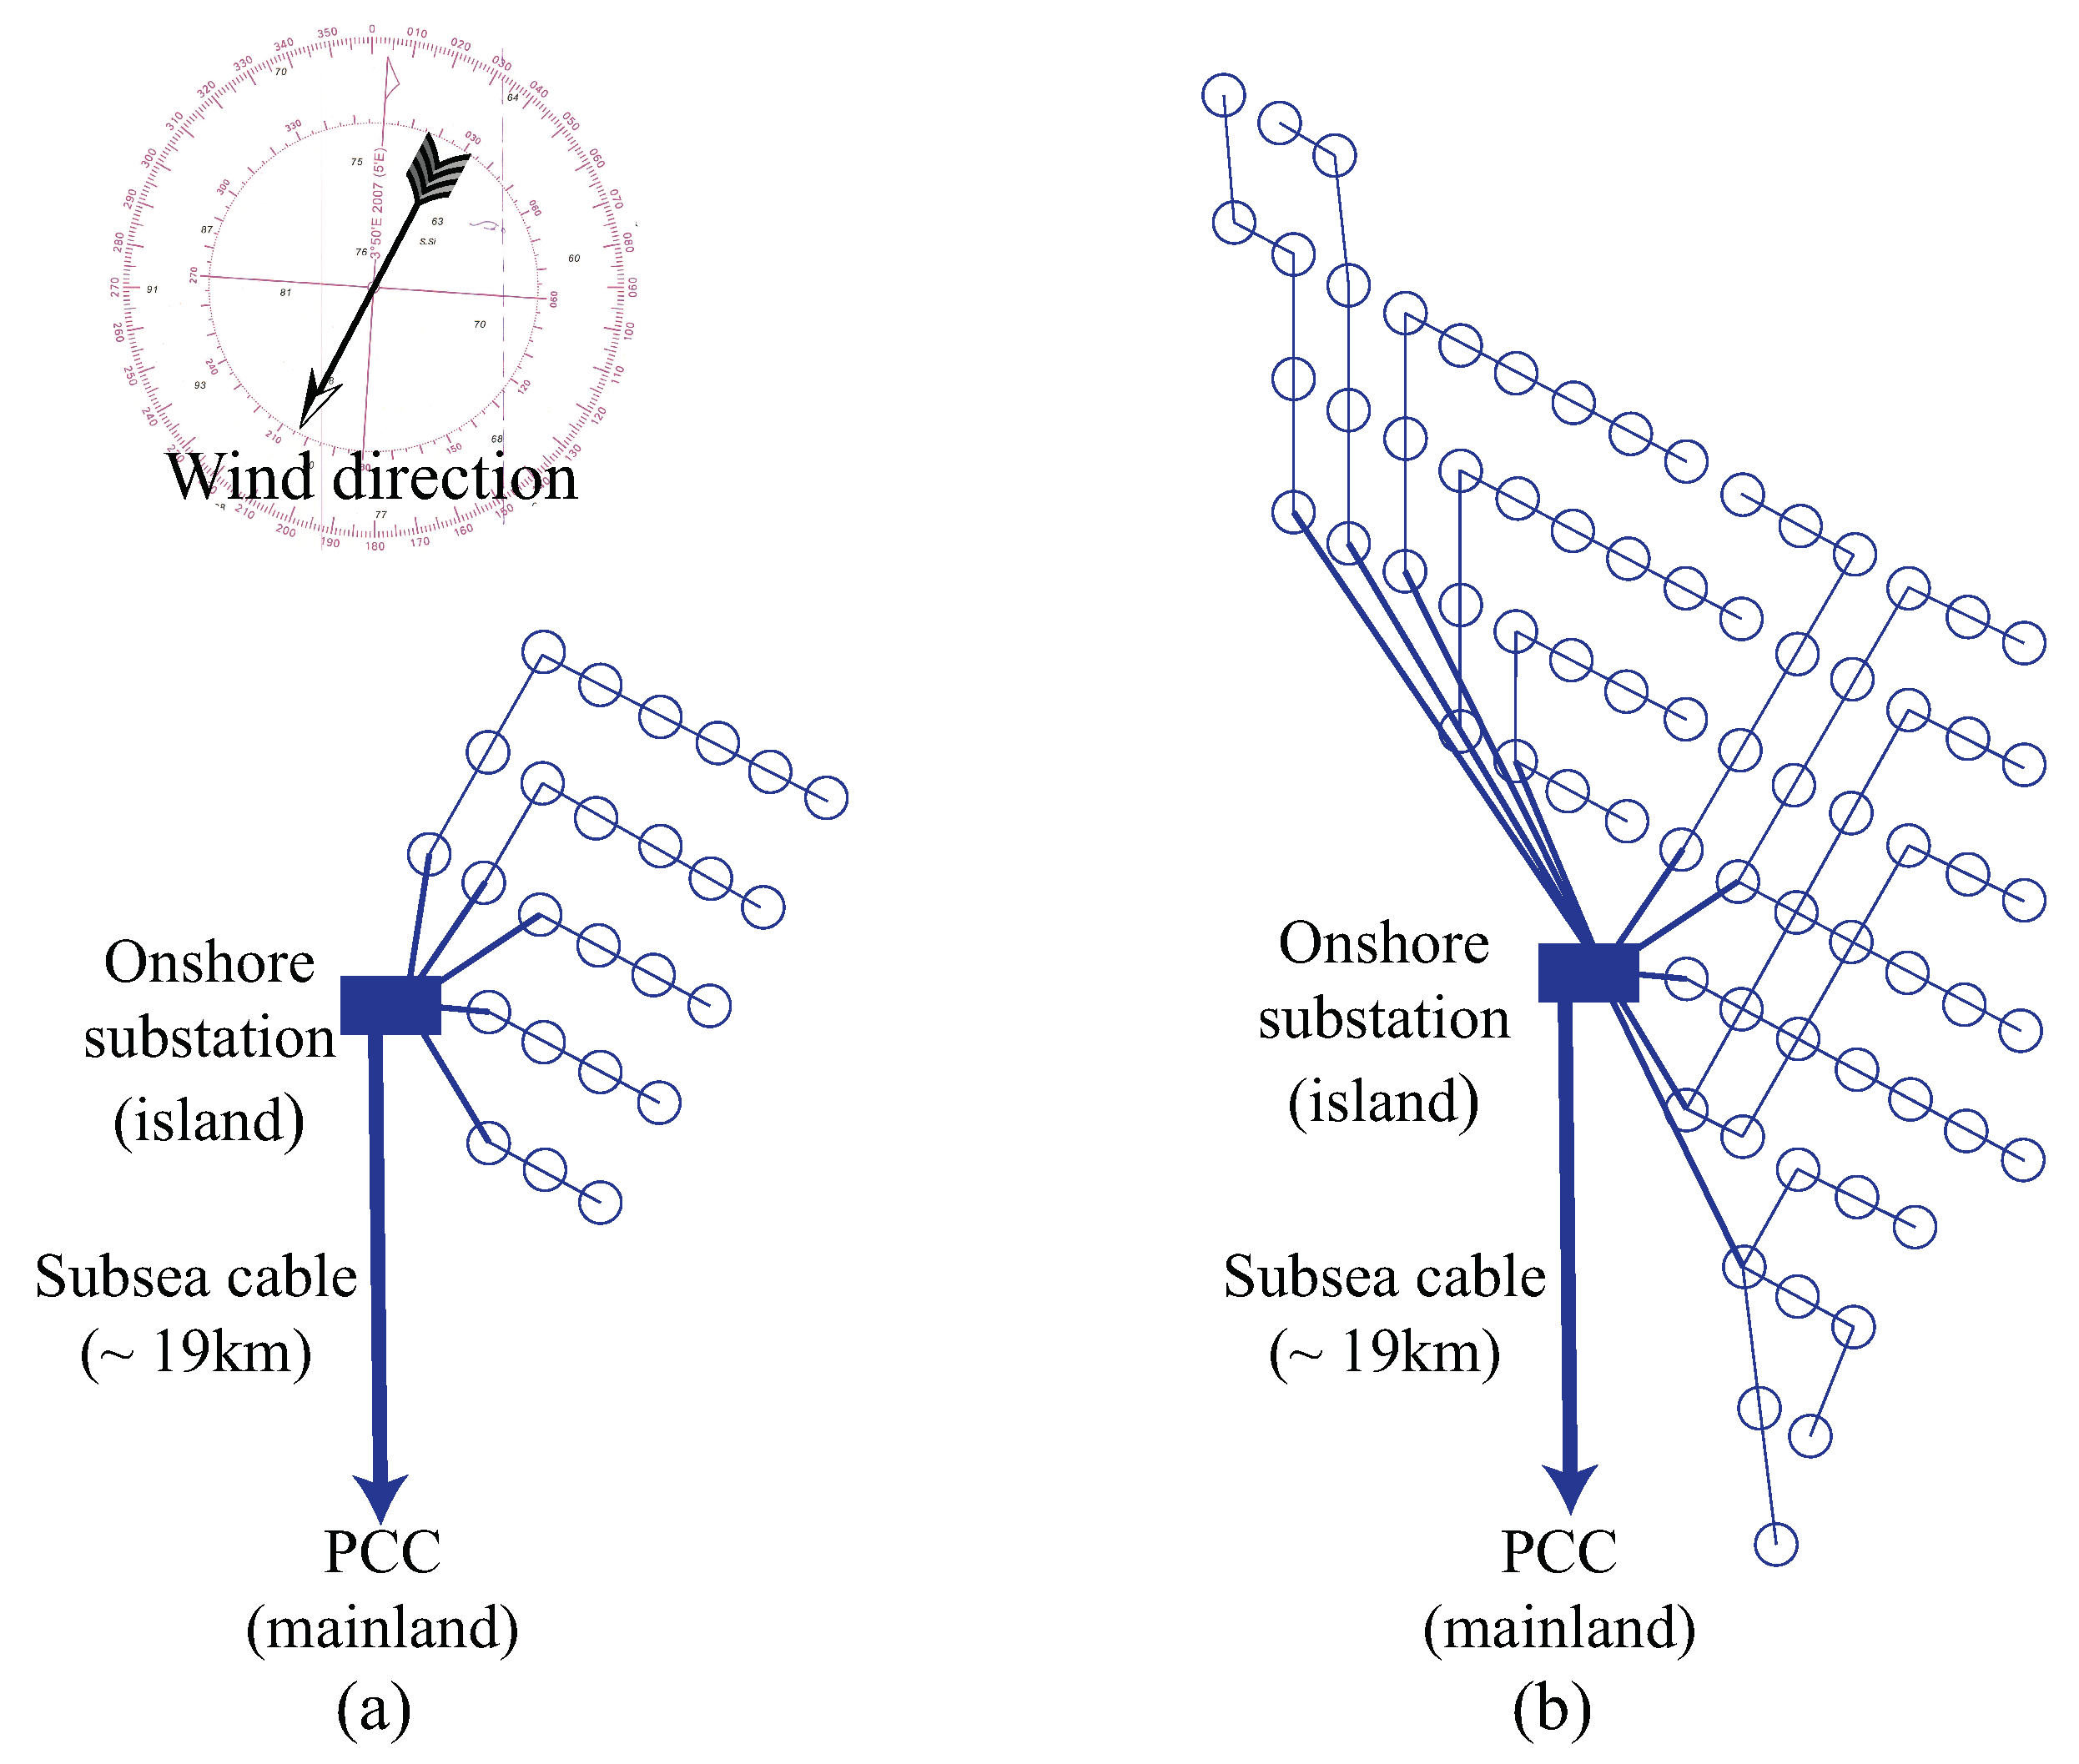
The radial design for an OWF collection system was shown to be the most cost-effective option in an earlier study [8]. Herein, based on engineering judgments, radial designs are considered for both the OWFs rated 100 MW and 300 MW as shown in Figure 3. To maximize wind energy usage as well as reduce wake effects, turbines sit perpendicular to the main wind direction and in rows spacing 3.6 rotor diameters (D) within each row and 7 D between rows as recommended in [27].

3. Annual Energy Yield and Electrical Losses Estimation

Estimating wind power output is an integral element of energy business which can be categorized into two clusters—long-term and short-term energy forecasting, respectively. Short-term forecasting tools with hour ahead and day ahead forecast horizons are used for daily operations such as optimal scheduling of the utilities while estimation of annual energy production (AEP) is used for investment decisions for energy generation projects [28]. Within the scope of this article, AEP figures are estimated using an open source renewable energy resource assessment tool named Virtual Wind Farm (VWF) [29]. VMF is based on the weather data which originates from satellite observations and global reanalysis models such as NASA’s MERRA (Modern-Era Retrospective Analysis for Research and Applications). The model generates the hourly wind power and wind speed values for the given location for the entire year [30]. The Siemens Wind Turbine SWT-4.0-130 is used in the model [31]. The cut in wind speed ( v m i n ) is 5 m/s and the cut out wind speed ( v m a x ) is 25 m/s while the rated wind speed is 12 m/s. As wind speed can greatly vary for the cycle of a year, power components (i.e., converters, transformers, etc.) of an OWF are not rated loaded for the most of the time of a year. Using Weibull distribution for power loss of a wind farm achieved more accurate results in Reference [32]. To have more accurate values in estimating losses of each system components, this study therefore considers the Weibull probability distribution function for wind speed. The steady state current values are used in the following calculations.

3.1. Power Electronics Losses

The power electronics (PE) losses for the AC offshore configuration include the losses in the turbine converters within the collection system while the PE losses for the DC counterpart include the losses in the turbine converters, the onshore DC-DC and DC-AC converters. The turbine converter losses are the sum of the switching and conduction losses in the IGBTs( P I G B T ) and the freewheeling diodes ( P F W D ) that are given, respectively, as follows [25]:
P I G B T t u r b i n e = N s w ( V C E O · I c a v e + R C · I c r m s 2 + ( E o n T + E o f f T ) · f s w ) ,
P F W D t u r b i n e = N s w ( V D O · I d a v e + R D · I d r m s 2 + E o n D · f s w ) ,
where V C E O and V D O are the on-state voltages (V), I c a v e and I d a v e are the average currents (A), R C and R D are the on-state resistances ( Ω ), I c r m s and I d r m s are the rms currents, for the IGBT and diode, respectively. E o n T and E o f f T are the IGBT’s turn-on and off energy losses (W), respectively and E o n D is the diode reverse recovery energy loss (W). f s w is the switching frequency which is selected as 1260 Hz. N s w is the number of switches (IGBT or diode). The ABB IGBT modules of type 5SNA 3600E170300 is considered in the turbine converters [33].
To get a high conversion ratio (e.g., 1:5) at MW level, the multilevel step-up DC-DC converter topology proposed in Reference [34] is used for the onshore DC-DC converter. Based on the conventional boost converter configuration, the topology consists of two half-bridges (clamped IGBTs) in the lower position and four chopper (clamped diodes) in the upper position. The ABB IGBT modules of type 5SNA 1200G450300 is used in the onshore DC-DC converter [33]. The switching losses are comprised of the upper and lower stacks IGBT switching losses and upper stack diode reverse recovery losses while the conduction losses comprise the upper and lower stacks IGBT conduction losses and upper and lower stacks diode conduction losses. The total losses are the sum of switching and conduction losses which can be expressed for the IGBT and diode, respectively, as follows [34]:
P I G B T H V D C = 2 N f s w E o f f T + 4 M f s w E o n T + 4 M f s w E o f f T + 2 N V C E O I N λ N 1 + 2 M V C E O I M λ M 1 ,
P F W D H V D C = 4 M · f s w · E o n D + 2 N V D O I N λ N 2 + 2 M V D O I M λ M 2 ,
where N = 4 is the number of upper sub modules, M = 2 is the number of lower sub modules. I N and I M are the average currents in the upper and lower stacks, respectively. λ refers to the ratio of the conduction time to the switching period. The switching frequency of 1 kHz is taken in the calculation.
For the onshore DC-AC converter, the cascaded multilevel converter topology [35] is considered. The topology uses five series connected H-bridges in each phase which creates 11-level line-to-neutral voltage and hence 21-level line-to-line voltages. The ABB IGBT modules of type 5SNA 0750G650300 rated 6500 V is used in the onshore DC-AC converter [33]. The switching frequency of 1 kHz is taken. The associated PE losses in the IGBT modules ( P I G B T H V A C ) and ( P F W D H V A C ) can be calculated as given by (1) and (2), respectively. Thus, total PE losses for AC and DC offshore configurations are obtained by (5) and (6), respectively. The parameters of the IGBT modules used are listed in Table 1.
P P E A C = N t u r b i n e · P I G B T + P F W D ,
P P E D C = N t u r b i n e · P I G B T + P F W D + P I G B T H V D C + P F W D H V D C + P I G B T H V A C + P F W D H V A C ,
where, N t u r b i n e is the total number of turbines within the OWF.

3.2. Transformer Losses

As the transformerless multilevel converter topologies are considered in the DC offshore wind configuration, the transformer losses are therefore a matter of concern for the AC offshore wind configuration. They include the losses of turbine transformers and the onshore substation transformers. The total losses of a transformer at any load level can be obtained by (7) [36],
P T r f m = P 0 + I L 2 · ( Z p u × Z b a s e ) ,
where, P 0 , Z p u and Z b a s e are no-load losses, p.u.and base impedances of transformer, respectively, obtained from its nameplate. I L is transformer primary current.

3.3. Collection and Transmission Lines Losses

The longest collection line is 8 km while the length of the transmission line is 19 km. The short line model can then be used for the modeling of the cables of the collection and transmission lines. It is represented by a series RL circuit. In this case, line losses are calculated by I 2 · R . The currents are calculated from operating wind power associated with each wind speed while resistance values are obtained from the underground cable manufacturer’s catalog which is selected for rated operation. Herein, the DC resistance values at 20 C of cables are used for the DC offshore configuration while maximum AC resistance values at 90 C are used for the AC counterpart. In determining the resistance values, cables are assumed to be directly buried in ground.

3.4. Annual Energy Losses

The total annual energy losses can be found by integrating the losses over the Weibull probability distribution of wind speed for a cycle of a year [25]. Thus, the annual energy losses in the AC and DC offshore configurations become
E A C l o s s e s = v m i n v m a x ( P P E A C + P T r f m + P c a b l e A C ) · f ( v w ) · 8760 d v w ,
E D C l o s s e s = v m i n v m a x ( P P E D C + P c a b l e D C ) · f ( v w ) · 8760 d v w ,
where E A C l o s s e s and E D C l o s s e s are the total annual energy losses in the AC and DC offshore configurations, respectively. P c a b l e A C and P c a b l e D C are the total collection and transmission lines losses in the AC and DC offshore configurations, respectively. f ( v w ) is the Weibull probability distribution function of occurrence of each wind speed for a year obtained using the wind farm model.

4. Economic Analysis

4.1. Major Investment Indicators Considered For Economic Assessment

NPV, LCOE and DPBP are among the major investment energy economic metrics which help the energy sector players to make wise investment decisions [8,37]. Besides, the cash follow diagrams provided contain more information about the entire projected life cycle of an project investment scenarios with yearly resolution. The business of the usual operations of the energy companies shall ideally utilize the above-mentioned techno-economic metrics with higher resolution by considering other dynamic parameters including tax, inflation and risk management components before making their multi-million $ investments. AEP figures are one of the most important parameters of a cost-benefit analysis where the revenues of the energy economic system are created. NPV indicates the difference between the present value of annual cash inflows (benefits) and annual outflows (expenditures). For the entire project lifespan of an OWF, NPV can be expressed by [8]:
N P V = C C A P E X + t = 1 T n e t C a s h F l o w ( t ) ( 1 + r ) t ,
where C C A P E X and T represents the total capital expenditures (CAPEX) and lifespan of OWF, respectively and r is the annual discount rate. The net cash flow for a year is found by subtracting the present value of outflows from the present value of annual cash inflows which includes the annualized operational expenditures (OPEX) and revenues, respectively. In other words, the outflows correspond to the OPEX in the corresponding year while the inflows are related to the AEP of the corresponding year. Revenues of investment calculation are primarily dependent on the AEP figures in energy investments. Positive NPV values represent the economically viable investment option. If there are multiple positive NPV values calculated for various investment options, the options that yield the highest NPV figure shall be selected for the investment. The LCOE is a special per unit cost energy economic metrics which characterizes the NPV of an OWF over its life-cycle and is estimated by [8]:
L C O E = t = 0 T C C A P E X ( t ) + C O P E X ( t ) ( 1 + r ) t t = 0 T n e t A E P ( 1 + r ) t ,
where t { 1 . . T } , C C A P E X ( t ) = 0 and initial value of C O P E X ( 0 ) = 0 . C O P E X ( t ) indicates the OPEX for the year of t. The net AEP is the estimated amount of energy generated by the power plant annually. Pay-back period (PBP) shows the time duration in which the cumulative profit is equal to the cumulative cost. For many investment decision processes, PBP is considered one of the important economic threshold values. However, the PBP does not reflect the time value of money. Thus, using the PBP can be misleading in real life investment decisions where the discount rate is greater than zero percent. In this case, it is essential to utilize the DPBP metrics for more realistic evaluations where the time value of money is also taken in to account. The DPBP is then calculated by [8]
D P B P = l n 1 1 r · C C A P E X N e t C a s h F l o w l n ( 1 + r ) .
The profitability can be measured by using internal rate of return (IRR) metrics that express the discount rate which makes the NPV of an investment equal to zero. The IRR is calculated by dividing the net profit of the investment by the total cost of the investment. The detailed explanation of techno-economic evaluation will be given in the following sections.

4.2. Cost Calculation for AC and DC Offshore Wind Energy Projects

The total investment cost of an OWF project includes CAPEX and OPEX. The parts of each element are expressed below.

4.3. CAPEX

The CAPEX typically have four parts [38]—(i) turbine cost, (ii) support system cost, (iii) electrical system cost, (iv) project development, management and other costs such as insurance. The cost difference in HVAC and HVDC mainly exists due to the different electrical system topologies. The following subsections provide details of each cost component.

4.3.1. Wind Turbine Cost

Wind turbine cost based on the power capacity is provided in Reference [39] for turbines ranging from 2 to 5 MW. Transportation and installation costs of turbines are considered to be 10% of the turbine cost and included into the total cost given by
C t u r b i n e s = 3 . 245 · 10 3 l n ( P ) 412 . 72 [ k ] ,
where, P is the installed wind power capacity. It is also assumed that this includes the cost of turbine converters and transformer. The given cost function is used both for AC and DC system turbine costs.

4.3.2. Support System Cost

The support system includes foundation and tower. Its cost mainly has three parts—(i) manufacturing, (ii) transportation and (iii) installation. The costs of transportation and installation are included into the manufacturing cost with the assumption of being 50% of the manufacturing cost. The total cost can be formulated as
C s u p p o r t = 480 · P ( 1 + 0 . 02 ( d 8 ) ) ( 1 + 0 . 8 · 10 6 ( h ( D 2 ) 2 10 5 ) ) [ k / t u r b i n e ] ,
where d [m] is sea depth, h[m] is hub height and D[m] is rotor diameter. Monopile foundation cost is considered for all the turbines. A sea depth of 45 m is considered; however, the soil properties are not taken into account due to the lack of publicly available data. Both AC and DC systems use the same cost function for support system.

4.3.3. Electrical System Cost

Based on the selected electrical system topology, electrical system cost components vary. Both in AC MV collection and HV transmission systems, the topology is standard AC system topology. In this study, the AC electrical system cost includes inner cable, substation, power factor correction devices and high voltage cables connecting the OWF to the nearest point of common coupling [8]. DC collection and transmission system, on the other hand, may have different configurations both in cables and components. There are two main topologies that exist in a HVDC transmission system, that is, Line-Commuted Converter (LCC) and VSC based topologies. Nowadays, the VCS based converter is the most promising technology that dominates the market [40,41].The overall electrical system cost components for the DC configuration include: (1) medium voltage DC submarine inner cables with installations; (2) onshore substation that includes converters and other necessary components; (3) high voltage DC submarine cables and their installations connecting onshore substation in the island to the mainland; (4) converters in the mainland; and (5) a grid connection unit including other substation components such as reactors.
  • Collection system cable cost—the wind turbines are connected to each other as well as to the onshore substation through submarine cables. The core (conductor) of the cables can be either stranded copper or aluminum. Due to the surrounding sea environment, sufficient electrical insulation is needed around the conductor. The subsea cable insulations are made of different dielectric materials. Among the two common ones are mass impregnated paper and Cross Linked Polyethylene (XLPE) Polymeric cables [42,43]. There are additional layers exist for shielding and mechanical strength purposes. For the DC configuration, XLPE cables are mostly used with VSC topology [44] and were therefore selected for this study. For the AC configuration, 3 core XLPE type cables were selected from available manufacturer datasheets. Reference [45] provides DC cable cost formulation for different voltages. Reference [25] presents a cost function for a 30 kV voltage level cable. The cost model used is given as follows [25]:
    C c a b l e D C / k m = A p + B p · P n [ M £ / k m ] ,
    where A p and B p are the cost constants of 0 . 0256 · 10 6 and 0.0068 for 30 kV, respectively. P n rated power of the cable [W]. The cost is converted to €/m and costs for different cross-sections of cables are calculated. The bipole 150 kV cable cost is calculated with the same formula with different constants ( A = 0 . 1 · 10 6 and B = 0 . 0164 ) given in Reference [45]. The calculated cable costs in €/m are given in Table 2.
    Typical cable cross-sections were taken from a manufacturer’s [46] publicly available datasheet and depending on the selected voltage and power levels, cable costs are estimated as in Table 2. The cable cross sections were selected such that they carried the maximum power output of the wind turbines. It was considered that the selected radial collector system has a single cable in a row and carries the power of minimum 3 and maximum 13 wind turbine outputs in one feeder. These numbers were determined by considering the physical layout design as well as cable cross sections ampacity levels. An additional 40 m supplementary cable for each turbine was considered as recommended in Reference [38]. The total cable cost for DC collection system was calculated as
    C c a b l e = C c a b l e D C / k m × l i n n e r c a b l e [ k ] .
    The cost function for 3 core XLPE cables given in Reference [39] was used to calculate the cable costs as follows:
    C c a b l e A C / k m = α + β × e γ · I n 10 5 [ k / k m ] ,
    where α , β and γ are constants 52.08, 75.51 and 234.34, respectively. I n is the current ratings of the cables. Typical cable cross-sections with their current ratings were taken from two manufacturer’s available data sheets [47,48].
    The cables were considered to be buried under on the seabed. The burying cost in Reference [38] was used as 273 k€/km. The total burying cost for the collection system was calculated by considering all the cable lengths used in the system as
    C b u r r y i n g = 273 × l i n n e r c a b l e [ k ] .
  • Onshore DC/DC converter substation—one of the factors affecting the DC offshore wind system cost is converter costs. The percentage of the converters over the total cost varies based upon the system topology and transmission distance. Converter costs are found to be around 20% in References [49,50]. The DC configuration becomes more economical over the AC configuration once the converter cost is covered by the cable costs. In DC offshore wind systems, the onshore and offshore substations house the converters and a few other components such as reactors, filters and DC breakers. In addition, the offshore substations cost includes the platform cost as well. In this paper, since there were two onshore substations considered, platform cost was disregarded.
    Obtaining the exact cost figures for substation converter stations is very difficult. Reference [51] investigated many studies and proposed € 150/kW. Reference [45,52] presented 1 SEK/VA price for the converters. Reference [53] argues this is because of having different insulation levels at different voltages and proposes three different cost figures for different power ratings. Reference [52] states that this cost includes the cost of valves, filters and other necessary parts. The average of these figures given in the literature was used in this study, which is € 194.23/kVA by assuming that all the substation component costs are included. The onshore substation in the island is a DC/DC converter that steps up the voltage. It is assumed that the converter station includes a series connection of valves for the total power rating. The total price is calculated as
    C s u b s t a t i o n D C = 194 . 23 · P [ k / k m ] .
  • Onshore AC substation and power factor correction costs—since the substation has many components including transformers, switchgeras, backup generators and so forth, the cost is considered as a lump sum that is a function of the installed wind power capacity. Based on the cost model in Reference [38], a cost of 50 k€/MW was used for the calculations. The cost models for power factor correction devices (i.e., SVC, STATCOM, shunt reactors) are given as follows [38]:
    C s h u n t r e a c t o r = 2 , 556 / M V A r C S V C = 6390 + 63 , 900 / M V A r C S T A T C O M = 128 k / M V A r
    Thus, the total substation cost is found [8] by
    C s u b s t a t i o n A C = 50 [ k ] / M W + C s h u n t r e a c t o r + C S V C + C S T A T C O M .
  • Transmission line cost: The total power of 100 MW and 300 MW collected from wind turbines are delivered to onshore substation with the monopole collector system in DC collection system. The DC/DC converter in onshore substation steps up the collector voltage from 30 kV to 150 kV for HV transmission system. A bipole with two conductor system given in Reference [54] is considered for the transmission system from the onshore substation on the island to the other onshore substation on the mainland. The system has 150 kV voltage and two identical cables deliver the power as an underground (1.7 km) and subsea system (17.3 km). No overhead lines are considered for the transmission system. The two cables connecting the two substations share the total power due to being a bipole system and their cross-sections were considered based on the maximum current. The transmission cable cost that was calculated earlier was used for per km. Additional 100 km supplemental cable was considered and the total cable cost was calculated as:
    C t r a n s m i s s i o n H V D C = 2 · C c a b l e D C / k m × l t r a n s m i s s i o n c a b l e [ k / k m ] .
    Since all the transmission cables are underground and subsea cables, a burying cost of 273 k€/km given in Equation (18) was used. In this study, close laying structure of cables was considered for the bipole system. The two cables were considered to be close to each other and buried together to have a single burying cost. The literature does not present any cost model for a single core XLPE cable used in the HVAC transmission system for high power delivery. It is also difficult to get the cost information from a manufacturer due to it being sensitive information for business operations. Therefore, it was assumed that a single core cable cost is 40% of the 3-core for the same current rating because of better insulation requirements for high voltage. The HVAC transmission system includes three single core cables, hence, the total cost for transmission system cable is tripled.
  • Onshore DC/AC converter substation—the onshore substation on the mainland is a DC/AC substation that converts 150 kV DC to 154 kV AC national transmission voltage. Although this is a DC/AC converter, the price of € 194.23 /kVA used for the DC/DC converter in Equation (19) was used for the calculations. Many converters are connected together for the total power as considered earlier. Since the total cost is given as per power, the total cost considered with total power is in Equation (19).
  • Grid connection cost—although the cost of the substation in the mainland was considered earlier, it was assumed that there is an additional grid connection cost at the point of common coupling in order to be connected to the 154 kV AC national electric transmission system. The cost for both AC and DC configuration is given as a function of total delivered power in Reference [38] as
    C G C = 8 . 047 × P 1 . 66 .

4.3.4. Project Development, Management and Other Costs

The project development and management costs including other costs such as insurance and design costs were estimated as $280.38 per MW as given in [55,56].

4.4. OPEX

The OPEX consist of operational, maintenance, administrative, insurance premiums and royalty costs. The sum of all these costs was considered to be 1.9% of the total CAPEX per annum for 20 years lifespan of the project [57].
By considering the aforementioned individual cost models, the total OWF investment cost was calculated as follows:
C C A P E X = C t u r b i n e s + C s u p p o r t + C c a b l e + C b u r r y i n g + C s u b s t a t i o n + C t r a n s m i s s i o n + C G C .

5. Results and Discussion

5.1. Losses Assessment

The estimated energy losses for each part of the AC and DC configurations for selected wind farm scales are reported in Table 3. It was found that the losses in the AC configuration were slightly higher than those of the DC counterpart for the 100 MW OWF size while they were almost the same for the 300 MW size. In this category, losses are mainly contributed to by the losses of the turbine converters ( P P E A C ) with regard to the transformer and onshore converter losses for the AC and DC configurations, respectively. There is a significance decrease in line losses in the case of DC offshore configuration. In this case study, the length of the collection and transmission lines are relatively shorter. The impact of further OWFs from shore on the losses was assessed in the sensitivity analysis.

5.2. Economic Assessment

Revenue of an OWF energy investment mainly depends on the annual energy production and the capacity factor of the power plant. The VWF model estimates the AEP values without considering array (wake effect), electrical and other related losses. Therefore, wind array efficiency parameters were calculated and used to generate realistic net AEP figures. Wind farm array efficiency for this study was assumed to be 96%. The net AEP was calculated by considering wake effects (e.g., 4%) and total electrical losses from the gross AEP estimated by the VWF model. Annual revenues were estimated by multiplying the net AEP and the corresponding Feed-in-Tariff (FIT). The base FIT of 7.3 USD cent/kWh represents the support mechanism which was designed for the wind investments using all exported wind turbines. In addition, the maximum FIT of 11 USD cent/kWh is provided for the investors using domestic wind turbines. The economic calculations in this study were performed in terms of US dollars. The dollar/euro parity of 1.335 is used to convert the CAPEX values to US dollars.
The estimated values for the mean wind speed, OPEX, CAPEX, annual revenues, capacity factors and the net AEP values are summarized in Table 4. This case study is considered as a reference scenario for the sensitivity analysis. The mean wind speed of the selected wind turbine at hub height of 90 m was estimated to be 7.68 m/s. The capacity factor at wind turbines output is constant for all electrical topologies (e.g., 44.7%). Final capacity factor values at the point of common coupling (PCC) that consider wake and electrical losses vary between 41.20% and 41.31% depending on the electrical topology and installed capacity. The net AEP values were estimated between 361.34 GWh and 361.19 GWh and 1,084.59 GWh for the 100 MW and 300 MW sizes, respectively, depending on the final capacity factor. Estimated annual revenue for each configuration ranges from 39.75 million $ to 39.73 million and 119.31 million $ the 100 MW and 300 MW sizes, respectively. CAPEX values were estimated to be in the range of 335.01 million $ and 998.72 million $ for the DC configuration and 300.59 million $ and 998.72 million $ for the AC configuration for the 100 MW and 300 MW sizes, respectively. For the entire project life cycle of 20 year, the OPEX values were estimated to be in the range of 6.37 and 18.98 million $ for the DC configuration and 5.71 and 17.17 million $ for the AC configuration.
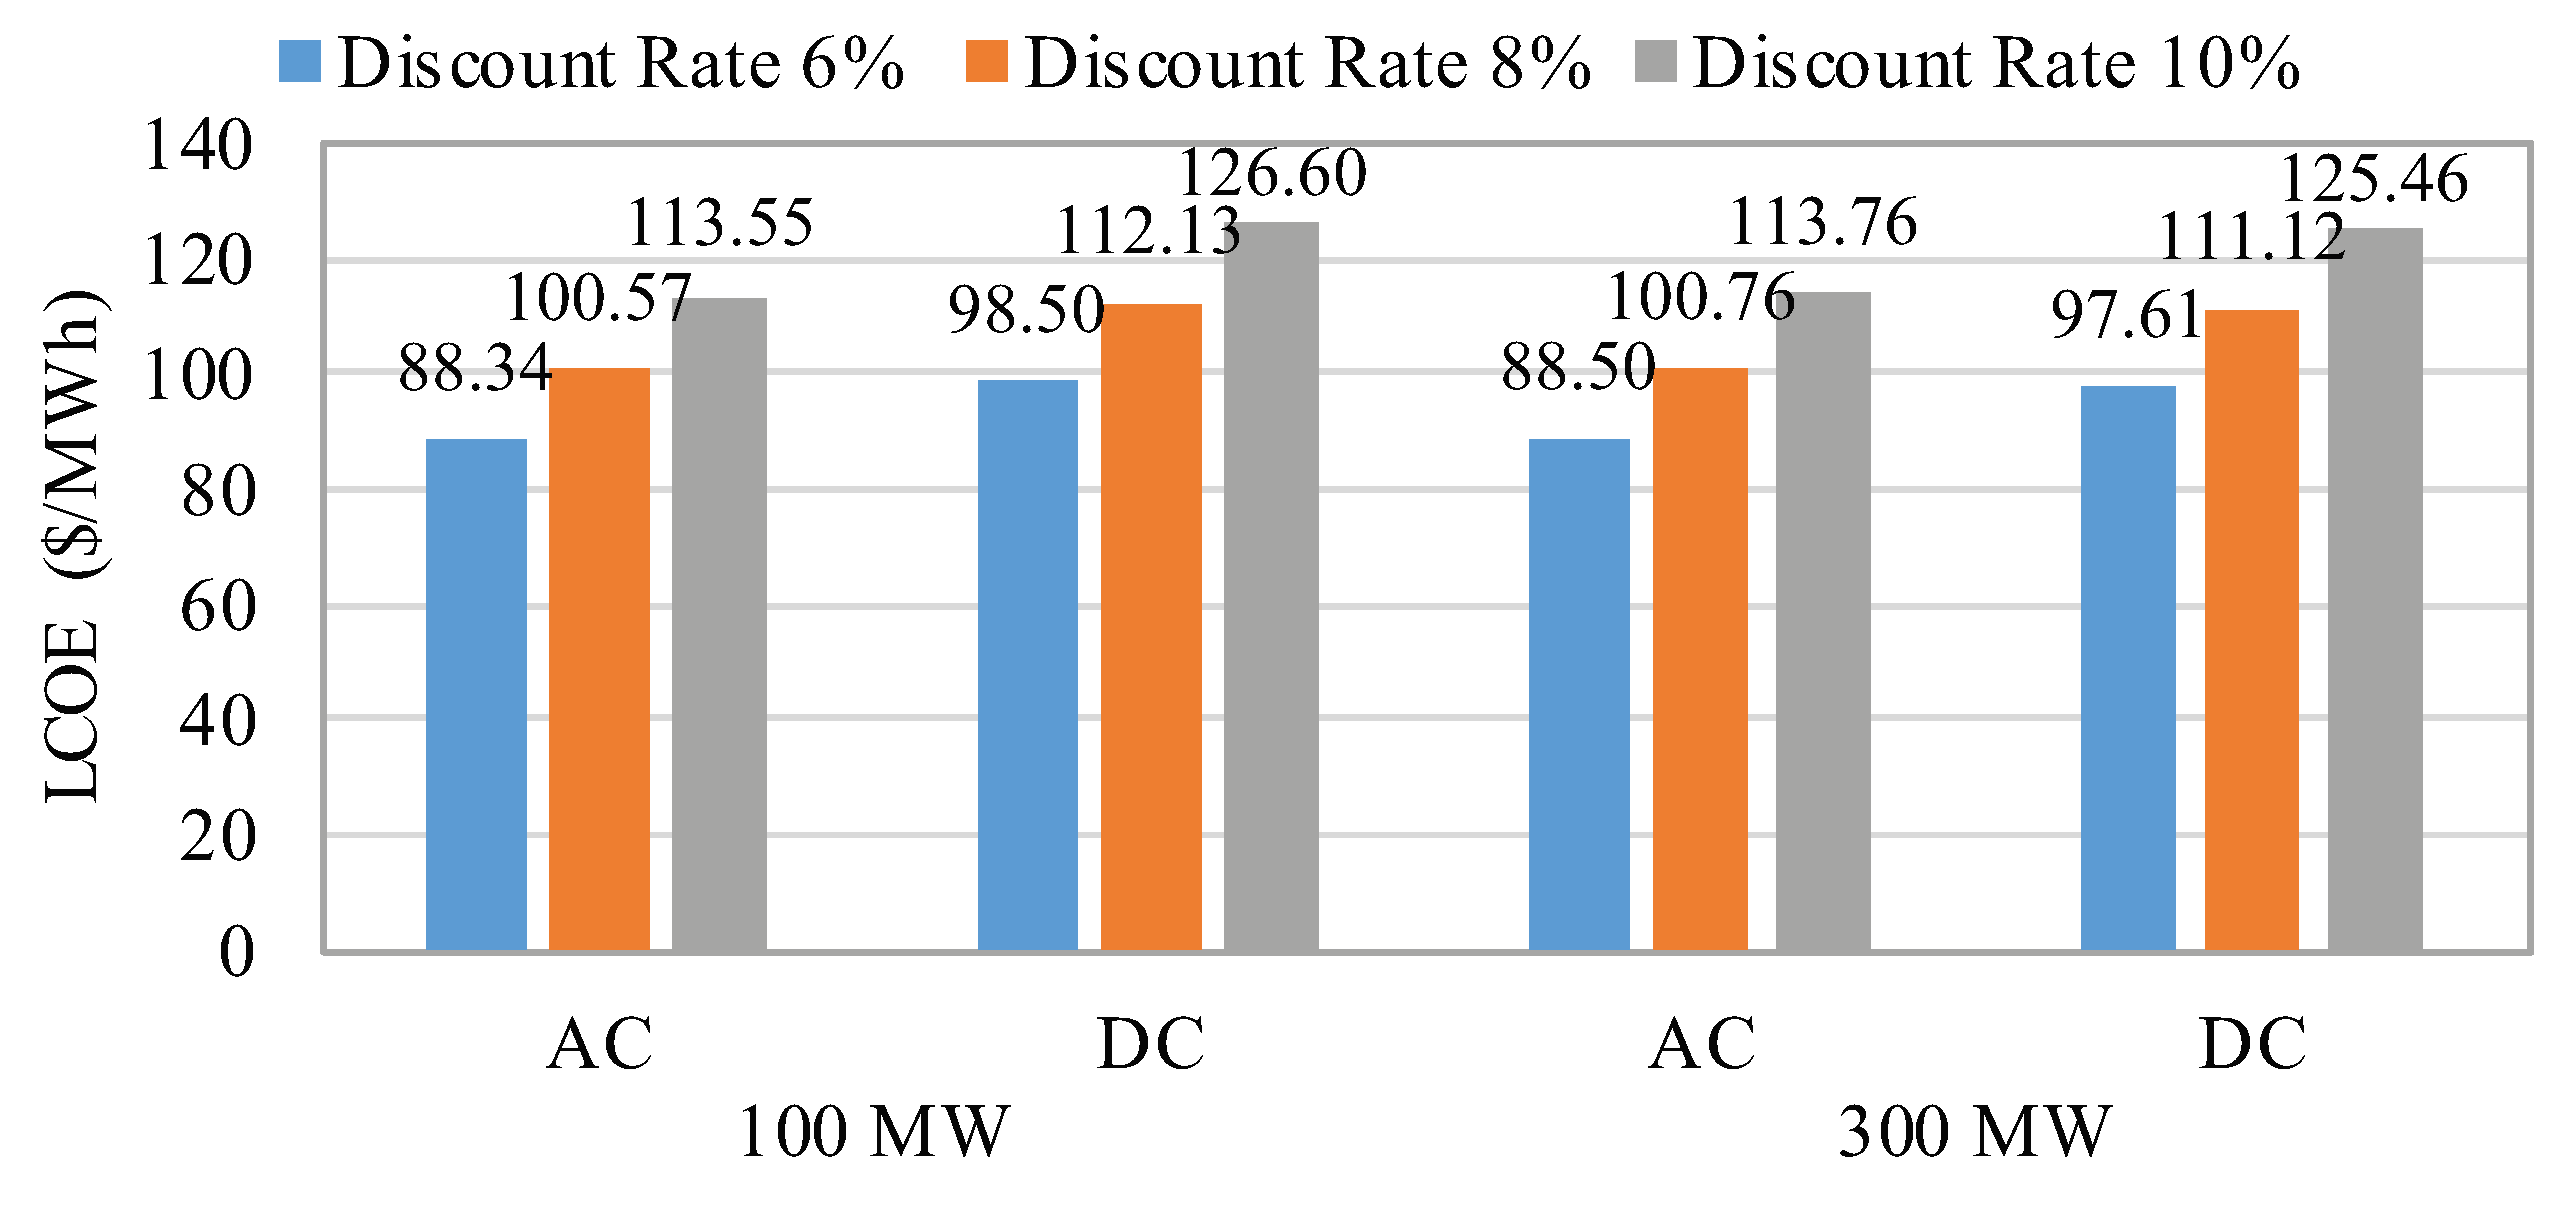
A comprehensive economic evaluation was performed by using the estimated cost-benefit analysis components. The estimated LCOEs for different discount rates are shown in Figure 4. The results reveal that the LCOE deviates from 88.34 $/MWh (AC 100 MW with 6 % discount rate) to 126.60 $/MWh (DC 100 MW with 10 % discount rate) depending on the electrical topology, interest rates and wind farm size. It can be observed that, although wind farm size is increased by three-fold, LCOEs for the AC and DC options slightly change.
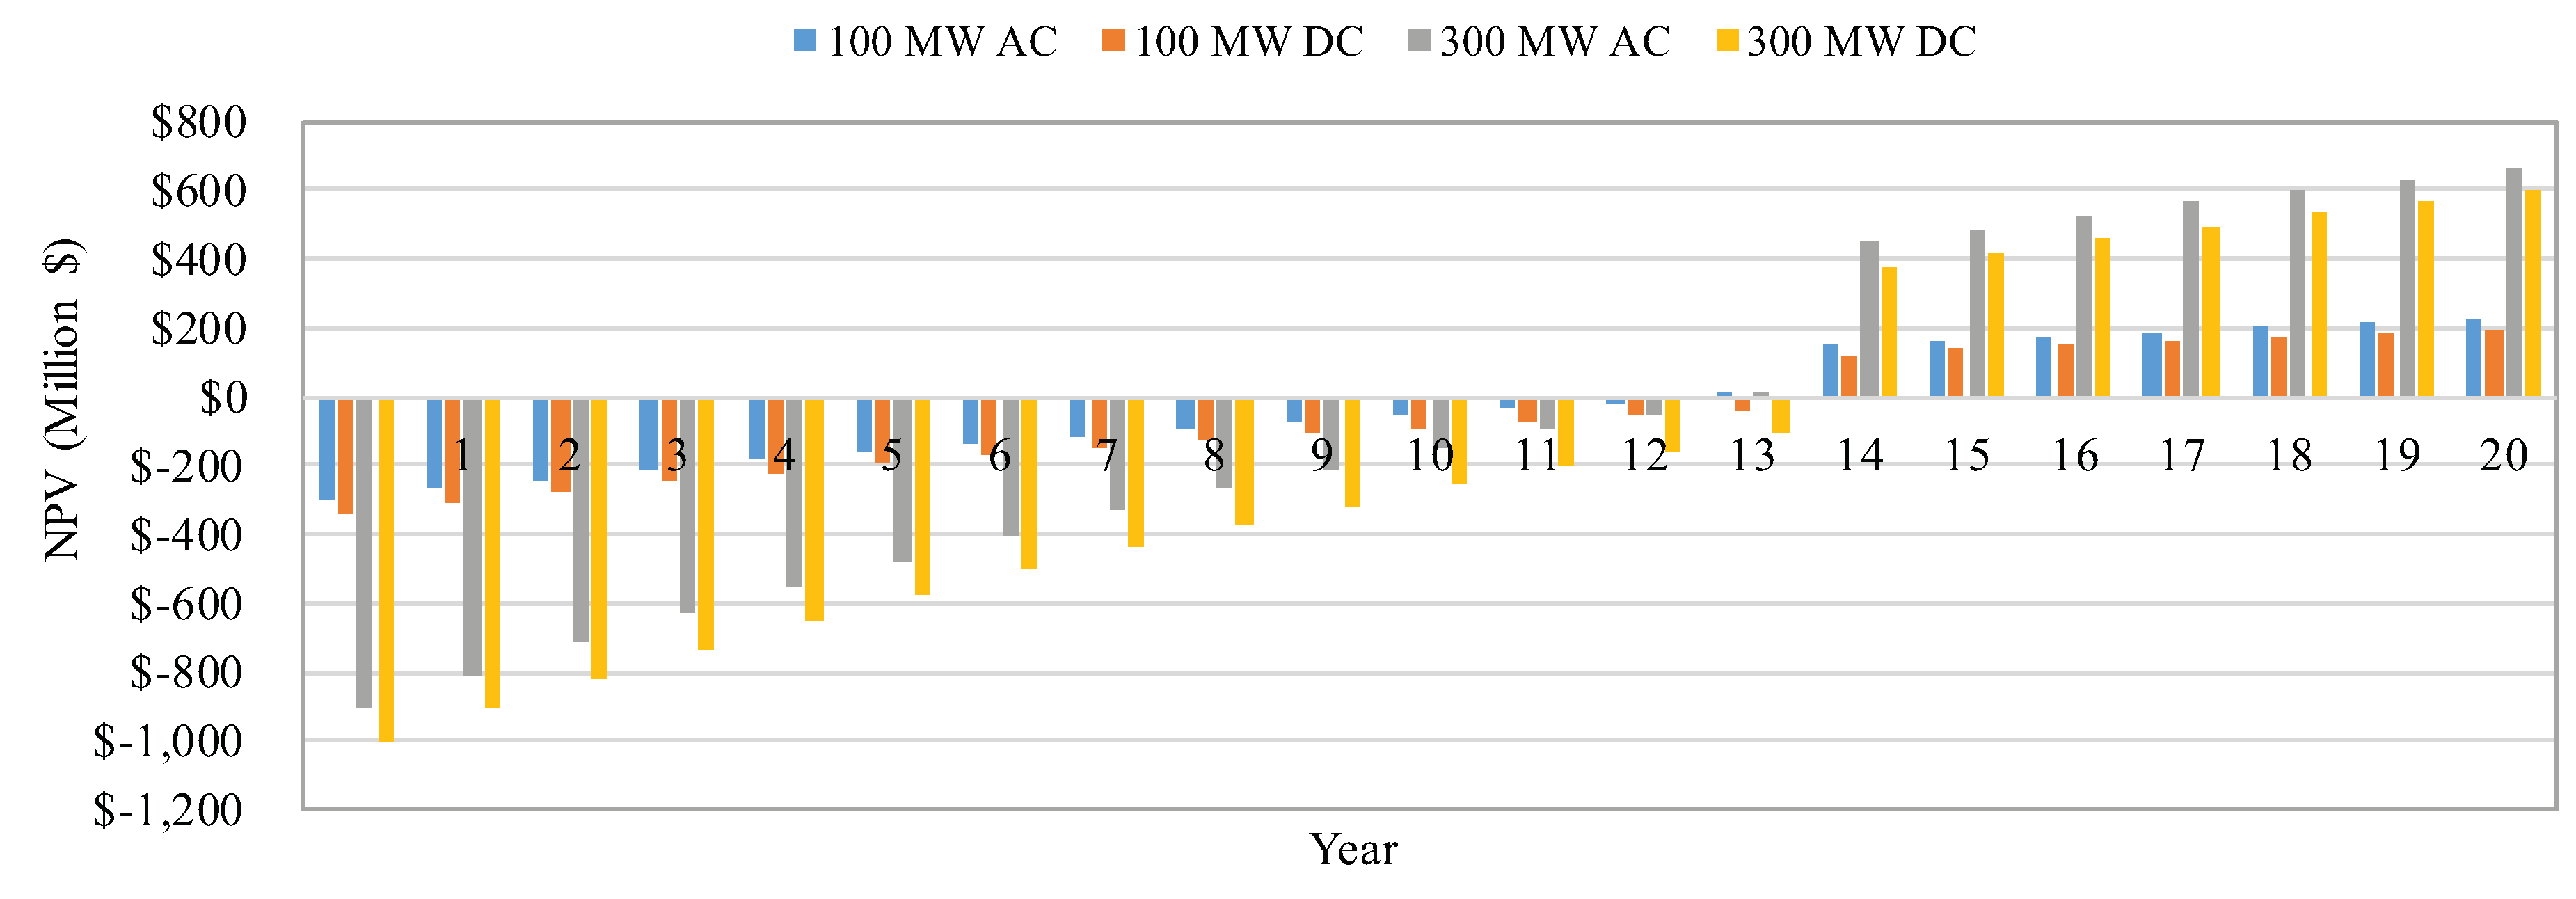
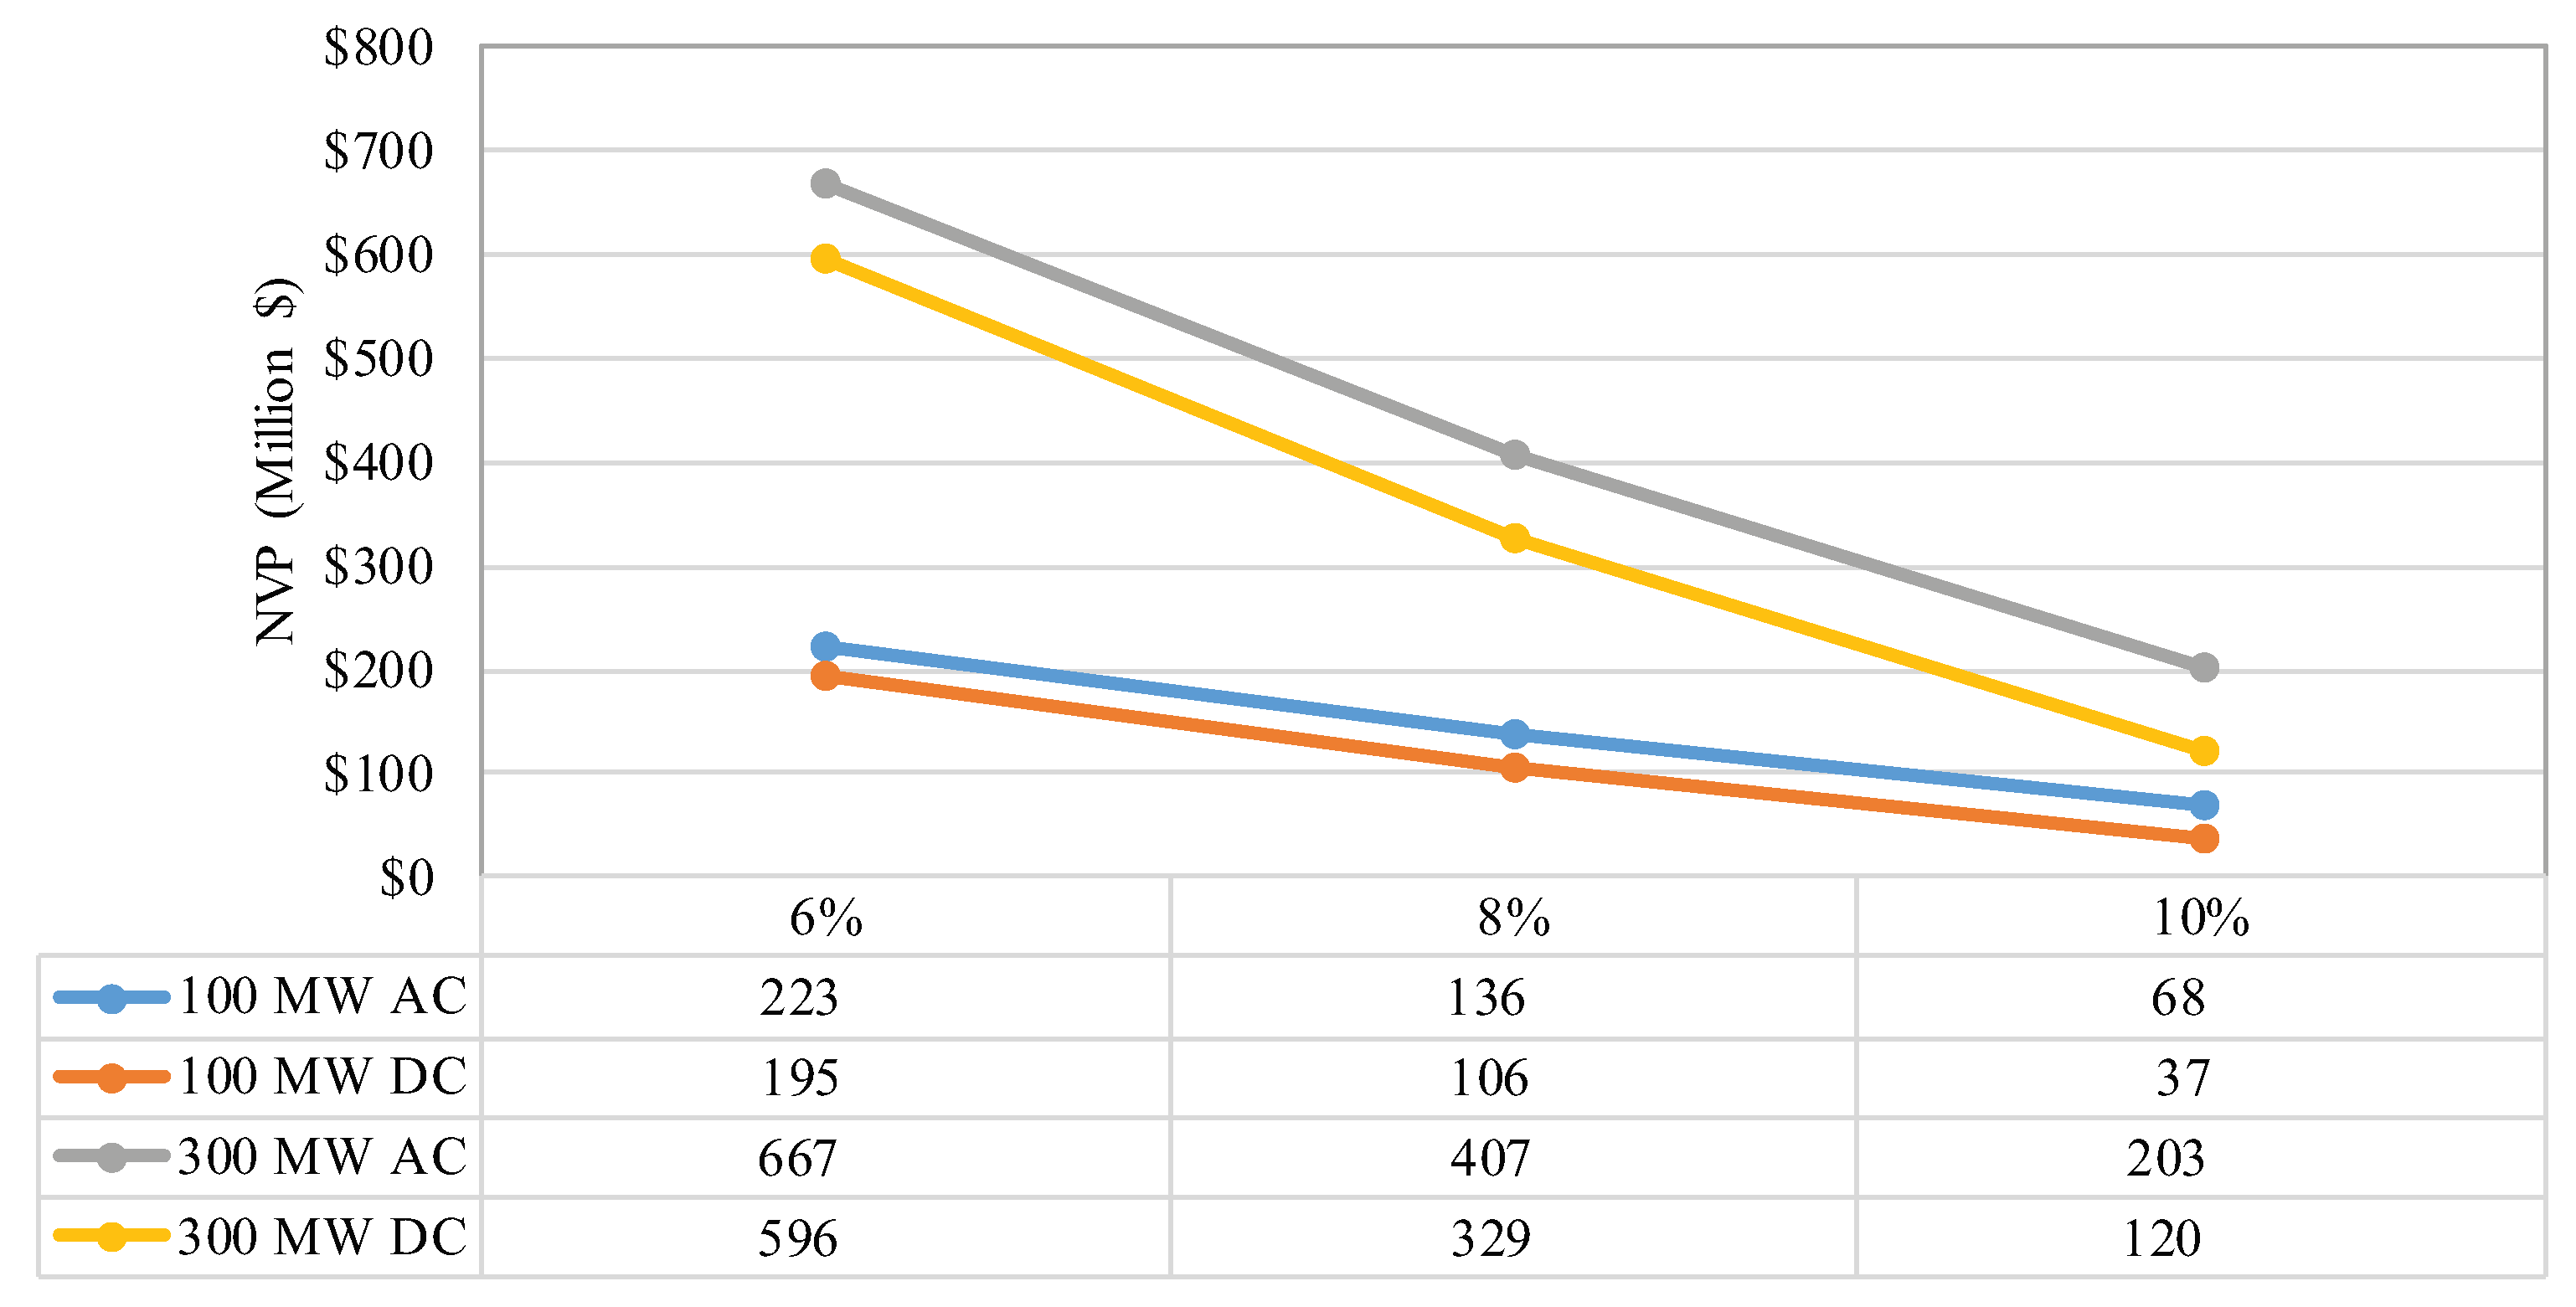
Figure 5 shows the NPV distribution over the entire lifespan of the OWF. It is proved that AC and DC options for larger wind farm size (e.g., 300 MW) are delivering a better NPV performance in comparison to the 100 MW wind farm size. DPBP for the AC configuration is found to be 13 years while it is 14 years for the DC options. The one year difference is due to higher CAPEX in DC options which is mainly contributed by the converters’ cost. The economic performance of the investigated electrical topologies in terms of NPV for various interest rates with the maximum FIT option is demonstrated in Figure 6. The 300 MW AC configuration under 6 % discount rate yields the best results with a NVP (i.e., 667 million$). Contrarily, the 100 MW DC option under a 10 % discount rate yields the worst performance in terms of NVP (i.e., 37 million). It is also shown that the OWF is economically viable for all interest rates considered for selected configurations and wind farm sizes. Nevertheless, the investigated OWF with both AC and DC electrical topologies for the 300 MW wind farm size is a superior investment option in case the discount rates are in the 6% range with the maximum FIT.

5.3. Sensitivity Analysis

The evaluation was extended with a sensitivity analysis to investigate the influence of capacity factor, transmission line length and the electrical topology with the 100 MW and 300 MW wind farm sizes on the technical and economic viability of OWFs. For this purpose, three different capacity factors with various transmission line lengths ranging from 20 km to 120 km were used. Based on the critical distance of 85 km given in Reference [11] and of 80 km in Reference [21], the transmission line length of 80 km and above distances are considered further offshore locations. Consequently, electrical losses and LCOEs are observed for the estimated values.
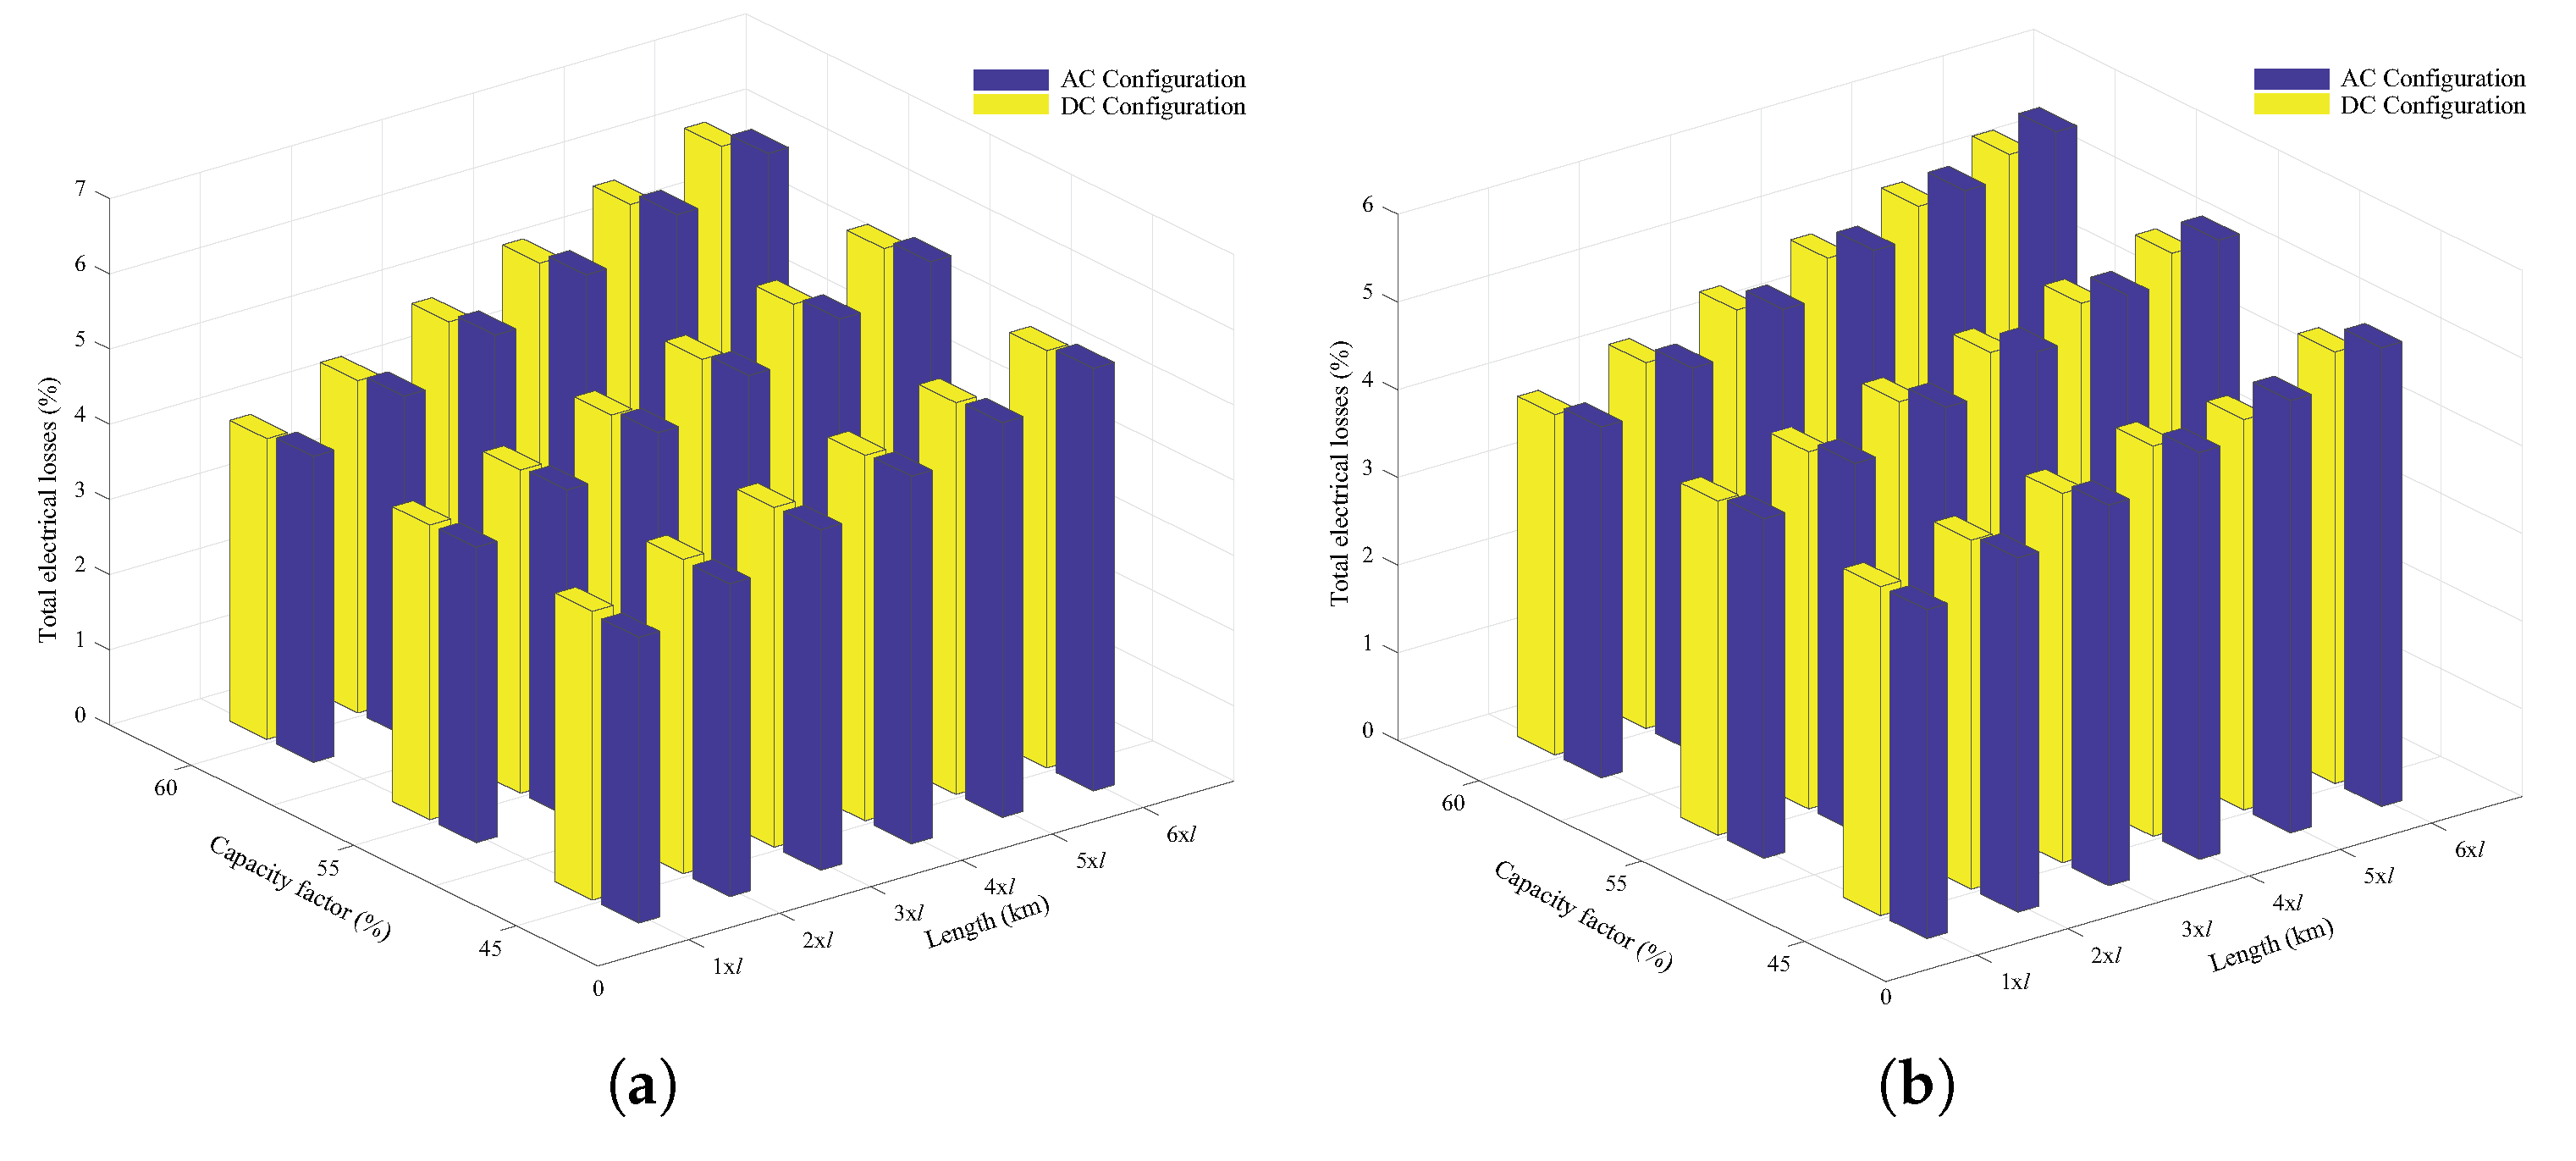
The impact of capacity factor and distance to shore on electrical losses is depicted in Figure 7. In terms of electrical losses, the DC configuration is found to be more favorable as the wind farm size, capacity factor and line lengths increase. Losses in the AC configuration range from 3.75% to 5.86% for 45% capacity factor with the transmission line length of the reference scenario (i.e., l = 19 km) and 60% capacity factor with a six-fold longer transmission line, respectively. Similarly, losses in the DC configuration vary between 3.75% and 5.34% for 45% capacity factor with the line length of l and 60% with a line length of 6 × l , respectively. As the wind farm size, capacity factor and transmission line length increase, the difference between the AC and DC configuration losses becomes significant. It is proved that transmission line length is more sensitive in losses estimation as compared to the capacity factor.
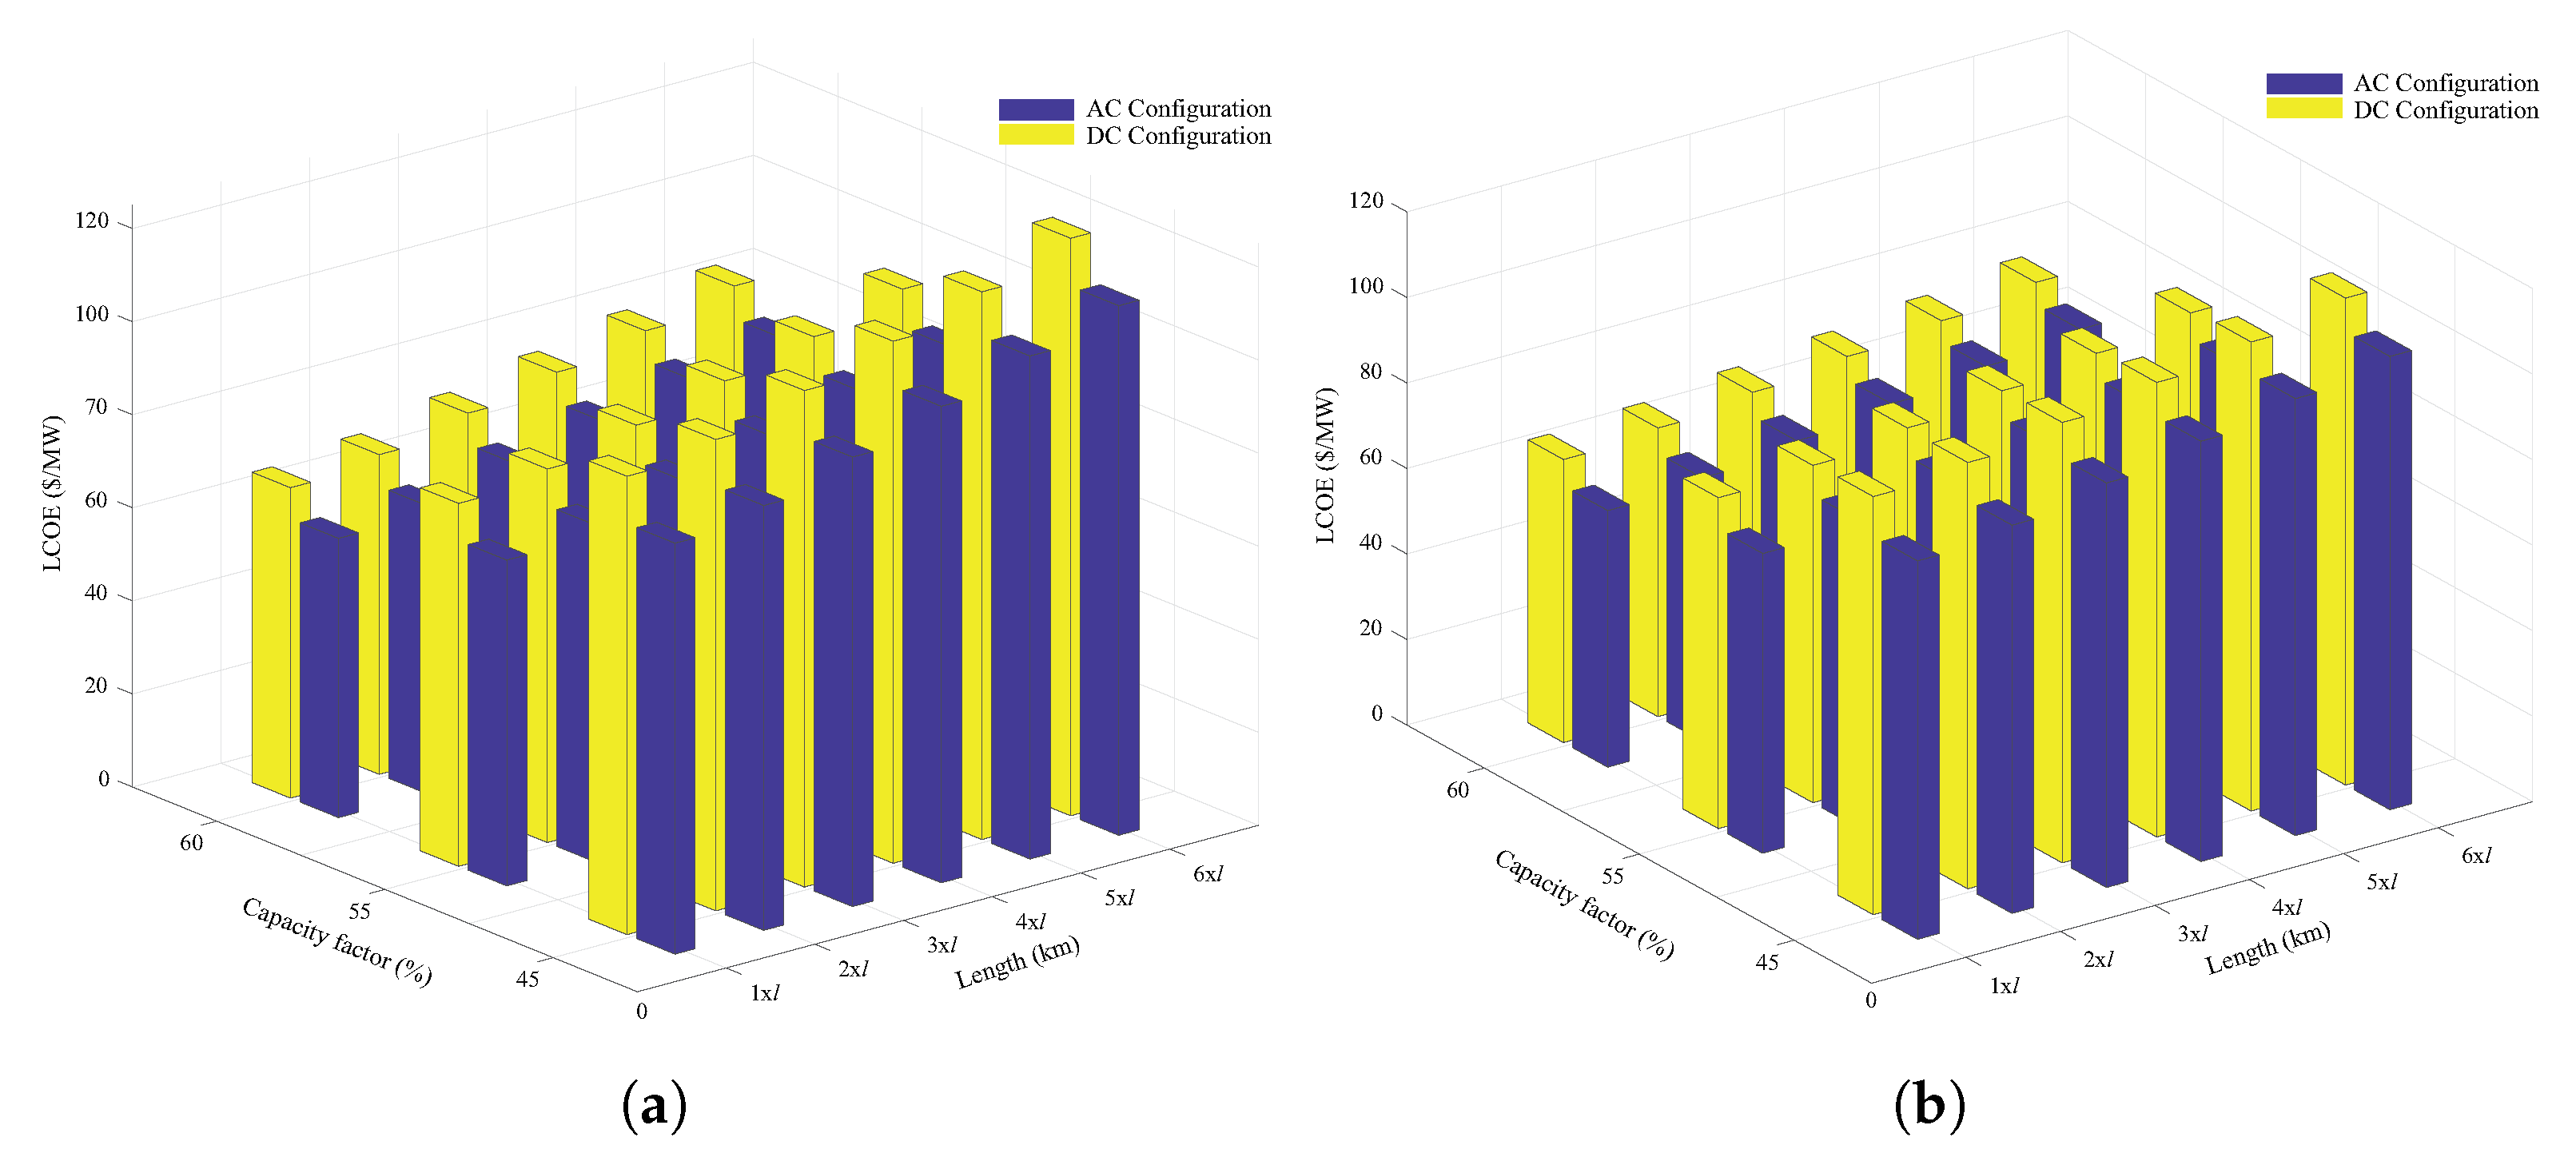
Figure 8 illustrates the impact of capacity factor and distance to shore on LCOE based on the 6% discount rate with the maximum FIT. In terms of LCOE, the AC configuration is found to be more favorable for all cases. It is shown that the best LCOE value is estimated to be 59.90 $/MWh for the AC configuration (i.e., 100 MW wind farm size) with 60% capacity factor and the transmission line of l. The highest LCOE value is, on the other hand, estimated to be 124.15 $/MWh for the DC configuration (e.g., 100 MW wind farm size) with 45% capacity factor and a transmission line of 6 × l . As the wind farm size, capacity factor and distance to shore increase, the difference between the AC and DC configuration LCOEs decreases. Unlike the impact on losses, the capacity factor proved to be more sensitive in LCOE estimation as compared to transmission line length.
It must be noted that this sensitivity analysis considers climatological conditions for the offshore sites with different capacity factors by using the MERRA 2 database for the annual energy yield calculations. However, due to a lack of publicly available data regarding seabed conditions, only one type of foundation structure (e.g., monopole) was considered for the CAPEX component of the foundation cost without any detailed investigation. Considering different types of foundation structures will sway LCOE estimation.

6. Conclusions

In this paper, the economic performance of the AC and DC configurations was investigated for examined OWF with two sizes (e.g., 100 MW and 300 MW). Annual energy yield and electrical losses estimation for AC and DC OWF configurations were detailed. An economic analysis was performed using detailed cost models for the system components. Finally, the impact of capacity factor, transmission line length and electrical topologies on the economic performance of OWF investments was explored through the sensitivity analysis. The analysis has yielded the following conclusions:
  • The studied OWF was found to be economically viable for both AC and DC configurations with 13 and 14 years of DPBPs for the AC and DC options, respectively. The estimated LCOEs for the AC and DC OWF configurations range from 88.34 $/MWh to 113.76 $/MWh and from 97.61 $/MWh to 126.60 $/MWh, respectively. LCOEs for both options slightly change even though the wind farm size was increased by three-fold.
  • Losses in the AC and DC configurations range from 3.75% to 5.86% and 3.75% to 5.34%, respectively, while LCOEs vary between 59.90 $/MWh and 113.76 $/MWh for the AC configuration and 66.21 $/MWh and 124.15 $/MWh for the DC configuration.
  • It was found that the transmission line length parameter is more sensitive in loss estimation while the capacity factor parameter is more sensitive in LCOE estimation.
  • It was proved that the superiority of AC configuration over the DC option in terms of LCOE decreases as capacity and transmission line length increase.
  • It was also shown that the advantage of DC configuration over the AC option in terms of losses increased as capacity factor and transmission line length increased.
The presented study provides a framework and methodology that can be used to verify the threshold point where LCOE of DC configuration reaches that of AC configuration for a particular wind farm. Although the techno-economic outcomes in this study are unique to the selected offshore sites, the presented methodology can be applied to other specific wind farms with various sizes using the given sensitivity analysis that may result in different break-even LCOE values.

Author Contributions

All authors contributed equally to this work.

Funding

This research received no external funding.

Conflicts of Interest

The authors declare no conflict of interest.

References

  1. Enerdata. 2018 Global Energy Trends Report. Available online: http://www.enerdata.net (accessed on 28 May 2019).
  2. International Energy Agency (IEA). Available online: https://www.iea.org/geco/electricity/ (accessed on 10 August 2019).
  3. Saidur, R.; Islam, M.R.; Rahim, N.A.; Solangi, K.H. A review on global wind energy policy. Renew. Sustain. Energy Rev. 2010, 14, 1744–1762. [Google Scholar] [CrossRef]
  4. Argin, M.; Yerci, V.; Erdogan, N.; Kucuksari, S.; Cali, U. Exploring the offshore wind energy potential of Turkey based on multi-criteria site selection. Energy Strategy Rev. 2019, 23, 33–46. [Google Scholar] [CrossRef]
  5. Serrano Gonzalez, J.; Burgos Payan, M.; Riquelme Santos, J. Optimum design of transmissions systems for offshore wind farms including decision making under risk. Renew. Energy 2013, 59, 115–127. [Google Scholar] [CrossRef]
  6. Global Wind Energy Council (GWEC). Global Wind Report 2018. Available online: http://www.gwec.net (accessed on 30 April 2019).
  7. Salo, O.; Syri, S. What economic support is needed for Arctic offshore wind power? Renew. Sustain. Energy Rev. 2014, 31, 343–352. [Google Scholar] [CrossRef]
  8. Cali, U.; Erdogan, N.; Kucuksari, S.; Argin, M. Techno-economic analysis of high potential offshore wind farm locations in Turkey. Energy Strategy Rev. 2018, 22, 325–336. [Google Scholar] [CrossRef]
  9. Gardner, P. Offshore wind energy: Resources, technology and grid connection. In First International Workshop on Feasibility of HVDC Transmission for Offshore Wind Farms; KTH Royal Institute of Technology: Stockholm, Sweden, 2000. [Google Scholar]
  10. Houghton, T.; Bell, K.R.W.; Doquet, M. Offshore transmission for wind: Comparing the economic benefits of different offshore network configurations. Renew. Energy 2016, 94, 268–279. [Google Scholar] [CrossRef] [Green Version]
  11. Reed, G.F.; Hassan, H.A.A.; Korytowski, M.J.; Lewis, P.T.; Grainger, B.M. Comparison of HVAC and HVDC solutions for offshore wind farms with a procedure for system economic evaluation. In Proceedings of the IEEE Energytech, Cleveland, OH, USA, 21–23 May 2013; pp. 1–7. [Google Scholar]
  12. Morton, A.B.; Cowdroy, S.; Hill, J.R.A.; Halliday, M.; Nicholson, G.D. AC or DC? Economics of grid connection design for offshore wind farms. In Proceedings of the 8th IEE International Conference on AC and DC Power Transmission (ACDC 2006), London, UK, 28–31 March 2006; pp. 236–240. [Google Scholar]
  13. Ruddy, J.; Meere, R.; O’Donnell, T. Low Frequency AC transmission for offshore wind power: A review. Renew. Sustain. Energy Rev. 2016, 56, 75–86. [Google Scholar] [CrossRef]
  14. Gonzalez, J.S.; Payan, M.B.; Santos, J.M.R.; Gonzalez-Longatt, F. A review and recent developments in the optimal wind-turbine micro-siting problem. Renew. Sustain. Energy Rev. 2014, 30, 133–144. [Google Scholar] [CrossRef]
  15. Musasa, K.; Nwulu, N.I.; Gitau, M.N.; Bansal, R.C. Review on DC collection grids for offshore wind farms with high-voltage DC transmission system. IET Power Electron. 2017, 10, 2104–2115. [Google Scholar] [CrossRef]
  16. Gil, M.D.P.; Domínguez-García, J.L.; Díaz-González, F.; Aragüés-Peñalba, M.; Gomis-Bellmunt, O. Feasibility analysis of offshore wind power plants with DC collection grid. Renew. Energy 2015, 78, 467–477. [Google Scholar] [Green Version]
  17. Xu, L.; Yao, L. DC voltage control and power dispatch of a multi-terminal HVDC system for integrating large offshore wind farms. IET Renew. Power Gener. 2011, 5, 223–233. [Google Scholar] [CrossRef]
  18. Kong, X.; Jia, H. Techno-Economic Analysis of SVC-HVDC Transmission System for Offshore Wind. In Proceedings of the 2011 Asia-Pacific Power and Energy Engineering Conference, Wuhan, China, 25–28 March 2011; pp. 1–5. [Google Scholar]
  19. Xiang, X.; Merlin, M.M.C.; Green, T.C. Techno-Cost analysis and comparison of HVAC, LFAC and HVDC for offshore wind power connection. In Proceedings of the 12th IET International Conference on AC and DC Power Transmission (ACDC 2016), Beijing, China, 28–29 May 2016. [Google Scholar]
  20. Hassan, A. Hamdan and Brian Kinsella. Using a VSC Based HVDC Application to Energize Offshore Platforms from Onshore—A Life-cycle Economic Appraisal. Energy Procedia 2017, 105, 3101–3111. [Google Scholar]
  21. Eeckhout, B.V. The Economic Value of VSC HVDC Compared to HVAC for Offshore Wind Farms. Ph.D. Thesis, Katholieke Universiteit Leuven, Leuven, Belgium, 2007. [Google Scholar]
  22. Elliott, D.; Bell, K.R.W.; Finney, S.J.; Adapa, R.; Brozio, C.; Yu, J.; Hussain, K. A Comparison of AC and HVDC Options for the Connection of Offshore Wind Generation in Great Britain. IEEE Trans. Power Deliv. 2016, 31, 798–809. [Google Scholar] [CrossRef]
  23. Abdulrahman, A.; Santiago, B.; Omar, E.; Grain, A.; Callum, M. HVDC Transmission: Technology Review, Market Trends and Future Outlook. Renew. Sustain. Energy Rev. 2019, 112, 530–554. [Google Scholar]
  24. Johnson, M.H.; Aliprantis, D.C.; Chen, H. Offshore wind farm with DC collection system. In Proceedings of the 2013 IEEE Power and Energy Conference at Illinois (PECI), Champaign, IL, USA, 22 February 2013; pp. 53–59. [Google Scholar]
  25. Lakshmanan, P.; Liang, J.; Jenkins, N. Assessment of collection systems for HVDC connected offshore wind farms. Electr. Power Syst. Res. 2015, 129, 75–82. [Google Scholar] [CrossRef] [Green Version]
  26. Ebenhoch, R. Comparative Levelized Cost of Energy Analysis. Energy Procedia 2015, 80, 108–122. [Google Scholar] [CrossRef] [Green Version]
  27. Masters, G.M. Renewable and Efficient Electric Power Systems; John Wiley & Sons: Hoboken, NJ, USA, 2013. [Google Scholar]
  28. Cali, U. Grid and Market Integration of Large-Scale Wind Farms Using Advanced Wind Power Forecasting: Technical and Energy Economic Aspects; Kassel University Press GmbH: Kassel, Germany, 2011; pp. 1–156. [Google Scholar]
  29. Renewables.ninja. 2017. Available online: https://www.renewables.ninja/ (accessed on 29 January 2019).
  30. Staffell, I.; Pfenninger, S. Using bias-corrected reanalysis to simulate current and future wind power output. Energy 2016, 114, 1224–1239. [Google Scholar] [CrossRef] [Green Version]
  31. Siemens. Wind Turbine SWT-4.0-130 Technical Specifications. 2015. Available online: https://www.thewindpower.net/scripts/fpdf181/turbine.php?id=957 (accessed on 25 May 2019).
  32. Al Ameri, A.; Ounissa, A.; Nichita, C.; Djamal, A. Power Loss Analysis for Wind Power Grid Integration Based on Weibull Distribution. Energies 2017, 10, 463. [Google Scholar] [CrossRef]
  33. ABB. HiPak IGBT Modules Data Sheet. 2014. Available online: www.abb.com/semiconductors (accessed on 12 January 2019).
  34. Zhang, X.; Green, T.C. The modular multilevel converter for high step-up ratio DC–DC conversion. IEEE Trans. Ind. Electron. 2015, 62, 4925–4936. [Google Scholar] [CrossRef]
  35. Gultekin, B.; Gercek, C.O.; Atalik, T.; Deniz, M.; Bicer, N.; Ermis, M.; Kose, K.N.; Ermis, C.; Ko, E.; Cadirci, I.; et al. Design and Implementation of a 154-kV±50-Mvar Transmission STATCOM Based on 21-Level Cascaded Multilevel Converter. IEEE Trans. Ind. Appl. 2012, 48, 1030–1045. [Google Scholar] [CrossRef]
  36. Mamane, C. Transformer Loss Evaluation: User-Manufacturer Communications. IEEE Trans. Ind. Appl. 1984, 20, 11–15. [Google Scholar] [CrossRef]
  37. Lerch, M.; De-Prada-Gil, M.; Molins, C.; Benveniste, G. Sensitivity analysis on the levelized cost of energy for floating offshore wind farms. Sustain. Energy Technol. Assess. 2018, 30, 77–90. [Google Scholar] [CrossRef]
  38. Gonzalez-Rodrigue, A.G. Review of offshore wind farm cost components. Energy Sustain. Dev. 2017, 37, 10–19. [Google Scholar] [CrossRef]
  39. Dicorato, M.; Forte, G.; Pisani, M.; Trovato, M. Guidelines for assessment of investment cost for offshore wind generation. Renew. Energy 2011, 36, 2043–2051. [Google Scholar] [CrossRef]
  40. Wei, Q.; Wu, B.; Xu, D.; Zargari, N.R. IOP Conference Series: Earth and Environmental Science. In Proceedings of the 12th IET International Conference on AC and DC Power Transmission (ACDC 2016), Beijing, China, 28–29 May 2016. [Google Scholar]
  41. Koch, H.; Retzmann, D. Connecting large offshore wind farms to the transmission network. In Proceedings of the IEEE PES T&D 2010, New Orleans, LA, USA, 19–22 April 2010. [Google Scholar]
  42. Europa Cable. An Introduction to High Voltage Direct Current (HVDC) Underground Cables. Technical Brochure. Available online: www.europacable.eu (accessed on 12 January 2019).
  43. ENSO. Offshore Transmission Technology. 2011. Available online: https://www.entsoe.eu (accessed on 20 February 2019).
  44. Zaccone, E. High voltage underground and subsea cable technology options for future transmission in Europe. In Proceedings of the European Electricity Grid Initiative E-Highway 2050 Workshop, Brussels, Belgium, 15 April 2014. [Google Scholar]
  45. Lundberg, S. Performance Comparison of Wind Park Configurations; Technical Report; Chalmers University of Technology: Gothenburg, Sweden, 2003. [Google Scholar]
  46. ABB. HVDC Light. 2011. Available online: www.new.abb.com/docs/default-source/ewea-doc/hvdc-light.pdf (accessed on 20 February 2019).
  47. BS6622/BS7835 Three Core Armoured 33kV XLPE Stranded Copper Conductors. Prysmian. 2011. Available online: www.powerandcables.com (accessed on 20 February 2019).
  48. BS6622/BS7835 Three Core Armoured 33kV XLPE Stranded Copper Conductors. 6-36kV Medium Voltage Underground Power Cables XLPE Insulated Cables. 2019. Available online: www.nexans.co.uk (accessed on 20 February 2019).
  49. Nieradzinska, K.; MacIver, C.; Gill, S.; Agnew, G.A.; Anaya-Lara, O.; Bell, K.R.W. Optioneering analysis for connecting Dogger Bank offshore wind farms to the GB electricity network. Renew. Energy 2016, 91, 120–129. [Google Scholar] [CrossRef] [Green Version]
  50. Daniel Manrique, O. Design of the HVDC Connection of a 425 MW Offshore Wind Farm to the German Network; Technical Report; Universidad Pontificia: Madrid, Spain, 2017. [Google Scholar]
  51. Stamatiou, G. Techno-Economical Analysis of DC Collection Grid for Offshore Wind Parks. Master’s Thesis, The University of Nottingham, Nottingham, UK, 2010. [Google Scholar]
  52. Lazaridis, L.P. Economic Comparison of HVAC and HVDC Solutions for Large Offshore Wind Farms underSpecial Consideration of Reliability. Master’s Thesis, School of Electrical Engineering, KTH, Stockholm, Sweden, 2005. [Google Scholar]
  53. Stamatiou, G.; Srivastava, K.; Reza, M.; Zanchetta, P. Economics of DC Wind Collection Grid as Affected by Cost of Key Components. In Proceedings of the World Renewable Energy Congress-Sweden, Linköping, Sweden, 8–13 May 2011. [Google Scholar]
  54. Korompili, A.; Wu, Q.; Zhao, H. Review of VSC HVDC connection for offshore wind power integration. Renew. Sustain. Energy Rev. 2016, 59, 1405–1414. [Google Scholar] [CrossRef] [Green Version]
  55. Heimiller, D.; Ho, J.; Moné, C.; Hand, M. 2015 Cost of Wind Energy Review. In National Renewable Energy Laboratory/TP-6A20-66861 Technical Report; 2017; 115p. Available online: https://www.nrel.gov/docs/fy17osti/66861.pdf (accessed on 12 July 2019).
  56. Kempton, W.; McClellan, S.; Ozkan, D. Massachusetts offshore wind future cost study. Special Initiative on Offshore Wind; University of Delaware: Newark, DE, USA, 2016. [Google Scholar]
  57. Kim, J.-Y.; Oh, K.-Y.; Kang, K.-S.; Lee, J.-S. Site selection of offshore wind farms around the korean peninsula through economic evaluation. Renew. Energy 2013, 54, 189–195. [Google Scholar] [CrossRef]
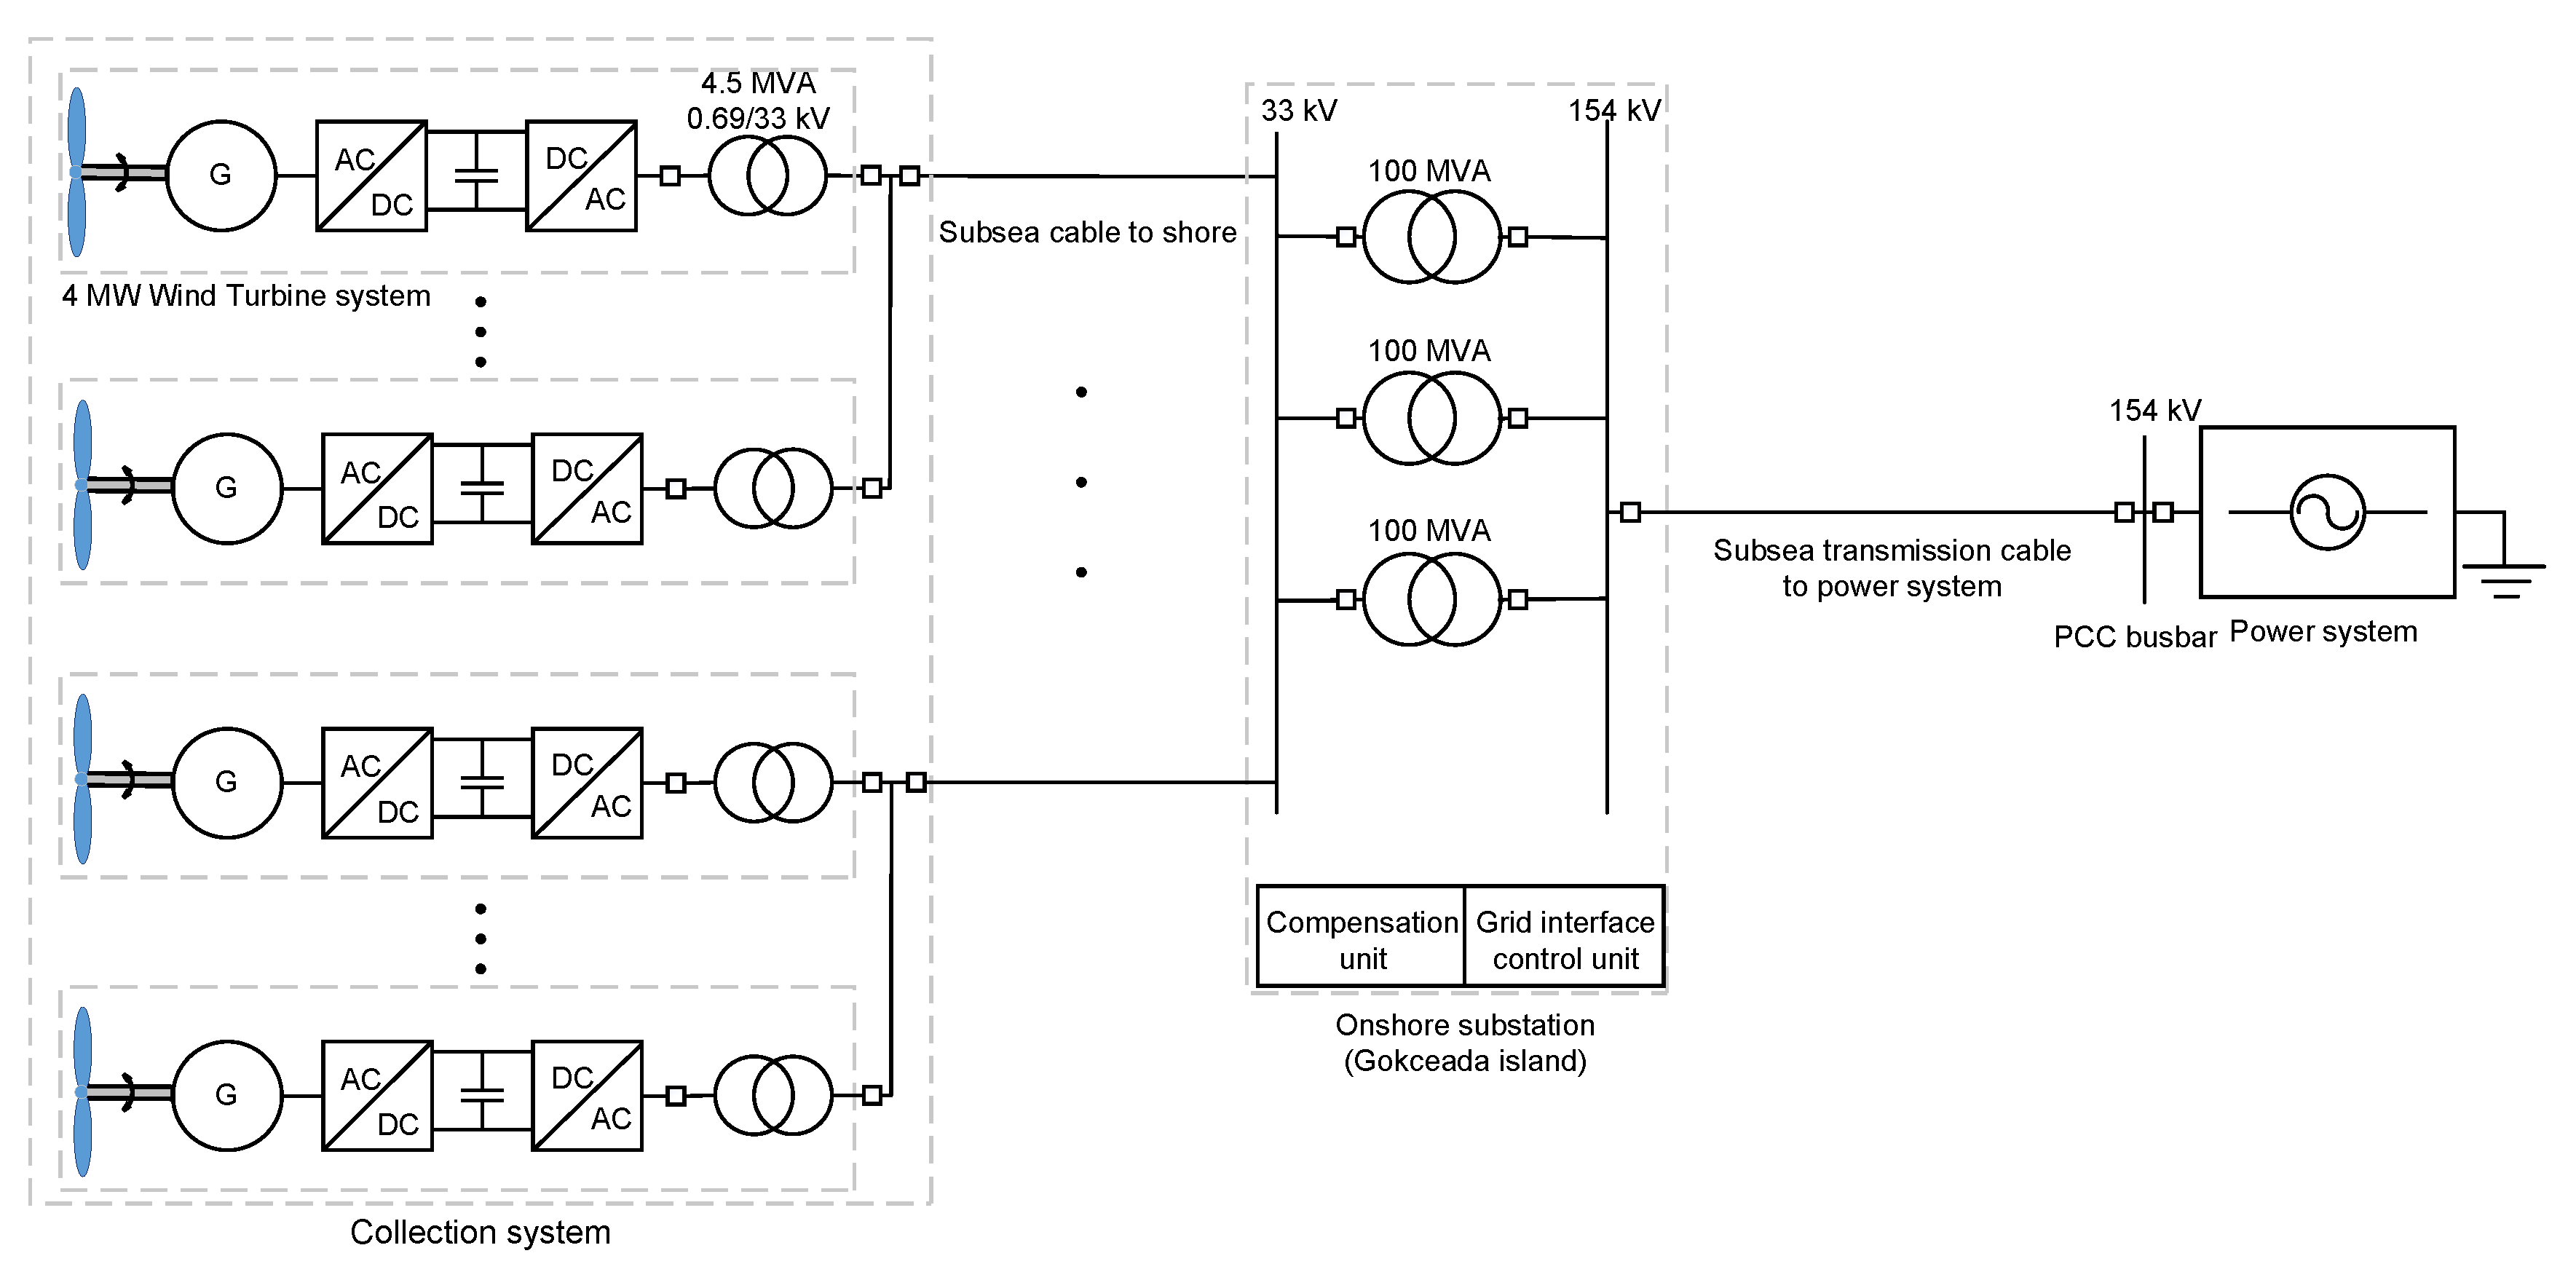
Figure 1. Configuration of proposed AC OWF.
Energies 12 03191 g001
Figure 2. Configuration of proposed DC OWF.
Energies 12 03191 g002
Figure 3. Proposed electrical layouts of the OWF collection system: (a) 100 MW. (b) 300 MW. Each circle represents the wind turbine system given in Figure 1 and Figure 2.
Energies 12 03191 g003
Figure 4. LCOEs of the OWFsfor AC and DC configurations for various discount rates.
Energies 12 03191 g004
Figure 5. The discounted cash flow of the OWF in terms of years for AC and DC configurations.
Energies 12 03191 g005
Figure 6. The variation of NPV of the OWF in terms of discount rates for AC and DC configurations.
Energies 12 03191 g006
Figure 7. Losses evaluation for AC and DC configurations with respect to capacity factor and transmission line length: (a) 100 MW layout. (b) 300 MW layout.
Energies 12 03191 g007
Figure 8. LCOE evaluation for AC and DC configurations with respect to capacity factor and transmission line length: (a) 100 MW layout. (b) 300 MW layout.
Energies 12 03191 g008
Table 1. Rated values for Parameters of the IGBTmodules used in the converters [33].
Parameter5SNA 3600E1703005SNA 1200G4503005SNA 0750G650300
V C E S (V)170045006500
I C (A)36001200750
V C E O (V)2.52.62.9
R C (m Ω )0.0550.070.07
E o n T (mJ)110043506400
E o f f T (mJ)160060005300
V D O (V)1.853.23.2
R D (m Ω )0.0940.340.13
E o n D (mJ)108027302700
Table 2. DC cable costs considered for collection and transmission systems.
Voltage (kV)TopologyCable Cross-Section (mm 2 )Price (€/m)
30Monopole9550
30Monopole12061
30Monopole18586
30Monopole300124
30Monopole400147
30Monopole500175
30Monopole630207
30Monopole1000279
30Monopole1400339
30Monopole1600368
150Bipole150201
150Bipole630479
Table 3. Annual Energy Losses of each components in the AC and DC Offshore Configurations.
AC Configuration100 MW 300 MW
(kWh)(%)(kWh)(%)
Collection cables190,5640.05700,3930.06
Transmission cable1,422,1270.363,490,6760.30
Total line losses1,612,6920.414,191,0700.36
Power electronics including transformer13,256,0693.3939,768,2063,39
Total energy losses14,868,7603.8043,959,2763,75
DC Configuration100 MW 300 MW
(kWh)(%)(kWh)(%)
Collection cables129,0180.03515,9440.04
Transmission cable1,069,2790.272,748,1870.23
Total line losses1,198,2970.313,264,1310.28
Power electronics13,552,1233.4640,697,9993.47
Total energy losses14,750,4203.7743,962,1293.75
Table 4. Cost–benefit analysis components of the OWF for AC and DC configurations.
AC 100 MWDC 100 MWAC 300 MWDC 300 MW
Capacity factor at PCC  (%)41.2441.2041.2441.24
Net AEP  (kWh/year)361,344,935361,194,6881,084,598,2341,084,598,234
Annual Revenue with base FIT  (million$)26.3826.3779,1879,18
Annual Revenue with max FIT  (million$)39.7539.73119.31119.31
CAPEX  (million$)300.59335.01903.88998.72
OPEX  (million$/20 years)5.716.3717.1718.98