Power Output Enhancement of a Ducted Wind Turbine by Stabilizing Vortices around the Duct


Abstract
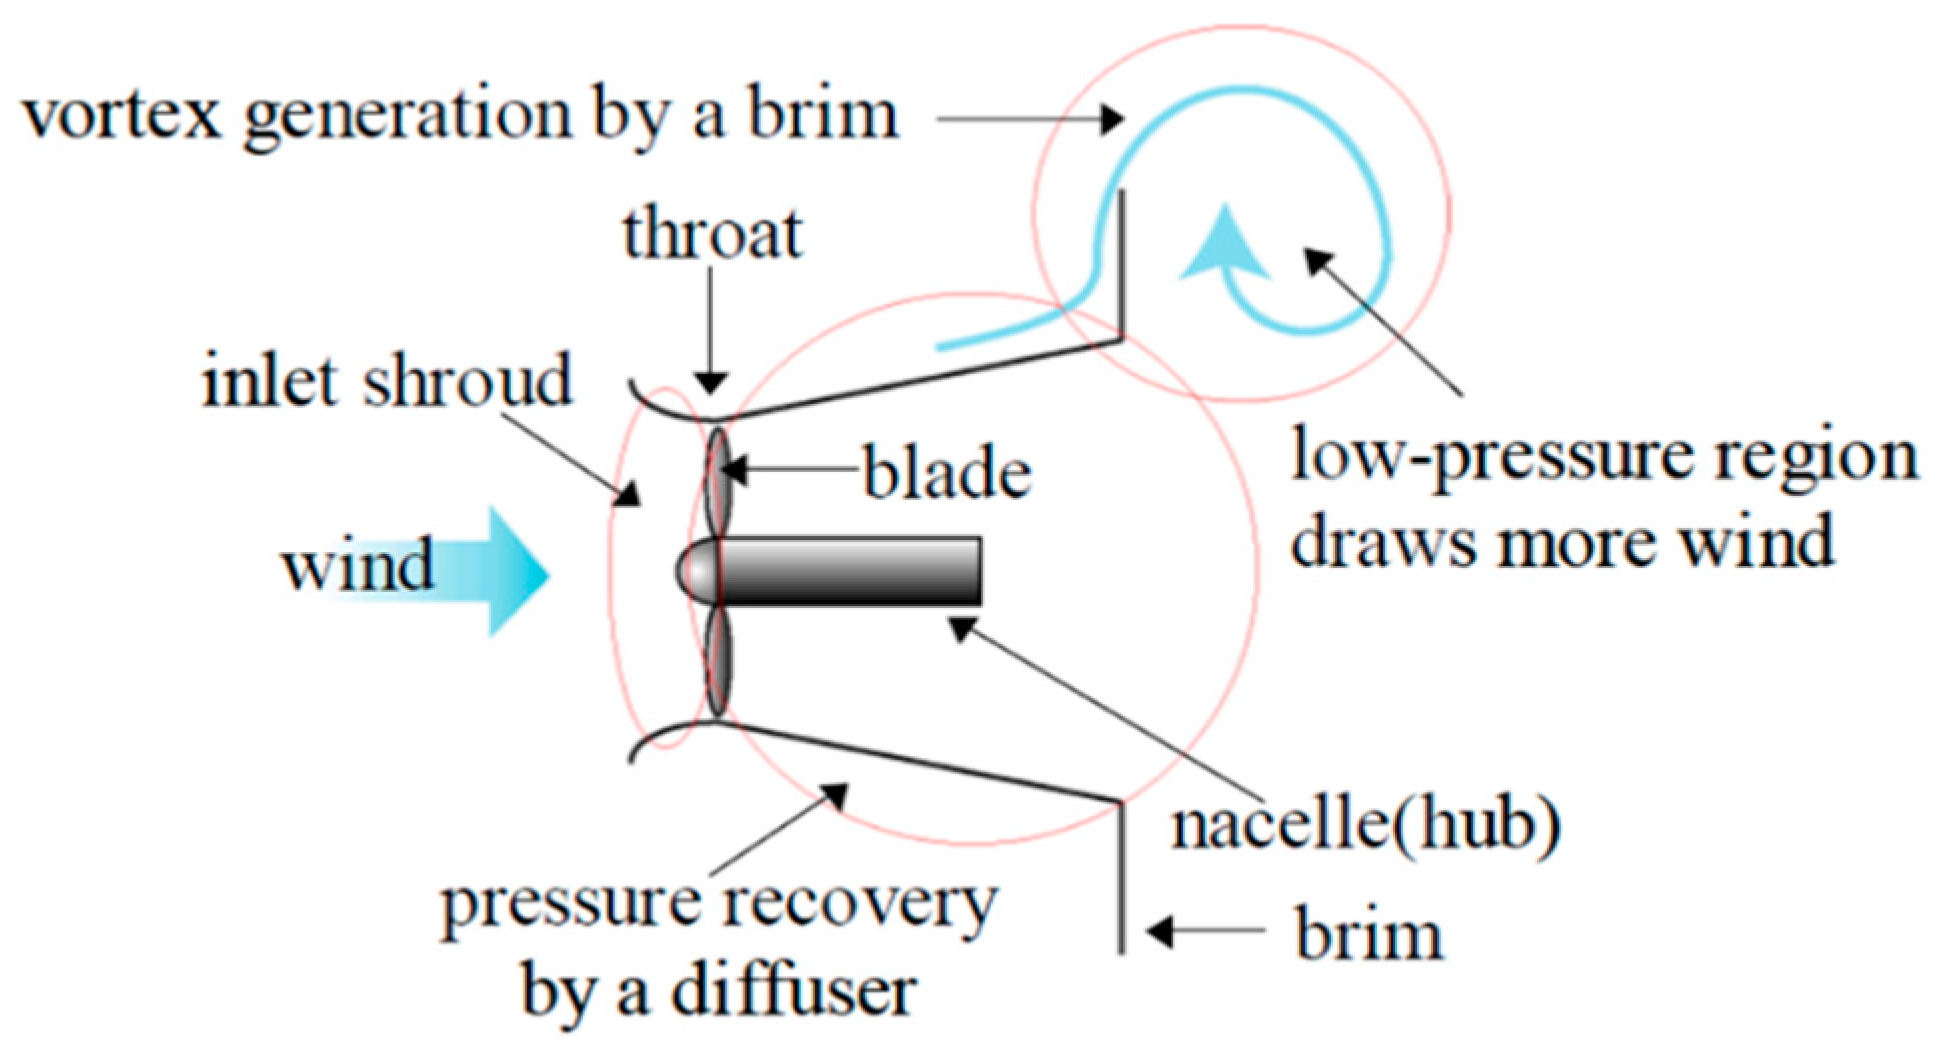
1. Introduction
2. Materials and Methods
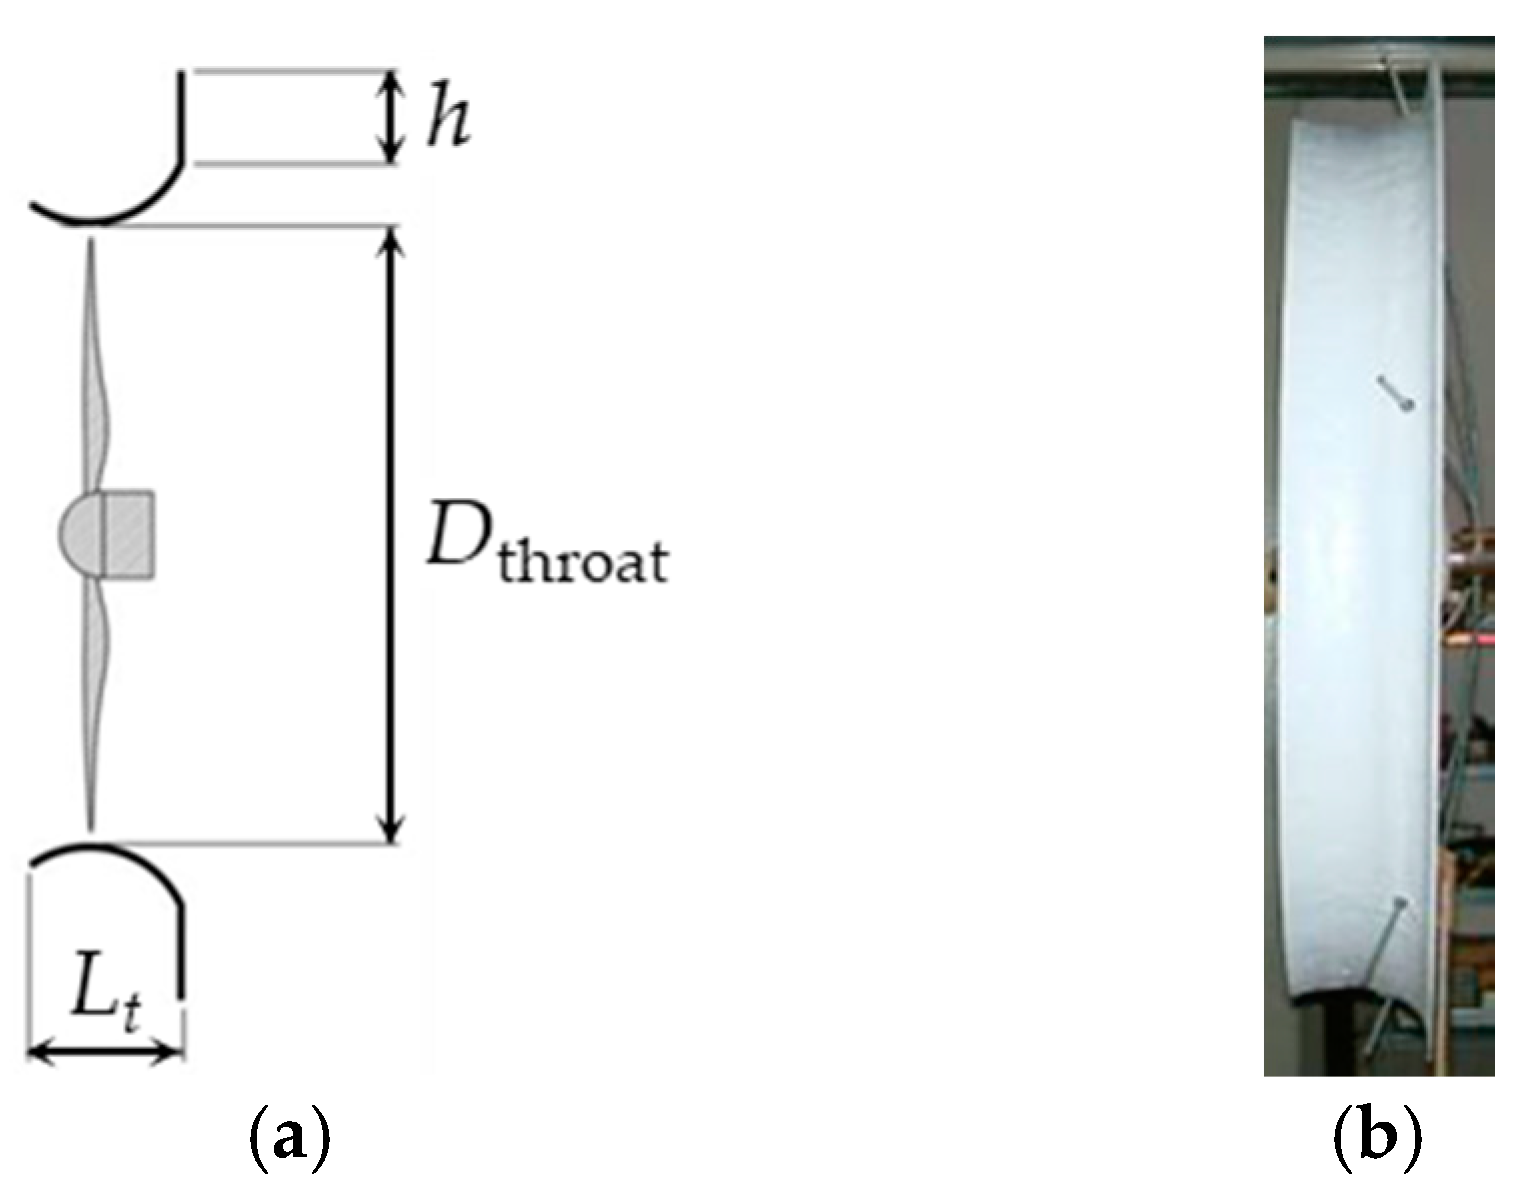
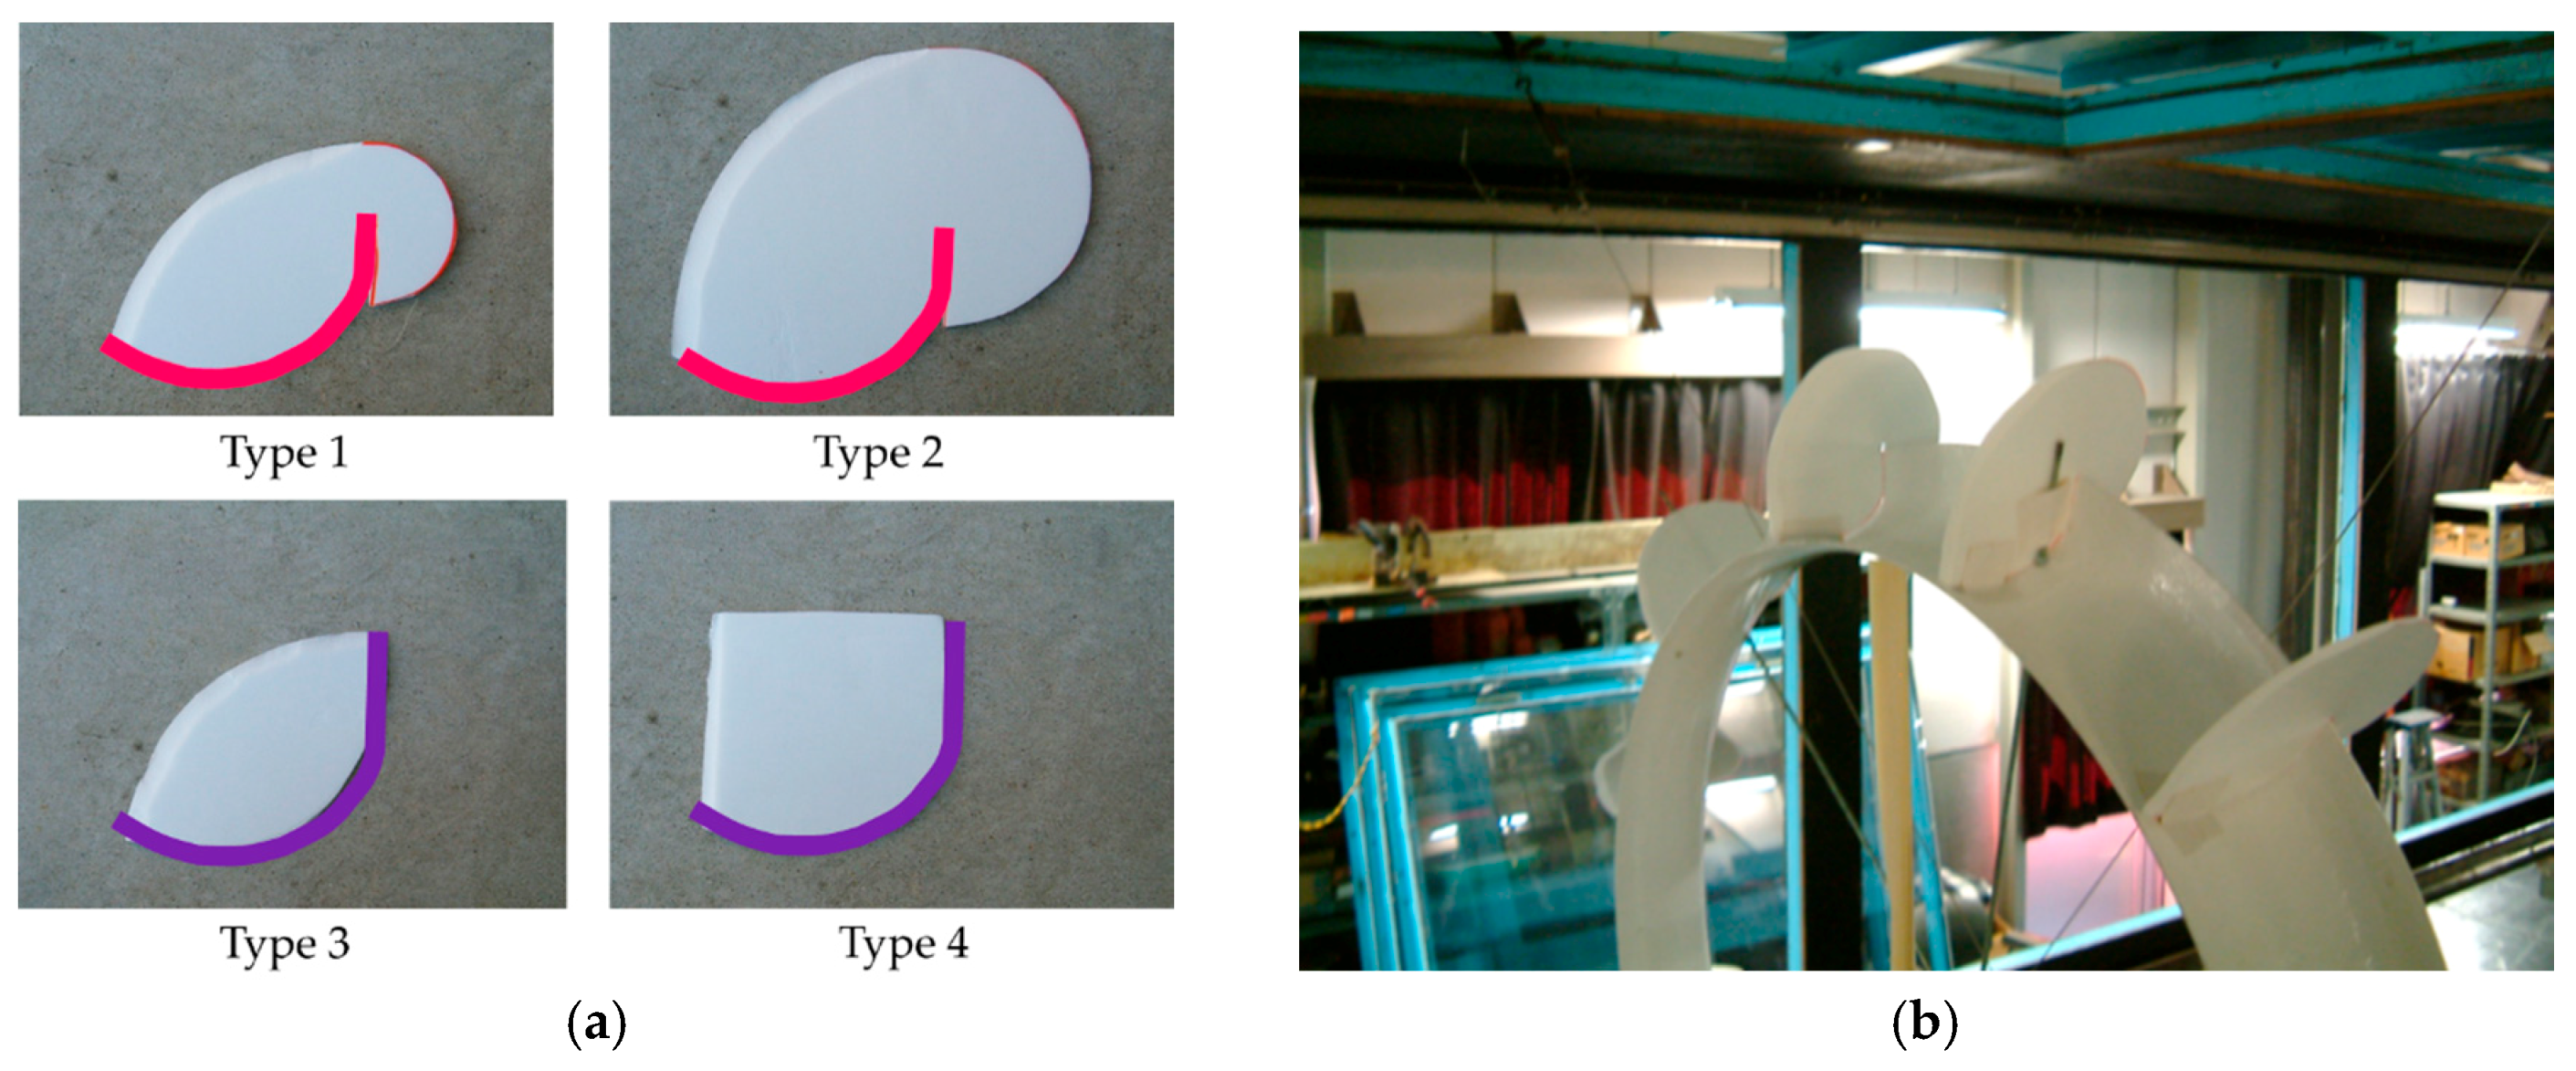
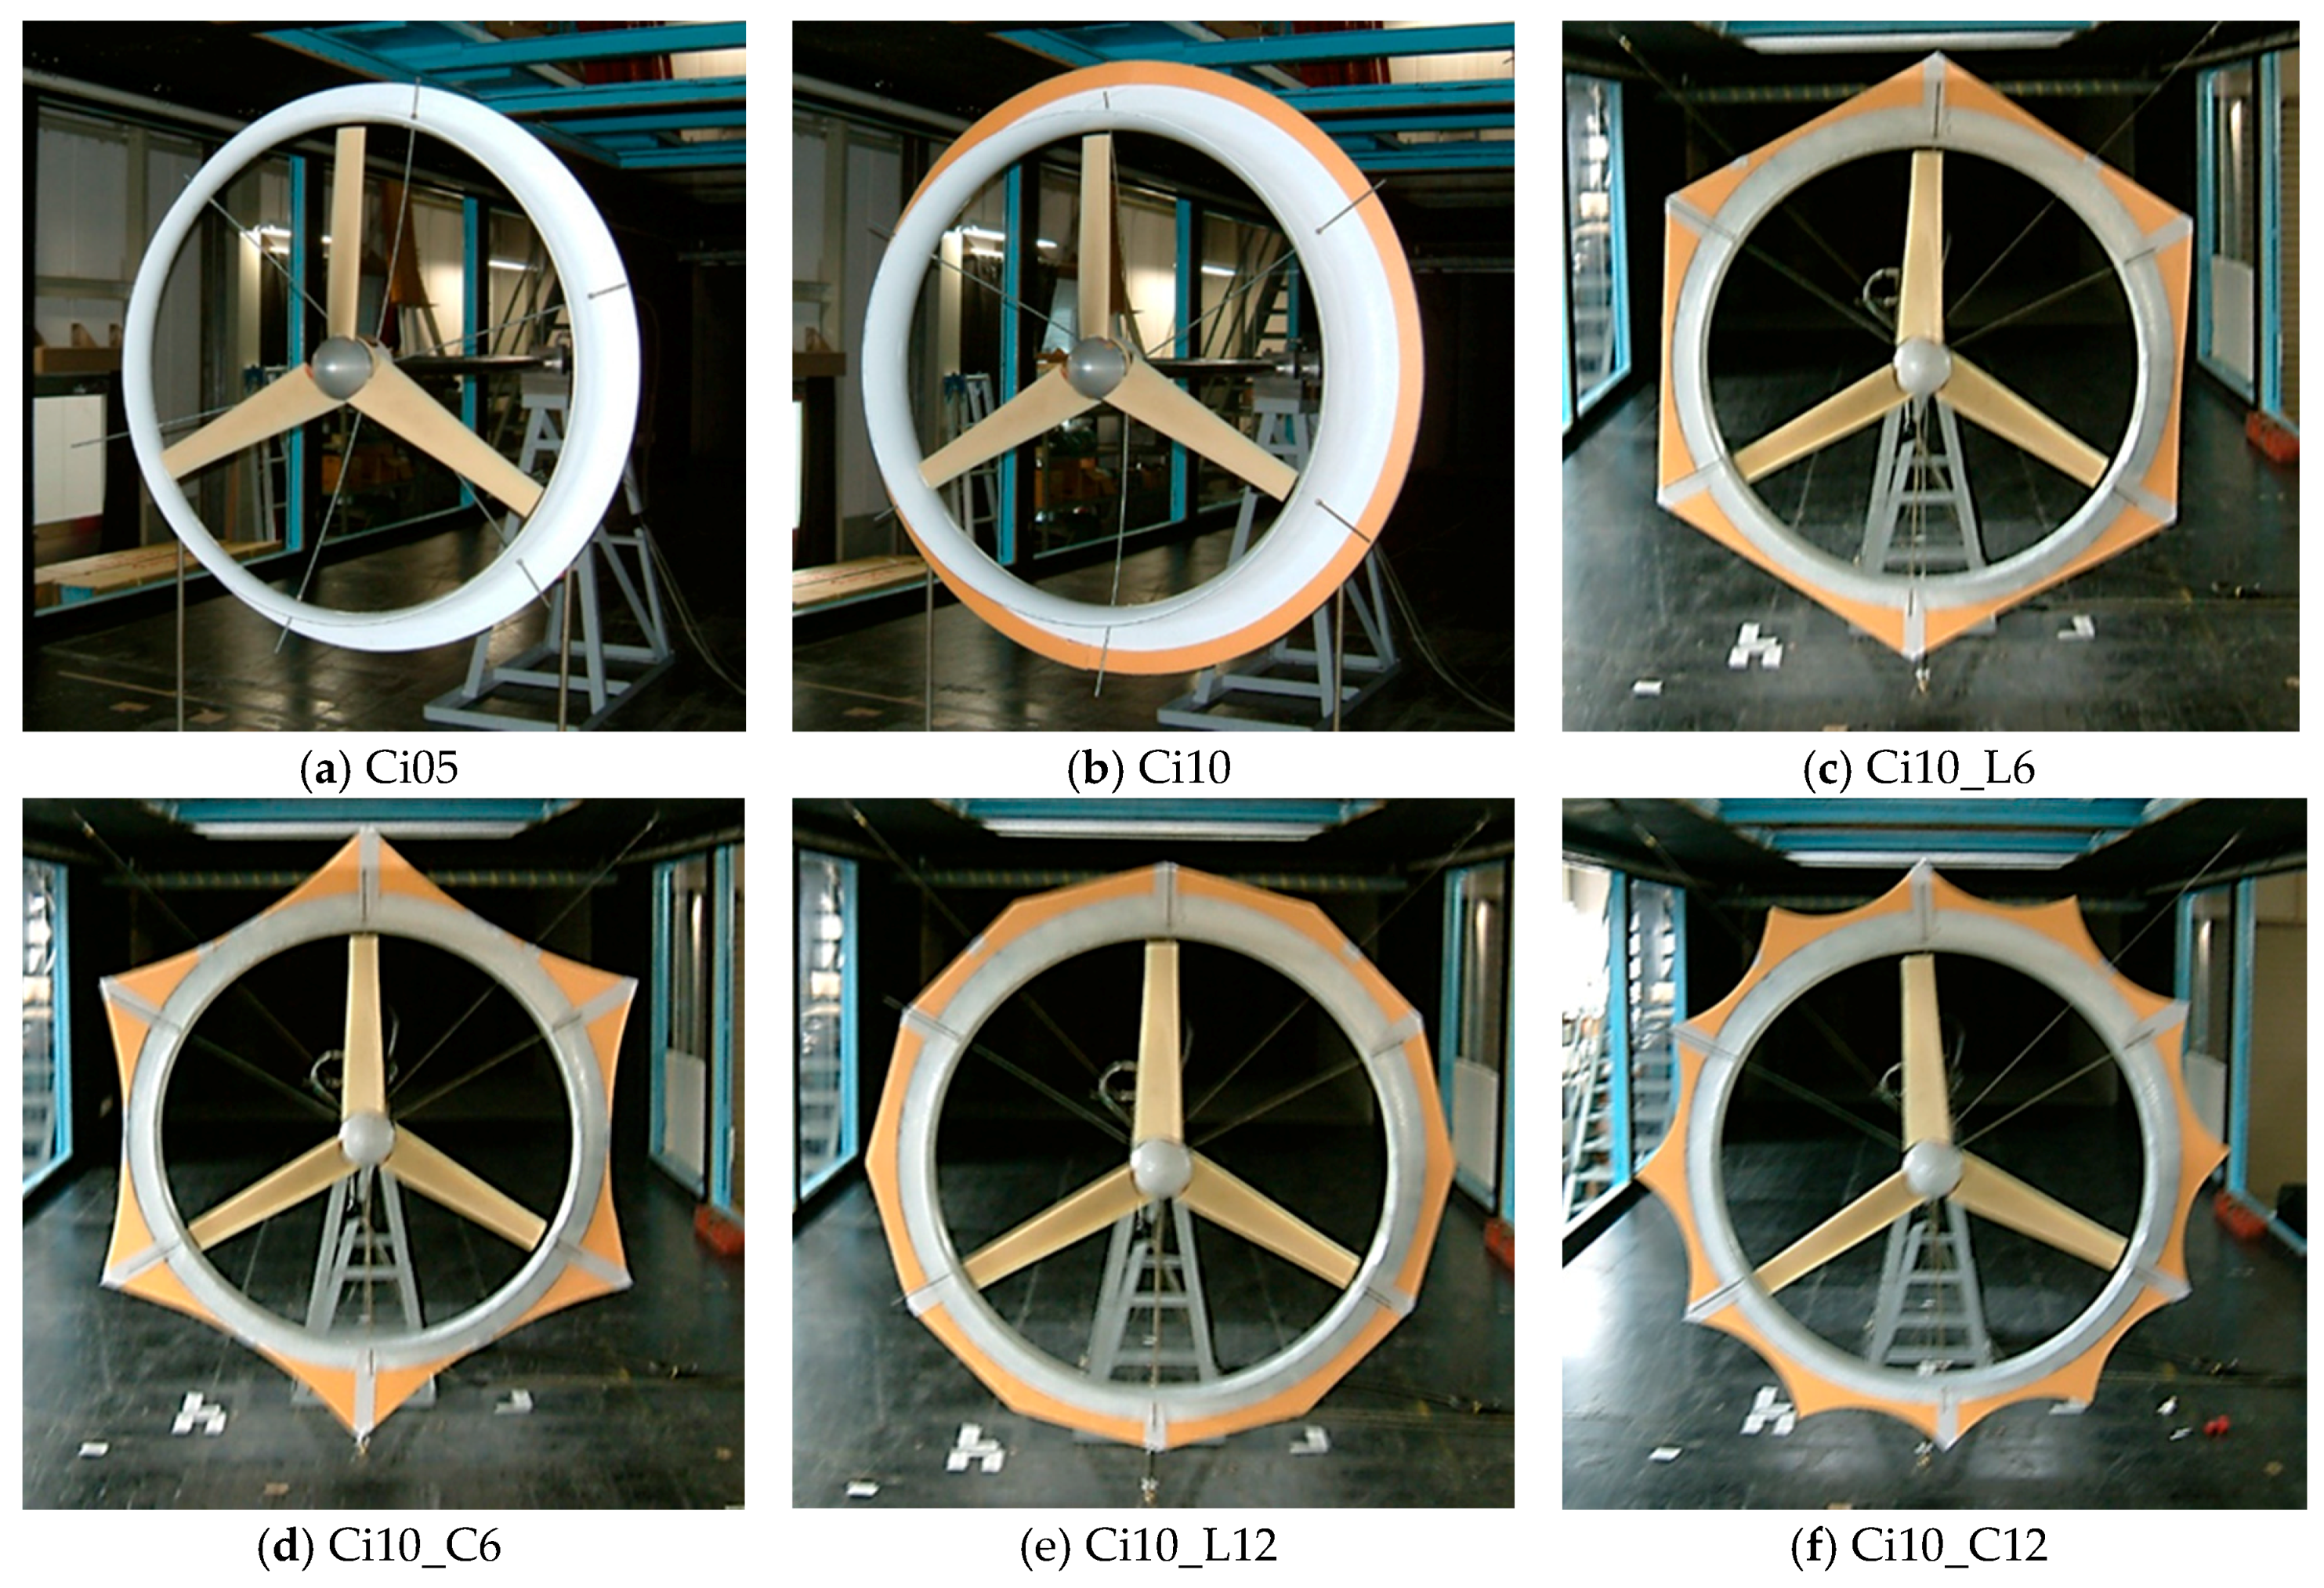
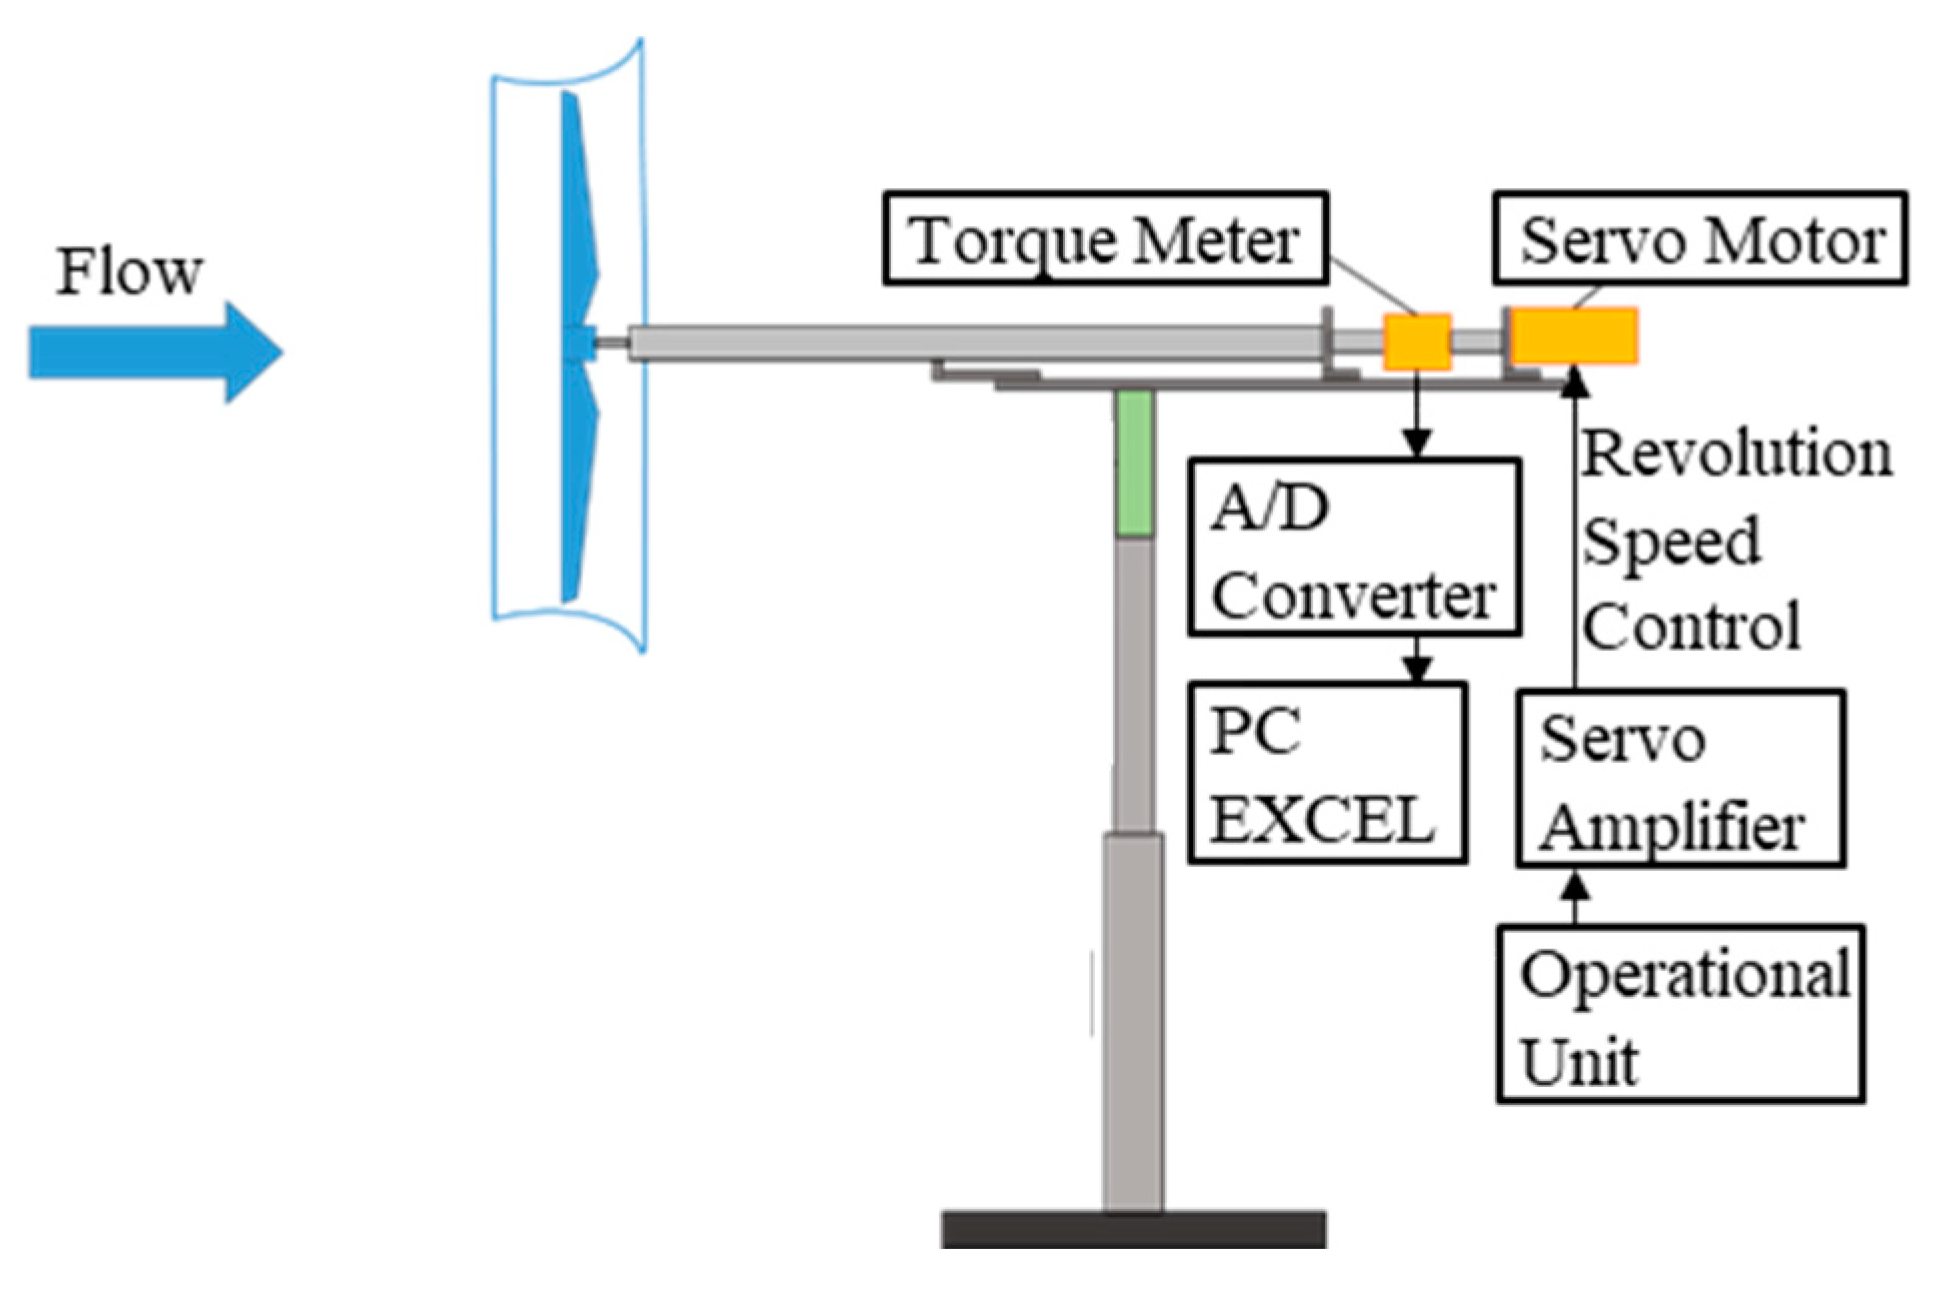
2.1. Wind Tunnel Experiments
2.2. Numerical Simulations
3. Results and Discussion
3.1. Experimental Results
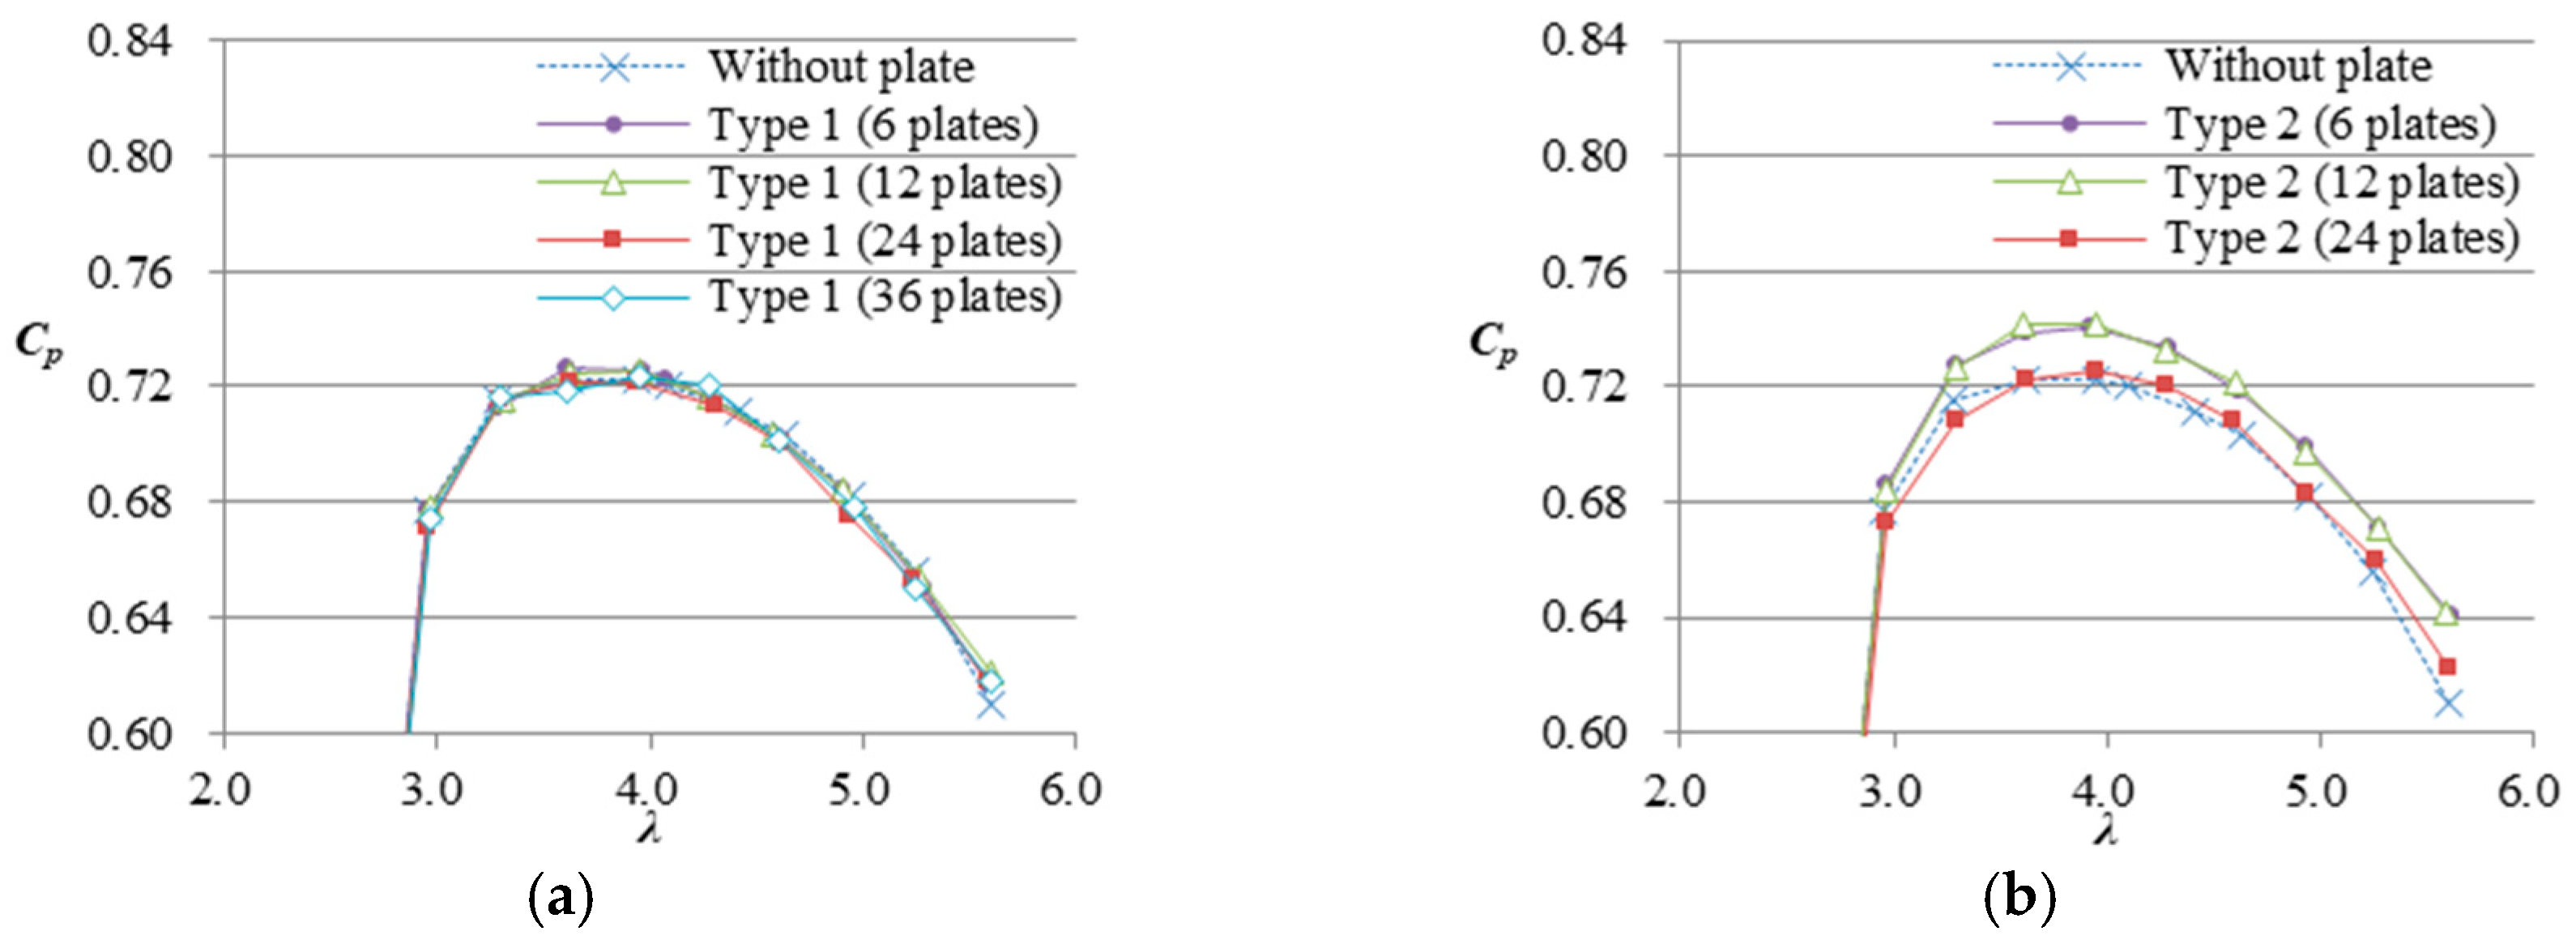
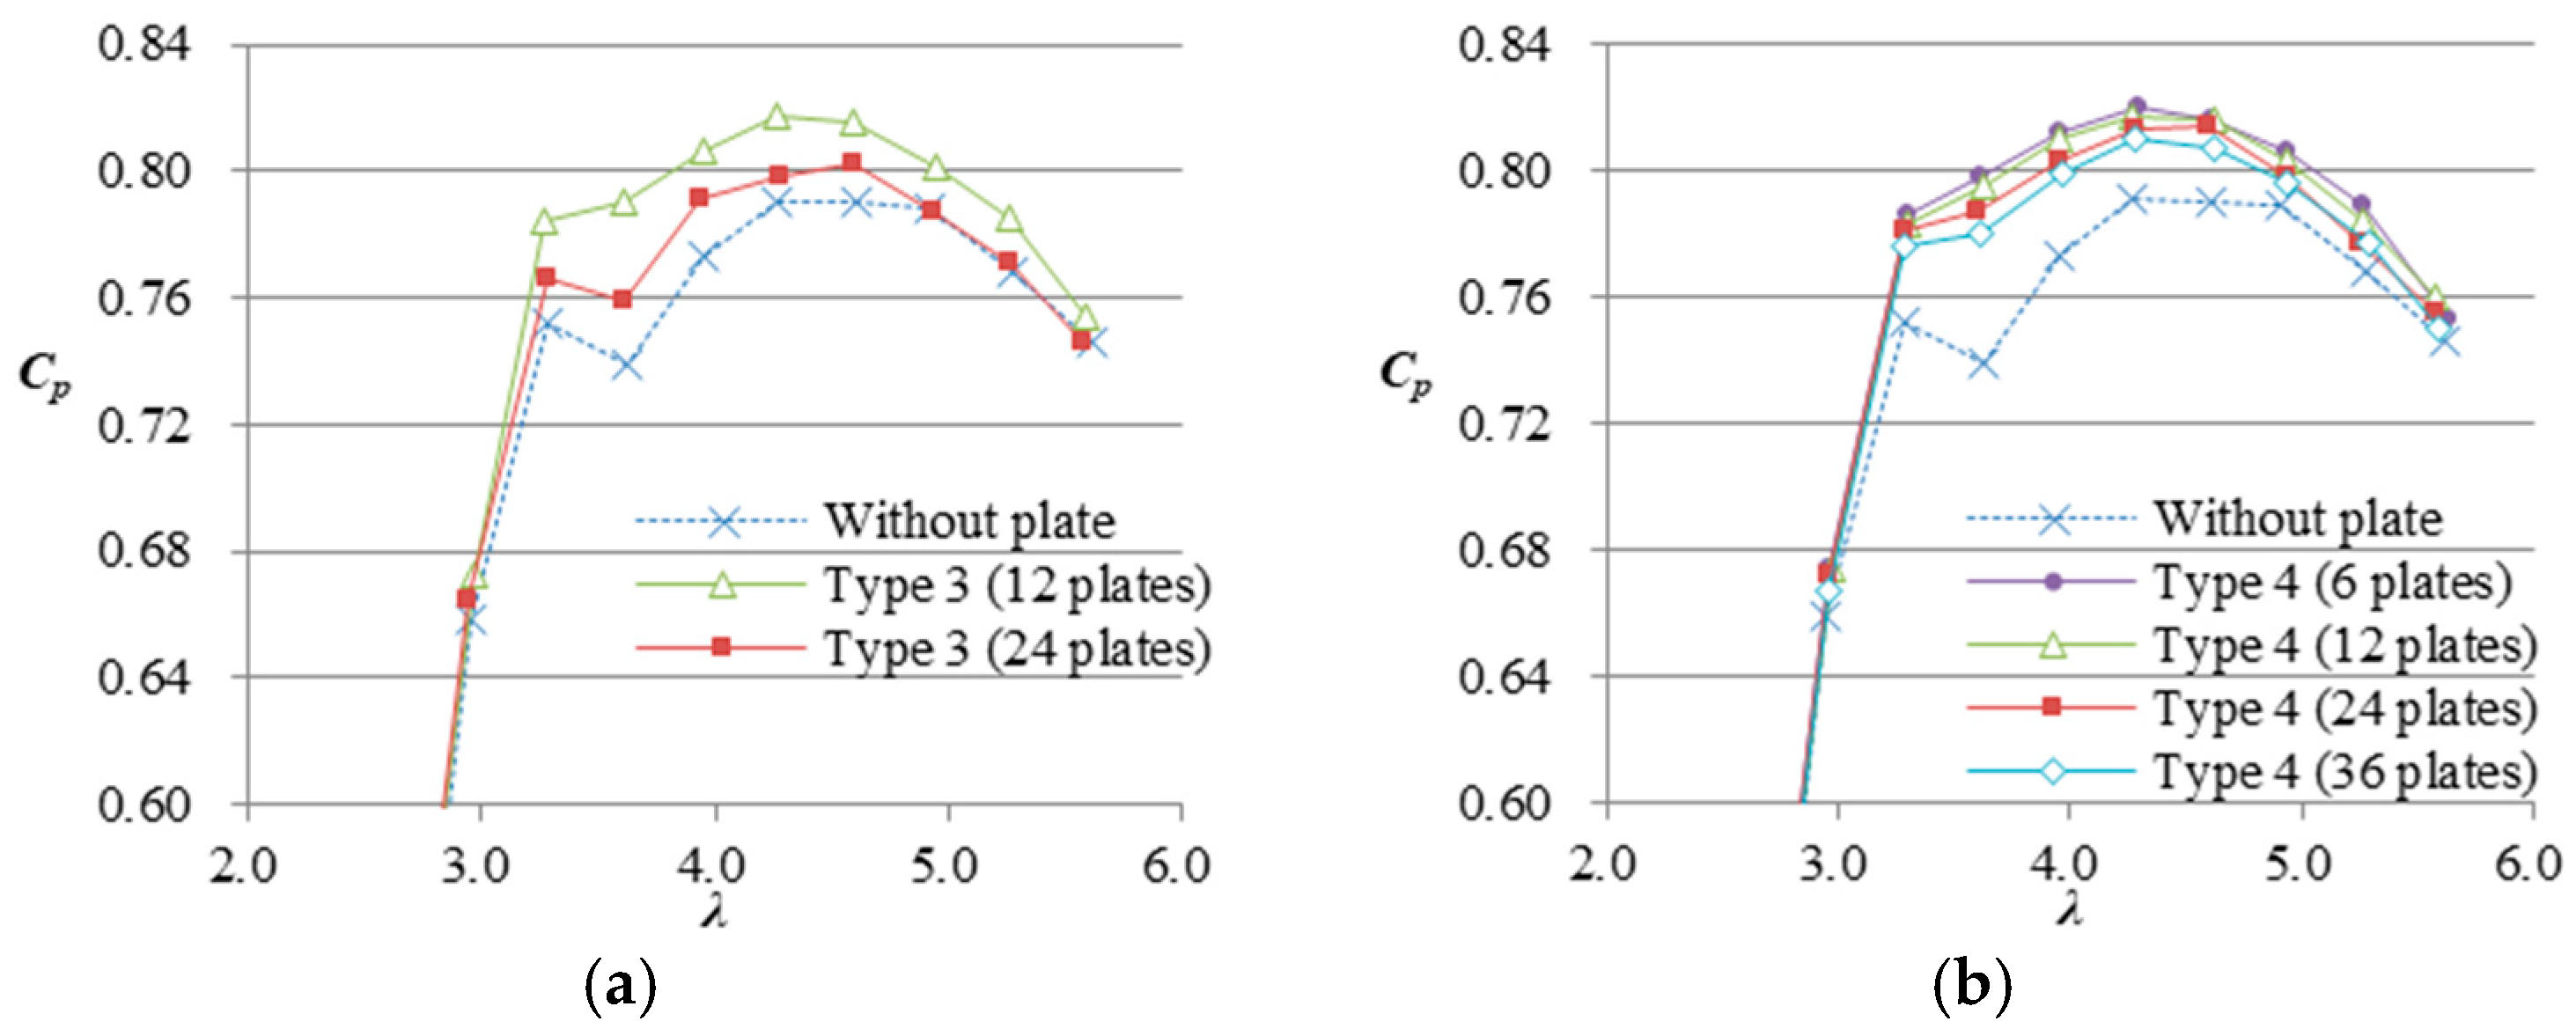
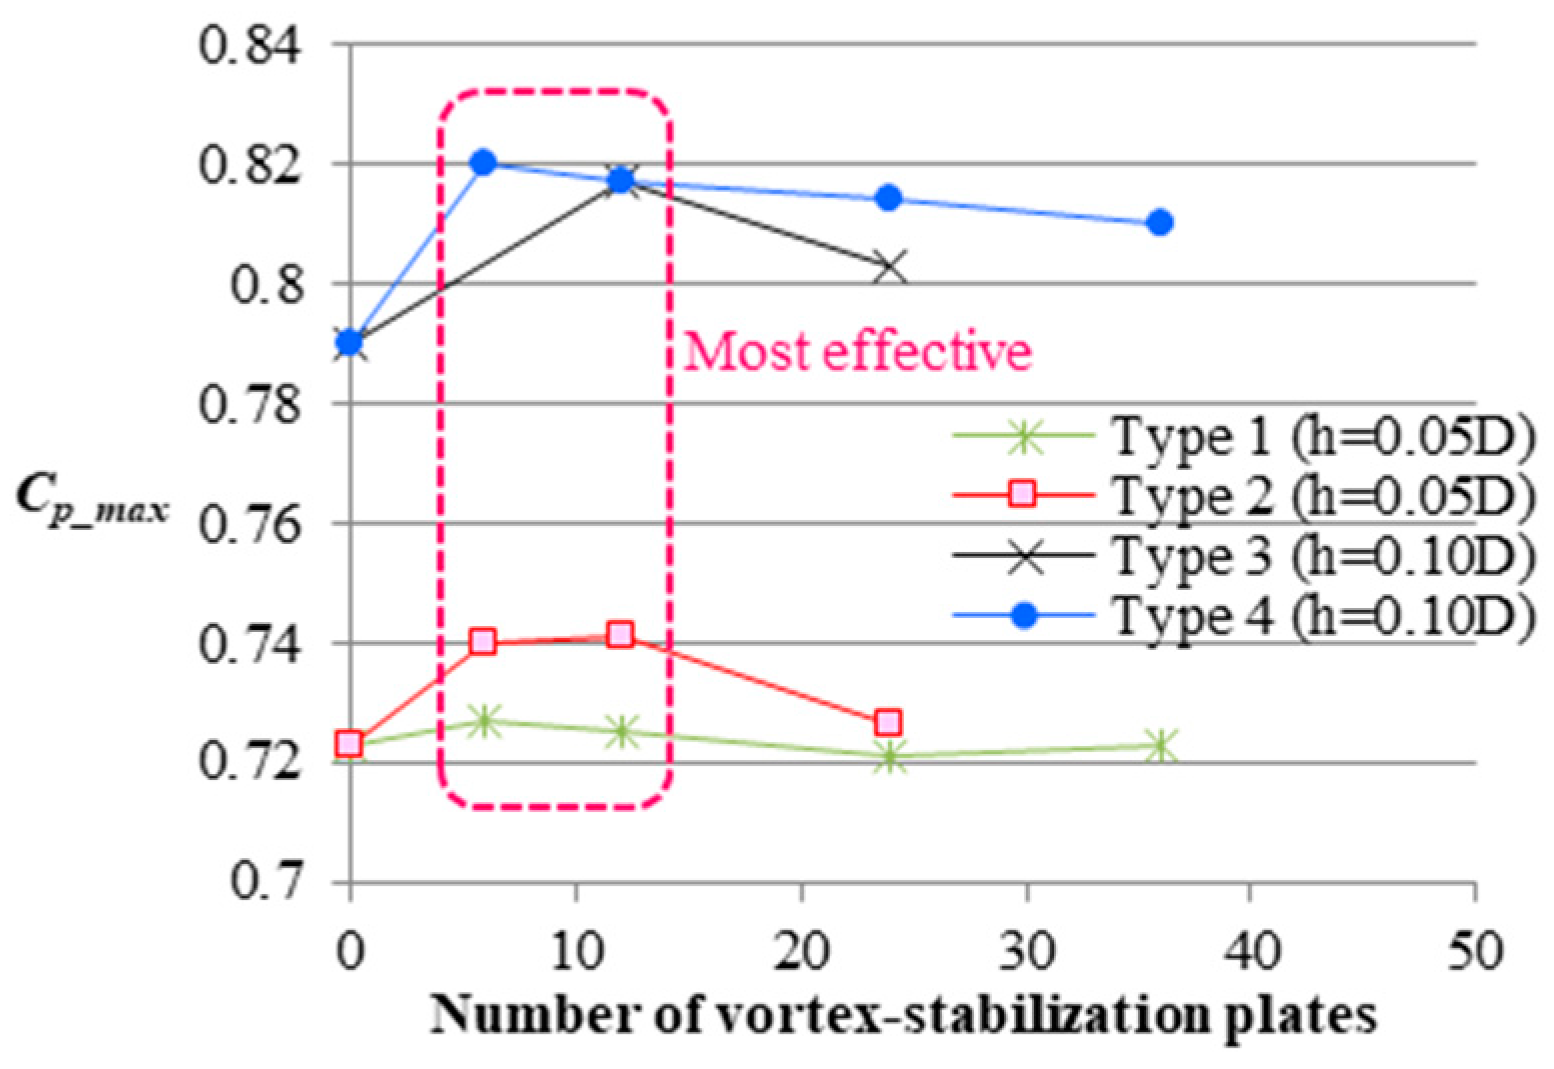
3.1.1. Power Output Enhancements by the Vortex Stabilization Plates
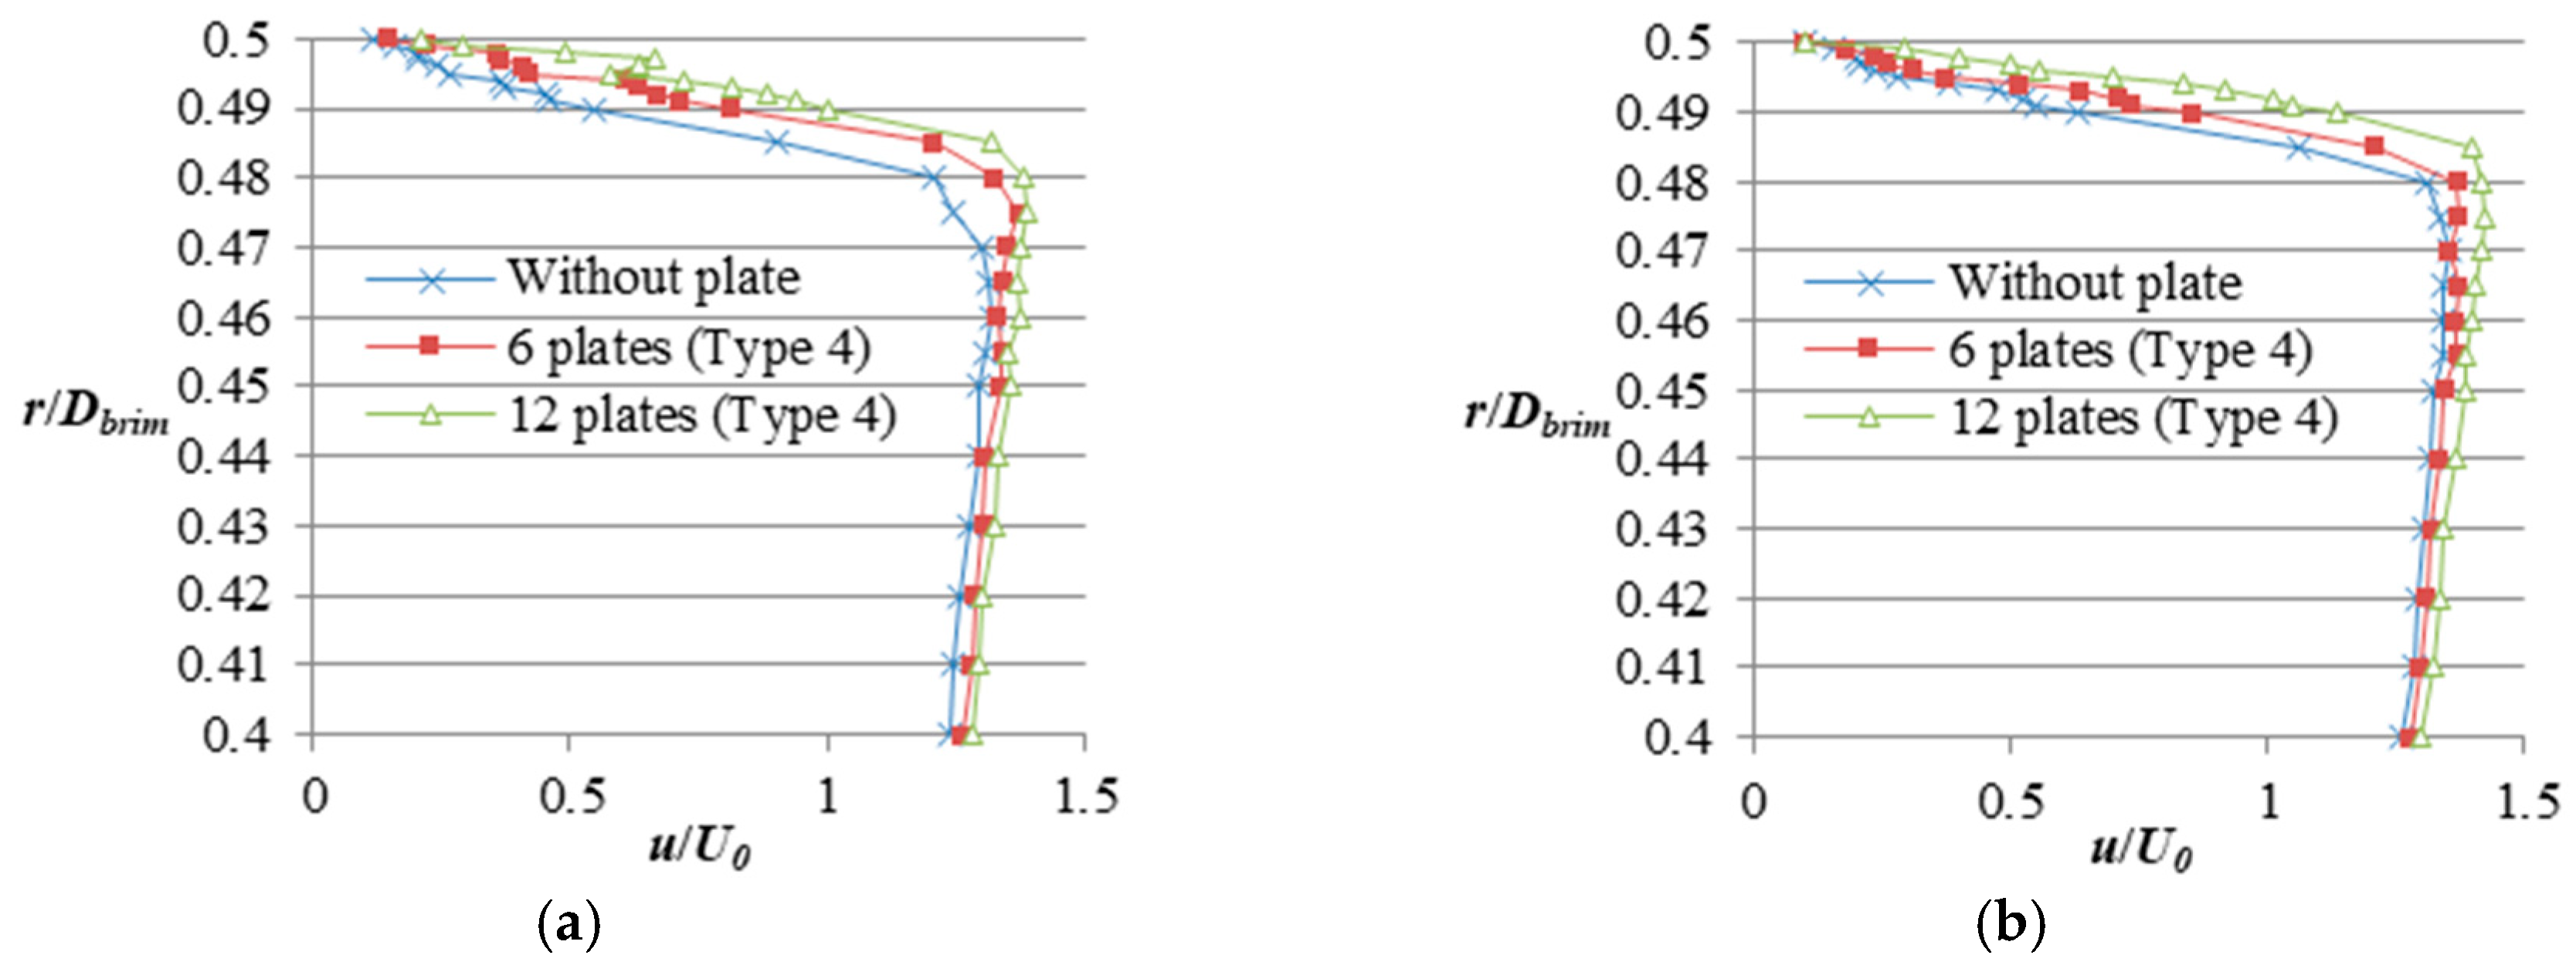
3.1.2. Wind Speed Acceleration Inside the Duct by the Vortex Stabilization Plates
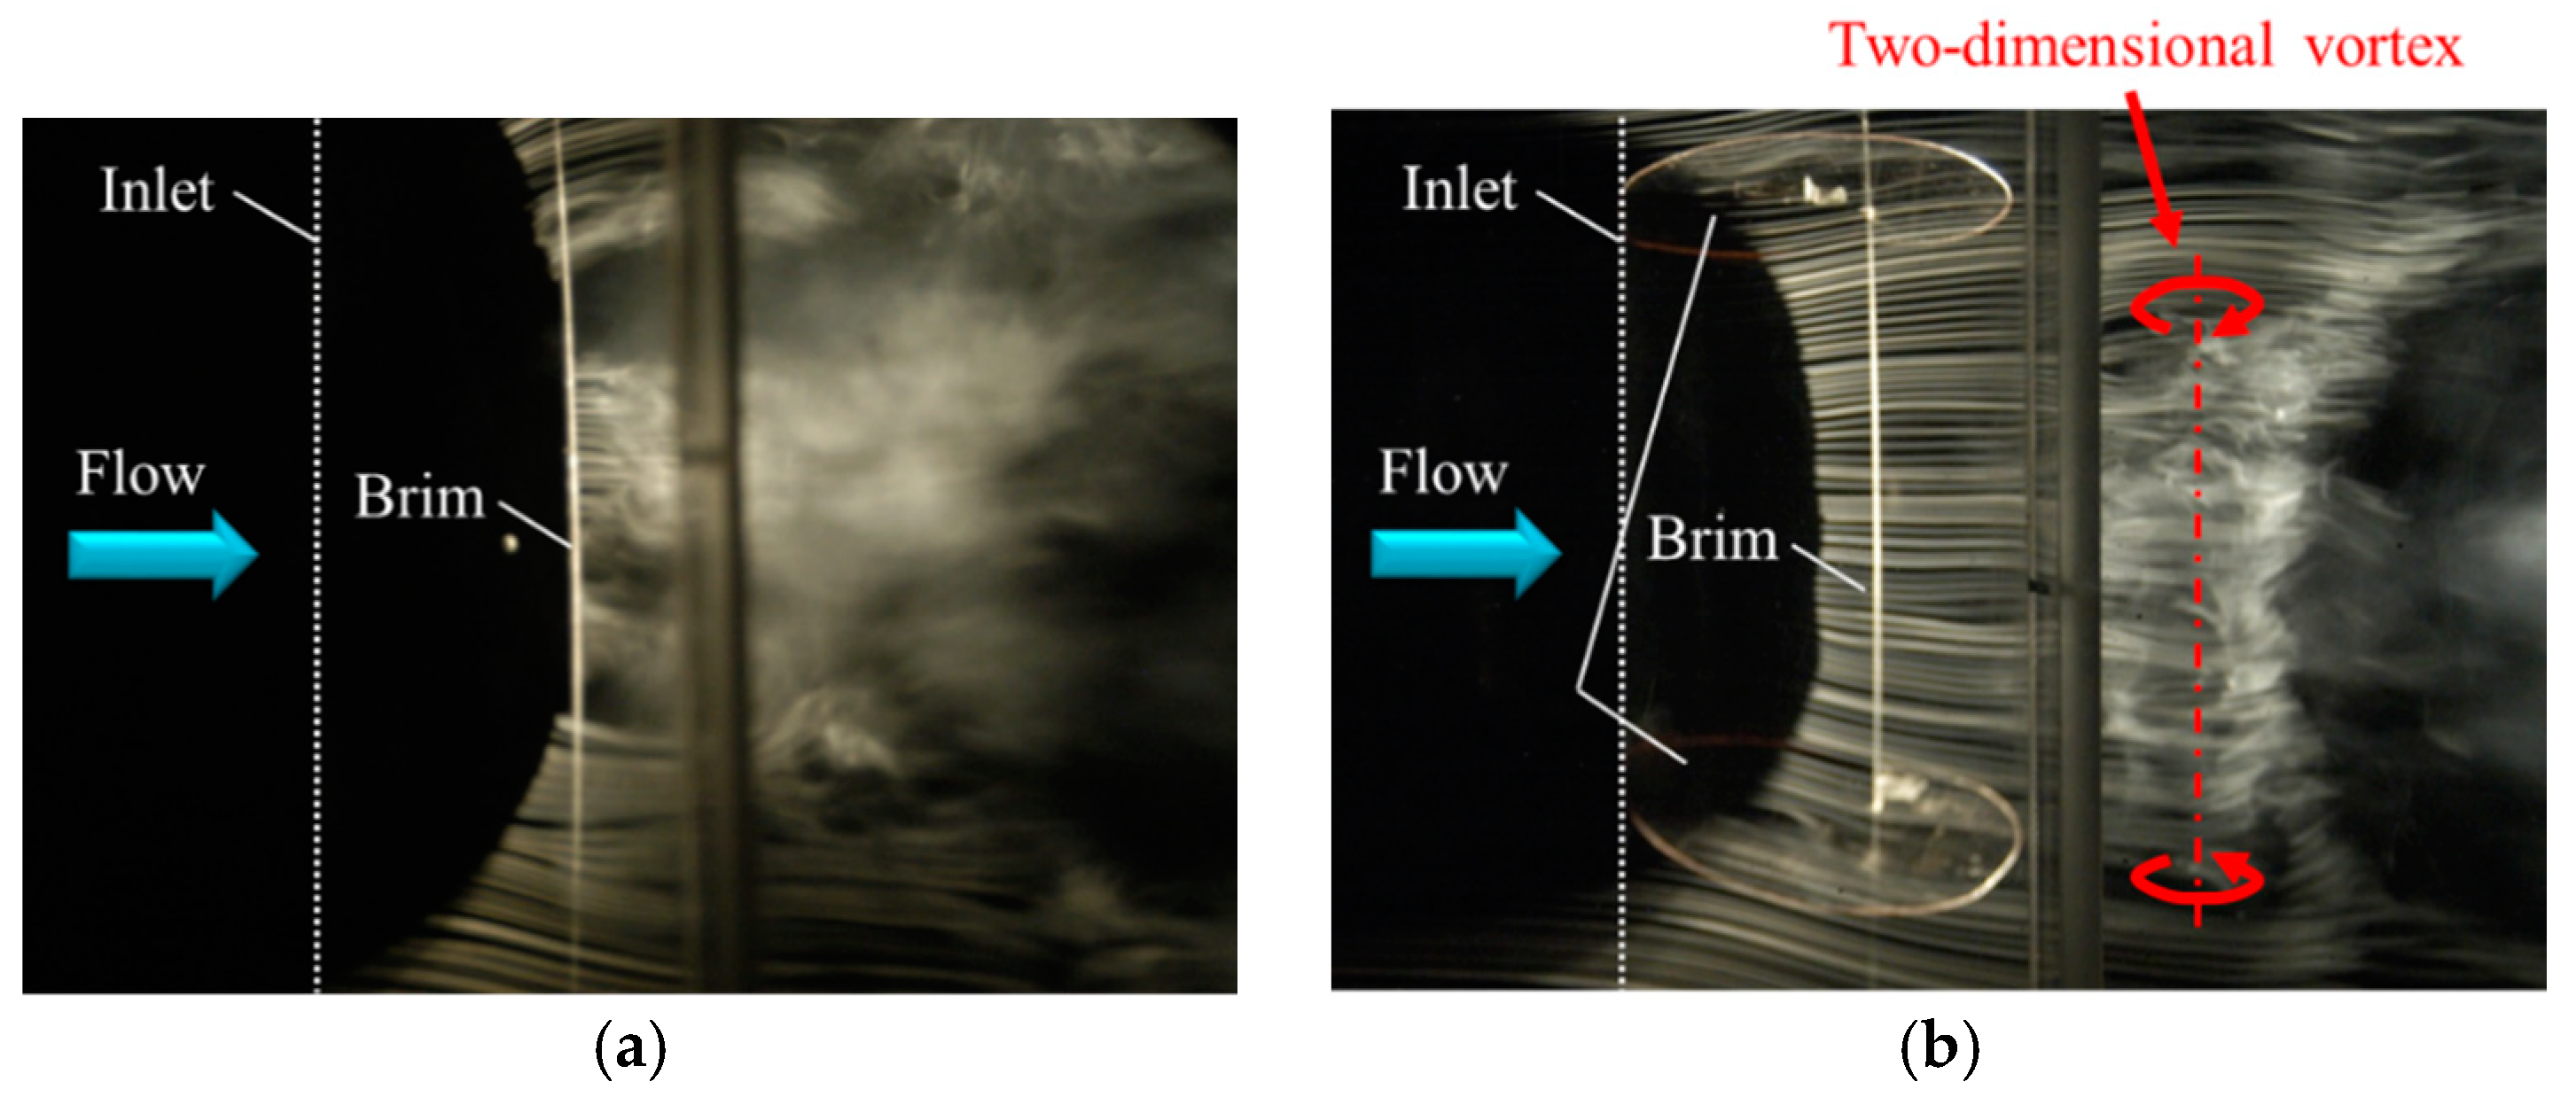
3.1.3. Two-Dimensional Vortices Generated by the Vortex Stabilization Plates
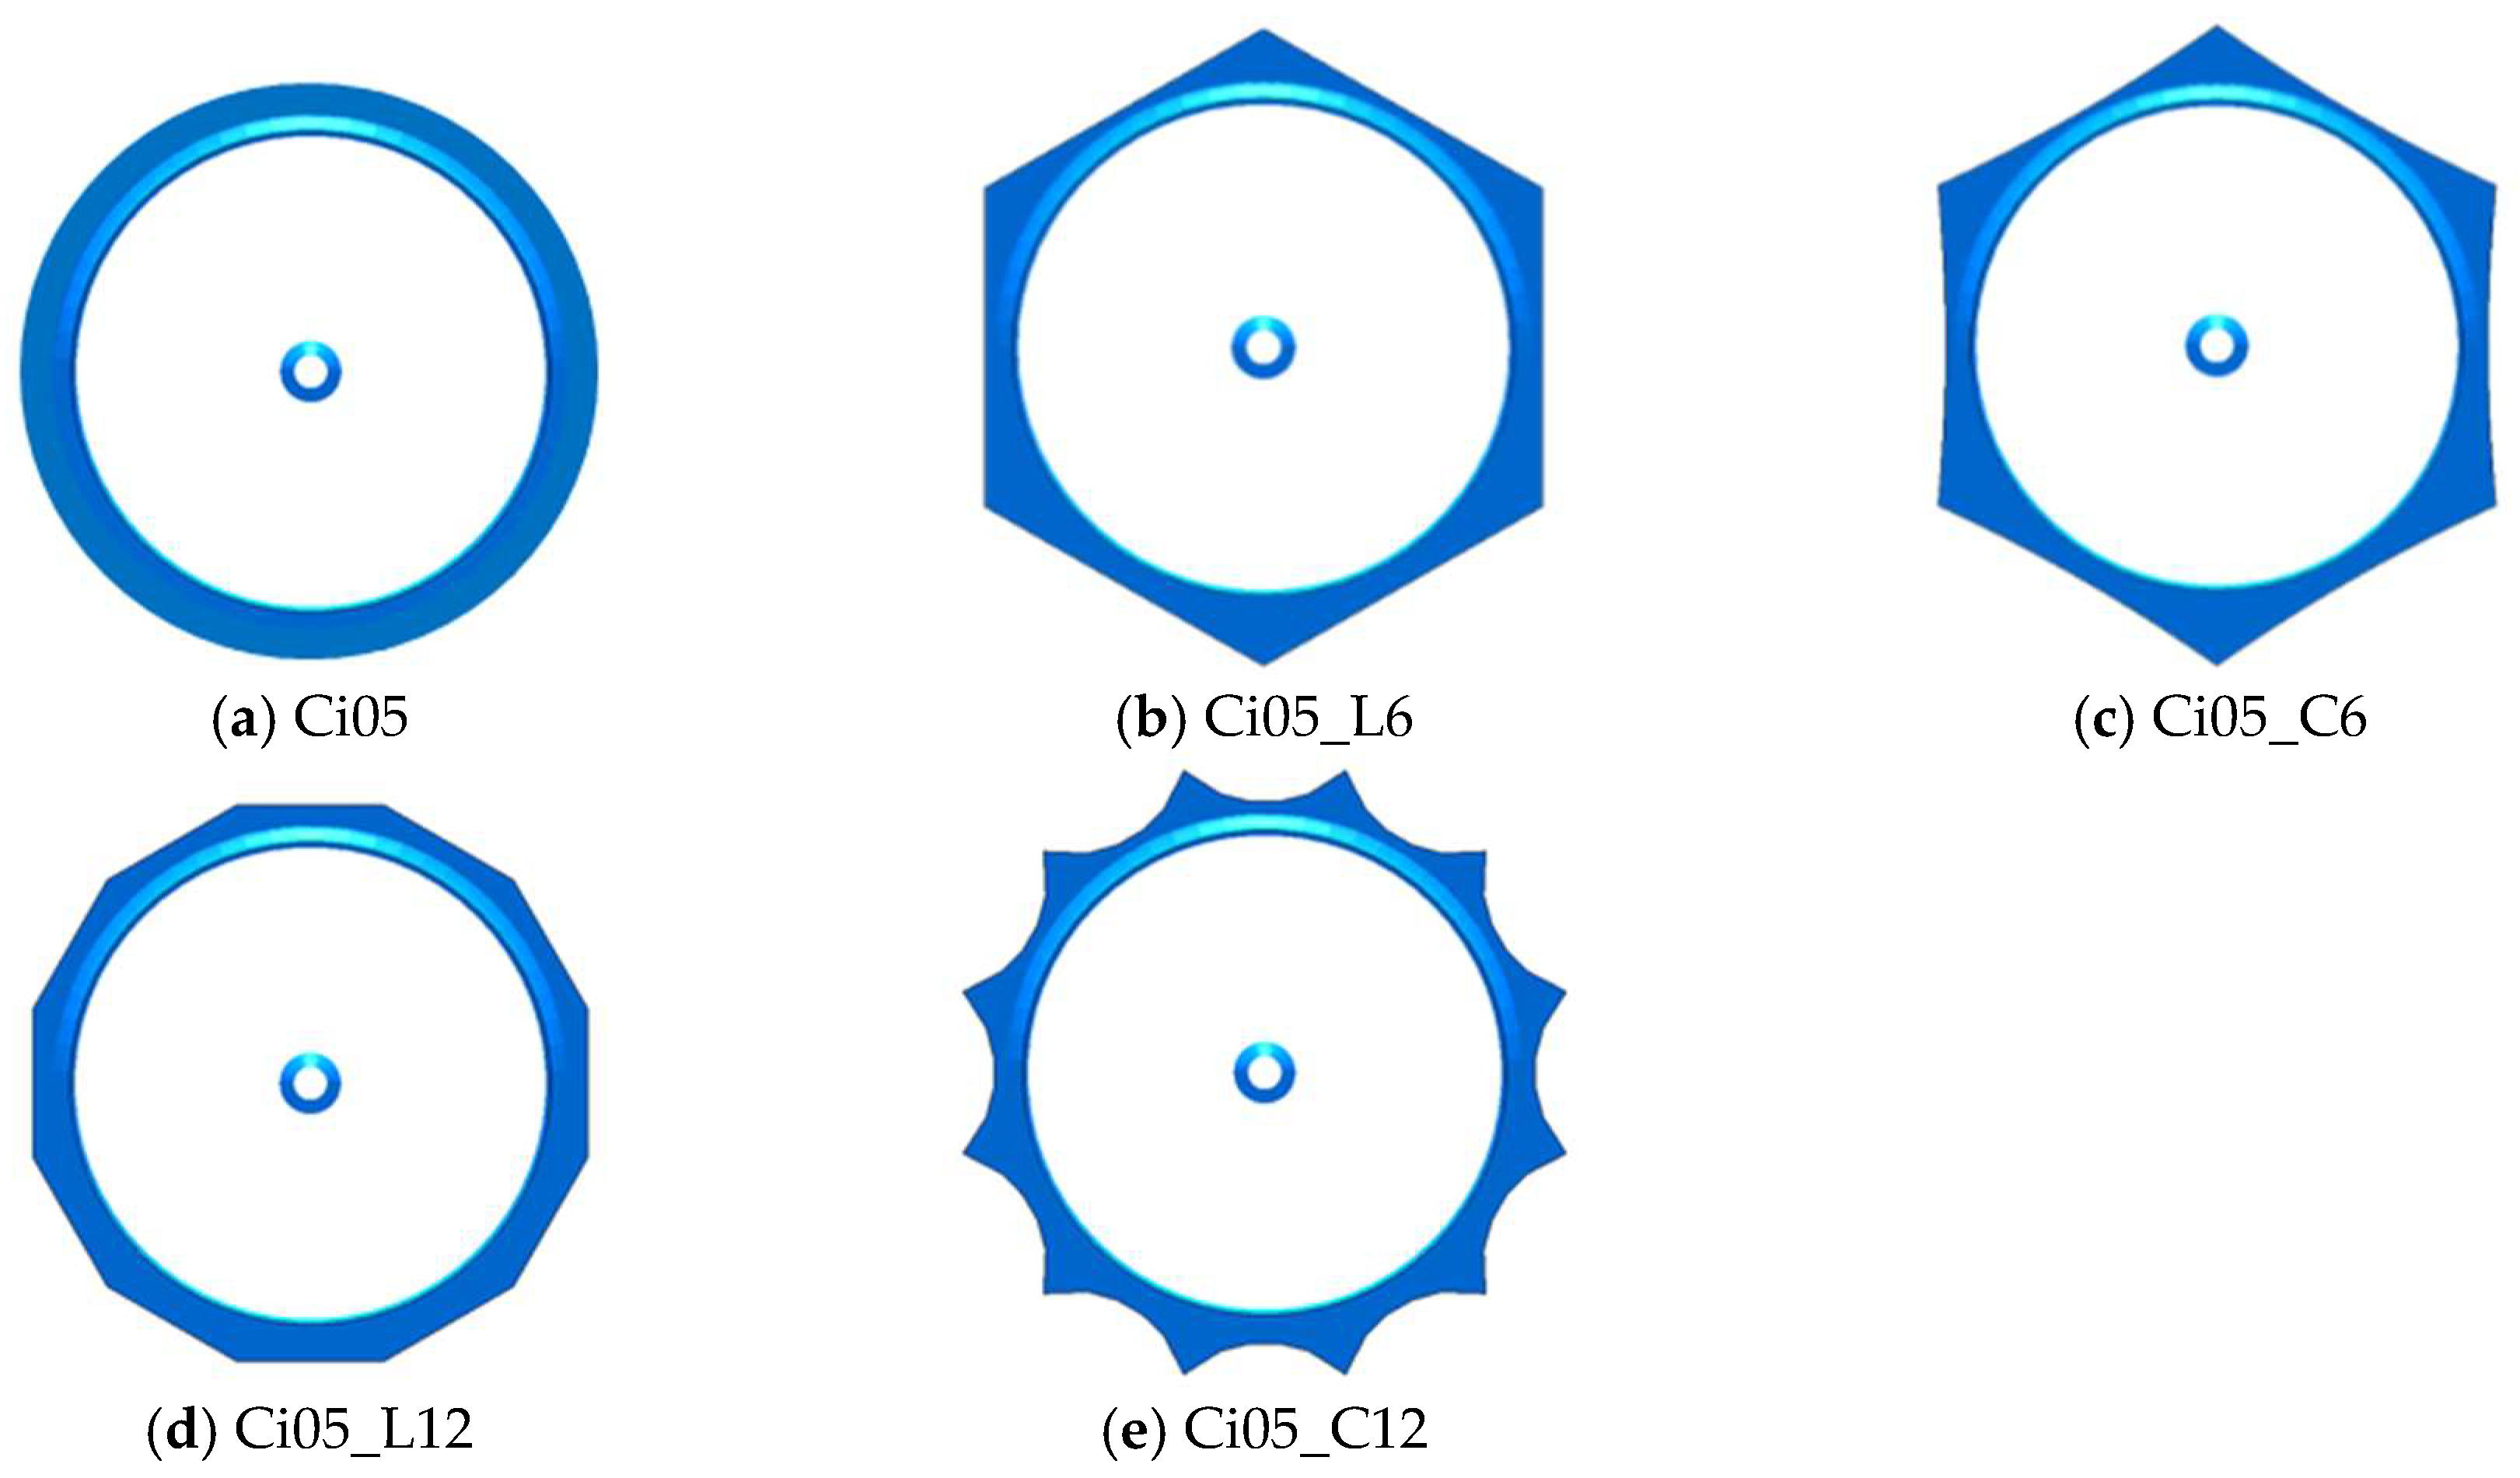
3.1.4. Power Output Enhancements by the Polygonal Brims
3.2. Numerical Results
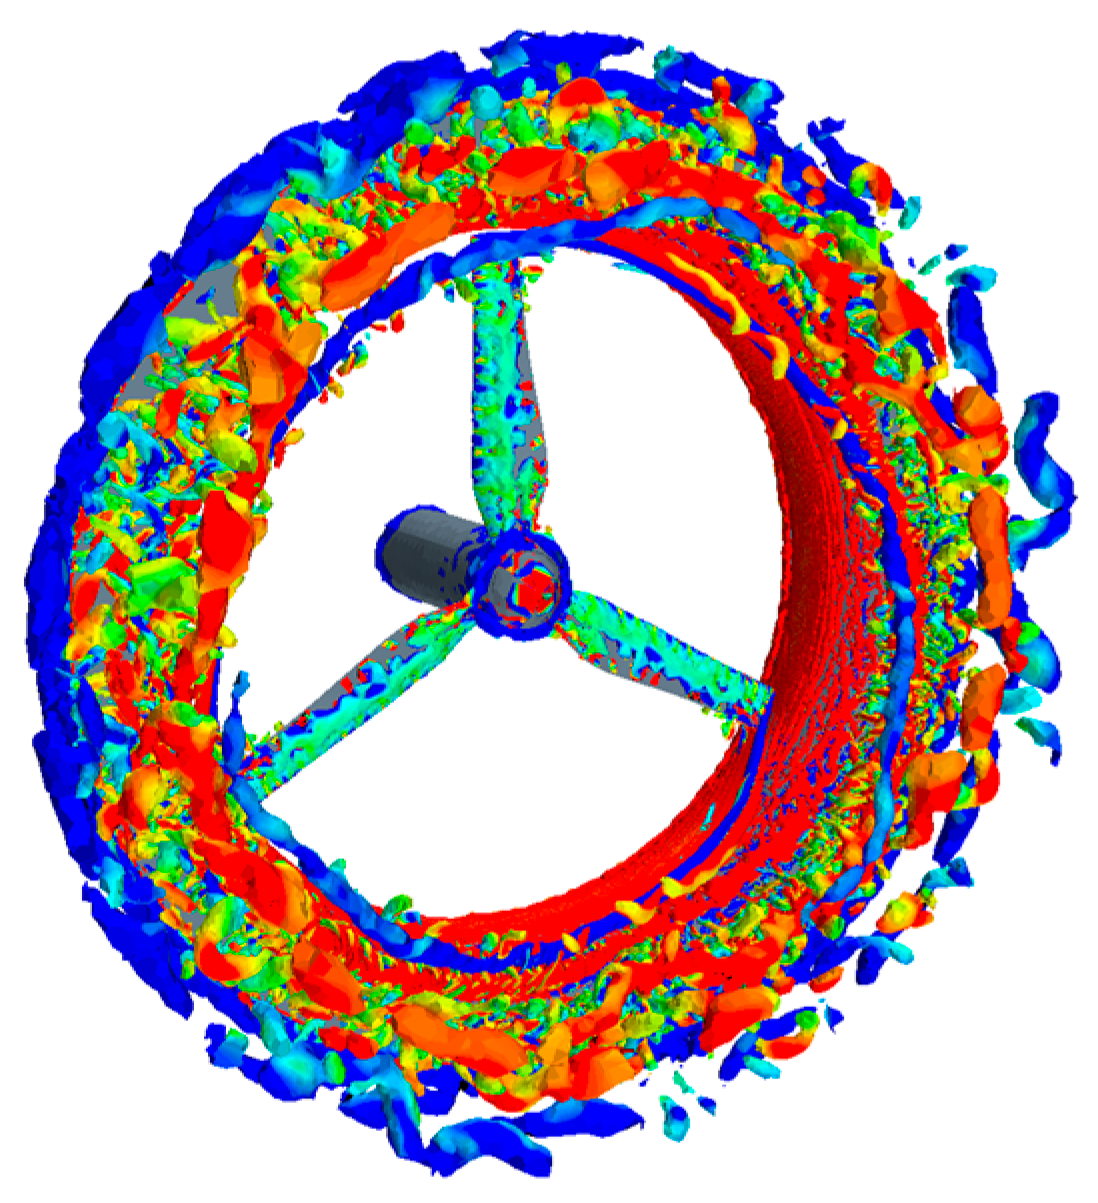
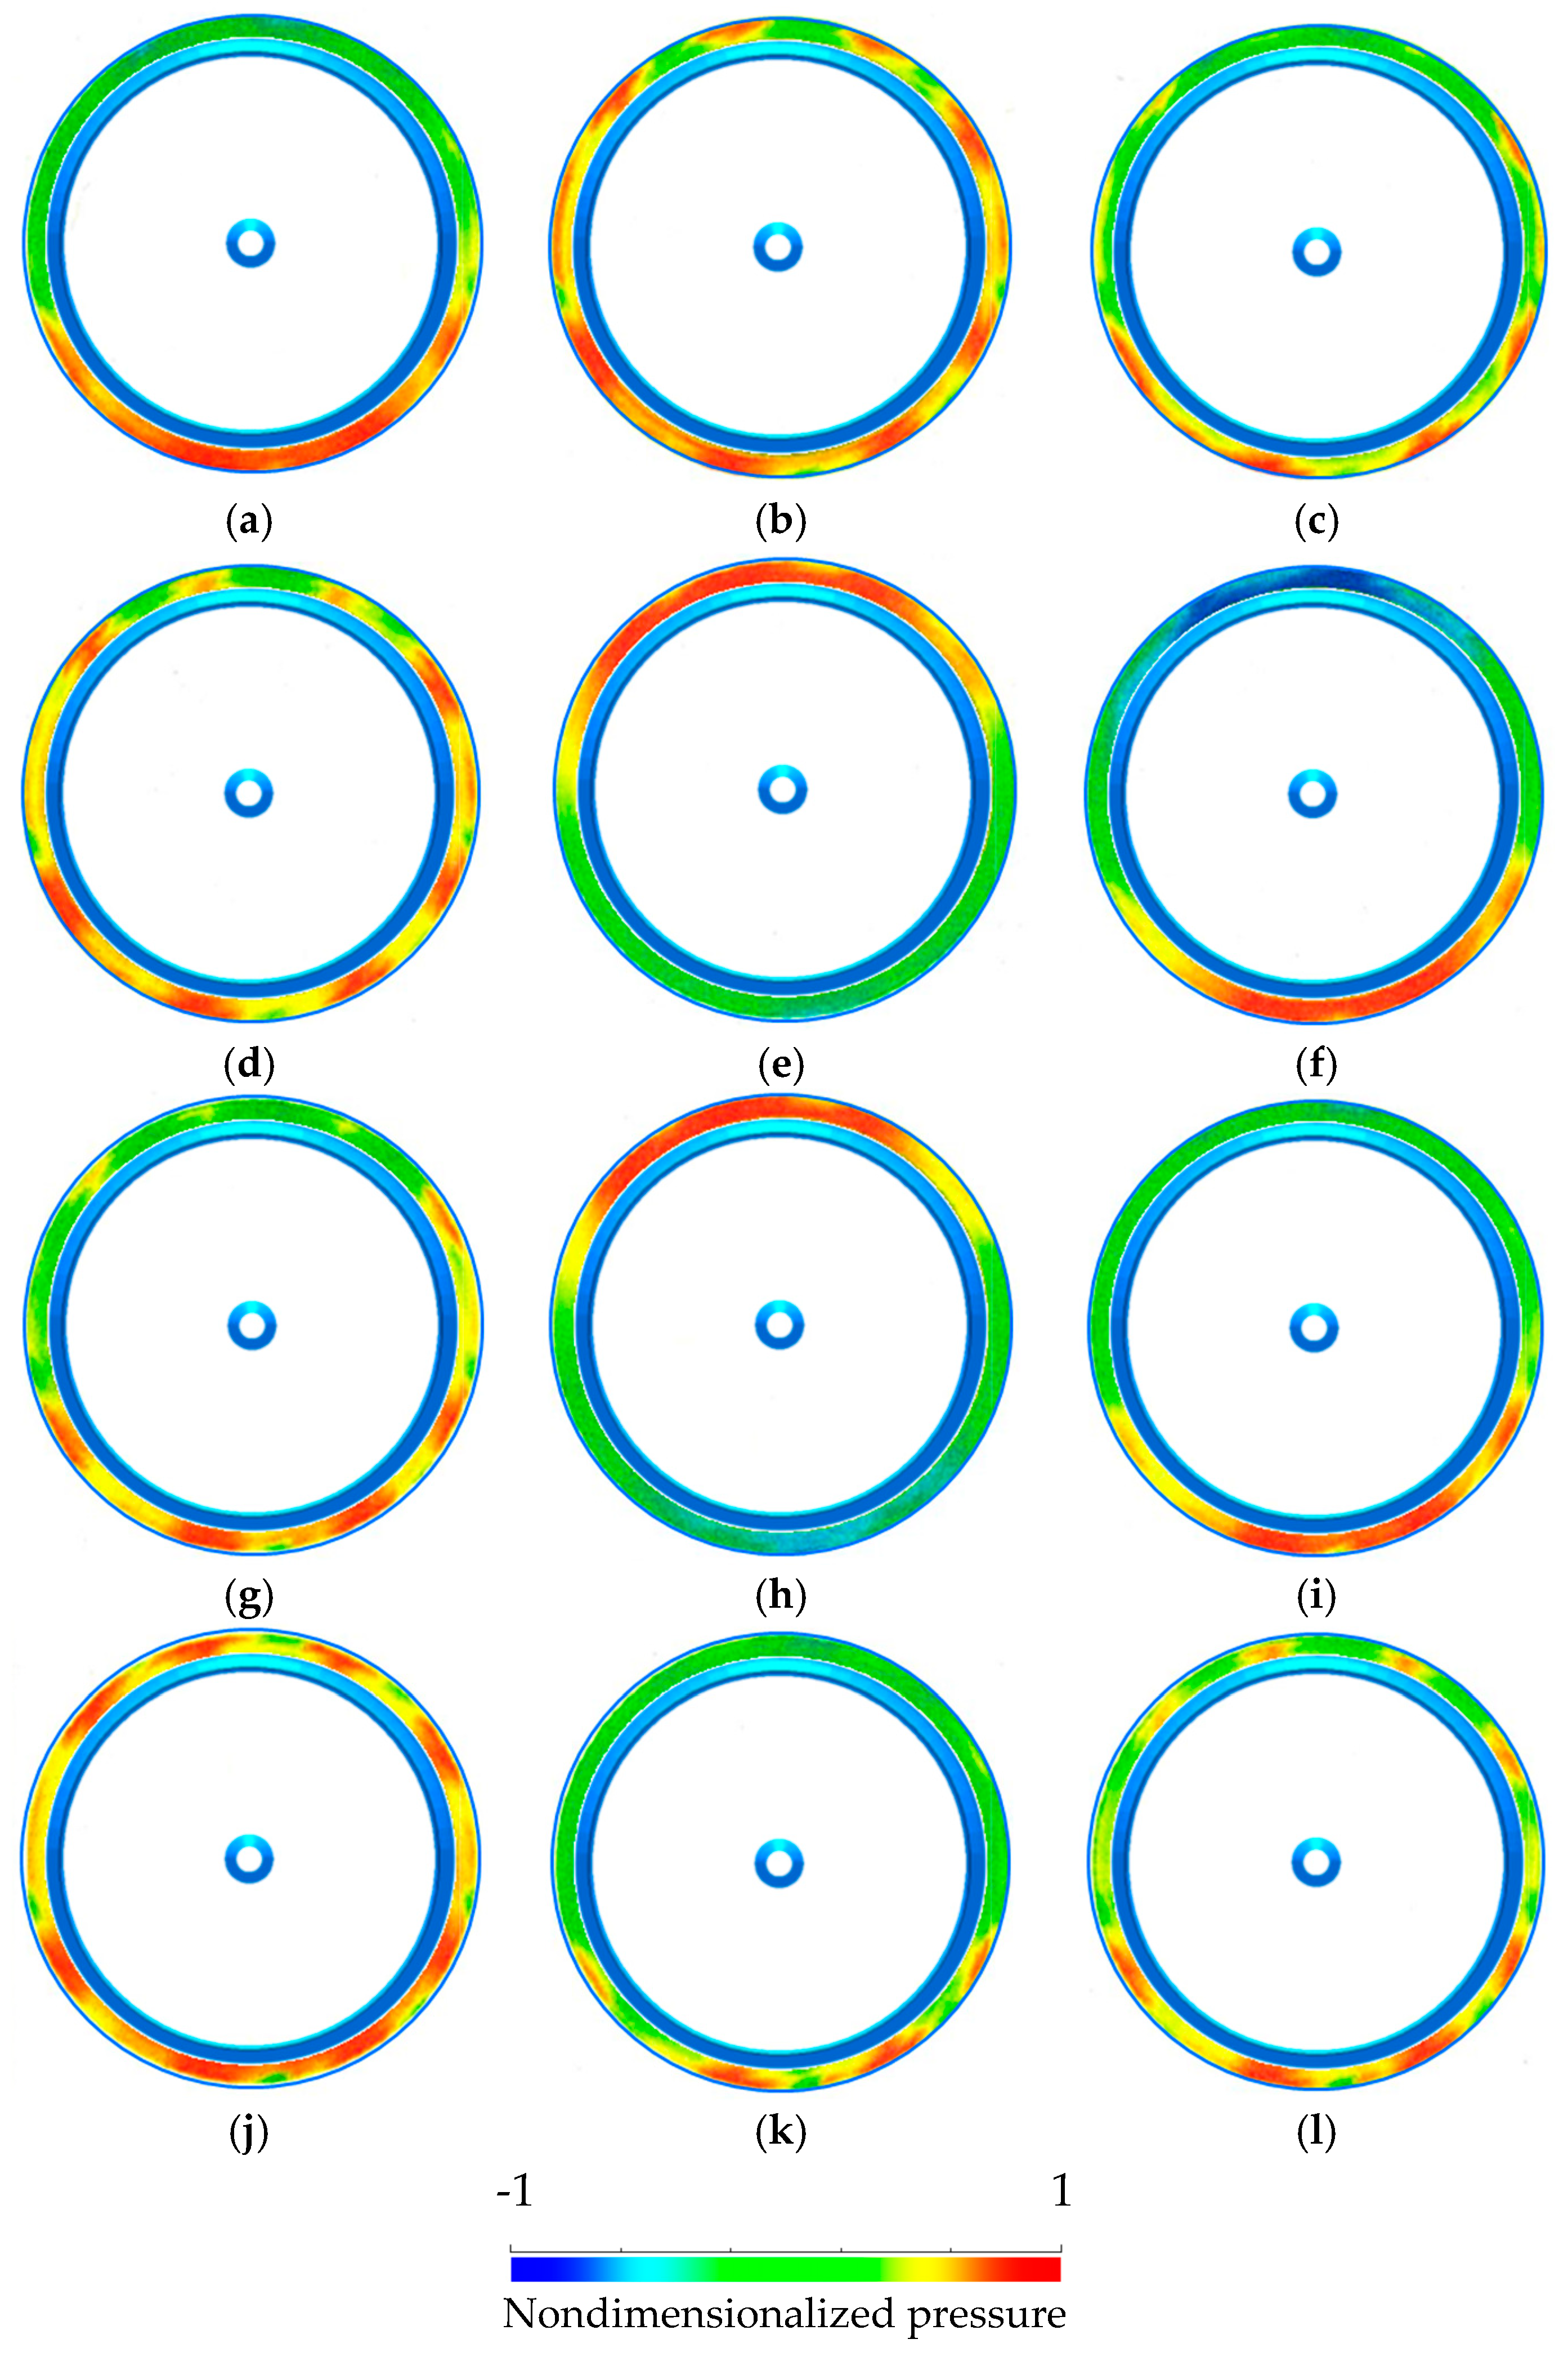
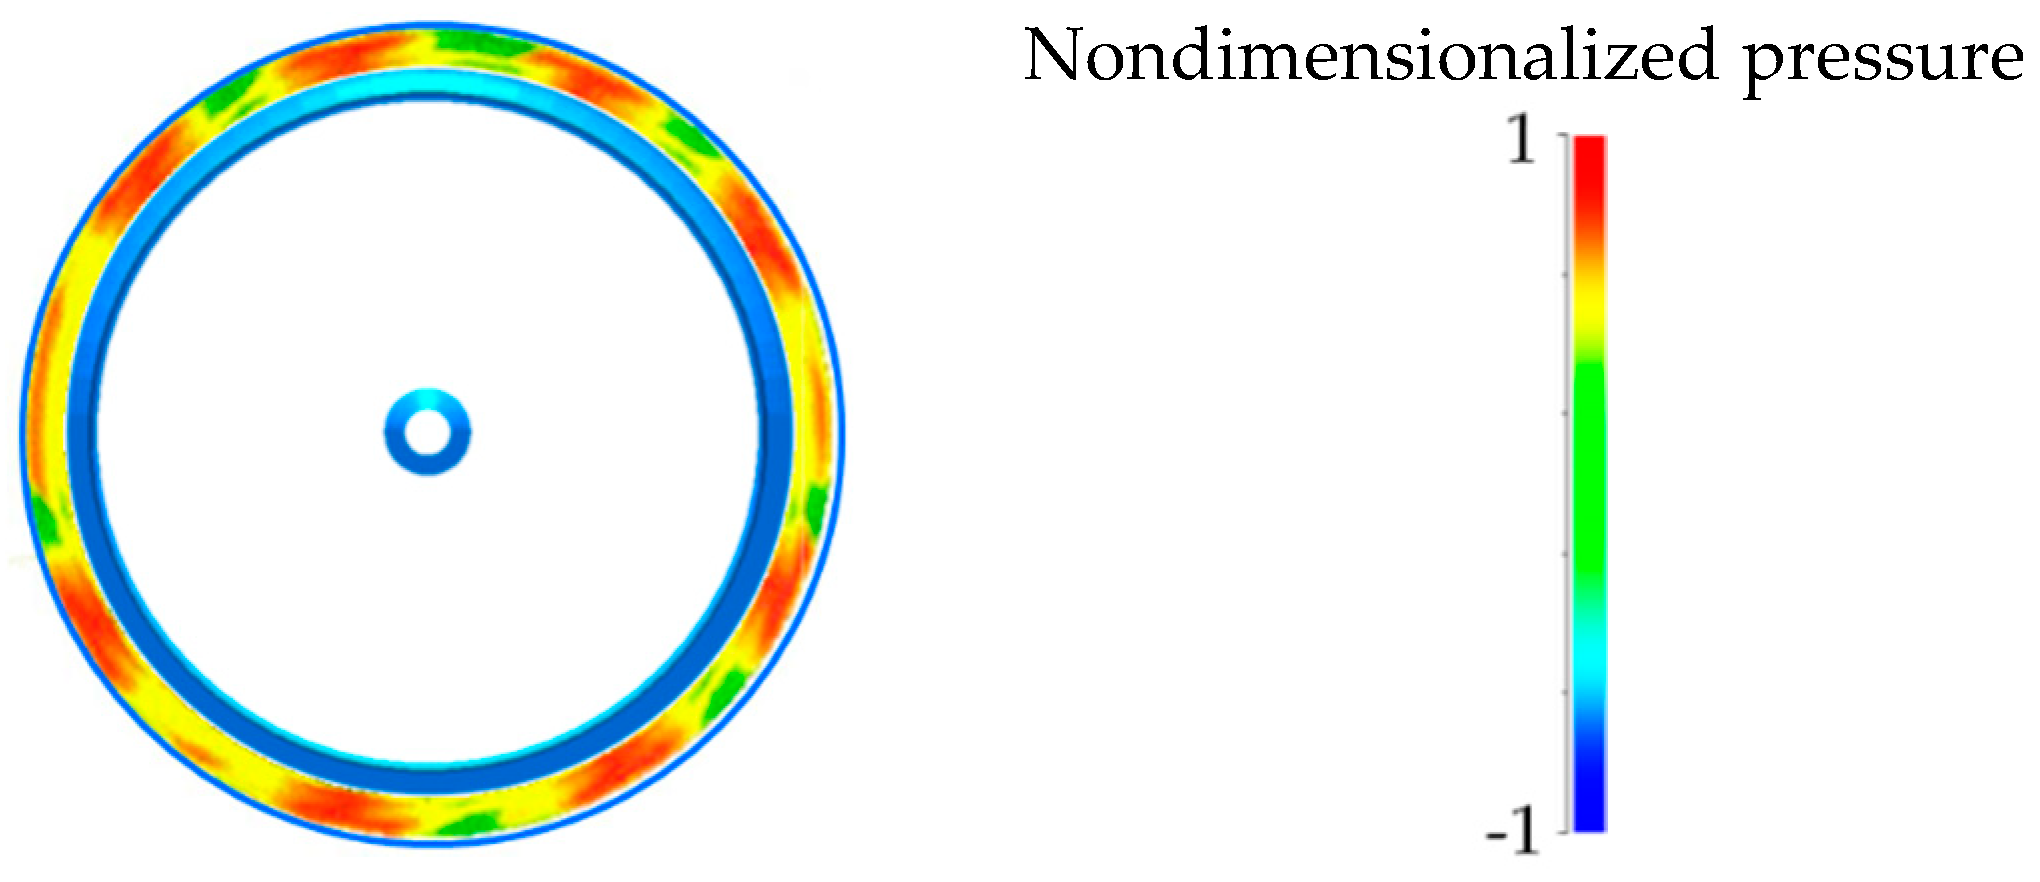
3.2.1. Fluctuating Vortex Structures around the WLT Brim
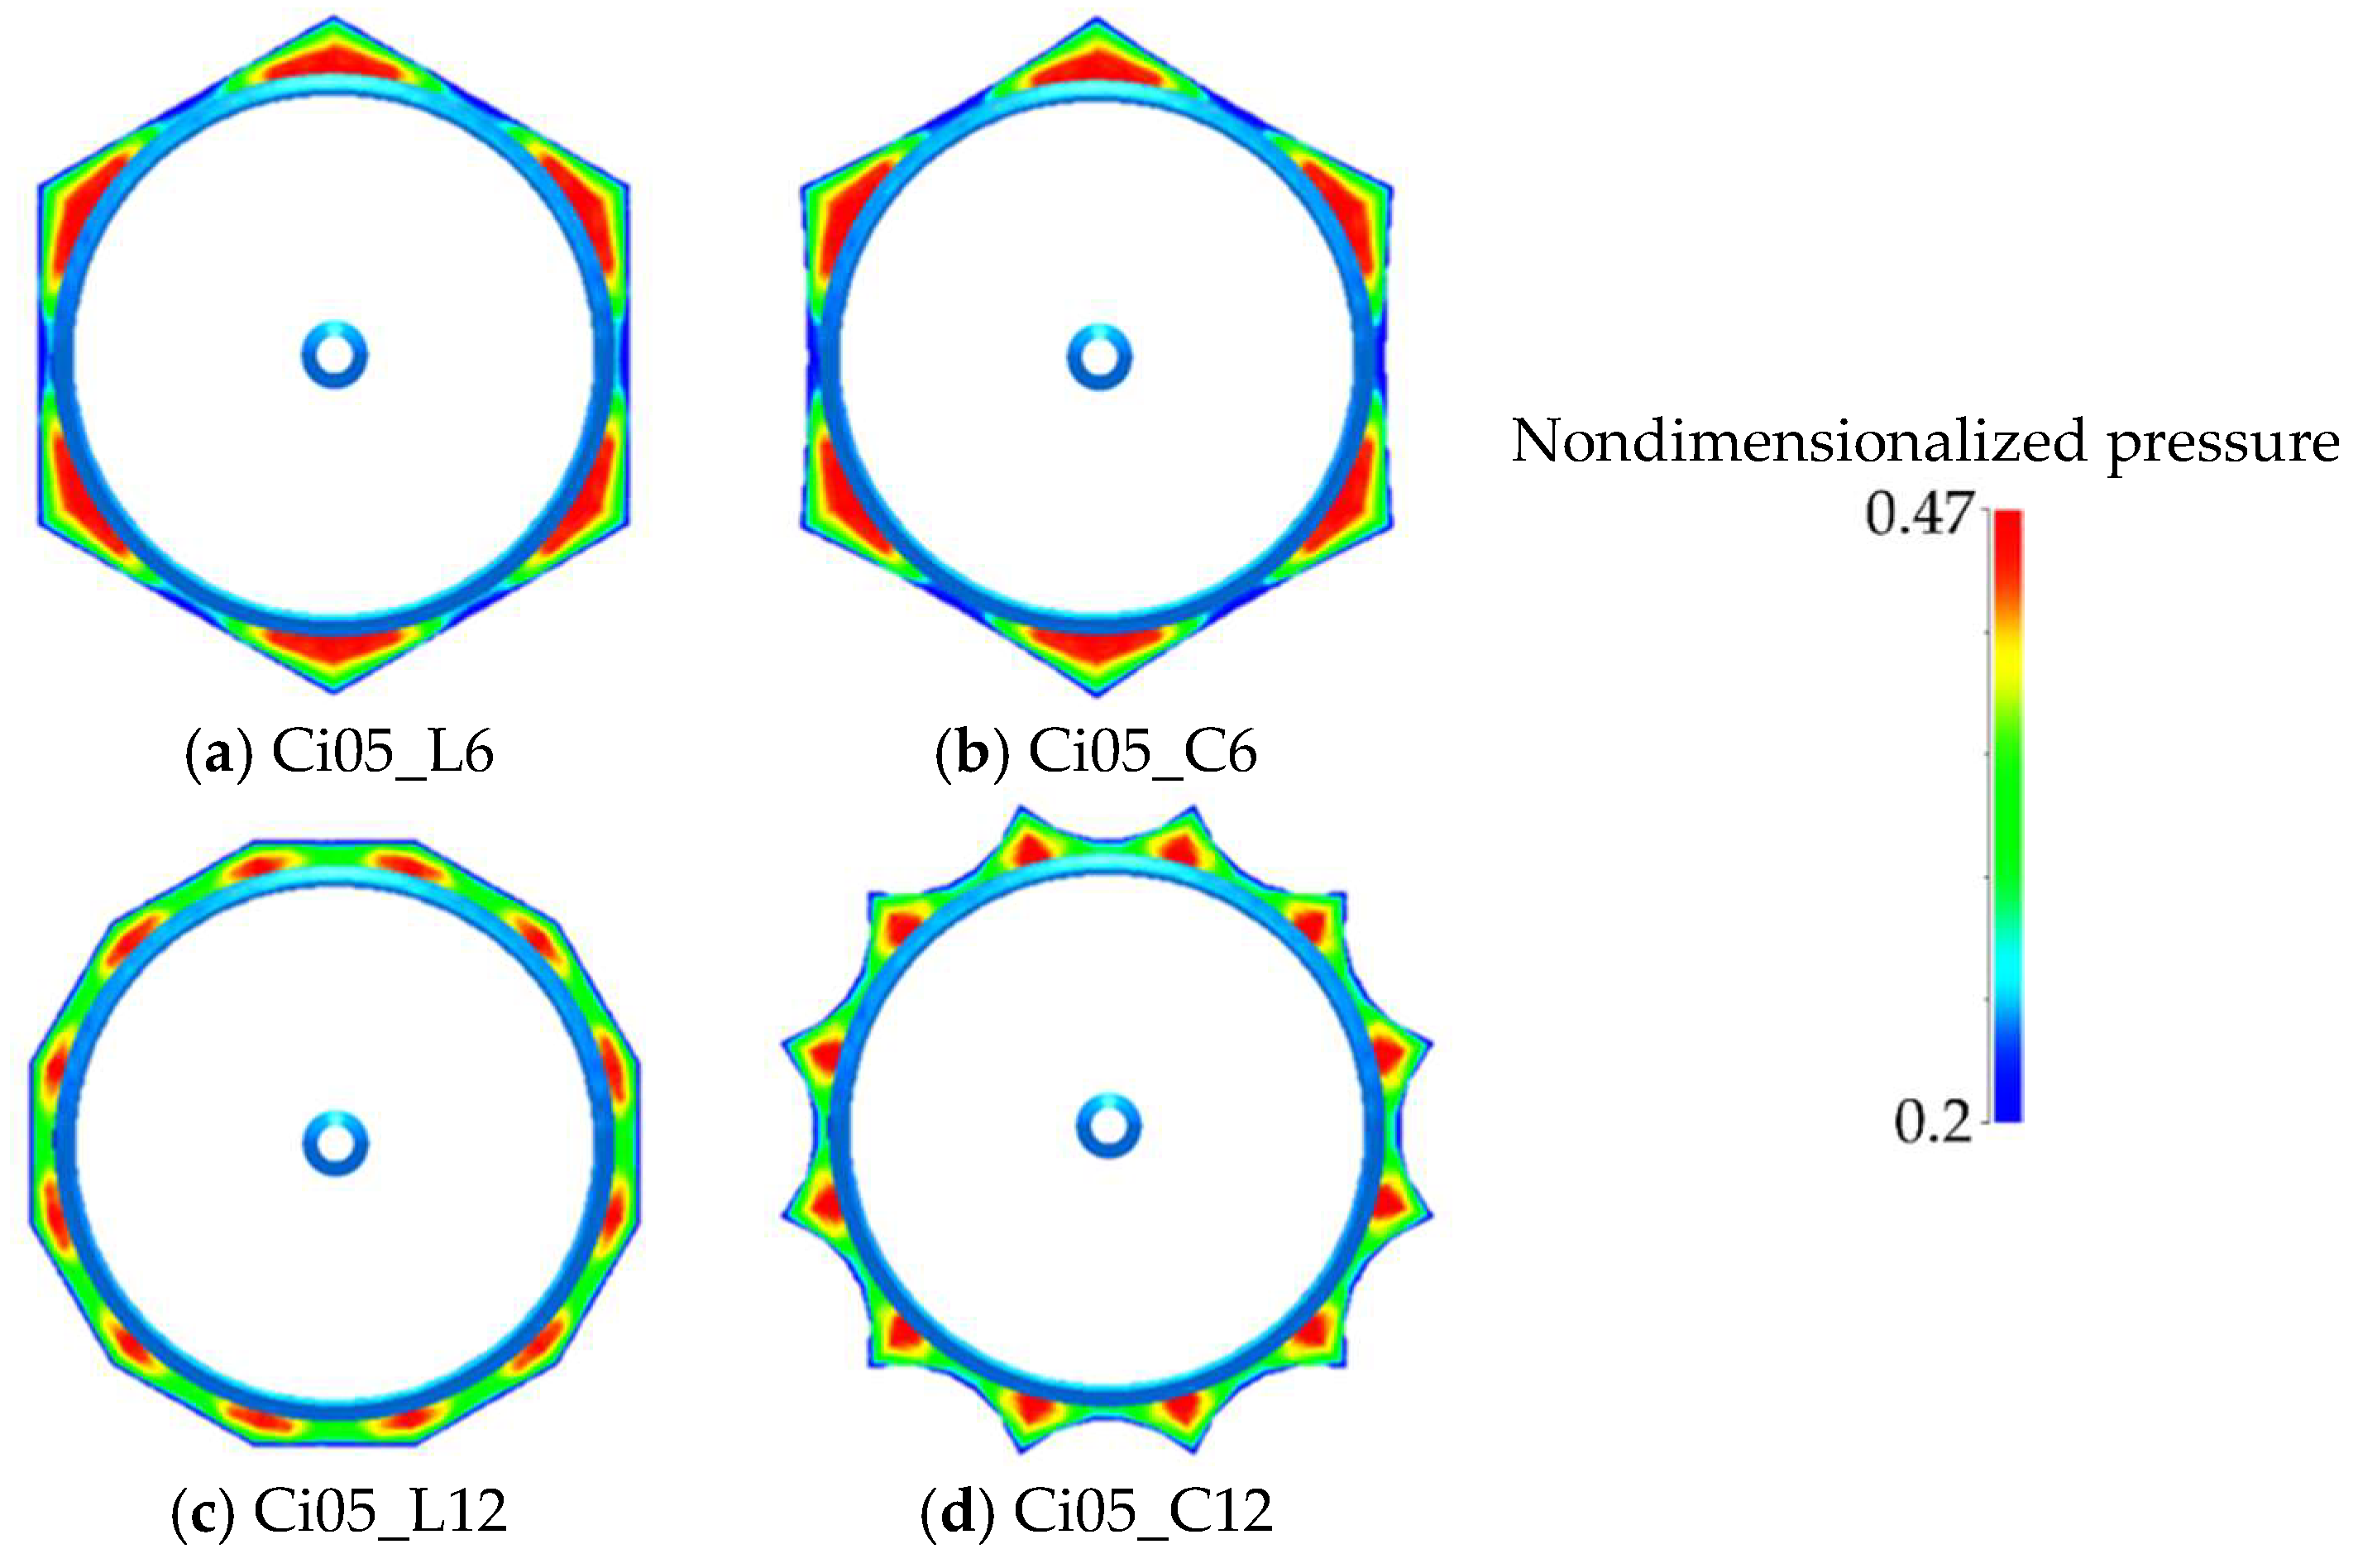
3.2.2. Periodic Vortex Structures around the Polygonal Brim
3.3. Future Possibilities
4. Conclusions
- The vortex stabilization plates enhance the output in a wide range of tip-speed ratios while the significance of the power enhancement depends on the installed number of the plates. A WLT with a high brim is able to enhance its power output even if the additional plates are small. In this study, the output peaked between 6 and 12 plates, which suggested the optimum range of the installed number of plates. WLT Ci10 with six plates achieved a maximum 3.8% increase in power output.
- A WLT with vortex stabilization plates enables its brim to form two-dimensional vortices around itself. The vortices maintain the WLT’s strong drawing action, especially near the inside wall of the duct where wind speed is accelerated.
- The vortex shedding from the WLT brim has a circumferentially periodic pattern, while the pattern instantaneously becomes unstable and asymmetrical. The vortex stabilization plates suppress vortex fluctuations, and the contribution is maximized when a pair of plates divides the structure of vortex shed into a size corresponding to the wavelength of its periodic loop. The wavenumber of the periodic loop derived by numerical simulation coincided with the optimum range of the installed number of the plates in wind tunnel experiments.
- The polygonal brims are able to form periodical vortex patterns without vortex stabilization plates, and the effect stabilizes the vortices. The wavelengths of the patterns coincide with the distances between the vertices of the brims. The WLT with the dodecagon brim achieved an approximately 1.5% increase in power output without vortex stabilization plates.
Author Contributions
Funding
Acknowledgments
Conflicts of Interest
References
- Gilbert, B.L.; Foreman, K.M. Experiments with a diffuser-augmented model wind turbine. J. Energy Resour. Technol. 1983, 105, 46–53. [Google Scholar] [CrossRef]
- Bussel, G.J.W. The science of making more torque from wind: Diffuser experiments and theory revisited. J. Phys. Conf. Ser. 2007, 75, 012010. [Google Scholar] [CrossRef]
- Hansen, M.O.L.; Sørensen, N.N.; Flay, R.G.J. Effect of placing a diffuser around a wind turbine. Wind Energy 2001, 3, 207–213. [Google Scholar] [CrossRef]
- Jamieson, P.M. Beating betz: Energy extraction limits in a constrained flow field. J. Sol. Energy Eng. 2009, 131, 031008. [Google Scholar] [CrossRef]
- Liu, Y.; Yoshida, S. An extension of the generalized actuator disc theory for aerodynamic analysis of the diffuser-augmented wind turbines. Energy 2015, 93, 1852–1859. [Google Scholar] [CrossRef]
- Aranake, A.C.; Lakshminarayan, V.K.; Duraisamy, K. Computational analysis of shrouded wind turbine configurations using a 3-dimensional RANS solver. Renew. Energy 2015, 75, 818–832. [Google Scholar] [CrossRef]
- Khamlaj, T.A.; Rumpfkeil, M.P. Analysis and optimization of ducted wind turbines. Energy 2018, 162, 1234–1252. [Google Scholar] [CrossRef]
- Oka, N.; Furukawa, M.; Kawamitsu, K.; Yamada, K. Optimum aerodynamic design for wind-lens turbine. J. Fluid Sci. Technol. 2016, 11, JFST0011. [Google Scholar] [CrossRef]
- Vaz, J.R.P.; Wood, D.H. Aerodynamic optimization of the blades of diffuser-augmented wind turbines. Energy Convers. Manag. 2016, 123, 35–45. [Google Scholar] [CrossRef]
- Wang, W.X.; Matsubara, T.; Hu, J.; Odahara, S.; Nagai, T.; Karasudani, T.; Ohya, Y. Experimental investigation into the influence of the flanged diffuser on the dynamic behavior of CFRP blade of a shrouded wind turbine. Renew. Energy 2015, 78, 386–397. [Google Scholar] [CrossRef]
- Hashem, I.; Mohamed, M.H.; Hafiz, A.A. Aero-acoustics noise assessment for Wind-Lens turbine. Energy 2017, 118, 345–368. [Google Scholar] [CrossRef]
- Ohya, Y.; Karasudani, T.; Sakurai, A.; Abe, K.; Inoue, M. Development of a shrouded wind turbine with a flanged diffuser. J. Wind Eng. Ind. Aerodyn. 2008, 96, 524–539. [Google Scholar] [CrossRef]
- Ohya, Y.; Karasudani, T. A shrouded wind turbine generating high output power with wind-lens technology. Energies 2010, 3, 1043–1052. [Google Scholar] [CrossRef]
- Fernandez-Gamiz, U.; Velte, C.M.; Réthoré, P.E.; Sørensen, N.N.; Egusquiza, E. Testing of self-similarity and helical symmetry in vortex generator flow simulations. Wind Energy 2016, 19, 1043–1052. [Google Scholar] [CrossRef]
- Fernandez-Gamiz, U.; Gomez-Mármol, M.; Chacón-Rebollo, T. Computational modeling of gurney flaps and microtabs by POD method. Energies 2018, 11, 2091. [Google Scholar] [CrossRef]
- Aramendia, I.; Fernandez-Gamiz, U.; Zulueta, E.; Saenz-Aguirre, A.; Teso-Fz-Betoño, D. Parametric study of a gurney flap implementation in a DU91W(2)250 airfoil. Energies 2019, 12, 294. [Google Scholar] [CrossRef]
- Lee, G.; Ding, Y.; Xie, L.; Genton, M.G. A kernel plus method for quantifying wind turbine performance upgrades. Wind Energy 2015, 18, 1207–1219. [Google Scholar] [CrossRef]
- Abe, K.; Nishida, M.; Sakurai, A.; Ohya, Y.; Kihara, H.; Wada, E.; Sato, K. Experimental and numerical investigations of flow fields behind a small wind turbine with a flanged diffuser. J. Wind Eng. Ind. Aerodyn. 2005, 93, 951–970. [Google Scholar] [CrossRef]
- Zhu, H.; Sueyoshi, M.; Hu, C.; Yoshida, S. A study on a floating type shrouded wind turbine: Design, modeling and analysis. Renew. Energy 2018, 134, 1099–1113. [Google Scholar] [CrossRef]
- Watanabe, K.; Ohya, Y.; Uchida, T.; Nagai, T. Numerical prediction and field verification test of wind-power generation potential in nearshore area using a moored floating platform. J. Flow Control Meas. Vis. 2017, 5, 21–35. [Google Scholar] [CrossRef][Green Version]
- Watanabe, K.; Takahashi, S.; Ohya, Y. Application of a diffuser structure to vertical-axis wind turbines. Energies 2016, 9, 406. [Google Scholar] [CrossRef]
- Amano, R.S. Review of wind turbine research in 21st century. J. Energy Resour. Technol. 2017, 139, 050801. [Google Scholar] [CrossRef]
- Göltenbott, U.; Ohya, Y.; Yoshida, S.; Jamieson, P. Aerodynamic interaction of diffuser augmented wind turbines in multi-rotor systems. Renew. Energy 2017, 112, 25–34. [Google Scholar] [CrossRef]
- Ohya, Y.; Miyazaki, J.; Göltenbott, U.; Watanabe, K. Power Augmentation of shrouded wind turbines in a multirotor system. J. Energy Resour. Technol. 2017, 139, 051202. [Google Scholar] [CrossRef]
- Watanabe, K.; Ohya, Y. Multi-Rotor Systems Using Three Shrouded Wind Turbines for Power Output Increase. J. Energy Resour. Technol. 2019, 141, 051211. [Google Scholar] [CrossRef]
- Ohya, Y.; Watanabe, K. A new approach toward power output enhancement using multirotor systems with shrouded wind turbines. J. Energy Resour. Technol. 2019, 141, 051203. [Google Scholar] [CrossRef]
- Takahashi, S.; Hata, Y.; Ohya, Y.; Karasudani, T.; Uchida, T. Behavior of the blade tip vortices of a wind turbine equipped with a brimmed-diffuser shroud. Energies 2012, 5, 5229–5242. [Google Scholar] [CrossRef]
- Taneda, S. Experimental investigation of the wake behind a sphere at low Reynolds numbers. J. Phys. Soc. Jpn. 1956, 11, 1104–1108. [Google Scholar] [CrossRef]
- Taneda, S. Visual observations of the flow past a sphere at Reynolds numbers between 104 and 106. J. Fluid Mech. 1978, 85, 187–192. [Google Scholar] [CrossRef]
- Achenbach, E. Experiments on the flow past spheres at very high Reynolds numbers. J. Fluid Mech. 1972, 54, 565–575. [Google Scholar] [CrossRef]
- Achenbach, E. Vortex shedding from spheres. J. Fluid Mech. 1974, 62, 209–221. [Google Scholar] [CrossRef]
- Nakamura, Y.; Ohya, Y. The effects of turbulence on the mean flow past square rods. J. Fluid Mech. 1983, 137, 331–345. [Google Scholar] [CrossRef]
- Nakamura, Y.; Ohya, Y. Vortex shedding from square prisms in smooth and turbulent flows. J. Fluid Mech. 1986, 164, 77–89. [Google Scholar] [CrossRef]
- Bearman, P.W. Vortex shedding from oscillating bluff bodies. Annu. Rev. Fluid Mech. 1984, 16, 195–222. [Google Scholar] [CrossRef]
- Bearman, P.W.; Takamoto, M. Vortex shedding behind rings and discs. Fluid Dyn. Res. 1988, 3, 214–218. [Google Scholar] [CrossRef]
- Castro, I.P.; Takamoto, M. Vortex shedding from a ring in shear flow. Exp. Fluid 1994, 16, 187–195. [Google Scholar] [CrossRef]
- Hirata, K.; Funaki, J.; Tsuno, N. On the critical geometry of a ring in flow. Trans. JSME Ser. B 2001, 67, 3101–3109. [Google Scholar] [CrossRef][Green Version]
- Hirata, K.; Nagase, A.; Funaki, J. On the development of ring-vortex wake. Trans. JSME Ser. B 2006, 72, 285–290. [Google Scholar] [CrossRef]
- Hirata, K.; Funaki, J.; Nagase, A.; Fujikawa, A. On curvature and thickness effects on flow past a ring. Trans. JSME Ser. B 2007, 73, 126–132. [Google Scholar] [CrossRef][Green Version]
- Funaki, J.; Sakata, Y.; Nagase, A.; Hirata, K. PIV Measurements of Ring Vortex Wake. In Proceedings of the 5th International Symposium on Measurement Techniques for Multiphase Flows, Macau, China, 10–13 December 2006; AIP Publishing: Melville, NY, USA, 2006. [Google Scholar]
- Obase, Y.; Hiratani, F.; Furukawa, M. Development of Wind Lens Turbine by Three-Dimension Blade Design. In Proceedings of the Annual Meeting, Japan Society of Fluid Mechanics, Kobe, Japan, 4–7 September 2008; The Japan Society of Fluid Mechanics: Tokyo, Japan, 2008; p. 150. (In Japanese). [Google Scholar]
- Sugita, Y.; Ueda, M.; Nagatsu, J.; Furukawa, M.; Ohya, Y. Effects of Blade Profile on Aerodynamic Performance of Wind Turbines with Brimmed Diffuser. In Proceedings of the JSME Annual Meeting, Chofu, Japan, 19–22 September 2005; The Japan Society of Mechanical Engineers: Tokyo, Japan, 2005; pp. 255–256. (In Japanese). [Google Scholar] [CrossRef]
- Matsumiya, H.; Tsutsui, Y.; Kawamura, S.; Kieda, K.; Kato, E.; Takano, S.; Toe, Y. Performance of New ‘MEL-WING SECTIONS’ for Wind Turbines. In Proceedings of the European Community Wind Energy Conference, Madrid, Spain, 10–14 September 1990; H. S. Stephens & Associates: Lyngby, Denmark, 1990; pp. 258–263. [Google Scholar]
- Uchida, T. Computational fluid dynamics (CFD) investigation of wind turbine nacelle separation accident over complex terrain in japan. Energies 2018, 11, 1485. [Google Scholar] [CrossRef]
- Uchida, T. LES investigation of terrain-induced turbulence in complex terrain and economic effects of wind turbine control. Energies 2018, 11, 1530. [Google Scholar] [CrossRef]
- Uchida, T. Computational fluid dynamics approach to predict the actual wind speed over complex terrain. Energies 2018, 11, 1694. [Google Scholar] [CrossRef]
- Uchida, T. Numerical investigation of terrain-induced turbulence in complex terrain by large-eddy simulation (LES) technique. Energies 2018, 11, 2638. [Google Scholar] [CrossRef]
- RIAM-COMPACT Co., Ltd. Available online: http://riam-compact.com/ (accessed on 24 January 2019).
- RIAM; Kyushu University Division of Renewable Energy Dynamics; Wind Engineering Section. Available online: https://www.riam.kyushu-u.ac.jp/windeng/en_index.html (accessed on 24 January 2019).
- Ohya, Y.; Uchida, T.; Karasudani, T.; Hasegawa, M.; Kume, H. Numerical studies of flow around a wind turbine equipped with a flanged-diffuser shroud using an actuator-disk model. Wind Eng. 2012, 36, 455–472. [Google Scholar] [CrossRef]
- Harlow, F.H.; Welch, J.E. Numerical calculation of time-dependent viscous incompressible flow of fluid with free surface. Phys. Fluids 1965, 8, 2182–2189. [Google Scholar] [CrossRef]
- Kajishima, T.; Taira, K. Computational Fluid Dynamics—Incompressible Turbulent Flows, 1st ed.; Springer International Publishing AG: Cham, Switzerland, 2017; pp. 110–114. [Google Scholar]
- Kawamura, T.; Takami, H.; Kuwahara, K. Computation of high Reynolds number flow around a circular cylinder with surface roughness. Fluid Dyn. Res. 1986, 1, 145–162. [Google Scholar] [CrossRef]
- Sørensen, J.N.; Myken, A. Unsteady actuator disc model for horizontal axis wind turbine. J. Wind Eng. Ind. Aerodyn. 1992, 39, 139–149. [Google Scholar] [CrossRef]
- Sheard, G.J.; Thompson, M.C.; Hourigan, K. From spheres to circular cylinders: Non-axisymmetric transitions in the flow past rings. J. Fluid Mech. 2004, 506, 45–78. [Google Scholar] [CrossRef]
- Williamson, C.H.K. Vortex dynamics in the cylinder wake. Annu. Rev. Fluid Mech. 1996, 28, 477–539. [Google Scholar] [CrossRef]
- Labbé, D.F.L.; Wilson, P.A. A numerical investigation of the effects of the spanwise length on the 3-D wake of a circular cylinder. J. Fluids Struct. 2007, 23, 1168–1188. [Google Scholar] [CrossRef]
- RIAMWIND Co., Ltd. Available online: http://www.riamwind.co.jp/english/index.html (accessed on 24 January 2019).


| Conditions | |
|---|---|
| Throat diameter of the duct | Dthroat = 1.0 m |
| Contour shape of the diffuser section in the duct | Ci type [13] |
| Brim height of the duct | h = 0.05 Dthroat or 0.10 Dthroat |
| Number of the additional plates | 0, 6, 12, 24, 36 |
| Turbine blade | MT1013-081 [41,42,43] |
| Inflow wind speed | U0 = 8 m/s (U0 = 4 m/s and U0 = 8 m/s for the wind speed measurement) (U0 = 1 m/s only for the flow visualization) |
| Reynolds number | 5.5 × 10⁵ (U0 = 8 m/s) (representative length: Dthroat) |
| Device | Manufacturer | Model | Measurement Accuracy |
|---|---|---|---|
| Torque detector Torque converter | Ono Sokki Co., Ltd. (Kanagawa, Japan) | SS-100 TS-2600 | ±0.2% F.S |
| AC servo-control system | Sanyo Denki Co., Ltd. (Tokyo, Japan) | PY0A 150A | - |
| Device | Manufacturer | Model | Specification |
|---|---|---|---|
| Hot-wire probe CTA unit Linearizer unit | Kanomax Japan, Inc. (Osaka, Japan) | 0251R-T5 1011 1013 | Straight type φ = 5 μm (Tungsten) |
| Shroud Shape | Plate Type | Number of Vortex Control Plates | ||||
|---|---|---|---|---|---|---|
| 0 | 6 | 12 | 24 | 36 | ||
| Ci05 (h = 0.05 Dthroat) | 1 | 0.723 | 0.727 | 0.725 | 0.721 | 0.723 |
| 2 | 0.723 | 0.740 | 0.741 | 0.726 | - | |
| Ci10 (h = 0.10 Dthroat) | 3 | 0.790 | - | 0.817 | 0.803 | - |
| 4 | 0.790 | 0.820 | 0.817 | 0.814 | 0.810 | |
© 2019 by the authors. Licensee MDPI, Basel, Switzerland. This article is an open access article distributed under the terms and conditions of the Creative Commons Attribution (CC BY) license (http://creativecommons.org/licenses/by/4.0/).
Share and Cite
Watanabe, K.; Ohya, Y.; Uchida, T. Power Output Enhancement of a Ducted Wind Turbine by Stabilizing Vortices around the Duct. Energies 2019, 12, 3171. https://doi.org/10.3390/en12163171
Watanabe K, Ohya Y, Uchida T. Power Output Enhancement of a Ducted Wind Turbine by Stabilizing Vortices around the Duct. Energies. 2019; 12(16):3171. https://doi.org/10.3390/en12163171
Chicago/Turabian StyleWatanabe, Koichi, Yuji Ohya, and Takanori Uchida. 2019. "Power Output Enhancement of a Ducted Wind Turbine by Stabilizing Vortices around the Duct" Energies 12, no. 16: 3171. https://doi.org/10.3390/en12163171
APA StyleWatanabe, K., Ohya, Y., & Uchida, T. (2019). Power Output Enhancement of a Ducted Wind Turbine by Stabilizing Vortices around the Duct. Energies, 12(16), 3171. https://doi.org/10.3390/en12163171