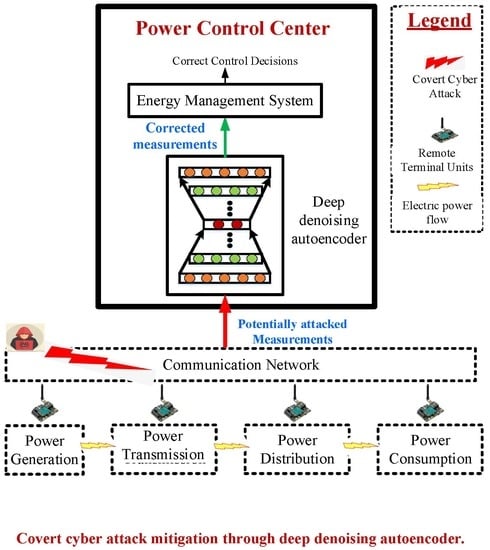
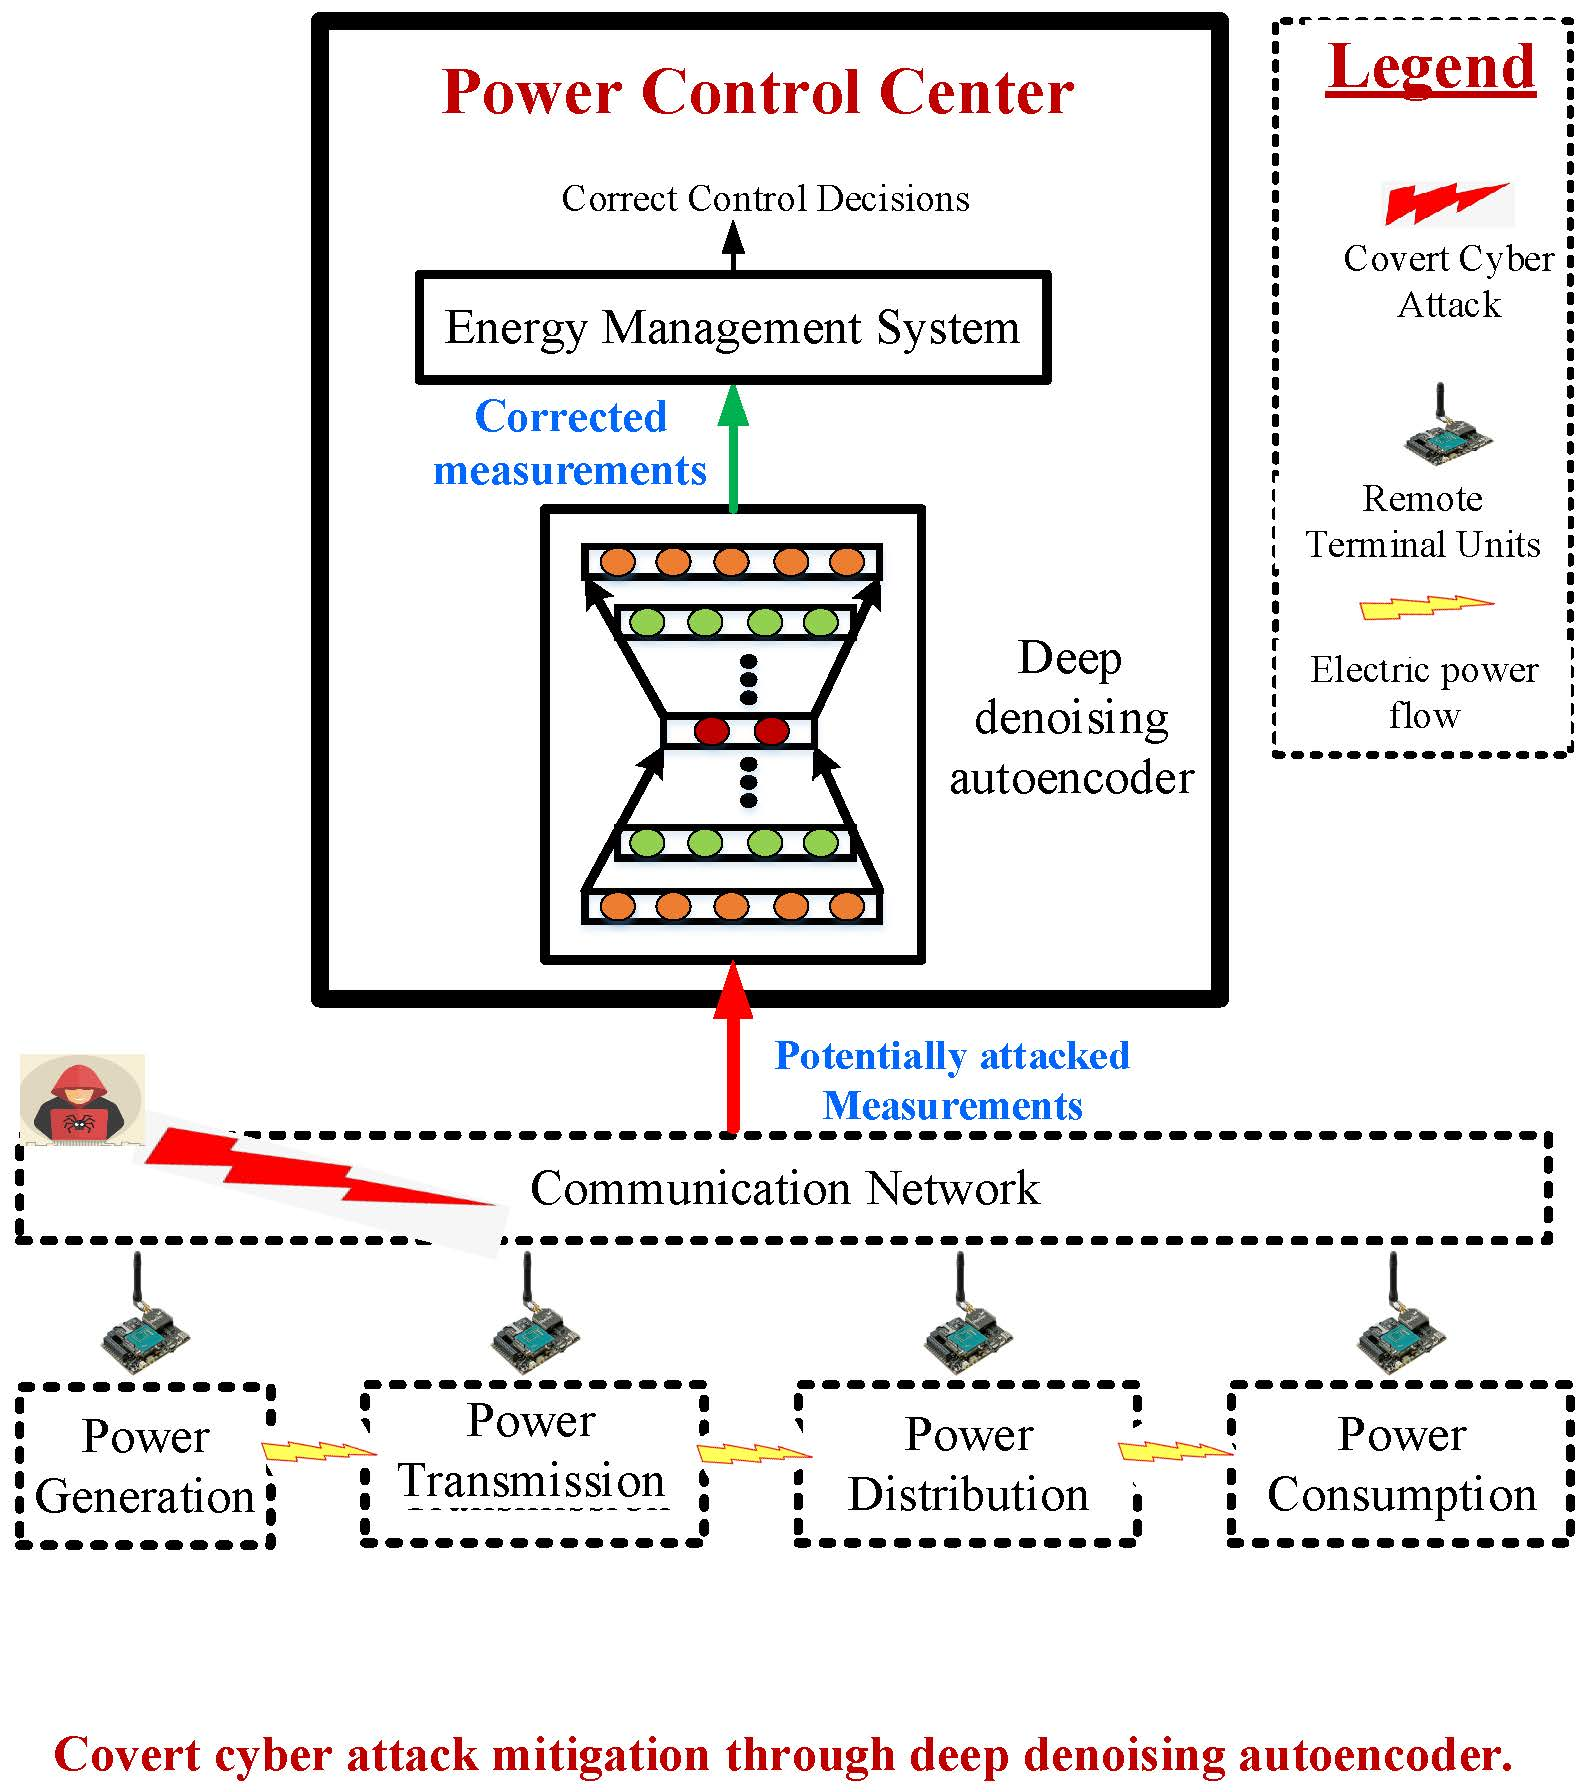
Figure 1.
SG data reconstruction options against CCDA attacks.
Figure 1.
SG data reconstruction options against CCDA attacks.
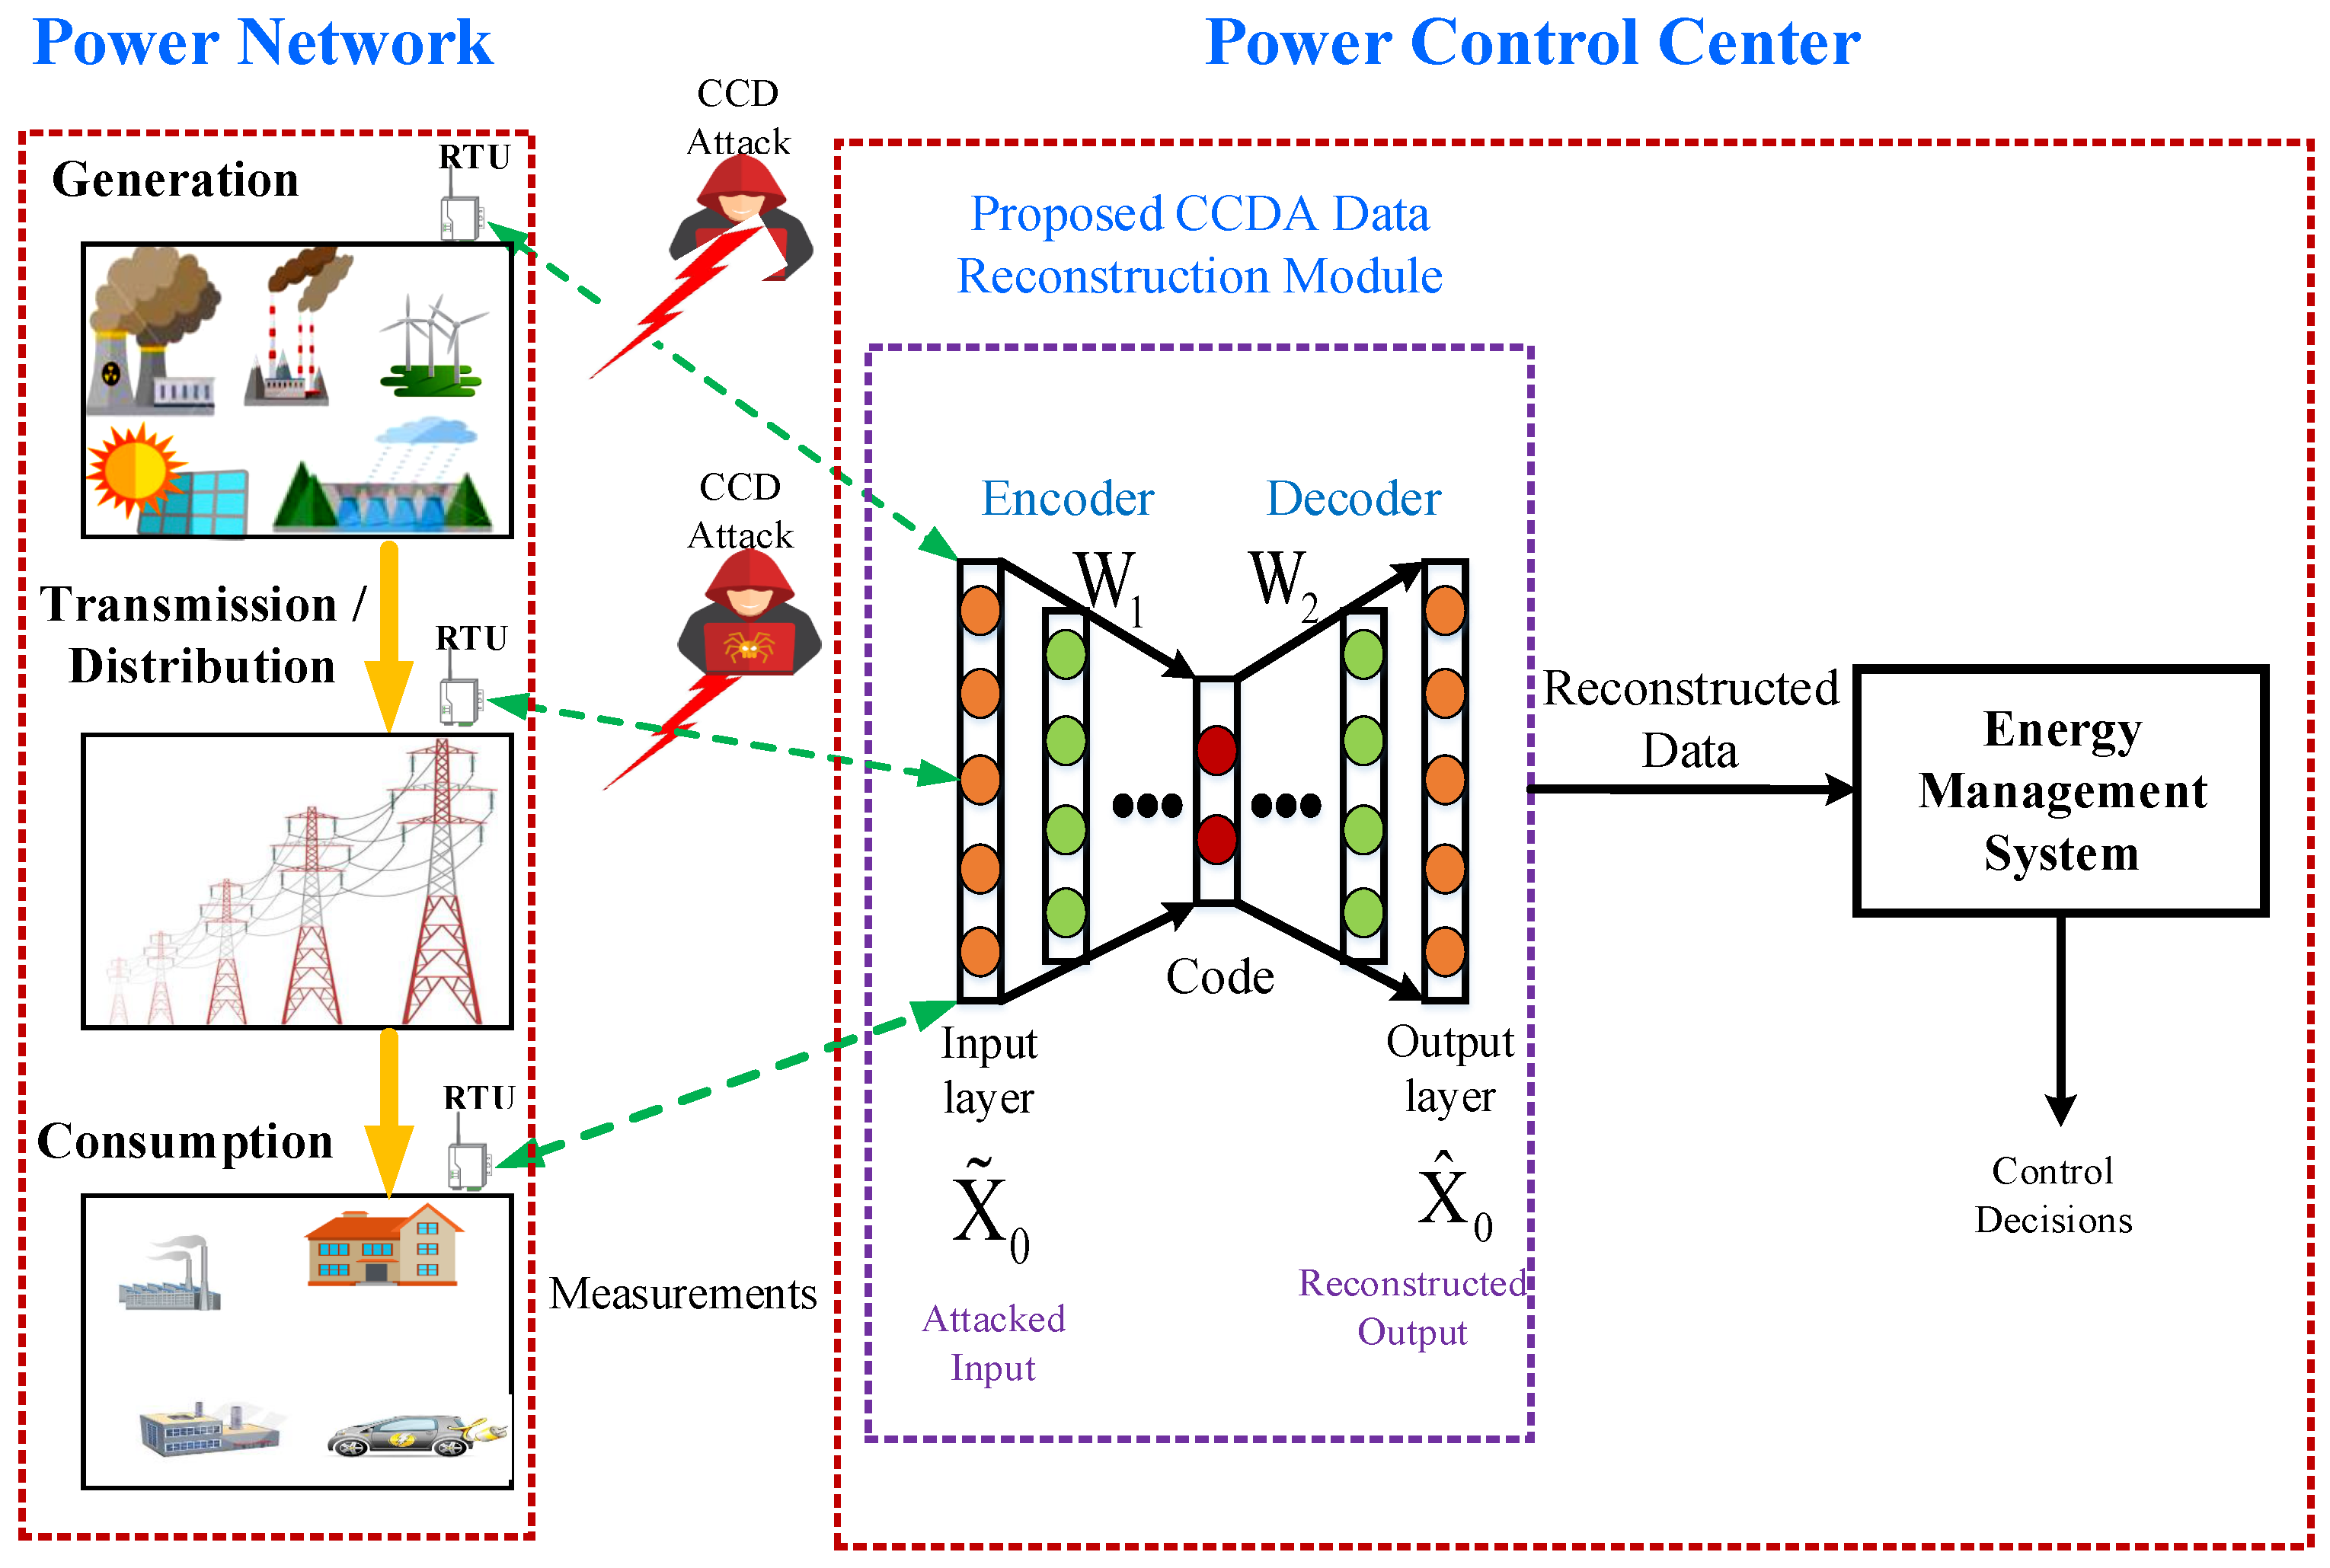
Figure 2.
SG Data reconstruction options against CCDA attacks.
Figure 2.
SG Data reconstruction options against CCDA attacks.
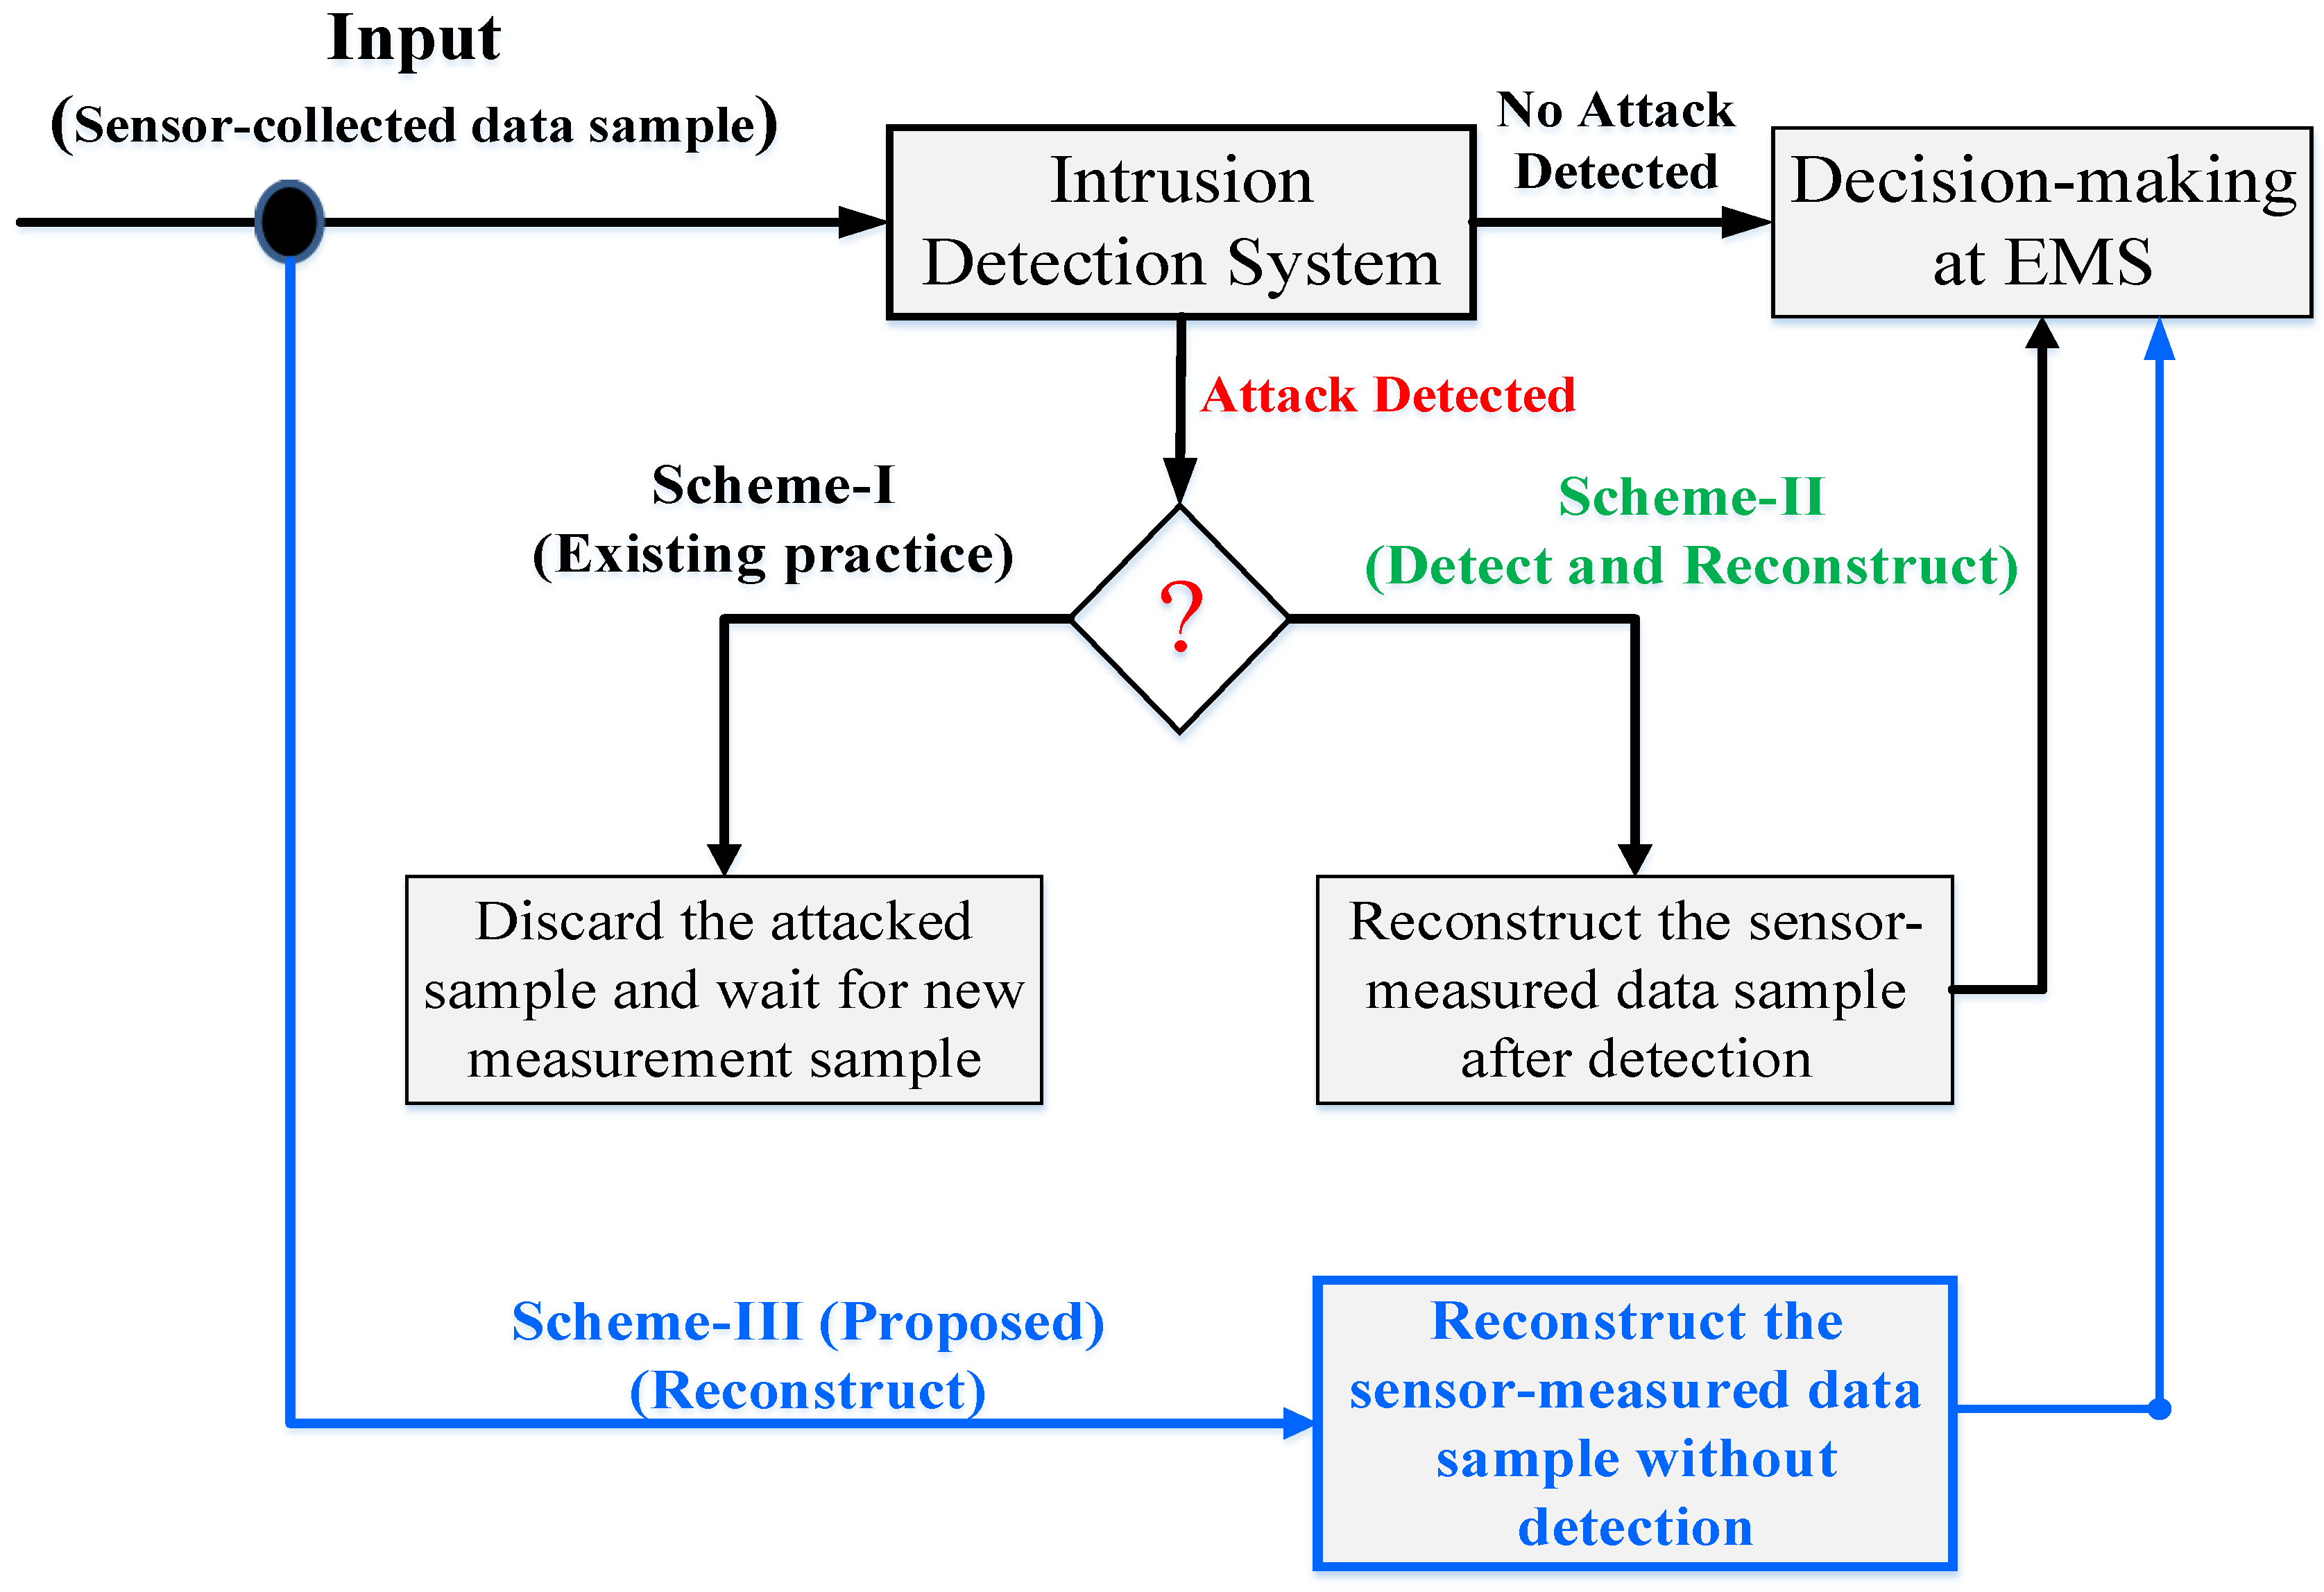
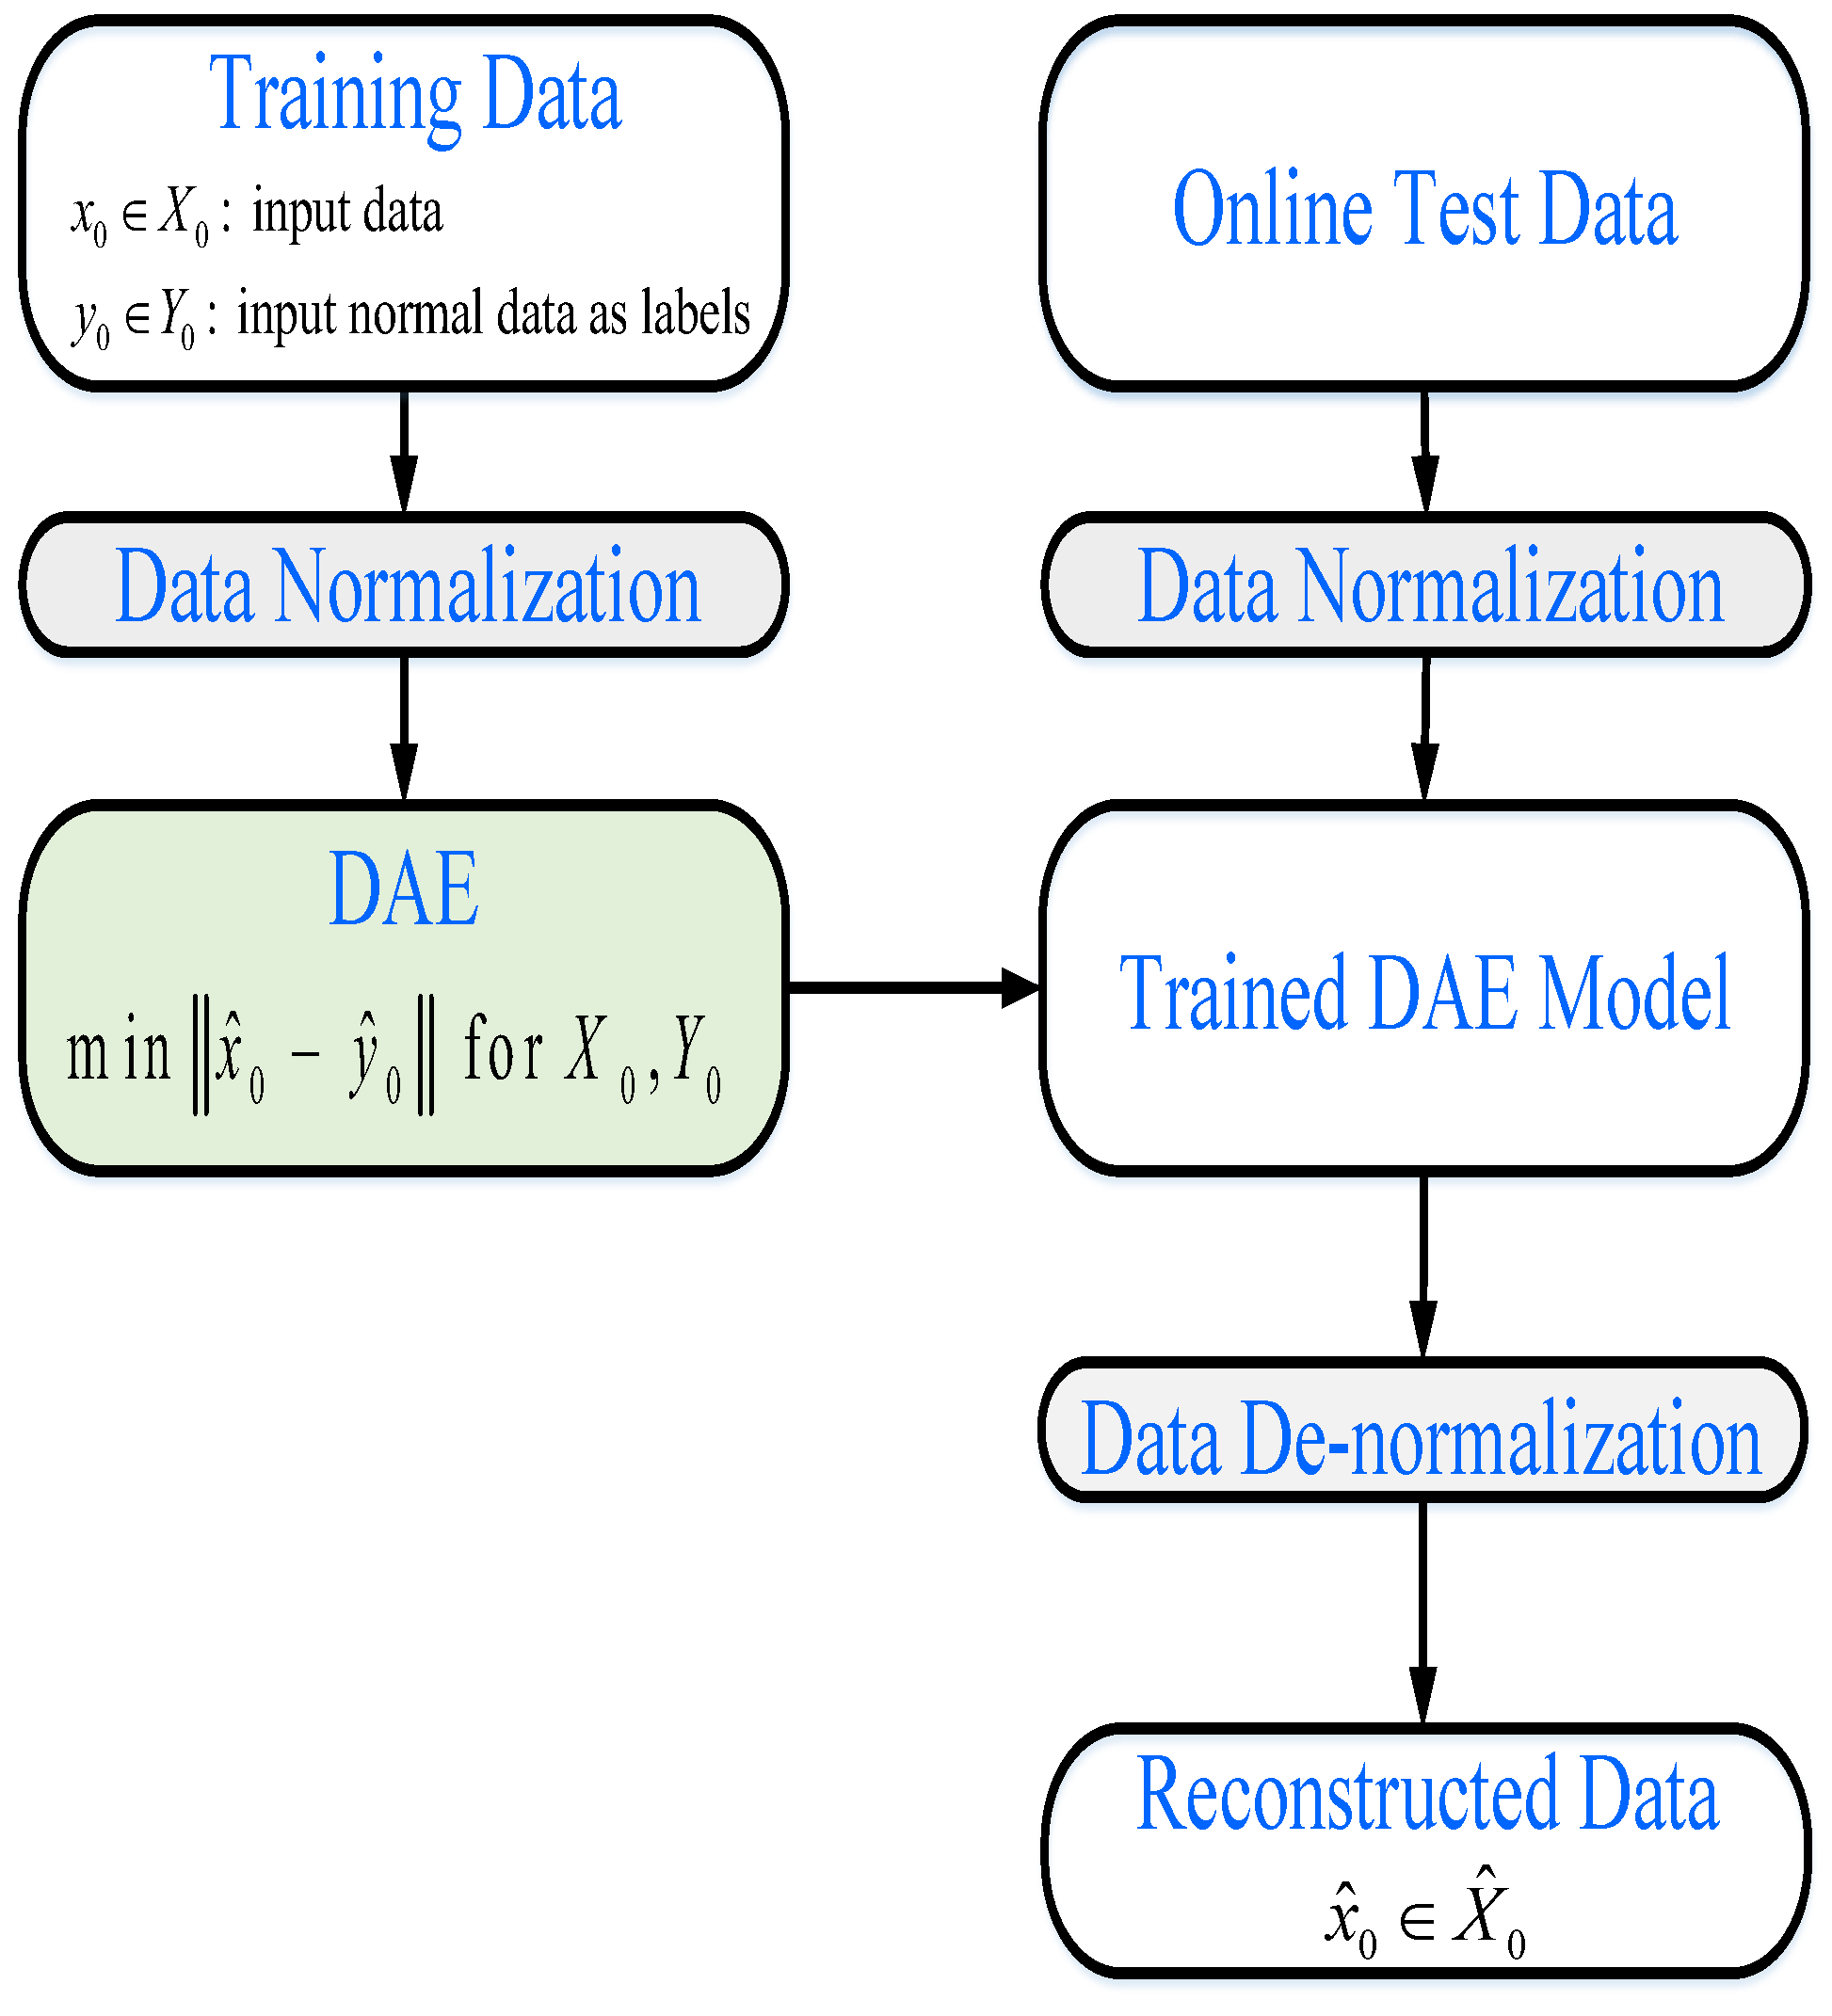
Figure 3.
A flowchart of the proposed scheme for reconstruction of data affected by CCDA.
Figure 3.
A flowchart of the proposed scheme for reconstruction of data affected by CCDA.
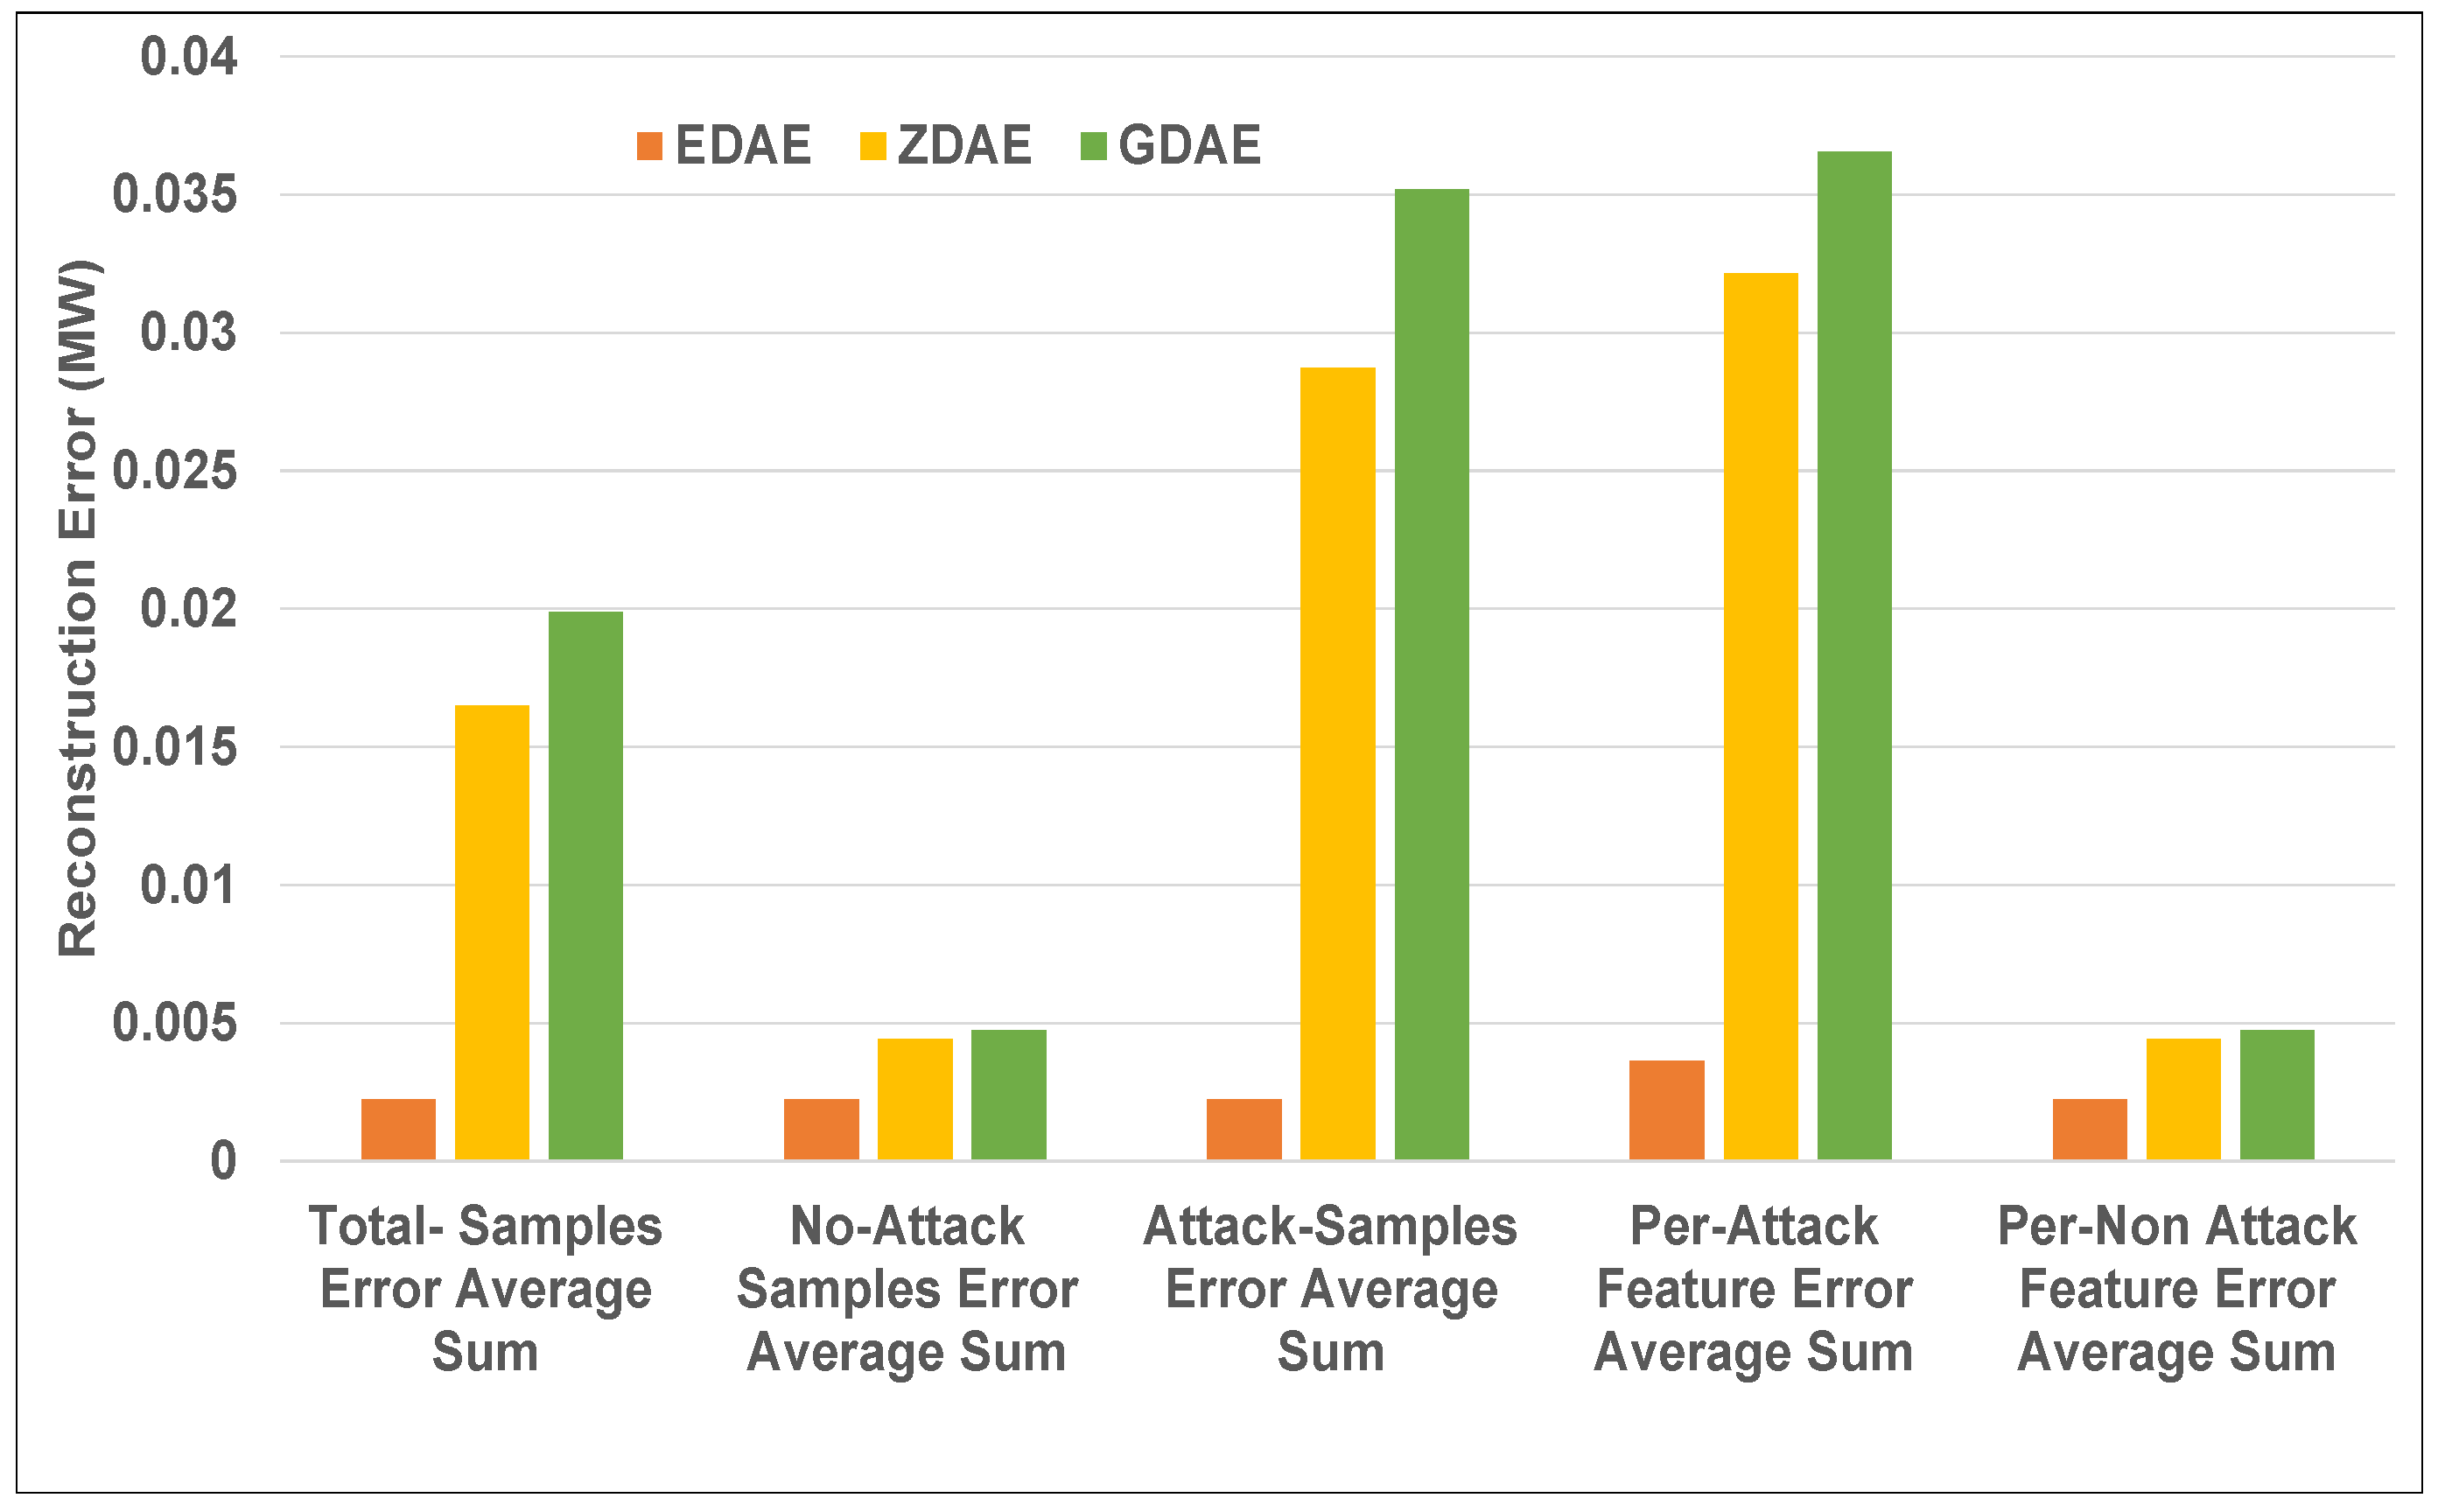
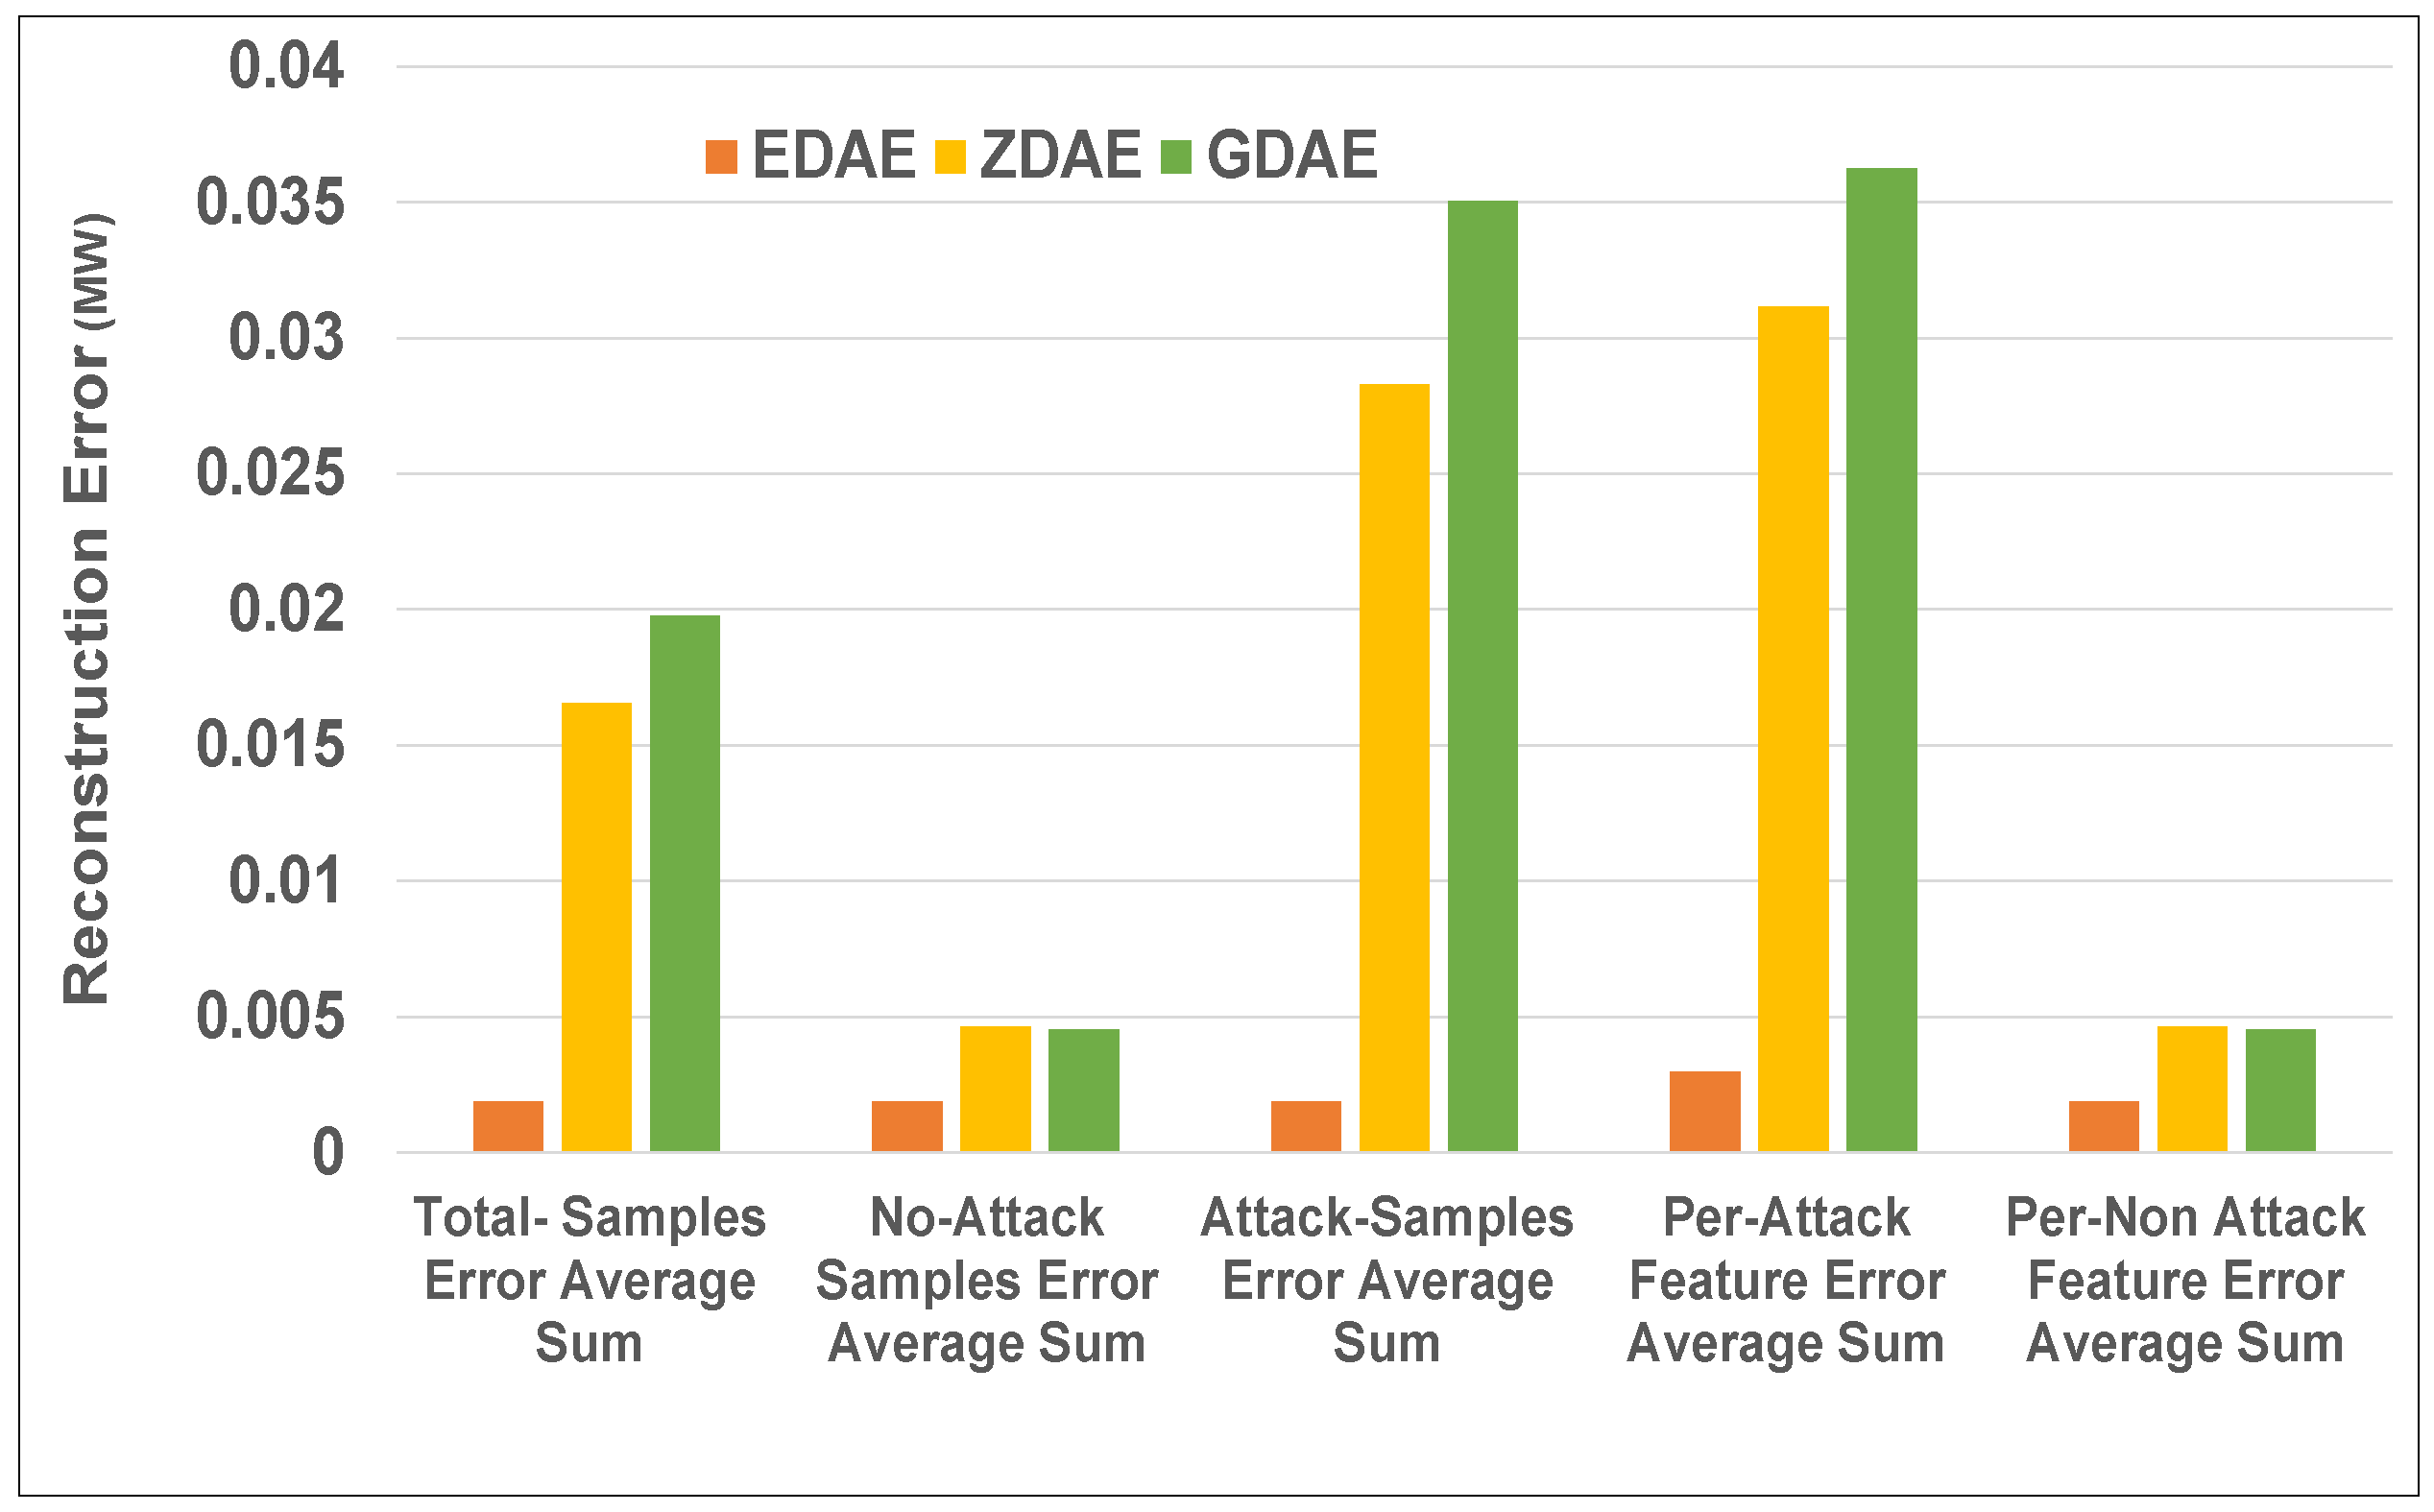
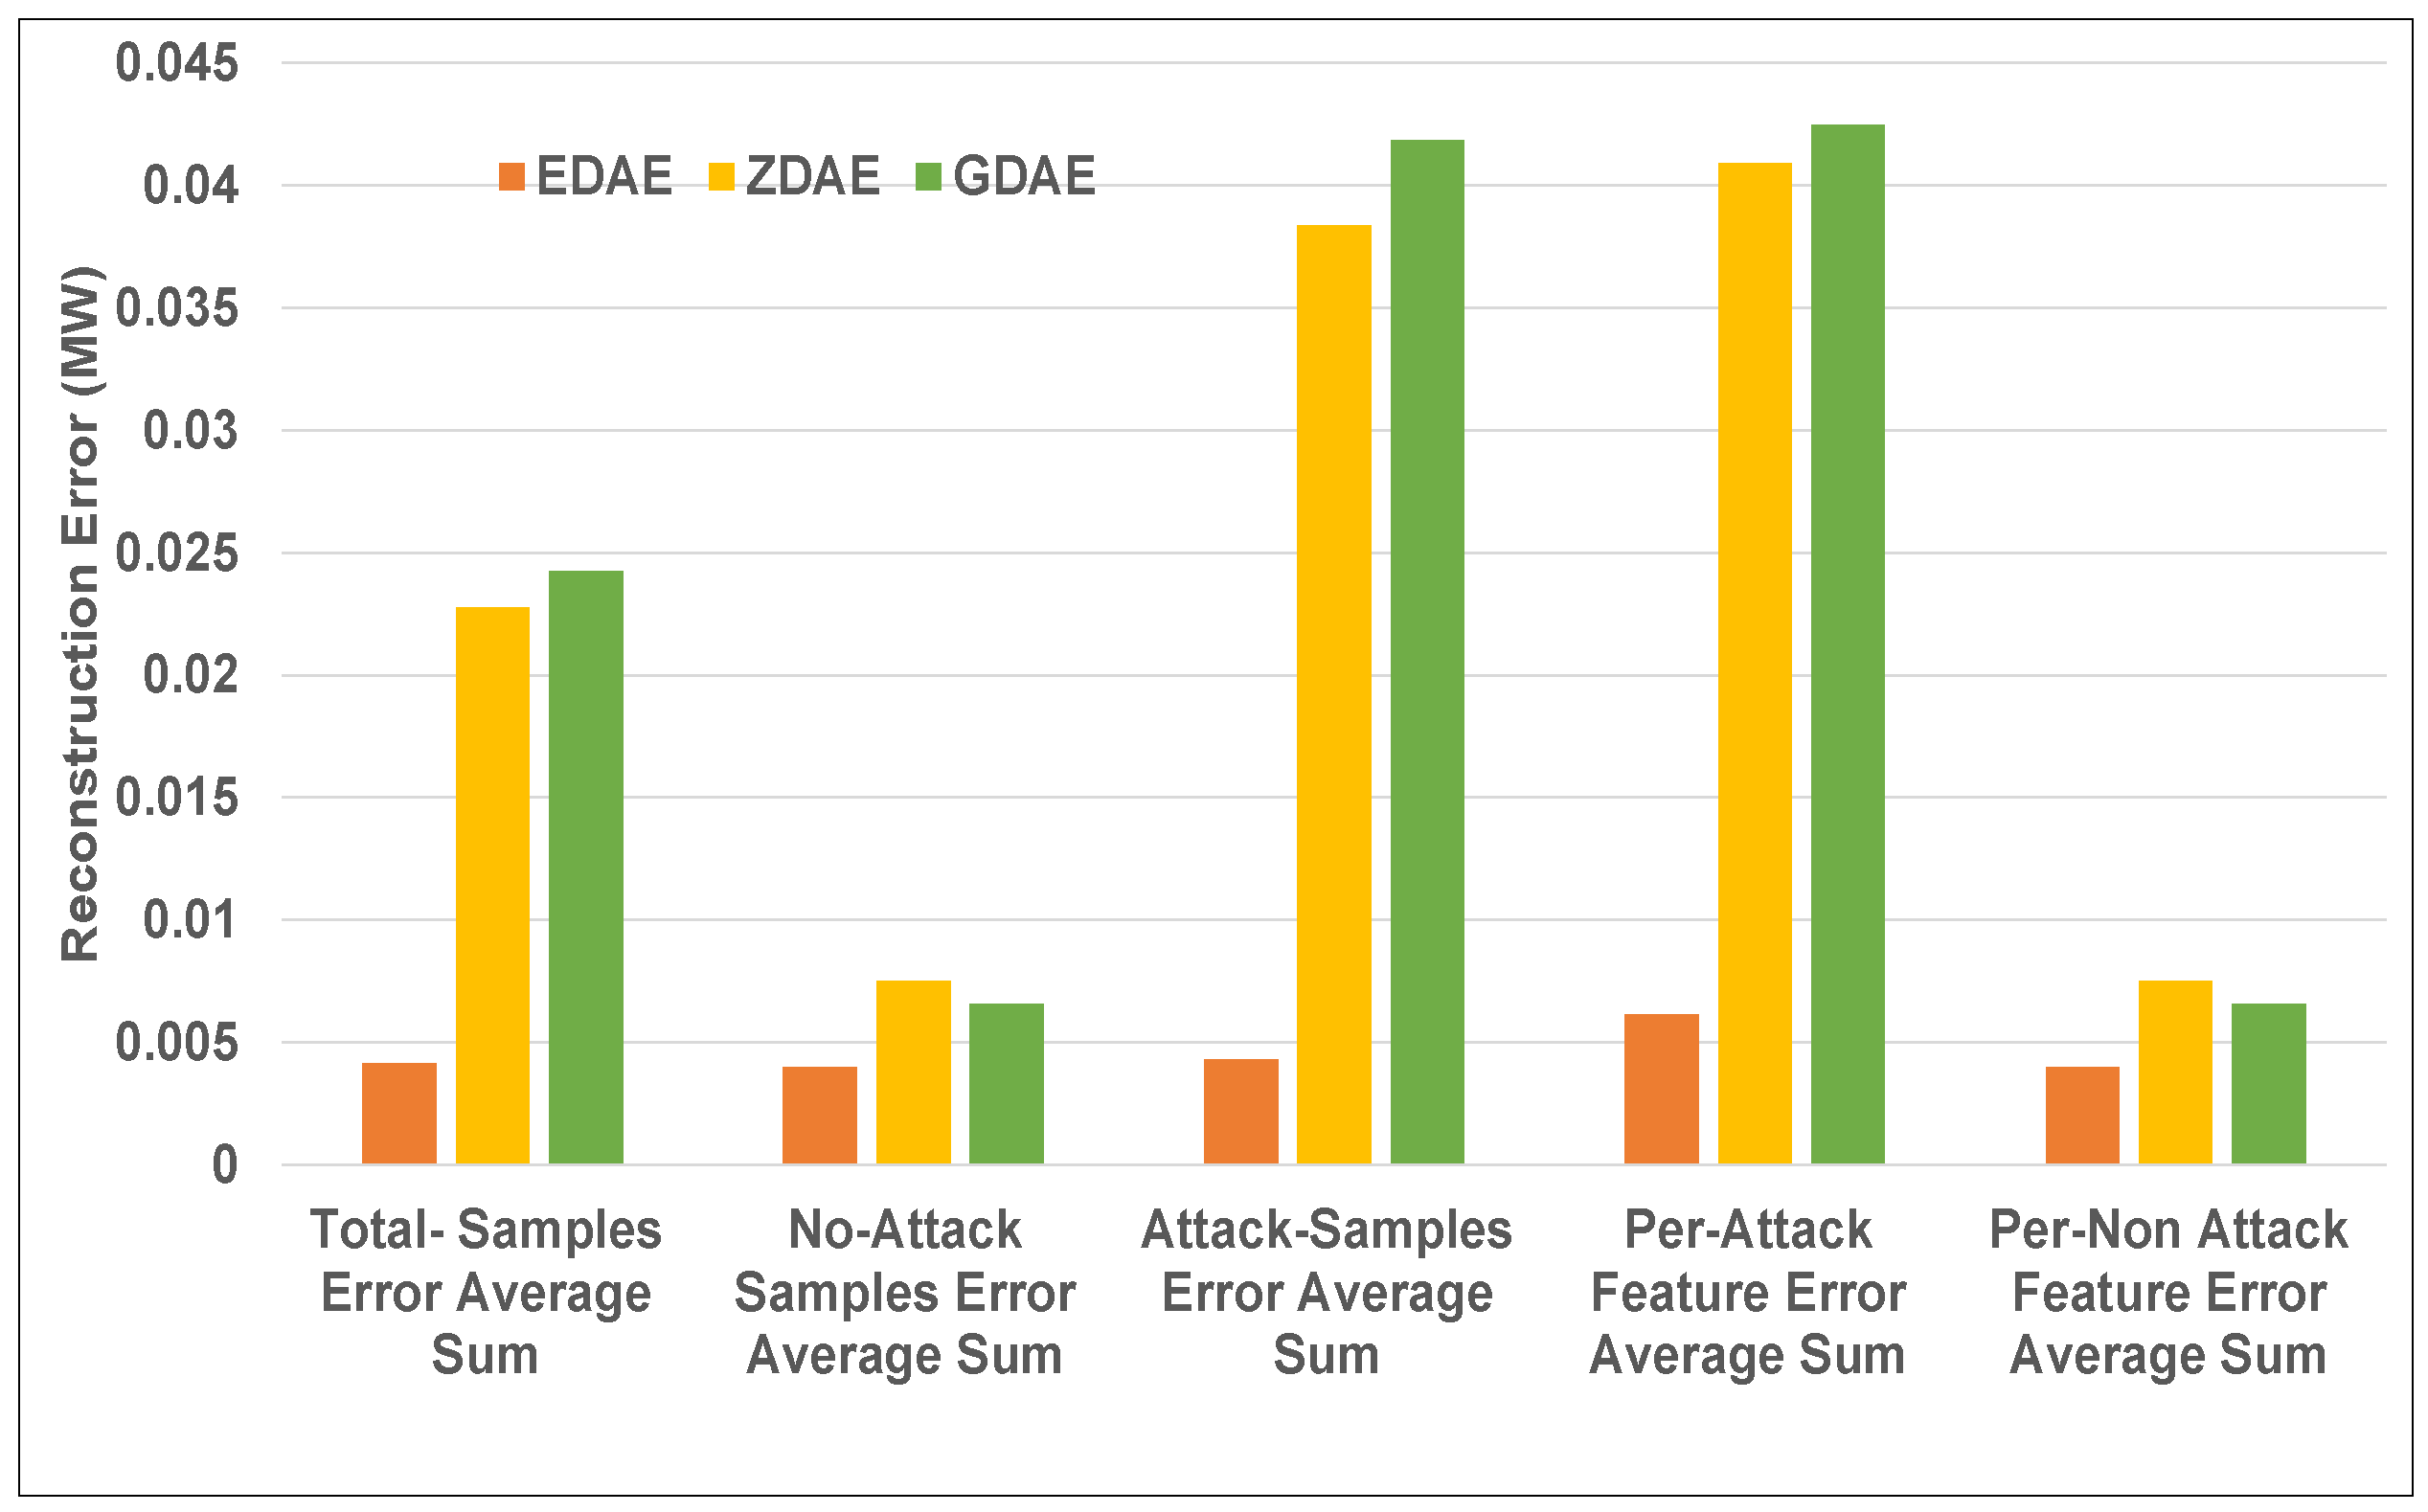
Figure 4.
Error average sum for various DAE schemes in a standard IEEE 14-bus system from a 20% fixed-attack dataset.
Figure 4.
Error average sum for various DAE schemes in a standard IEEE 14-bus system from a 20% fixed-attack dataset.
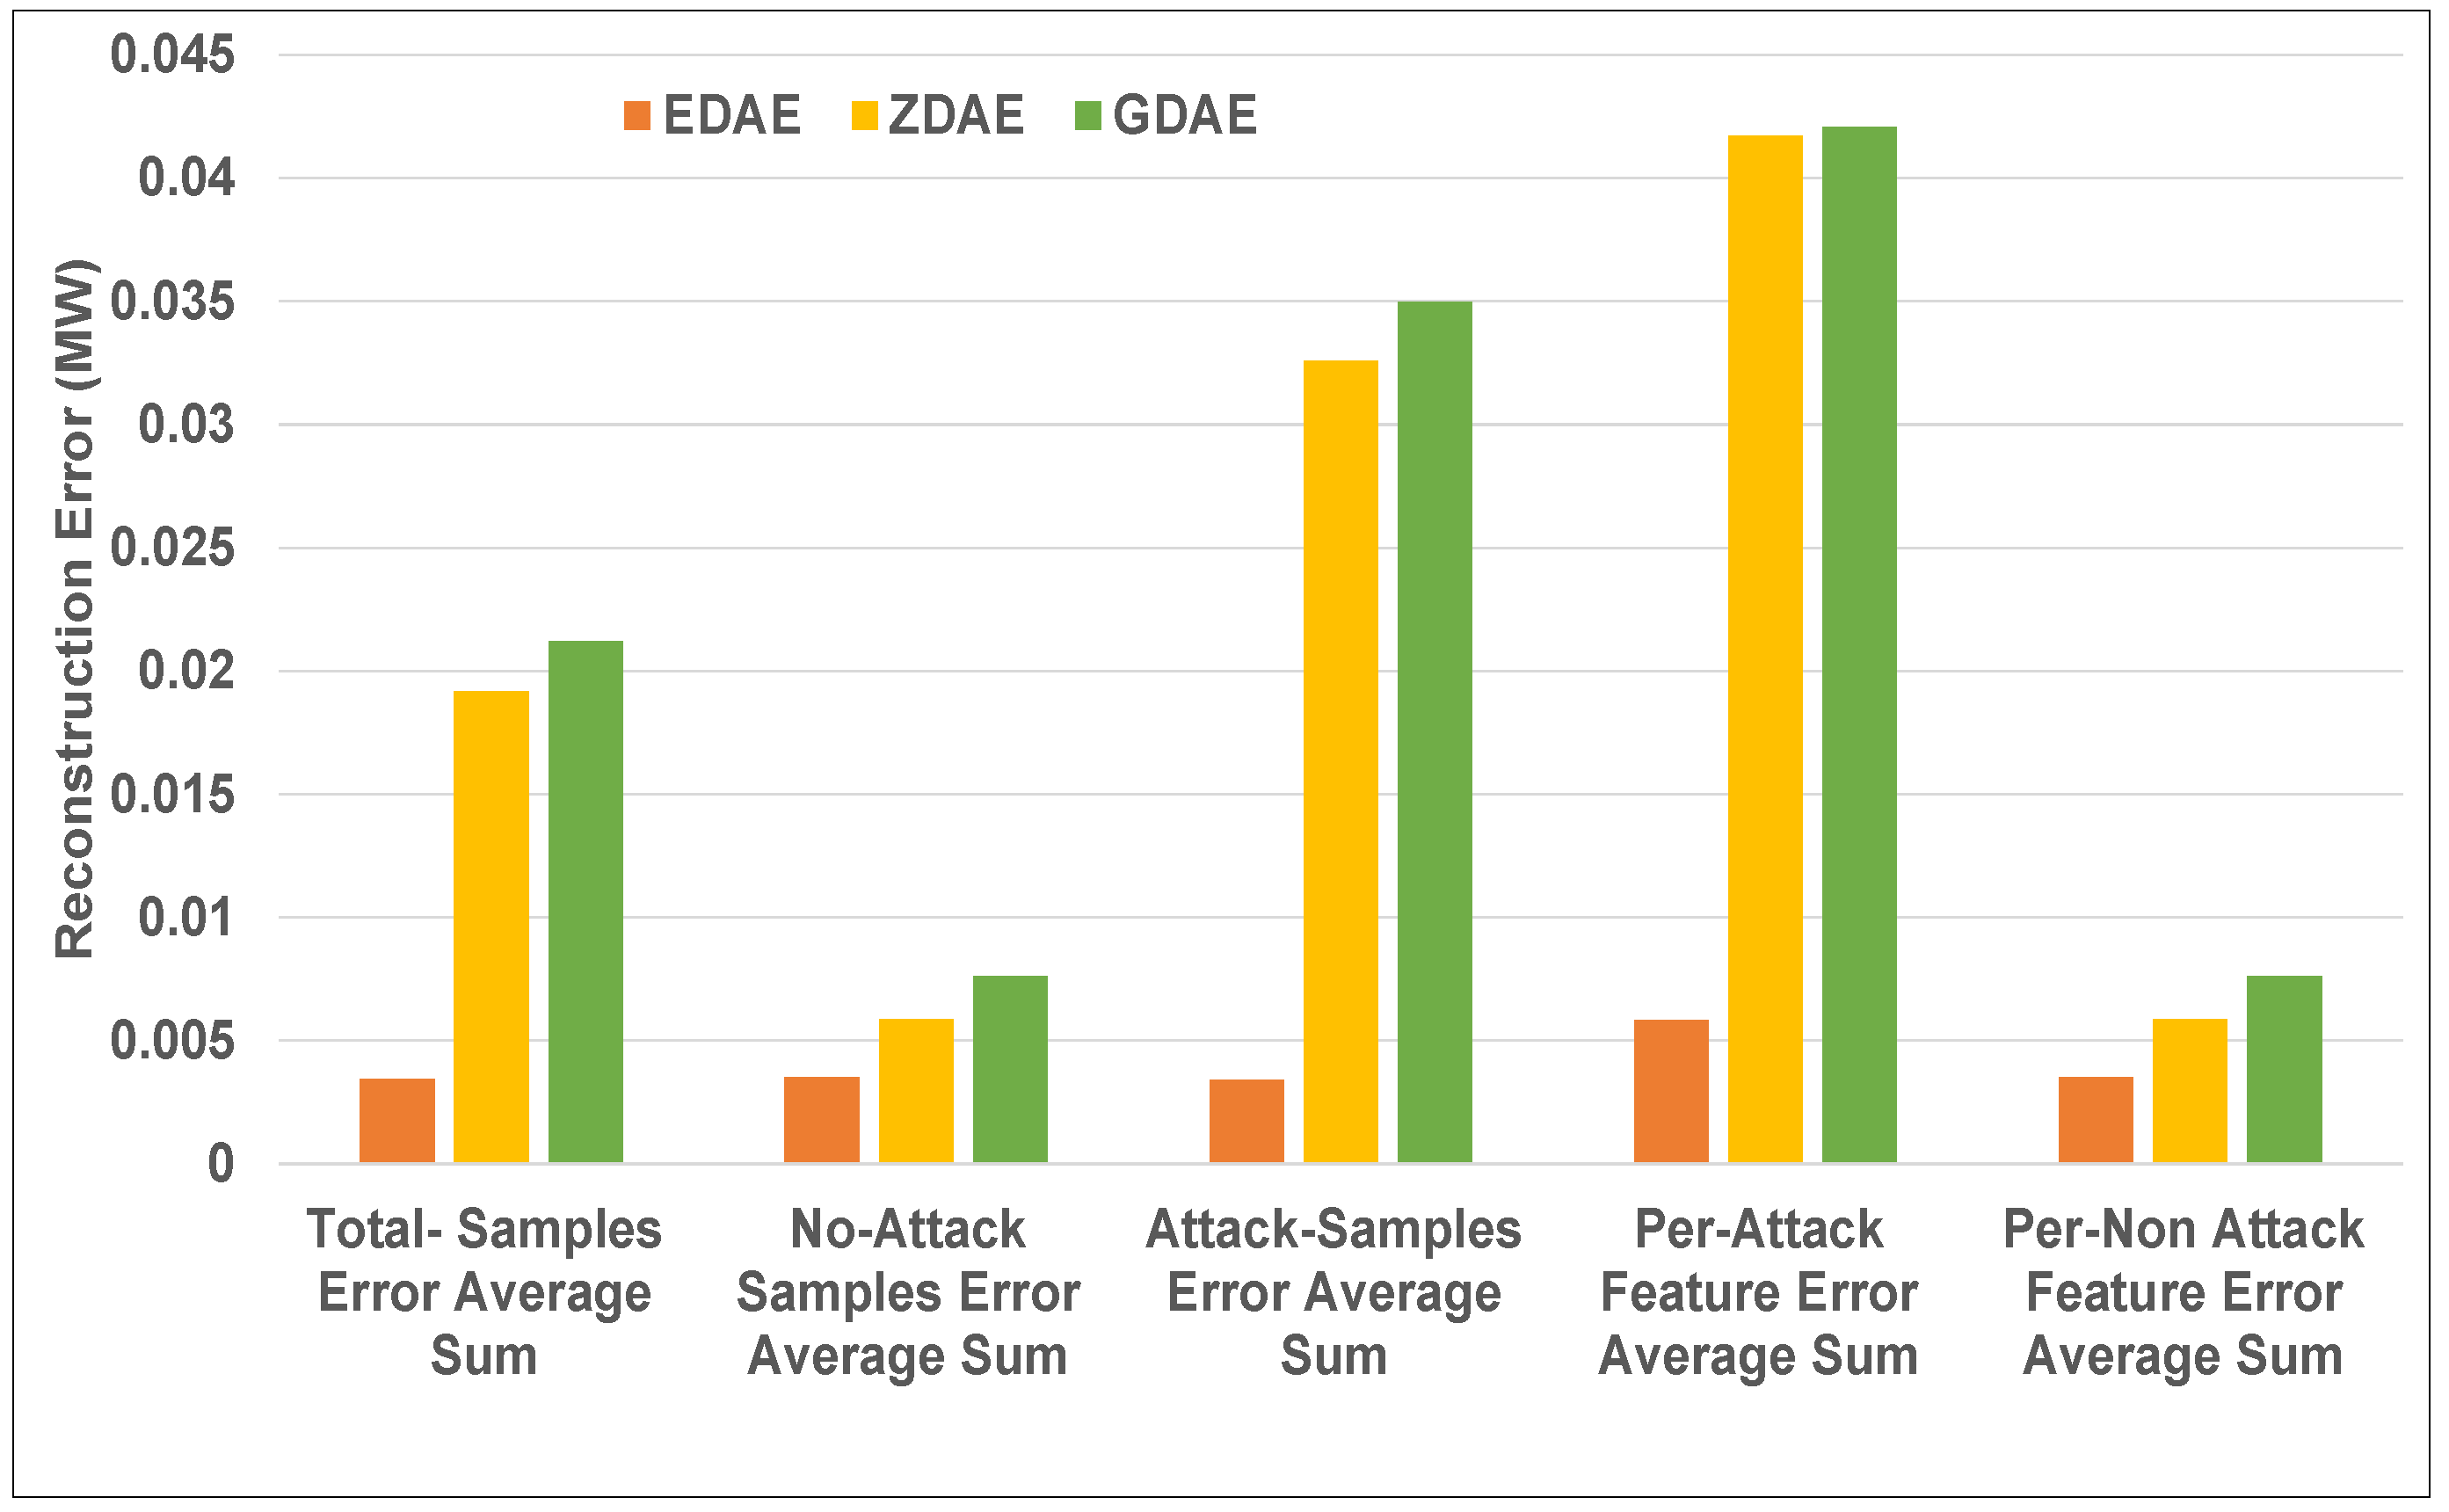
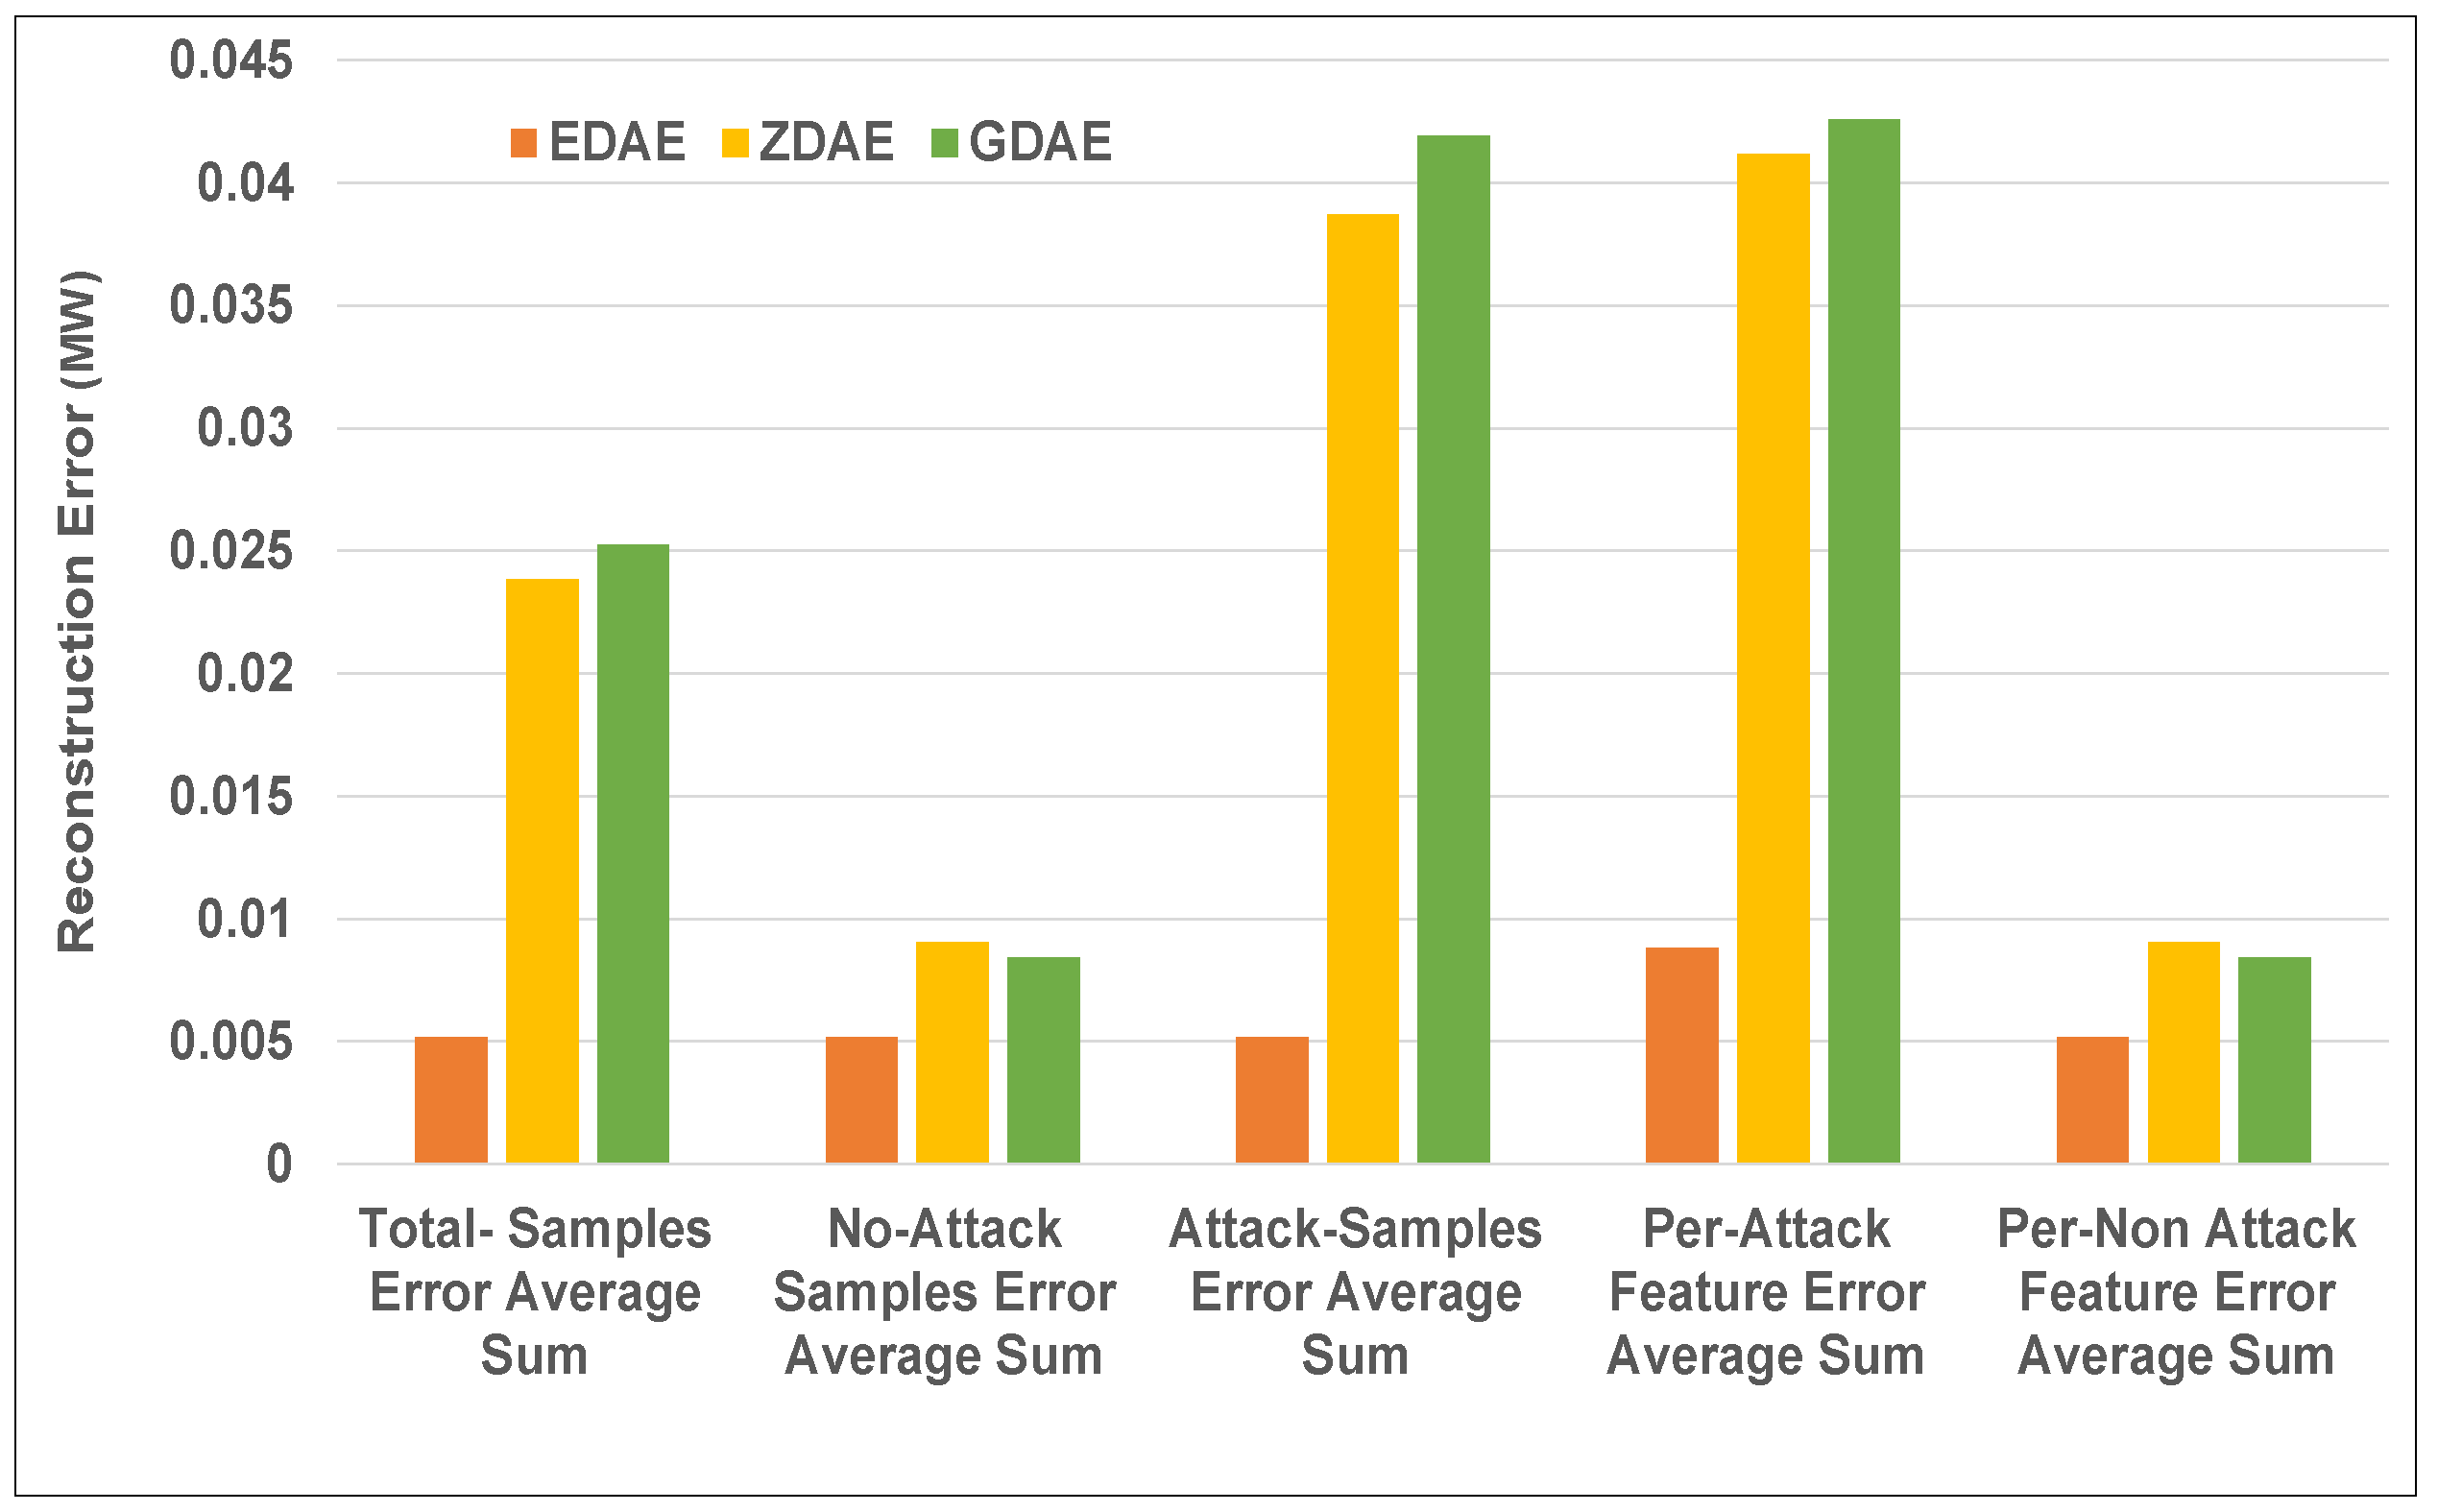
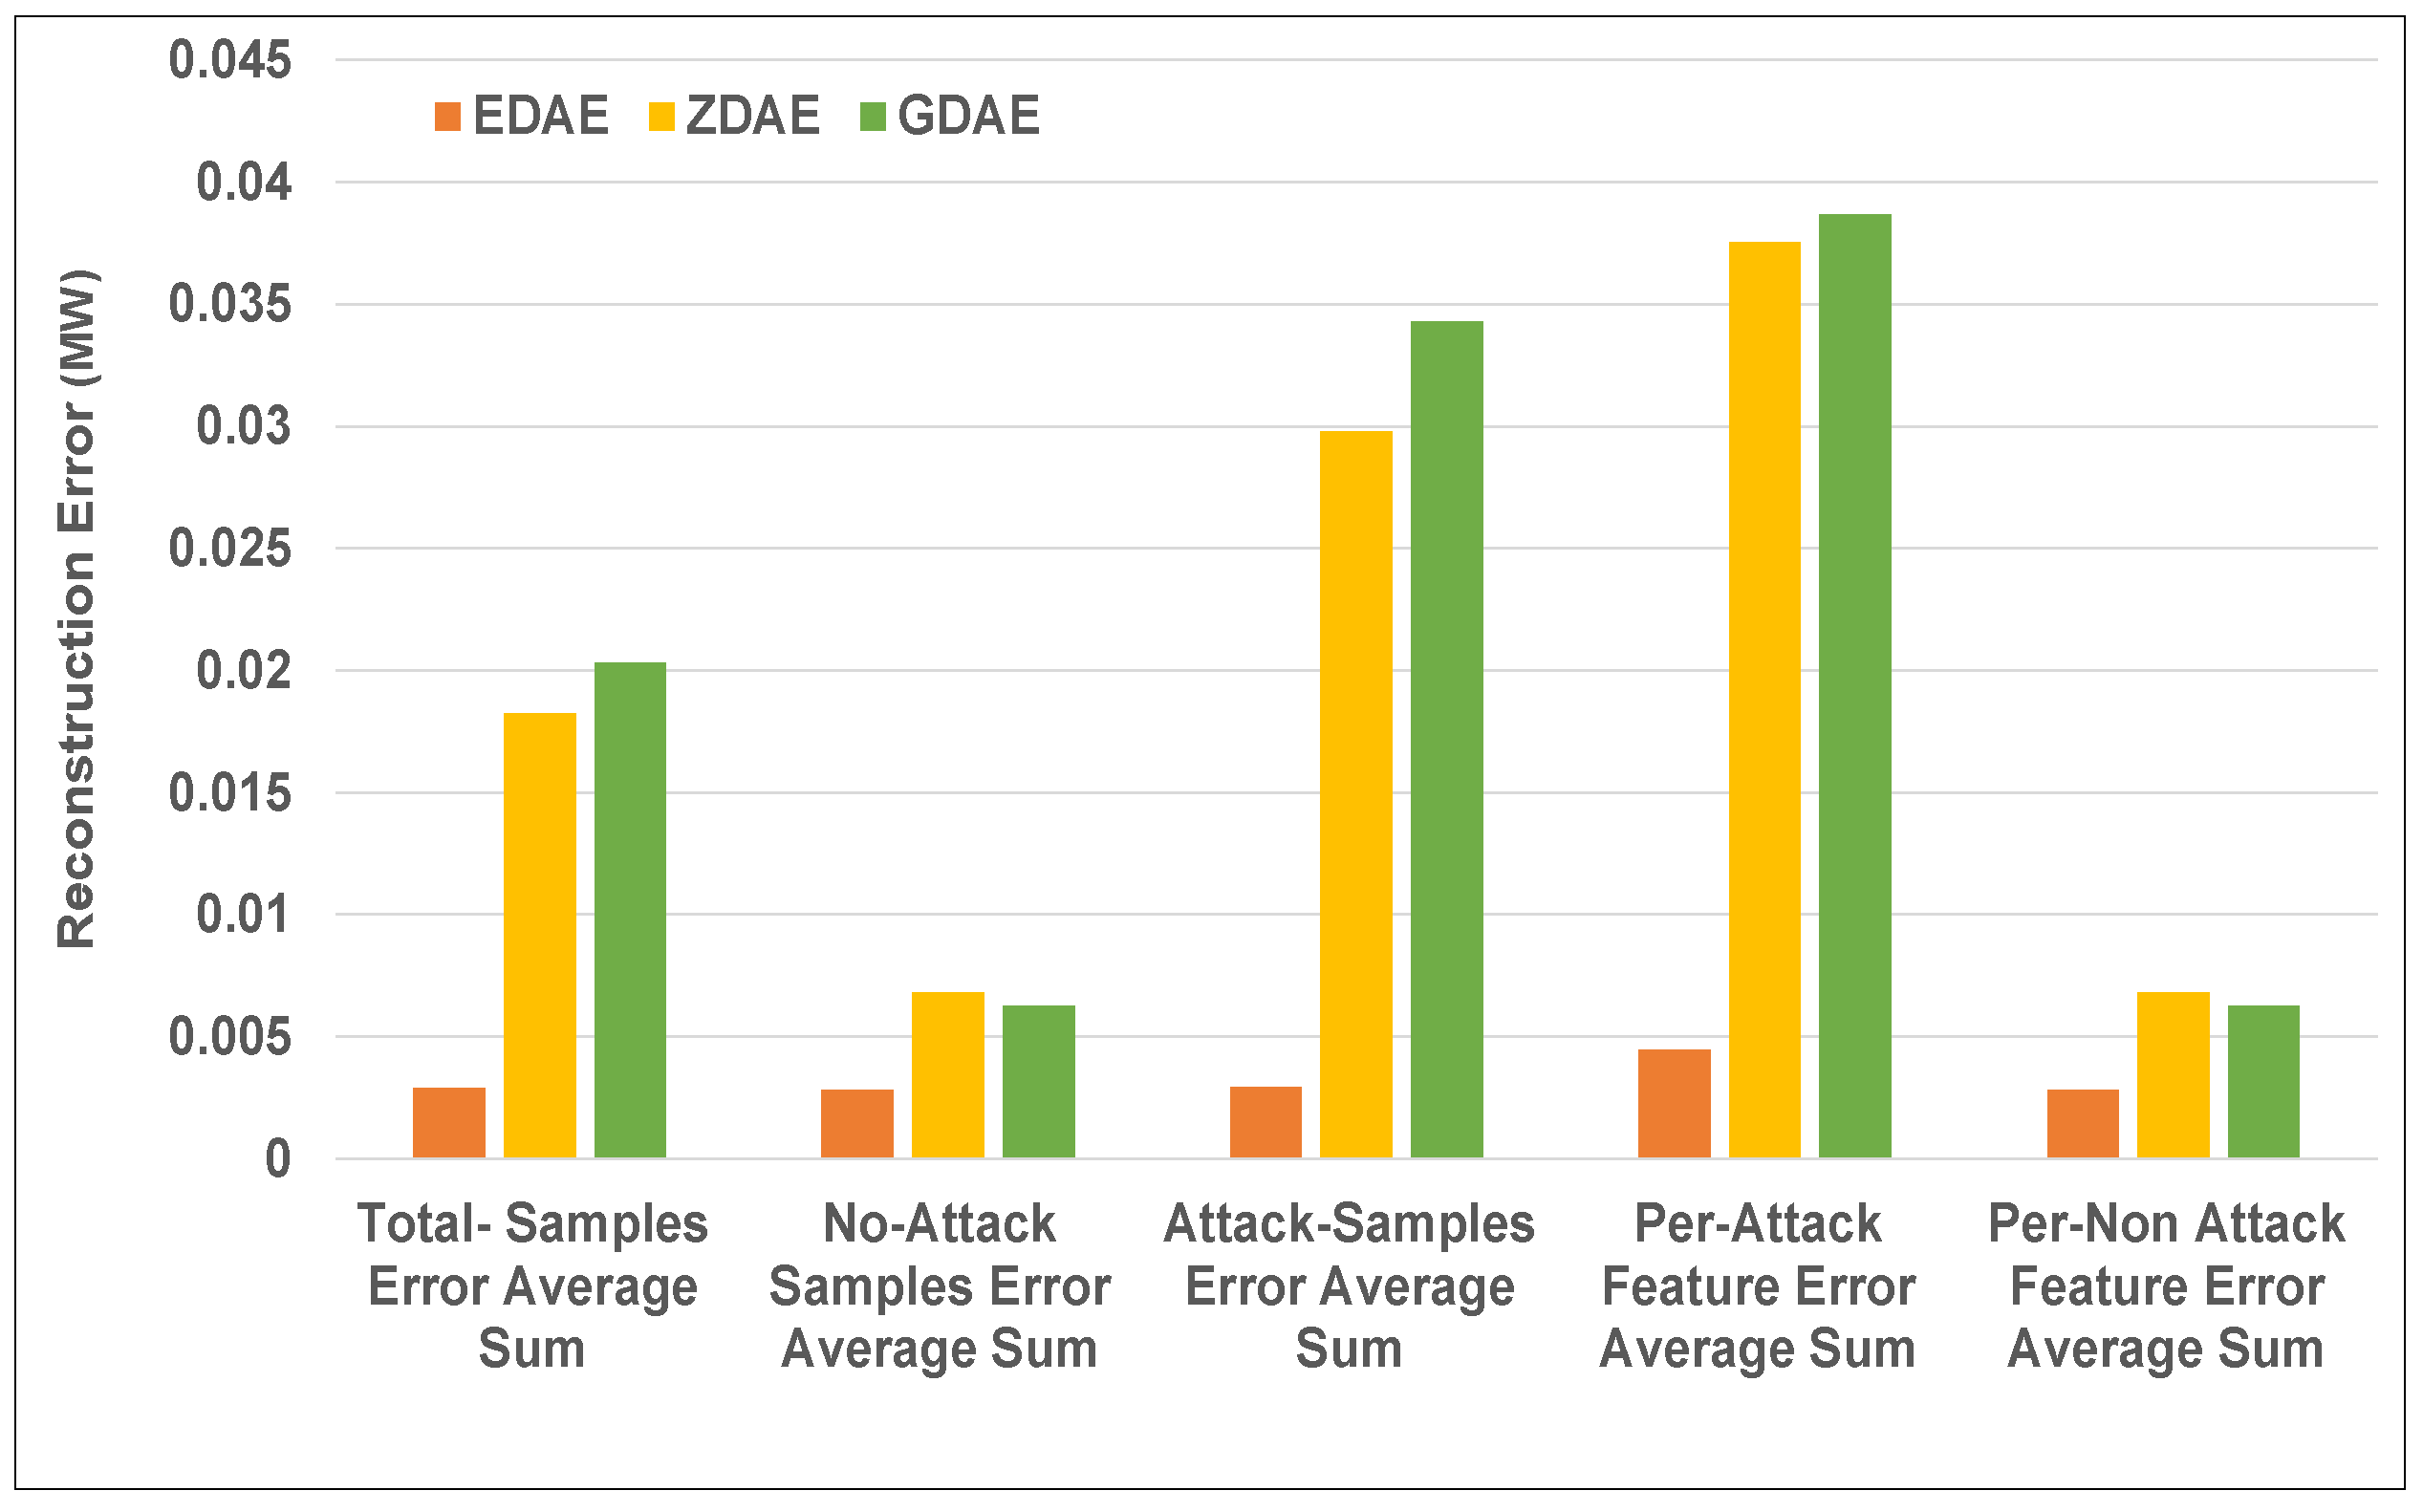
Figure 5.
Error average sum for various DAE schemes in a standard IEEE 14-bus system from a 40% fixed-attack dataset.
Figure 5.
Error average sum for various DAE schemes in a standard IEEE 14-bus system from a 40% fixed-attack dataset.
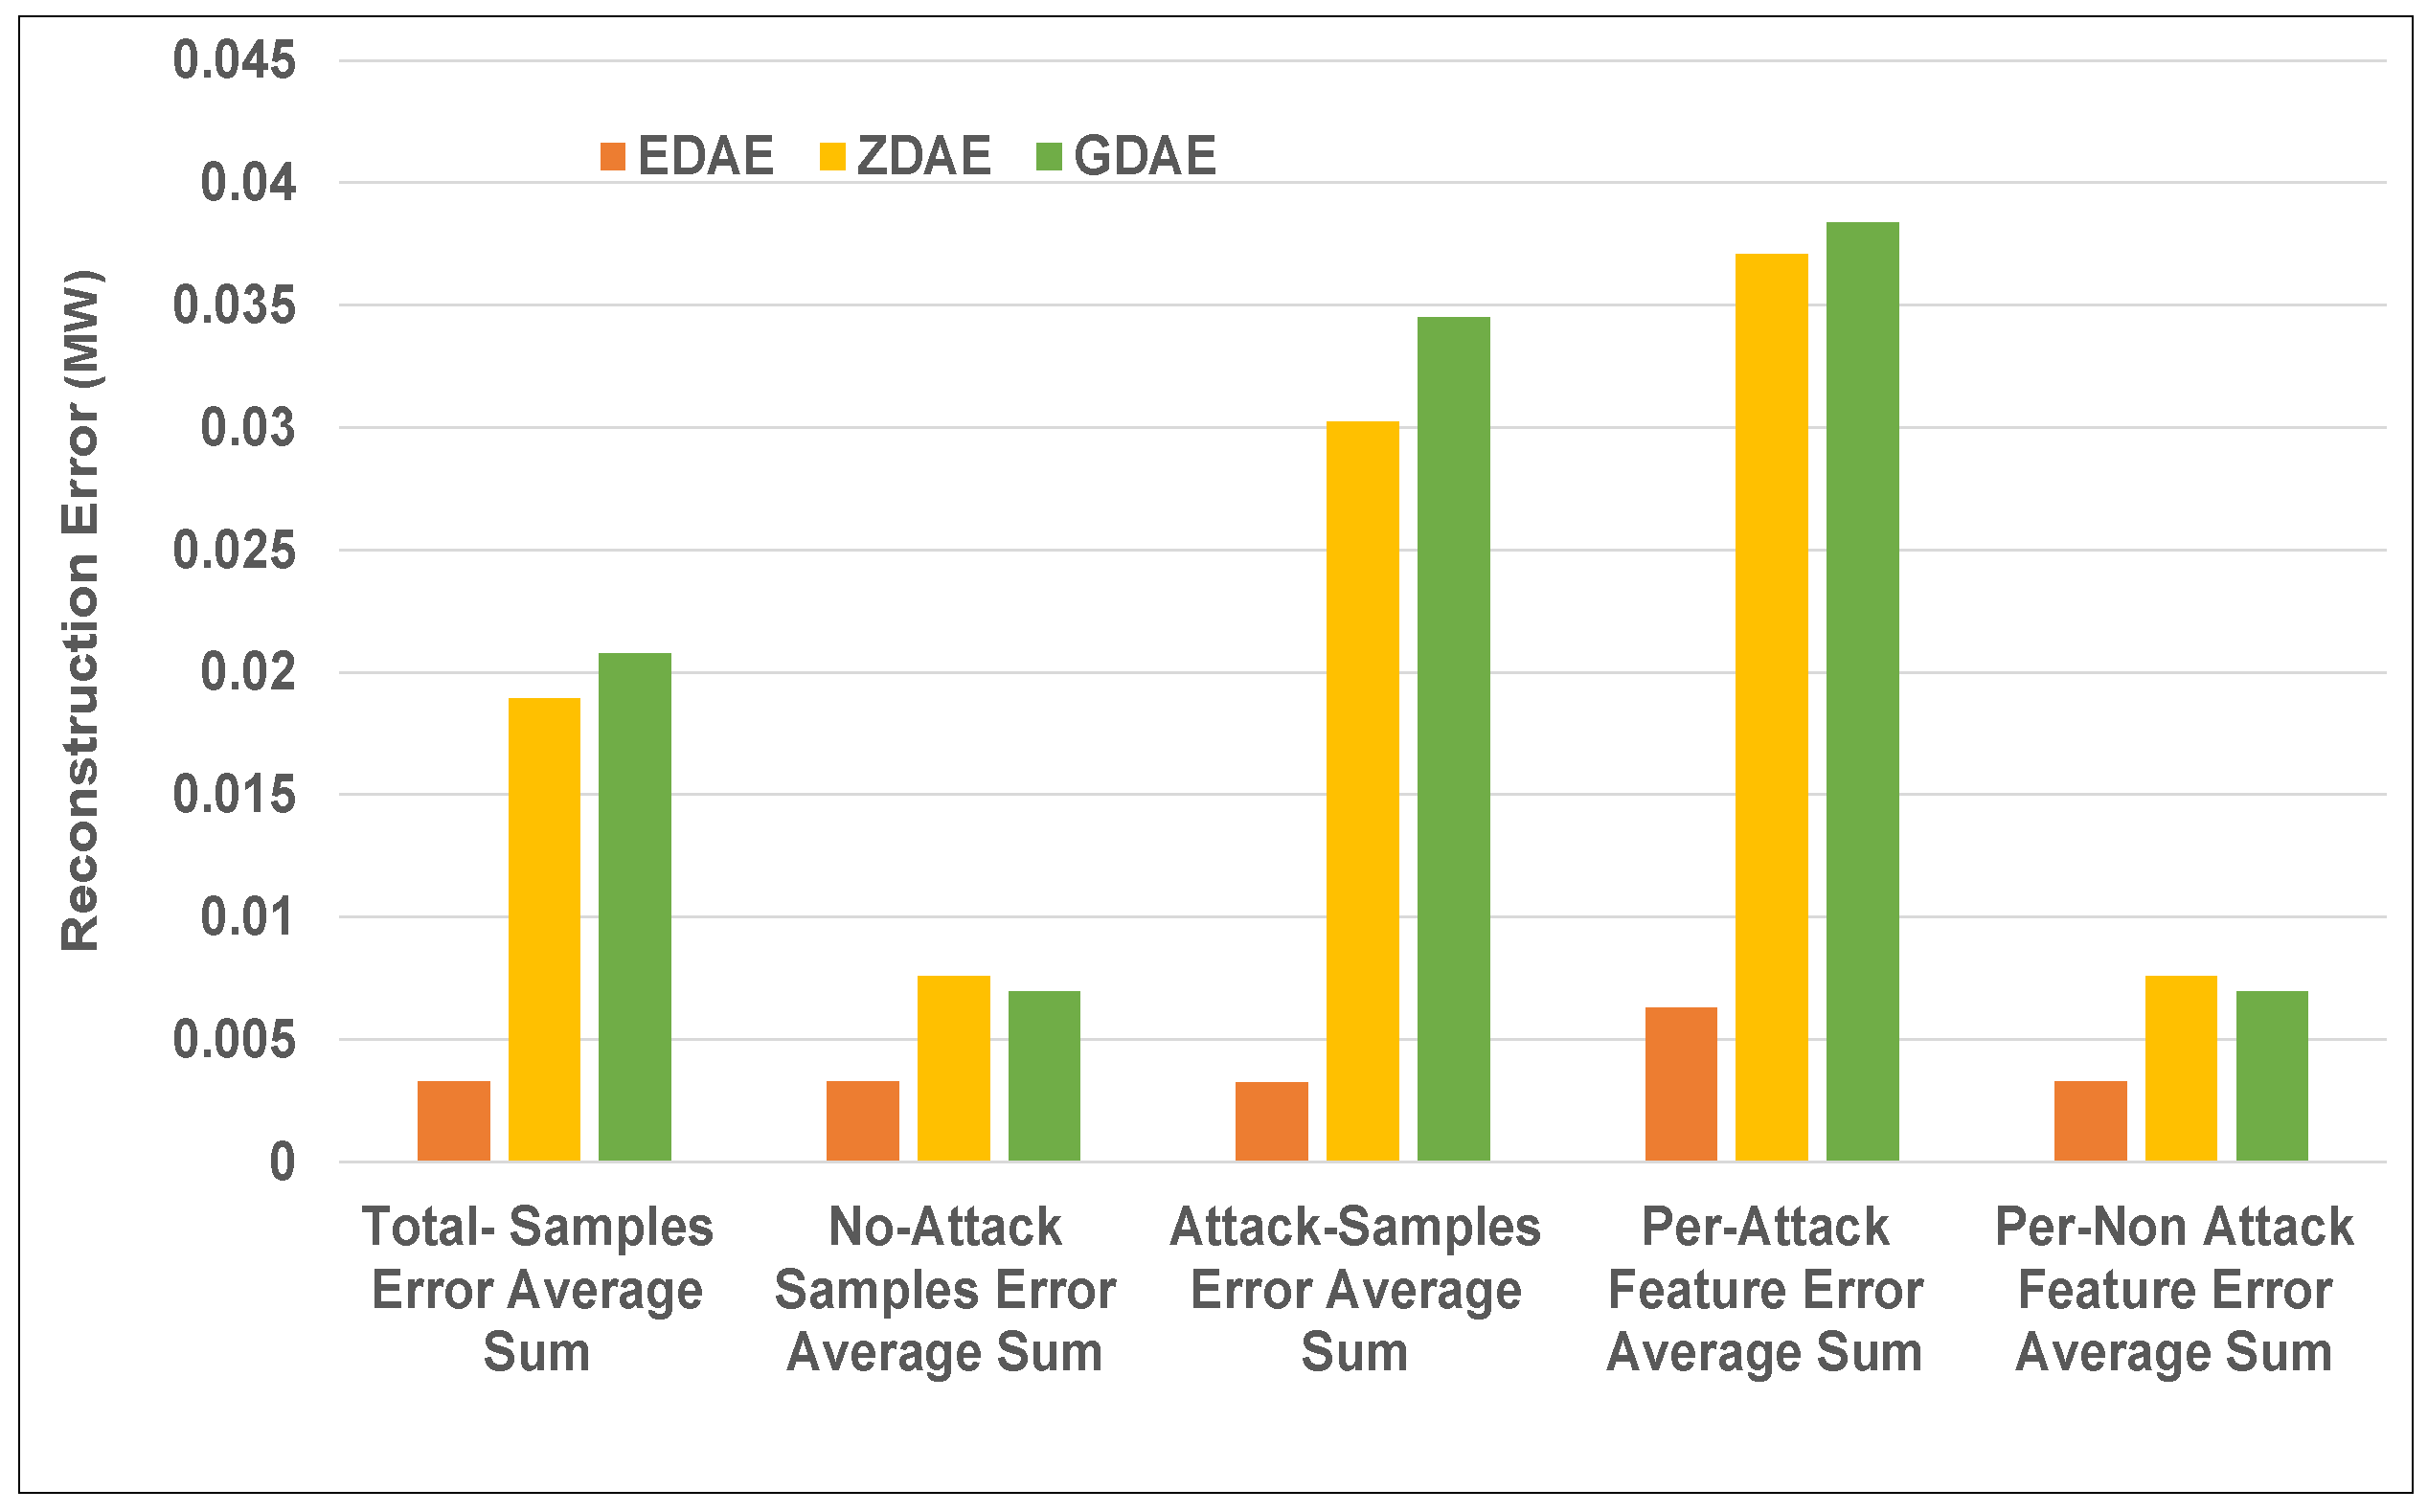
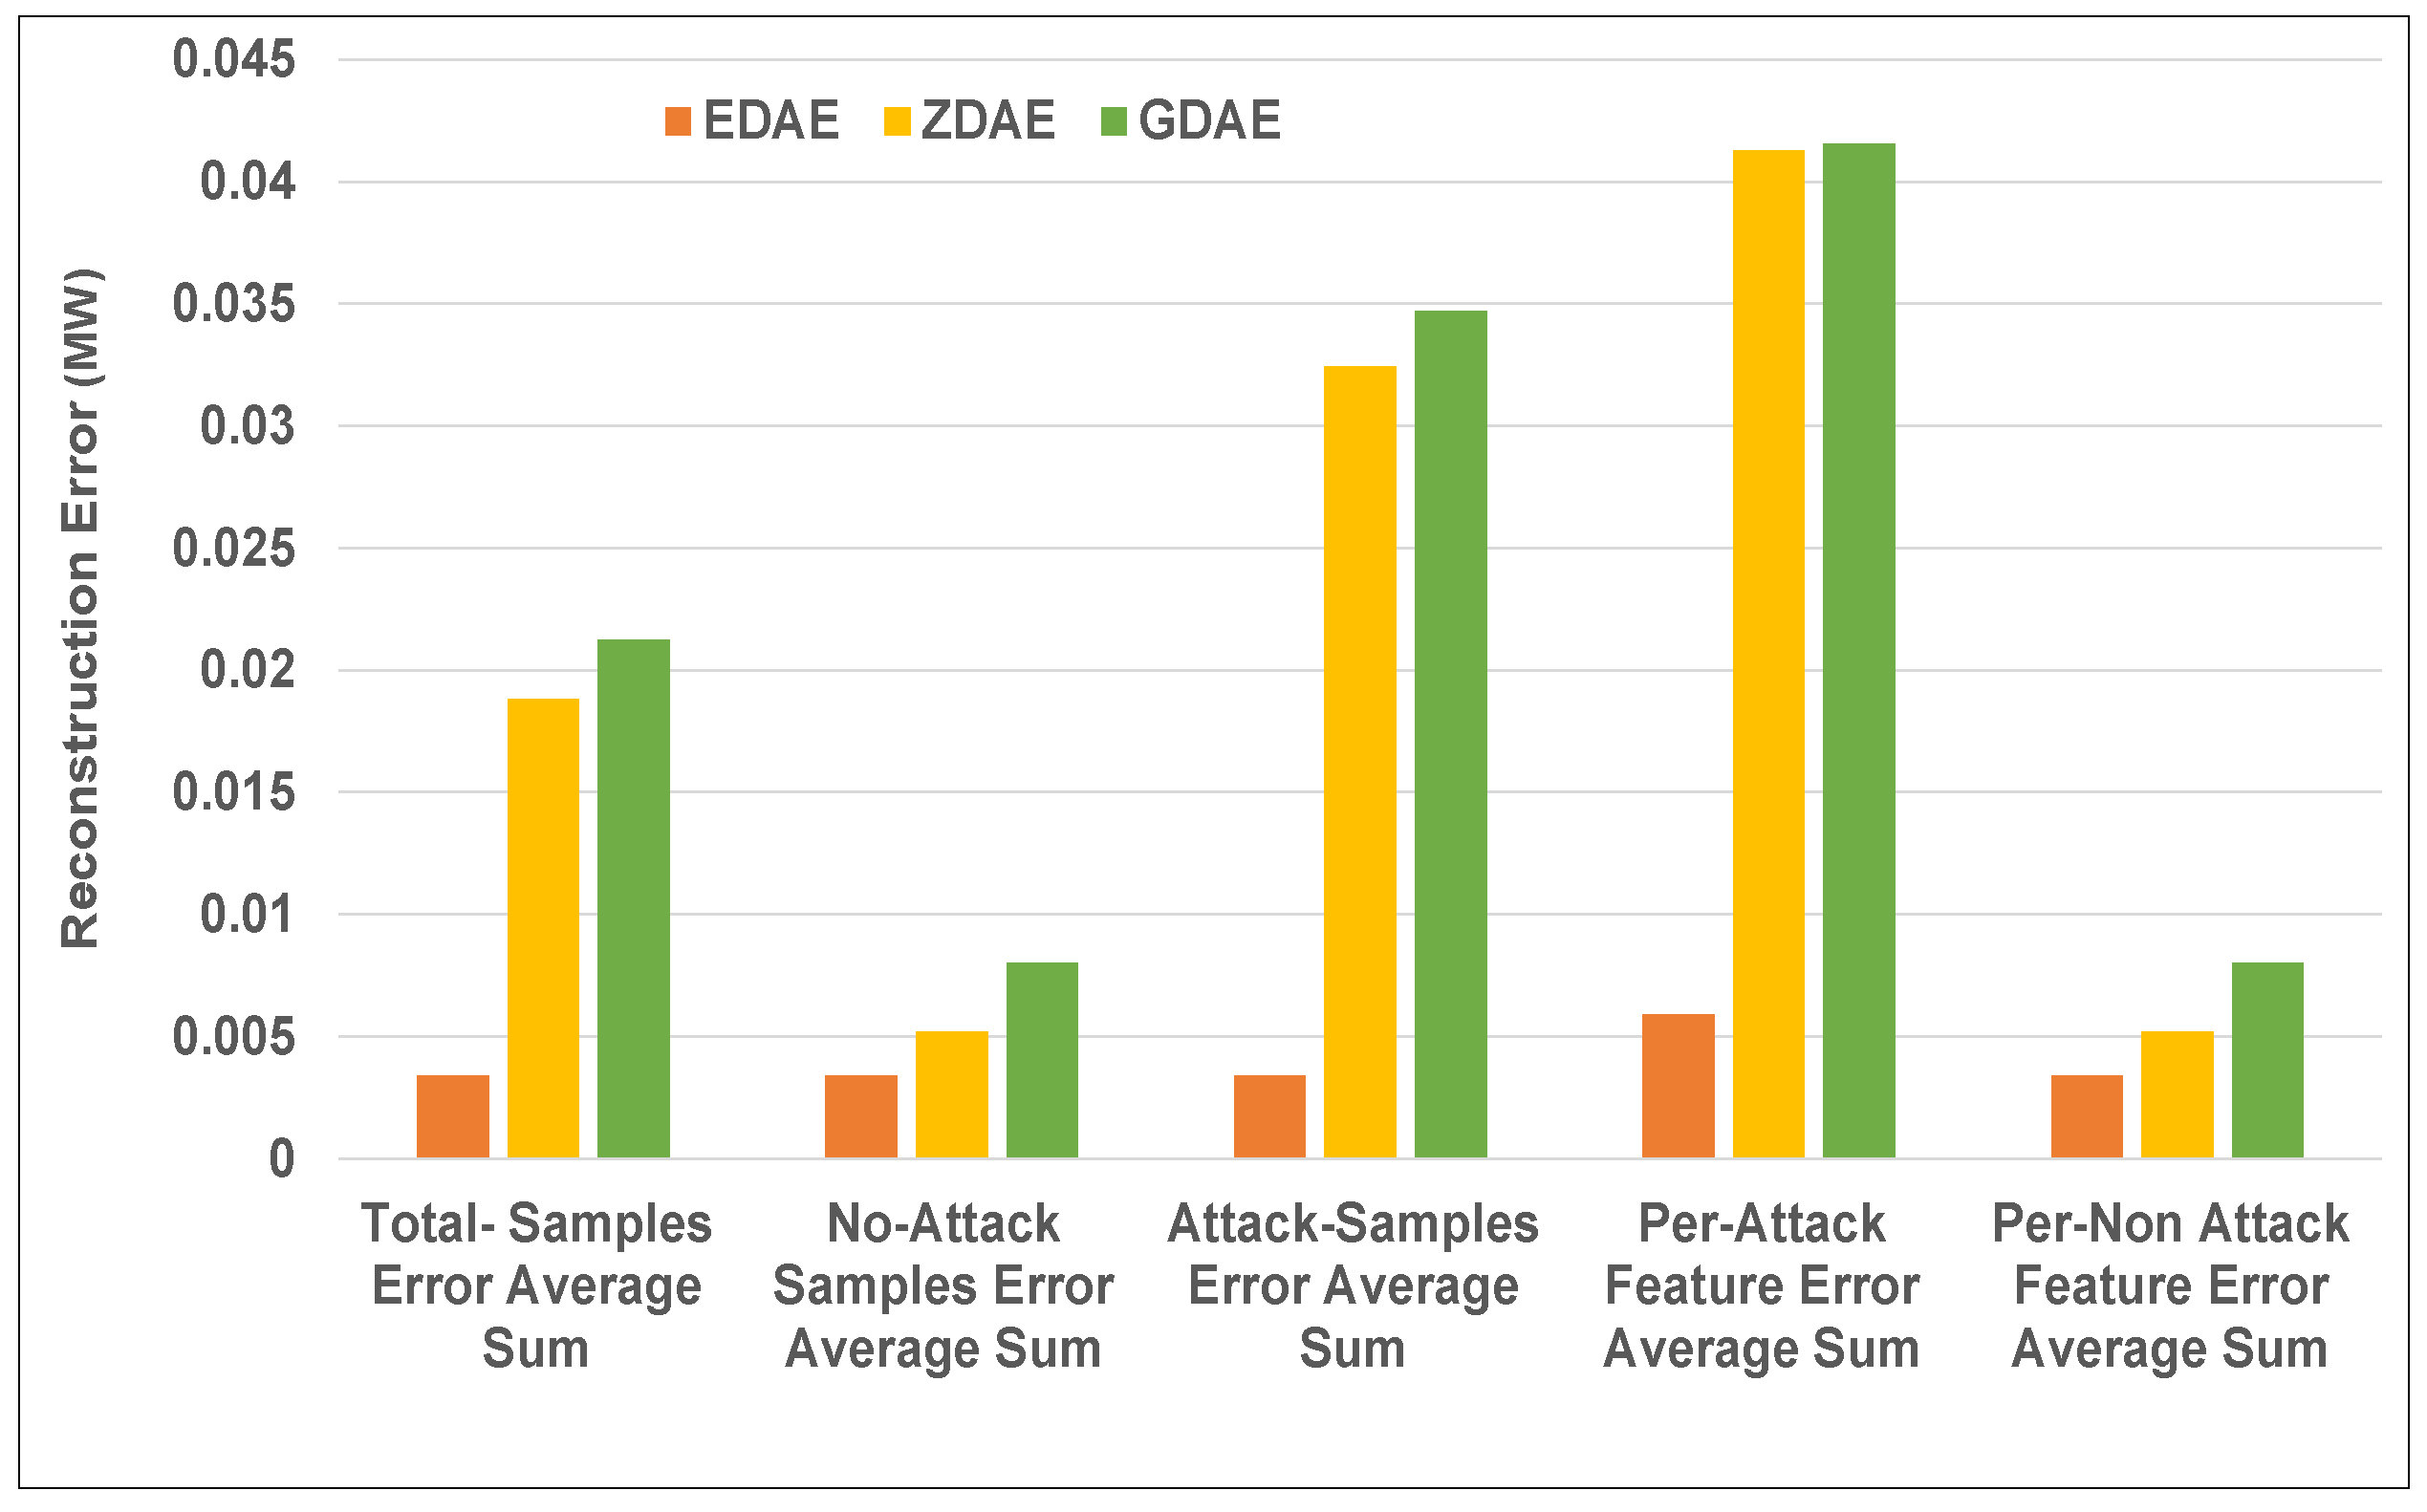
Figure 6.
Error average sum for various DAE schemes in a standard IEEE 39-bus system from a 20% fixed-attack dataset.
Figure 6.
Error average sum for various DAE schemes in a standard IEEE 39-bus system from a 20% fixed-attack dataset.
Figure 7.
Error average sum for various DAE schemes in a standard IEEE 39-bus system from a 40% fixed-attack dataset.
Figure 7.
Error average sum for various DAE schemes in a standard IEEE 39-bus system from a 40% fixed-attack dataset.
Figure 8.
Error average sum for various DAE schemes in a standard IEEE 14-bus system from a 20% random-attack dataset.
Figure 8.
Error average sum for various DAE schemes in a standard IEEE 14-bus system from a 20% random-attack dataset.
Figure 9.
Error average sum for various DAE schemes in a standard IEEE 14-bus system from a 40% random-attack dataset.
Figure 9.
Error average sum for various DAE schemes in a standard IEEE 14-bus system from a 40% random-attack dataset.
Figure 10.
Error average sum for various DAE schemes in a standard IEEE 39-bus system from a 20% random-attack dataset.
Figure 10.
Error average sum for various DAE schemes in a standard IEEE 39-bus system from a 20% random-attack dataset.
Figure 11.
Error average sum for various DAE schemes in a standard IEEE 39-bus system from a 40% random-attack dataset.
Figure 11.
Error average sum for various DAE schemes in a standard IEEE 39-bus system from a 40% random-attack dataset.
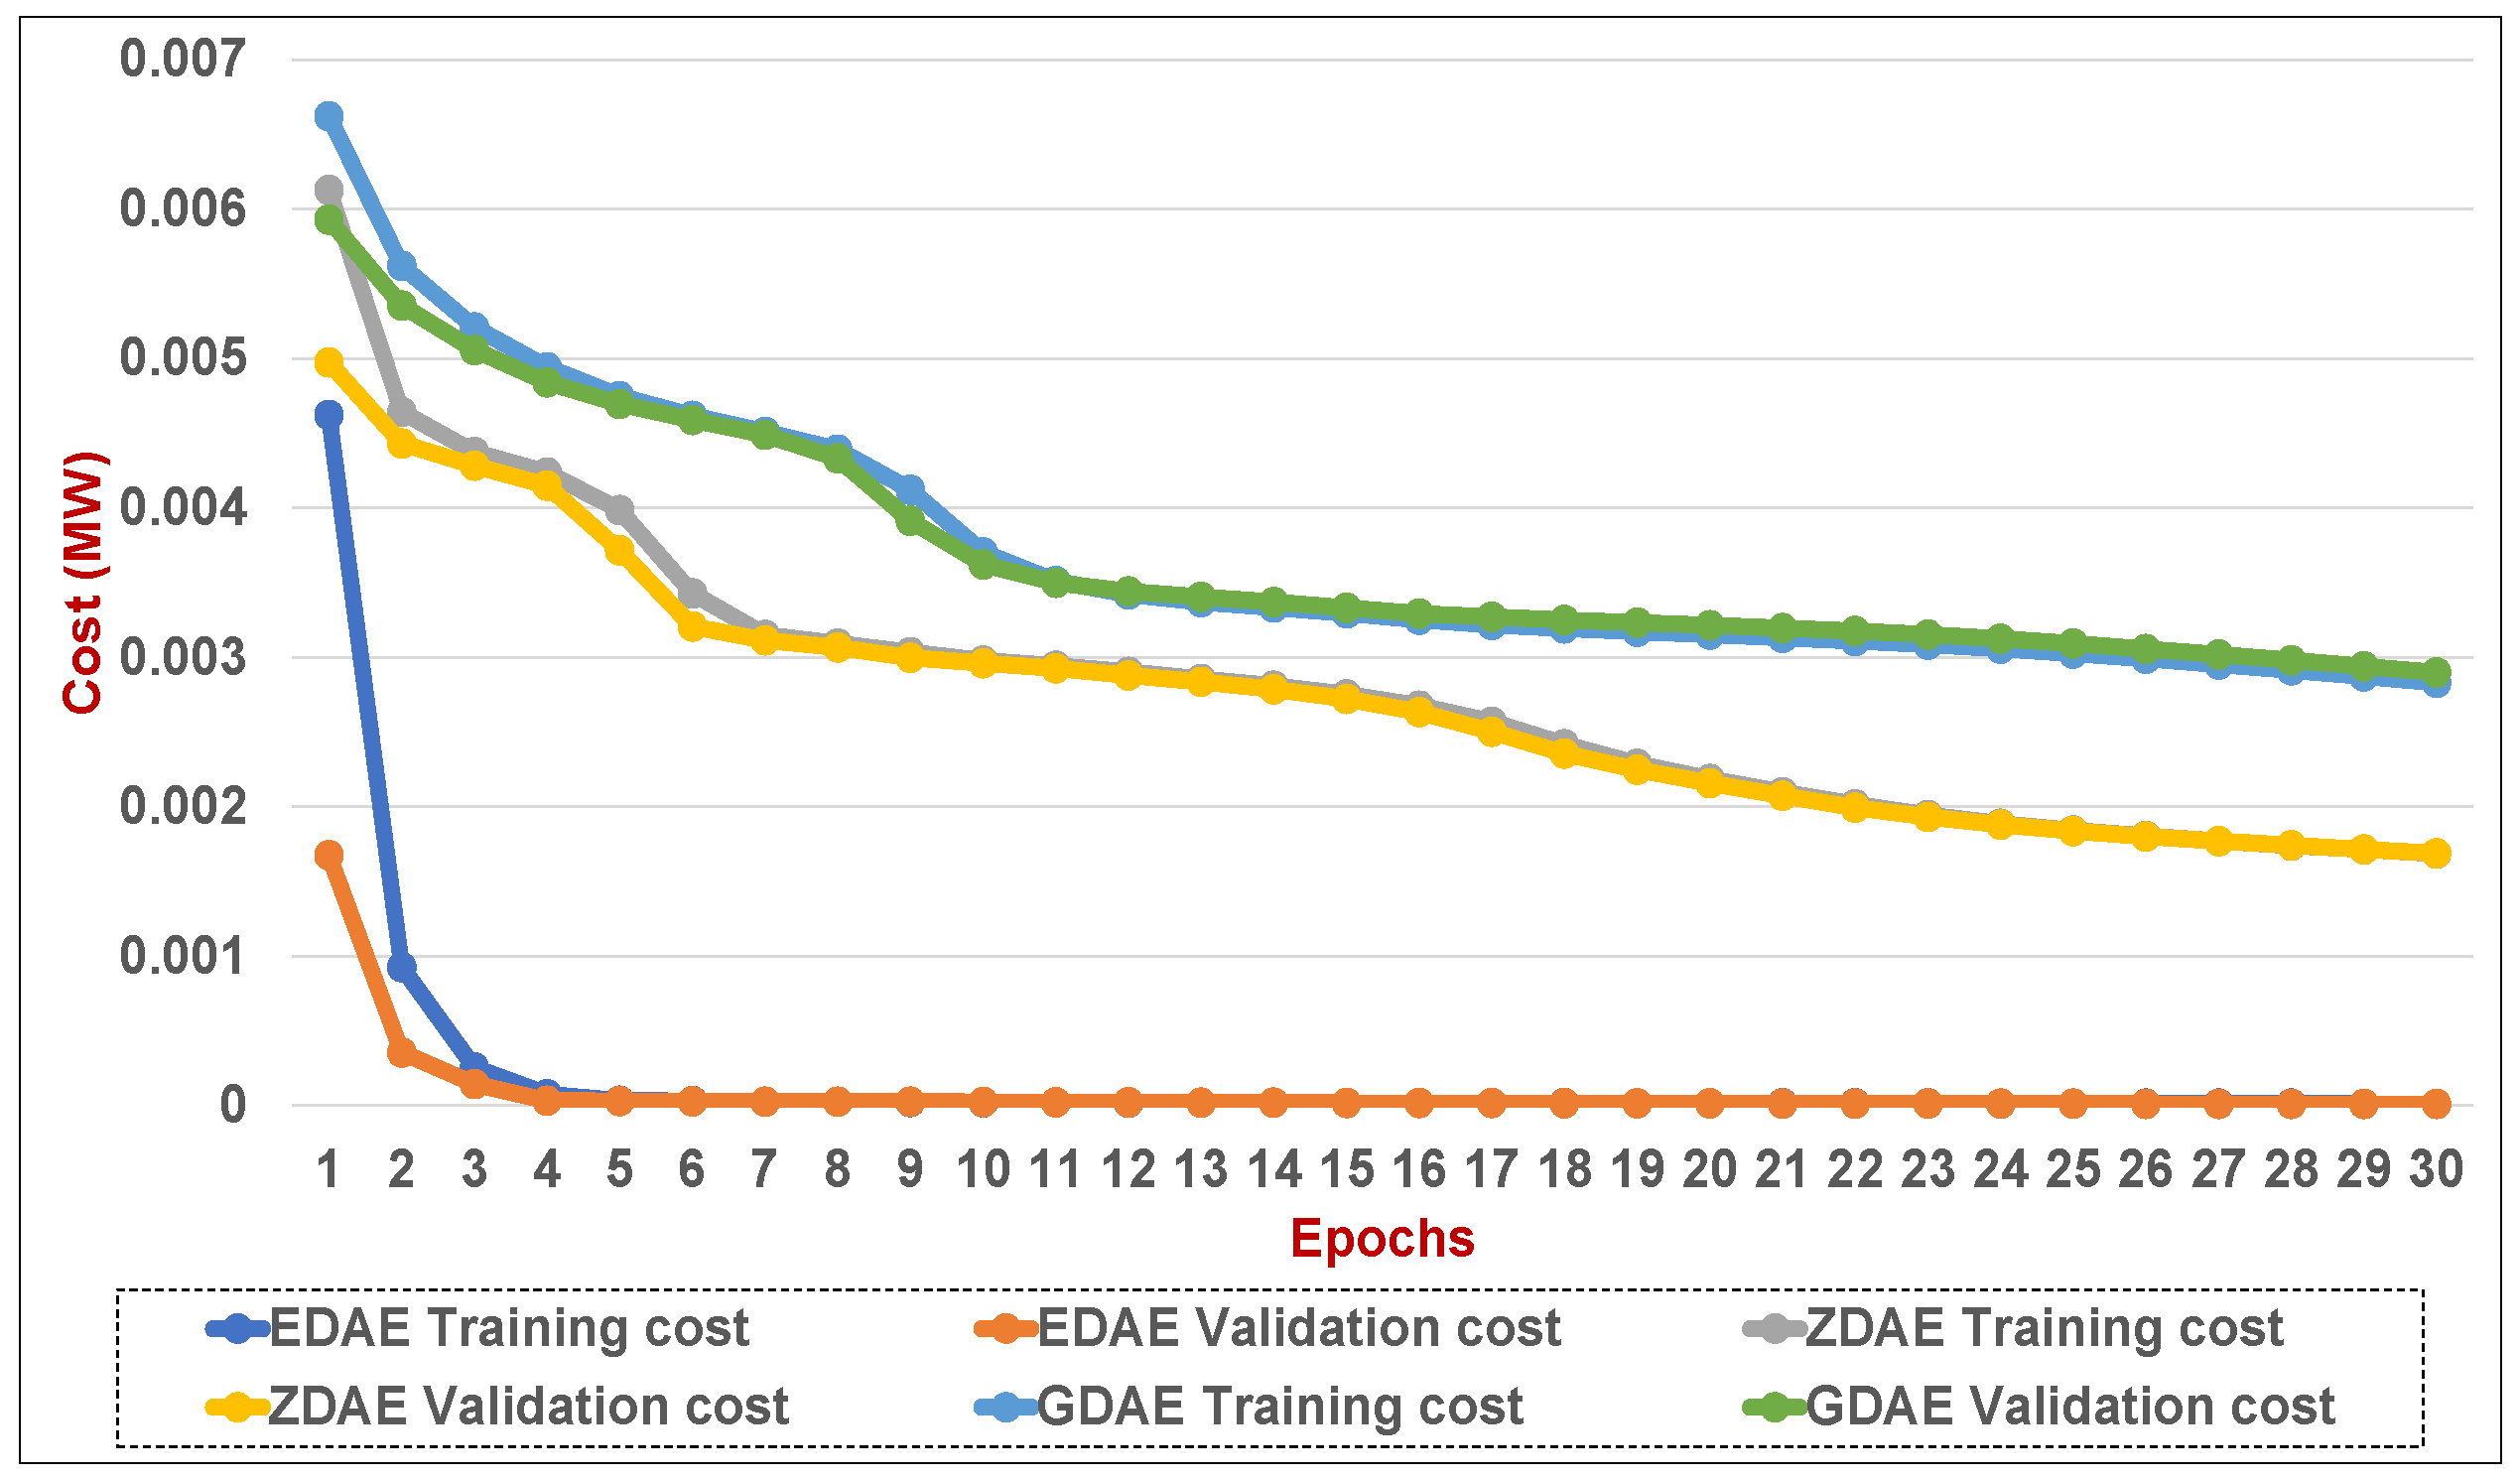
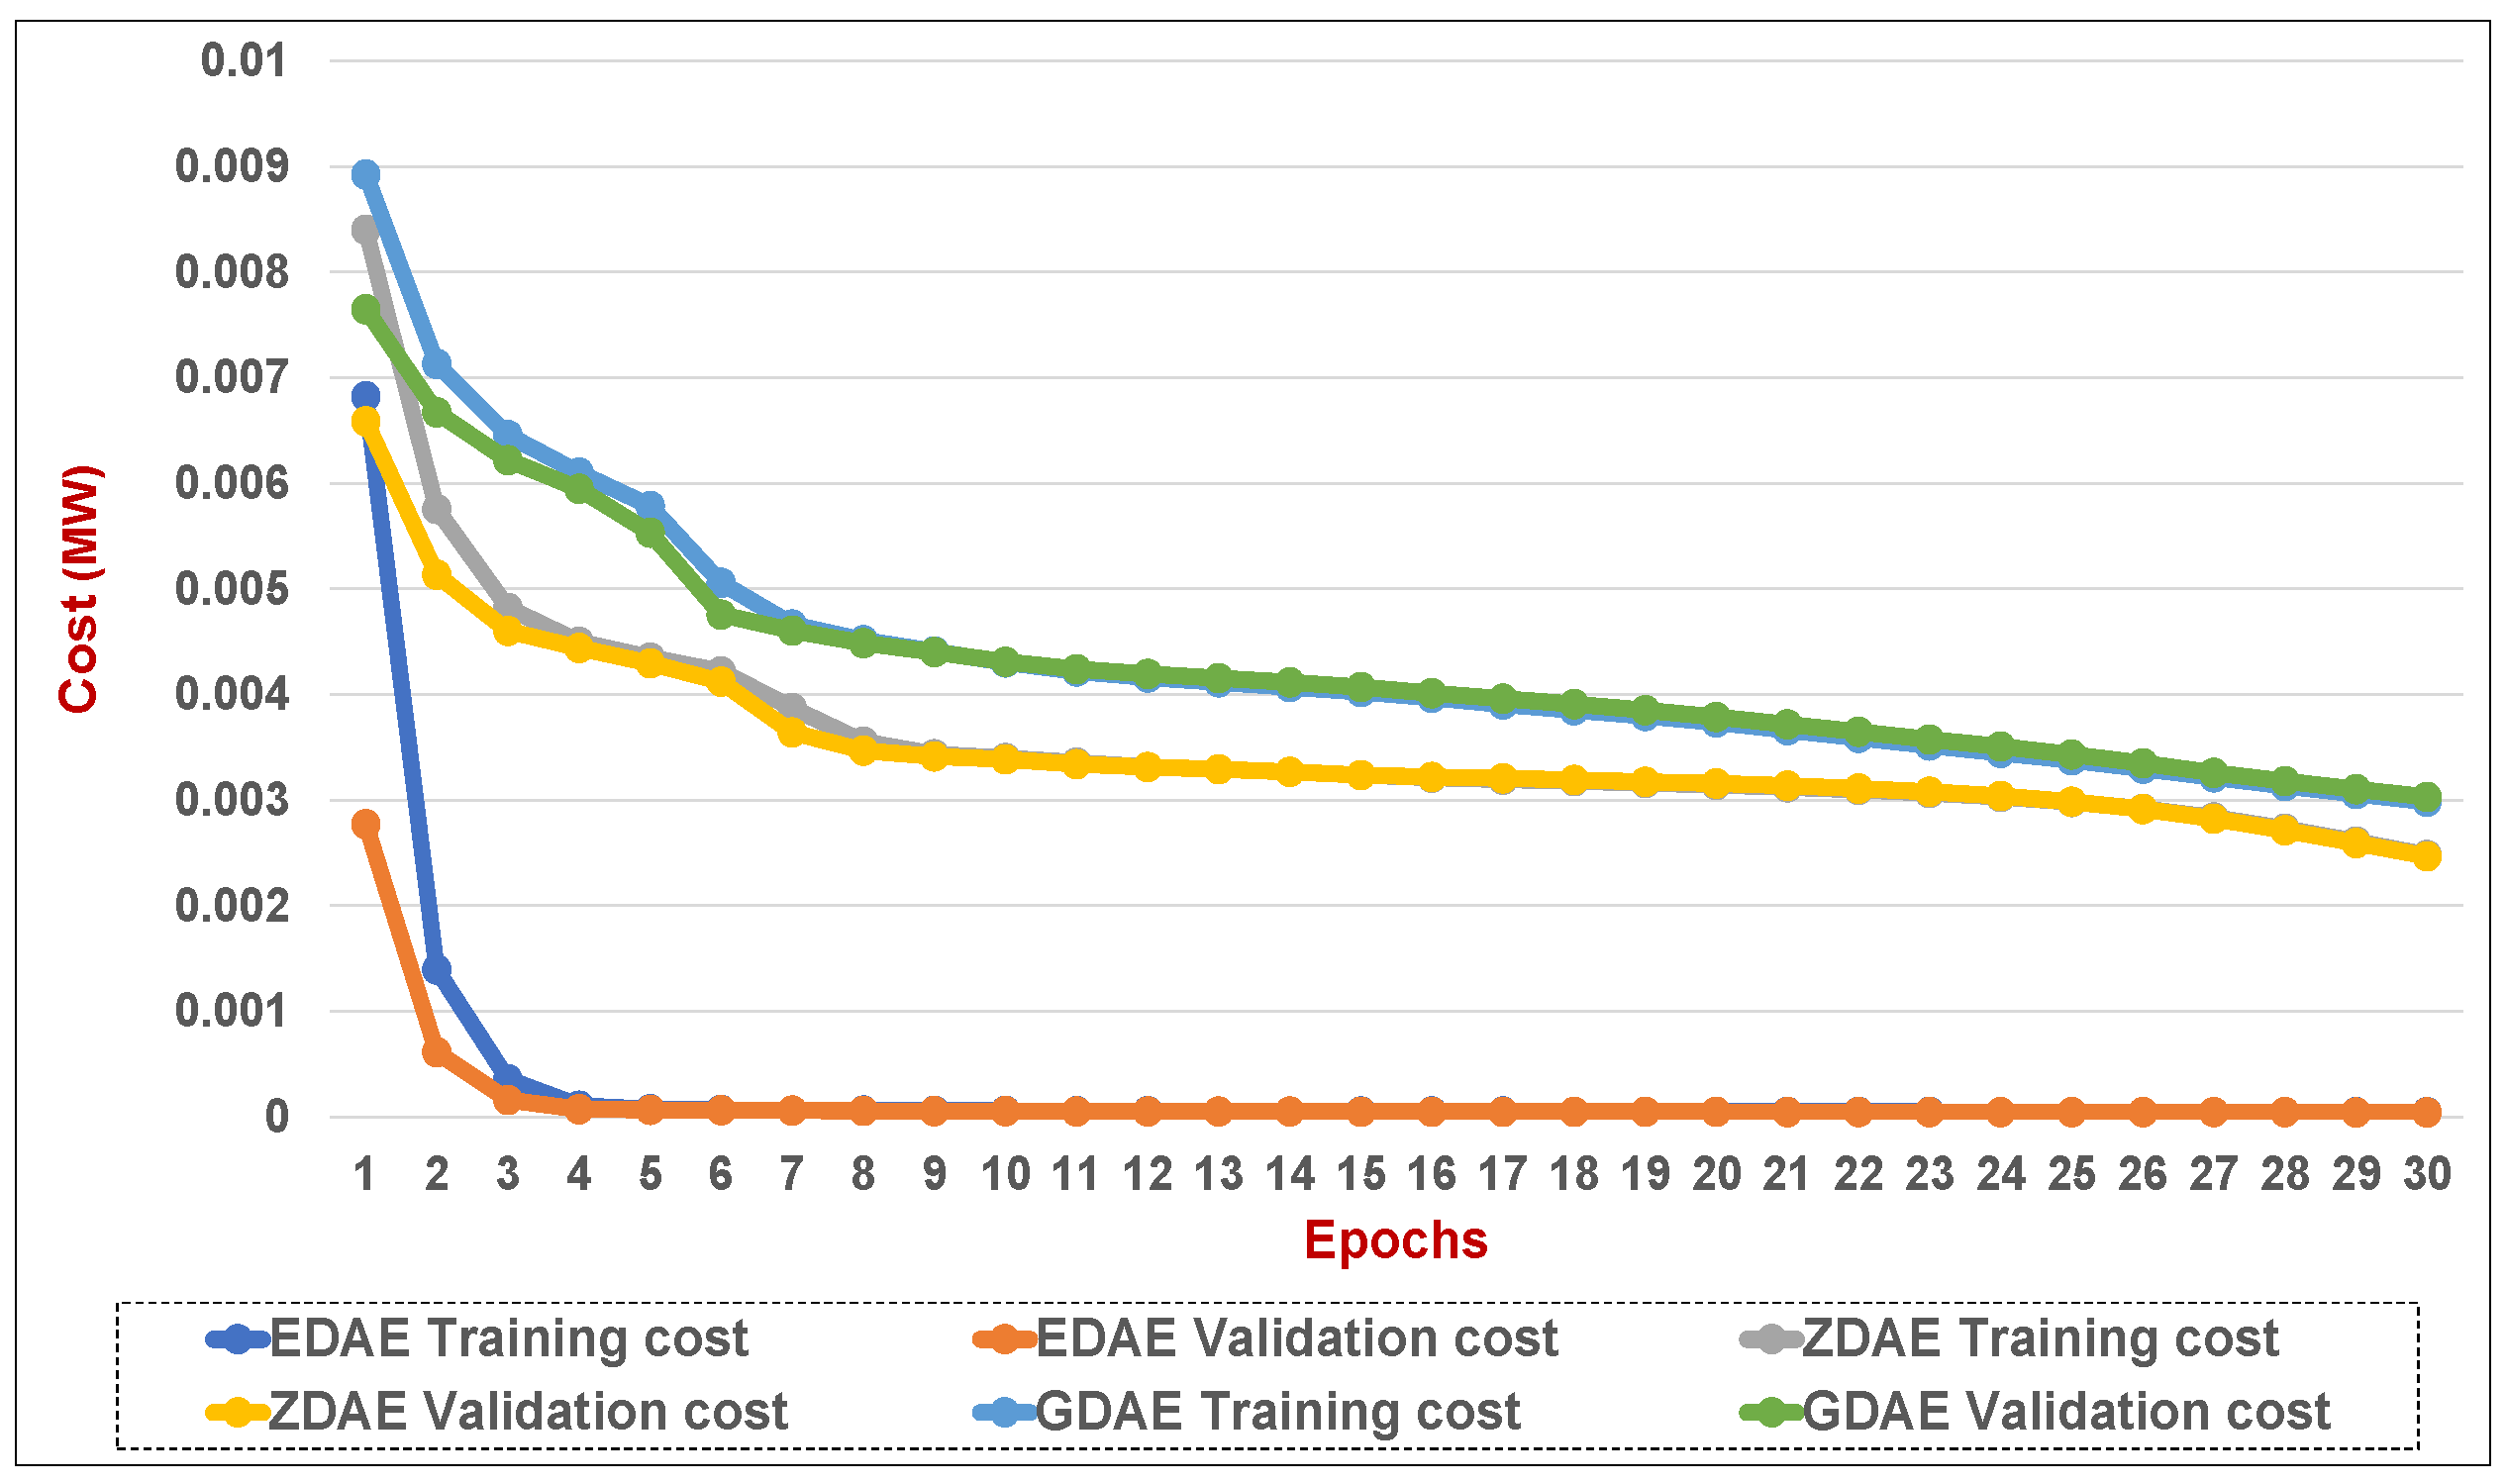
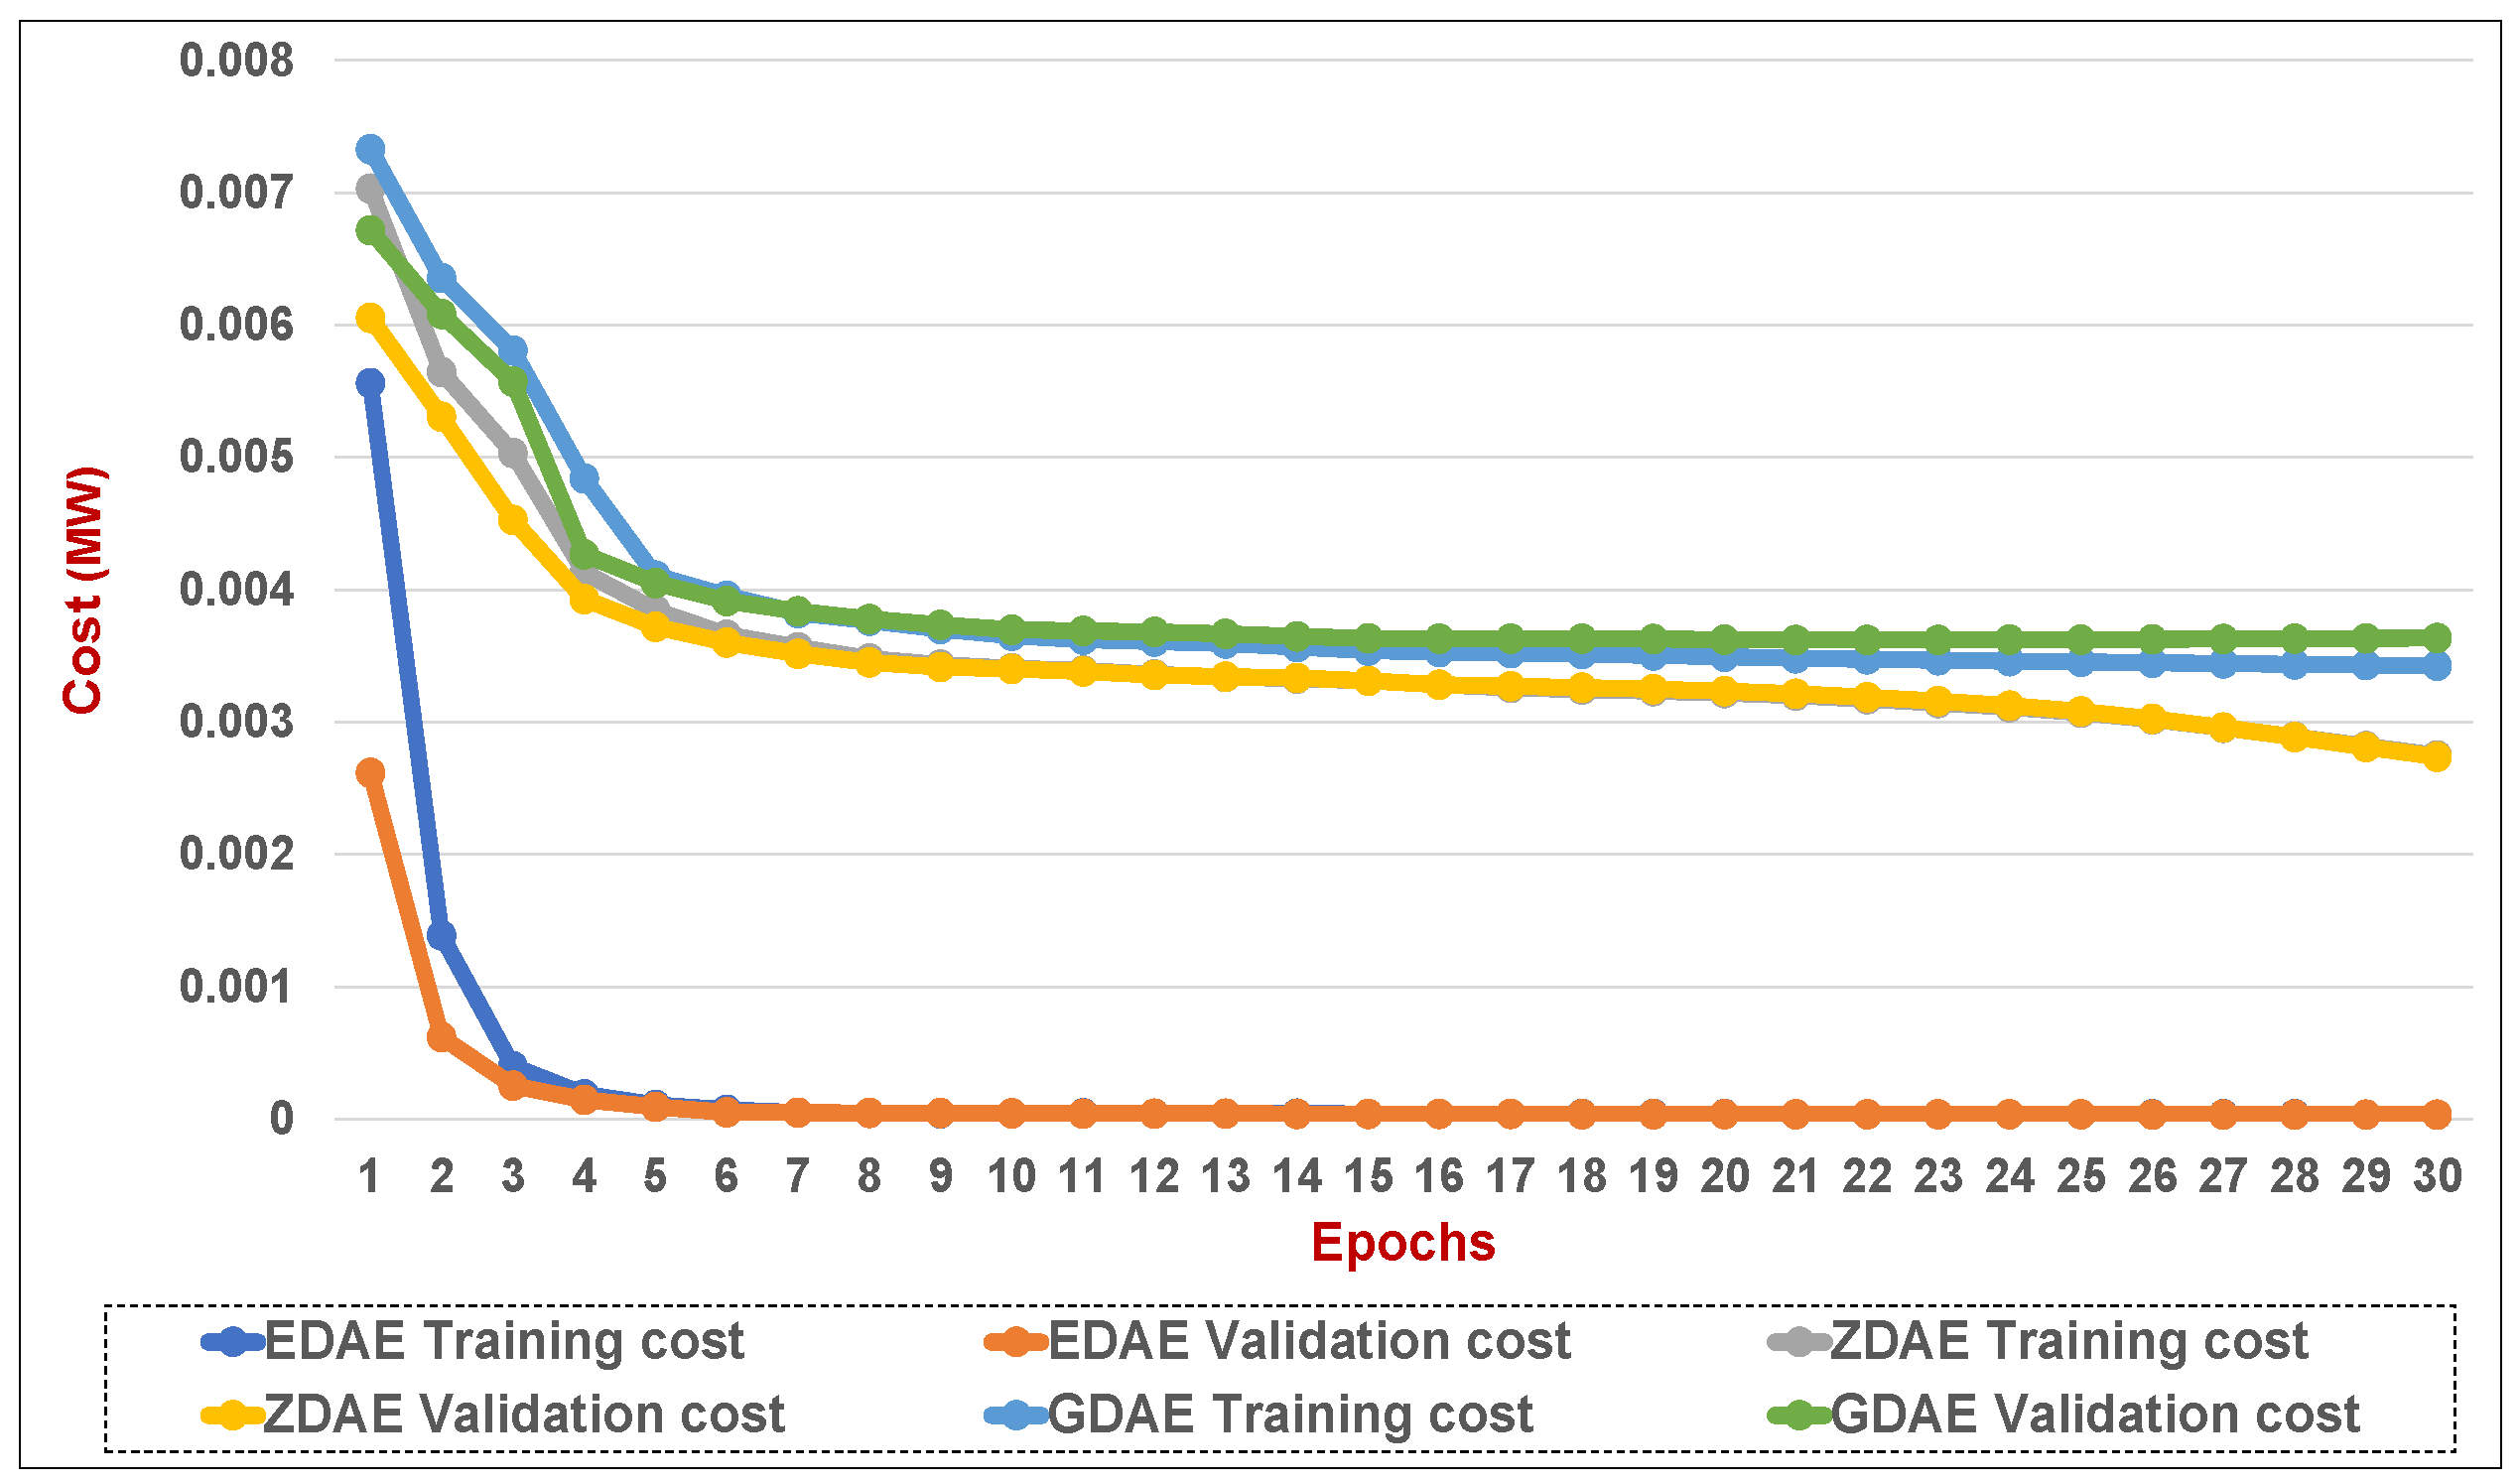
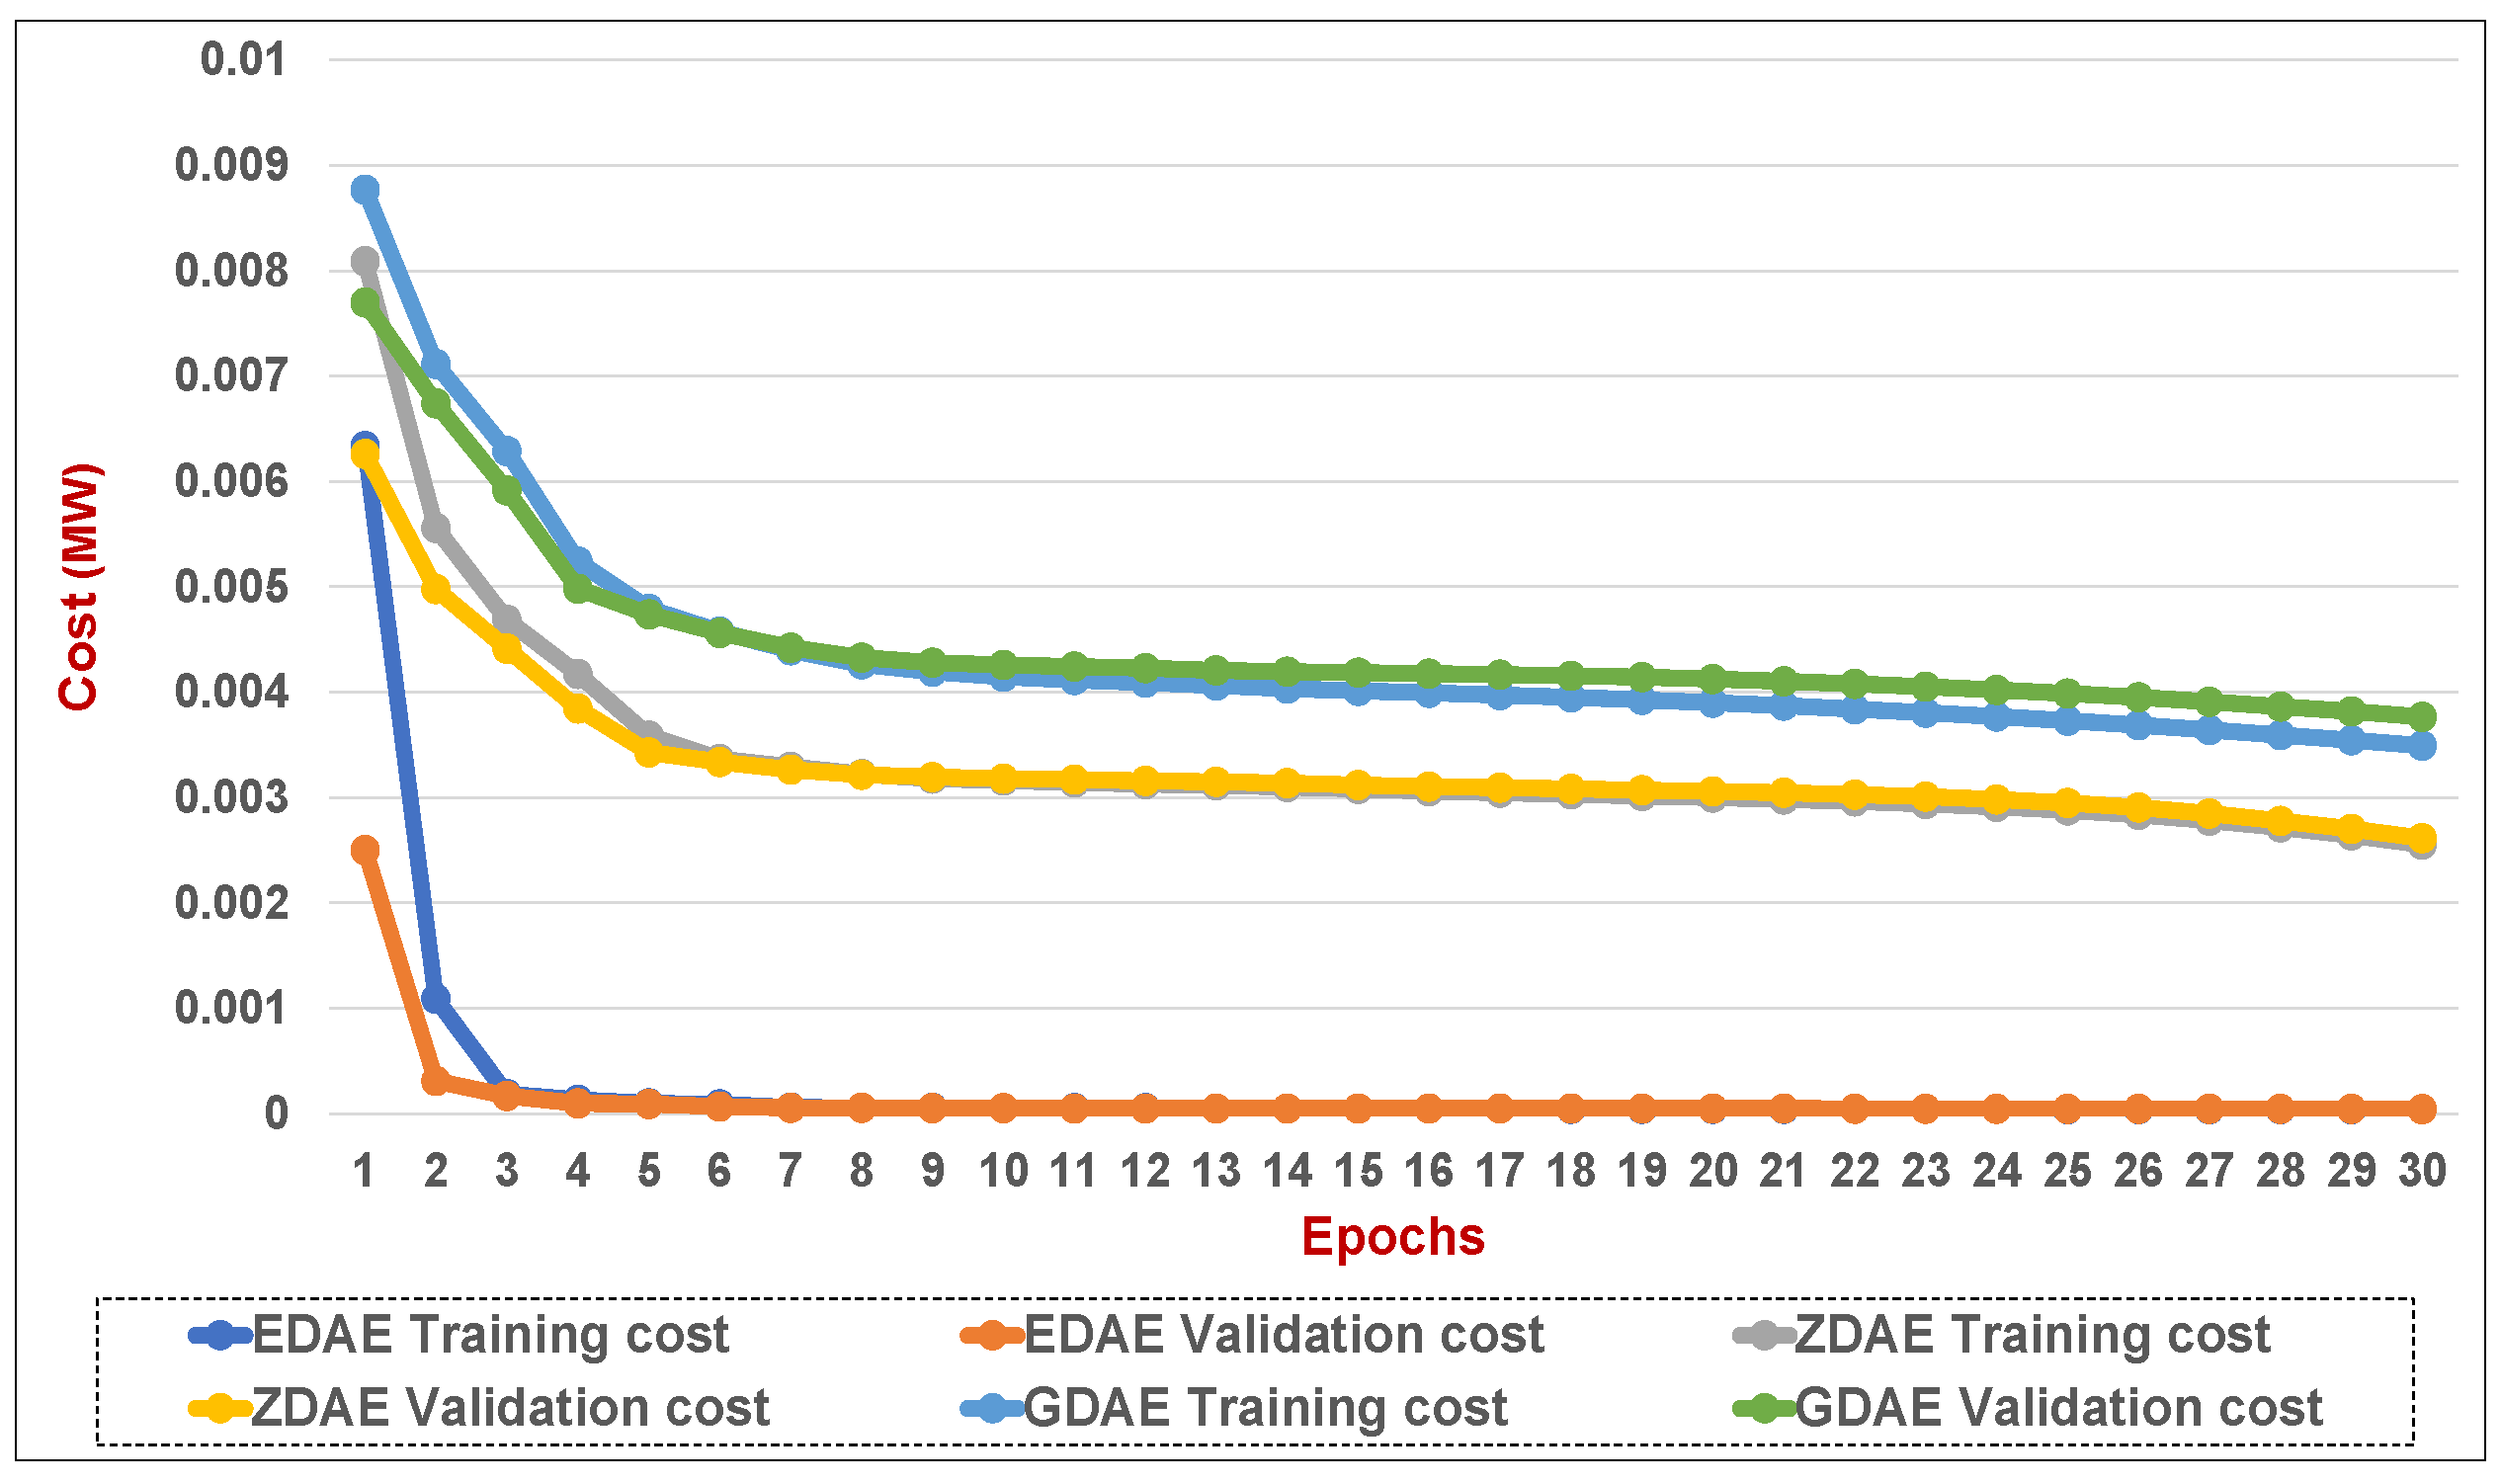
Figure 12.
Training and validation costs for various DAE corruption-addition schemes (20% of the features in a fixed attack) in a standard IEEE 14-bus system.
Figure 12.
Training and validation costs for various DAE corruption-addition schemes (20% of the features in a fixed attack) in a standard IEEE 14-bus system.
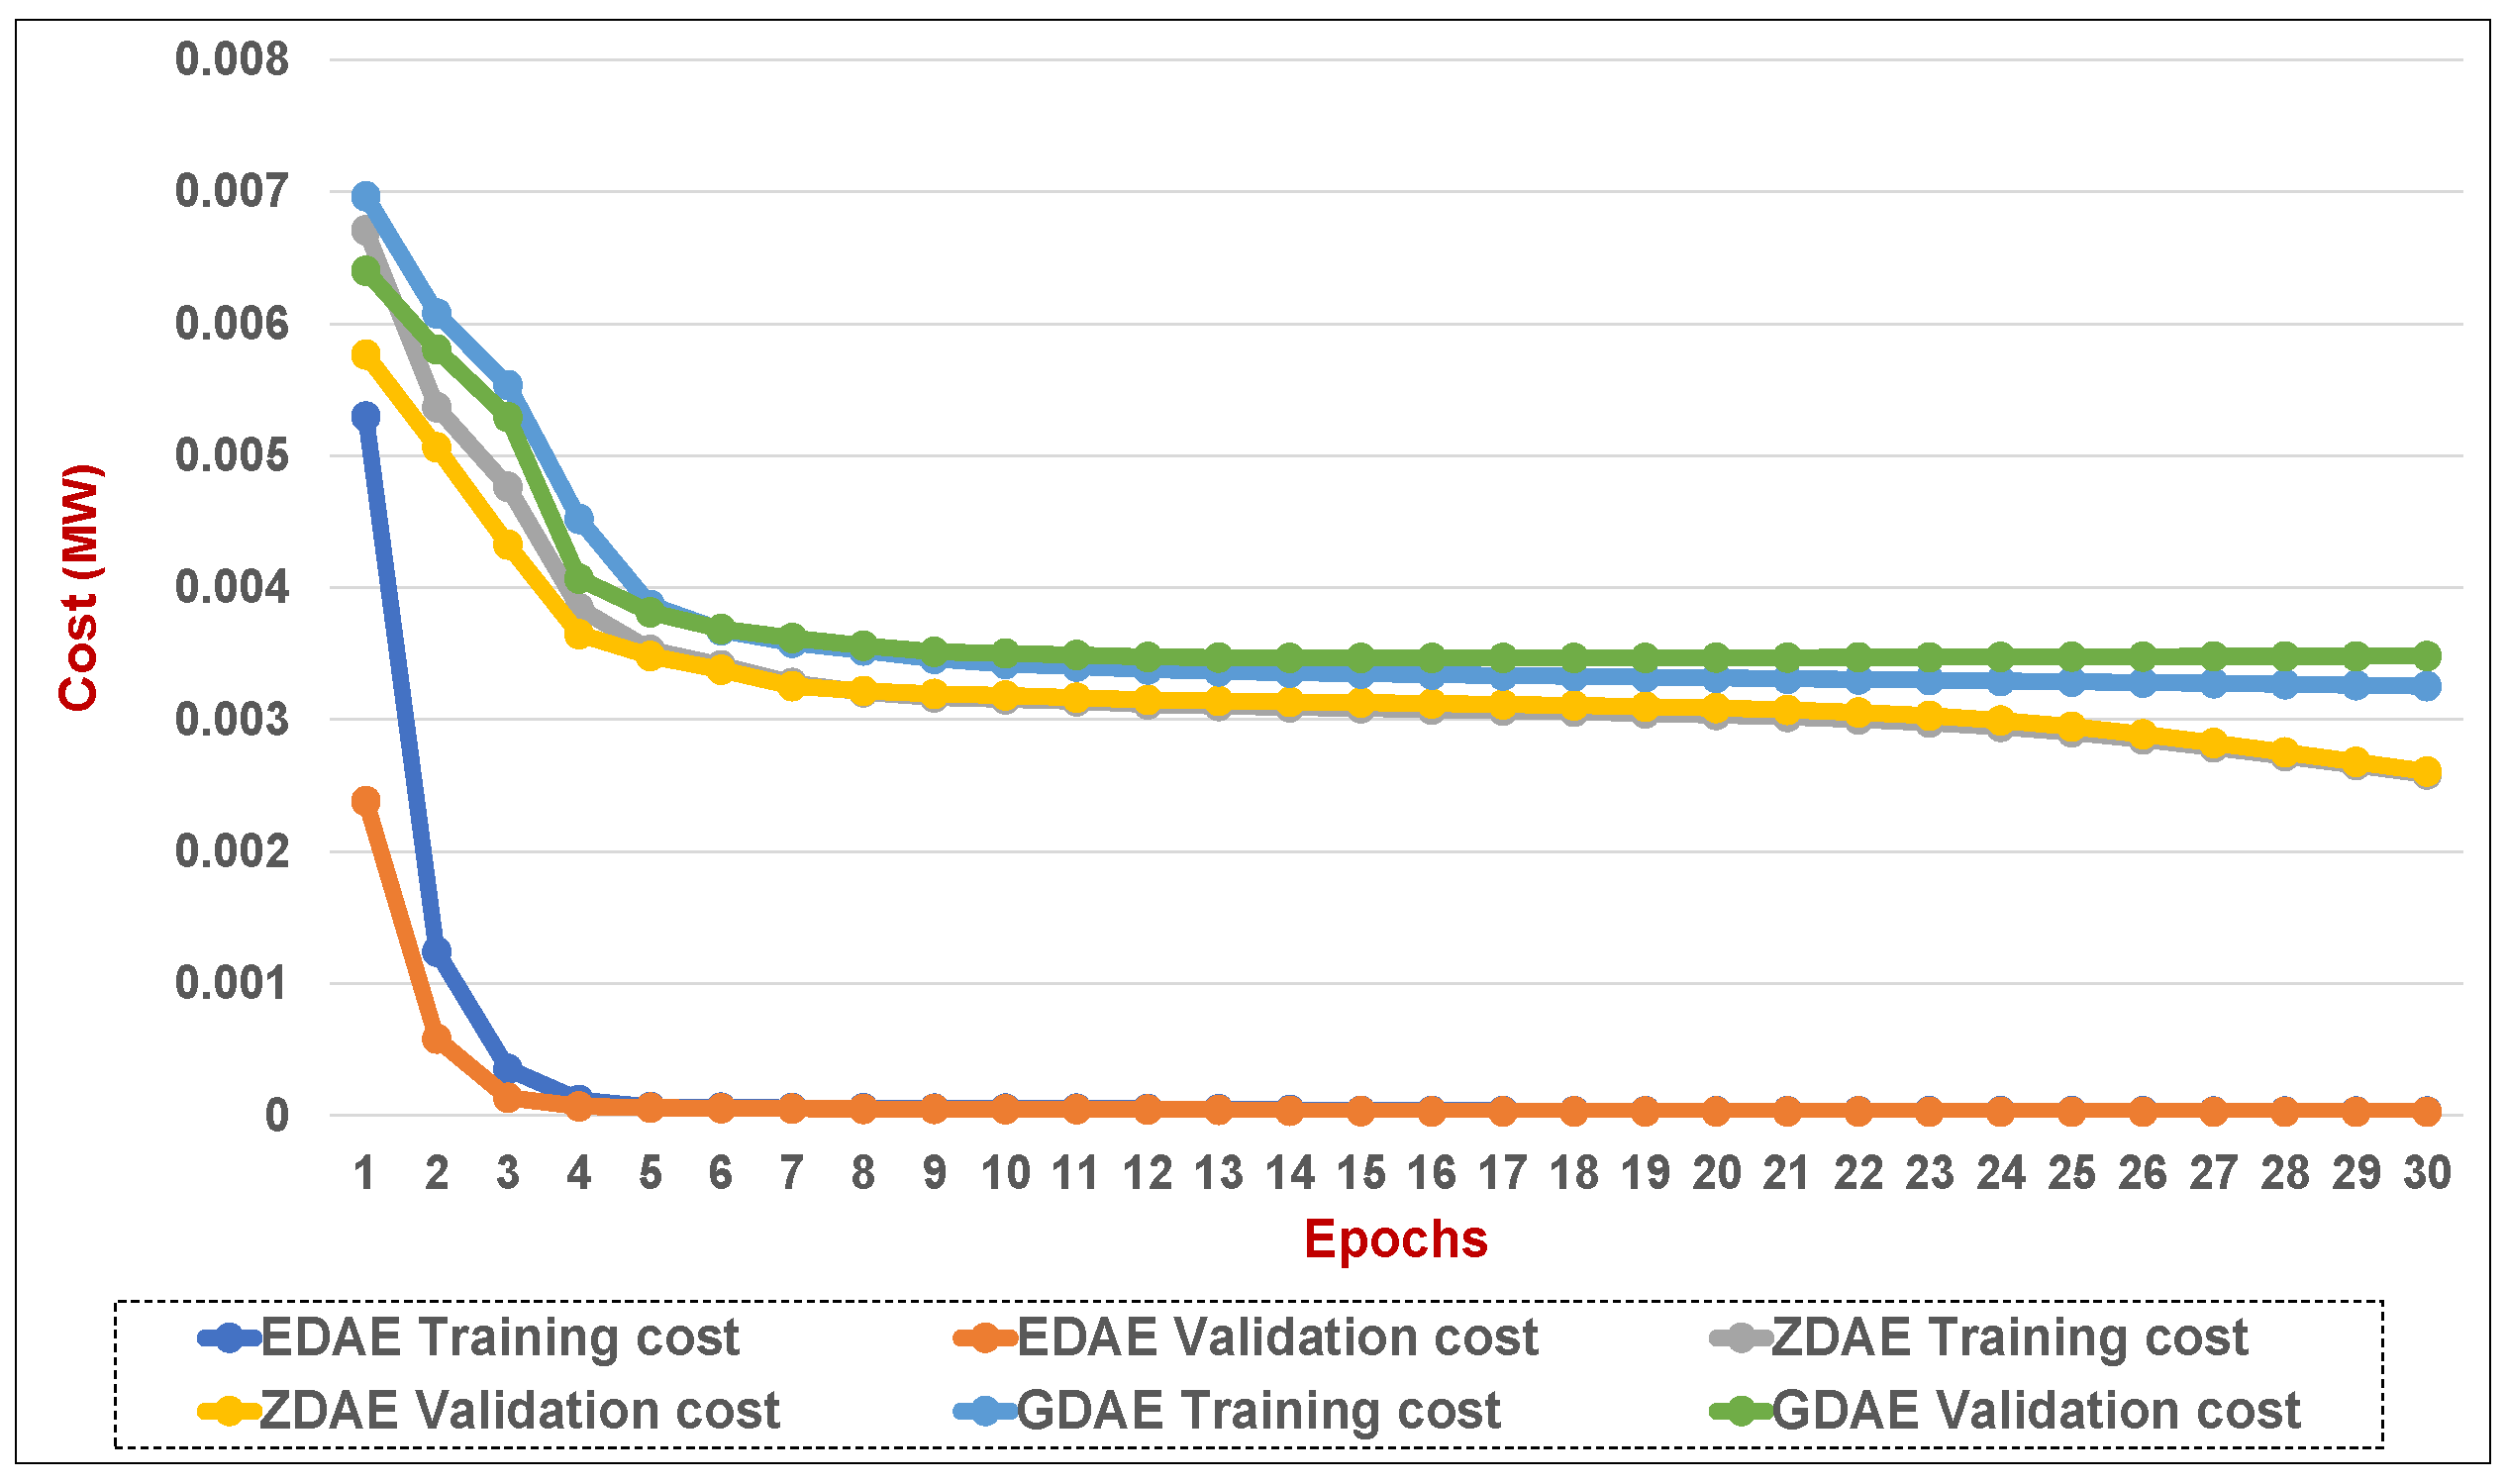
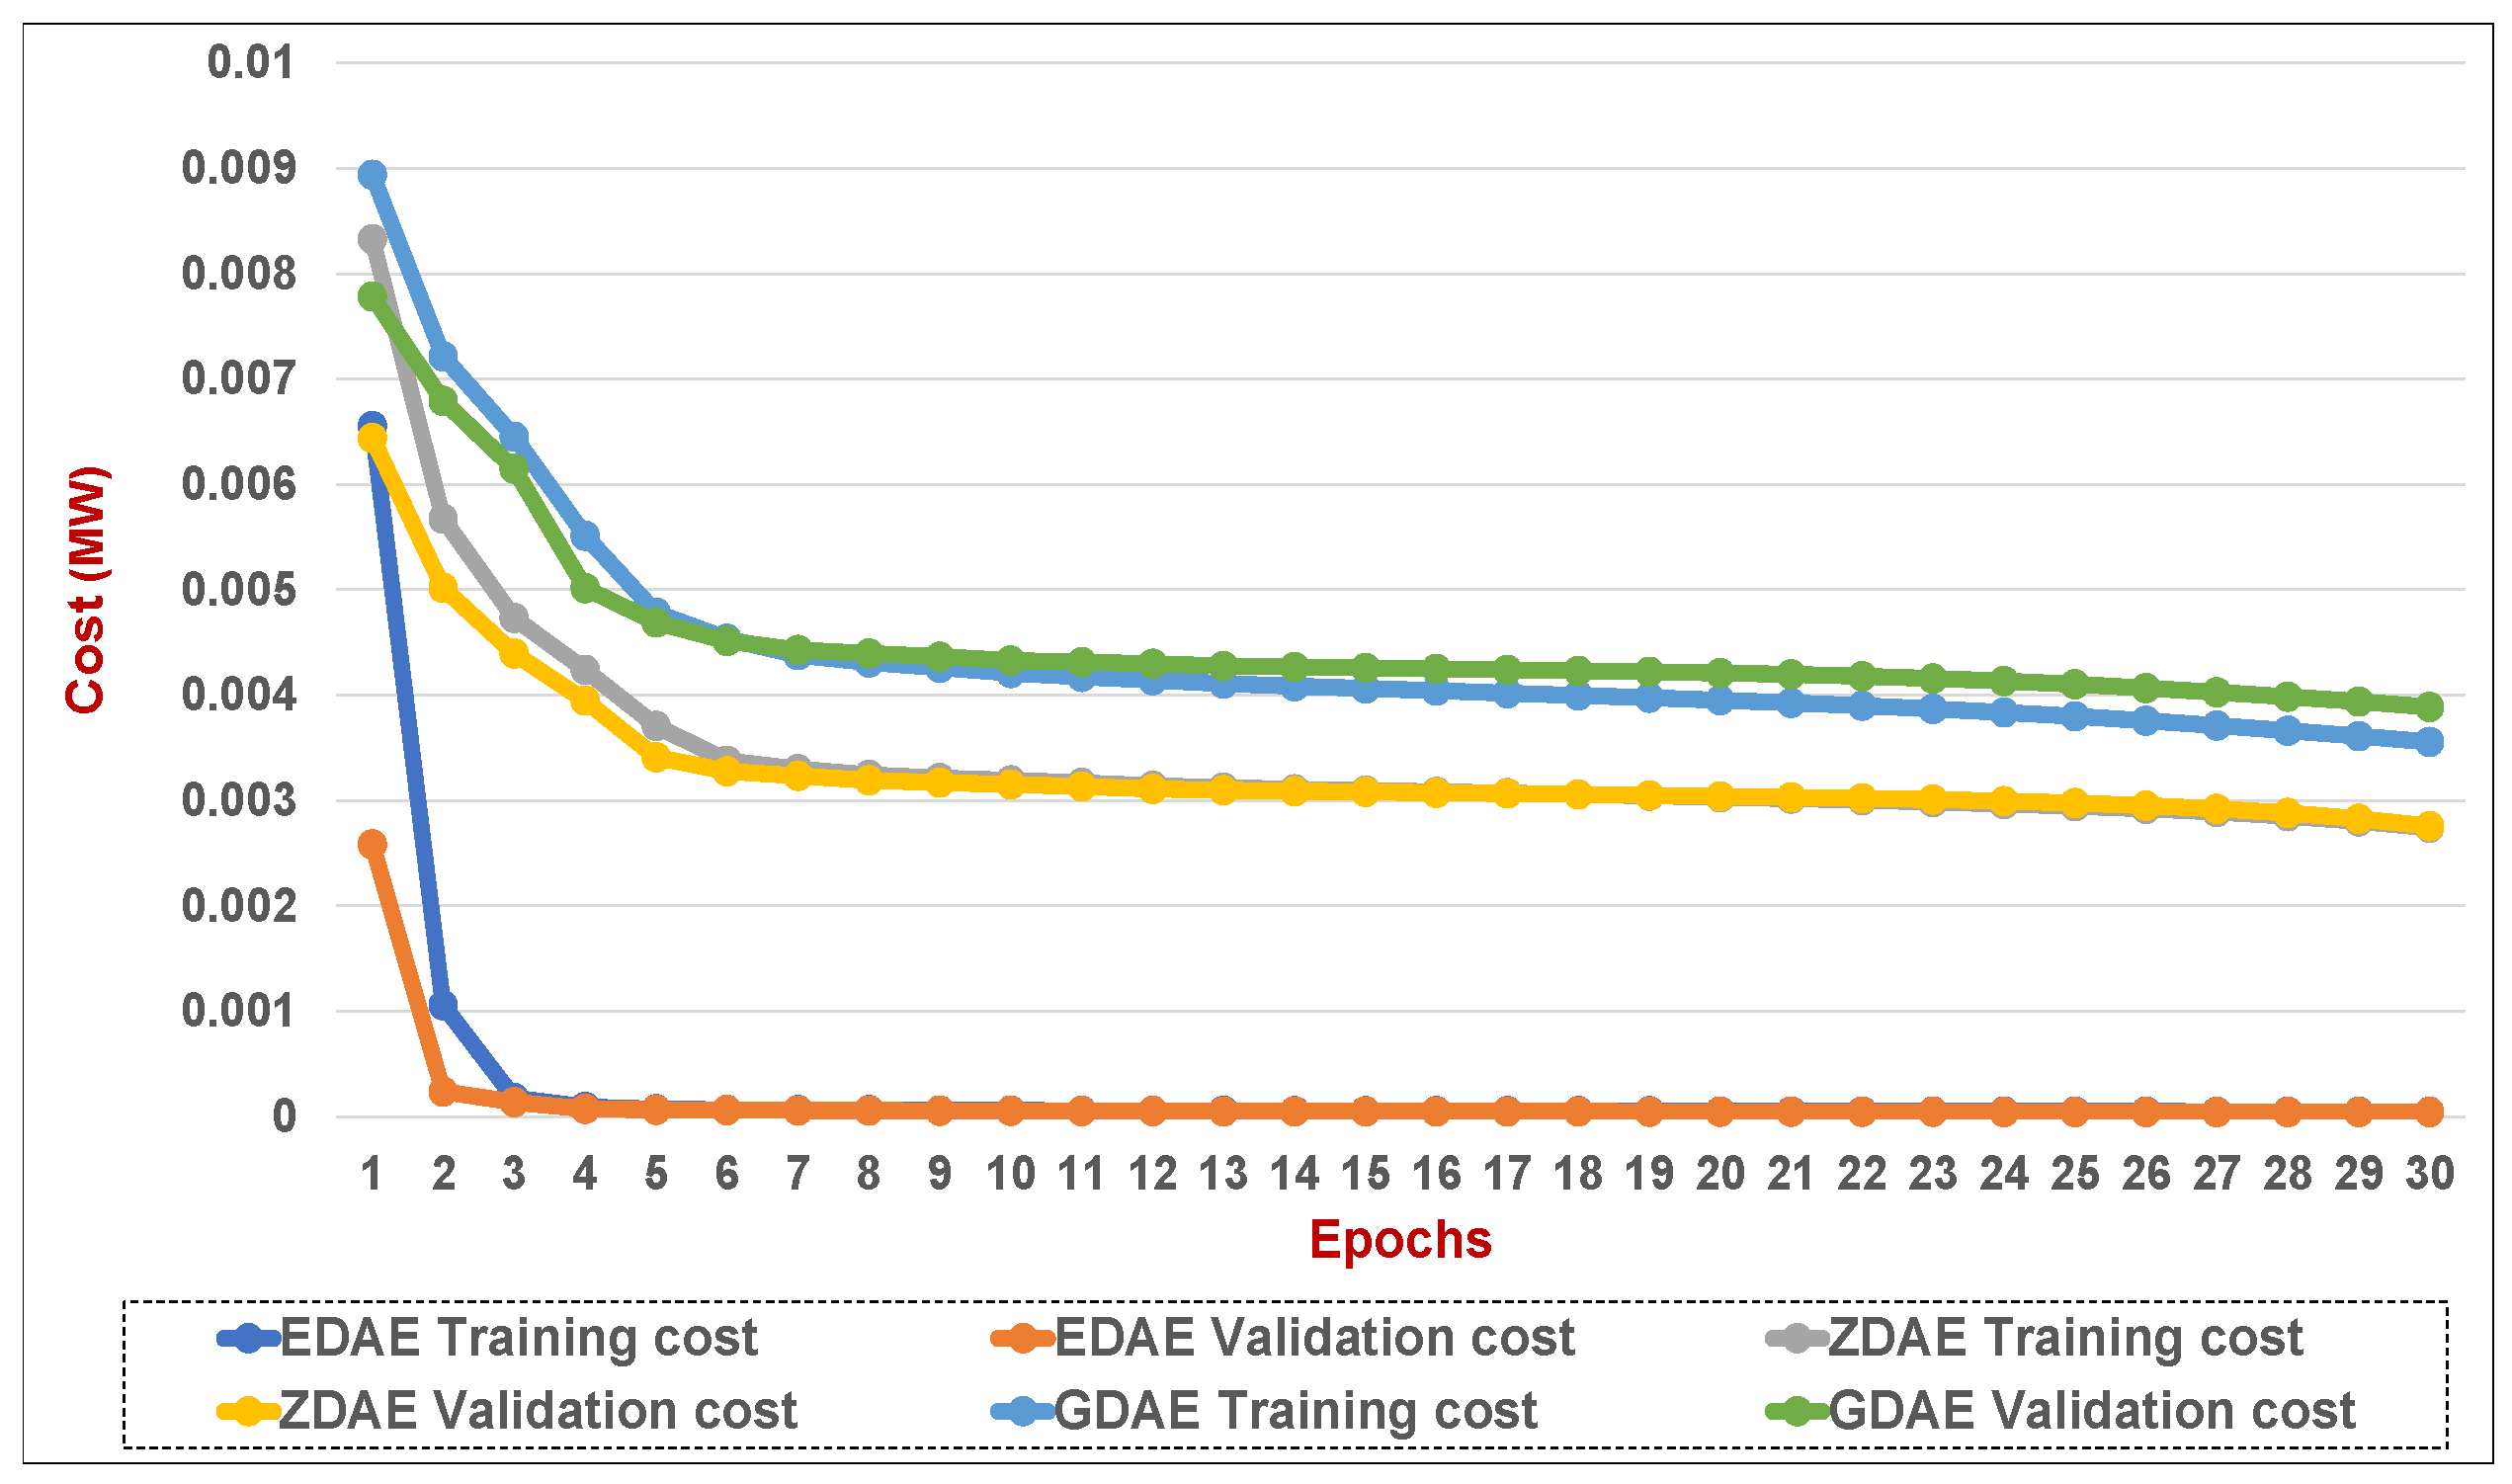
Figure 13.
Training and validation costs for various DAE corruption-addition schemes (40% of the features in a fixed attack) in a standard IEEE 14-bus system.
Figure 13.
Training and validation costs for various DAE corruption-addition schemes (40% of the features in a fixed attack) in a standard IEEE 14-bus system.
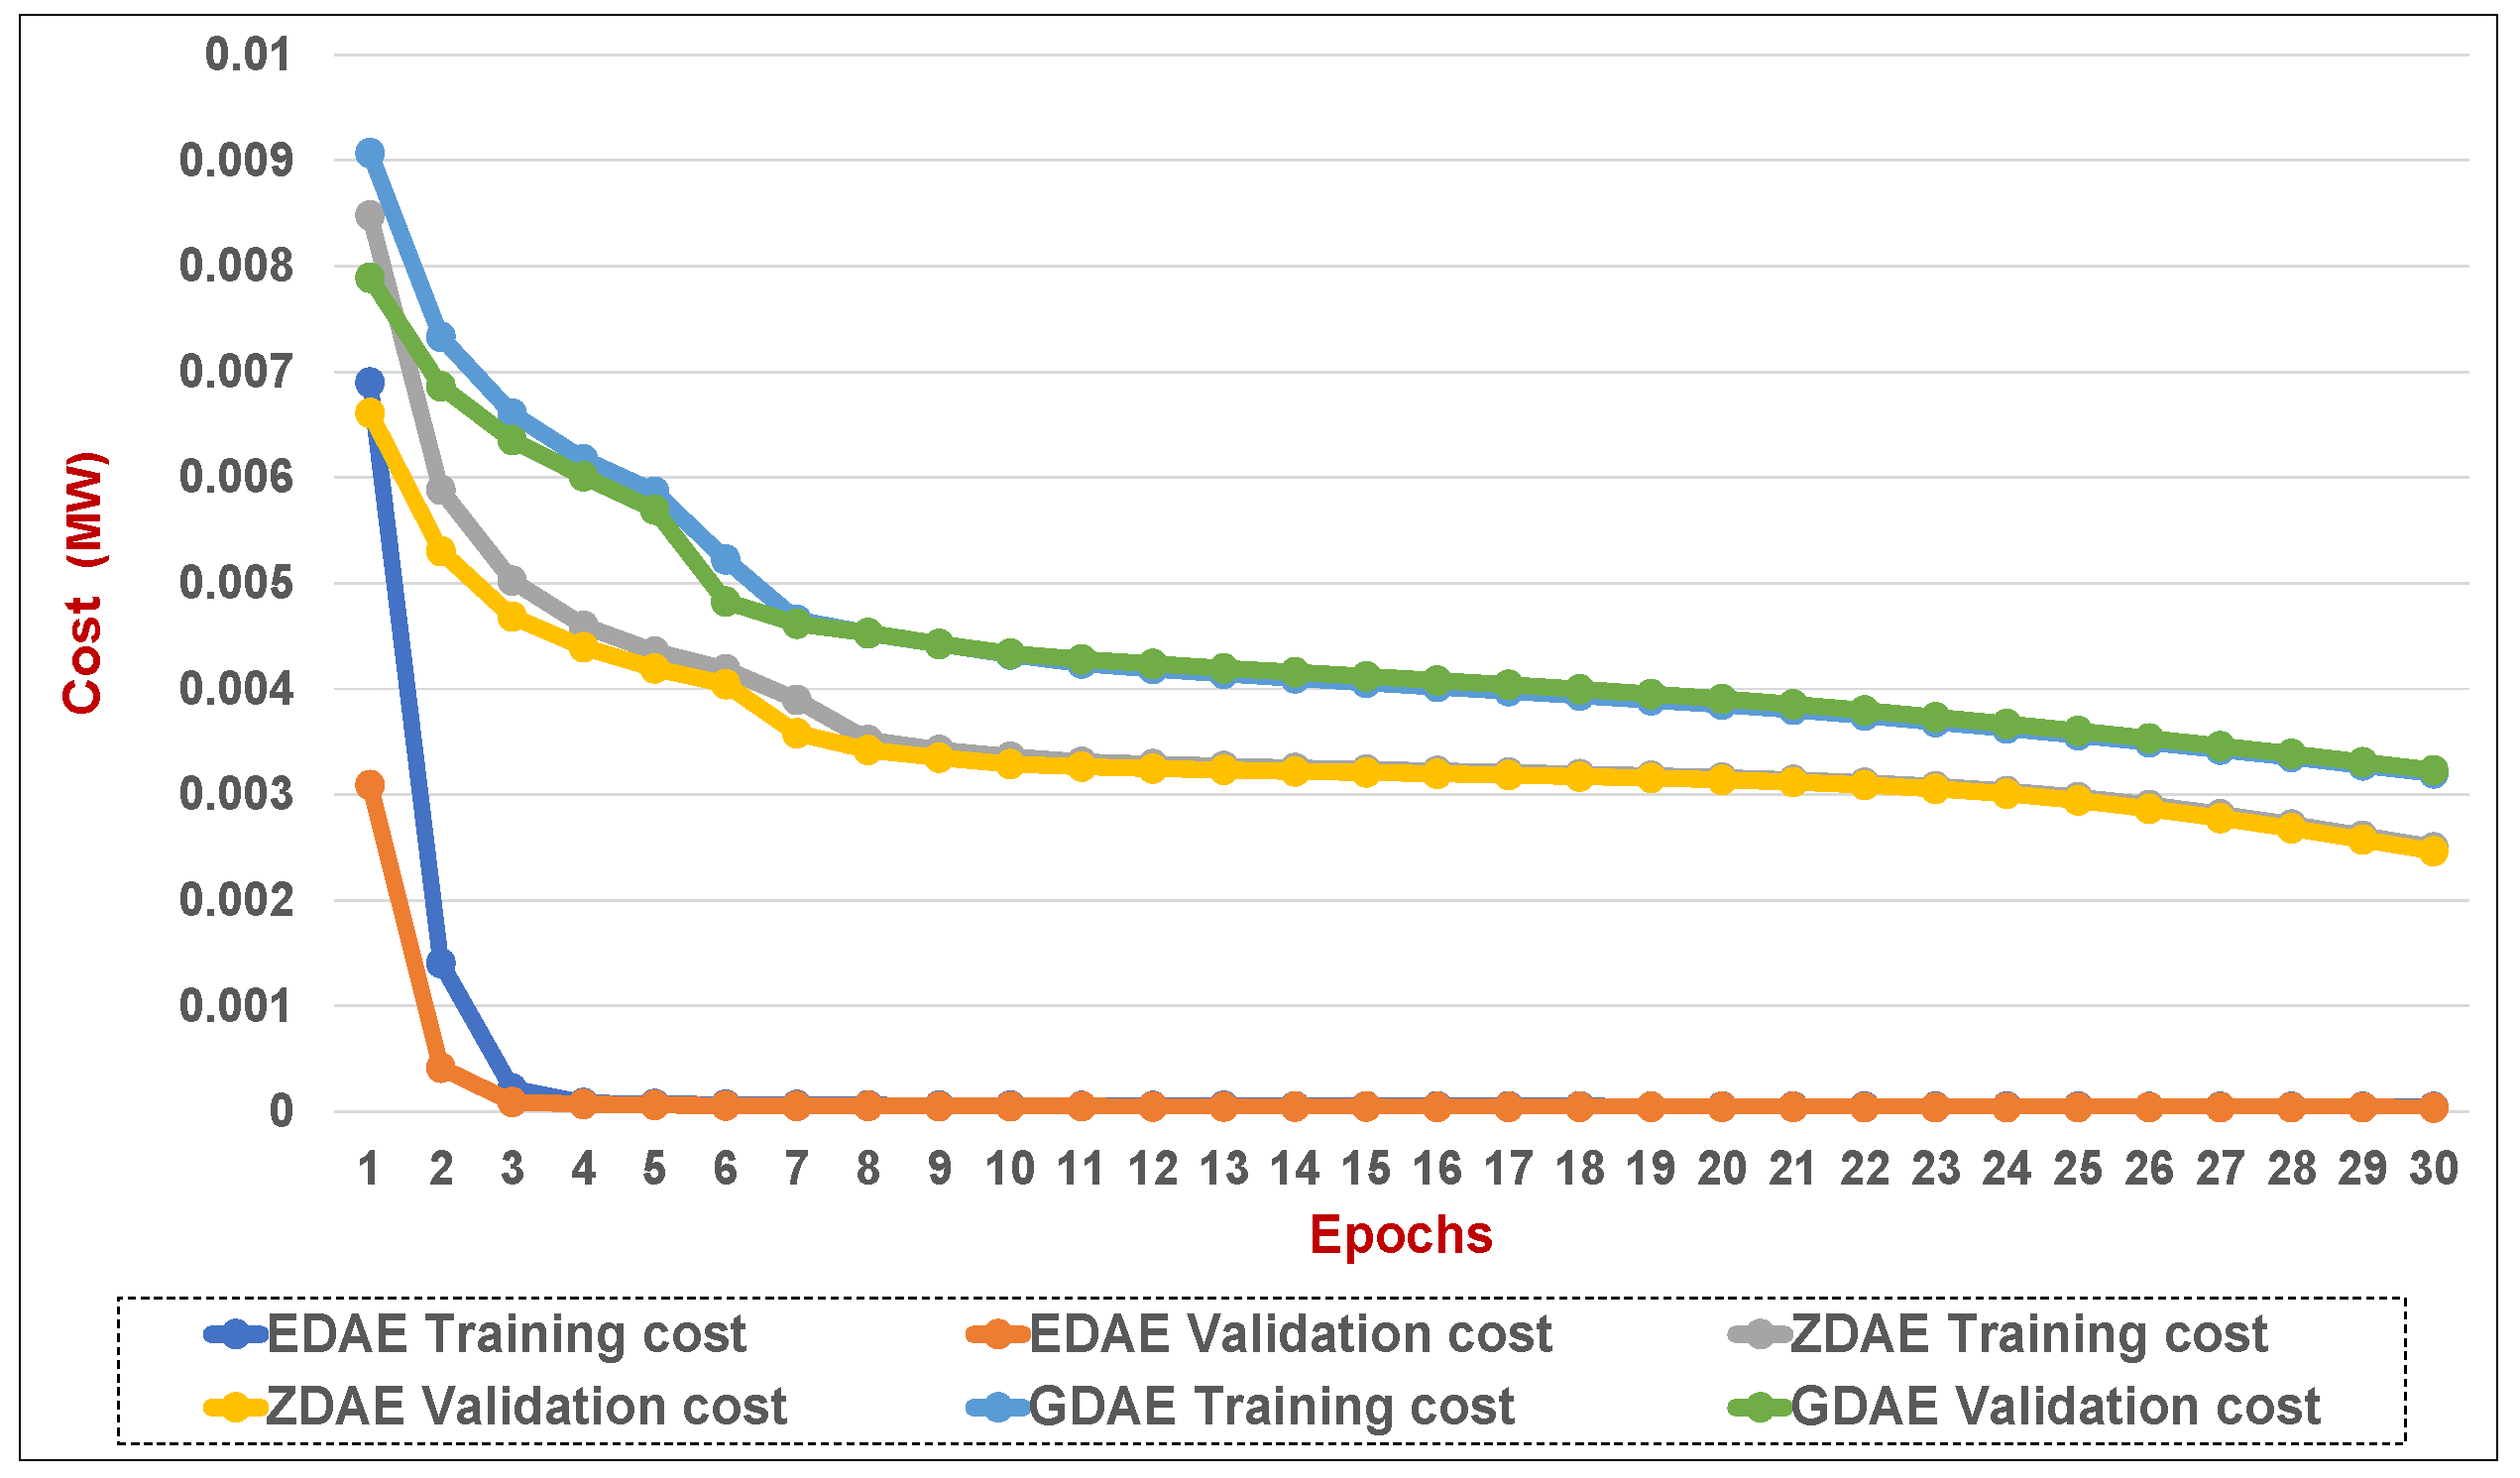
Figure 14.
Training and validation costs for various DAE corruption-addition schemes (20% of the features in a fixed attack) in a standard IEEE 39-bus system.
Figure 14.
Training and validation costs for various DAE corruption-addition schemes (20% of the features in a fixed attack) in a standard IEEE 39-bus system.
Figure 15.
Training and validation costs for various DAE corruption-addition schemes (40% of the features in a fixed attack) in a standard IEEE 39-bus system.
Figure 15.
Training and validation costs for various DAE corruption-addition schemes (40% of the features in a fixed attack) in a standard IEEE 39-bus system.
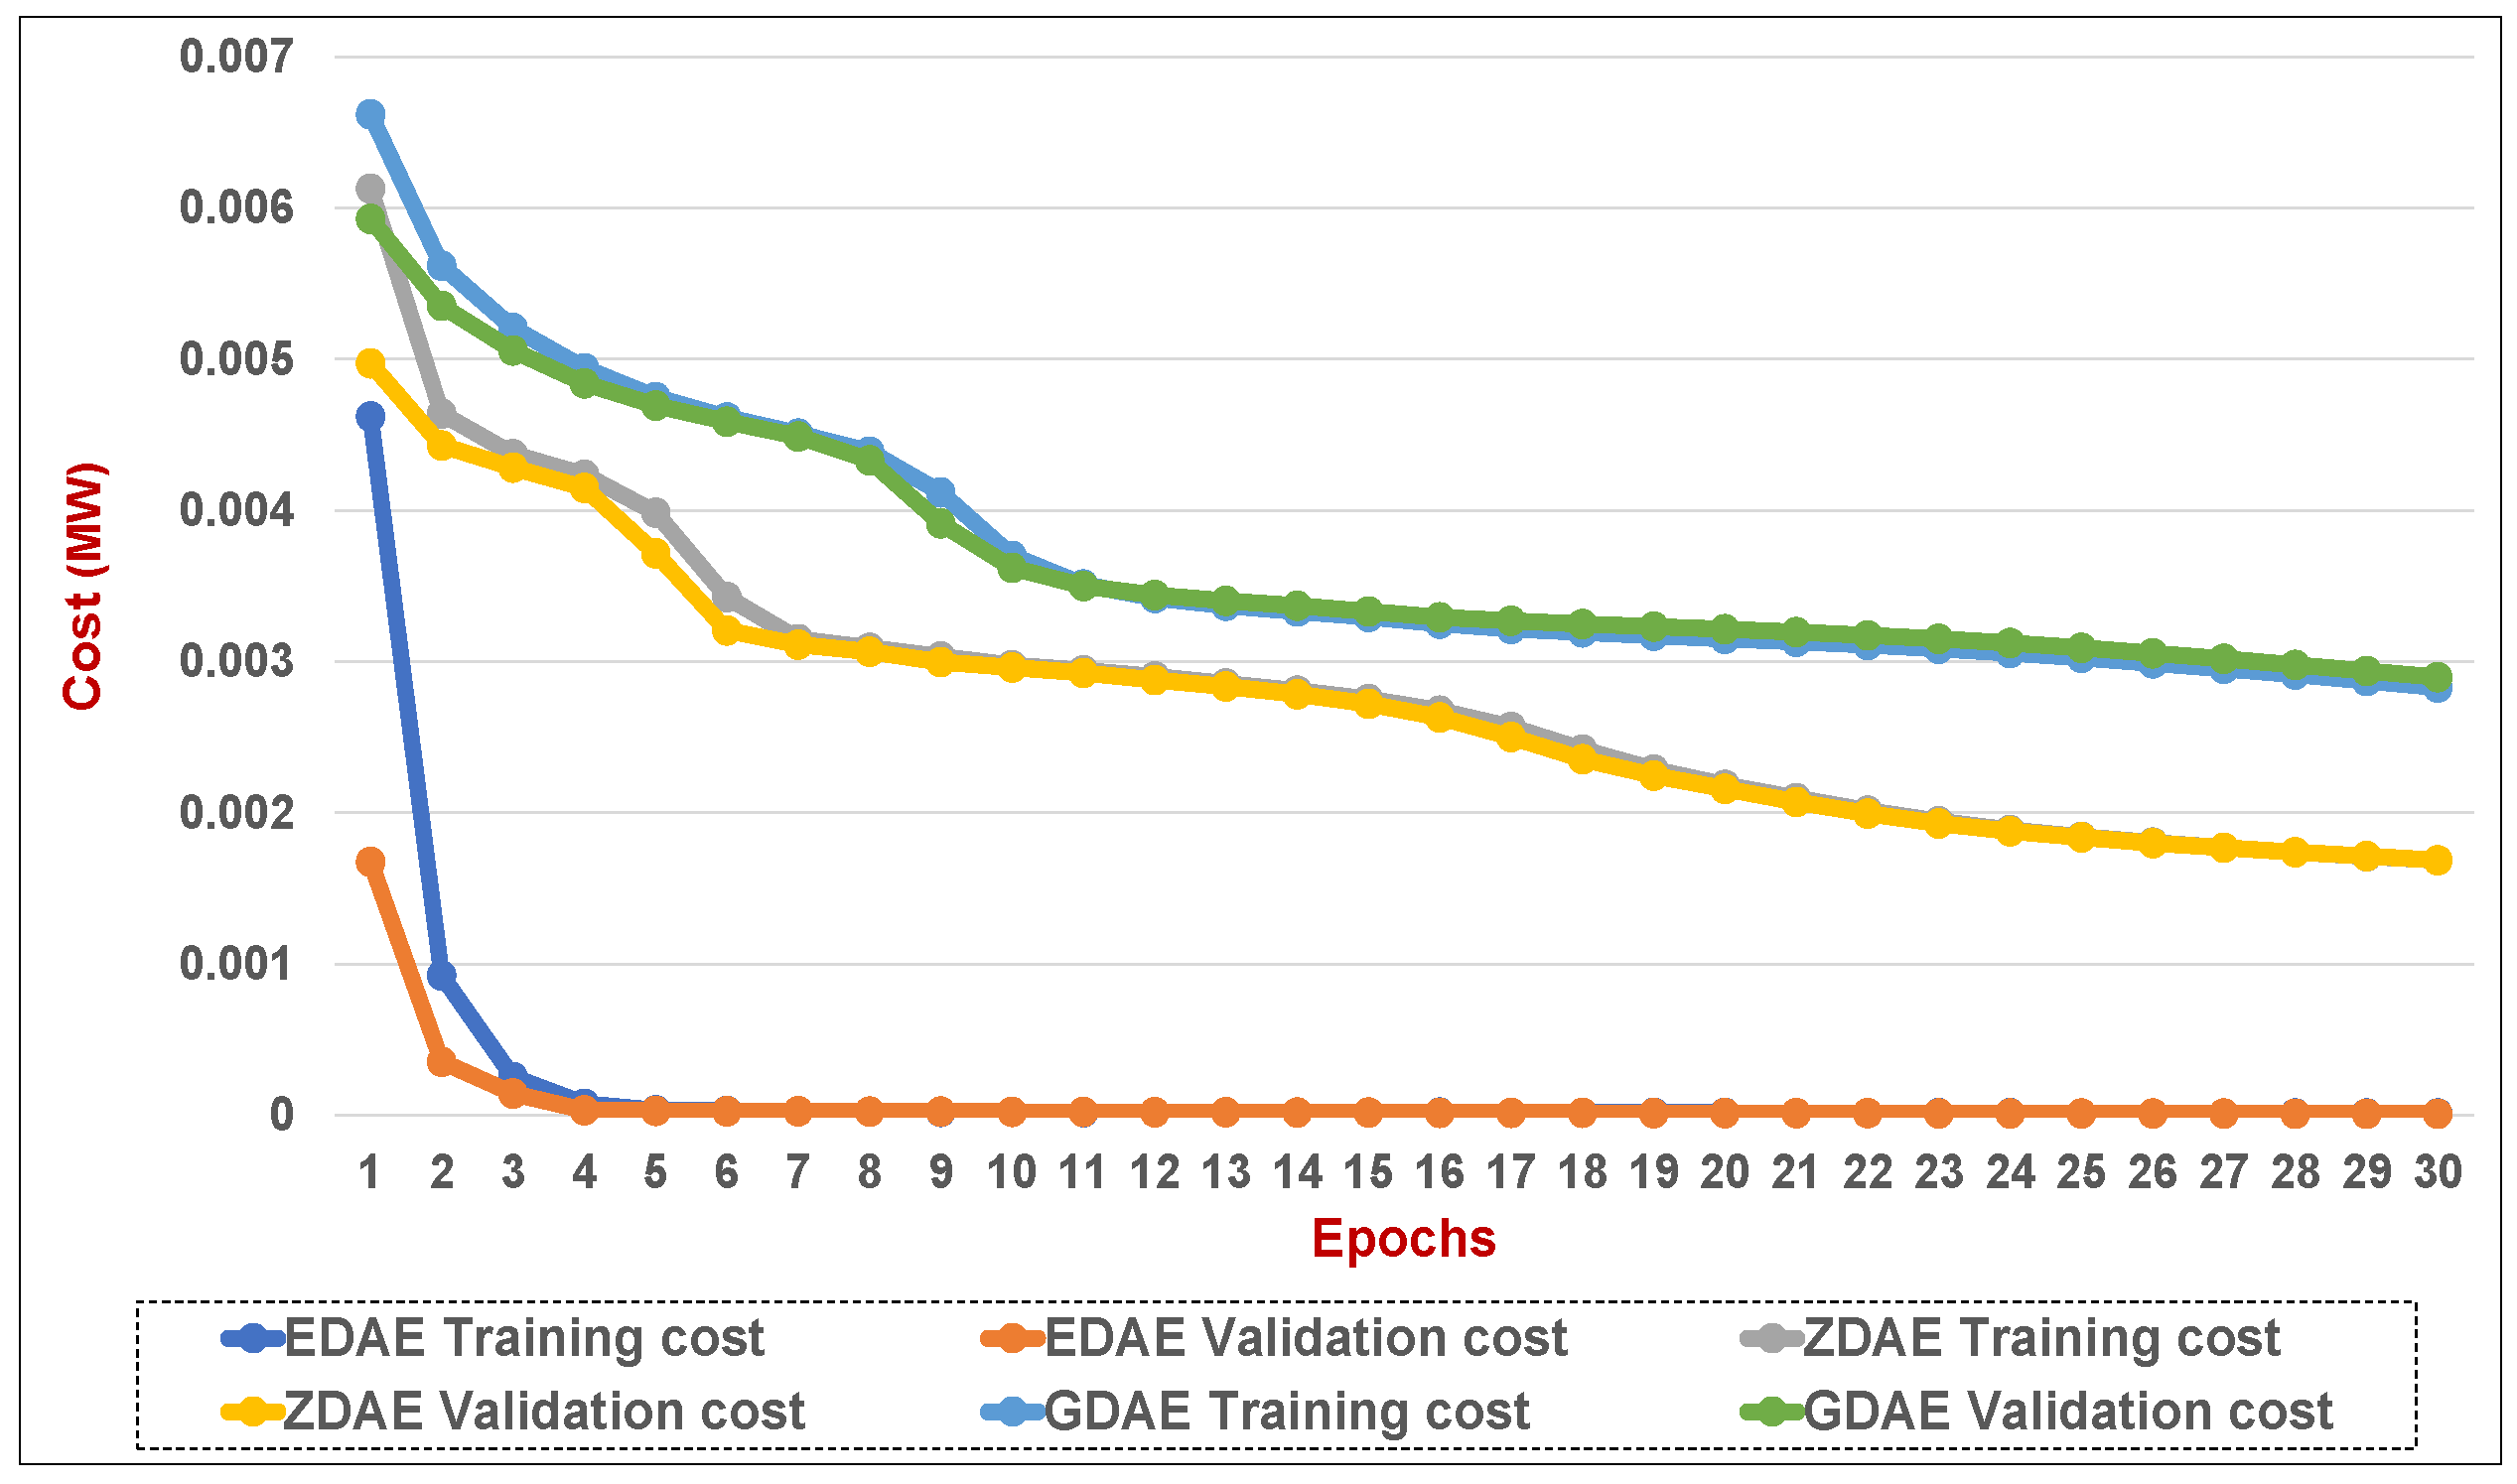
Figure 16.
Training and validation costs for various DAE corruption-addition schemes (20% of the features in a random attack) in a standard IEEE 14-bus system.
Figure 16.
Training and validation costs for various DAE corruption-addition schemes (20% of the features in a random attack) in a standard IEEE 14-bus system.
Figure 17.
Training and validation costs for various DAE corruption-addition schemes (40% of the features in a random attack) in a standard IEEE 14-bus system.
Figure 17.
Training and validation costs for various DAE corruption-addition schemes (40% of the features in a random attack) in a standard IEEE 14-bus system.
Figure 18.
Training and validation costs for various DAE corruption-addition schemes (20% of the features in a random attack) in a standard IEEE 39-bus system.
Figure 18.
Training and validation costs for various DAE corruption-addition schemes (20% of the features in a random attack) in a standard IEEE 39-bus system.
Figure 19.
Training and validation costs for various DAE corruption-addition schemes (40% of the features in a random attack) in a standard IEEE 39-bus system.
Figure 19.
Training and validation costs for various DAE corruption-addition schemes (40% of the features in a random attack) in a standard IEEE 39-bus system.
Table 1.
A summary of research works on the detection and mitigation tier of defense mechanism in SGs.
Table 1.
A summary of research works on the detection and mitigation tier of defense mechanism in SGs.
| Defense Tier | Application Area |
|---|
| Detection Tier |
| (Intrusion detection system (IDS) without utilizing machine learning) |
| Model-based techniques and game-theoretic methods for security [8,9] | EMS |
| Physical watermarking of control inputs [10] | PCC |
| Integration of run-time semantic analysis with efficient look-ahead PF analysis [11] | SCADA |
| Model-based IDS system to tackle attacks on auto generation control [12] | EMS |
| Integration of host-, and network-based IDS substations [13] | SCADA |
| Generic use of phasor measurement units (PMU) data considering white-list behavior and network topology [14] | PMU |
| IDS to detect PMU data assaulted by the GPS spoofing [15] | PMU |
| Detection of CP assaults on advanced metering network (AMI) systems based on behavior rules [16] | AMI |
| Distributed multi-layered IDS and early warning system [17,18] | AMI |
| Stealth attack identification with cumulative sum and quickest detection [19] | EMS and PCC |
| Abnormal energy consumption detection in smart meters using heuristic methods and contextual analysis of data [20,21,22] | Smart meters |
| Detection Tier |
| (Intrusion detection system (IDS) utilizing machine learning) |
| Utilizing machine learning methods for CCDA detection [23,24] | PCC/ EMS |
| Feature selection and supervised learning-based CCDA detection [25,26] | PCC |
| feature extraction and unsupervised learning-based CCDA detection [6] | PCC |
| Identification of CCDA utilizing joint transformation and Kullback–Leibler distance [27] | PCC |
| Deep learning-based recognition of the behavior features for CCDA [28] | PCC |
| Mitigation Tier |
| (Restoration mechanism to eliminate impacts of attack) |
| Game theroy-based mitigation (attacker-defender, zero-sum) game [29,30] and zero-sum Markov game-based mitigation [31] | Substation |
| Physical watermarking of control inputs [10] | Substation |
| Integration of run-time semantic analysis with efficient look-ahead PF analysis [11] | Substation |
Table 2.
Possible options for mitigating attacks.
Table 2.
Possible options for mitigating attacks.
| Detect and Discard (Scheme-I) | Detect and Reconstruct (Scheme-II) | Reconstruct (Scheme-III) |
|---|
| - Attacked samples are dropped | - Attacked samples are reconstructed | - Reconstruct without detection |
| - Wait for normal samples to be received | - Requires detection and reconstruction time | - Requires reconstruction time |
Table 3.
Advantages of the denoising autoencoder over principal component analysis.
Table 3.
Advantages of the denoising autoencoder over principal component analysis.
| Denoising Autoencoder | Principal Component Analysis |
|---|
| The DAE can learn nonlinear and linear correlations in the multivariate sensor-collected data from the power grid [34,35,37,38] | PCA requires linear and Gaussian assumption about the data [34]. |
| The DAE does not need dictionary elements to be orthogonal, making it adaptable to fluctuations in the representation of data. Thus signal reconstruction capability is improved [34,36,39]. | PCA reduces the data frame by orthogonally transforming the data into a set of principal components. This limits the performance of PCA in reconstruction of data [34]. |
| By restricting removed variables to be rebuilt from the remaining data, the DAE learns to convolute variables that tend to be correlated. This enhances robustness against noise and local fluctuations in the primary multivariate measurement data [36,39]. | Reconstruction of noisy or corrupted nonlinear data is much too lossy as compared to PCA [34,35]. |
Table 4.
Dimension growth with increasing sizes of power systems.
Table 4.
Dimension growth with increasing sizes of power systems.
| System | States | DAE Nodes
(Input and Output) |
|---|
| IEEE 14-bus | 13 | 53 |
| IEEE 39-bus | 38 | 130 |
| IEEE 57-bus | 56 | 216 |
| IEEE 118-bus | 117 | 489 |
Table 5.
Simulation parameters for DAE model.
Table 5.
Simulation parameters for DAE model.
| System | IEEE
14-Bus | IEEE
39-Bus | IEEE
57-Bus | IEEE
118-Bus |
|---|
| Input and Output Nodes | 53 | 130 | 13 | 53 |
| DAE Layers | 3 | 2 | 2 | 2 |
| Code Layer size | 34 | 75 | 140 | 318 |
| Total Data | 200,000 | 200,000 | 200,000 | 200,000 |
| Training Data | 100,000 | 100,000 | 100,000 | 100,000 |
| Test Data | 100,000 | 100,000 | 100,000 | 100,000 |
| Optimizer | MSE | MSE | MSE | MSE |
| Normalization | Min-Max | Min-Max | Min-Max | Min-Max |
| Batch Size | 1 | 1 | 1 | 1 |
| Epochs | 30 | 30 | 30 | 30 |
Table 6.
Seven best-reconstructed features (20% fixed-attack on 20% of the features in a standard IEEE 14-bus system) with the EDAE scheme.
Table 6.
Seven best-reconstructed features (20% fixed-attack on 20% of the features in a standard IEEE 14-bus system) with the EDAE scheme.
| Feature Number | 19 | 47 | 38 | 46 | 49 | 24 | 18 |
| Feature Value | −24.31 | −0.10896 | −42 | −17.574 | −6.8649 | 8.09 | 50.4 |
| Reconstructed Value | −2.43 × 101 | −1.09 × 10⁻¹ | −4.20 × 101 | −1.76 × 101 | −6.86 × 100 | 8.09 × 100 | 5.04 × 101 |
| Error | 5.88 × 10 | 1.39 × 10 | 5.18 × 10 | 6.14 × 10 | 6.47 × 10 | 8.01 × 10 | 0.00010462 |
| Error Ratio | 8.50 × 10 | 3.84 × 10 | 6.75 × 10 | 7.19 × 10 | 1.12 × 10 | 4.24 × 10 | 6.09 × 10 |
Table 7.
Seven worst-reconstructed features( fixed attack on 20% of the features in a standard IEEE 14-bus system) with the EDAE scheme.
Table 7.
Seven worst-reconstructed features( fixed attack on 20% of the features in a standard IEEE 14-bus system) with the EDAE scheme.
| Feature Number | 33 | 8 | 1 | 9 | 13 | 44 | 50 |
| Feature Value | 5.2503 | −35.862 | 16.015 | −10.707 | −15.029 | −6.7417 | −11.735 |
| Reconstructed Value | 5.25731468 | −35.85805672 | 16.01861077 | −10.70396887 | −15.02630777 | −6.739086843 | −11.73276872 |
| Error | 5.25731468 | −35.85805672 | 16.01861077 | −10.70396887 | −15.02630777 | −6.739086843 | −11.73276872 |
| Error Ratio | 0.001336053 | 0.000109957 | 0.000225462 | 0.000283098 | 0.000179135 | 0.000387611 | 0.000190139 |
Table 8.
Seven best-reconstructed features (fixed attack on 40% of the features in a standard IEEE 14-bus system) with the EDAE scheme.
Table 8.
Seven best-reconstructed features (fixed attack on 40% of the features in a standard IEEE 14-bus system) with the EDAE scheme.
| Feature Number | 16 | 24 | 18 | 44 | 36 | 43 | 38 |
| Feature Value | 71.248 | 6.7785 | 50.363 | −8.1342 | −71.248 | −52.386 | −41.969 |
| Reconstructed Value | 7.12 × 10 | 6.78 × 10 | 5.04 × 10 | −8.13 × 10 | −7.12 × 10 | −5.24 × 10 | −4.20 × 10 |
| Error | 6.05 × 10 | 2.60 × 10 | 3.40 × 10 | 5.84 × 10 | 7.95 × 10 | 0.000221883 | 0.000255396 |
| Error Ratio | 8.50 × 10 | 3.84 × 10 | 6.75 × 10 | 7.19 × 10 | 1.12 × 10 | 4.24 × 10 | 6.09 × 10 |
Table 9.
Seven worst-reconstructed features (fixed attack on 40% of the features in a standard IEEE 14-bus system) with the EDAE scheme.
Table 9.
Seven worst-reconstructed features (fixed attack on 40% of the features in a standard IEEE 14-bus system) with the EDAE scheme.
| Feature Number | 4 | 28 | 7 | 13 | 2 | 33 | 5 |
| Feature Value | −9.3102 | 28.447 | −0.21257 | −15.038 | −114.81 | 5.2384 | −11.576 |
| Reconstructed Value | −9.305423719 | 28.45157074 | −0.208140482 | −15.03418581 | −114.806619 | 5.241757108 | −11.57308739 |
| Error | 0.004776281 | 0.004570744 | 0.004429518 | 0.003814195 | 0.003381042 | 0.003357108 | 0.002912608 |
| Error Ratio | 0.000513016 | 0.000160676 | 0.020837926 | 0.000253637 | 2.9449 × 10 | 0.000640865 | 0.000251607 |
Table 10.
Seven best-reconstructed features (fixed attack on 20% of the features in a standard IEEE 14-bus system) with the ZDAE scheme.
Table 10.
Seven best-reconstructed features (fixed attack on 20% of the features in a standard IEEE 14-bus system) with the ZDAE scheme.
| Feature Number | 21 | 49 | 29 | 41 | 9 | 35 | 15 |
| Feature Value | 29.115 | −5.7354 | −5.7354 | −29.115 | −10.608 | −73.443 | 73.443 |
| Reconstructed Value | 29.11551588 | −5.73057252 | −5.729508174 | −29.10641015 | −10.59362174 | −73.42701639 | 73.46094698 |
| Error | 0.00051588 | 0.00482748 | 0.005891826 | 0.008589851 | 0.01437826 | 0.015983606 | 0.017946978 |
| Error Ratio | 1.77187 × 10 | 0.000841699 | 0.001027274 | 0.000295032 | 0.001355417 | 0.000217633 | 0.000244366 |
Table 11.
Seven worst-reconstructed features (fixed attack on 20% of the features in a standard IEEE 14-bus system) with the ZDAE scheme.
Table 11.
Seven worst-reconstructed features (fixed attack on 20% of the features in a standard IEEE 14-bus system) with the ZDAE scheme.
| Feature Number | 22 | 42 | 4 | 1 | 5 | 12 | 17 |
| Feature Value | 16.856 | −20.227 | −9.3102 | 16.01 | −11.576 | −13.834 | 56.302 |
| Reconstructed Value | 17.3320005 | −19.75872138 | −9.015861877 | 16.29326843 | −11.40118695 | −13.66738703 | 56.46786937 |
| Error | 0.476000501 | 0.468278621 | 0.294338123 | 0.283268428 | 0.174813047 | 0.166612974 | 0.165869371 |
| Error Ratio | 0.028239232 | 0.023151165 | 0.031614587 | 0.017693218 | 0.015101334 | 0.012043731 | 0.002946065 |
Table 12.
Seven best-reconstructed features (fixed attack on 40% of the features in a standard IEEE 14-bus system) with the ZDAE scheme.
Table 12.
Seven best-reconstructed features (fixed attack on 40% of the features in a standard IEEE 14-bus system) with the ZDAE scheme.
| Feature Number | 39 | 9 | 35 | 15 | 32 | 52 | 19 |
| Feature Value | 24.31 | −10.707 | −73.47 | 88.164 | 1.7611 | −1.4676 | −24.31 |
| Reconstructed Value | 2.43 × 10 | −1.07 × 10 | −7.35 × 10 | 8.82 × 10 | 1.77 × 10 | −1.45 × 10 | −2.43 × 10 |
| Error | 9.29 × 10 | 0.003913956 | 0.009265381 | 0.009673824 | 0.010849409 | 0.013501805 | 0.021025564 |
| Error Ratio | 3.82 × 10 | 3.66 × 10 | 1.26 × 10 | 1.10 × 10 | 6.16 × 10 | 9.20 × 10 | 8.65 × 10 |
Table 13.
Seven worst-reconstructed features (fixed attack on 40% of the features in a standard IEEE 14-bus system) with the ZDAE scheme.
Table 13.
Seven worst-reconstructed features (fixed attack on 40% of the features in a standard IEEE 14-bus system) with the ZDAE scheme.
| Feature Number | 22 | 42 | 11 | 17 | 1 | 14 | 8 |
| Feature Value | 16.855 | −20.226 | −6.335 | 56.346 | 16.015 | 153.52 | −35.862 |
| Reconstructed Value | 17.2521351 | −19.8600899 | −5.976216655 | 56.6757069 | 16.30432973 | 153.773394 | −35.6177516 |
| Error | 0.397135099 | 0.365910095 | 0.358783345 | 0.329706898 | 0.289329731 | 0.253393963 | 0.244248405 |
| Error Ratio | 3.82 × 10 | 3.66 × 10 | 1.26 × 10 | 1.10 × 10 | 6.16 × 10 | 9.20 × 10 | 8.65 × 10 |
Table 14.
Seven best-reconstructed features (fixed attack on 20% of the features in a standard IEEE 14-bus system) with the GDAE scheme.
Table 14.
Seven best-reconstructed features (fixed attack on 20% of the features in a standard IEEE 14-bus system) with the GDAE scheme.
| Feature Number | 23 | 38 | 47 | 12 | 27 | 18 | 25 |
| Feature Value | 6.7785 | 24.427 | −28.447 | −15.038 | 28.447 | −24.427 | 17.551 |
| Reconstructed Value | 6.78 × 10 | 2.44 × 10 | −2.84 × 10 | −1.50 × 10 | 2.84 × 10 | −2.44 × 10 | 1.76 × 10 |
| Error | 2.40 × 10 | 0.000135149 | 0.000241691 | 0.000330428 | 0.000685705 | 0.000773076 | 0.001103067 |
| Error Ratio | 3.55 × 10 | 5.53 × 10 | 8.50 × 10 | 2.20 × 10 | 2.41 × 10 | 3.16 × 10 | 6.28 × 10 |
Table 15.
Seven worst-reconstructed features (fixed attack on 20% of the features in a standard IEEE 14-bus system) with the GDAE scheme.
Table 15.
Seven worst-reconstructed features (fixed attack on 20% of the features in a standard IEEE 14-bus system) with the GDAE scheme.
| Feature Number | 3 | 10 | 7 | 28 | 48 | 31 | 51 |
| Feature Value | −9.3102 | −6.2287 | −29.767 | 5.7354 | −5.7354 | 1.5209 | −1.5209 |
| Reconstructed Value | −9.271860897 | −6.190712099 | −29.73700456 | 5.75936093 | −5.711731496 | 1.543764792 | −1.498413224 |
| Error | 0.038339103 | 0.037987901 | 0.02999544 | 0.02396093 | 0.023668504 | 0.022864792 | 0.022486776 |
| Error Ratio | 0.004117968 | 0.006098849 | 0.001007674 | 0.004177726 | 0.00412674 | 0.015033725 | 0.014785177 |
Table 16.
Seven best-reconstructed features (fixed attack on 40% of the features in a standard IEEE 14-bus system) with the GDAE scheme.
Table 16.
Seven best-reconstructed features (fixed attack on 40% of the features in a standard IEEE 14-bus system) with the GDAE scheme.
| Feature Number | 48 | 22 | 37 | 28 | 17 | 1 | 6 |
| Feature Value | −5.7354 | 43.655 | −41.969 | 5.7354 | 41.969 | −95.675 | −0.21257 |
| Reconstructed Value | −5.734781558 | 43.6563242 | −41.966989 | 5.738713765 | 41.97239975 | −95.67142491 | −0.207780056 |
| Error | 0.159876943 | 0.145020078 | 0.13172484 | 0.131127364 | 0.10495939 | 0.086672587 | 0.083504682 |
| Error Ratio | −0.000107829 | 3.03333 × 10 | −4.79163 × 10 | 0.000577774 | 8.10061 × 10 | −3.73671 × 10 | −0.022533488 |
Table 17.
Seven worst-reconstructed features (fixed attack on 40% of the features in a standard IEEE 14-bus system) with the GDAE scheme.
Table 17.
Seven worst-reconstructed features (fixed attack on 40% of the features in a standard IEEE 14-bus system) with the GDAE scheme.
| Feature Number | 4 | 1 | 13 | 33 | 3 | 7 | 11 |
| Feature Value | −5.7354 | 43.655 | −41.969 | 5.7354 | 41.969 | −95.675 | −0.21257 |
| Reconstructed Value | −5.734781558 | 43.6563242 | −41.966989 | 5.738713765 | 41.97239975 | −95.67142491 | −0.207780056 |
| Error | 0.000618442 | 0.001324201 | 0.002010998 | 0.003313765 | 0.003399746 | 0.003575093 | 0.004789944 |
| Error Ratio | 0.000107829 | 3.03333 × 10 | 4.79163 × 10 | 0.000577774 | 8.10061 × 10 | 3.73671 × 10 | 0.022533488 |
Table 18.
Seven best-reconstructed features (random attack on 20% of the features in a standard IEEE 14-bus system) with the EDAE scheme.
Table 18.
Seven best-reconstructed features (random attack on 20% of the features in a standard IEEE 14-bus system) with the EDAE scheme.
| Feature Number | 25 | 41 | 24 | 50 | 21 | 52 | 15 |
| Feature Value | 1.76 × 10 | −1.69 × 10 | 7.73 × 10 | 2.99 × 10 | 1.69 × 10 | −5.27 × 10 | 7.36 × 10 |
| Reconstructed Value | 1.76 × 10 | −1.69 × 10 | 7.73 × 10 | 2.99 × 10 | 1.69 × 10 | −5.27 × 10 | 7.36 × 10 |
| Error | 2.42 × 10 | 3.72 × 10 | 0.000121965 | 0.000145602 | 0.000226226 | 0.000232532 | 0.000244578 |
| Error Ratio | 1.38 × 10 | 2.20 × 10 | 1.58 × 10 | 4.88 × 10 | 1.34 × 10 | 4.41 × 10 | 3.33 × 10 |
Table 19.
Seven worst-reconstructed features (random attack on 20% of the features in a standard IEEE 14-bus system) with the EDAE scheme.
Table 19.
Seven worst-reconstructed features (random attack on 20% of the features in a standard IEEE 14-bus system) with the EDAE scheme.
| Feature Number | 49 | 8 | 1 | 4 | 38 | 18 | 45 |
| Feature Value | −9.9661 | −8.6655 | −95.556 | −11.794 | −42.103 | −24.313 | −7.734 |
| Reconstructed Value | −9.960711568 | −8.660489164 | −95.55141419 | −11.78952318 | −42.09859985 | −24.3087889 | −7.730274573 |
| Error | 0.005388432 | 0.005010836 | 0.00458581 | 0.004476824 | 0.004400152 | 0.004211097 | 0.003725427 |
| Error Ratio | 0.000540676 | 0.000578251 | 4.79908 × 10 | 0.000379585 | 0.000104509 | 0.000173203 | 0.000481695 |
Table 20.
Seven best-reconstructed features (random attack on 40% of the features in a standard IEEE 14-bus system) with the EDAE scheme.
Table 20.
Seven best-reconstructed features (random attack on 40% of the features in a standard IEEE 14-bus system) with the EDAE scheme.
| Feature Number | 20 | 35 | 29 | 32 | 43 | 40 | 14 |
| Feature Value | 29.111 | −73.554 | 5.6798 | 5.2682 | −6.7198 | −29.111 | 73.554 |
| Reconstructed Value | 2.91 × 10 | −7.36 × 10 | 5.68 × 10 | 5.27 × 10 | −6.72 × 10 | −2.91 × 10 | 7.36 × 10 |
| Error | 4.64 × 10 | 5.41 × 10 | 6.26 × 10 | 0.000224246 | 0.000406535 | 0.000490851 | 0.000534421 |
| Error Ratio | 1.59 × 10 | 7.36 × 10 | 1.10 × 10 | 4.26 × 10 | 6.05 × 10 | 1.69 × 10 | 7.27 × 10 |
Table 21.
Seven worst-reconstructed features (random attack on 40% of the features in a standard IEEE 14-bus system) with the EDAE scheme.
Table 21.
Seven worst-reconstructed features (random attack on 40% of the features in a standard IEEE 14-bus system) with the EDAE scheme.
| Feature Number | 7 | 11 | 47 | 4 | 49 | 9 | 1 |
| Feature Value | 0.046326 | −13.885 | −28.613 | −11.794 | −9.9661 | −3.734 | −95.556 |
| Reconstructed Value | 0.05920957 | −13.87618859 | −28.60460809 | −11.78692803 | −9.959870581 | −3.728092846 | −95.55035503 |
| Error | 0.01288357 | 0.008811412 | 0.008391909 | 0.007071968 | 0.006229419 | 0.005907154 | 0.005644974 |
| Error Ratio | 0.27810667 | 0.000634599 | 0.00029329 | 0.000599624 | 0.000625061 | 0.001581991 | 5.9075 × 10 |
Table 22.
Seven best-reconstructed features (random attack on 20% of the features in a standard IEEE 14-bus system) with the ZDAE scheme.
Table 22.
Seven best-reconstructed features (random attack on 20% of the features in a standard IEEE 14-bus system) with the ZDAE scheme.
| Feature Number | 41 | 14 | 21 | 44 | 42 | 24 | 49 |
| Feature Value | −16.888 | 73.554 | 16.888 | −7.734 | −43.836 | 7.734 | −9.9661 |
| Reconstructed Value | −16.88659536 | 73.55574957 | 16.88984495 | −7.732058335 | −43.83405151 | 7.736052894 | −9.963812929 |
| Error | 0.001404636 | 0.001749567 | 0.001844953 | 0.001941665 | 0.00194849 | 0.002052894 | 0.002287071 |
| Error Ratio | 8.31736 × 10 | 2.37862 × 10 | 0.000109246 | 0.000251056 | 4.44496 × 10 | 0.000265438 | 0.000229485 |
Table 23.
Seven worst-reconstructed features (random attack on 20% of the features in a standard IEEE 14-bus system) with the ZDAE scheme.
Table 23.
Seven worst-reconstructed features (random attack on 20% of the features in a standard IEEE 14-bus system) with the ZDAE scheme.
| Feature Number | 5 | 27 | 47 | 7 | 2 | 11 | 40 |
| Feature Value | −0.5438 | −0.046326 | −29.855 | −48.433 | −6.169 | −29.111 | 29.111 |
| Reconstructed Value | −0.402496385 | 0.062047902 | −29.74962789 | −48.35341728 | −6.09788107 | −29.04398602 | 29.17169563 |
| Error | 0.141303615 | 0.108373902 | 0.105372107 | 0.079582725 | 0.07111893 | 0.067013983 | 0.06069563 |
| Error Ratio | 0.259844824 | 2.339375345 | 0.003529463 | 0.001643151 | 0.011528437 | 0.002302016 | 0.002084972 |
Table 24.
Seven best-reconstructed features (random attack on 40% of the features in a standard IEEE 14-bus system) with the ZDAE scheme.
Table 24.
Seven best-reconstructed features (random attack on 40% of the features in a standard IEEE 14-bus system) with the ZDAE scheme.
| Feature Number | 42 | 22 | 18 | 14 | 38 | 44 | 24 |
| Feature Value | −43.836 | 16.888 | −24.313 | 73.554 | 24.313 | −7.734 | 7.734 |
| Reconstructed Value | −43.83578598 | 16.88835338 | −24.31091173 | 73.5561661 | 24.31673587 | −7.729402089 | 7.739212442 |
| Error | 0.000214025 | 0.000353378 | 0.002088271 | 0.002166096 | 0.003735869 | 0.004597911 | 0.005212442 |
| Error Ratio | 4.88239 × 10 | 2.09248 × 10 | 8.58911 × 10 | 2.94491 × 10 | 0.000153657 | 0.000594506 | 0.000673965 |
Table 25.
Seven worst-reconstructed features (random attack on 40% of the features in a standard IEEE 14-bus system) with the ZDAE scheme.
Table 25.
Seven worst-reconstructed features (random attack on 40% of the features in a standard IEEE 14-bus system) with the ZDAE scheme.
| Feature Number | 12 | 1 | 9 | 7 | 47 | 33 | 52 |
| Feature Value | −15.234 | 16.22 | −3.734 | −29.855 | 6.7198 | 5.2682 | −1.565 |
| Reconstructed Value | −15.14360235 | 16.30842128 | −3.673237667 | −29.80570794 | 6.764957918 | 5.312002445 | −1.523176287 |
| Error | 0.090397648 | 0.088421284 | 0.060762333 | 0.049292057 | 0.045157918 | 0.043802445 | 0.041823713 |
| Error Ratio | 0.00593394 | 0.005451374 | 0.016272719 | 0.001651049 | 0.006720128 | 0.008314499 | 0.026724418 |
Table 26.
Seven best-reconstructed features (random attack on 20% of the features in a standard IEEE 14-bus system) with the GDAE scheme.
Table 26.
Seven best-reconstructed features (random attack on 20% of the features in a standard IEEE 14-bus system) with the GDAE scheme.
| Feature Number | 12 | 41 | 21 | 20 | 24 | 30 | 4 |
| Feature Value | −13.885 | −29.111 | 16.888 | 29.111 | 6.7198 | 9.9661 | −11.794 |
| Reconstructed Value | −13.88377492 | −29.10957017 | 16.88965969 | 29.11274824 | 6.721632953 | 9.967963504 | −11.79191121 |
| Error | 0.001225077 | 0.001429832 | 0.001659687 | 0.001748239 | 0.001832953 | 0.001863504 | 0.002088788 |
| Error Ratio | 8.82302 × 10 | 4.91165 × 10 | 9.82761 × 10 | 6.00542 × 10 | 0.000272769 | 0.000186984 | 0.000177106 |
Table 27.
Seven worst-reconstructed features (random attack on 20% of the features in a standard IEEE 14-bus system) with the GDAE scheme.
Table 27.
Seven worst-reconstructed features (random attack on 20% of the features in a standard IEEE 14-bus system) with the GDAE scheme.
| Feature Number | 1 | 7 | 33 | 13 | 0 | 2 | 18 |
| Feature Value | −95.556 | −95.556 | −153.53 | 153.53 | 16.22 | −95.556 | −24.313 |
| Reconstructed Value | −95.48854845 | −95.49835622 | −153.4731469 | 153.5859801 | 16.27401379 | −95.50443633 | −24.27054722 |
| Error | 0.067451553 | 0.057643775 | 0.056853103 | 0.055980148 | 0.054013795 | 0.051563669 | 0.042452777 |
| Error Ratio | 0.000705885 | 0.000603246 | 0.000370306 | 0.00036462 | 0.003330074 | 0.000539617 | 0.001746094 |
Table 28.
Seven best-reconstructed features (random attack on 40% of the features in a standard IEEE 14-bus system) with the GDAE scheme.
Table 28.
Seven best-reconstructed features (random attack on 40% of the features in a standard IEEE 14-bus system) with the GDAE scheme.
| Feature Number | 14 | 42 | 22 | 13 | 33 | 19 | 38 |
| Feature Value | 73.554 | -43.836 | 43.836 | 153.53 | −153.53 | 42.103 | −42.103 |
| Reconstructed Value | 73.55511276 | −43.83366463 | 43.83835556 | 153.5325412 | −153.5258551 | 42.10726753 | −42.09863462 |
| Error | 0.001112764 | 0.002335371 | 0.002355563 | 0.00254121 | 0.004144926 | 0.004267531 | 0.004365384 |
| Error Ratio | 1.51285 × 10 | 5.32752 × 10 | 5.37358 × 10 | 1.65519 × 10 | 2.69975 × 10 | 0.000101359 | 0.000103683 |
Table 29.
Seven worst-reconstructed features (random attack on 40% of the features in a standard IEEE 14-bus system) with the GDAE scheme.
Table 29.
Seven worst-reconstructed features (random attack on 40% of the features in a standard IEEE 14-bus system) with the GDAE scheme.
| Feature Number | 2 | 11 | 7 | 12 | 8 | 0 | 19 |
| Feature Value | −48.433 | −13.885 | −95.556 | −13.885 | −8.6655 | 16.22 | −62.336 |
| Reconstructed Value | −48.30994115 | −13.79823827 | −95.47778432 | −13.80909392 | −8.591674696 | 16.2896147 | −62.26993855 |
| Error | 0.123058854 | 0.086761732 | 0.078215681 | 0.075906078 | 0.073825304 | 0.069614699 | 0.066061451 |
| Error Ratio | 0.002540806 | 0.006248594 | 0.000818532 | 0.005466768 | 0.008519451 | 0.004291905 | 0.001059764 |


