1. Introduction
Our daily life on Earth requires the production of large amounts of energy. The energy is produced mainly in the forms of electrical energy and mechanical energy as a result of liquid fuels and gases combustion in engines in various types of vehicles. Unfortunately, the various types of useful energy also cause the production of a huge amount of heat. Moreover, these useful energies are eventually converted to heat energy in machines, vehicles, and devices. An important question arises here—whether this release of a large amount of thermal energy is comparable to solar energy and can it significantly affect the global temperature and climate change. In this paper, the thesis was verified whether the heat emission, which is the final result of energy generated by our civilization, has an effect comparable to that of greenhouse warming. The greenhouse effect is well known and is comprehensively presented in many papers—among others [
1,
2,
3,
4]. However, the effect and greenhouse gas emission have not been discussed in the presented work so far.
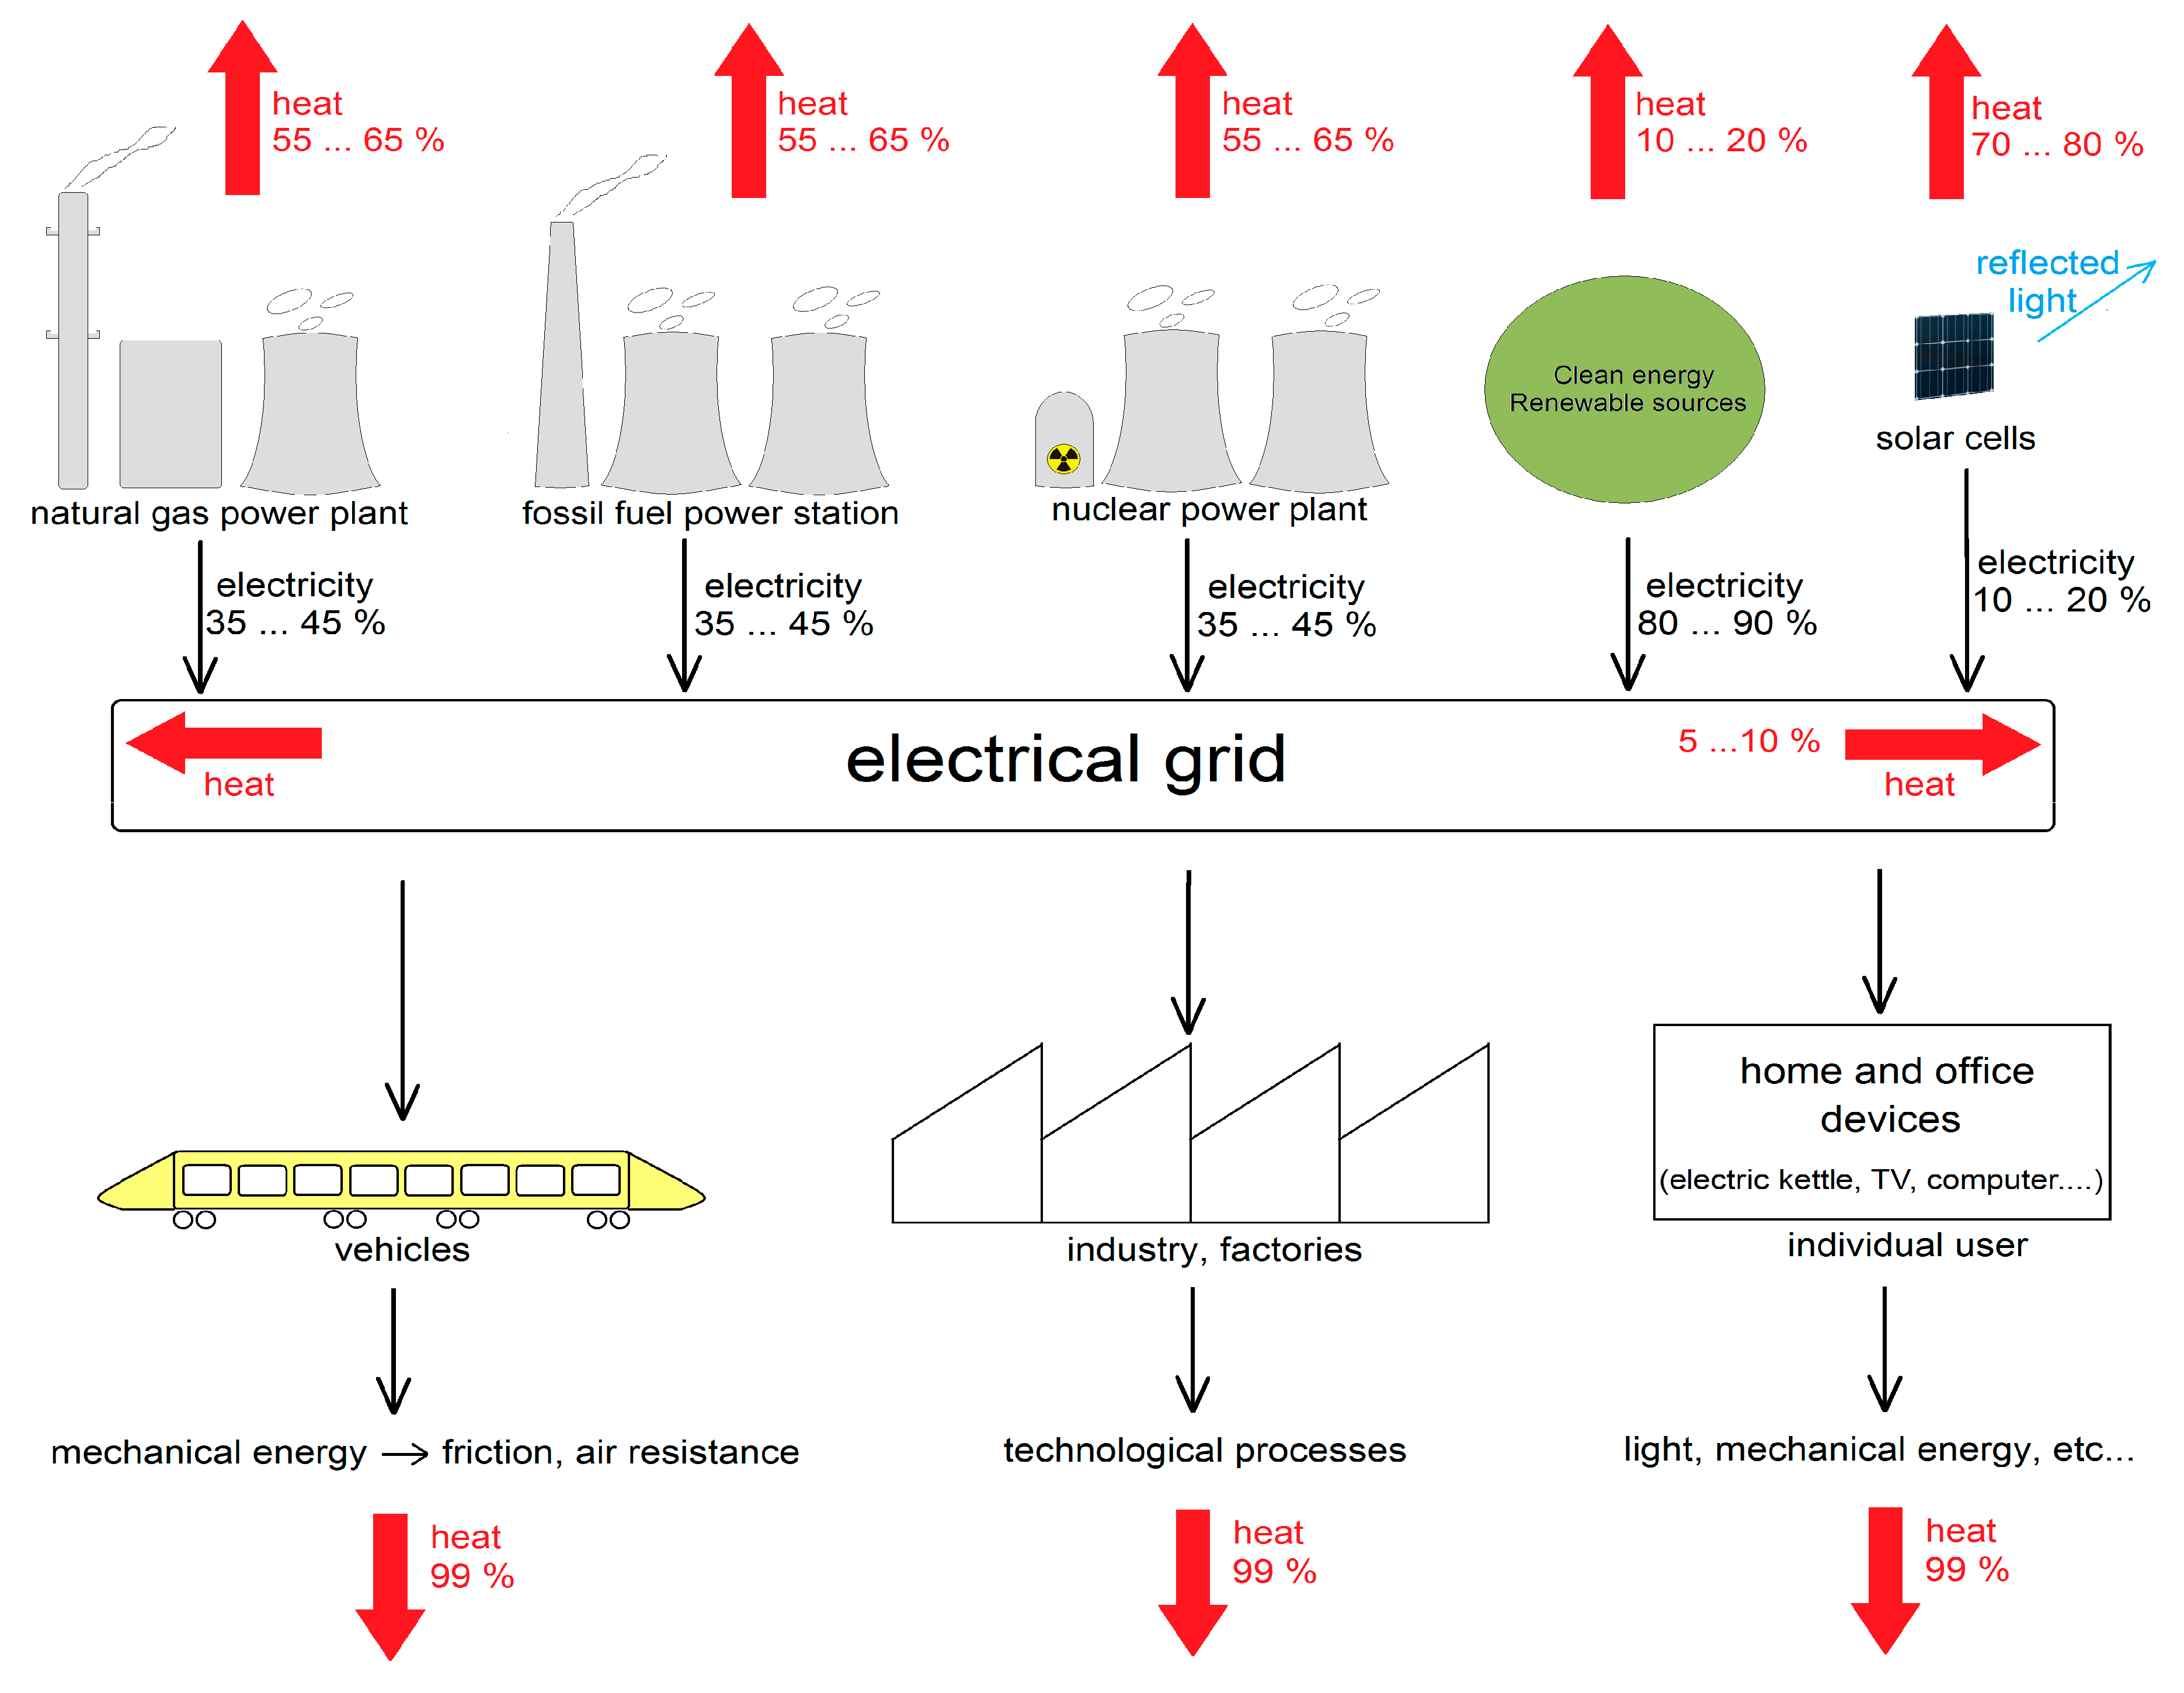
Nuclear and fossil fuel power plants are thermal power stations and have a maximum efficiency of around 40%. It means that during the production of electrical energy, around 60% of nuclear or chemical energy in fossil fuel is converted to heat energy and is emitted directly into the atmosphere and water (seas, lakes, rivers). Thus, most of the energy contained in any fuel is lost, but there is currently no technically more efficient way to generate electricity. Unfortunately, that also applies to the combustion of biofuels. Wind and water power plants have much higher energy efficiency, and the production of electricity is accompanied by a low heat emission. Much more information about the energy conversion efficiency in thermal power stations is presented in the papers [
5,
6,
7].
However, regardless of the way how electricity is produced, almost all electricity is ultimately turned into heat. It may seem surprising, but the following analysis proves this thesis. Electrical energy is distributed to different electricity consumers—factories, buildings, hospitals, railway electrification systems, etc. For example, any computer consumes electrical power and uses it to perform calculations, which is accompanied by heat production in semiconductor components (microprocessors, transistors, diodes, resistors). In practice, considering the field of physics, all the electric power in any computer is finally converted to heat. In a fridge, an electric motor drives a heat pump, which pumps out heat from inside the fridge to the outside. According to the principle of energy conservation, the heat energy released into the atmosphere (outside) is equal to the sum of heat energy collected from the fridge interior and the consumed electricity. A very similar situation occurs in any device. While an electrical train moves, electric motors cause acceleration driving at a constant velocity and partial energy recovery during braking. When the velocity of the vehicle is constant, all the consumed electrical energy compensates the work of friction forces in mechanical components (in bearings, etc.) and of air resistance forces. The friction in the components causes their heating, and air resistance causes the heating of the train’s surface and air. The same situation occurs in cars. In a modern petrol engine, the chemical energy in the fuel is converted to heat (about 60%) and useful mechanical energy (about 40%). All mechanical energy is used to compensate friction forces and air resistance, so always a heat is produced. Thousands of various devices and machines can be considered in which the energy would finally be converted into heat—similar to what it is shown in
Figure 1.
Consequently, sooner or later, almost 100% of electrical energy or chemical energy in fuels is finally converted to heat energy. To determine the global heat production, it is necessary to calculate the global production of electricity and petrol fuels.
2. Energy Market
The right energy structure and the increase in energy efficiency are the key issues on the way to the transformation in the field of energy, which is to ensure a safe future for all [
8,
9,
10,
11]. The current way of generating energy is associated with high greenhouse gas emissions because it is based mainly on fossil fuels and the inefficient use of traditional bioenergy, especially in developing countries [
12,
13,
14,
15,
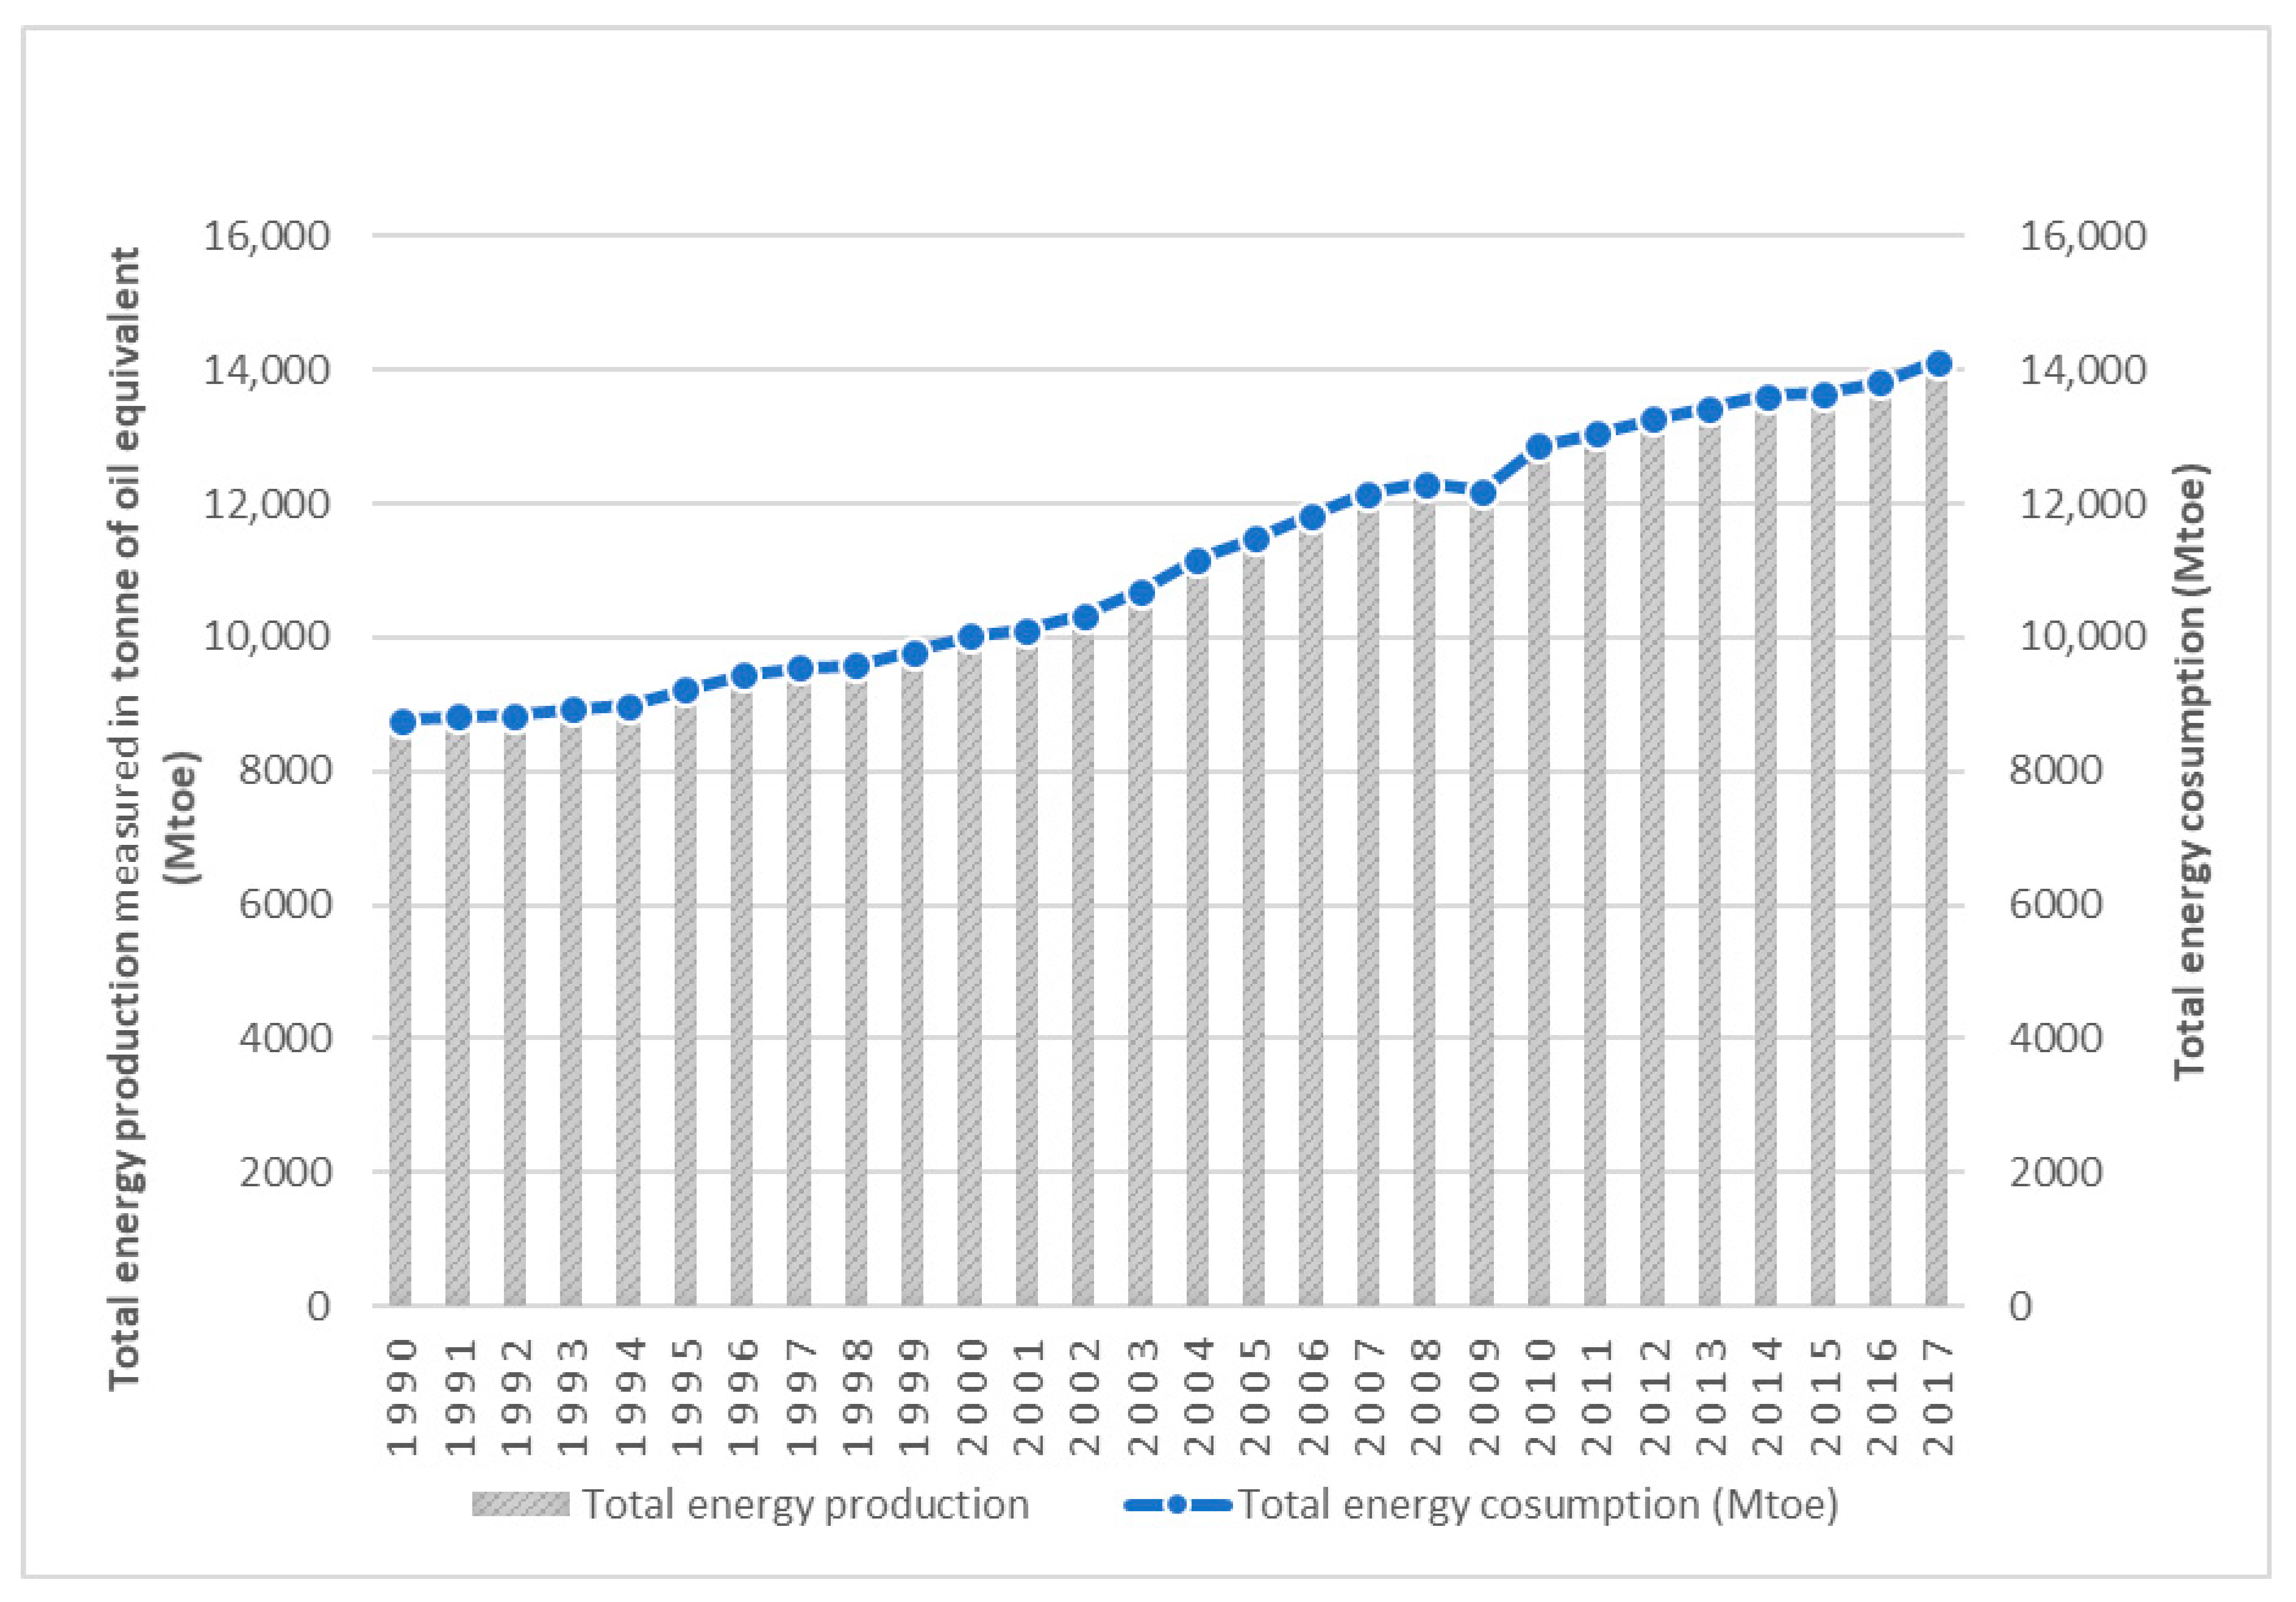
16]. Besides, the world’s demand for energy is growing, which is largely due to the economic growth that drives global energy consumption. Rapid growth occurs in developing countries, such as China and India, while in countries belonging to the OECD (The Organisation for Economic Co-operation and Development), for example, Germany or Italy, energy consumption is beginning to stabilize but is still at a high level. These tendencies are in line with the assumptions of the Singer report [
17], and this can also be confirmed by analyzing current trends, both in consumption and in energy production, as shown in
Figure 2.
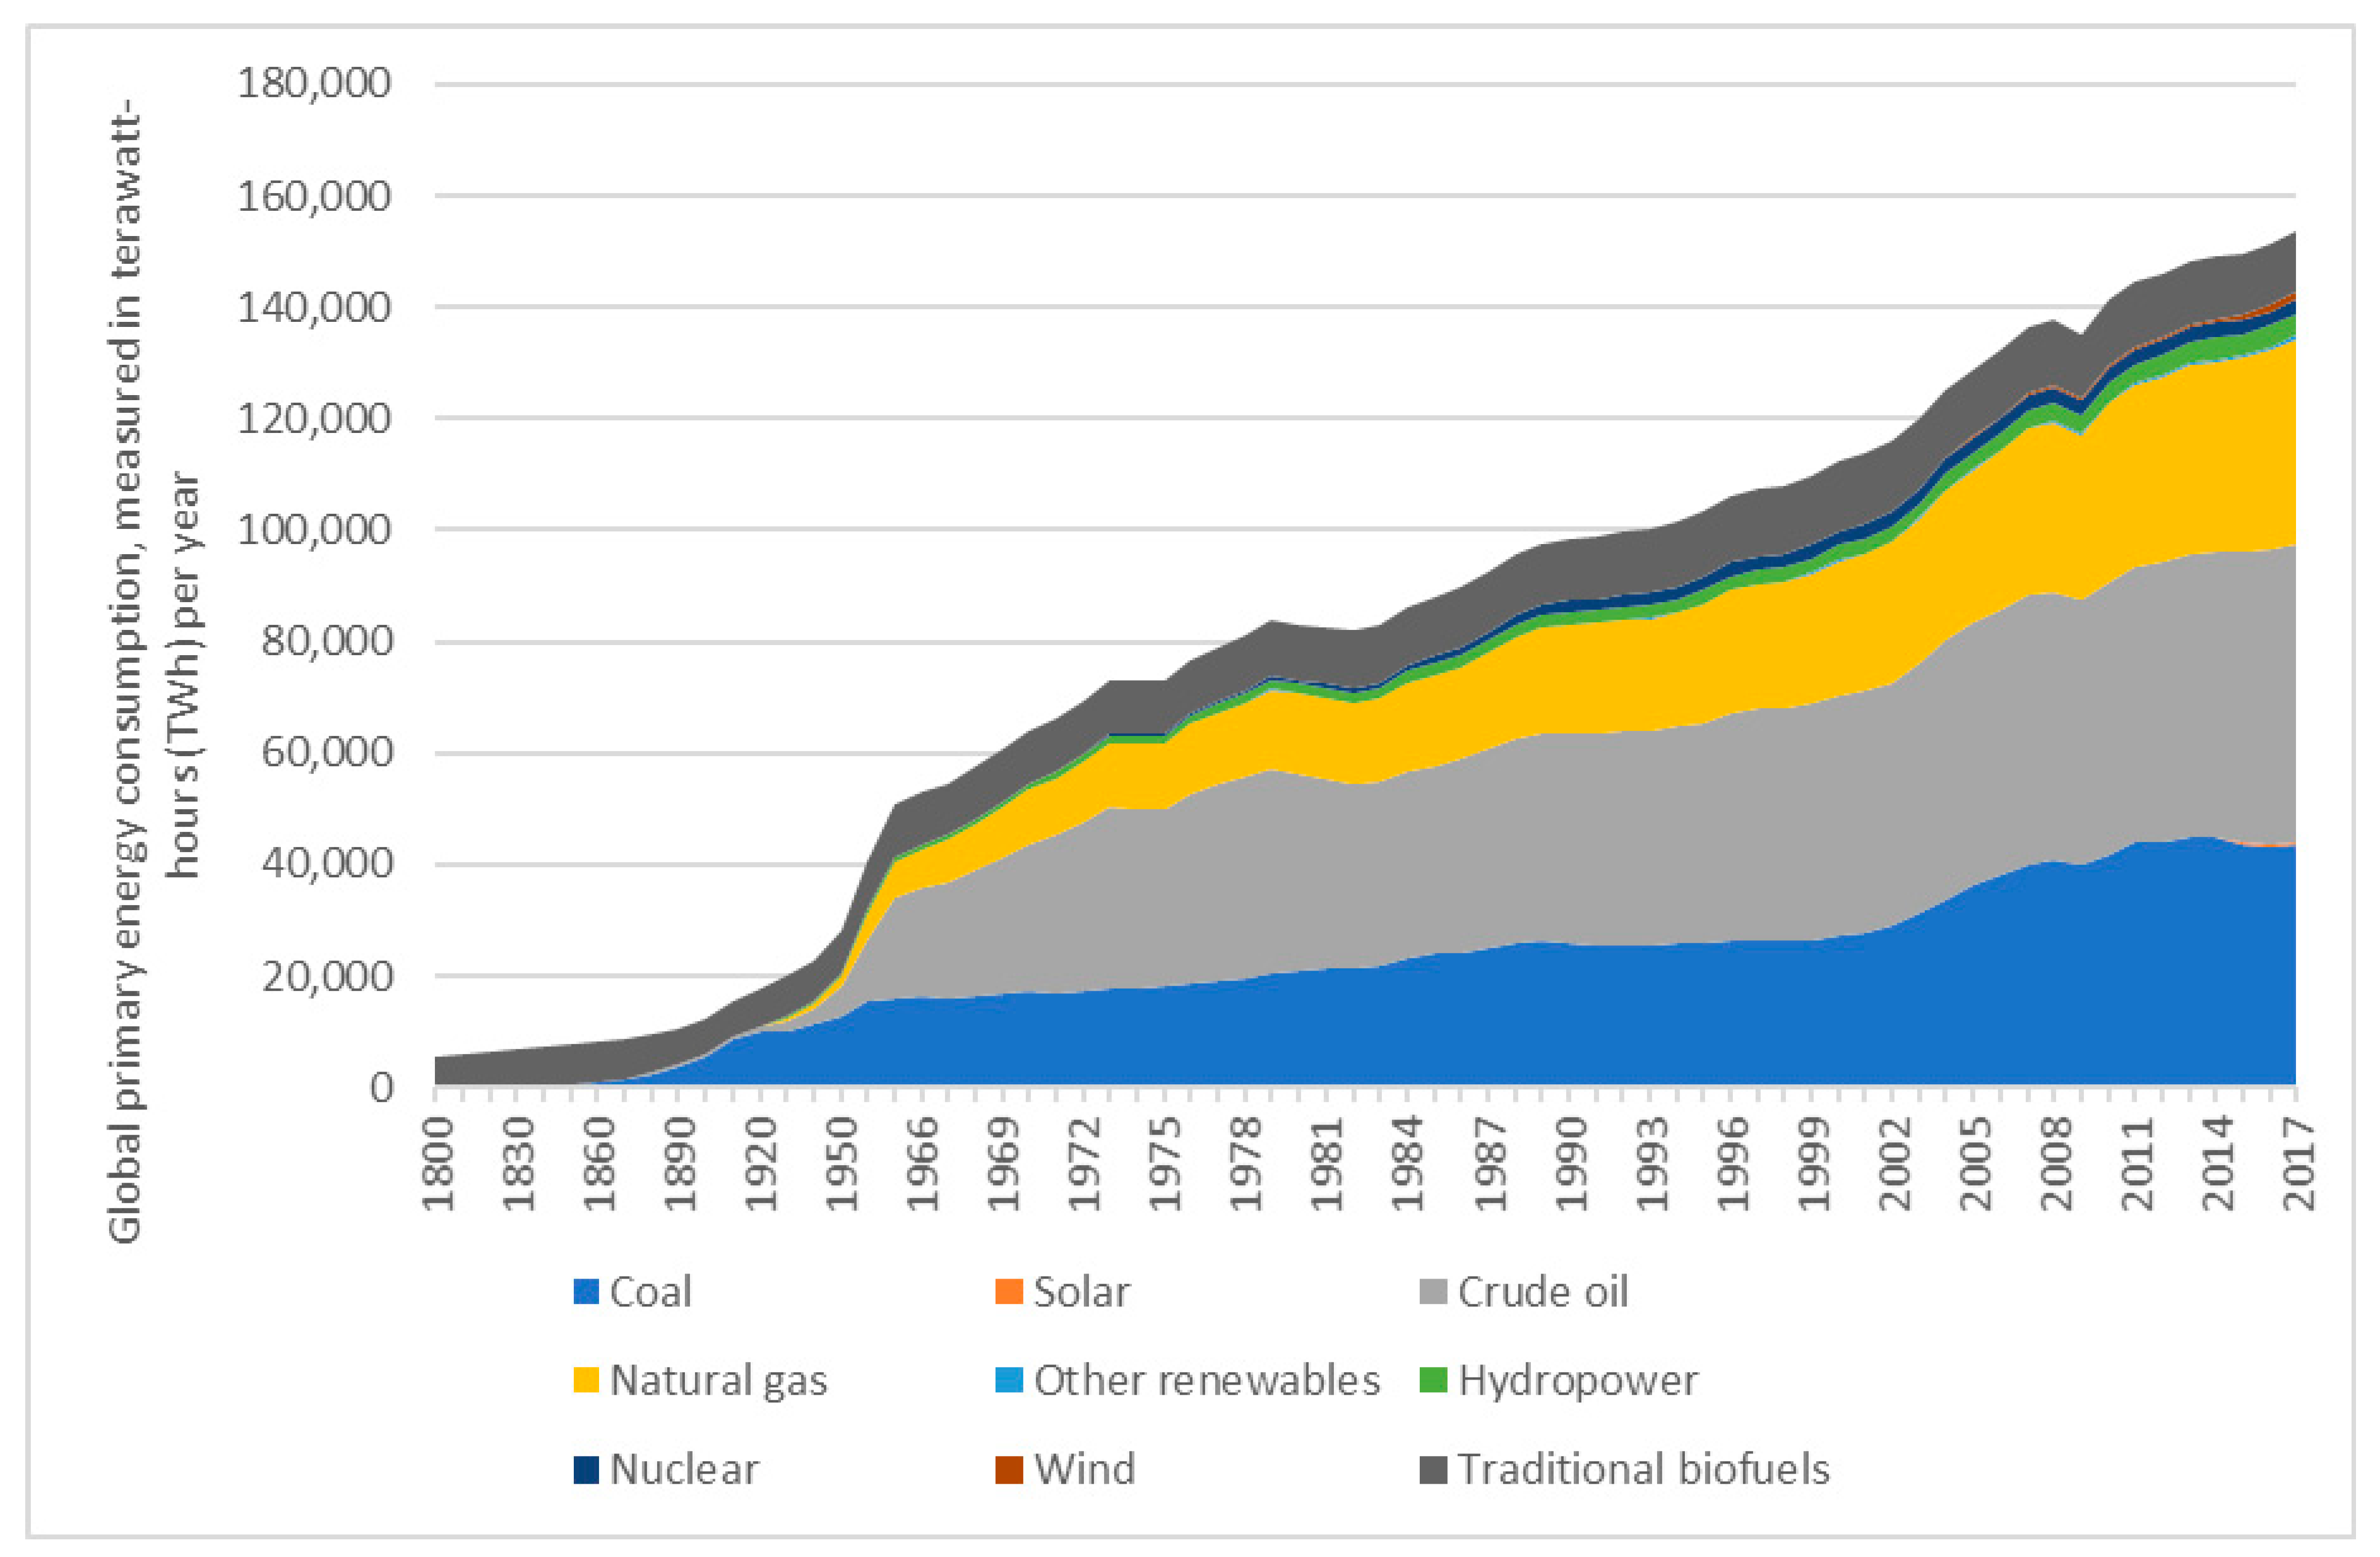
Let us first take a look at how global energy production has changed from a long-term perspective, both in terms of quantity and sources (
Figure 3).
In the 1800s, almost all of the world’s energy was produced by burning wood and other organic matter [
19]. Oil consumption started in the 1870s [
19]. Twenty years later, there were natural gas and hydroelectricity in the energy mix. Since 1900, coal consumption has increased significantly, and, now, it constitutes almost half of the world’s energy [
19]. In the 20th century, the energy mix changed significantly, coal took over traditional biofuels, and oil constituted up to around 20% of the energy market, and since 1960, the world has had nuclear electricity [
18]. Today, on the energy market, we have renewable energy sources—RES, not appearing until the 1980–1990s [
19].
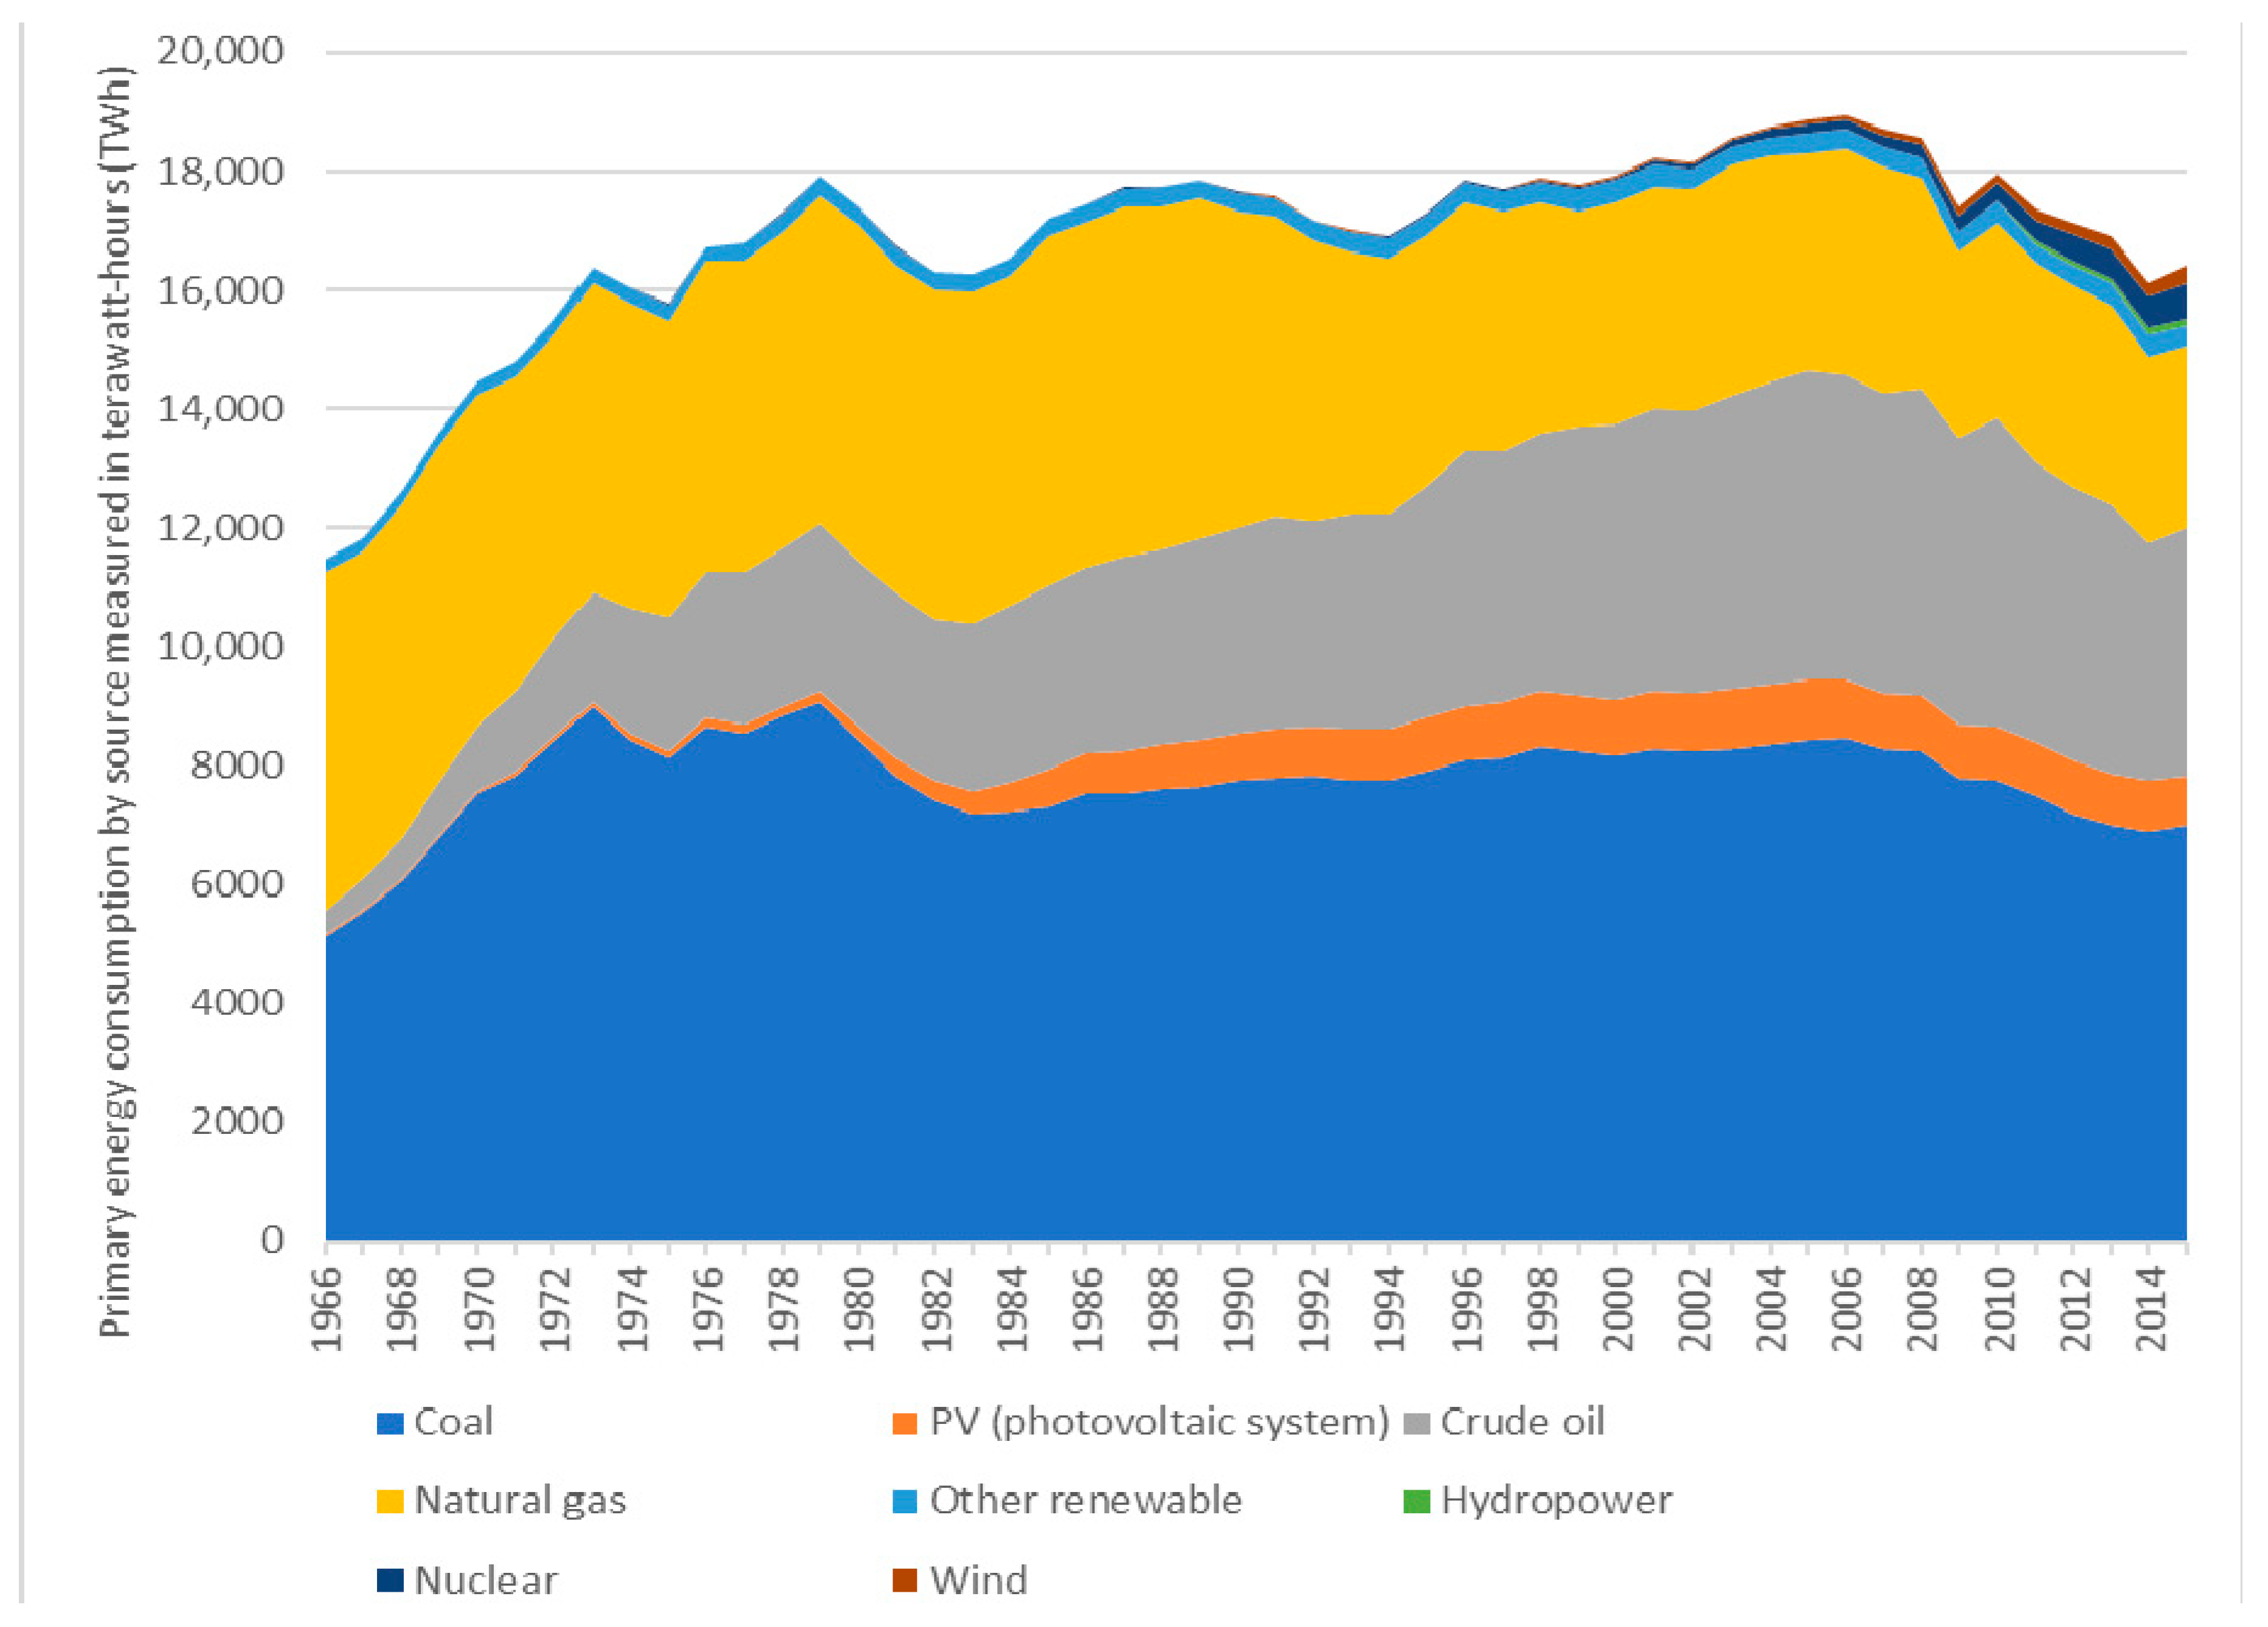
Besides, apart from analyzing the total consumption of primary energy, we could also compare the contribution of different energy sources. As shown in
Figure 4, changes in the energy mix are slow, so, mainly, fossil fuels dominate [
19]. Except for the emergence of nuclear electricity, the energy mix was fairly stable for at least fifty years [
18].
Changes in the structure of the energy mix began after 1997 [
20,
21] when the first EU regulations on energy from renewable sources appeared [
22,
23,
24,
25]. They were stated in the European Commission’s White Paper Energy for the Future—Renewable Energy Sources RES (December 1997). In 2001, the European Parliament and the Council adopted Directive 2001/77/EC on the promotion of electricity production from RES on the internal market, which determined the share of RES in total electricity consumption by 2010 (replaced by Directive 28/2009/IN). A breakthrough in the development of RES took place in March 2006, after the publication of the Green Book [
26].
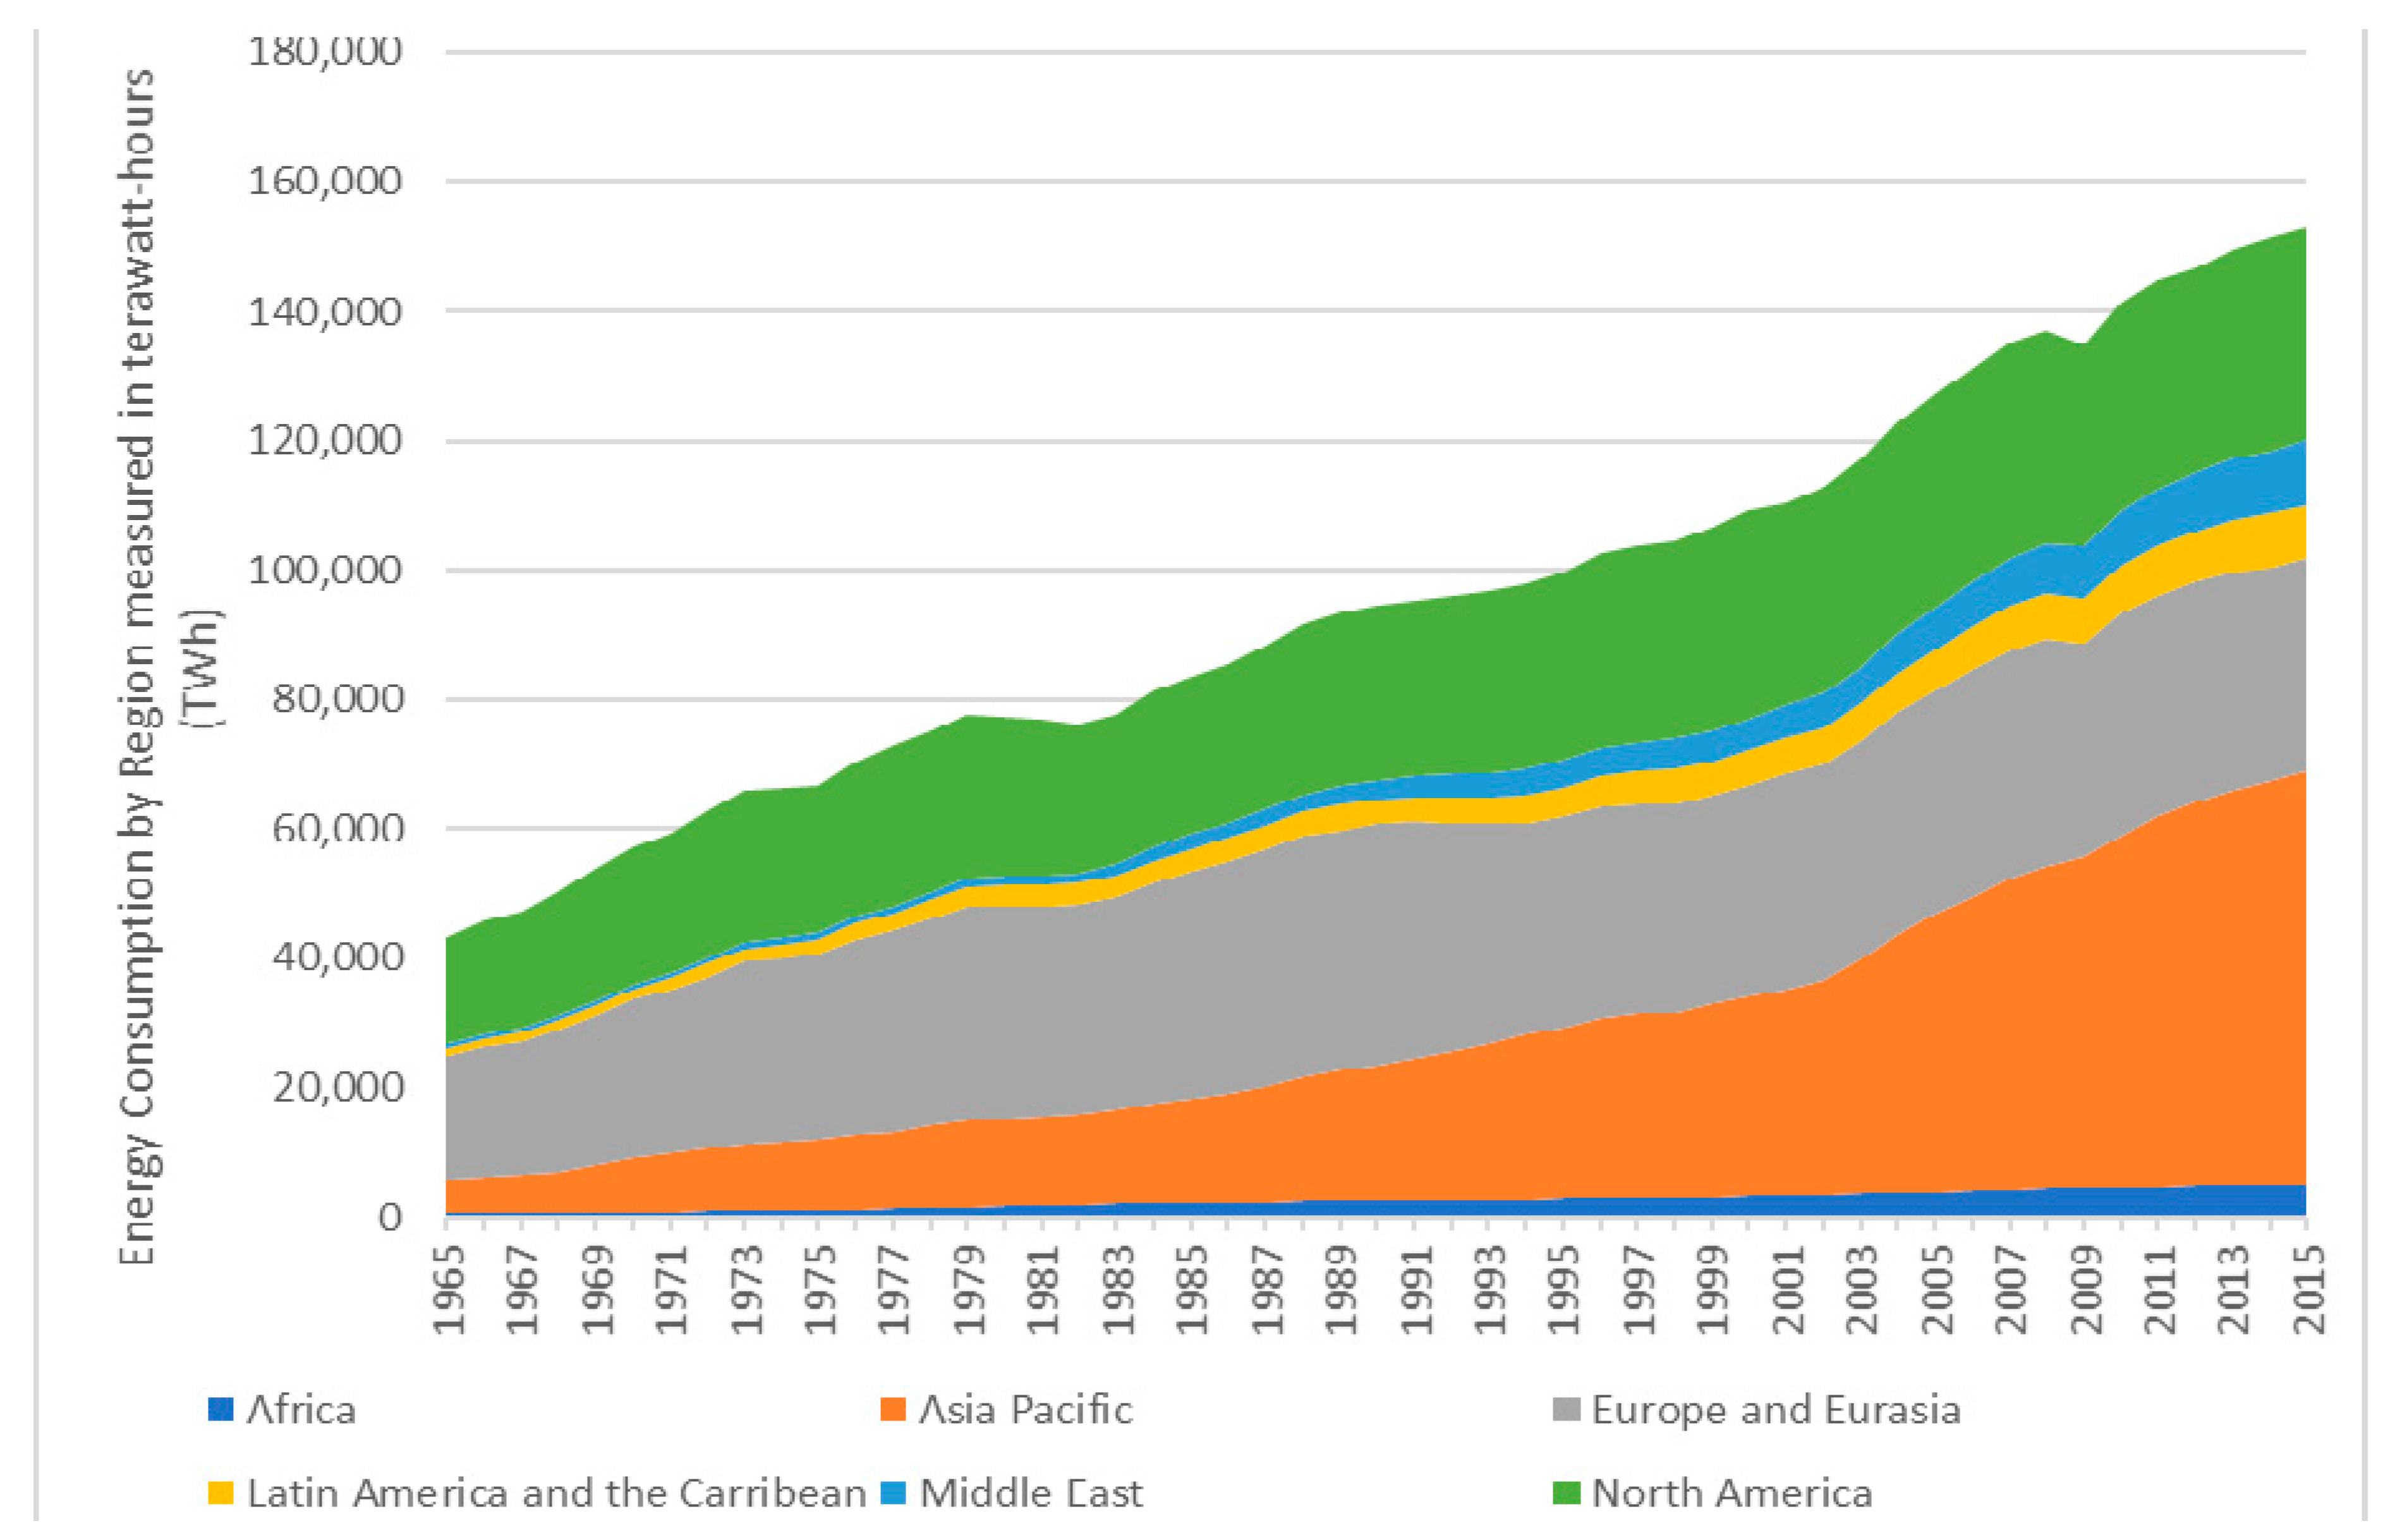
Figure 5 shows primary energy consumption from 1965–2017 in continental regions [
19].
In 1965, most of the total energy was consumed in North America, Europe, and Eurasia. In total, they accounted for over 80% of global energy consumption. Consumption in other parts of the world has been increasing, most dramatically in the Asia Pacific. In 2015, Asia Pacific was by far the largest regional consumer. The total consumption (about 43%) was the same as in North America, Europe, and Eurasia combined [
19]. The Middle East used 7%, Latin America 5%, and Africa 3% [
18,
19].
In 2017, the production of energy from coal increased due to China. Higher energy prices in the world had caused a drop in oil and gas production in the United States. Energy production in the European Union decreased due to moderate growth in energy consumption, lower primary energy production (nuclear and hydro), depletion of oil and gas resources, and climate policy, which ultimately means giving up coal. Large oil and gas exporting countries, such as Russia, Iran after international sanctions, Canada or Nigeria, as well as fast-developing countries (India, Indonesia, Turkey, and Brazil), were the main energy donors. In 2017, total consumption was at 567 EJ (EJ = exajoule = 10
18 joules), and it is forecast that by 2020, there would be a 10% increase [
19].
Prices can have a big impact on the choice of energy sources. While comparing costs between sources, it is important to have relative prices [
19]. In the literature, the levelized cost of electricity (LCOE) is used [
27]. The concept of LCOE is defined in the following way:
it measures the cost of living divided by energy production,
it calculates the current value of the total cost of construction and operation of the plant during the assumed period of use,
it allows comparison of different technologies (e.g., wind, solar, natural gas) with uneven life span, project size, different capital costs, risk, return, and capacity [
27].
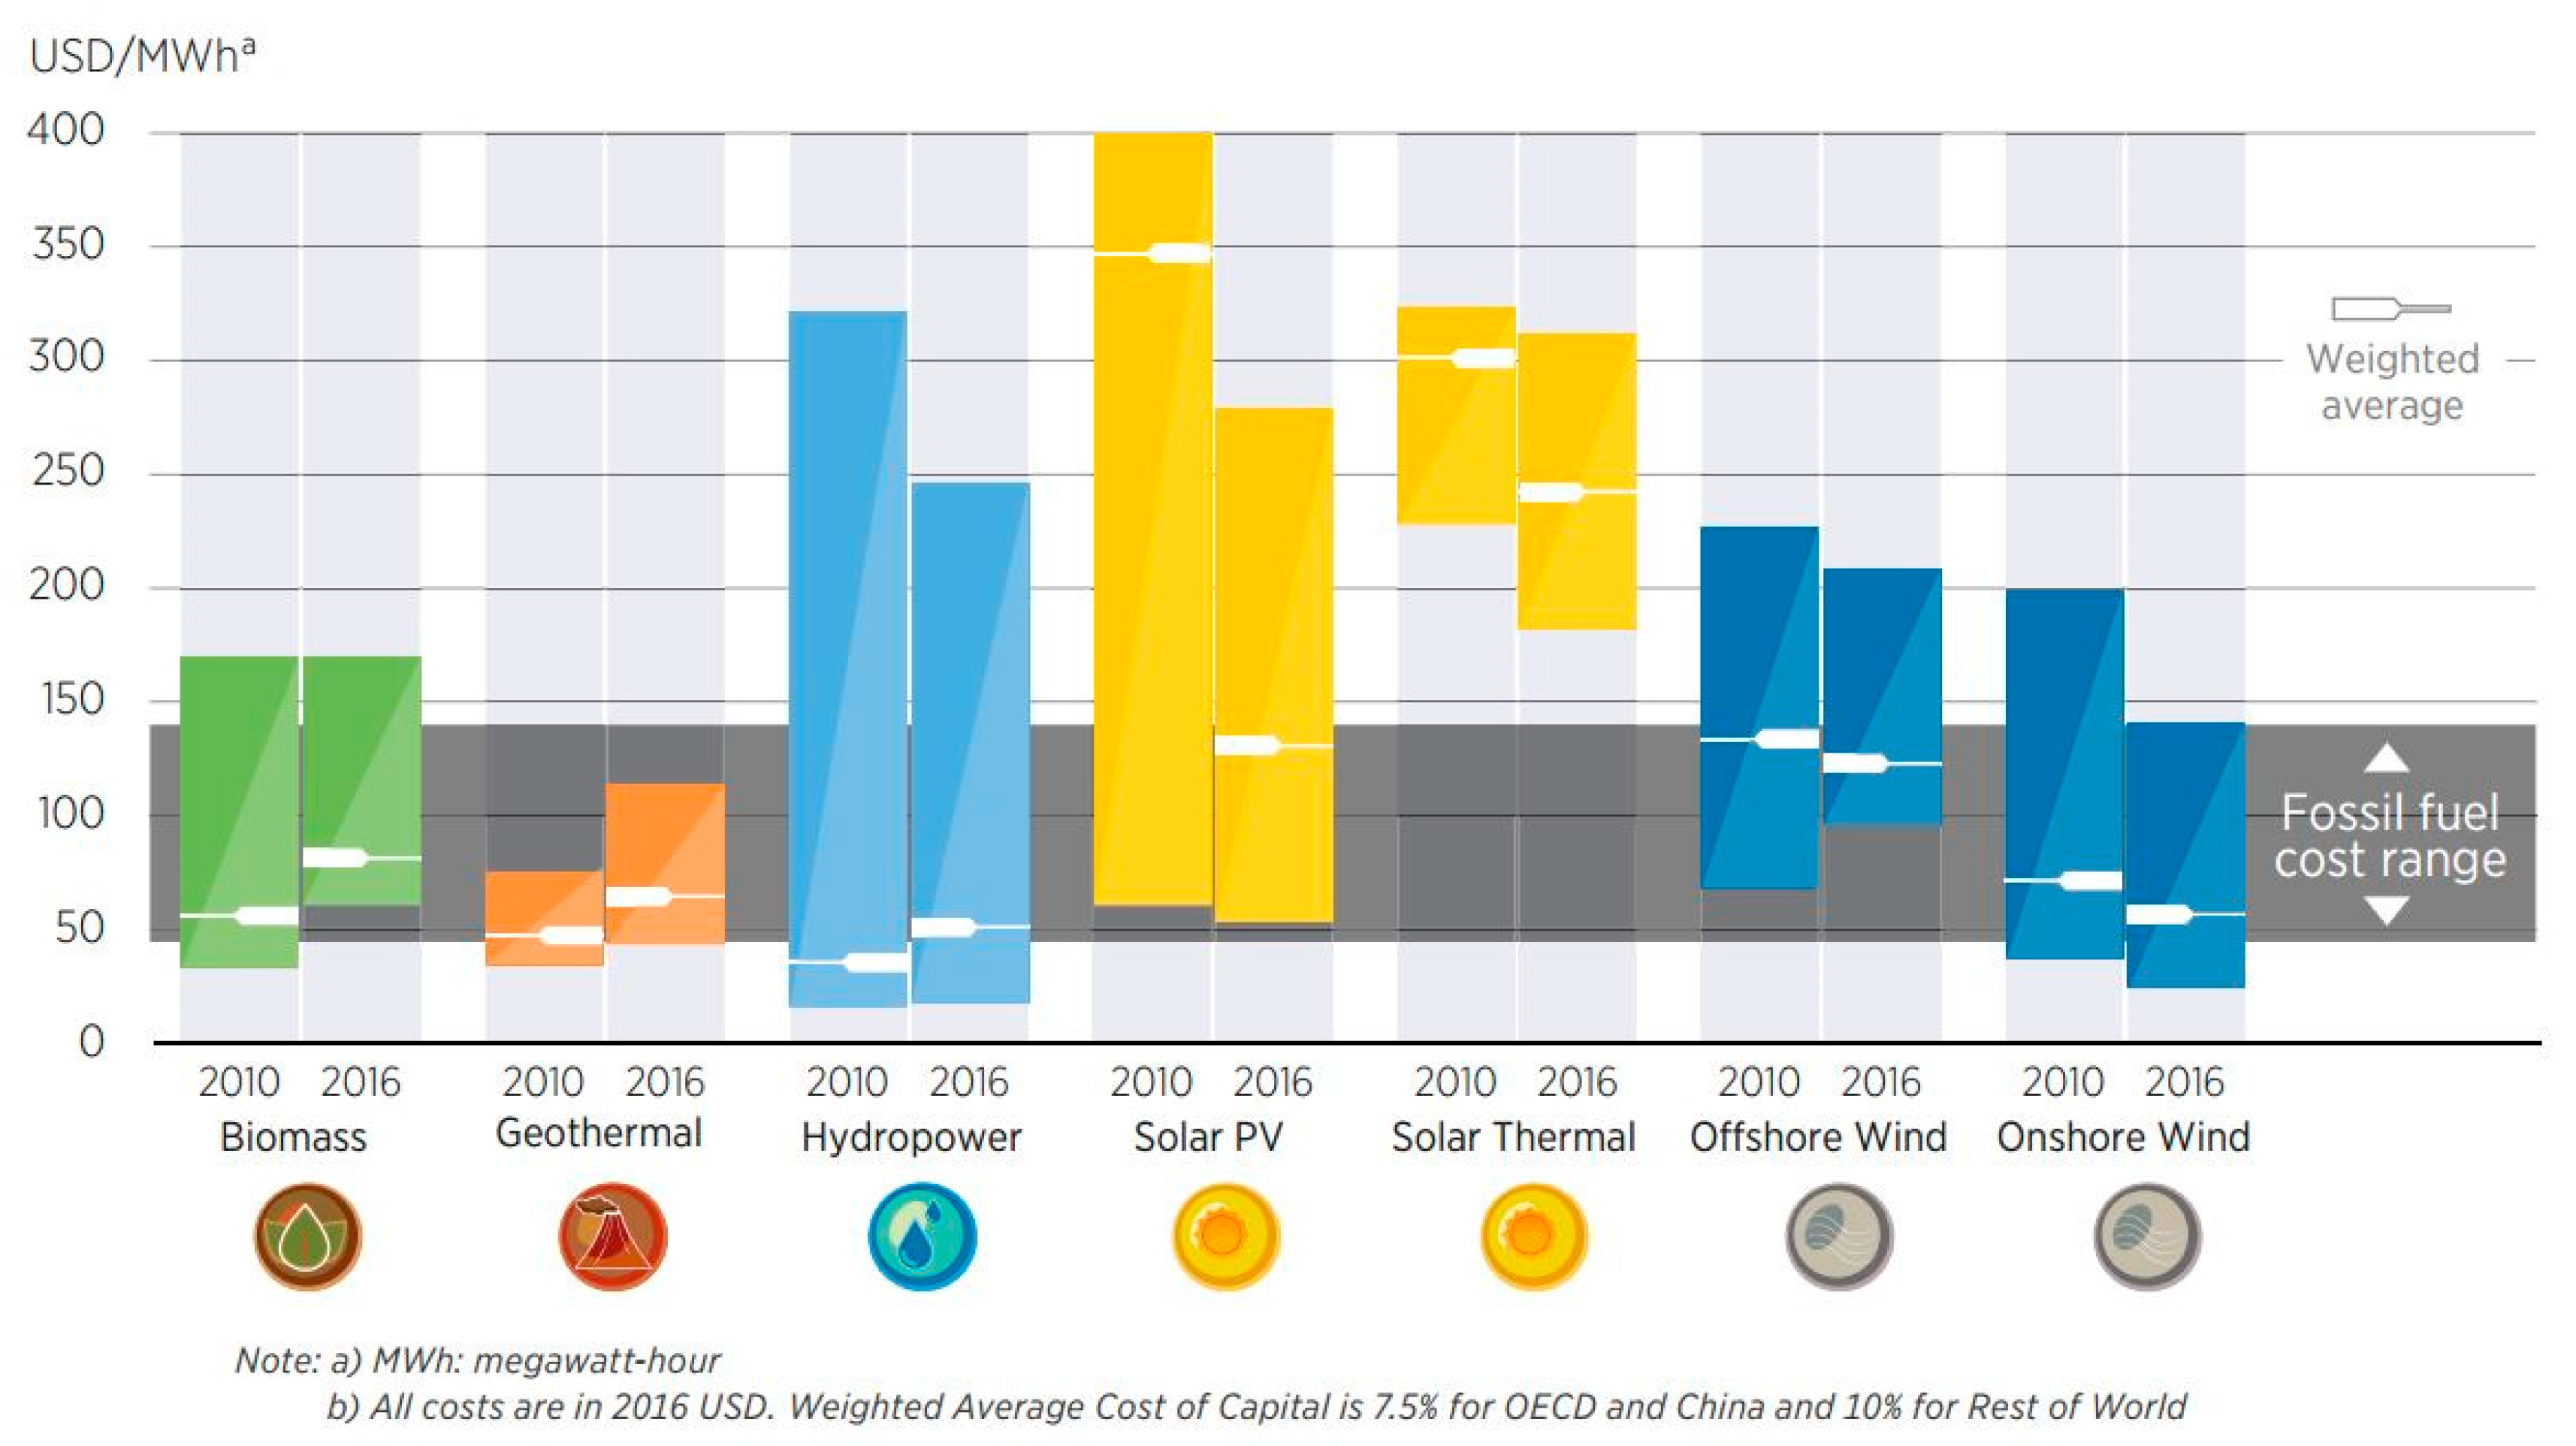
Figure 6 shows the levelized cost of electricity (LCOE). The cost range is represented on the column chart for each technology. The white line in each of them represents the global cost of each technology. The average range of fossil fuel costs is shown as a gray column. In this chart, it is shown that, in 2016, most renewable technologies were in a competitive range to fossil fuels. The key exception was the thermal solar radiation, which remained about twice as expensive, but began to decrease [
19]. Hydropower is the oldest renewable source. In this technology, the price is low. Analyzing how the average cost of technology changed in the years 2010–2016, we can see that the cost of solar photovoltaic system dropped significantly [
19]. This reduction of cost in photovoltaic cells has been deep over the past few decades. The price of solar photovoltaic modules has decreased more than 100 times since 1976 [
19].
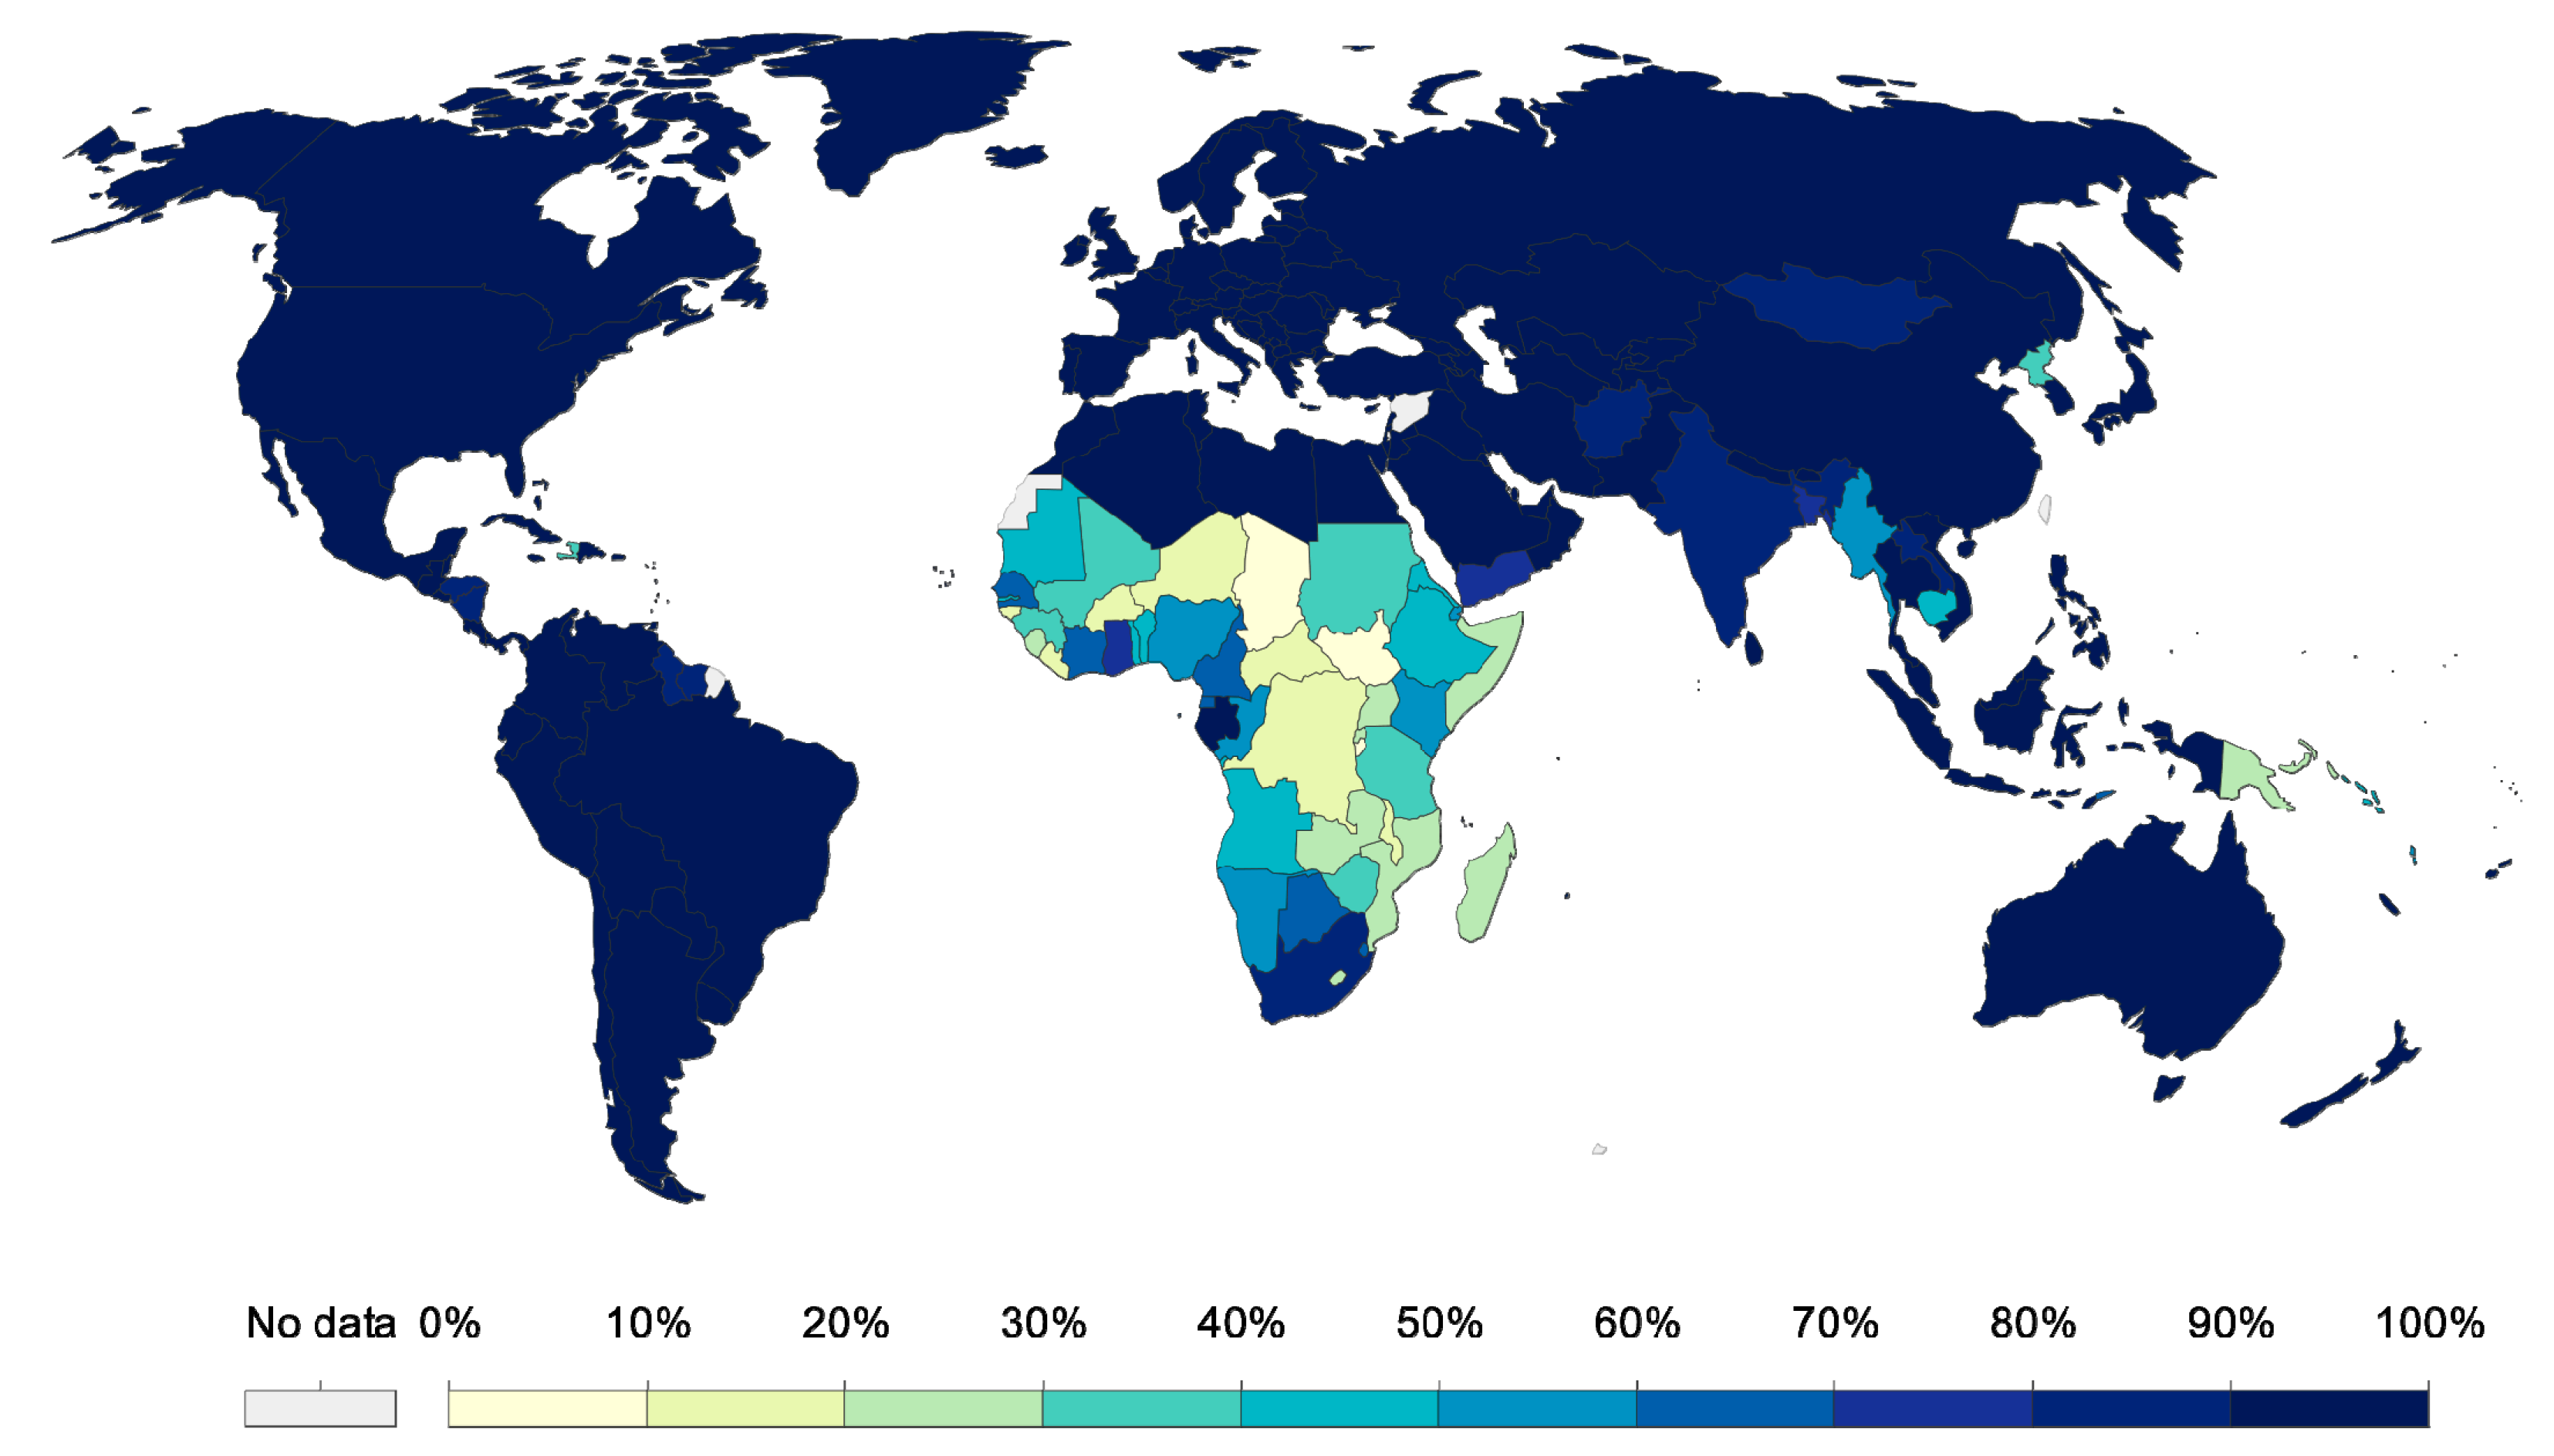
Measuring the number of people with electricity access is a very important social and economic indicator. We think that the growth of population has caused an increase in energy consumption.
Figure 7 shows that the percentage of people with access to electricity has increased at a global level [
19].
In 1990, about 73% of the population had access to electricity, and this level increased to 85% in 2014 [
19]. High-income countries typically have access between 95–100% [
19]. The growing global share was, therefore, driven by increased access in low- and middle-income economies. In many countries, this trend has developed, for example, access in India has increased from 45% to 80%, and in Indonesia, it has increased to 97% from 60% in 1990 [
19]. While the trend is upward for most countries, there are some countries where this access is very low, for example, only 8.8% of Chad’s population has electricity access. Therefore, we can assume that this factor will increase, and thus also energy consumption, in the future.
3. Materials and Methods
The structures of the energy market and total energy production are important to determine the global heat emission. While producing useful energy, as it is shown in the introduction, heat energy is emitted (as an adverse side effect)—Equation (1). Moreover, sooner or later, almost 100% of that useful energy—electrical energy or chemical energy in fuels—is finally converted to heat energy. Because average efficiency of a thermal electric plant is about 40% [
5,
6,
7], most of the primary energy (chemical energy in coal or natural gas, nuclear energy in nuclear fuel, etc.) is converted directly to heat. Engines in cars, where chemical energy in petrol is converted to mechanical energy, have similar efficiency. The results in
Figure 2 show that the values of global energy production and energy consumption are very similar—they are approximately the same. Because the global annual useful energy production is known (
Figure 2 and
Figure 3), taking the efficiency about 40%, total annual energy produced on the Earth could be written by Equations (1) and (2). Unfortunately, as it is shown in
Figure 3, the amount of energy produced by renewable sources is still very low on a global scale. Therefore, it is reasonable to adopt the average efficiency of the energy production process at 40%, as in thermal power plants, because this dominates. The total power produced by our civilization on the Earth is determined by Equation (3).
where
Euseful—annual useful energy production (electricity, motion, etc.)—it is given in
Figure 2 and
Figure 3,
Etotal—total annual energy, which is converted to heat (as an adverse side effect) and useful energy,
Eheat—annual heat energy production,
Ptotal—total power produced on the Earth (in Watts). All energies are in joules per year.
Based on the global energy production of useful energy (
Euseful), it is possible to estimate the total energy (heat energy and useful energy), which is also finally converted to heat in consumers. At this point, the question arises whether the value of the calculated
Etotal (in global terms) is high, low, significant, or insignificant. To answer this question, the total power produced on the Earth would be compared to the total solar irradiation reaching the Earth’s surface. It is presented by factor n in Equation (4).
where
n—the ratio of total power produced on the Earth to the power of solar irradiation hitting the Earth’s surface,
PGND—solar irradiation power hitting the Earth’s surface (the ground).
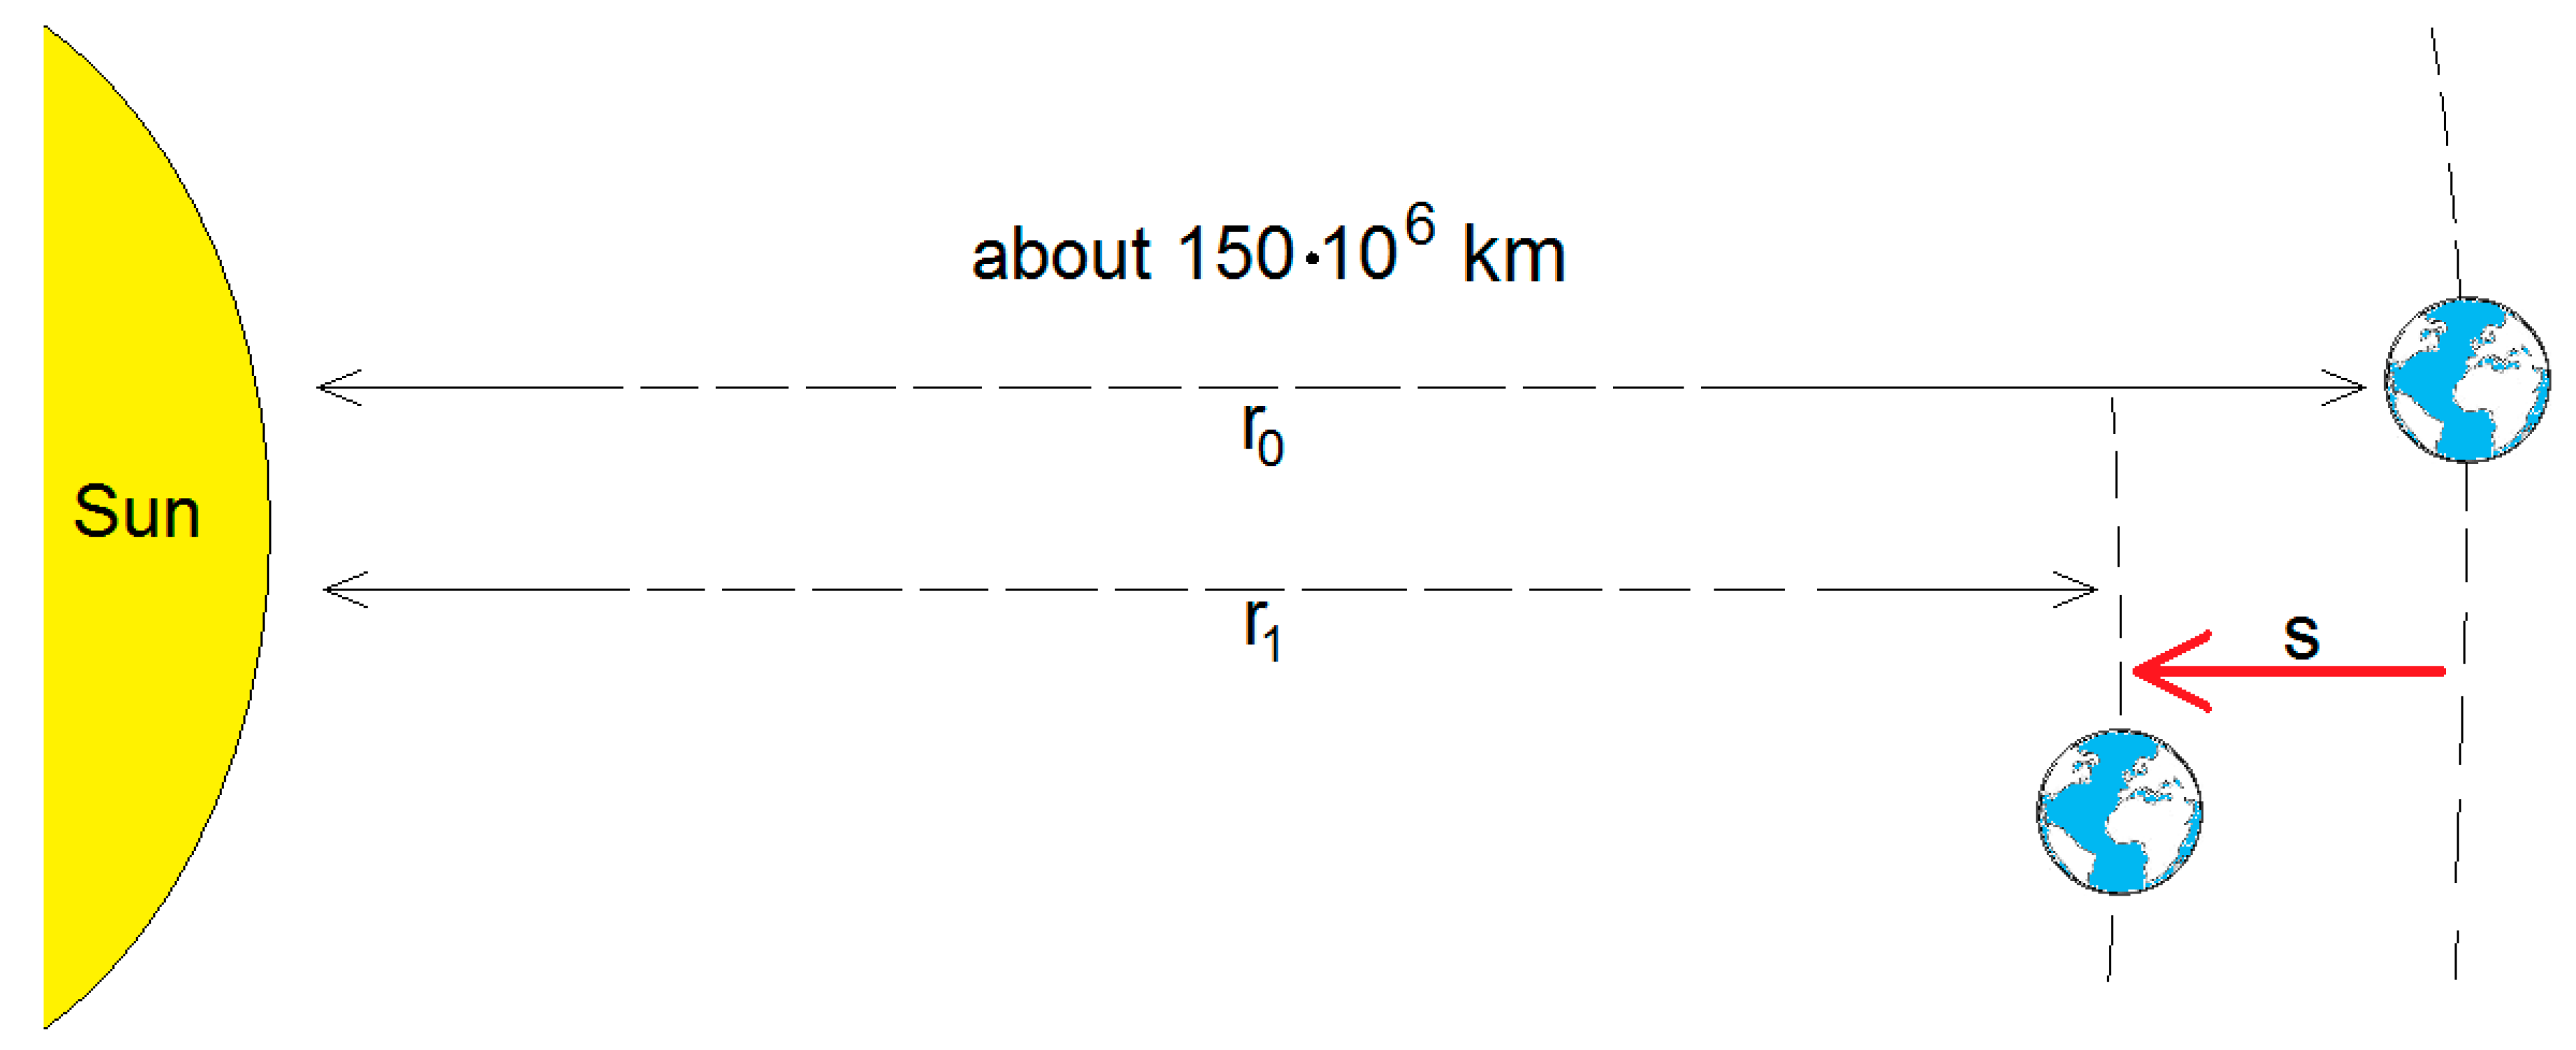
The heat produced on the Earth combines with the energy supplied from the Sun. Consequently, these two energies together cause the energetical effect as if the Earth was a little closer to the Sun. To illustrate this effect, we imagined the Earth before the industrial revolution (before the 19th century) in orbit with a radius of
r0—
Figure 8. Nowadays, additional heat emission causes an effect of the seeming shortening of the Earth’s orbit to a radius of
r1.
The seeming shortening of the Earth’s orbit is given by Equation (5).
Sun radiance, it means the radiant power per unit area emitted over all wavelengths and all directions (watts per square meter) of the Sun’s surface area, is given by the Stefan-Boltzmann law [
8]—Equation (6). The total power emitted by the Sun is given in Equation (7).
where:
R*—Sun radiance—power emitted by one square meter of the Sun’s surface area (W/m2)
PSun—total power emitted by the Sun (Watts)
ASun—Sun’s surface area (m2)
T—the temperature of the Sun’s surface
σ—Stefan-Boltzmann constant 5.67·10−8 (W m−2K−4)
The sunrays are emitted over all directions from the Sun. As we move away from the Sun (the distance from the Sun increases), the intensity of light decreases. For the distance “
r” from the Sun, the solar radiation strikes the surface (sphere) whose area is equal to 4
πr2. The surface power density (called also solar constant, flux density) for the distance “
r” is represented by Equations (8)–(11).
introducing the constant “
k”, we obtain:
where
Pd—power density, solar constant, power per unit of surface reached to place at a distance of “
r” from the Sun in a unit of W/m
2,
r—distance from the center of the Sun (in meters)
Finally, the surface power density for the point at a distance of “
r“ from the Sun is inversely proportional to the square of the distance. Because the mean distance of the Earth from the Sun is about 149.6 × 10
6 km [
9], the surface power density above the atmosphere of the Earth is about 1380 W/m
2, theoretically based on Equation (9), and about 1366 W/m
2 in reality [
10].
4. Results and Discussions
Global useful energy produced on the Earth (
Figure 2) in 2000 was equal 10,016 Mtoe (419.35 × 10
18 J), and in 2017 was equal 14,080 Mtoe (589.50 × 10
18 J). Total produced energy (heat + useful energy) is given in Equation (12) (transforming Equation (2)).
The Sun always illuminates the surface of the Earth seen as a wheel. Total power of the solar rays reaching the top of the Earth’s atmosphere (Equation (13)) can be computed by multiplying the surface power density (Equation (9)) and illuminated Earth’s surface—the wheel with a radius of 6378 km [
9]. Very rare phenomena, such as the solar eclipse, are omitted.
where
REarth—radius of the Earth,
PSE—the power of the solar irradiation reaching the top of the Earth’s atmosphere.
This result is confirmed by the Authors in work [
11]. Around 8.1 × 10
16 W of solar radiation passes through the atmosphere and arrives at the surface of the Earth, which accounts for 47% of the solar energy that reaches the Earth [
11]—Equation (14).
where
PGND—solar irradiation power hitting the Earth’ surface (the ground).
The “
n” ratio (total power produced on the Earth to the power of the solar irradiation ratio) is obtained in
Table 1.
Taking Equations (11) and (14), (15) could be written as:
where
PGND(
r)—solar irradiation power hitting the Earth’s surface (the ground) as a function of the distance between the Earth and the Sun.
Next, we introduced the radius
r0 of the actual (real) orbit of the Earth and the hypothetical radius
r1 of the orbit, which is shorter and corresponds to a little higher solar power. It means the heat emission causes the effect of the seeming shortening of the Earth’s orbit to a radius of
r1. Because the
PGND is inversely proportional to the square of the distance (Equation (16)), it is possible to determine the hypothetical radius
r1 (Equations (17)–(19)). Finally, the seeming shortening of the radius of the Earth’s orbit is given by Equation (20).
where
r0—radius of the actual (real) orbit of the Earth,
r1—radius of a hypothetical orbit where the little higher solar power is the equivalence of the total energy produced on the Earth,
s—seeming shortening of the radius of the Earth’s orbit.
In conclusion, the heat emission as a consequence of energy production on the Earth gives the same effect as shortening the radius of the Earth’s orbit by about 31,000 km in 2000 and about 43,300 km in 2017 with respect to the time directly before the industrial revolution (before the 19th century).
5. Conclusions
Total energy produced by our civilization on the Earth consists of the useful energy (electricity, mechanical energy, etc.) and heat, as an adverse side effect. Unfortunately, the various types of useful energy are finally converted to heat in machines, vehicles, and devices. The estimated calculations presented in this work prove that the total power produced by us was 0.0414% in 2000 and 0.0577% in 2017 of the global solar power reaching the Earth’s surface—it means reaching the lowest layers of the atmosphere, almost the ground. A significant increase in the “n” factor between 2000 and 2017 results from the increase in global energy production.
A few questions arise here—are these values high or low? Are they important? A very good determiner of the importance of these values is the value of cyclic, annual changes of the Earth’s orbit. The orbits of planets are not circles; they are ellipses. The eccentricity of planets is a very well-known natural phenomenon in the solar system. As a result of the elliptical trajectory of the Earth around the Sun, the solar light power density varies about 3.3% [
11], and that is over 50 times more than the “
n” factor in
Table 1. After inserting data into Equation (20), the total heat produced on the Earth causes an effect like a seeming shortening of the radius of the Earth’s orbit around the Sun by about 31,000 km in the year 2000, and about 43,300 km in the year 2017. Consequently, the seeming radius shortening (“
s” in Equation (5),
Figure 8) is about 2.4 (for 2000) and 3.4 (for 2017) times bigger in comparison to the Earth’s diameter (12,756 km). These distances are significant compared to the Earth’s dimensions, but, in the field of astronomy, they are very small. Taking into account that the average Earth-Sun distance is about 1496 × 10
5 km, the seeming shortening “
s” is 3455 times smaller (in 2017). However, the key factor in assessing the importance of the heat emitted during the global energy production in terms of climate impact is the comparison of the parameter “
n” to the natural changes of the solar light power density reaching the Earth. That power density varies about 3.3% cyclically during every year (the “
n” is about 50 times smaller), and this is why the total heat energy produced by our civilization has a small impact on the global warming in the time horizon of several dozen years. We can say that there would be a one-year increase of supplied energy by about 3.3% of the average solar energy once every 50 years. It would probably have significance over several hundred years. Therefore, the use of renewable energy sources makes sense regardless of their energy efficiency because the emitted heat during the generation of electric power in such sources does not significantly affect the climate. For example, photovoltaic solar cells have a low energy efficiency—a dozen or so percent [
28]. The fact that more than 80% of solar energy is converted into heat in photovoltaic panels should not be a limitation in their widespread use.


