Abstract
In recent years, most countries in the Middle East and North Africa (MENA), including Jordan, Morocco and Tunisia, have rolled out national policies with the goal of decarbonising their economies. Energy policy goals in these countries have been characterised by expanding the deployment of renewable energy technologies in the electricity mix in the medium term (i.e., until 2030). This tacitly signals a transformation of socio-technical systems by 2030 and beyond. Nevertheless, how these policy objectives actually translate into future scenarios that can also take into account a long-term perspective up to 2050 and correspond to local preferences remains largely understudied. This paper aims to fill this gap by identifying the most widely preferred long-term electricity scenarios for Jordan, Morocco and Tunisia. During a series of two-day workshops (one in each country), the research team, along with local stakeholders, adopted a participatory approach to develop multiple 2050 electricity scenarios, which enabled electricity pathways to be modelled using Renewable Energy Pathway Simulation System GIS (renpassG!S). We subsequently used the Analytical Hierarchy Process (AHP) within a Multi-Criteria Analysis (MCA) to capture local preferences. The empirical findings show that local stakeholders in all three countries preferred electricity scenarios mainly or even exclusively based on renewables. The findings demonstrate a clear preference for renewable energies and show that useful insights can be generated using participatory approaches to energy planning.
1. Introduction
Countries of the Middle East and North Africa are at an energy crossroads. Governments in these countries will soon need to address the continued increase in energy demand for the next few decades. Energy consumption in the region is projected to almost double by 2040 [1]. This increase in demand is largely due to expected population growth well into 2050 and beyond [2]. At the same time, countries in this region also face the challenge of addressing their high vulnerability to climate change, which has a strong social dimension [3]. In the medium term (i.e., until 2030), the power sector is set to undergo the most important change in the countries’ energy plans. In Morocco, awareness of this was reflected in the National Energy Strategy of 2009 and the updated version of 2015, which included the Moroccan Solar Plan (Noor). Under these plans, renewables-based installed capacity in the electricity sector is set to increase from 34% in 2015 to 52% by 2030 (20% wind, 20% solar, 12% hydro) [4]. Tunisia also put out a Solar Plan, in 2009, as well as an updated version in 2012; this was followed by the Tunisian Renewable Energy Action Plan 2030. Under these plans, renewables as part of the installed capacity for electricity generation are set to increase from 2% to 30% by 2030 (15% wind, 10% Photovoltaic (PV) and 5% Concentrating Solar Power (CSP)) [5]. Jordan has also established the National Master Strategy of the Energy Sector (2007–2020) as well as the National Strategy for the Development of Renewable Resources. Under these plans, 10% of electricity generation is to be based on renewable energy technologies (solar and wind) by 2020, increasing to 20% by 2025 [6,7]. The national plans in these three countries mean that the choices made today regarding the technologies that constitute the electricity mix will reverberate for decades.
The policies in these three countries signal a transformation of energy systems and tacitly a transformation of the interaction between society and these systems. Energy planning is an intricate exercise of balancing between different priorities and effects on different segments of society. As such, the different societal segments are local stakeholders in the energy planning exercise. Short to medium-term energy policies set the stage for long-term energy scenarios. To ensure that energy planning for future electricity systems corresponds to the needs and priorities of the different local stakeholders, it is important to capture societal preferences in a systematic manner.
Electricity infrastructures are technical systems that need to go in tandem with the societal systems of the populations they serve. Decisions about electricity infrastructures are made even more complex, given the technical challenge of matching electricity demand and supply at any point in time. There has been a growing appreciation of the necessity to better understand the relationship between sources of energy and societies, particularly in the MENA region [8]. Under the concept of “Energy Humanities”, such scholarship has gained ground in recent years, allowing for humanities and social sciences to investigate energy challenges against the background of anthropogenic climate change, thereby complementing natural sciences (which have long been dominant in energy scholarship) [9]. Within this academic trend, one particular strand of research has focused on transitions and has been generating a growing body of academic literature under the umbrella of Sustainability Transitions (ST). ST as a field of research has three main perspectives: socio-technical, socio-institutional and socio-ecological, which nevertheless share an understanding that transitions result from the interaction of dominant regimes with changing external landscape factors as well as emerging innovations [10]. The frameworks under ST [11,12,13,14,15] are designed to better understand the dynamics of what triggers a potential system reconfiguration and how such shifts may be hindered or facilitated.
This paper locates its contribution within the socio-technical perspective of the steadily growing ST literature. Nevertheless, in spite of the emergence of this field, especially in the last decade [16], its expansion into covering transitions in the Global South has been far less advanced and more recently been subject to several research caveats. These caveats have given impetus to exploring new research frontiers [17] with major relevance in the context of developing countries. However, the MENA region itself has barely been studied thus far.
Local stakeholder preferences of future electricity scenarios in particular are still understudied for this region. While renewables are “normatively” regarded as the cornerstone of decarbonisation, the degree to which reliance on renewables in future electricity systems is seen as desirable by local stakeholders is unclear. In light of this, the article attempts to answer the following research questions: what long-term electricity scenarios for the year 2050 do local stakeholders in Morocco, Jordan and Tunisia actually prefer? And what criteria are seen as most important in such scenarios? Various scholars have previously conducted studies using the core methods of this article, electricity scenario modelling and MCA. We can distinguish between two particular categories of these studies: MCA, with a view to energy (technologies) in different countries or regions or with a different time frame than the ones proposed here (1) and electricity scenarios for countries in the MENA region but without MCA (2):
- Indeed, Brand and Missaoui [18] developed five electricity scenarios combined with a stakeholder-based MCA in Tunisia, that is, applying the same methodology as the one undertaken here. However, their study was conducted against a horizon of 2030 instead of 2050. Several studies apply MCA methodologies for different countries but focus solely on energy production technologies, instead of electricity mix scenarios: Shaaban et al. [19] have studied Egypt, Bohanec et al. [20] Slovenia, Štreimikiene et al. [21] Lithuania and Promentilla et al. [22] the Philippines, for example. Other studies have developed scenarios displaying different electricity mixes in combination with MCA but not for the countries/region in question: Klein and Whalley [23] studied the USA, Santos et al. [24] Portugal, Strantzali et al. [25] a Greek island, Mirjat et al. [26] Pakistan, Santos et al. [27] Brazil and Atilgan and Azapagic [28] Turkey, for instance.
- Alhamwi et al. [29] sought to quantify an optimal mix of renewable power generation in Morocco, using a mismatch energy modelling approach with the aim of minimising the need for storage capacities. Damerau et al. [30] considered three alternative pathways, looking at energy efficiency, carbon intensity and energy exports from the MENA region and studied them with a focus on water demand. However, neither study involved local stakeholders in the development of distinct electricity scenarios against a certain time horizon and did not proceed to rank them based on stakeholders’ preferences with regard to different criteria. Rather, their studies evaluated the pathways against one single criterion respectively: the minimisation of storage capacities or of water use.
Based on the analysis of existing literature, we locate the novelty of our approach in the combination of selected theoretical approaches—which have so far mainly been deployed separately—within a new temporal and spatial scope. This approach contributes to an increasingly integrated research of both technical feasibility and social priorities, as a basis to develop robust transformation pathways. This article thus addresses the knowledge gap pertaining to participatory scenario development and MCA in Jordan, Morocco and Tunisia in the policy horizon of 2050 by looking more specifically at the extent to which local stakeholders in these three countries support the deployment of different electricity generating technologies and scenarios in the future, up to the year 2050.
This approach relies heavily on local stakeholders’ participation as a central component of the empirical investigation. The research adopts an understanding of energy transition as a socio-technical undertaking, the course of which would benefit from insights generated by empirical and participatory methods involving a broad spectrum of local stakeholder representatives. This required to develop a multidisciplinary approach that devised methodologies that merged natural science (mainly engineering) methods of electricity modelling with social science methodologies for achieving complementarity.
To answer the research questions, the article starts by presenting the scenario development and modelling method and proceeds by describing how stakeholder preferences were captured using MCA (Section 2). It moves on to presenting the results of the selected scenarios and their rankings in Section 3, which also highlights the top-ranked scenarios per country, provides a roadmap to achieve them and compares the results of all three countries. The discussion subsequently focuses on major findings and challenges (Section 4), culminating in a number of conclusions (Section 4.5).
2. Methods and Data
During workshops held in 2016 and 2017 on-site in the countries under review [31,32,33], about 25 participants per country developed, discussed and evaluated various scenarios of their respective country’s future power supply in 2050. To do so, an energy simulation model and an MCA were applied.
Discovering preferences of local stakeholders regarding electricity scenarios in 2050 was conceived as the exercise of the participatory building of visions and scenarios. To include different interests and perspectives, the group of stakeholders involved had to be decidedly heterogeneous, which could be ensured by involving local scientific partners in the workshop organisation. Stakeholders included representatives from academia, policymakers and private sector actors, as well as civil society representatives and Non-Governmental Organisations (NGOs). The participating organisations are listed in References [31,32,33].
2.1. Scenario Development and Modelling
The workshop participants developed scenarios of their respective country’s future power supply with the help of a stripped-down version of renpassG!S, an open-source energy system simulation software [34,35,36,37,38]. The full model’s main functionalities were included in this spreadsheet version. However, the utilisation order of dispatchable generation was pre-defined and its application allowed straightforward scenario inputs and an on-the-fly display of results.
During the development of the scenarios, all workshop participants were invited to state their expert judgment, their assessment about potential future developments and the view of the institutions they represented about their country’s future power system. All inputs to the model were adjustable during the exercise; however, the main focus was set on adjusting the installed capacity in 2050. The workshops’ intended aim was to develop technically feasible scenarios, not prognoses [39] (p. 59).
In order to reduce complexity and for methodological reasons [40] (p. 89), the countries’ future power systems were conceptualised as isolated systems without transmission links abroad. In the model, each country was split into four regions. Every region was represented by an hourly-resolved load curve and hourly-resolved meteorological data (based on References [41,42,43]), relevant for the modelling of the power generation from wind power, solar PV and CSP. Fluctuating, non-dispatchable renewable energy technologies (wind power, solar PV) were assumed to operate any time the natural resource would be available due to their marginal cost close to zero [39] (p. 245). The residual load was calculated according to the (lack of) production of fluctuating renewables on an hourly basis. It would have to be covered by dispatchable and partly-dispatchable generation technologies (e.g., CSP) and the utilisation of storage options. A scenario was considered to be functional once it was possible to cover the load for every hour of the target year. To calculate potential additionally required transfer capacity, the model compared the residual load in the regions of a country and the existing transmission grid infrastructure between the regions.
A major outcome from the model was the production of every technology in the system as defined by the workshop participants according to their personal assessment, experience and expectations, simulated in an hourly resolution for the year of analysis. Regional values were aggregated to national totals, which again were automatically translated into direct emissions of all energy sources and of the entire system. Additionally, the installed capacity as well as the annual production were utilised for the calculation of annuitised investment costs and operational costs. The levelised cost of electricity (LCOE) was calculated for the electricity produced. In order to take different stakeholder views and assessments into account, it was useful and indeed necessary to develop several scenarios under different storylines for the target year, focusing for example on low emissions, use of domestic resources or high shares of renewables. This meant deriving corresponding development trajectories until 2050 for the selected scenarios that described potential system settings. All system configurations, which were passed on to the subsequent multi-criteria analysis, allowed to balance load and demand for every hour of the target year. This assured their basic technical feasibility.
2.2. Identifying Stakeholder Preferences Using Multi-Criteria Analysis
An MCA is a useful method for systematically identifying and examining the preferences of stakeholders for various alternatives. In this case, the alternatives were the scenarios that had been defined previously (see Section 2.1). The MCA was applied to consider the importance assigned by national and local stakeholders to a range of social, techno-economic and ecological implications. As a result, this process allowed the identification of those development pathways that would be expected to receive broad support from the stakeholders involved. An MCA consists of the following essential steps: Before starting the assessment, the alternatives which are to be scrutinised must be defined or identified (see Section 2.1). Then, it is necessary to define criteria (see Section 2.2.1) that are appropriate for examining the differences between the alternatives. Afterwards, these criteria are weighted according to the stakeholders’ preferences (see Section 2.2.3). For each alternative and each criterion, the proper respective indicators have to be derived (see Section 2.2.2). Finally, the weighted criteria are applied to the alternatives in order to develop a ranking of alternatives (see Section 2.2.4).
There is a multitude of different methods that can be used in an MCA [44] and many of them have been applied in the context of sustainable energy [45]. Some of those methods apply to the weighting process (e.g., the Simos Method or the AHP), some to the ranking of alternatives (e.g., the Weighted Sum Model (WSM) or “outranking-relations” methods such as the Preference Ranking Organization Method for Enrichment of Evaluations (PROMETHEE)), some can be used for both steps (e.g., the Technique for Order of Preference by Similarity to Ideal Solution (TOPSIS)). This study applied the AHP for the weighting; for the ranking, both the WSM and TOPSIS ranking methods were used. The utilisation of both ranking methods allowed us to analyse the robustness of the results.
2.2.1. Criteria definition
Based on [45], the criteria need to cover all relevant aspects of the question under examination, allow representative indicators for each criterion, avoid redundancies (and thereby distorted results) and allow for clear and unambiguous categorisation. Therefore, the next step was to define criteria that would assess stakeholder preferences about the question “What are the most preferable long-term electricity scenarios for the year 2050 among the local population?” (see Table 1).

Table 1.
Criteria for the acceptability of electricity scenarios.
Each criterion is clearly defined to allow for a well-founded discussion in the weighting process. The following definitions apply:
- Techno-economic criteria: These criteria analyse the technical and economic characteristics of the electricity system. They take electricity production costs, dependency on energy imports and production volatility into consideration.
- -
- System costs: The costs of the electricity system include production, grid extension and storage costs.
- -
- System flexibility: The electricity system’s capacity to react rapidly and flexibly to changes in electricity demand.
- -
- Energy independence: Future capacity of the scenarios to make use of local resources in order to reduce energy dependency.
- Environmental criteria: These criteria analyse the environmental characteristics of the electricity system. They take water consumption, land use, emissions and management of hazardous waste into consideration.
- -
- emissions: Direct emissions of all power plants during the observation period.
- -
- Land use: Soil occupation caused by the operation of all power plants (on-site).
- -
- Water consumption: Direct freshwater consumption during the operation of all power plants (cooling, steam cycle, cleaning).
- -
- Hazardous waste: Quantity and quality of hazardous waste produced by all power plants, including radioactive waste.
- Societal criteria: These criteria analyse the socio-economic characteristics of the electricity system. They take the system’s effects on public health, the risk of serious incidents and the support of the local economy into consideration.
- -
- Contribution to local economy: The scenarios’ capacity to integrate the local economy into the electricity system.
- ∗
- On-site job creation: The scenarios’ capacity to create on-site jobs during the construction and operation of power plants.
- ∗
- Domestic value chain integration: The scenarios’ capacity to encourage the emergence and/or development of national industries and of indirect jobs during the entire life cycle of power plants.
- -
- Safety: The number of fatalities as a result of serious accidents during the operation and maintenance of power plants.
- -
- Air pollution (health): Air quality deterioration resulting from atmospheric pollutants that can bring about health risks.
2.2.2. Evaluation of Scenarios With Regard to the Criteria
Each alternative, that is, each scenario, needed to be evaluated with regard to the previously defined criteria. Each criterion was represented by one indicator for each scenario. The techno-economic criterion of “system costs” was represented by the indicator of “levelised costs of electricity”, which directly resulted from the scenario modelling. So did the indicator “ emissions”. The indicator for the criterion of “system flexibility” was calculated from the shares of intermittent, partly dispatchable and dispatchable energy generation in the scenarios with a ratio of one (intermittent) to two (partly dispatchable) to three (dispatchable).
The other eight criteria were based on surveys from [46]. Numerous indicators for the different energy technologies were collected in stakeholder workshops in the three countries. The criteria of “land use” (hectares per megawatt), “water consumption” (litres per megawatt hour), “safety” (fatalities per megawatt hour) and “air pollution” (kilograms per megawatt hour) had quantitative indicators. For these, the indicator values were scaled up and then totalled according to the installed capacities and the energy generation of the respective energy technologies in the scenarios. For the remaining criteria of “energy independence” (represented by the “possible share of domestic resources”), “hazardous waste”, “on-site job creation” and “domestic value chain integration”, semi-quantitative indicators on a scale from one to five were derived for each energy technology in each country. To obtain an indicator value for the scenarios, the indicator values of the energy technologies were scaled according to the corresponding generation quantities or the installed capacities and then normalised by dividing by either the total generation or the sum of the installed capacities in the scenario, respectively.
2.2.3. The Weighting Process
We employed the AHP as the weighting process, since it leads to a structured evaluation of all criteria, promoting awareness of the participants’ own priorities and thus providing a basis for a well-founded discussion. It therefore enhances communication and dialogue among different stakeholders. The AHP uses a pairwise comparison of the criteria categories and of the criteria in each category. These pairwise comparisons are then automatically aggregated into a total weight using a mathematical procedure based on the eigenvalues and eigenvectors of the resulting weighting matrix. The pairwise comparison reduces the complexity of the multidimensional assessment. In addition, it allows the detection of inconsistencies in the evaluations and thereby deepens researchers’ understandings of these preferences. To enable the integrated assessment of indicators with different units, the weighting process transforms these indicators into dimensionless comparable classifications on a common numeric scale. For a detailed description of the AHP, see References [44,47]. Here, this method was embedded in a three-step procedure: individual, group and overall weighting, of which the group weighting was the most relevant part.
The individual weighting, in which each stakeholder applied the AHP according to their own preferences, served as preparation for the subsequent group weighting. In the group weighting, we specified four different working groups with focus on different criteria. We then asked all participants to join one of these groups according to their individual preferences:
- a techno-economic group,
- an environmental group,
- a societal group,
- and an equal preference group.
The group weighting is the essential part of the weighting process, since it is on this level that dialogue is enhanced and a fruitful discussion becomes achievable. It results in a weighting that is representative for the individual weightings in the group. The question of how to reach consensus was left to the groups. In some groups, the participants’ weightings did not differ significantly, so these groups were able to come to a group result easily. In other groups, an intensive and vivid discussion ultimately led to a consensus. Some groups calculated the arithmetic mean of the single weightings and used this as a basis for further discussion. Although the need for discussion was very different among the groups, each group ultimately reached consensus in each country workshop.
As an optional third step, the workshops also worked on an “overall weighting”—an attempt to bring together all stakeholder preferences. Finding a consensus in a larger group of heterogeneous stakeholders is a difficult task, with a likelihood of failure. The arithmetic mean of all group weightings was used as a starting point, from which the stakeholders were given the opportunity to change the weighting if it did not reflect their judgment. In Tunisia, the discussion of the arithmetic mean led to alterations in the weighting. Not all groups, however, were able to agree on the resulting weighting. But when it turned out that such alterations had no effect on the ranking of the scenarios, the participants nevertheless decided that the adjusted weighting would be the overall weighting. In Morocco, the discussion of the arithmetic mean and alterations in the weighting led to a consensus among all groups. In the Jordan country workshop, no consensus could be agreed on because the majority of participants felt that the average results did not represent their preferences.
In this case, where a consensus could not be reached, the arithmetic mean of group weightings was used for a summarising view across preference groups instead. This weighting does not reflect the actual preferences of a person or group. However, it can be a useful tool to summarise general trends and also to examine the impact of different decisions on the outcome of the MCA, in this case on the resulting scenario ranking.
2.2.4. Ranking the Identified Electricity Scenarios
In the last step of the MCA, the study applied the weighted criteria to the alternatives in order to create a ranking of the scenarios. This meant that all the indicators were combined with the weighting factors, using the WSM as well as the TOPSIS methods. In the WSM, the indicators were simply multiplied by the weighting factor of the corresponding criteria and totalled for each scenario. Each criterion therefore influences the result directly according to its assigned weighting. This procedure leads to a score for every scenario and the scenarios can be ranked. The TOPSIS ranking method computes the distance of a scenario to the best possible alternative, ranking the scenarios from best (with the shortest distance) to worst (with the longest distance to the ideal solution). A detailed description of the ranking methods can be found in Reference [45].
3. Results
This section describes and analyses the scenarios for the target year 2050 developed in the workshops for all three countries, as well as the rankings resulting from the MCA. This is followed by a more detailed description of the top-ranked scenario of each country and a short roadmap showing how to achieve the proposed installed capacities of the scenarios.
3.1. Describing the Scenarios Developed
In each country, the workshop participants successfully developed four (Morocco, Tunisia) or five (Jordan) electricity scenarios for the target year 2050. Such a variety of scenarios allowed participants to consider the diverse range of stakeholder views and to compare a broad spectrum of future energy system arrangements.
All three countries are expected to face a significant increase in their electricity demand in the long term [48,49]. Such growth requires considerable expansion of currently installed capacity, ranging between four-fold and seven-fold increases in the target countries by 2050. Having limited domestic fossil resources [46] but at the same time focusing on conventional fossil fuels in the current energy system, all three countries have the aim of shifting from their current position as net energy importers to net energy exporters in the future. Since the potential of domestic renewable resources is very high in all three countries, the installation of renewable energy capacities can reduce national-level energy dependence, though this would also create a need for additional electricity production capacities due to renewables’ intermittency. Additionally, Morocco, Jordan and Tunisia are still considered “developing” economies today [50], which means that expected future economic development will further intensify their energy needs.
In general, the workshops revealed that even though the criterion of emissions was not prioritised by stakeholders, the increase in renewable energy options in the future was supported by participants based on the criteria of “energy independence” and “low water consumption of the electricity system”. This understanding is reflected in the various scenarios they developed (see Appendix A.1, Appendix A.2 and Appendix A.3), where a mix of different renewable energy technologies combined with gas-fired power plants are the most frequent composition of the proposed future electricity systems.
In order to keep the diversity of the developed scenarios at an easily manageable level, the scenarios were classified into four major groups, depending on the role renewables play. Category A comprises scenarios that are fully based on renewable energy technologies. Scenarios focusing on renewables but still including a minor share of conventional technologies fall into Category B. Rather balanced shares of renewable and conventional production can be found in Category C, while in Category D, the dominant conventional technologies are supplemented by lower shares of renewables. A list of all scenarios can be found in Appendix A.
Morocco is expected to experience a significant increase in electricity demand until 2050. Installed generation capacities will have to increase from about 8000 MW in 2014 [51] to between 70,000 MW and 85,000 MW in 2050, depending on the respective scenario (see Appendix A.1). Such a development is required due to an estimated five-fold increase in electricity demand, up to 173 TWh/year in 2050 [31]; this represents the highest projected absolute electricity demand in 2050 among the three countries surveyed here. According to national targets, 52% of installed capacity should be renewable by 2030 [52], which equals about 13,000 MW. In the scenarios developed here, this number could increase to between 57,000 MW and 85,100 MW by 2050, mainly covered by high shares of wind energy and solar PV. The amount of hydropower and CSP capacities in 2050 would probably be the same as those planned for 2030 in order to limit the use of water and maintenance-intensive technologies in mainly desert regions. Conventional technologies will play a minor role in the future electricity system, as domestic resources are very limited and intensive fossil fuel technologies are not able to meet the requirements of the Paris Agreement [53,54].
Jordan faces the highest projected percentage increase of its electricity demand by 2050; at approximately 106 TWh/year, this would be seven times higher than in 2014 [32]. Thus, the total amount of installed capacities needs to increase significantly from 4000 MW in 2014 [55] to about 20,000 MW to 78,000 MW, depending on the future composition of the electricity system in 2050 (see Appendix A.2). Although Jordan has very limited domestic natural gas reserves [56], gas-fired power plants represent the highest share of conventional power generation in the present energy system and, as Appendix A.2 shows, will presumably play a significant role in the future. There might be considerable potential for pumped hydropower storage, either between the Dead Sea and the Red Sea or as one system directly located near the Red Sea; this might even be less expensive than battery storage options. These options, however, were not pursued by the stakeholders during the scenario development due to their currently unknown potential.
In contrast to the Moroccan scenarios, there is no clear preference for one or two renewable energy technologies; wind energy, solar PV and CSP are all considered with significant shares. In total, renewable capacities range between 2300 MW and 69,000 MW in 2050 in the scenarios.
Tunisia’s electricity demand is set to increase from 18 TWh/year in 2014 [57] to approximately 70 TWh/year in 2050 [33]. To cover such growth, installed capacities must increase from about 4800 MW in 2014 [57] to between 18,000 MW and 26,300 MW by 2050. The installed capacities of renewable energy technologies will probably have to increase from the currently planned 3815 MW by 2030 to at least 8400 MW, depending on which scenario is developed. 95% of currently installed capacities run on natural gas, which is also the only conventional technology that was considered by the workshop participants for the future electricity scenarios (see Appendix A.3).
Wind energy, solar PV and CSP were included in all of the scenarios, with a slight focus on solar technologies. However, the planned renewable capacities from wind and solar for the future only correspond to the lower end of the estimated total potential of 10 GW and 280 GW, respectively [58] and could therefore even be exploited to a greater extent than currently envisaged. Hydro power is limited to current installations as water is very scarce in Tunisia [59]. Another source not explicitly described in the scenario results but very important for the Tunisian population is the use of domestic rooftop PV systems to enable the cheap generation of their own electricity [60].
More detailed information about the scenarios described and the underlying workshop results are available in Reference [31] for Morocco, in Reference [32] for Jordan and in Reference [33] for Tunisia.
3.2. Applying an MCA to the Given Scenarios
As outlined in Section 2.2, the results of the stakeholder-based MCA can be further divided into (intermediate) weighting results and (final) ranking results. While the former give insights into the preferences of different stakeholders with regard to individual criteria, the latter represent a ranking of the identified alternatives in light of these preferences. Section 3.2.1 and Section 3.2.2 give an overview of both types of results for all three countries under study.
3.2.1. Results of the Scenario Weighting
The criteria weightings resulting from the stakeholder workshops in Morocco, Jordan and Tunisia are presented in Appendix B. The figures in the respective tables represent the weight in percentage points calculated from the pairwise comparisons of criteria during the group weighting stage.
Given the fact that the stakeholder groups in the MCA process were assembled according to the general preferences of the respective participants (see Section 2.2.3), this group bias was expected to be mirrored by the weighting results of the groups, for example, resulting in high weightings assigned by the environmental group to criteria linked to aspects of environmental degradation. This effect was observed in most groups but not all.
In Morocco, most of the groups prioritised techno-economic criteria and weighted “energy independence” as the most important criterion by far (42–52%). The other criteria obtained a relatively low weighting compared to “energy independence”. Only the environmental group developed a structurally different weighting, resulting in “water consumption” as the most important criterion (40%)—followed by “air pollution (health)” and “hazardous waste”. During the subsequent plenary discussion, a consensus weighting among all workshop participants could be reached. This consensus still focused on techno-economic criteria but also acknowledged the importance of “water consumption” and “domestic value chain integration.”
In Jordan, most group weightings reflected the respective groups’ category priority as expected, that is, the techno-economic group prioritised all techno-economic criteria (15–31% each), the environmental group ranked environmental criteria higher (24% each, with the exception of “land use,” which was considered less important) and the societal group gave more importance to social aspects of energy systems, especially “safety” (46%) and “air pollution” (20%). However, the equal preference group did not consider the categories to be equally significant: environmental and societal criteria, especially “air pollution” and “hazardous waste,” dominated techno-economic aspects. In the arithmetic mean, “safety” stood out as the most significant criterion. Forming a consensus (considered an optional step of the process, see Section 2.2.3) could not be reached in the plenary discussion due to the strongly diverging opinions of the participants.
In Tunisia, the preferences of the different groups roughly represented their respective focus, that is, the techno-economic group weighted criteria from the techno-economic category higher than the other groups and the environmental group placed its focus on environmental criteria. The equal preference group displayed rather balanced weightings among the three criteria categories. However, “energy independence” also seemed to be crucial to groups other than the techno-economic one: the societal and equal preference groups still weighted this criterion as rather important. It was also the only outstanding criterion in the arithmetic mean. A consensus across the groups could be reached only after the participants were assured that their original group rankings would remain part of the final ranking and the workshop’s conclusions. Using the arithmetic mean as the starting-point of the discussion, the consensus included a slight increase of the weighting assigned to “system costs” and “system flexibility” as well as “on-site job creation” at the expense of “energy independence” and “safety” but it did not differ significantly from the average weighting.
3.2.2. Results of the Scenario Ranking
In Morocco, the different group weightings all resulted in the same scenario ranking (Table 2). The Category A scenario featuring 100% renewables ranked first, followed by the “Mix 2” and “Mix 1” scenarios, while the “PV” scenario was least preferred across all scenarios. Only the consensus weighting showed minor deviations in the ranking—with an inverted order of “Mix 2” and “Mix 1.” All scenarios in positions 2 to 4 focused on selected renewables, which were supplemented by different different compositions of fossil fuels (Category B). For a definition of scenario categories, see Section 3.1.
Table 2.
Resulting rankings in the Morocco country workshop.
The fact that structurally different weightings led to an identical ranking can be considered a coincidence in Morocco: for most groups (those which considered “energy independence” crucial), the top position of the “ 100% renewables” scenario was mainly determined by the superior performance of the scenario with regard to this criterion. However, the scenario also features the lowest “water consumption,” “air pollution” and “generation of hazardous waste,” which were considered most important by the environmental group. This scenario therefore also ranked first on the basis of this group’s weighting.
As a result, the scenario ranking that the participants obtained turned out to be robust with regard to the preferences of all stakeholder groups involved in the workshop. Achieving the outlines of the Category A scenario, “100% renewables” in 2050 would result in an energy system solely based on renewable energy technologies, mainly from wind and solar power.
Also in Jordan, the different weightings resulted in similar scenario priorities (Table 3). In all stakeholder groups, the “No imports” scenario, which would solely rely on domestic power sources, ranked first. In addition to renewable sources, this scenario also considers small amounts of fossil shale oil and gas. The techno-economic, environmental and societal groups’ preferences all displayed the same ranking of scenarios, which was also reflected by the arithmetic mean across all groups. However, the equal preference group revealed a different prioritisation: here, the “Mix including nuclear” scenario, which is the only one containing nuclear power and coal, ranked second instead of last.
Table 3.
Resulting rankings in the Jordan country workshop.
On the one hand, the “Mix including nuclear” scenario can be considered a moderate scenario that would not result in extreme values as compared to the other scenarios concerning most criteria. For example, with regard to “energy independence,” “air pollution” and—due to the relatively low share of nuclear power–even “hazardous waste,” this scenario ranges between “No imports” at one end of the scale and the other fossil-based scenarios at the other end. The “Mix including nuclear” scenario therefore appears to correspond better to the rather balanced category preference of the equal preference group. The other groups, on the other hand, placed stronger emphasis on their own individual criteria groups and especially those criteria in which the gas-focused and renewables-exempt scenarios (”Current plans + gas,” ”RE + gas” and “medium RE + gas”) outperformed “Mix including nuclear” (e.g., in “system costs,” “water consumption” or “safety”); this is consequently reflected in their ranking results.
The scenario ranking generated by the MCA turned out to be in accordance with the criteria weightings and preferences of the various stakeholders. Even though the stakeholders could not agree on a single set of common weighting results, they could, however, still relate to the final averaged scenario rankings. As a final result of the MCA, the “No imports” scenario proved to dovetail best with the preferences of the workshop participants. This scenario features a future electricity system that would rely mainly on renewable energy sources that are minimally supplemented by fossil fuels derived from domestic shale oil reserves (Category B).
In Tunisia, in contrast to the other two countries, the different weightings led to structurally different scenario priorities, with the exception of the societal and equal preference groups, which displayed the exact same scenario ranking (Table 4).
Table 4.
Resulting rankings in the Tunisia country workshop.
In line with its strong focus on “system costs,” the techno-economic group’s ranking basically sorted the scenarios in ascending order with regard to this criterion. As a result, the “Mix” scenario, with large amounts of natural gas and relatively little new installation of renewables, ranked first for this group, while participants’ lowest preference was for the most cost-intensive scenarios “Mix + solar” and “5 GW mix.” However, the “5 GW mix” scenario at the same time ranks first for all other groups, which dedicated more attention to aspects other than cost. The resulting scenario ranking turned out to be in accordance with most stakeholders’ criteria weightings and preferences. Nevertheless, there were significant differences among the four stakeholder groups, especially between the techno-economic on the one hand and the remaining groups on the other. The arithmetic mean as well as the consensus ranking resulted in the “5 GW mix” (Category A) scenario corresponding most closely with the preferences of the workshop participants. This scenario was characterised by a future electricity system relying exclusively on a balanced set of renewable energy sources.
3.3. Comparing the Top-Ranked Scenarios From the Three Study Regions
For each country case, the top-ranked scenario for the year 2050 was selected for further analysis of future options and needs to increase the installed capacity over time, according to the preference rankings developed during the workshops. In addition to the system description for 2050, the next step was to develop possible pathways to bring the electricity systems in those scenarios to fruition.
3.3.1. Top-Ranked Scenarios
According to the weighting results from Section 3.2.1, the top-ranked scenarios relied heavily on renewable energy technologies and thus were from Categories A and B. Their rankings were based on participants’ consensus in the case of Tunisia and Morocco and on the group average in the case of Jordan, where no consensus could be achieved (see Section 3.2.2). This section describes these scenarios as well as the most important underlying discussion results from the workshops in more detail.
Table 5 summarises the main characteristics of the top-ranked scenarios of each country. These scenarios can be seen as one possibility of a future electricity system, featuring a high share of renewables.
Table 5.
Top-ranked scenarios.
Today, the power systems in all three countries differ significantly, relying on different mixes of electricity generation techniques as well as meeting different electricity demand curves; this makes a direct comparison difficult. Different expectations regarding future electricity demand as well as varying electricity storage options also lead to different future energy system requirements. However, all countries could rely on sufficient renewable resources, which could be combined in a mix of different technologies to achieve energy independence in the future, as this criterion was very important for the stakeholders involved (see Section 3.2.1).
Morocco’s excellent wind resources, resulting from both high wind speeds and high wind availability [61], contribute to a slight focus on wind power (onshore) followed by a high share of solar PV in the top-ranked scenario. These intermittent technologies would be combined with a diverse mix of variable technologies to produce electricity in times when the intermittent technologies of wind and solar would not be able to meet electricity demand. Since hydropower resources are limited, workshop participants considered the utilisation of gaseous biomass (biogas) as another flexible electricity production technology besides CSP. Although there are currently no large-scale biogas plants in Morocco and no exact resource assessment is available, the use of biogas would reduce the increasing amount of agricultural and organic waste, which was also seen as important by the workshop participants.
In contrast to Morocco, Jordan’s top-ranked scenario envisions a future based mainly on three different pillars—wind power, PV and CSP—with 15 GW–25 GW each. Even though CSP is currently much more expensive and therefore not favoured by decision-makers, the workshop participants saw a clear benefit in it as an energy storage option compared to PV. However, using CSP mainly for covering the residual load during times when wind power and solar PV would not be capable of producing cheap electricity, it contributes only to small shares to the electricity production due to relatively high production costs. Since the possible exploitation of domestic shale oil and shale gas is currently under study [62], the scenario includes small shares of these conventional fossil fuels, contributing slightly to the total electricity production in times of a positive residual load. Another regional restriction of the Jordanian energy system is the assumed limited potential of relatively cheap pumped hydro power already mentioned above. Since no reliable estimates or research studies on the potential for this technology have been conducted, it was initially excluded and batteries were considered instead.
The top-ranked scenario for Tunisia’s future electricity system differs from the other countries because equal shares of wind power, PV, geothermal, biomass and CSP were all considered. In general, the workshop participants preferred PV most, being beneficial both as rooftop home systems and large-scale power plants. Under the assumptions made, geothermal and CSP were considered to be more expensive than other renewables. Although geothermal power is still cost-intensive and its potential is currently unknown, the participating stakeholders included this technology in future scenarios.
Looking at all the scenarios in Appendix A.1, Appendix A.2 and Appendix A.3, differences in the specific costs (in ) are noticeable between the scenarios that have high generation shares of renewable technologies and scenarios that have higher shares of conventional technologies. All three renewable-focused scenarios are the most expensive ones per country according to the presented results. However, this is not necessarily due to the renewables themselves. Assumed storage capacities as well as supplementary fossil plants operating with low capacity factors to compensate for fluctuating generation also contribute to high specific costs of electricity. The assessment of costs also changes when the external costs, mainly arising from conventional fossil energy, are internalised. According to Reference [63], externalities arise when a market transaction affects a third party that is not involved in the actual transaction. Internalising externalities is one approach to incorporating such impacts back into the market transaction. The most prominent negative environmental externality is pollution caused by conventional fossil fuel technologies. Pollution causes health problems but the underlying costs of such problems are not for the most part incorporated into electricity prices but are paid by the suffering party directly. The Moroccan case shows that when considering system costs and external costs, the 100% renewable scenario is by far the cheapest–with externalities exceeding system costs by three to four times [64]. This point makes it clear that external costs, energy independence and sustainability all play an important role with regard to cheap and environmentally friendly future electricity systems.
3.3.2. A Roadmap to Achieving High Shares of Renewables
The next step was to generate technology roadmaps for the top-ranked scenarios for each country that describe development towards the 2050 goals on an annual basis, using a back-casting approach [65]. This was achieved by linearly interpolating existing installations and capacities, intermediate targets and the 2050 scenario data (based on References [31,32,33,48,51,55,57,60]). The annual numbers that emerged represent the approximated development path required to reach the envisaged 2050 system. Although there might be room for manoeuvre over time in the actual implementation, intermediate goals should be in agreement with the calculated figures.
Since Morocco’s wind power installation is expected to be 5 GW in 2030 [4] (p. 29), a target of 45 GW in 2050 requires substantial capacity additions. This also holds for solar PV, albeit at a lower capacity level, reaching GW in 2040 and 30 GW in 2050. Only an increase in installed CSP capacity can flatten out somewhat after 2030 due to the fact that CSP capacity is already expected to reach a substantial level ( GW) by 2030. In the top-ranked scenario, conventional capacities would no longer be required in 2050 and therefore they can be or must be taken out of operation in the years before.
Similar to the Moroccan case, the installed capacity of renewables in Jordan under the top-ranked scenario significantly increases until 2050. While the Moroccan case anticipated total power demand to multiply by a factor of five between the intermediate year of 2020 and the target year of 2050, the corresponding factor of 10 in Jordan translates into an even more dramatic increase in installed capacity. In 2020, both wind power and solar PV will remain far below 2 GW of installed capacity [66] and they are forecast to reach 15 GW and 25 GW, respectively, in the scenario for 2050, meaning more than a tenfold increase. In contrast to the Moroccan scenario, in Jordan’s 2050 power system, there would still be conventional installations, which, however, would only be required to cover a few peaks in demand.
In Tunisia, power demand was forecast to more than double between 2020 and 2050, which nevertheless would result in a smaller necessary increase in installed capacity compared to the other two country cases. With multiple renewable technologies, each contributing 5 GW in the scenario for 2050, however, substantially increased development of all technologies would still be required.
For all three country cases, it is apparent that reaching a fully or substantially renewables-based power system by 2050 will require a major expansion of renewable capacities as well as a reduction in conventional capacity. The conventional capacity installed today or in use as part of the intermediate targets can or should be taken out of operation in the years before 2050. The role of this conventional capacity should be subject to further in-depth analyses. For all countries, it is clear that conventional capacity should not be expanded beyond current intermediate goals. At least for Morocco and Tunisia, it may even be advisable to reconsider intermediate targets. Figure 1 illustrates the calculated installed capacity in selected years. It becomes obvious that the increases among the countries differ, depending on hypothesised electricity demand in 2050 and national intermediate installation targets. These roadmaps should therefore be seen as a sound basis for further discussion about what steps are necessary in terms of a required legal framework, incentives, or the prevention of stranded investment.
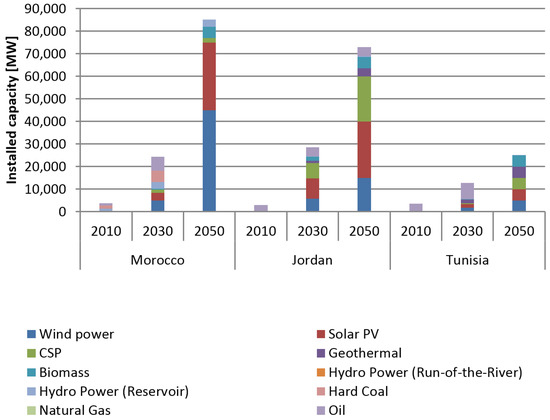
Figure 1.
Capacity expansion trajectories in the top-ranked scenarios for Morocco, Jordan and Tunisia. Based on [31,32,33,48,51,55,57,60].
3.4. Comparison of Country Results
The individual workshops focused on one country each and intentionally provided an arena for discussions about country-specific issues such as national targets and plans, and potential challenges and opportunities. The additional juxtaposition of the country results and country-specific discussions further reveals similarities and differences between the country cases. Such a comparison could be utilised by a country’s stakeholders to learn from other country cases. Moreover, stakeholders from third countries might be inspired by the differing aspects of the three country cases, which could be translated into the development of targets and plans in their own countries.
Analysing all country weightings as a whole reveals repeating patterns of criteria, with similar weighting results in different countries: while high weightings are assigned to all techno-economical criteria as well as “water consumption”, “hazardous waste” and “air pollution” by different groups in all countries, “land use”, “ emissions” and aspects of job creation are considered less important in all countries. Some of these patterns are rather obvious, such as a far higher importance assigned to “water consumption” as compared to “land use”, with all three countries characterised by an arid climate and a low population density, especially in vast rural areas. Other patterns appear to contrast with political focal points at the global level as well as local characteristics of the countries. Especially in the light of the “Paris Agreement” [53], the subordinate weighting of the “ emissions” criterion in all countries is a noticeable result. Only the environmental workshop group in Jordan gave this criterion a two-digit weighting (24%); in many other groups, it even turned out to be considered the least important criterion. It therefore appears that, in the perception of most stakeholders, the long-term global goal of climate protection is still outweighed by urgent short-term challenges, mainly socio-economic ones. Furthermore, although unemployment rates are high in all three countries [67], none of the countries prioritised one of the two job-related criteria of “on-site job-creation” or “domestic value chain integration” by assigning larger weights.
When comparing the MCA stakeholder process in all countries, similar rankings across multiple groups could be observed even after vigorous discussions and widely diverging opinions during the weighting stage of the process. However, this does not allow us to conclude that different criteria weightings only have limited influence on the scenario rankings. It rather shows that different scenarios developed in the workshops simultaneously demonstrate similar characteristics concerning different criteria that are regarded as important by different groups. For example, a scenario contributing both to “energy independence” as well as lower air pollution may by highly ranked by two different groups, which nevertheless assigned specific importance to the one or the other criterion. As a result, although consensus-finding on the importance of different aspects of future electricity systems may be difficult, it would still be possible for heterogeneous groups of stakeholders to ultimately agree on particular transformation pathways for the electricity system.
With regard to the calculated ranking results in the respective countries, it appears that most stakeholder groups across all three countries had similar preferences for similar types of scenarios. With the due caution with regard to the relatively small sample of countries, scenarios and stakeholder groups, we observe the following:
- The highest preferences were calculated for scenarios from Categories A and B, characterised by high shares of renewable power, especially for 100% renewable scenarios (if available from the respective range of scenarios).
- Lower preference values were calculated for Categories C and D scenarios, which assumed that conventional fossil-based power would continue to play an important role in the decades to come.
- In most cases, nuclear power had already been excluded during the stage of scenario definition. The only scenario that discussed nuclear power (”Mix including nuclear”, in Jordan) ended up receiving the lowest preference results.
- With regard to renewables, most scenarios (especially the top-ranked ones) feature a diverse mix of different renewable power sources instead of deploying single technologies such as only wind power or only CSP.
However, in addition to some recurring patterns, it was also possible to notice differences between the three countries under study: the Moroccan stakeholders initially refrained from considering Category C and D scenarios including nuclear power as well as relevant future shares of fossil fuels. As a consequence, while the first-ranked scenario is based on renewables only (Category A), all other—rather similar—scenarios (ranked second to fourth) still focus on renewable technologies that are only supported by fossil fuels to a limited extent (Category B). Although the Moroccan scenarios also showed an aforementioned tendency towards a diversified electricity mix, compared to the other countries, they nevertheless had a stronger focus on single technologies, especially wind and PV power.
In principle, the Tunisian stakeholders developed a similar range and ranking of scenarios as the Moroccans did but they additionally also defined a Category C scenario with a rather balanced share of renewables and fossil-based power. However, this scenario was least preferred according to the calculated rankings.
In contrast to the two other countries, in Jordan, three out of five scenarios the stakeholders defined could be assigned to Category D, because they still focused on selected fossil technologies (mainly gas) even in 2050. These were ranked from second to fourth, while the only Category B scenario with a focus on diverse renewables ranked first. The only scenario with relatively balanced shares of renewables and fossils as well as supplementary nuclear power (Category C) received the lowest ranking.
This comparison of the three country cases shows that a large variety of arrangements of these countries’ future power systems is possible. Not only do the scenarios differ substantially in the future mix of technologies but also in the resulting costs and the amount of direct emissions (see Appendix A). Such differences, again, can be found not only within one country but also in the comparison of one country with another. However, the three country cases have shown that high shares of renewable energy sources in these countries’ future power systems were gladly included in most of the scenarios developed or vice versa, high shares of conventional power generation in the countries’ future power systems were regarded to be rather unpopular. Results from all three countries demonstrated that an electricity supply based solely or to a large extent on renewables is technically possible and economically feasible in the countries of analysis. This depends to a limited extent on the amount of local resources, while the main driver in these countries’ future power system concerns the question of available storage potential and the anticipated load level.
4. Discussion
The following paragraphs take a look at the results with respect not only to content but also to the methodology surrounding group MCA.
4.1. MCA Methodology
The workshops highlighted procedural challenges linked to the application of an AHP-based multi-criteria assessment in groups. The lessons learned include the following aspects:
To check pairwise weightings of criteria for consistency is as fundamentally important as it is difficult. In our workshops, we relied on printed questionnaires that were subsequently transferred to an Excel-based MCA tool that included a mathematical consistency check. Although participants were asked to check their results for consistency before handing them in, some inconsistencies could only be pointed out by the Excel tool. This created needs for another iteration of the weighting process, which was partly seen as an attempt to influence the formation of opinion. This process could be improved by applying a less strict consistency check (e.g., as described in Reference [68]) than the check based on Reference [47] which was used here.
The successful application of the AHP relies on the definition of structurally different alternatives that are fed into the weighting and ranking stage. However, in a group process that starts with the definition of alternatives, individual preferences are already included in the definition stage, which may result in the exclusion of unpopular alternatives at the outset. The process owner of the MCA needs to make sure that alternatives defined in the process demonstrate fundamental differences.
Applying an MCA in a process with groups of heterogeneous stakeholders is expected to result in a wide range of different weightings. However, a range of diverse weightings may even result in similar rankings.
Based on our observations, participants in the process may have a tendency to assign inferior weightings to criteria which they generally rate as important but which are currently not considered as a problem (e.g., presently good air quality in a specific country).
4.2. High Electricity and Capacity Demand
As described in Section 3.3, the scenarios in all countries are based on a major increase in future demand for electricity production as well as for the installation of corresponding additional generation capacities. On the one hand, our calculations show that the resulting systems might be technically viable. They are also in line with the high level of technology optimism among the workshop participants, which became apparent during the workshops. On the other hand, large power systems, even those relying mainly on renewable resources, cause severe side effects such as high investment cost, high demand for mineral resources (including critical minerals) [69], increased water consumption and ecosystem degradation. The threats from these adverse effects might even be exacerbated as soon as a transformation of the entire energy system is seriously considered by national policymakers or in case the countries under study decide to harvest their export potential for electricity-based products such as solar fuels and chemicals. However, several strategies exist to reduce the amount of future construction required and the usage needs of additional plant capacities: first, energy sufficiency and efficiency policies can lead to lower long-term electricity demand. Second, there are balancing effects in connected energy systems, in contrast to the isolated systems assumed in this study. This reduces the necessary peak generation capacity. And third, additional measures not considered in this study, such as demand-side management and sector-coupling technologies, can also reduce the need for electricity generation capacity.
4.3. Stakeholder Preferences
In all three countries, there was a very high commitment for high shares of renewable energy in the future energy system. That is especially because these contribute to energy independence, which stakeholders considered very important. In this context, cost effectiveness and the availability of local resources were the important features of the most widely preferred energy generation technologies. A mix of different renewable energy systems with a focus on solar sources (as well as wind in Morocco) emerged as the most popular option. The use of biogas plants on a large scale was seen as an option to reduce waste in the three countries. Coal and nuclear power were regarded as unpopular technology options in all three countries because of their high costs, the lack of international funding and their non-sustainable characteristics. Energy storage is a key question, especially for Jordan, since pumped hydro power was not considered to be an option due to water scarcity, and batteries would be necessary instead.
The stakeholder preferences outlined above correspond to recent scenario literature describing global and regional 100% renewables scenarios in the electricity as well as the entire energy sector [70,71,72,73,74]. Already in 2011, the Working Group III Special Report on Renewable Energy Sources and Climate Change Mitigation (SRREN) of the Intergovernmental Panel on Climate Change (IPCC) pointed out that “a significant increase in the deployment of RE by 2030, 2050 and beyond is indicated in the majority of the 164 scenarios reviewed in this Special Report” [75], referring to an analysis of Reference [76]. In terms of renewable energy shares, many of the scenarios discussed in our work (those of category B, C and D) even lag behind the scenario studies from the literature mentioned above.
Apart from being socially preferred or accepted, future electricity scenarios must also be plausible from an electrical engineering perspective. Aspects of electrotechnical feasibility of preferred scenarios beyond a balancing of supply and demand on an hourly basis are not covered by our analysis. However, these aspects, such as the consideration of sub-hourly time resolutions, the provision of reserve power or other ancillary services, are subject of numerous publications. For example, Reference [74] concludes that “there are solutions using today’s technology for all the feasibility issues raised” in the discussion about scenarios featuring 100% renewable electricity. However, even with the required technologies available, the comprehensive transformation of the electricity sector of a country from mainly fossil to renewable sources remains a challenging task, which needs to be accomplished in a cost- and resource-efficient manner.
4.4. Strategic Decisions
In all three countries under study, the approach using participatory workshops to identify priorities for future electricity systems proved to be an appropriate method to enable constructive discussions and receive valuable contributions from a wide range of stakeholder groups. The workshops created awareness about the necessity of adopting national long-term goals up to the year 2050, because the currently adopted targets for 2020 or 2030 will not be sufficient to cover the expected increase of future electricity demands. In the discussions, participants saw the dissemination of knowledge related to the long term (i.e., until 2050) as a basis to facilitate informed planning and investment decisions that need to be made today. The workshops also pointed out the potential need to revise existing 2030 development plans for the respective countries: according to the workshop discussions and modelling results, many scenarios featured a decommissioning of most fossil power plants before 2050. As a result of the usually high technical lifetime of such types of plants, any construction of additional fossil-fuel plants in the decades to come would therefore likely be linked to a high risk of stranded investments. The same logic not only also applies for nuclear power plants but is further bolstered by larger environment-related challenges and problems. Due to infrastructural and geographical concerns, plans to build two nuclear power units in Jordan by 2025 were cancelled in 2018. However, the Jordan Atomic Energy Commission (JAEC) is still planning the construction of small modular nuclear reactors to deploy the country’s domestic uranium reserves [77]. According to the workshop participants in Tunisia and Morocco, plans for nuclear energy in both countries have been put on hold as no potential sites could be identified and the technology’s deployment was perceived to be too closely linked to a host of techno–economic, ecological and societal risks [31,33]. In light of the respective domestic levels of renewable resources from solar and wind as well as the modelling results obtained from renpassG!S, this study found nuclear power to be unnecessary in the future with respect to covering the rising electricity demand of the three countries under study. The results of the study therefore entail a recommendation of reviewing and possibly abandoning remaining plans to build nuclear power plants, thus facilitating a focus on the implementation of more widely accepted renewable technologies.
4.5. Conclusions
To achieve a high level of energy independence, all three countries should focus on their abundant renewable energy sources such as solar and wind power for their future power supply. Provided that sufficient residual material flows are available, sustainable biomass technologies should also be considered in long-term national goals; conventional generation should play a minor role.
Opportunities to establish electricity systems based on high shares of renewable energy should be investigated while simultaneously working to reduce the required capacities for electricity generation and storage. These opportunities may include a combination of renewable technologies with different feed-in profiles or balancing supply and demand by means of various flexibility options. Even though the scenarios take thermal storage through CSP plants into account, the need to further reduce storage demand is especially important with regard to the limited availability of other storage options such as pumped hydro power in Jordan and Tunisia. In the case of Morocco, researchers should work to identify the potential application of additional storage technologies (other than pumped hydro power) in an effort to reduce the country’s dependency on the availability of its water resources.
Researchers and policymakers should define long-term goals and intermediate steps towards these goals; existing intermediate goals might need to be revised in order to avoid stranded investments, since today’s decisions will have a significant influence on the future system. There is a need for new policies to support these goals and to enable new business models.
It will be necessary to disseminate knowledge to the general public about long-term goals and improve participation processes, while concurrently further analysing and discussing available options to produce electricity, with all their advantages and disadvantages in economic, ecological and social terms. Representatives of the population need to be included in the discussion on the countries’ future electricity supply to increase public support for national targets. There should be a strategy to assure that all societal groups are empowered to participate in this process. Finally, action needs to be taken to ensure that the local population has its fair share of benefits from the increase in renewable energy technologies, such as new green jobs or financial participation in decentralised projects.
Author Contributions
O.Z. and C.K. designed and implemented the multi-criteria analyses. M.B. and S.B. developed the electricity scenarios and carried out the technoeconomic modelling. O.Z., C.K., M.B. and S.B. derived and discussed country-specific as well as cross-country results. S.F. was in charge of the underlying research project and contributed the article’s abstract and introduction. O.Z. further managed and reviewed the overall writing process.
Acknowledgments
The work presented in this article is the outcome of the research activities conducted within the framework of the Middle East North Africa Sustainable ELECtricity Trajectories (MENA SELECT) project. The work has received funding from the German Federal Ministry of Economic Cooperation and Development. We acknowledge financial support by Wuppertal Institute for Climate, Environment and Energy within the “Open Access Publishing” funding programme. We also thank our colleague Sarra Amroune for her valuable feedback on an earlier version of this paper. Furthermore, we thank Matthew Rees and Teresa Gehrs (LinguaConnect) for proofreading the manuscript and the anonymous reviewers for their valuable comments and suggestions.
Conflicts of Interest
The authors declare no conflict of interest. The founding sponsors had no role in the design of the study; in the collection, analyses, or interpretation of data; in the writing of the manuscript, or in the decision to publish the results.
Abbreviations
The following abbreviations are used in this manuscript:
| AHP | Analytical Hierarchy Process |
| carbon dioxide | |
| CSP | Concentrating Solar Power |
| cts | Euro cents |
| IPCC | Intergovernmental Panel on Climate Change |
| JAEC | Jordan Atomic Energy Commission |
| LCOE | levelised cost of electricity |
| MCA | Multi-Criteria Analysis |
| MENA SELECT | Middle East North Africa Sustainable ELECtricity Trajectories |
| MENA | Middle East and North Africa |
| NDC | Nationally Determined Contribution |
| NGO | Non-Governmental Organisation |
| PROMETHEE | Preference Ranking Organization Method for Enrichment of Evaluations |
| PV | Photovoltaic |
| renpassG!S | Renewable Energy Pathway Simulation System GIS |
| SRREN | Special Report on Renewable Energy Sources and Climate Change Mitigation |
| ST | Sustainability Transitions |
| TOPSIS | Technique for Order of Preference by Similarity to Ideal Solution |
| WI | Wuppertal Institute for Climate, Environment and Energy |
| WSM | Weighted Sum Model |
Appendix A. Installed Capacity, CO2 Emissions and LCOE in the Developed Scenarios
Appendix A.1. Morocco, 2050
Table A1.
Selected characteristics of scenarios (Morocco, 2050).
Table A1.
Selected characteristics of scenarios (Morocco, 2050).
| Ranking Result | Rank 1 | Rank 2 | Rank 3 | Rank 4 | |
|---|---|---|---|---|---|
| Technology | Unit | 100% Renewable | Mix 1 | Mix 2 | PV |
| Category A | Category B | Category B | Category B | ||
| Renewable | |||||
| Wind power | MW | 45,000 | 35,000 | 40,000 | 10,000 |
| PV | MW | 30,000 | 15,000 | 10,000 | 50,000 |
| Hydro power | MW | 3100 | 3100 | 3100 | 3100 |
| Biomass | MW | 5000 | 3000 | 3000 | 0 |
| CSP | MW | 2000 | 2000 | 1500 | 1300 |
| Conventional | |||||
| Coal | MW | 0 | 5000 | 6000 | 4937 |
| Oil | MW | 0 | 741 | 741 | 741 |
| Gas | MW | 0 | 500 | 6172 | 6172 |
| Total | MW | 85,100 | 69,341 | 70,513 | 76,250 |
| PHS (pump) | MW | 10,000 | 9000 | 10,000 | 23,906 |
| PHS (turbine) | MW | 17,926 | 9635 | 7511 | 14,283 |
| CO2 | Mt/a | 0.0 | 18.5 | 19.1 | 29.3 |
| LCOE | cts/kWh | 9.73 | 8.56 | 8.61 | 9.44 |
Appendix A.2. Jordan, 2050
Table A2.
Selected characteristics of scenarios (Jordan, 2050).
Table A2.
Selected characteristics of scenarios (Jordan, 2050).
| Ranking Result | Rank 1 | Rank 2 | Rank 3 | Rank 4 | Rank 5 | |
|---|---|---|---|---|---|---|
| Technology | Unit | No Imports | Medium RE + gas | RE + gas | Current Plans + gas | Mix Incl. Nuclear |
| Category B | Category D | Category D | Category D | Category C | ||
| Renewable | ||||||
| Wind power | MW | 15,000 | 3000 | 4000 | 1200 | 8000 |
| PV | MW | 25,000 | 3500 | 4000 | 1000 | 9000 |
| Geothermal | MW | 3500 | 0 | 0 | 0 | 750 |
| Hydro power | MW | 500 | 12 | 12 | 12 | 250 |
| Biomass | MW | 5000 | 1500 | 90 | 90 | 700 |
| CSP | MW | 20,000 | 2000 | 2000 | 0 | 5000 |
| Conventional | ||||||
| Nuclear | MW | 0 | 0 | 0 | 0 | 2000 |
| Coal | MW | 0 | 0 | 0 | 0 | 1000 |
| Oil | MW | 5000 | 470 | 470 | 470 | 1500 |
| Gas | MW | 4000 | 16,000 | 17,500 | 18,000 | 12,000 |
| Total | MW | 78,000 | 26,482 | 28,072 | 20,772 | 40,200 |
| Batteries | GWh | 40.0 | 2.0 | 2.0 | 0 | 9.0 |
| (energy) | ||||||
| Batteries | MW | 18,000 | 900 | 900 | 0 | 5,187 |
| (power) | ||||||
| CO2 | Mt/a | 0.3 | 18.4 | 20.6 | 26.7 | 15.2 |
| LCOE | cts/kWh | 28.19 | 9.99 | 10.08 | 9.52 | 13.68 |
Appendix A.3. Tunisia, 2050
Table A3.
Selected characteristics of scenarios (Tunisia, 2050).
Table A3.
Selected characteristics of scenarios (Tunisia, 2050).
| Ranking Result | Rank 1 | Rank 2 | Rank 3 | Rank 4 | |
|---|---|---|---|---|---|
| Technology | Unit | 5 GW mix | Mix | Mix + solar | Solar + gas |
| Category A | Category B | Category B | Category C | ||
| Renewable | |||||
| Wind power | MW | 5000 | 7000 | 1755 | 1755 |
| PV | MW | 5000 | 6000 | 10,000 | 5000 |
| Geothermal | MW | 5000 | 500 | 500 | 0 |
| Hydro power | MW | 63 | 63 | 63 | 63 |
| Biomass | MW | 5000 | 1000 | 1000 | 100 |
| CSP | MW | 5000 | 1500 | 5000 | 1500 |
| Conventional | |||||
| Coal | MW | 0 | 0 | 0 | 0 |
| Oil | MW | 0 | 0 | 0 | 0 |
| Gas | MW | 0 | 8000 | 8000 | 9500 |
| Total | MW | 25,063 | 24,063 | 26,318 | 17,918 |
| PHS (pump) | MW | 400 | 400 | 400 | 400 |
| PHS (turbine) | MW | 400 | 400 | 400 | 400 |
| CO2 | Mt/a | 0.0 | 7.24 | 6.90 | 14.01 |
| LCOE | cts/kWh | 16.46 | 8.96 | 11.76 | 9.47 |
Appendix B. Resulting Weightings in the Country Workshops
Appendix B.1. Morocco
Table A4.
Resulting weightings in the Morocco country workshop.
Table A4.
Resulting weightings in the Morocco country workshop.
| Techno-Economic Group | Environ-Mental Group | Societal Group | Equal Preference Group | Consensus | |
|---|---|---|---|---|---|
| System costs | 16 | 1 | 14 | 20 | 16 |
| System flexibility | 5 | 2 | 6 | 10 | 12 |
| Energy independence | 51 | 8 | 52 | 42 | 25 |
| emissions | 1 | 6 | 1 | 1 | 4 |
| Land use | 1 | 3 | 1 | 1 | 1 |
| Water consumption | 6 | 40 | 6 | 9 | 12 |
| Hazardous waste | 6 | 16 | 6 | 3 | 4 |
| On-site job creation | 3 | 1 | 1 | 2 | 6 |
| Local value chain integration | 8 | 6 | 3 | 8 | 11 |
| Safety | 2 | 3 | 3 | 2 | 3 |
| Air pollution (health) | 2 | 17 | 8 | 3 | 6 |
Appendix B.2. Jordan
Table A5.
Resulting weightings in the Jordan country workshop.
Table A5.
Resulting weightings in the Jordan country workshop.
| Techno-Economic Group | Environ-Mental Group | Societal Group | Equal Preference Group | Arithmetic Mean | |
|---|---|---|---|---|---|
| System costs | 15 | 2 | 1 | 3 | 4 |
| System flexibility | 21 | 2 | 4 | 1 | 5 |
| Energy independence | 31 | 2 | 9 | 10 | 12 |
| emissions | 1 | 24 | 1 | 4 | 4 |
| Land use | 0 | 3 | 1 | 3 | 2 |
| Water consumption | 4 | 24 | 1 | 4 | 4 |
| Hazardous waste | 4 | 24 | 5 | 24 | 14 |
| On-site job creation | 1 | 0 | 4 | 1 | 1 |
| Local value chain integration | 4 | 1 | 1 | 3 | 3 |
| Safety | 15 | 15 | 46 | 13 | 27 |
| Air pollution (health) | 5 | 4 | 20 | 26 | 14 |
Appendix B.3. Tunisia
Table A6.
Resulting weightings in the Tunisia country workshop.
Table A6.
Resulting weightings in the Tunisia country workshop.
| Techno-Economic Group | Environ-Mental Group | Societal Group | Equal Preference Group | Consensus | |
|---|---|---|---|---|---|
| System costs | 49 | 2 | 2 | 3 | 13 |
| System flexibility | 8 | 2 | 8 | 9 | 11 |
| Energy independence | 20 | 6 | 18 | 21 | 16 |
| emissions | 2 | 9 | 5 | 4 | 6 |
| Land use | 1 | 3 | 2 | 2 | 2 |
| Water consumption | 5 | 35 | 5 | 8 | 13 |
| Hazardous waste | 10 | 16 | 2 | 18 | 12 |
| On-site job creation | 0 | 3 | 2 | 2 | 5 |
| Local value chain integration | 1 | 3 | 5 | 8 | 5 |
| Safety | 4 | 3 | 37 | 5 | 4 |
| Air pollution (health) | 1 | 16 | 15 | 19 | 13 |
References
- British Petroleum. BP Energy Outlook 2018; Report; British Petroleum: London, UK, 2018. [Google Scholar]
- McKee, M.; Keulertz, M.; Habibi, N.; Mulligan, M.; Woertz, E. Demographic and Economic Material Factors in the MENA Region; Working Paper; IAI: Roma, Italy, 2017. [Google Scholar]
- Waha, K.; Krummenauer, L.; Adams, S.; Aich, V.; Baarsch, F.; Coumou, D.; Fader, M.; Hoff, H.; Jobbins, G.; Marcus, R.; et al. Climate change impacts in the Middle East and Northern Africa (MENA) region and their implications for vulnerable population groups. Reg. Environ. Chang. 2017, 17, 1623–1638. [Google Scholar] [CrossRef]
- Schinke, B.; Klawitter, J.; Zejli, D.; Barradi, T.; Garcia, I.; Leidreiter, A. Background Paper: Country Fact Sheet Morocco. Energy and Development at a Glance 2016. Project: Middle East North Africa Sustainable ELECtricity Trajectories (MENA-SELECT); Germanwatch, Bonn International Center for Conversion GmbH (bicc): Bonn, Germany, 2016. [Google Scholar]
- Ministère de l’Industrie de la République Tunisienne. Débat National Stratégie Energétique—Horizon 2030; Ministère de l’Industrie de la République Tunisienne: Tunis, Tunisia, 2013.
- Jordanian Ministry of Energy & Mineral Resources. Annual Report 2015; Jordanian Ministry of Energy & Mineral Resources: Amman, Jordan, 2015.
- Jordanian Ministry of Energy & Mineral Resources. Annual Report 2017; Jordanian Ministry of Energy & Mineral Resources: Amman, Jordan, 2017.
- Mitchell, T. Carbon democracy. Econ. Soc. 2009, 38, 399–432. [Google Scholar] [CrossRef]
- Szeman, I.; Boyer, D. Energy Humanities: An Anthology; Johns Hopkins University Press: Baltimore, MA, USA, 2017. [Google Scholar]
- Loorbach, D.; Frantzeskaki, N.; Avelino, F. Sustainability Transitions Research: Transforming Science and Practice for Societal Change. Ann. Rev. Environ. Resour. 2017, 42, 599–626. [Google Scholar] [CrossRef]
- Rip, A.; Kemp, R.; Schaeffer, G.J.; van Lente, H. Technological Change. In Human Choice and Climate Change; Rayner, S., Malone, E., Eds.; Battelle Press: Columbus, OH, USA, 1997; Volume II, pp. 327–399. [Google Scholar]
- Geels, F.W. Technological transitions as evolutionary reconfiguration processes: A multi-level perspective and a case-study. Res. Policy 2002, 31, 1257–1274. [Google Scholar] [CrossRef]
- Smith, A.; Voss, J.P.; Grin, J. Innovation studies and sustainability transitions: The allure of the multi-level perspective and its challenges. Res. Policy 2010, 39, 435–448. [Google Scholar] [CrossRef]
- Rotmans, J.; Kemp, R.; van Asselt, M. More evolution than revolution: transition management in public policy. Foresight 2001, 3, 15–31. [Google Scholar] [CrossRef]
- Loorbach, D. Transition Management for Sustainable Development: A Prescriptive, Complexity-Based Governance Framework. Gov. Int. J. Policy Adm. Ins. 2010, 23, 161–183. [Google Scholar] [CrossRef]
- Markard, J.; Raven, R.; Truffer, B. Sustainability transitions: An emerging field of research and its prospects. Res. Policy 2012, 41, 955–967. [Google Scholar] [CrossRef]
- Sovacool, B.K. What are we doing here? Analyzing fifteen years of energy scholarship and proposing a social science research agenda. Energy Res. Soc. Sci. 2014, 1, 1–29. [Google Scholar] [CrossRef]
- Brand, B.; Missaoui, R. Multi-criteria analysis of electricity generation mix scenarios in Tunisia. Renew. Sustain. Energy Rev. 2014, 39, 251–261. [Google Scholar] [CrossRef]
- Shaaban, M.; Scheffran, J.; Böhner, J.; Elsobki, M. Sustainability assessment of electricity generation technologies in Egypt using multi-criteria decision analysis. Energies 2018, 11, 1117. [Google Scholar] [CrossRef]
- Bohanec, M.; Trdin, N.; Kontić, B. A qualitative multi-criteria modelling approach to the assessment of electric energy production technologies in Slovenia. Cent. Eur. J. Oper. Res. 2017, 25, 611–625. [Google Scholar] [CrossRef]
- Štreimikiene, D.; Šliogeriene, J.; Turskis, Z. Multi-criteria analysis of electricity generation technologies in Lithuania. Renew. Energy 2016, 85, 148–156. [Google Scholar] [CrossRef]
- Promentilla, M.; Tapia, J.; Aviso, K.; Tan, R. Optimal selection of Low carbon technologies using a Stochastic Fuzzy multi-criteria decision modelling approach. Chem. Eng. Trans. 2017, 61, 253–258. [Google Scholar] [CrossRef]
- Klein, S.; Whalley, S. Comparing the sustainability of U.S. electricity options through multi-criteria decision analysis. Energy Policy 2015, 79, 127–149. [Google Scholar] [CrossRef]
- Santos, M.; Ferreira, P.; Araújo, M. Multicriteria scenario analysis on electricity production. In Proceedings of the 2015 12th International Conference on the European Energy Market (EEM), Lisbon, Portugal, 19–22 May 2015. [Google Scholar] [CrossRef]
- Strantzali, E.; Aravossis, K.; Livanos, G. Evaluation of future sustainable electricity generation alternatives: The case of a Greek island. Renew. Sustain. Energy Rev. 2017, 76, 775–787. [Google Scholar] [CrossRef]
- Mirjat, N.; Uqaili, M.; Harijan, K.; Mustafa, M.; Rahman, M.; Khan, M. Multi-criteria analysis of electricity generation scenarios for sustainable energy planning in Pakistan. Energies 2018, 11, 757. [Google Scholar] [CrossRef]
- Santos, M.; Ferreira, P.; Araújo, M.; Portugal-Pereira, J.; Lucena, A.; Schaeffer, R. Scenarios for the future Brazilian power sector based on a multi-criteria assessment. J. Clean. Prod. 2018, 167, 938–950. [Google Scholar] [CrossRef]
- Atilgan, B.; Azapagic, A. Energy challenges for Turkey: Identifying sustainable options for future electricity generation up to 2050. Sustain. Prod. Consum. 2017, 12, 234–254. [Google Scholar] [CrossRef]
- Alhamwi, A.; Kleinhans, D.; Weitemeyer, S.; Vogt, T. Optimal mix of renewable power generation in the MENA region as a basis for an efficient electricity supply to europe. EDP Sci. 2014, 79. [Google Scholar] [CrossRef]
- Damerau, K.; van Vliet, O.; Patt, A. Direct impacts of alternative energy scenarios on water demand in the Middle East and North Africa. Clim. Chang. 2015, 130, 171–183. [Google Scholar] [CrossRef]
- Berg, M.; Bohm, S.; Fink, T.; Komendantova, N.; Soukup, O. Summary of Workshop Results: Scenario Development and Multi-Criteria Analysis for Morocco’s Future Electricity System in 2050; Europa-Universitat Flensburg, Wuppertal Institute, International Institute for Applied Systems Analysis: Flensburg, Germany, 2016. [Google Scholar]
- Amroune, S.; Blohm, M.; Bohm, S.; Komendantova, N.; Soukup, O. Summary of Workshop Results: Scenario Development and Multi-Criteria Analysis for Jordan’s Future Electricity System in 2050; Europa-Universitat Flensburg, Wuppertal Institute, International Institute for Applied Systems Analysis: Flensburg, Germany, 2018. [Google Scholar]
- Amroune, S.; Blohm, M.; Bohm, S.; Far, S.; Zelt, O. Summary of Workshop Results: Scenario Development and Multi-Criteria Analysis for Tunisia’s Future Electricity System in 2050; Europa-Universitat Flensburg, Wuppertal Institute, International Institute for Applied Systems Analysis: Flensburg, Germany, 2018. [Google Scholar]
- Wiese, F. Renpass Renewable Energy Pathways Simulation System. Manual; Europa-Universität Flensburg: Flensburg, Germany, 2014. [Google Scholar]
- Wiese, F. renpass Renewable Energy Pathways Simulation System. Open Source as an Approach to Meet Challenges in Energy Modeling. Ph.D. Thesis, Europa-Universität Flensburg, Flensburg, Germany, 2015. [Google Scholar]
- Bohm, S. OEMoF and RenpassG!S. The fRamework and the Model. Mena Select Capacity Building Workshop, University of Jordan, Amman, 09.03.2017; Europa-Universität Flensburg: Flensburg, Germany, 2017. [Google Scholar]
- Wiese, F.; Hilpert, S.; Kaldemeyer, C.; Pießmann, G. A qualitative evaluation approach for energy system modelling frameworks. Energy Sustain. Soc. 2018, 8. [Google Scholar] [CrossRef]
- Christ, M.; Wiese, F.; Degel, M. Broadening the Energy Pathway Map: Integration of Socio-Ecological Dimensions into Techno-Economic Modeling; Europa-Universität Flensburg: Flensburg/Berlin, Germany, 2016. [Google Scholar]
- Sachverständigenrat für Umweltfragen (SRU). Wege zur 100% Erneuerbaren Stromversorgung. Sondergutachten; Sachverständigenrat für Umweltfragen (SRU): Berlin, Germany, 2011. [Google Scholar]
- Scholz, Y. Möglichkeiten und Grenzen der Integration Verschiedener Regenerativer Energiequellen zu einer 100% Regenerativen Stromversorgung der Bundesrepublik Deutschland bis zum Jahr 2050. Endbericht. Erstellt für den Sachverständigenrat für Umwelfragen; Deutsches Zentrum für Luft- und Raumfahrt (DLR), Sachverständigenrat für Umweltfragen (SRU): Stuttgart/Berlin, Germany, 2010. [Google Scholar]
- National Aeronautics and Space Administration (NASA), Global Modeling and Assimilation Office. Modern-Era Retrospective Analysis for Research and Applications, Version 2; National Aeronautics and Space Administration (NASA), Global Modeling and Assimilation Office: Washington, DC, USA, 2016. Available online: http://gmao.gsfc.nasa.gov/reanalysis/MERRA-2/ (accessed on 12 April 2016).
- National Renewable Energy Laboratory (NREL). System Advisory Model SAM. Financial Metrics: Levelized Cost of Energy (LCOE); National Renewable Energy Laboratory (NREL): Golden, CO, USA, 2016. Available online: https://www.nrel.gov/analysis/sam/help/html-php/index.html?mtf_lcoe.htm (accessed on 12 April 2016).
- Nørgaard, P.; Holttinen, H. A multi-turbine power curve approach. In Proceedings of the 4th Nordic Wind Power Conference (NWPC’04), Gothenburg, Sweden, 1–4 March 2004; pp. D1–D5. [Google Scholar]
- Zopounidis, C.; Pardalos, P.M. Handbook of Multicriteria Analysis, 1st ed.; Applied Optimization; Springer: Berlin/Heidelberg, Germany, 2010. [Google Scholar]
- Wang, J.J.; Jing, Y.Y.; Zhang, C.F.; Zhao, J.H. Review on multi-criteria decision analysis aid in sustainable energy decision-making. Renew. Sustain. Energy Rev. 2009, 13, 2263–2278. [Google Scholar] [CrossRef]
- Schinke, B.; Klawitter, J.; Döring, M.; Komendantova, N.; Irshaid, J.; Bayer, J. Working Paper—Electricity Planning for Sustainable Development in the MENA Region. Criteria and Indicators for Conducting a Sustainability Assessment of Different Electricity Generation Technologies in Morocco, Jordan and Tunisia; Germanwatch: Bonn, Germany; IIASA: Laxenburg, Austria, 2018. [Google Scholar]
- Saaty, T.L. Decision making with the analytic hierarchy process. Int. J. Serv. Sci. 2008, 1, 83–98. [Google Scholar] [CrossRef]
- Trieb, F.; Hass, D.; Kern, J.; Fichter, T.; Moser, M.; Pfenning, U.; Caldez, N.; de la Rua, C.; Türk, A.; Frieden, D.; et al. Bringing Europe and Third Countries Closer Together through Renewable Energies (BETTER); Deutsches Zentrum für Luft und Raumfahrt (DLR): Köln, Germany, 2015. [Google Scholar]
- Fichter, T.; Kern, J.; Trieb, F. The challenges of Jordan’s electricity sector. In Jordanien und Deutschland—Über die Vielfalt kultureller Brücken. Festschrift zum 50jährigen Bestehen der Deutsch-Jordanischen Gesellschaft e.V.; Präsidium der Deutsch-Jordanischen Gesellschaft e.V.: Cloppenburg, Germany, 2013; pp. 199–204. [Google Scholar]
- United Nations Conference on Trade and Development (UNCTAD). Development Status Groups and Composition; United Nations Conference on Trade and Development (UNCTAD): Geneva, Switzerland, 2018. [Google Scholar]
- Office National de l’Electricité et de l’Eau Potable du Maroc. Rapport d’Aktivités 2014; Office National de l’Electricité et de l’Eau Potable du Maroc: Rabat, Morocco, 2014. [Google Scholar]
- Office National de l’Electricité et de l’Eau Potable du Maroc. Rapport d’Activités 2016; Office National de l’Electricité et de l’Eau Potable du Maroc: Rabat, Morocco, 2016. [Google Scholar]
- United Nations Framework Convention on Climate Change (UNFCCC). Paris Agreement; UNFCCC: Bonn, Germany, 2015. [Google Scholar]
- Central Inteligent Agency (CIA). The World Factbook Morocco; Central Inteligent Agency (CIA): Langley, VA, USA, 2018.
- National Electric Power Co. (NEPCO). Annual Report 2014; National Electric Power Co. (NEPCO): Amman, Jorda, 2014. [Google Scholar]
- Central Inteligent Agency (CIA). Country Comparison: Natural Gas—Proved Reserves; Central Inteligent Agency (CIA): Langley, VA, USA, 2017. [Google Scholar]
- Société Tunisienne de l’Electricité et du Gaz. Rapport Annuel 2014; Société Tunisienne de l’Electricité et du Gaz: Tunis, Tunisia, 2014. [Google Scholar]
- El Khazen, A. Le Cadre Tunisien de Développement des Energies Renouvelables; Agence Nationale pour la Mâtrise de l’Energie (ANME): Tunis, Tunisia, 2017. [Google Scholar]
- Renewable Energy Solutions for the Mediterranean (RES4MED). Country Profiles Tunisia; Renewable Energy Solutions for the Mediterranean (RES4MED): Roma, Italy, 2016. [Google Scholar]
- Agence Nationale pour la Mâtrise de l’Energie (ANME). Nouvelle Version du Plan Solaire Tunisien. Programmation, Conditions et Moyens de Mise en œuvre; Agence Nationale pour la Mâtrise de l’Energie (ANME): Tunis, Tunisia, 2012. [Google Scholar]
- Sahara Wind. De la Genèse des Phosphates à une Transition Energétique: vers un Maroc Esportateur d’Energie Eolienne à Grande Echelle; Sahara Wind: Rabat, Morocco, 2016. [Google Scholar]
- Enefit. Oil Shale in Jordan. 2018. Available online: https://www.enefit.jo/en/oilshale/in-jordan (accessed on 14 May 2019).
- Harris, J.M.; Roach, B. Environmental and Natural Resource Economics. A Contemporary Approach; Routledge: New York, NY, USA; London, UK, 2018; Volume 4. [Google Scholar]
- Dettner, F. External Cost of Energy Generation in Morocco. Master’s Thesis, Europa-Universität Flensburg, Flensburg, Germany, 2018. [Google Scholar]
- Maas, H. Towards CO2eq-Neutral Cities: A Participatory Approach Using Backcasting and Transition Management. Ph.D. Thesis, University Flensburg, Flensburg, Germany, 2014. [Google Scholar]
- Komendantova, N.; Irshaid, J.; Marashdeh, L.; Al-Salaymeh, A.; Ekenberg, L.; Linnerooth-Bayer, J. Background Paper: Country Fact Sheet, Jordan. Energy and Development at a Glance; Bonn International Center for Conversion: Bonn, Germany, 2017. [Google Scholar]
- The World Bank. World Development Indicators; The World Bank: Washington, DC, USA, 2018. [Google Scholar]
- Crawford, G.; Williams, C. A note on the analysis of subjective judgment matrices. J. Math. Psychol. 1985, 29, 387–405. [Google Scholar] [CrossRef]
- Viebahn, P.; Soukup, O.; Samadi, S.; Teubler, J.; Wiesen, K.; Ritthoff, M. Assessing the need for critical minerals to shift the German energy system towards a high proportion of renewables. Renew. Sustain. Energy Rev. 2015, 49, 655–671. [Google Scholar] [CrossRef]
- Teske, S. (Ed.) Achieving the Paris Climate Agreement Goals: Global and Regional 100% Renewable Energy Scenarios with Non-Energy GHG Pathways for +1.5 °C and +2 °C; Springer International Publishing: Basel, Switzerland, 2019. [Google Scholar]
- Palzer, A.; Henning, H.M. A comprehensive model for the German electricity and heat sector in a future energy system with a dominant contribution from renewable energy technologies—Part II: Results. Renew. Sustain. Energy Rev. 2014, 30, 1019–1034. [Google Scholar] [CrossRef]
- Blakers, A.; Lu, B.; Stocks, M. 100% renewable electricity in Australia. Energy 2017, 133, 471–482. [Google Scholar] [CrossRef]
- Connolly, D.; Lund, H.; Mathiesen, B.V. Smart Energy Europe: The technical and economic impact of one potential 100% renewable energy scenario for the European Union. Renew. Sustain. Energy Rev. 2016, 60, 1634–1653. [Google Scholar] [CrossRef]
- Brown, T.W.; Bischof-Niemz, T.; Blok, K.; Breyer, C.; Lund, H.; Mathiesen, B.V. Response to ‘Burden of proof: A comprehensive review of the feasibility of 100% renewable-electricity systems’. Renew. Sustain. Energy Rev. 2018, 92, 834–847. [Google Scholar] [CrossRef]
- IPCC. IPCC Special Report on Renewable Energy Sources and Climate Change Mitigation. Prepared by Working Group III of the Intergovernmental Panel on Climate Change; Technical Report; Cambridge University Press: Cambridge, UK; New York, NY, USA, 2011. [Google Scholar]
- Krey, V.; Clarke, L. Role of renewable energy in climate mitigation: A synthesis of recent scenarios. Clim. Policy 2011, 11, 1131–1158. [Google Scholar] [CrossRef]
- World Nuclear Association. Nuclear Power in Jordan; World Nuclear Association: London, UK, 2019. [Google Scholar]
© 2019 by the authors. Licensee MDPI, Basel, Switzerland. This article is an open access article distributed under the terms and conditions of the Creative Commons Attribution (CC BY) license (http://creativecommons.org/licenses/by/4.0/).