1. Introduction
Current concerns about energy efficiency in the building sector yield a number of design strategies to achieve nearly zero energy buildings, such as ventilated façades. Different types of ventilated façades are incessantly the subject of research that could help to improve their usage in public buildings.
Concerning naturally ventilated double-skin façades (DSF), authors highlighted dependence of an optimum cavity depth on many factors; for example, climatic conditions, material and size of the double façade, concluding that double façades could be simple and efficient alternatives to improving the thermal performance of buildings. Souza et al. [
1] investigated the efficiency of a DSF in Brazil. Their results showed that this DSF could contribute to the reduction of the temperature of the wall surfaces and reduce the heat gains indoors. Başaran and İnan [
2], and Inan and Başaran [
3] tested DSF in an office building located in Turkey. They aimed at analyzing the effect of perforated elements on pressure drop in a double skin façade cavity, studying the surface and air temperature distributions in the cavity, the pressure drops under different air flow rates and different perforated plates.
When compared to SSF (single side façade), DSF showed unfavorable results in January (winter) there was an external airflow within the cavity. However, it showed better energy performance in July (summer). Using DSF in all directions, the cooling loads decreased up to 26% comparing to the SSF. Zomorodian and Tahsildoost [
4] tested DSF in an office building in Iran. Authors proposed a model that could help to avoid overheating of indoor spaces in warm climates. It was selected based on minimum energy demand and the maximum thermal comfort hours, yielding a reduction of the energy consumption from 7.9% to 14.8%. Larsen at al. [
5] tested a double-glazed façade (DGF) in an office building in Argentina, concluding that well-designed double glazed façades could reduce the cooling energy consumption.
Scientists, engineers and policy makers focus on net zero energy buildings (nZEB), especially for new building designs through the application of modern materials and technologies. However, existing research also approaches the possibility to achieve the nZEB target by combination of envelope and technical building systems refurbishment for existing structures, as studied by Ballarini et al. [
6].
Lately, building-integrated photovoltaic (BIPV) systems are becoming more and more common in modern public buildings, where PV (photovoltaic) panels replace conventional construction materials of the building’s envelope [
7]. Since the moment when the first BIPV system had been installed in Germany [
8], many researchers have focused their work on different types of PV façades. Indeed, Biyik et al. [
9] examined studies regarding BIPV systems and found that about half of the existing research had been focused on façades.
Many factors influence the energy performance of BIPV façades, as studied by Shahrestani et al. [
10] in a southeast facing façade. Also Gaillard et al. [
11,
12] and Saadon et al. [
13] studied the performance of a PV envelope prototype in an office building in France. The façade comprised tinted double glass PV modules and fully transparent tinted panels. Authors developed a model that was found to slightly overestimate the stack effect during the periods when it was the main driving force of air flow in the cavity, and that tended to underestimate peaks in mass flow rate during periods of low radiation. The PV double-skin prototype resulted in a slight increase in cooling needs for all the French climates considered, whereas the impact of the façade on heating needs turned out to be not predominant from the energetic point of view. Regarding the factor of the air gap within the façade, Agathokleousa and Kalogiro [
7] found that in Cyprus conditions, an air gap of 0.1 m could create adequate air flow on naturally ventilated systems and was able to ensure low PV temperatures to avoid efficiency decrease. In addition, Gan [
14] investigated the air gap in BIPV systems required to reduce PV overheating.
Concerning the effect of different configurations of BIPV façades, Lau et al. [
15] analyzed the cell temperature in these systems under various configurations, including for example the PV periphery openings in a warm climate. The results of simulations showed that in the case where the areas of the top and bottom openings were the same, there was limited air ventilation behind air cavity. Li et al. [
16] also studied the surface temperature on naturally-ventilated PV façades of a public building in China. According to their findings, the high surface temperature of the PV module could be overcame by introducing natural ventilation to the PV façade through the air cavity formed by the PV panel and the external wall. Moreover, the PV cell efficiency of the naturally-ventilated PV façade turned out to be slightly higher (0.25–0.29%) than a conventional PV façade due to lower surface temperatures. Further applications of BIPVs were described by Quesada et al. [
17,
18] as well as by Biyik et al. [
9].
Investigation into DSFs apply both simulations and the development of theoretical models. Dama et al. [
19] developed a thermal model suitable for integration in building with DSF simulations. while Valentin et al. [
20] evaluated the feasibility of using nozzles for DGF ventilation. Authors used a CFD model to simulate a Coanda˘ nozzle for different flow rate conditions and to obtain velocity and pressure fields in its outlet. Coussirat et al. [
21] highlighted the importance of applying proper turbulence and radiation models in DGF problems. They evaluated the performance of three different radiation models available for simulations in the CFD (computational fluid dynamics) solver to select the model that showed the best fitting to the experimental results. Models recommended in [
21] were applied in the CFD simulations by Guardoa et al. [
22] to study several ventilation systems. Elarga et al. [
23] developed a simplified mathematical model for dynamic simulation of the thermal performance of DSFs and compared its usefulness with a detailed simulation model DIGITHON.
As showed in the existing literature, researchers resort to a number of methods and models for simulations. Some researchers like Gan [
14] conducted a CFD (computational fluid dynamics) analysis. Hailu et al. [
24] used the CFD for testing forced convection. An approach for energy modelling of BIPV was showed by Koyunbaba et al. [
25]. In this work, the CFD code AnsysCFX was used to model airflow and heat transfer with the Navier–Stokes equations. The simulations were performed for transient conditions using a k-epsilon turbulence model. The importance of the CFD is highlighted by Linfield and Mudry [
26], who outlined its applicability for solving heat transfer problems involving conduction, convection or radiation. This allows for a consideration of temperature variations or changes in fluid parameters like density, viscosity or thermal conductivity.
Review work developed by Biyik et al. [
9] showed that software like TRNSYS and EnergyPlus were among the most commonly used. Shahrestani et al. [
10] developed and experimentally validated a model in TRNSYS that demonstrated the improvement in the efficiency of the system by ventilation. Andelkovic et al. [
27] created a model in EnergyPlus combined with an air network algorithm. As noted by authors, there were no guidelines and standards available at the time the paper was written, regarding a procedure of predicting temperature and air flow. Their model was verified and was in good agreement for most conditions; however, there was a high level of disagreement between measurements and simulations concerning the cavity air velocity. The published results from simulations that used various approximations and assumptions, showed on the overall acceptable accuracies; thus, different methods can lead to proper conclusions.
Existing research also makes use of other software rather than TRNSYS or EnergyPlus. and CFD models. Agathokleousa and Kalogiro [
7] used a simulation model created in COMSOL Multiphysics. Dama et al. [
19] applied a BS model based on a pressure loop and heat transfer along the inside space of the DSF, whilst Frilling at al. [
28] studied the influence of forced ventilation with fins in the air gap. The latter used grey-box modelling and considered a continuous-discrete stochastic state space model (using CTSM—continuous time stochastic modelling program). Sánchez-Palencia et al. [
29] proposed a model based on the physics of heat transfer and optics to estimate the temperature of BIPV modules and their thermal transmittance in real operating conditions. A one-dimensional approach was considered, taking the depth of the PV module as the characteristic dimension, disregarding the thermal gradients in the plane perpendicular to the characteristic direction, neither the lateral losses through the frame. Simulations carried out in MATLAB language showed 35% difference in the global heat transfer coefficient, between PV and common glazing, under high irradiance conditions.
In this paper, the PV integrated ventilated façade of an existing nZEB in Spain is studied. It presents results from the experimental validation of a mathematical model that describes the behavior of the ventilated façade in its current operating modes. The model is later used to study the applicability of an alternative operating mode during winter.
2. Materials and Methods
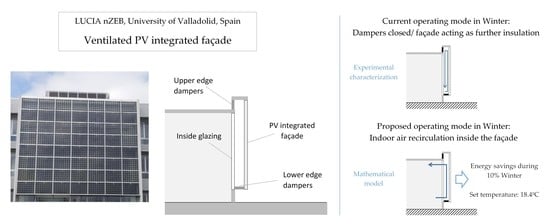
The present work focuses on the east-south oriented ventilated façade of a near zero energy building (nZEB) called “LUCIA” of the University of Valladolid, Spain (
Figure 1). It is equipped with a number of strategies such as an earth-air heat exchanger, tri-generation, heat recovery and free cooling, among others; together with a bioclimatic design that yielded a LEED platinum certification [
30,
31].
Figure 1 shows the target façade from different points of view, identifying the zones considered in the definition of the model presented in
Section 2.2.
The photovoltaic-ventilated façade has 56 PV modules composed of 6” polycrystalline cells. Each module has 180 W and dimensions 1730 × 1015 × 35 mm. Dimensions of the ventilated façade are 12.8 m width and 10.5 m height and it is orientated 35° south. It is therefore covered by more than 70% by the PV modules. It projects 1.1 m from the main wall, which corresponds with the façade depth.
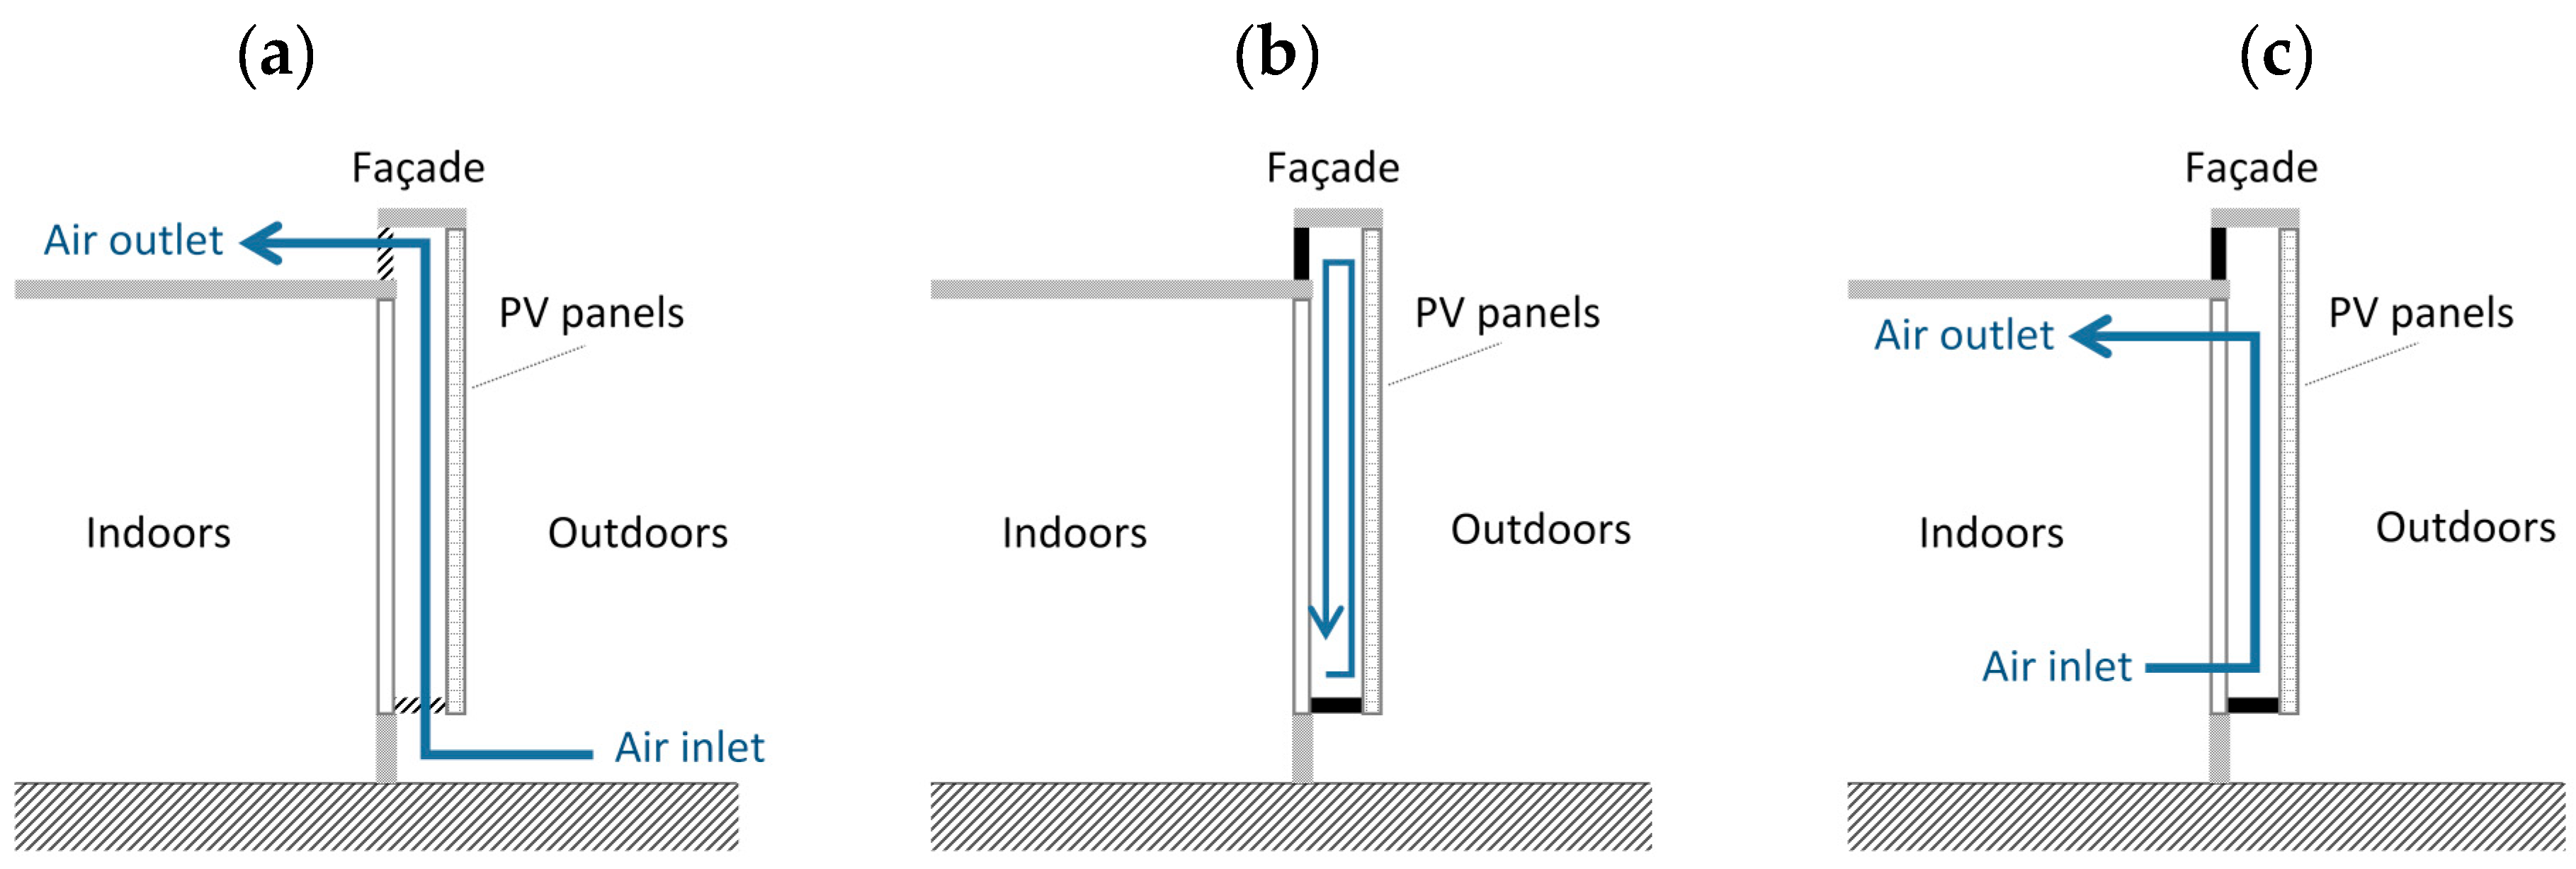
The façade has dampers in the lower and upper edges. These dampers permit two operating conditions of the ventilated façade: Either air circulation inside or acting as an additional insulation (
Figure 2a,b). In correspondence with the existing literature [
32,
33], the former operating mode is currently preferred during summer, aimed at reducing the air temperature inside the façade, yielding lower thermal loads and better performances of the PV modules; whereas the latter is mostly implemented during winter. This article focuses on wintertime, proposing the recirculation of indoor air inside the façade as an alternative operating mode (
Figure 2c).
This work develops the experimental characterization of the façade thermal behavior under its current operating mode during winter (
Figure 2b), with the final target of proposing the alternative operating mode of air-recirculation (
Figure 2c), which may reduce further the thermal needs of the building. This alternative proposed would actually entail energy savings when thermal gains through radiation surpass the thermal losses through conduction-convection in the outer surface of the façade.
2.1. Characterization of the Ventilated Façade
The experimental characterization of the ventilated façade is developed at two levels: First, through determination of its radiative properties, which will be needed for the mathematical model proposed; then, the measurement of the air properties evolution inside the façade will provide data for the model validation.
Comparison among measurements of the surface temperature though surface sensors and a thermal camera permit determination of the façade radiative properties.
The measuring of the air dry-bulb temperature (DBT) and relative humidity (RH) inside the ventilated façade, indoors and outdoors, as well as solar irradiation, enable the thermal characterization. This paper presents results obtained from measurements registered each 5 min during the period from 5 November to 5 December and each 10 min from 18–28 February. These periods were selected for being wintertime with different solar radiation.
Table 1 gathers the characteristics and position of the different sensors used.
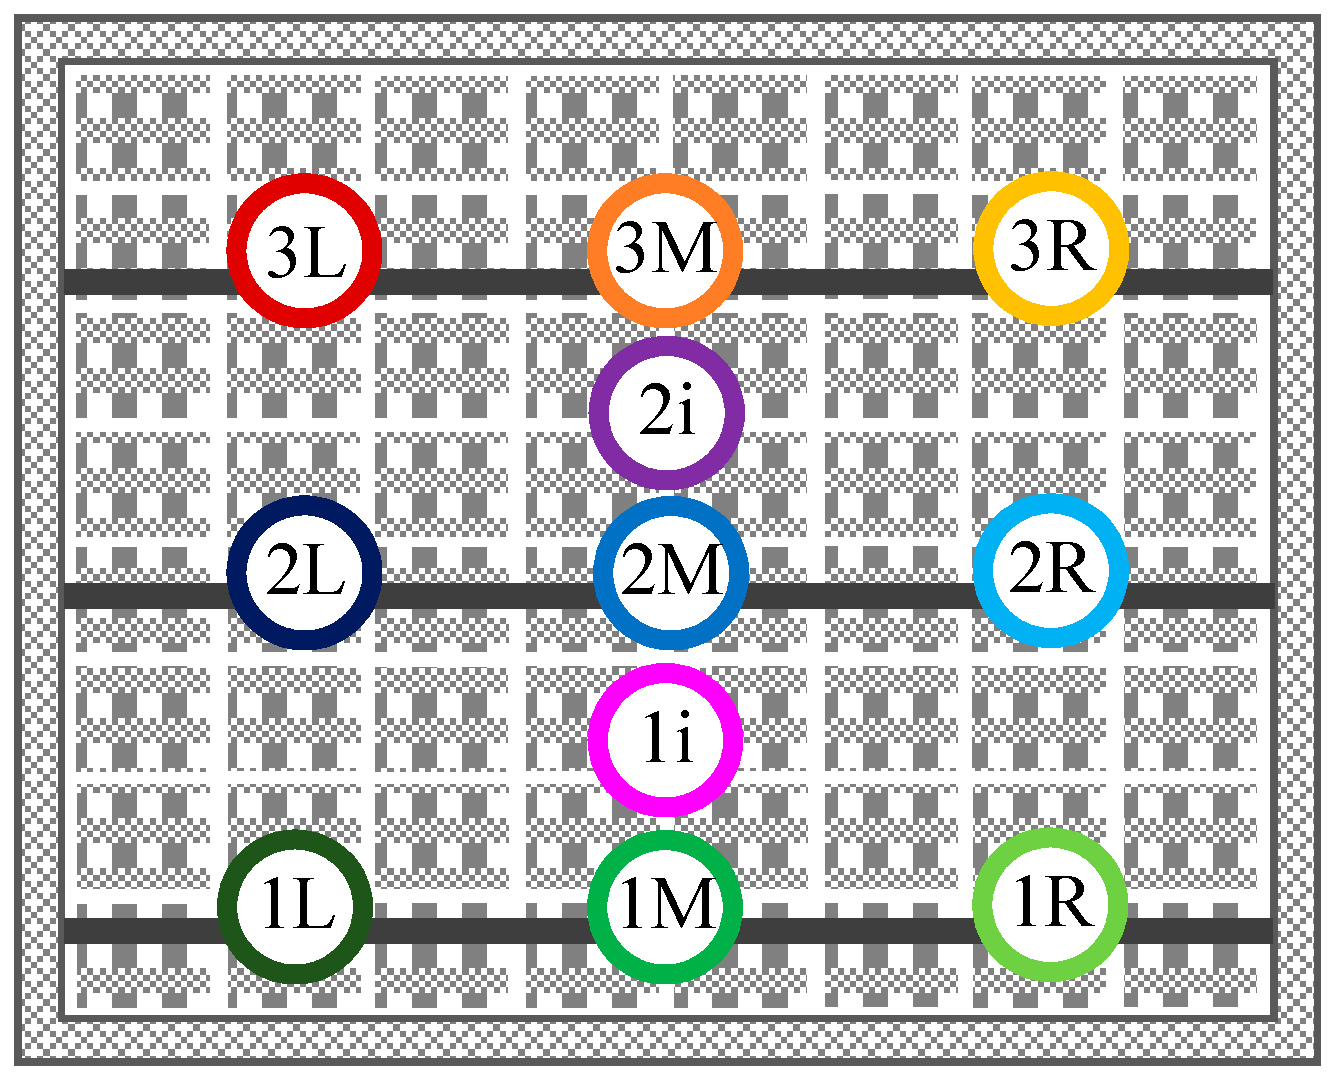
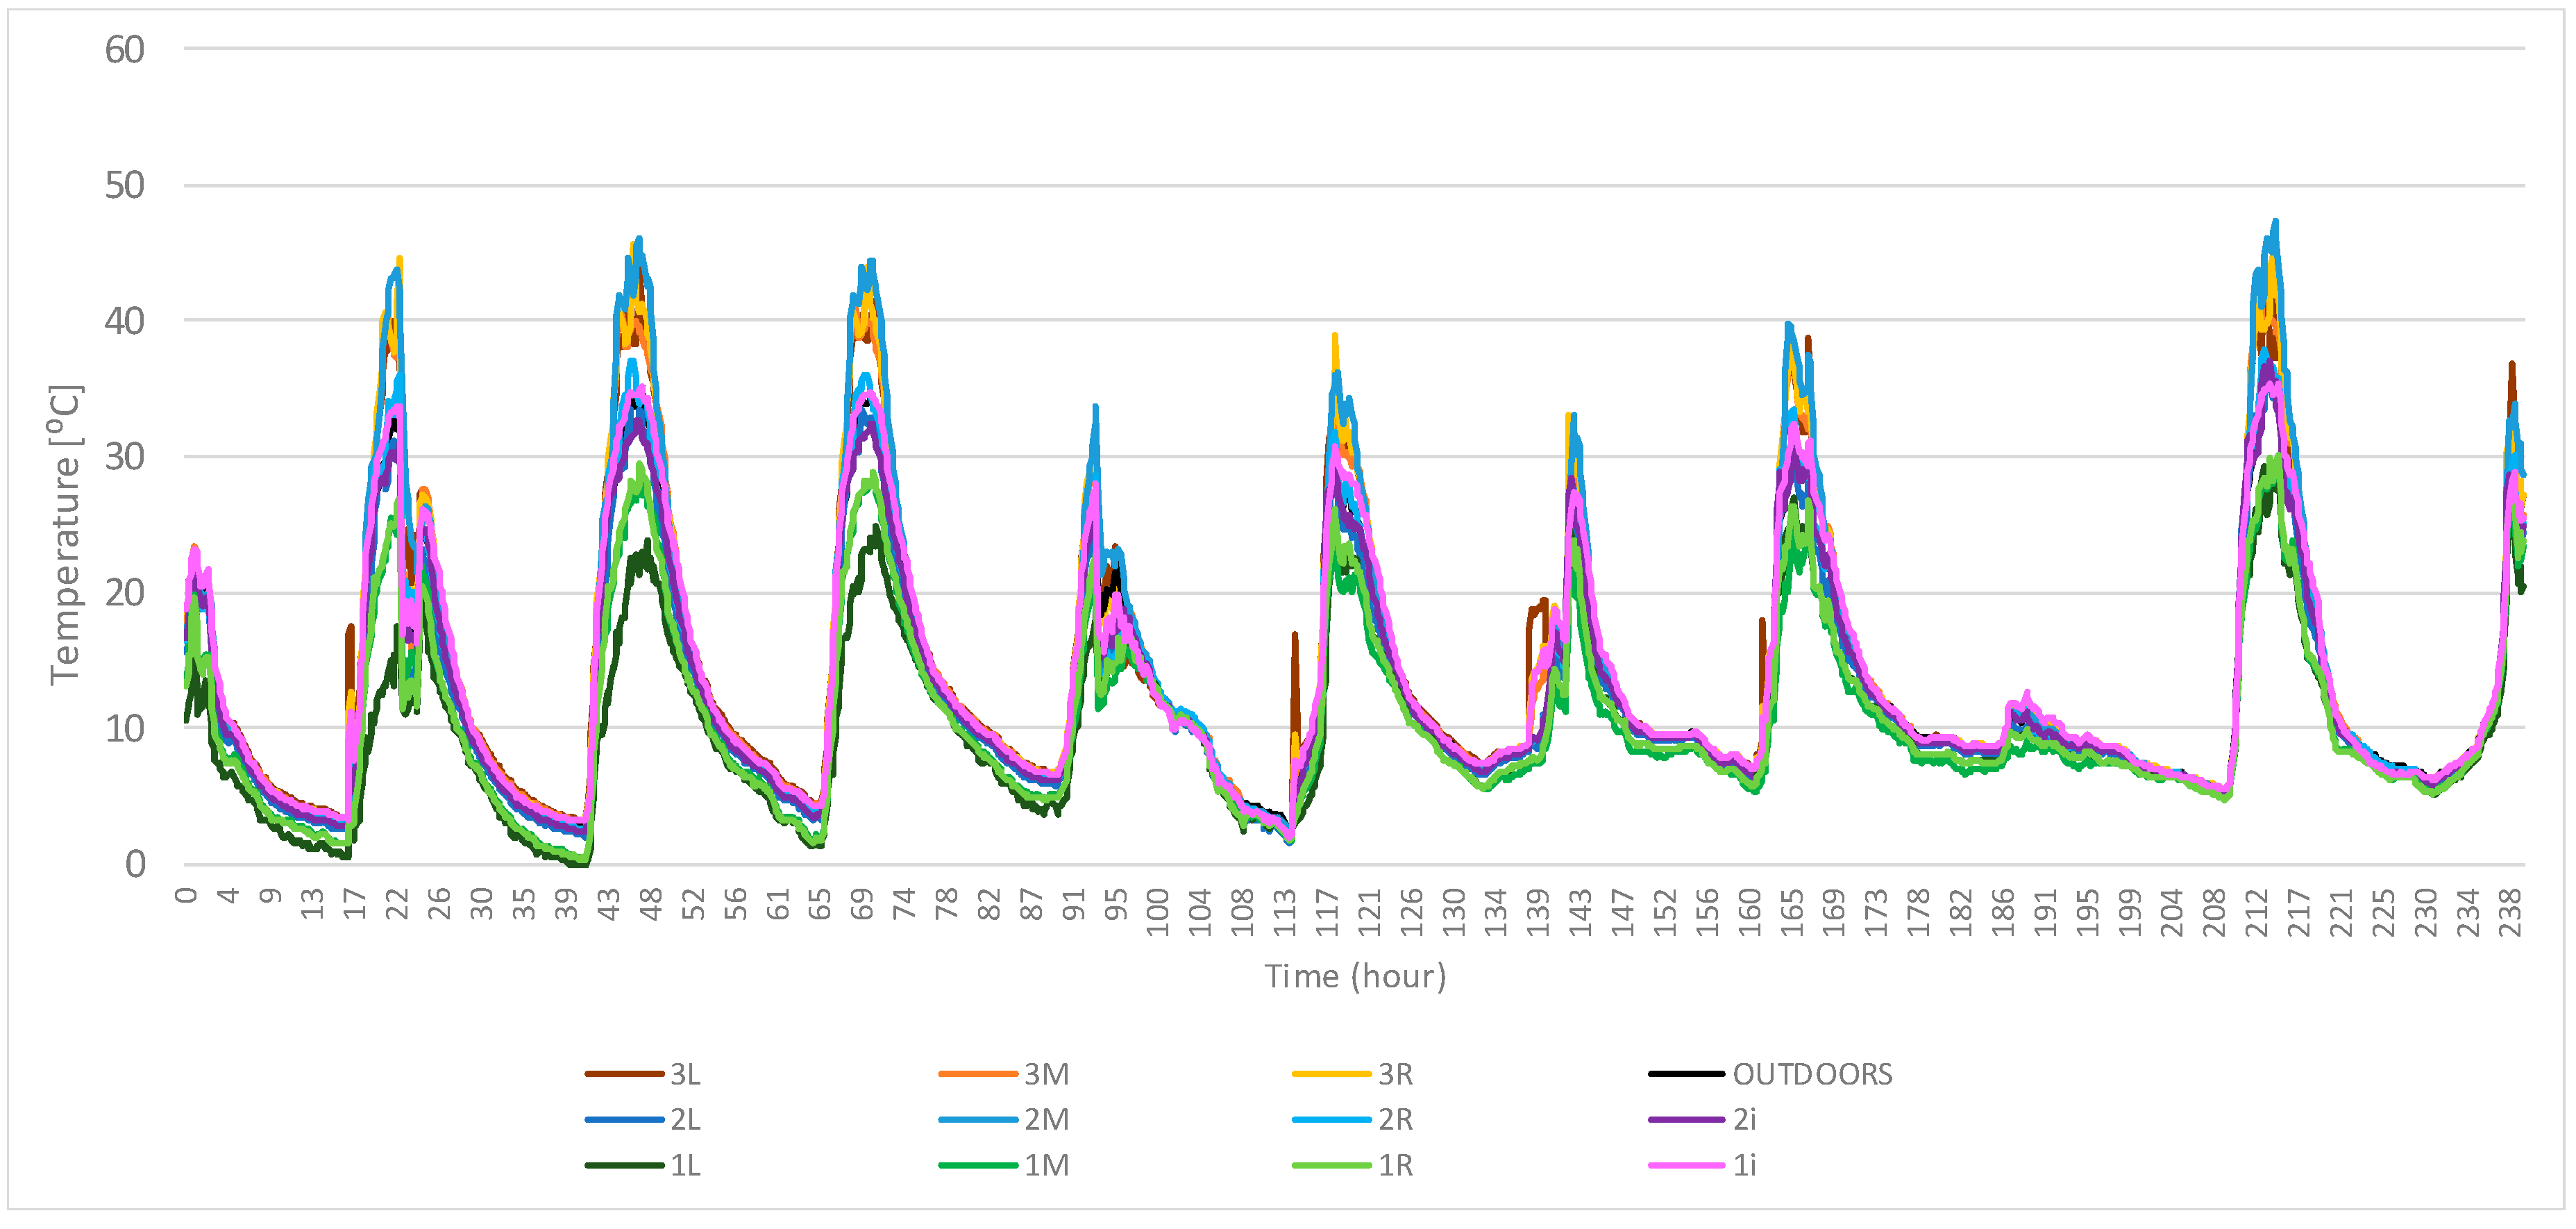
There are nine sensors for DBT measuring inside the façade: At three different points along its width at each of the three floors of the building. This allows demonstration that there are no temperature gradients along the façade width. Indoor air DBT is measured at the first two floors of the building, as there is no occupied space in the third floor. Because the indoors next to the façade are open, common spaces, only one sensor per floor is placed at the occupied space.
Figure 3 outlines the position of these sensors within the façade (nomenclature used for the temperature sensors corresponds to a number and a letter, namely the floor and the position: left-middle-right inside the façade or “
i” indoors; e.g., 1 L means first floor, left position).
2.2. Energy Balances in the Façade
In this section, a model is proposed to predict the temperatures inside the façade. The model is based on energy balances defined in the eight different zones of the ventilated façade identified in
Figure 1.
Firstly, an energy balance between the air within the façade and the outdoors is set out on the outer surface of the façade as given in Equation (1):
where, for each section of the façade section studied “
i”, A is the outer surface area (m
2),
Qsun the irradiation (W/m
2),
Qin the heat transferred to the air inside the façade (W) and
Qout the heat dissipated outdoors (W).
Qsun is obtained from the irradiation on a horizontal surface, related in direct proportion by a factor
Ksun,i, different for each zone
i. This factor considers the required corrections related to the absorptivity, azimuth and slope of the surface. No shadowing effects are considered, due to the non-existence of near buildings or trees. Consequently:
where the correction factor,
Kαβ, i, for each possible combination of slopes and azimuths is given in
Table 2. Zones one, seven and eight never get direct radiation, whereas surface five is horizontal and needs no correction. The absorptivity of each surface,
αi, is determined experimentally, as described in
Section 3.1.
Once the irradiation available is known, Equation (1) is developed considering the conduction-convection heat transfer resistances [
34] between the outdoors and the façade (
Rout) and between the façade and the indoors (
Rin), both in K∙m
2/W.
where
Tc is the temperature inside the façade, in
K. The temperature on the outer surface of the façade,
Tp, can then be obtained through Equation (5):
Being
Tout the temperature outside of the building, in
K. Then the heat transferred to the inside of the façade can be obtained through Equation (6):
For each zone
i, the thermal resistances calculated are gathered in
Table 3.
Determination of the air temperature within the ventilated façade (
Tc) needs a further balance for the inner surface of the façade to contemplate the radiant heat transfer. For the façade under insulation mode:
where
QG is the indoor heat gain due to the solar irradiation and
Qbuild the heat transferred to the building indoors (W). Solar gain,
QG, is then obtained from the sum of solar irradiation on the different outer surfaces (zones two to six), subtracting the radiation transmitted through the indoor glazed surface of the façade (zone one):
where constants
Kc,i are:
Being
τi the transmittance of the particular surface, which has been experimentally calculated as described in
Section 3.1.
This balance can be expressed by Equation (9):
where
B and
C are two values related to the surface area, the thermal resistances involved and the radiant characteristics of the surfaces:
Values obtained for constants
B and
C for each surface
i are gathered in
Table 3.
To study the air-recirculation mode, the above model needs adaptation. Under this operating mode, the heat balance for the outer surface of the façade (Equation (1)) and thus the heat transferred to the inside of the façade (Equation (6)) are the same. However, the heat transferred to the building indoor space occurs in this case not only by transmission through the inner surface of the façade (
Qbuild), but also through the air recirculated inside (
Qair):
In this case, the temperature inside the façade turns to be:
where
is the air mass flow recirculated in kg/s and
cp the specific heat capacity of air, considered 1.012 kJ/(kg∙K).
3. Results
3.1. Radiative Properties of the Façade
Firstly, the radiative properties of both surfaces of the ventilated façade are determined. Transmissivity is calculated from the difference between the solar irradiation measured indoors and the value measured outdoors. Measures are performed around midday, for homogeneity. It is calculated for both the glass and the PV modules.
Absorptivity is determined through comparison between the measured values with the thermal camera and the surface temperature. When both values correspond, emissivity selected in the thermal camera should coincide with the actual emissivity of the surface.
Table 4 gathers these results, which are used in the model implementation.
3.2. Operating Behavior of the Façade
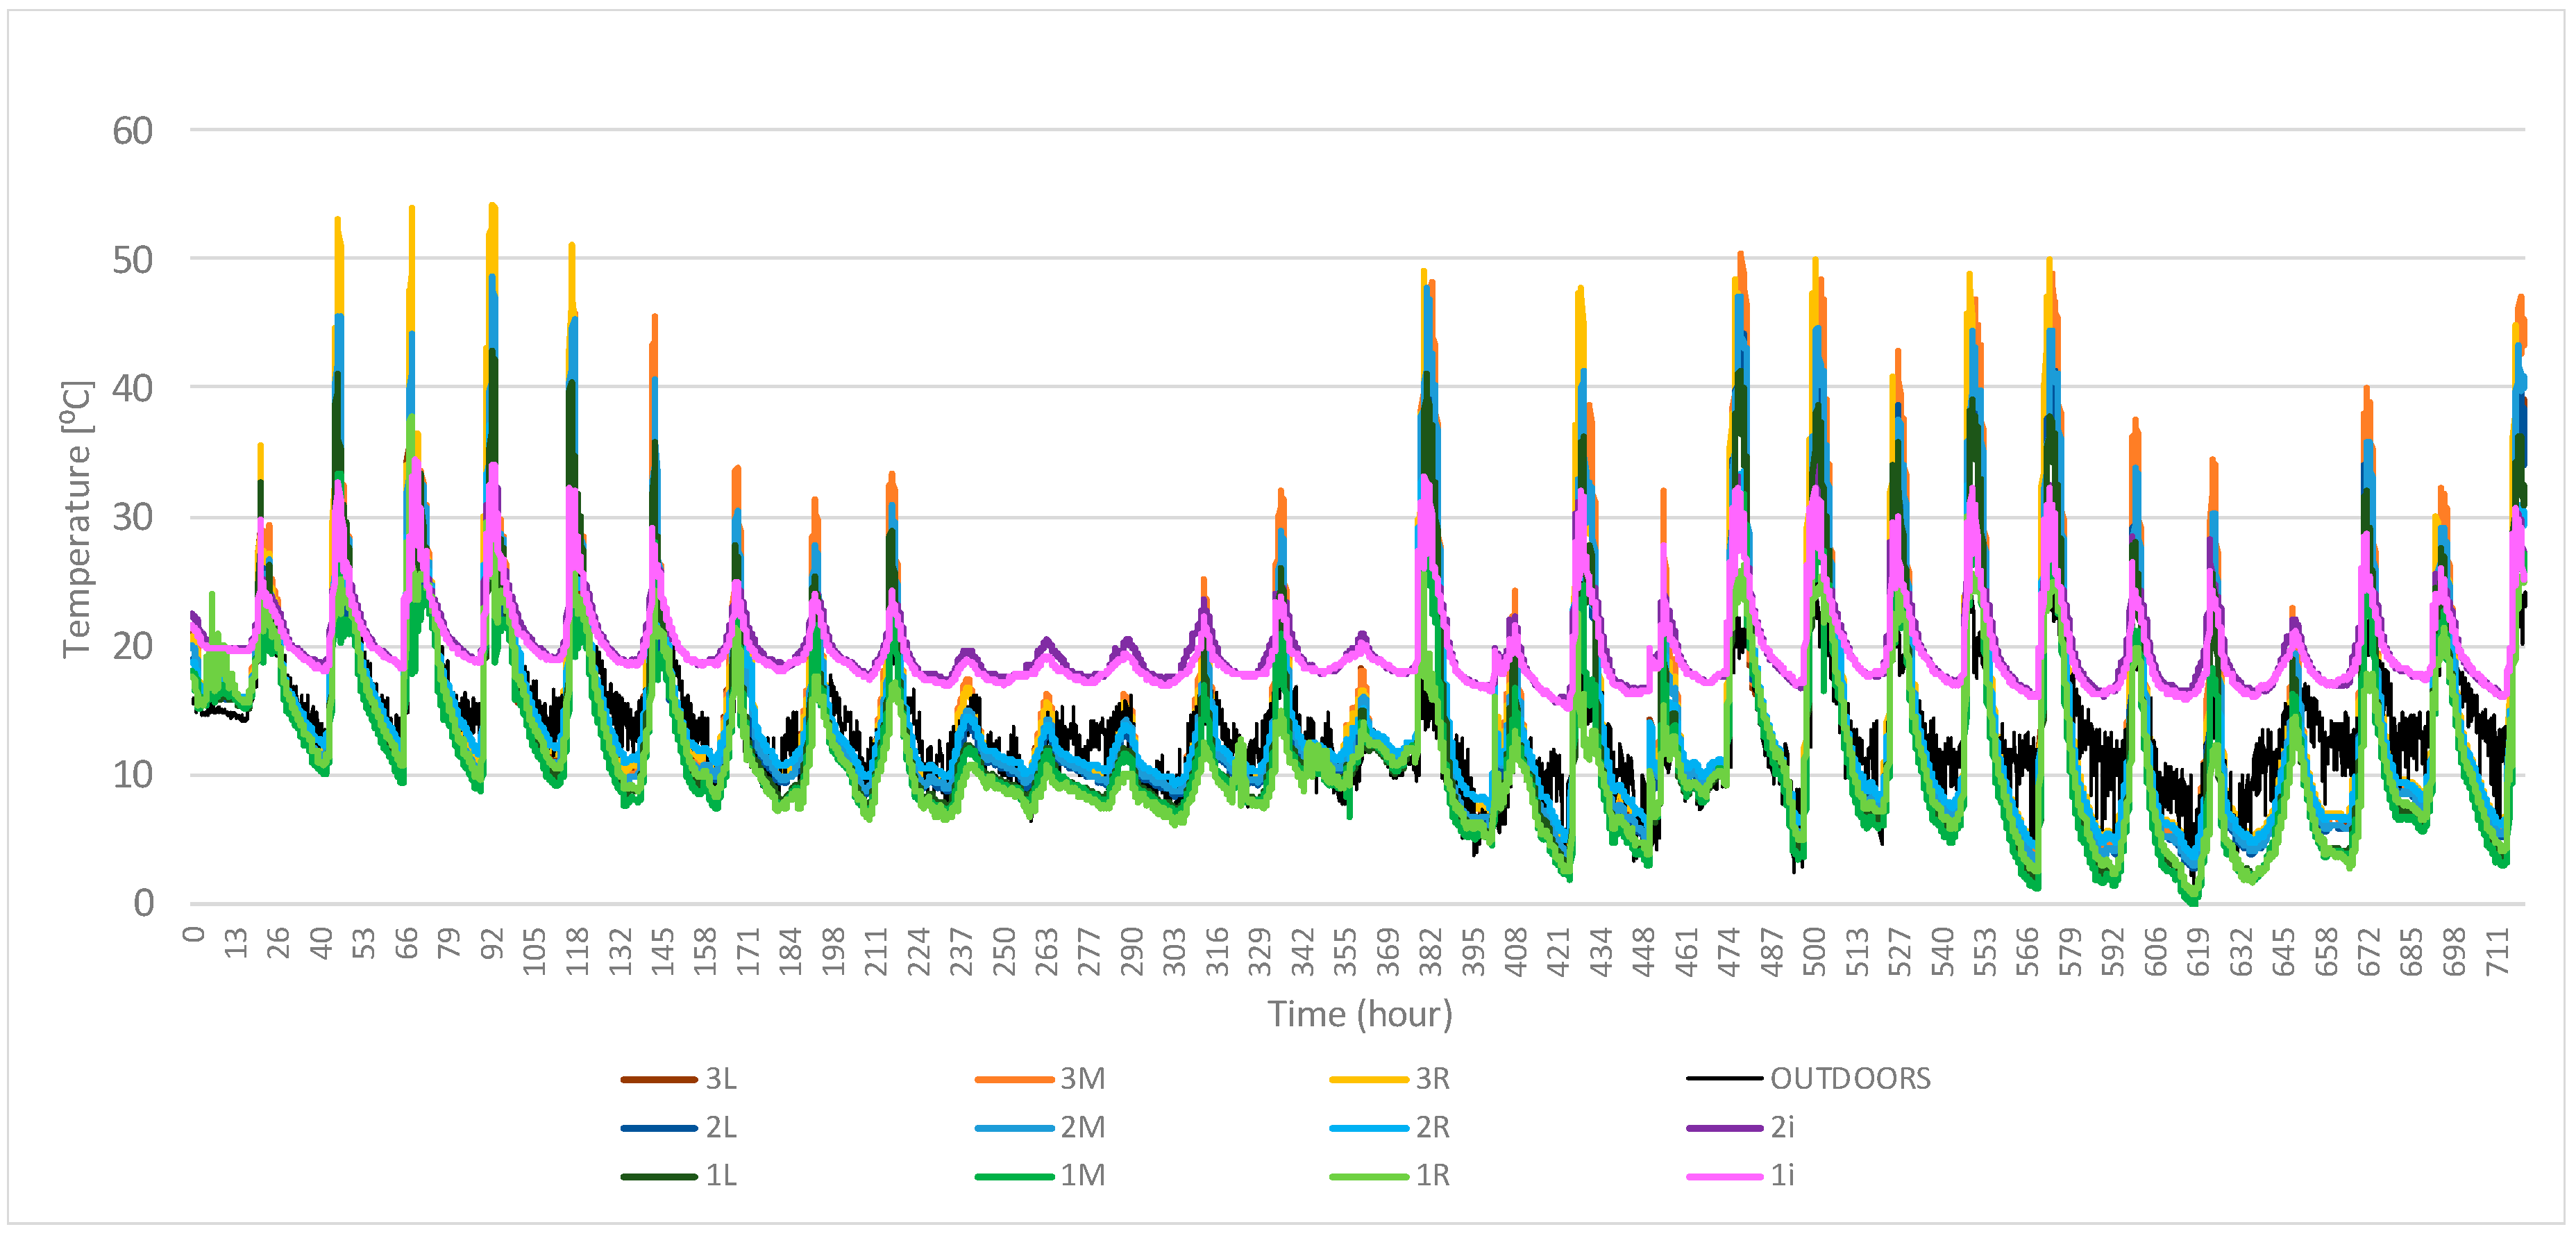
Figure 4 shows the evolution of the different temperature measured inside the façade, indoors and outdoors during the first target period (from 5 November to 5 December). It should be noted that, during this period, the façade operates only as a further insulation. Nomenclature used corresponds to the scheme shown in
Figure 3.
During nighttime, there is a drop in the air DBT within the façade, but these temperatures increase above the values registered inside the building during daytime.
The analysis of the standard deviation of temperatures measured at each floor inside the façade permit identification of possible temperature gradients along the façade width. These standard deviations remain under the uncertainty of the measure for 27%, 12% and 51% of time for first, second, and third floors. The highest differences arise during periods of high irradiance. However, there is no pattern, and consequently, no relevant temperature gradients along the façade width, being the differences observed due to the effect of uncontrolled factors in their particular position.
Indoor temperatures measured in the first and second floor are similar. Standard deviation remains under the uncertainty of the measure during 67% of time. Peaks registered evidence that these sensors can be affected by solar radiation, hence not properly shielded.
The fact that indoor temperatures may exceed comfort values is not relevant, as sensors are near the façade in a non-occupied zone. Indeed, temperatures in the occupied zone during the target period remained between 20 and 24 °C, thanks to the heating, ventilation and air conditioning (HVAC) system control.
Figure 5 presents the evolution of the same measured values during the second target period (from 18–20 February).
Maximum temperatures reached inside the façade are lower than those registered during the first period because February is a colder month in Valladolid, as demonstrate the lower temperatures registered by the “outdoor” sensor. Indoor temperatures also follow this trend, which shows that the HVAC system may have not been controlling the indoor comfort in these spaces during this period, due to any reason external to the present study. It is important to note that these measuring periods belong to the first year of the building operation and that it may have been subject to other tests simultaneously.
During this period, standard deviation of temperatures inside the façade remain under the uncertainty of the measure for 60%, 54% and 79% of time for first, second, and third floors. Again, the highest differences occur during periods of high irradiance, but there are no clear temperature gradients along the façade width.
3.3. Predicted Temperatures inside the Façade
To check validity of the model, air temperatures predicted inside the façade when closed and acting as further insulation are compared to the measurements available under this operating mode.
Figure 6 illustrates the difference between the predicted value through the model and the average measured one for a sample period (5–15 November). It can be seen that the model misestimates the temperature inside the façade during the periods of high irradiance. For the dates and the façade orientation, these periods are from 10:00 to 15:00.
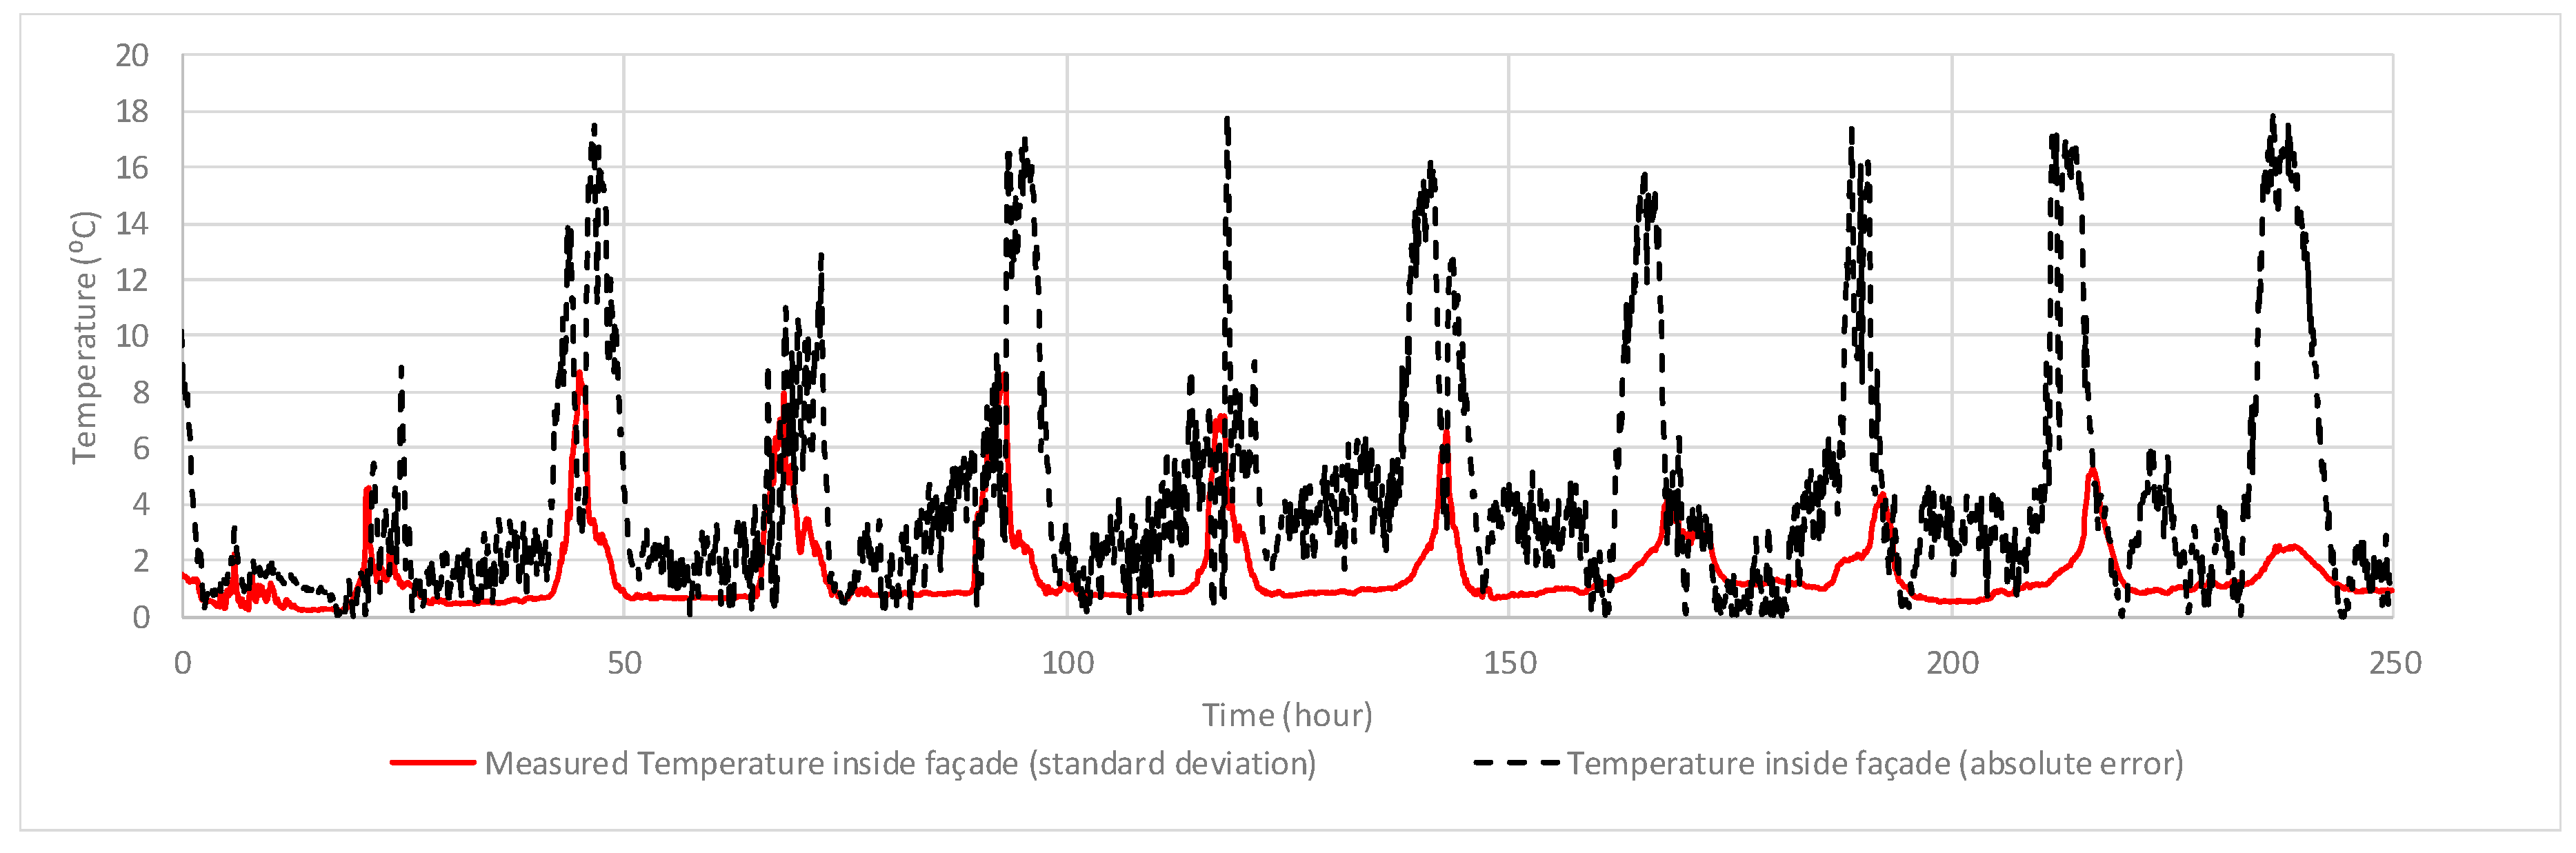
It is noted that the standard deviation of the measurements presents the highest values during these periods of high irradiance (
Figure 7). This is due to the limitations mentioned above about the experimental measurements performed inside the façade, related to the shielding of the temperature sensors.
Actually, when the error reaches the maximum values (of up to 21 °C), the standard deviation also reaches its maximum (of up to 10 °C). It is thus concluded that, during these periods, the model does not diverge from the actual temperatures achievable inside as much as the values of the absolute errors could predict.
On the other hand, the PV modules described in
Section 2 have a series resistance of 0.3 Ω and provide a current flow of 7.7 A under nominal conditions, which would not diverge much from the actual ones during winter period. The whole PV façade would yield a maximum thermal power of 1 kW
t; even supposing that no heat is dissipated to the outdoors, it cannot be the cause of such difference of temperatures between the measuring and the model.
Consequently, the difference between the model and the measured values can be due to several factors, among which is the variability in the measurements due to the difficulties of properly shielding the sensors.
Considering the above results, the present approach is limited in terms of prediction of air temperatures inside the façade, being applicable only beyond the periods of high irradiance, when the error is restricted to the order of magnitude of the measurements uncertainties. Nevertheless, given the fact that the model provides a fair prediction of the temperature evolution, it can be applied to estimate when the thermal conditions inside the façade would make different alternatives preferable to the current operating mode. This last approach is developed in the next section.
4. Discussion
As introduced in section two (
Figure 2), currently the façade only permits dampers opening and closing for two configurations: Acting as an additional insulation to the building or enabling outdoor air circulation inside. As mentioned before, the former mode is preferred during winter.
There exist alternative operating modes of the façade that can entail further thermal energy savings during winter: Indoor air recirculation inside the façade, preheating of ventilation air, and a combination of the former two. If the radiant thermal gains by way of the outer surface of the façade surpass the thermal losses due to conduction-convection, then air preheating or recirculation may provide further energy savings than the insulation mode.
However, the implementation of ventilation air preheating is not possible in this case study due to physical constraints, as the target building is an existing construction. The air handling unit, originally designed to permit air pretreatment through a heat recovery system or the existing earth-air heat exchanger (EAHE) [
35], is thus placed close to the EAHE and not easily accessible from the ventilated façade. Concerning the air recirculation operating mode, its implementation is feasible with small changes in the inside surface of the existing façade. Consequently, this work focuses on this last option to improve the energy savings introduced by the ventilated façade. A scheme of this mode was shown in
Figure 2c.
There is a need of identifying a control condition to determine when it is preferable either to recirculate air inside or to maintain the air enclosed within the façade. To identify this set point, the model has been implemented considering the alternative of the air-recirculation operating mode described in
Section 2.2.
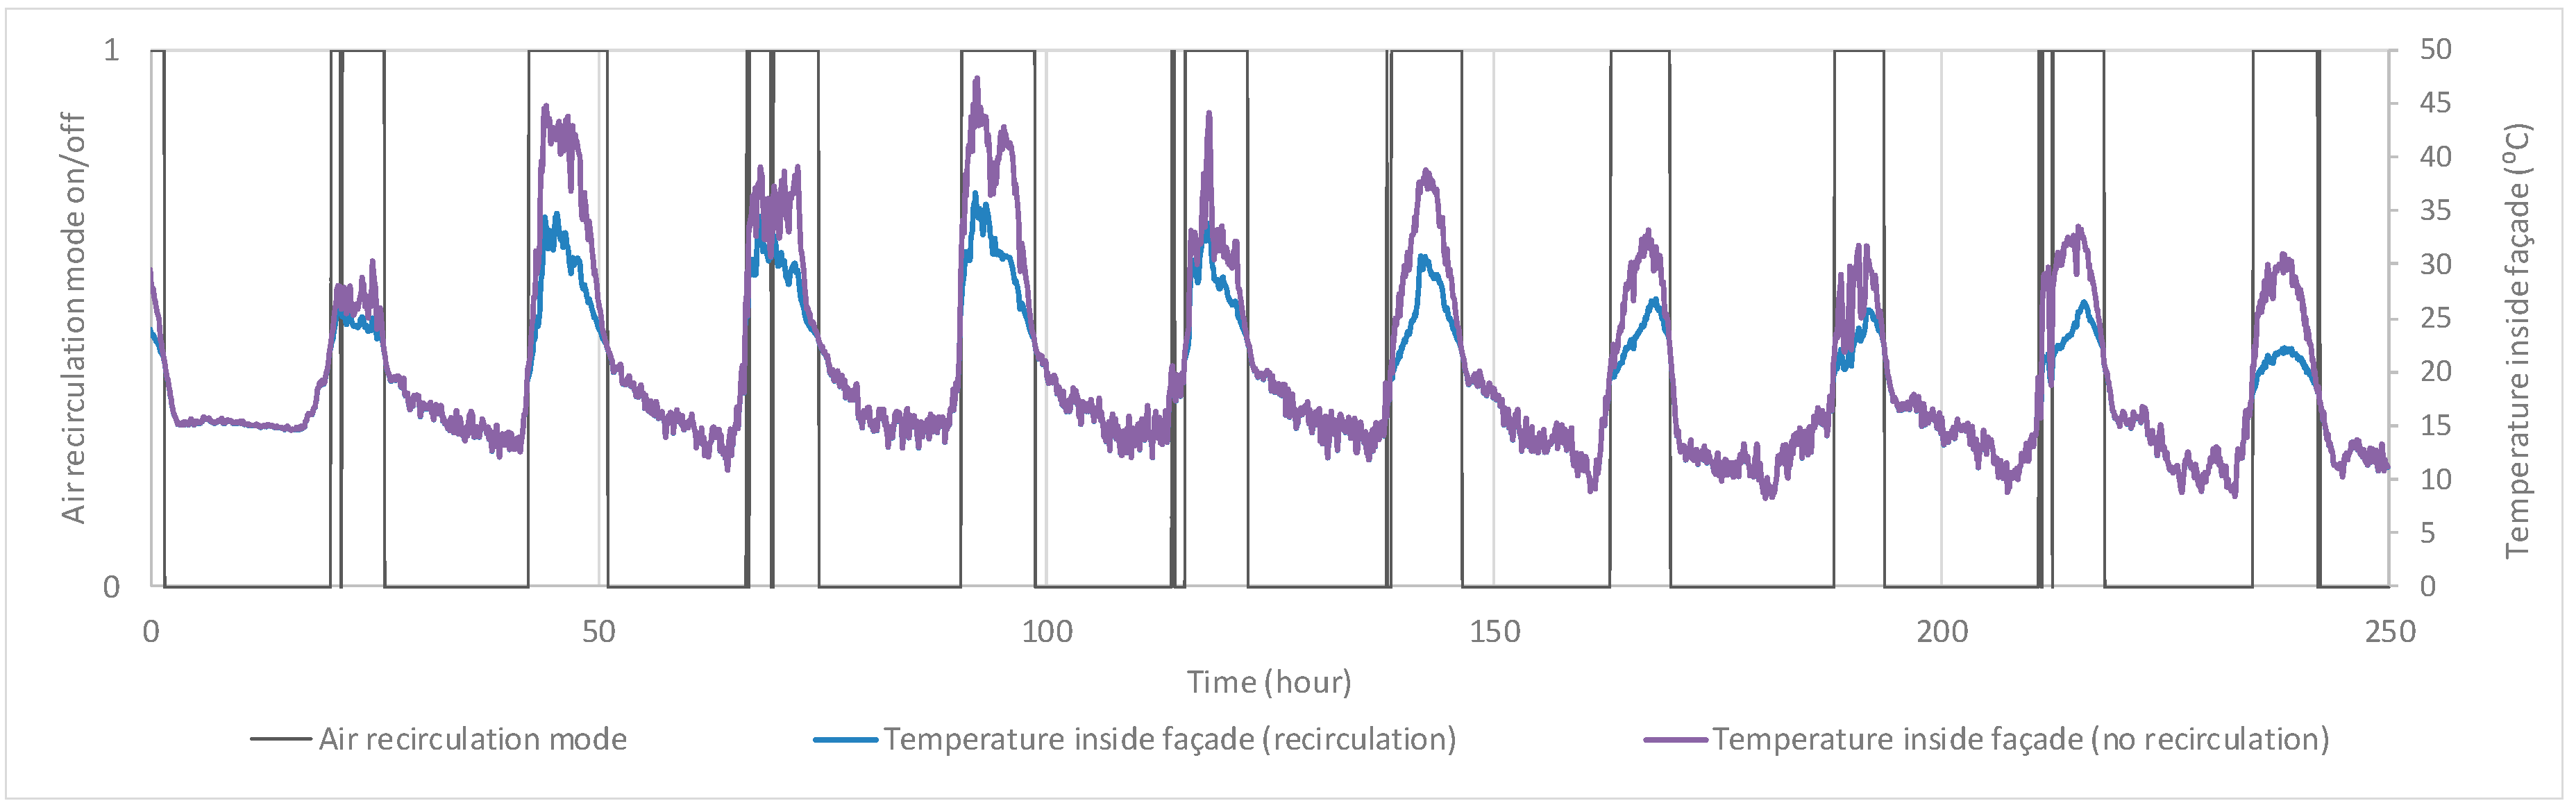
Figure 8 shows that heat gains would be positive if indoor air were recirculated inside the façade, for the same 10-days during the measuring period in November as in
Figure 6 and
Figure 7.
Results in
Figure 8 illustrate that positive heat gains through air recirculation occur when there is irradiation on the façade. For the whole measuring period during November, recirculation could yield energy savings during 23% of time. Due to the limitations observed in the model, prediction of the operating periods yielding better efficiency is reliable but not the actual energy savings achievable, as the model misestimates the temperatures inside the façade.
Continuous estimation of the heat gains could create undue complexity of the dampers opening and closing control. For the measuring period, the study of the conditions when air recirculation would reduce the building thermal needs, shows that the outdoor air temperature could be used as a fair, easy to obtain parameter to identify these periods. Considering this fact and after reviewing the results obtained, it is proposed that when outdoor air is below 18.4 °C dampers remain closed and the façade acts as a further insulation. When outdoor air exceeds that value, indoor air should rather recirculate passing through the ventilated façade. Nevertheless, it must be noted that this last measure would incur additional fan power if mechanical ventilation were implemented. Under this criteria, the ventilated façade could operate under recirculating mode during 10% of winter time in the present case study, considering the typical meteorological year (TMY) data for Valladolid [
36]. Future research can consider the methodology presented in this paper to predict the periods when air recirculation can entrain further energy savings than the insulation mode, commonly preferred in winter.
5. Conclusions
The PV ventilated façade installed in the LUCIA nZEB is appealing as a combined measure to improve the efficiency in the building, concerning both its thermal behavior and the PV electricity generation. However, monitoring the real performance of the façade is necessary to determine the best operating modes under the different possible outdoor conditions.
This work presents and discusses the operating conditions measured for two different periods during wintertime. The experimental data serves to validate a model that predicts the thermal behavior of the façade under the present or alternative operating modes. The model succeeds in predicting the temperatures inside the façade beyond periods of high irradiance and can be used to estimate when alternative operating modes would further improve the thermal efficiency of the building.
The aim of the study was to propose the optimal control mode to enhance the thermal energy savings achievable. Results show that, during winter, dampers should remain closed to make the façade act as a further insulation if outdoor temperature is below 18.4 °C. Recirculation of indoor air would be more efficient than the current operating mode during 10% of winter period.
The methodology presented in this paper can serve as a guide for future research to predict the optimal operating periods for alternative ventilation modes of these façades under different climates.
Future work is needed to investigate the improvement in the PV performance when operating under recirculation, as well as the possible additional fan power required. In addition, the thermal implications of the façade can be further studied, conceiving possible alternative operating modes during summer such as the implementation of evaporative cooling inside the façade.

 ,
, 


