Article

Impact of Electrically Assisted Turbocharger on the Intake Oxygen Concentration and Its Disturbance Rejection Control for a Heavy-duty Diesel Engine

State Key Laboratory of Engines, Tianjin University, Tianjin 300072, China
*
Authors to whom correspondence should be addressed.
Energies 2019, 12(15), 3014; https://doi.org/10.3390/en12153014
Submission received: 7 July 2019 / Revised: 30 July 2019 / Accepted: 1 August 2019 / Published: 5 August 2019

Abstract

:
The electrically assisted turbocharger (EAT) shows promise in simultaneously improving the boost response and reducing the fuel consumption of engines with assist. In this paper, experimental results show that 7.8% fuel economy (FE) benefit and 52.1% improvement in transient boost response can be achieved with EAT assist. EAT also drives the need for a new feedback variable for the air system control, instead of the exhaust recirculation gas (EGR) rate that is widely used in conventional turbocharged engines (nominal system). Steady-state results show that EAT assist allows wider turbine vane open and reduces pre-turbine pressure, which in turn elevates the engine volumetric efficiency hence the engine air flow rate at fixed boost pressure. Increased engine air flow rate, together with the reduced fuel amount necessary to meet the torque demand with assist, leads to the increase of the oxygen concentration in the exhaust gas (EGR gas dilution). Additionally, transient results demonstrate that the enhanced air supply from the compressor and the diluted EGR gas result in a spike in the oxygen concentration in the intake manifold (Xoim) during tip-in, even though there is no spike in the EGR rate response profile. Consequently, there is Nitrogen Oxides (NOx) emission spike, although the response of boost pressure and EGR rate is smooth (no spike is seen). Therefore, in contrast to EGR rate, Xoim is found to be a better choice for the feedback variable. Additionally, a disturbance observer-based Xoim controller is developed to attenuate the disturbances from the turbine vane position variation. Simulation results on a high-fidelity GT-SUTIE model show over 43% improvement in disturbance rejection capability in terms of recovery time, relative to the conventional proportional-integral-differential (PID) controller. This Xoim-based disturbance rejection control solution is beneficial in the practical application of the EAT system.

1. Introduction

Modern diesel engines are normally equipped with a variable-geometry turbocharger (VGT) or fixed geometry turbocharger (FGT) [1,2]. However, the FGT, and to a lesser extent VGT, suffer from an undesired response dynamic caused by the sluggish turbine power response, popularly known as turbo-lag. Turbo-lag is observed through the slow boost pressure ( p 2 ) and torque responses, leading to undesired transient emissions spikes and fuel penalty. In addition, the poor transient boost response, together with smoke limited fueling, also leads to poor drivability performance [3]. Moreover, part of the exhaust energy is also wasted, either through the exhaust bypass valve or widely opened VGT vane, to avoid over-boost at high engine load conditions. This results in the thermodynamic efficiency penalty for engines equipped with conventional turbochargers.
The electrically assisted turbocharger (EAT) is promising in enhancing boost response and recovering exhaust energy [4,5,6,7,8,9,10,11]. By mounting an electrical motor/generator (referred to as TEMG in this paper) in the shaft of conventional turbocharger, EAT is capable of bi-directional energy transfer. The EAT can assist the compressor via the motor mode for enhanced boost response at the early stage of tip-in, and recover the exhaust energy via the generator mode to avoid over-boost. The schematic of the diesel engine equipped with EAT is shown in Figure 1. The benefits of EAT are summarized as below:
(1)
Improved boost response allows enhanced engine torque response [12,13], and enables down-speeding and downsizing [14,15]. Improvements of fuel economy (FE) can also be achieved mainly by reduced pumping losses. In a drive cycle simulation by Zhao et al. [16], a 6.44% fuel-saving was reported for a Hybrid electric vehicle equipped with EAT assisted diesel engine.
(2)
Better utilization of exhaust enthalpy during regen mode via energy recuperation from turbocharger (TC) braking.
(3)
Lower pre-turbine pressure ( p 3 ) and thereby lower pumping loss can be achieved through reduced VGT throttling during assist mode. This improves the thermal efficiency of the engine [17].
(4)
Proper use of assist and regen modes allows the TC to operate in optimal efficiency region [14].
(5)
Improved regulation of intake oxygen concentration (Xoim). Compared to the conventional variable geometry turbocharger-exhaust gas recirculation (VGT-EGR) system, EAT offers additional control degree of freedom and therefore brings a direct result of improved manipulations of p 3 and p 2 . This helps to improve EGR inert quality and reduce transient soot/Nitrogen Oxides (NOx) emissions [18].
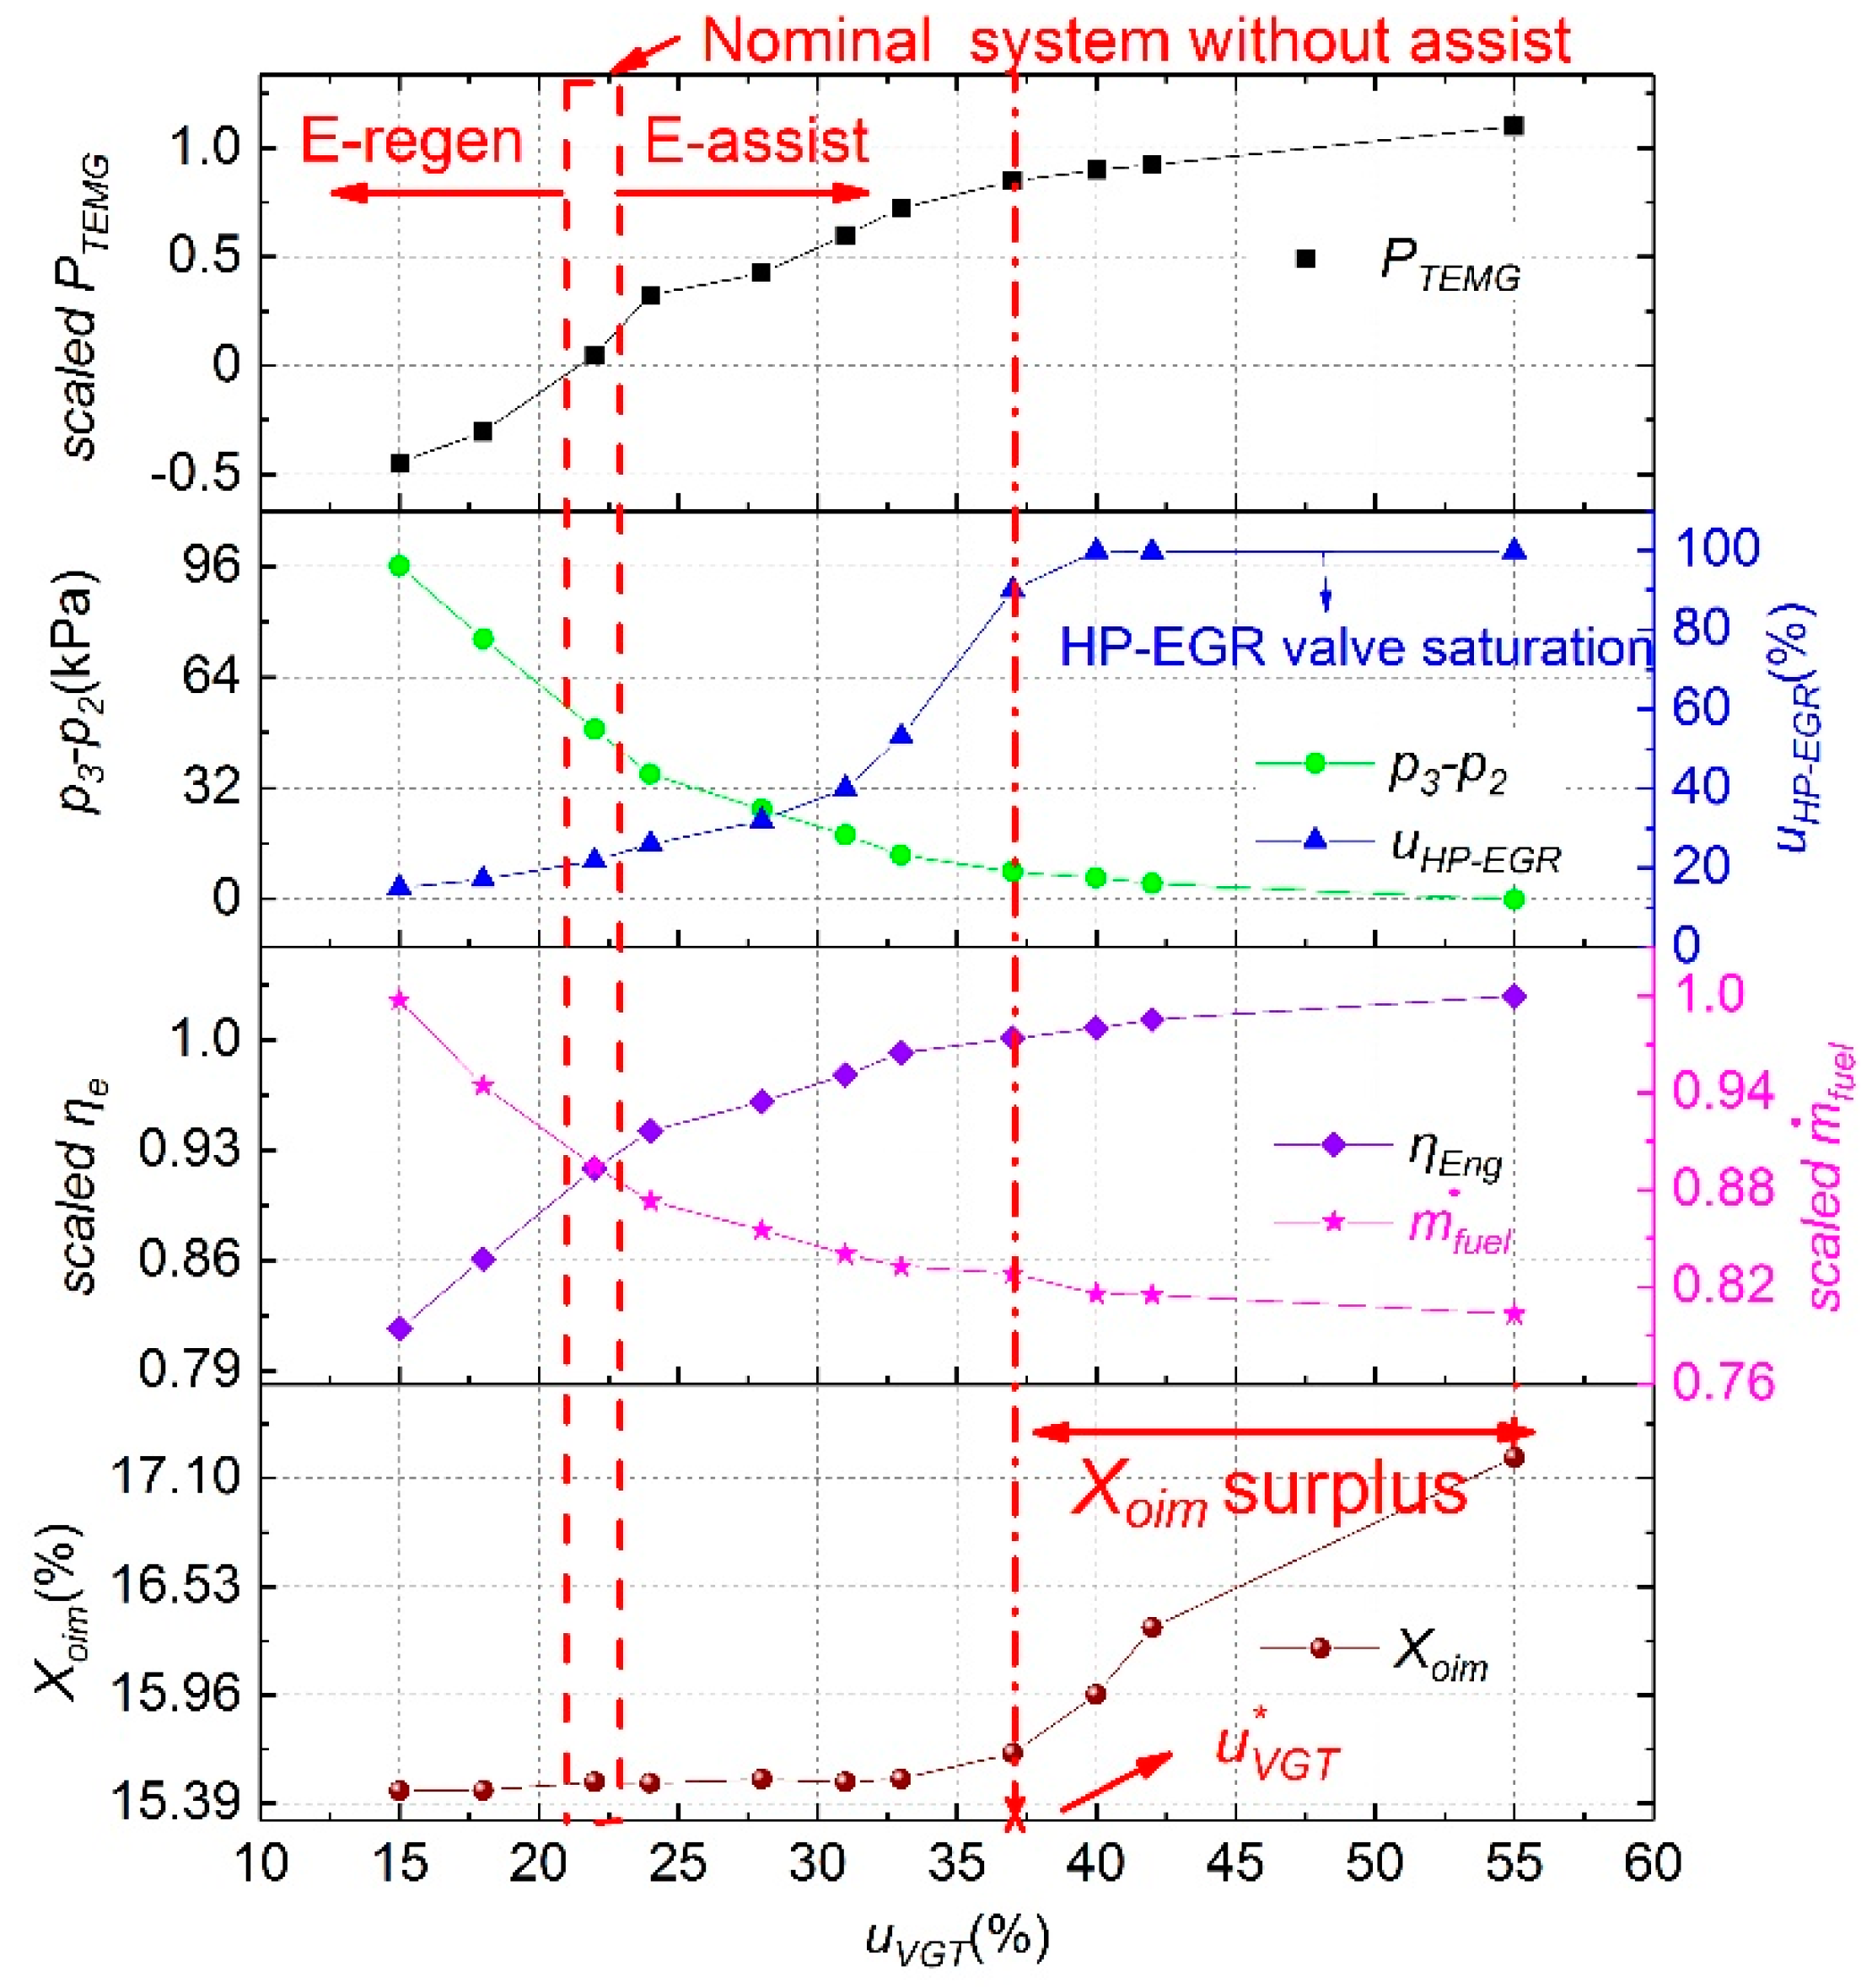
For a tip-in maneuver with the EAT system, a fast boost response can be achieved in assist mode without the need for an equivalent increase in exhaust turbine power. Therefore, a wider open VGT vane position can be held for optimal turbine efficiency, relative to the unassisted VGT-EGR air-path system (referred to as nominal system in this paper henceforth) [19]. A wider open vane position leads to a decrease in the exhaust manifold pressure. The simultaneous decrease in p 3 and increase in p 2 reduce the ( p 3 p 2 ) margin which impacts both FE and the ability to flow high pressure EGR (HP-EGR).
Using the intake oxygen concentration as feedback variable was attempted by Nakayama et al. [
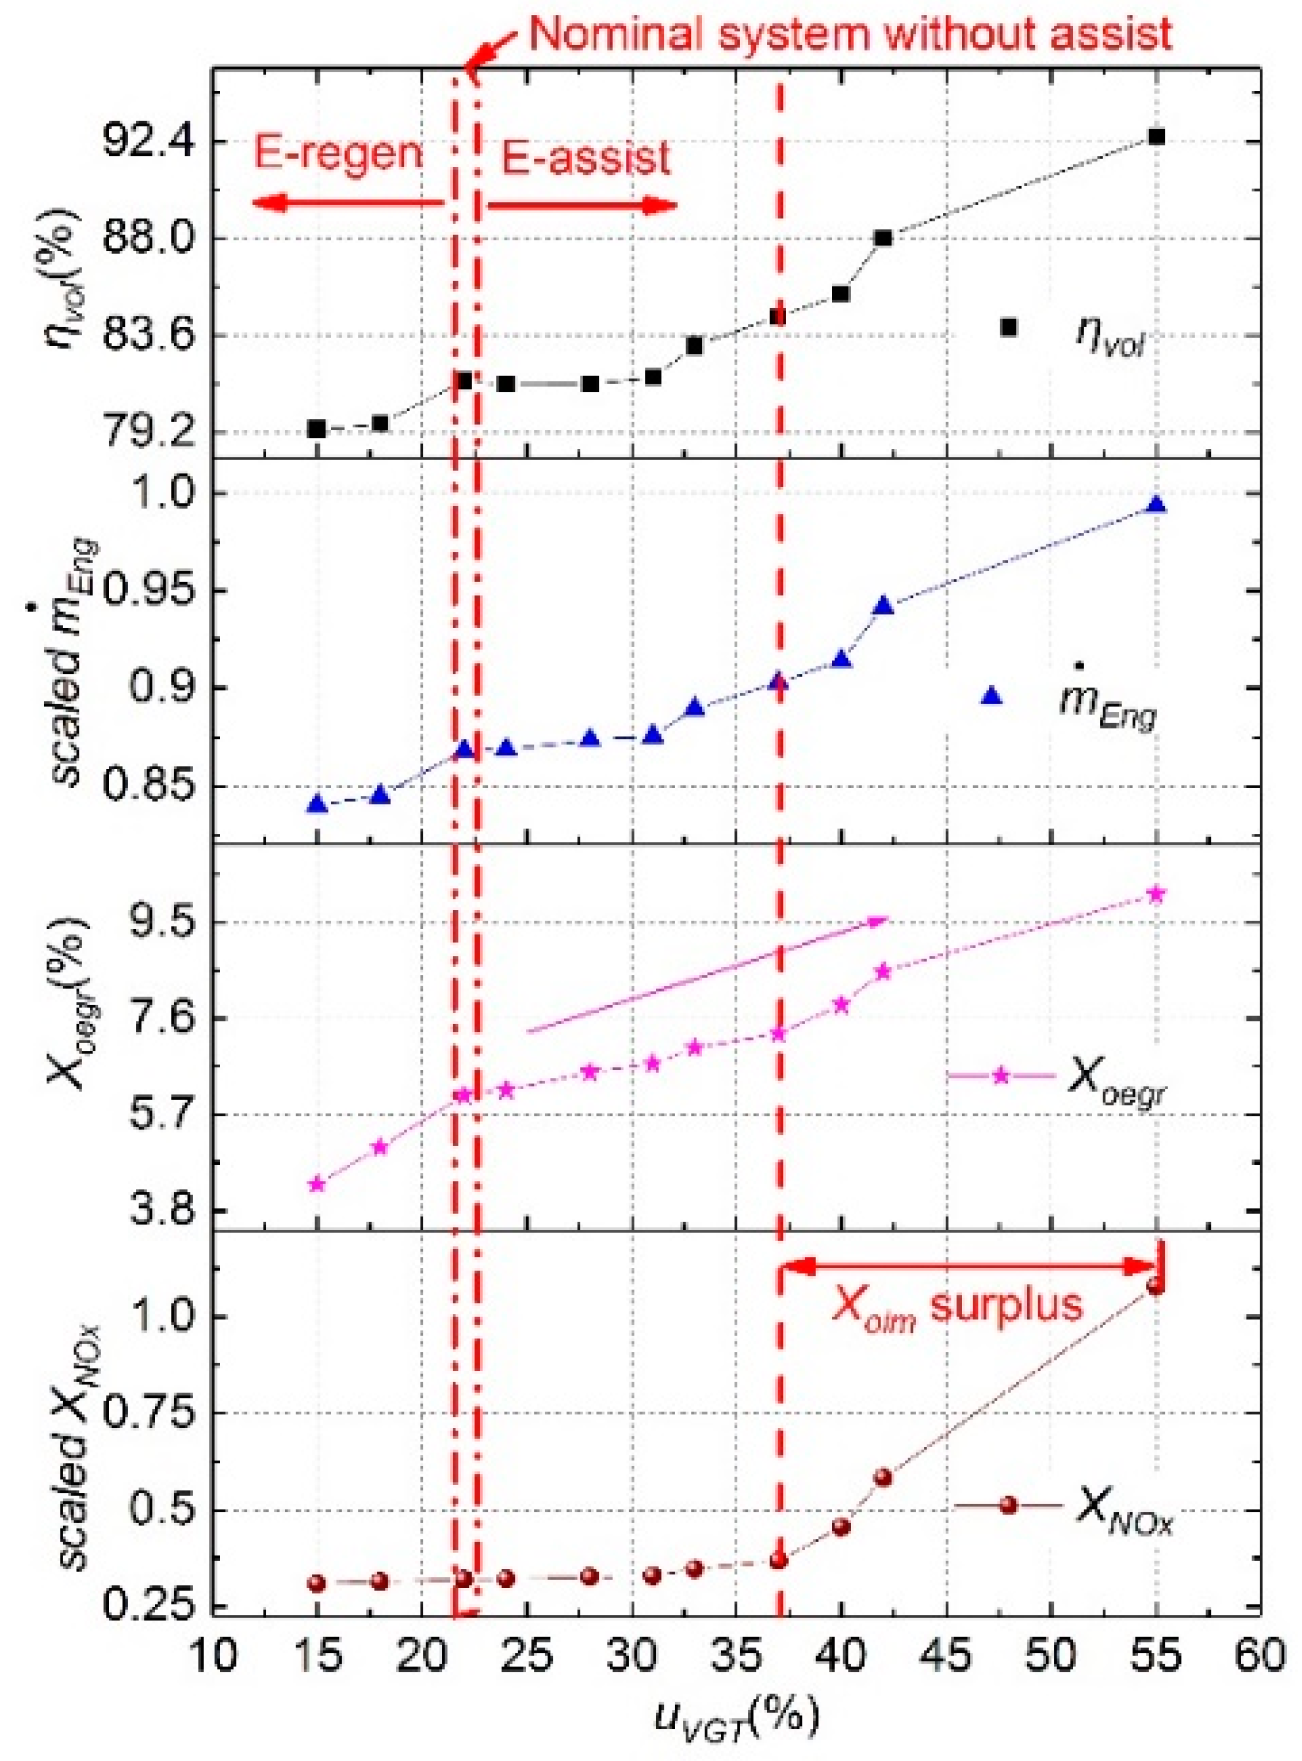
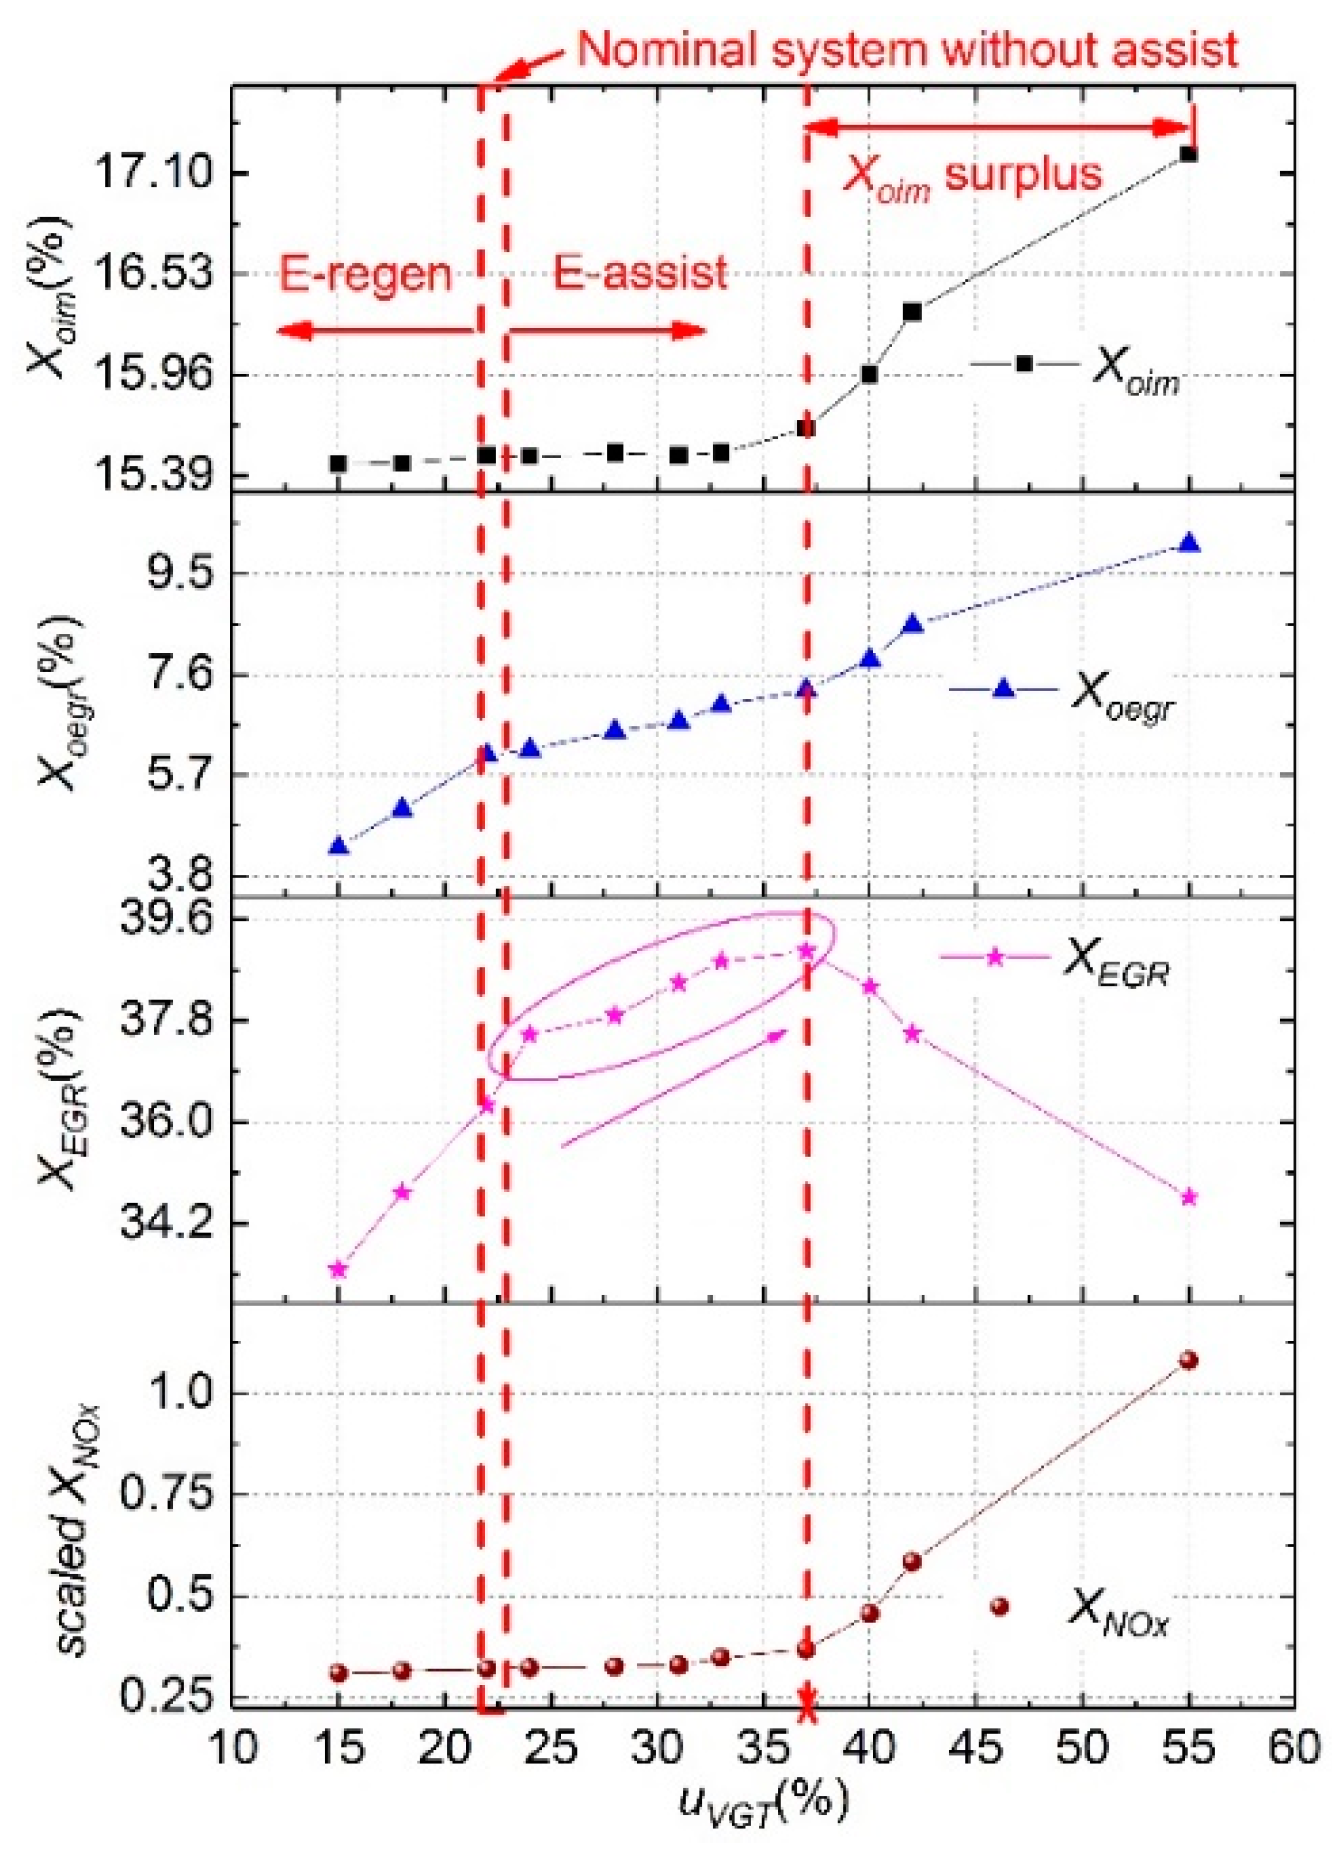
20], Shutty et al. [21], and Millo et al. [22], for conventional VGT-EGR diesel engines. For engines equipped with EAT, however, fast boost response leads to increased fresh air flow relative to the nominal system, and wider open VGT vane position improves the engine volumetric efficiency for increased engine mass flow rate. Those two facts lead to increased dilution of the HP-EGR gas relative to the nominal system, which distinguished from conventional VGT-EGR engine. Therefore a higher HP-EGR flow rates may be of necessity to keep the intake oxygen concentration well matched with any hard constraints on engine out emissions. In other words, the EGR rate (XEGR), as popularly used in the conventional VGT-EGR system, might not be an appropriate output for control for EAT [3]. So far no experimental assessment results are reported on the selection of control output variables for EAT assisted engines, according to the authors’ best knowledge.
Regarding the control of Xoim, the traditional proportional–integral–derivative (PID) algorithm is fairly straightforward to use and consequently is of great popularity. For instance, Park [23] proposed a PID controller for Xoim control in a 2.2 L turbocharged passenger car diesel engine, where the proportional gain was determined according to the current NOx level. In another approach, Chen et al. [24] proposed an implicit PI-based Xoim controller by tracking the air-fuel ratio in the tail pipe.
However, the PID controller suffers from the time-consuming parameter tuning and gain-scheduling [25], and shows as poor robustness against operating condition variations and external disturbances. For EAT-assisted diesel engines, the transient response of the air system is much faster relative to the conventional VGT-EGR system. The frequent VGT vane position optimization also introduces a lot of disturbances to the Xoim controller. Those facts drive the need for an advanced control solution for Xoim with faster response and improved robustness against uncertainties.
In this paper, the benefits from using the Xoim as control output is assessed experimentally on a heavy duty Diesel Engine test bench. Then, an active disturbance rejection control [25,26] based Xoim controller (OADRC) is proposed, assisted by an existing Xoim observer [23]. The superiority of the proposed controller, against the conventional PID controller, is validated based on a previously calibrated high fidelity GT-SUITE simulation model [27].
The rest of the paper is organized as follows. The system layout and the experiment setup as well as the simulation platform used in this study are discussed briefly in Section 2. Experimental investigation on the fuel economy benefit and discussion on the selection of feedback variable for the HP-EGR system are provided in Section 3. The impact of EAT on Xoim control is analyzed in Section 4. The Xoim controller is developed and validated in Section 5 and Section 6 respectively. Finally, the conclusions are summarized in Section 7.

2. Experiment Setup and Simulation Platform

A modern heavy-duty diesel engine equipped with common-rail injection system, HP-EGR and VGT, was used for the experimental evaluation. The engine specifications are tabulated in Table 1. Note that the original variable geometry turbocharger was replaced by the EAT and the specifications are listed in Table 2.
The schematic diagram of the experimental platform is shown in Figure 2, where all the variables are explained in Nomenclature. The test bench is shown in Figure 3. The specifications of the test bench are listed in Table 3.
A high-fidelity simulation model was established in GT-SUITE [28]. The performance of the model was validated against experimental data from a FTP-75 test cycle. Validation results are shown in Figure 4. Model accuracy results are summarized in Table 4. The relative error (Xerror) is defined as in Equation (1), where ymeas is the measured value in the experiment, ymodel is the estimated value obtained from the GT-SUITE model.
X e r r o r = y m e a s y m o d e l y m e a s × 100 %

3. Experimental Assessment on the Benefits from Using Xoim as Control Output Variable

3.1. Steady-State Investigation

In this section, steady-state experiment was carried out on the test bench to assess the superiority of regulating Xoim in terms of NOx emission reduction relative to the EGR rate. The impact of EAT on the HP-EGR flow and fuel efficiency were also investigated. The operating conditions were tabulated in Table 5. Note that in this paper 100% is fully open and 0% is fully closed for both the VGT vane and EGR valve.
From the results shown in Figure 5, the following observations are clear:
  • When the VGT vane open is less than 22%, the electrical regeneration (E-regen) mode is turned on to brake the turbine in order to avoid over-boost. The electrical power in regeneration is about 0.46 kW at the cost of 45 kPa increase in p 3 p 2 , compared to the nominal system. Consequently, 12.1% increase in fuel consumption is seen with E-regen compared to the nominal system.
  • When the VGT vane is greater than 37% open, there is Xoim surplus even though the HP-EGR valve (the blue triangle curve) is already 100% open. This is a direct effect of reduced p 3 p 2 caused by wide VGT vane open, which limits the HP-EGR flow capability.
  • For VGT vane ranging from 22% to 37%, with increasing VGT vane position, the assist power increases (from 0 kW to 0.78 kW) to compensate for the turbine power deficit in order to maintain the boost pressure. Consequently, the pumping loss (indicated by p 3 p 2 ) decreases (from 4.22 kW to 0.86 kW) due to reduced p 3 . Lower p3 and unchanged p2 elevates the thermodynamic efficiency ( η e ) of the engine (8.5% improvement) through pumping loss reduction. This allows less fuel injection to maintain the desired torque, relative to the nominal system.
  • With VGT vane increasing from 22% to 37%, the incremental benefit in fuel economy decreases, since p 3 p 2 gradually converges when the VGT open approaches 37%. The fuel saving with VGT vane 37% open is 7.8%, relative to the nominal system. Note that here the electrical energy is assumed to be free in the driveline electrical regeneration during vehicle braking. Therefore, the cost for the electrical power is neglected when evaluating the fuel economy.
  • It should be noted that equivalent brake-specific fuel consumption (Eq_BSFC), as defined in Equation (2), can also be used to evaluate the efficiency of the system when the cost of assist power has to be taken into consideration [3]. In Equation (2), t0 and tf are the time stamps of the start and end of the current test respectively, W E n g is the engine work output, W T E M G a s s i s t and W T E M G r e g e n are defined as W T E M G a s s i s t = t 0 t f max ( 0 , P T E M G ) d t and W T E M G r e g e n = | t 0 t f min ( 0 , P T E M G ) d t | respectively. In terms of Eq_BSFC, the fuel economy benefit from using EAT is 5.9% relative to the conventional VGT-EGR engine.
    E q _ B S F C = t 0 t f m ˙ f u e l d t W E n g W T E M G a s s i s t + W T E M G r e g e n
In addition to FE improvement, another impact of reduced p 3 p 2 is the improvement in the volumetric efficiency η v o l of the engine, as calculated according to Equation (3), where NEng is the engine speed, VEng is the engine displacement, M is the molar mass of gas in intake manifold, and p2 and T2 are intake manifold pressure and temperature, respectively. The engine mass flow rate m ˙ E n g can be calculated based on Equation (4),where oxygen concentration in the recirculated exhaust gas (Xoegr) and Xoim are measured by the UEGO sensors, fuel injection rate m ˙ f u e l is obtained from the AVL 735 S fuel mass flow meter, Xoair is oxygen concentration in the air, AFR is air-fuel ratio. From Figure 6, it is seen that up to 13.6% improvement in η v o l is achieved with 1.01 kW E-assist power ( P T E M G ) relative to the nominal system. This is primarily attributed to the decrease in p3p2, as clearly explained in the Equation (5) proposed in [29], where C η v o l ( N E n g ) is an engine speed dependent factor, r c is compression ratio. Obviously, the decrease in p 3 p 2 helps increasing η v o l .
The increase in-cylinder charge amount caused by increased η v o l , together with reduced fuel amount (shown in Figure 5), elevates the oxygen concentration in the HP-EGR gas (EGR dilution), i.e., the increasing Xoegr as shown in Figure 6. Therefore, a 7.5% increase in EGR rate (from 36.30% in nominal system to 39.03% in EAT system) at 37% VGT open is needed to maintain the Xoim and NOx emission, relative to the nominal system (22% VGT vane open), as shown in Figure 7. This can be understood via the mathematical expression for XEGR shown in Equation (6) [30], where m ˙ H P , E G R is the HP-EGR mass flow rate. It is clearly seen from Equation (6) that the desired XEGR increases with increasing Xoegr with Xoim fixed and Xoair being a constant.
η v o l = m ˙ E n g 120 N E n g R T 2 p 2 V E n g M
m ˙ E n g = m ˙ f u e l ( A F R   X o a i r + X o e g r ) X o i m X o e g r
η v o l ( p 2 , p 3 ) = C η v o l ( N E n g ) r c ( p 3 p 2 ) 1 / γ r c 1
X E G R = m ˙ H P E G R m ˙ E n g = X o a i r X o i m X o a i r X o e g r
The primary reason to regulate Xoim is that Xoim has much higher correlation with NOx emission than XEGR and Xoegr in the EAT system, as shown in Figure 8. For EAT assisted air system, the HP-EGR is diluted due to elevated engine mass flow rate, which is not taken into account in the conventional EGR rate based control. In contrast, the Xoim based control is able to maintain Xoim using increased XEGR, which is beneficial for NOx control for EAT assisted air system.
Therefore, steady-state results show that Xoim is a better control output for the air system relative to the XEGR in EAT assisted air system in diesel engines.

3.2. Transient Results Analysis

In addition to the steady-state experiment, transient tests were also carried out on the test bench under the operating conditions shown in Table 6. The three actuators were manipulated as shown in Figure 9.
For conventional VGT-EGR system, as shown in Figure 10, the settling time for p2 is about 4.6 s. Consequently, there is Xoim undershoot in the time period from 31.6 s to 36 s, where the XEGR response is smooth. In the process of tip-in, there is a slight NOx spike.
For the EAT assisted engine, the p2 response is significantly enhanced with the settling time shorten to 2.2 s (52.1% improvement relative to the nominal system without E-assist), as shown in Figure 11. This implies enhanced fresh air or oxygen response. Consequently, there is a Xoim spike shown in the time period from 32.8 s to 34.8 s. Therefore, it is not surprising to see a NOx spike in the same time interval. What is interesting is that the XEGR response is still smooth without any overshoot or undershoot. This implies that there is no sign of oxygen surplus by observing the EGR rate for EAT assisted engines. This makes it difficult to suppress the NOx spike by controlling the EGR rate since the EGR rate based control is not able to take into account the EGR dilution caused by VGT vane position optimization with EAT. Therefore, transient results confirmed that Xoim is a better control output in the air system of EAT assisted engines, relative to EGR rate, since the NOx spike can be removed by simply avoiding the Xoim overshoot.

4. Theoretical Analysis of the Impact of EAT on Xoim Control

From the aforementioned analysis, both steady-state and transient response confirmed the superiority of using Xoim as the control output for EAT assisted engines. However, interactions, between the electrical power of EAT and the states in the intake and exhaust manifolds, bring up complex disturbances to the Xoim control loop. This will be investigated based on the fundamentals of the boosting system in this section.
Based on the mass conservation of the intake manifold, the Xoim dynamics can be modeled as [27]:
X ˙ o i m = R T 2 p 2 V i m ( m ˙ C X o a i r + m ˙ H P E G R X o e g r m ˙ E n g X o i m )
where m ˙ C is the compressor mass flow rate, m ˙ H P E G R is the HP-EGR mass flow rate, m ˙ E n g is the engine mass flow rate, V i m is the volume of intake manifold. At steady-state condition, m ˙ E n g can be approximated by the sum of m ˙ H P E G R and m ˙ C . Detailed discussion about the unknown terms, namely m ˙ C , m ˙ H P E G R and X o e g r , are shown below. This purpose of the following analysis is to understand the impact of EAT assist on the Xoim control from the perspective of physics.
1. The compressor mass flow rate m ˙ C can be obtained from the definition of the compressor efficiency ( η C ) in [29], as shown in Equations (8) and (9).
P C , i d e a l = m ˙ C Δ h 0 s = m ˙ C c p , c T 1 { ( p 2 p 1 ) γ 1 γ 1 }
η C = P C , i d e a l P C = ( p 2 p 1 ) γ 1 γ 1 T 2 T 1 1
where c p , c is the specific heat capacity of air, p 1 and T1 are pre-compressor pressure and temperature, respectively, P C , i d e a l is the isentropic power for compressing the air from p 1 to p 2 , i.e., power requirement during an isentropic process, and P C is the actual power that the compression process consumes, which can be approximated by the steady-state energy balance relation:
P C = P T + P T E M G P L o s s
where P T is the turbine power, P L o s s is the mechanical loss of the EAT. Based on Equations (8)–(10), the compressor mass flow rate is modeled as function of P T E M G as below:
m ˙ C = η C ( P T + P T E M G P L o s s ) c p , c T 1 ( ( p 2 p 1 ) 1 1 k 1 ) g m ˙ C ( P T E M G , P T , p 2 )
2. The HP-EGR flow rate m ˙ H P E G R can be estimated by the model proposed in [29] as:
m ˙ H P E G R = θ H P E G R A H P E G R C D p 3 R T 3 1 ( p 2 p 3 ) 2
where θ H P E G R is the HP-EGR valve position, C D and A H P E G R are the flow coefficient and cross-sectional area of the HP-EGR valve, respectively, p 3 and T 3 are exhaust manifold pressure and temperature respectively.
The p 3 in Equation (12) can be obtained through the turbine efficiency definition and the Equation (10) as show in Equation (13) [29]:
P T = P C + P L o s s P T E M G = η t m m ˙ T c p , e T 3 ( 1 ( p 4 p 3 ) 1 1 k )
where η t m is the turbine efficiency, m ˙ T is the turbine mass flow rate, c p , e is the specific heat capacity of exhaust gases, and p 4 is the post-turbine pressure. Specifically, the p 3 model shown in Equation (14) as:
p 3 = p 4 ( 1 P C + P L o s s P T E M G η t m m ˙ T c p e T 3 ) 1 1 k g p 3 ( P T E M G , P C , T 3 , m ˙ T )
Substituting Equation (14) into Equation (12) transforms the HP-EGR flow model into:
m ˙ H P E G R = θ H P E G R A H P E G R C D g p 3 ( P T E M G , P C , T 3 , m ˙ T ) R T 3 1 ( p 2 g p 3 ( P T E M G , P C , T 3 , m ˙ T ) ) 2 θ H P E G R g m ˙ H P E G R ( P T E M G , p 2 , m ˙ T , T 3 )
It can be inferred that increased assist power (PTEMG) reduces the EGR flow rate through reduced pressure differential (or p3) across the EGR value, as shown in Equation (14).
3. The X o e g r can be approximated as the engine outlet port oxygen concentration ( X o c y l _ o u t ), which is estimated based on [27]:
X o e g r X o c y l _ o u t = m ˙ E n g X o i m m ˙ f u e l A F R X o a i r m ˙ E n g + m ˙ f u e l
where A F R is the air-to-fuel ratio, m ˙ E n g and η v o l can be estimated by Equations (3) and (5) respectively. By substituting Equations (3), (5), and (14) into Equation (16), the X o e g r can be modeled as a function of P T E M G as:
X o e g r = g η v o l ( N , p 2 , g p 3 ( P T E M G , P C , T 3 , m ˙ T ) ) N E n g p 2 V E n g 120 R T 2 ( m ˙ E n g + m ˙ f u e l ) X o i m m ˙ f u e l A F R X o a i r m ˙ E n g + m ˙ f u e l g X o e g r ( P T E M G , N , p 2 , m ˙ f u e l , m ˙ E n g )
Finally, substituting Equations (11), (15), and (17) into Equation (7), the X o i m model is derived as below:
X ˙ o i m = R T 2 p 2 V i m ( m ˙ C X o a i r + m ˙ H P E G R X o e g r m ˙ E n g X o i m ) = R T 2 p 2 V i m [ g m ˙ C ( P T E M G , P T , p 2 ) X o a i r +   θ H P E G R g m ˙ H P E G R ( P T E M G , p 2 , m ˙ T , T 3 ) × g X o e g r ( P T E M G , N , p 2 , m ˙ f u e l , m ˙ E n g )     m ˙ E n g X o i m ]
It should be noted that the turbine and compressor efficiency are implicitly used in Equation (18), both of which vary with the operating point. For simplicity, they are read in turbine and compressor maps respectively, which are extrapolated from manufacturer’s data.
By observing Equation (18), it is clear that the EAT assisting power affects the X o i m dynamic primarily from three different aspects:
  • Enhanced air response through the term m ˙ C = g m ˙ C ( P T E M G , P T , p 2 ) , since PTMEG increased the compressor power.
  • HP-EGR flow deficit when the pressure differential across the HP-EGR valve is insufficient as illustrated by m ˙ H P E G R = θ H P E G R g m ˙ H P E G R ( P T E M G , p 2 , m ˙ T , T 3 ) , as PTEMG affects the upstream pressure of the EGR valve.
  • EGR gas dilution due to increased engine mass flow rate from elevated volumetric efficiency as indicated by X o e g r = g X o e g r ( P T E M G , N , p 2 , m ˙ f u e l , m ˙ E n g ) , since PTEMG leads to increased fresh air flow and reduces the fuel consumption.
Clearly, in order to attenuate the disturbances caused by the additional control degree of freedom ( P T E M G ), an advanced disturbance rejection solution becomes necessary, as will be discussed in Section 5.

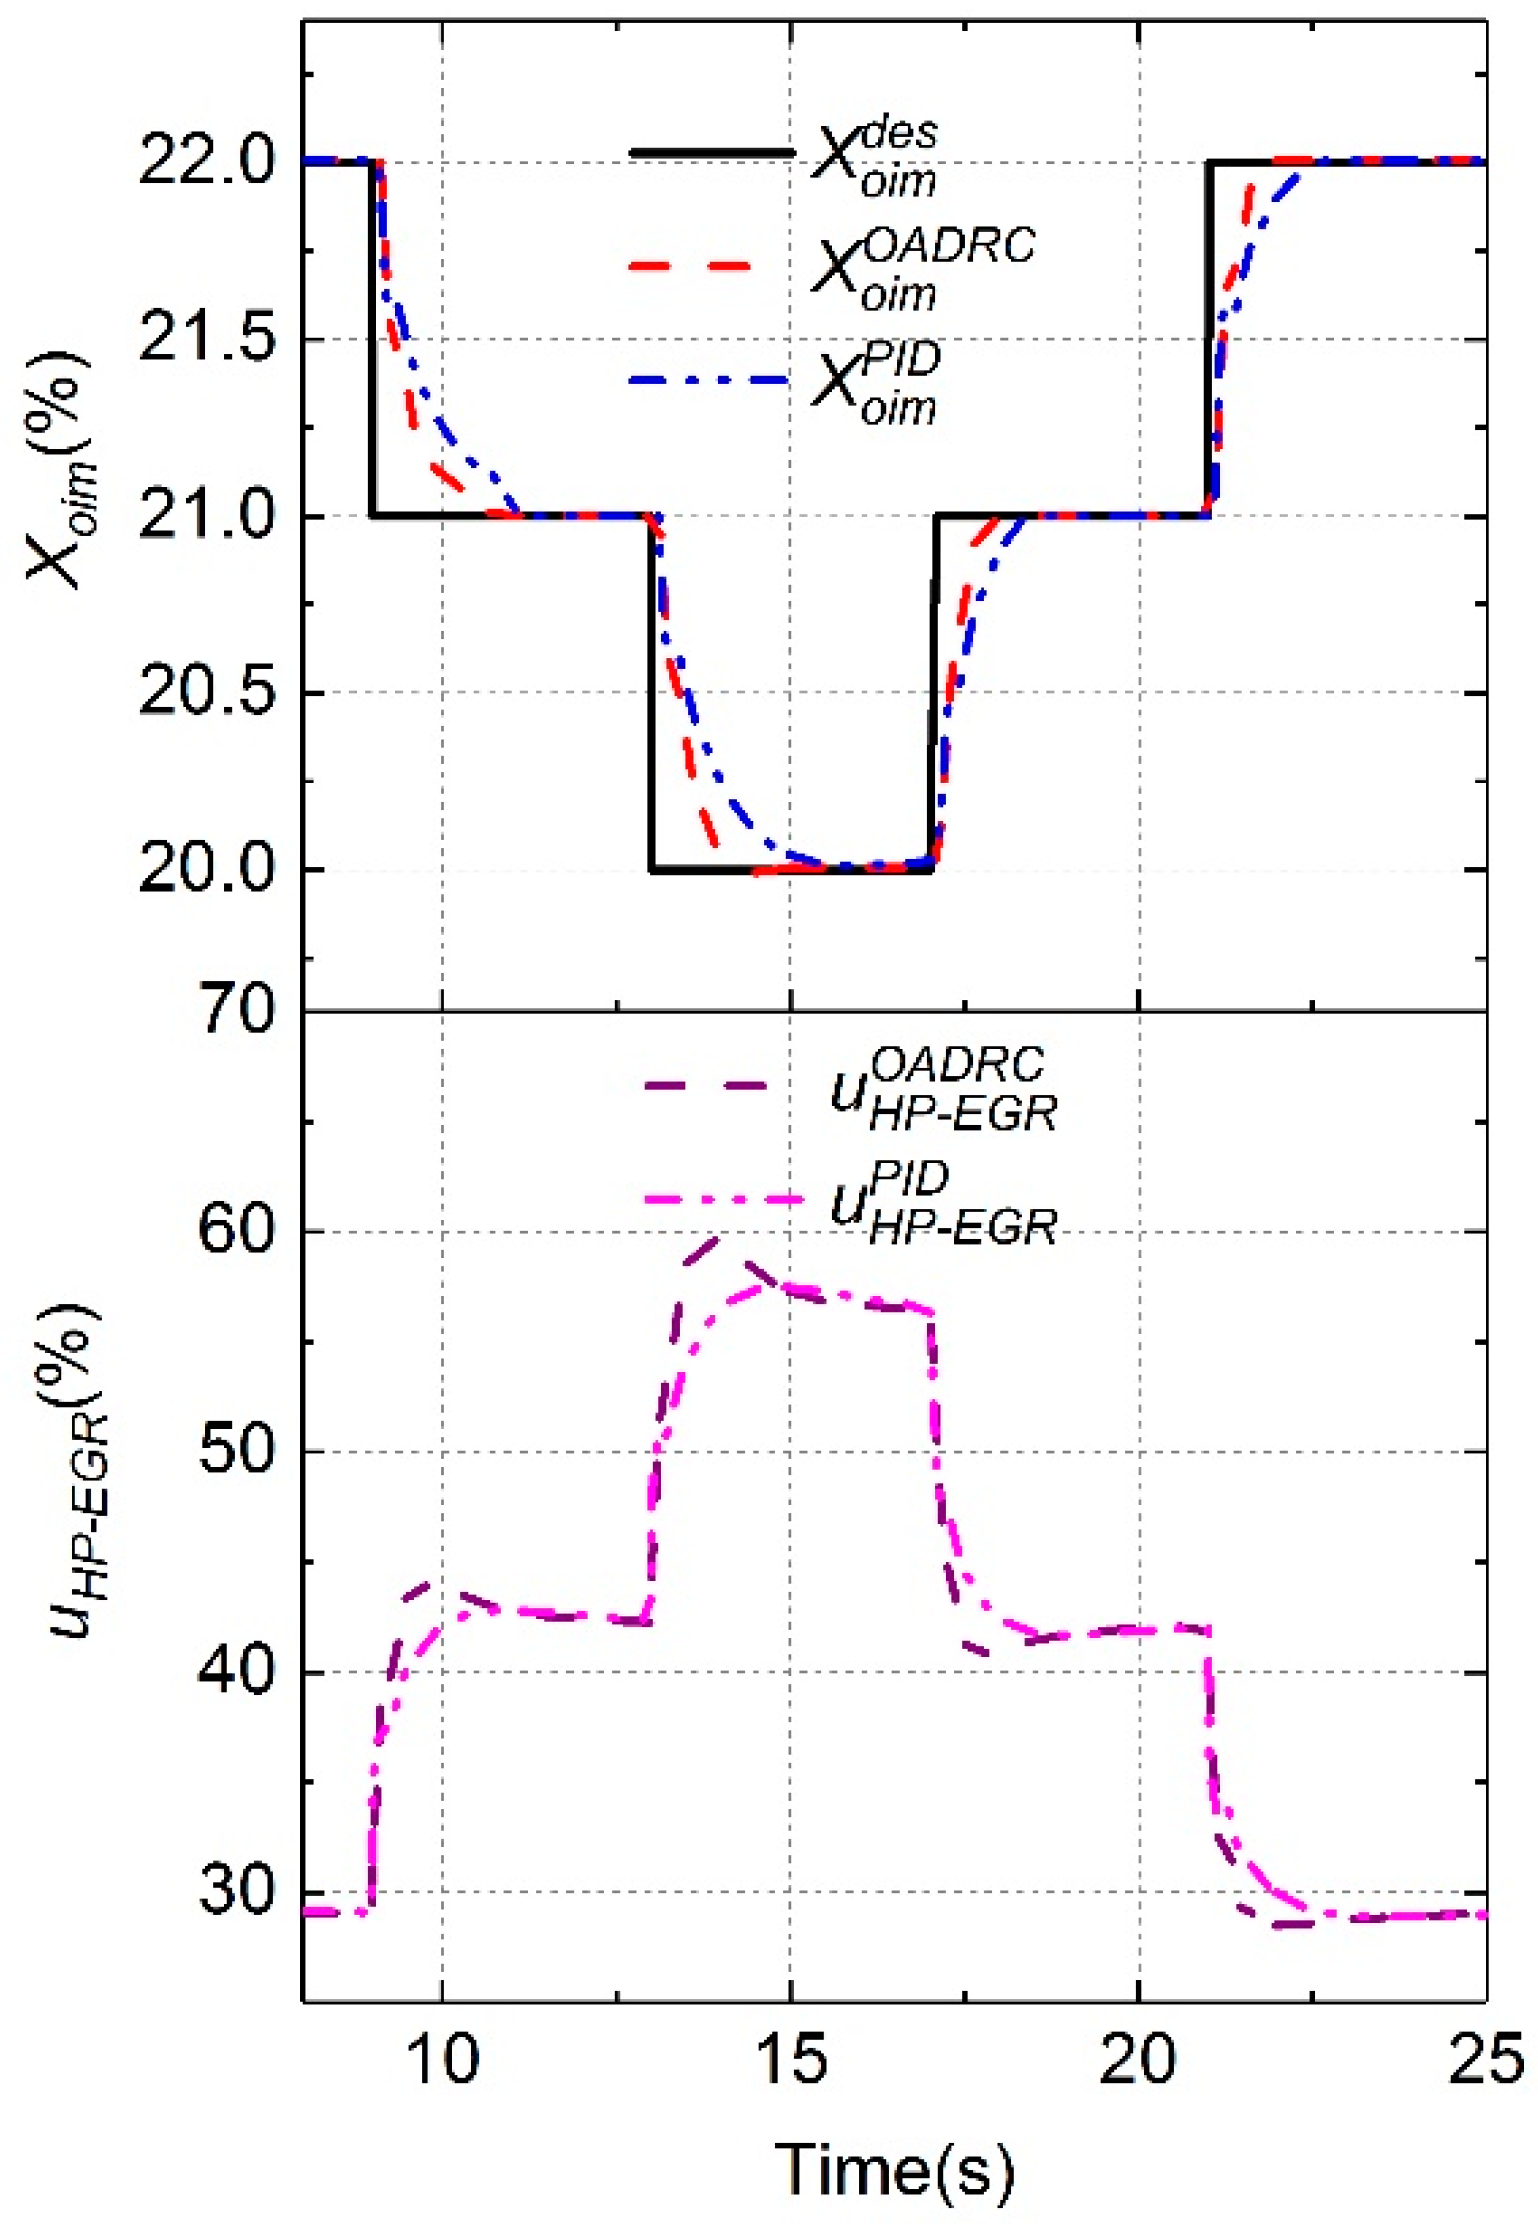
5. Xoim Controller Development

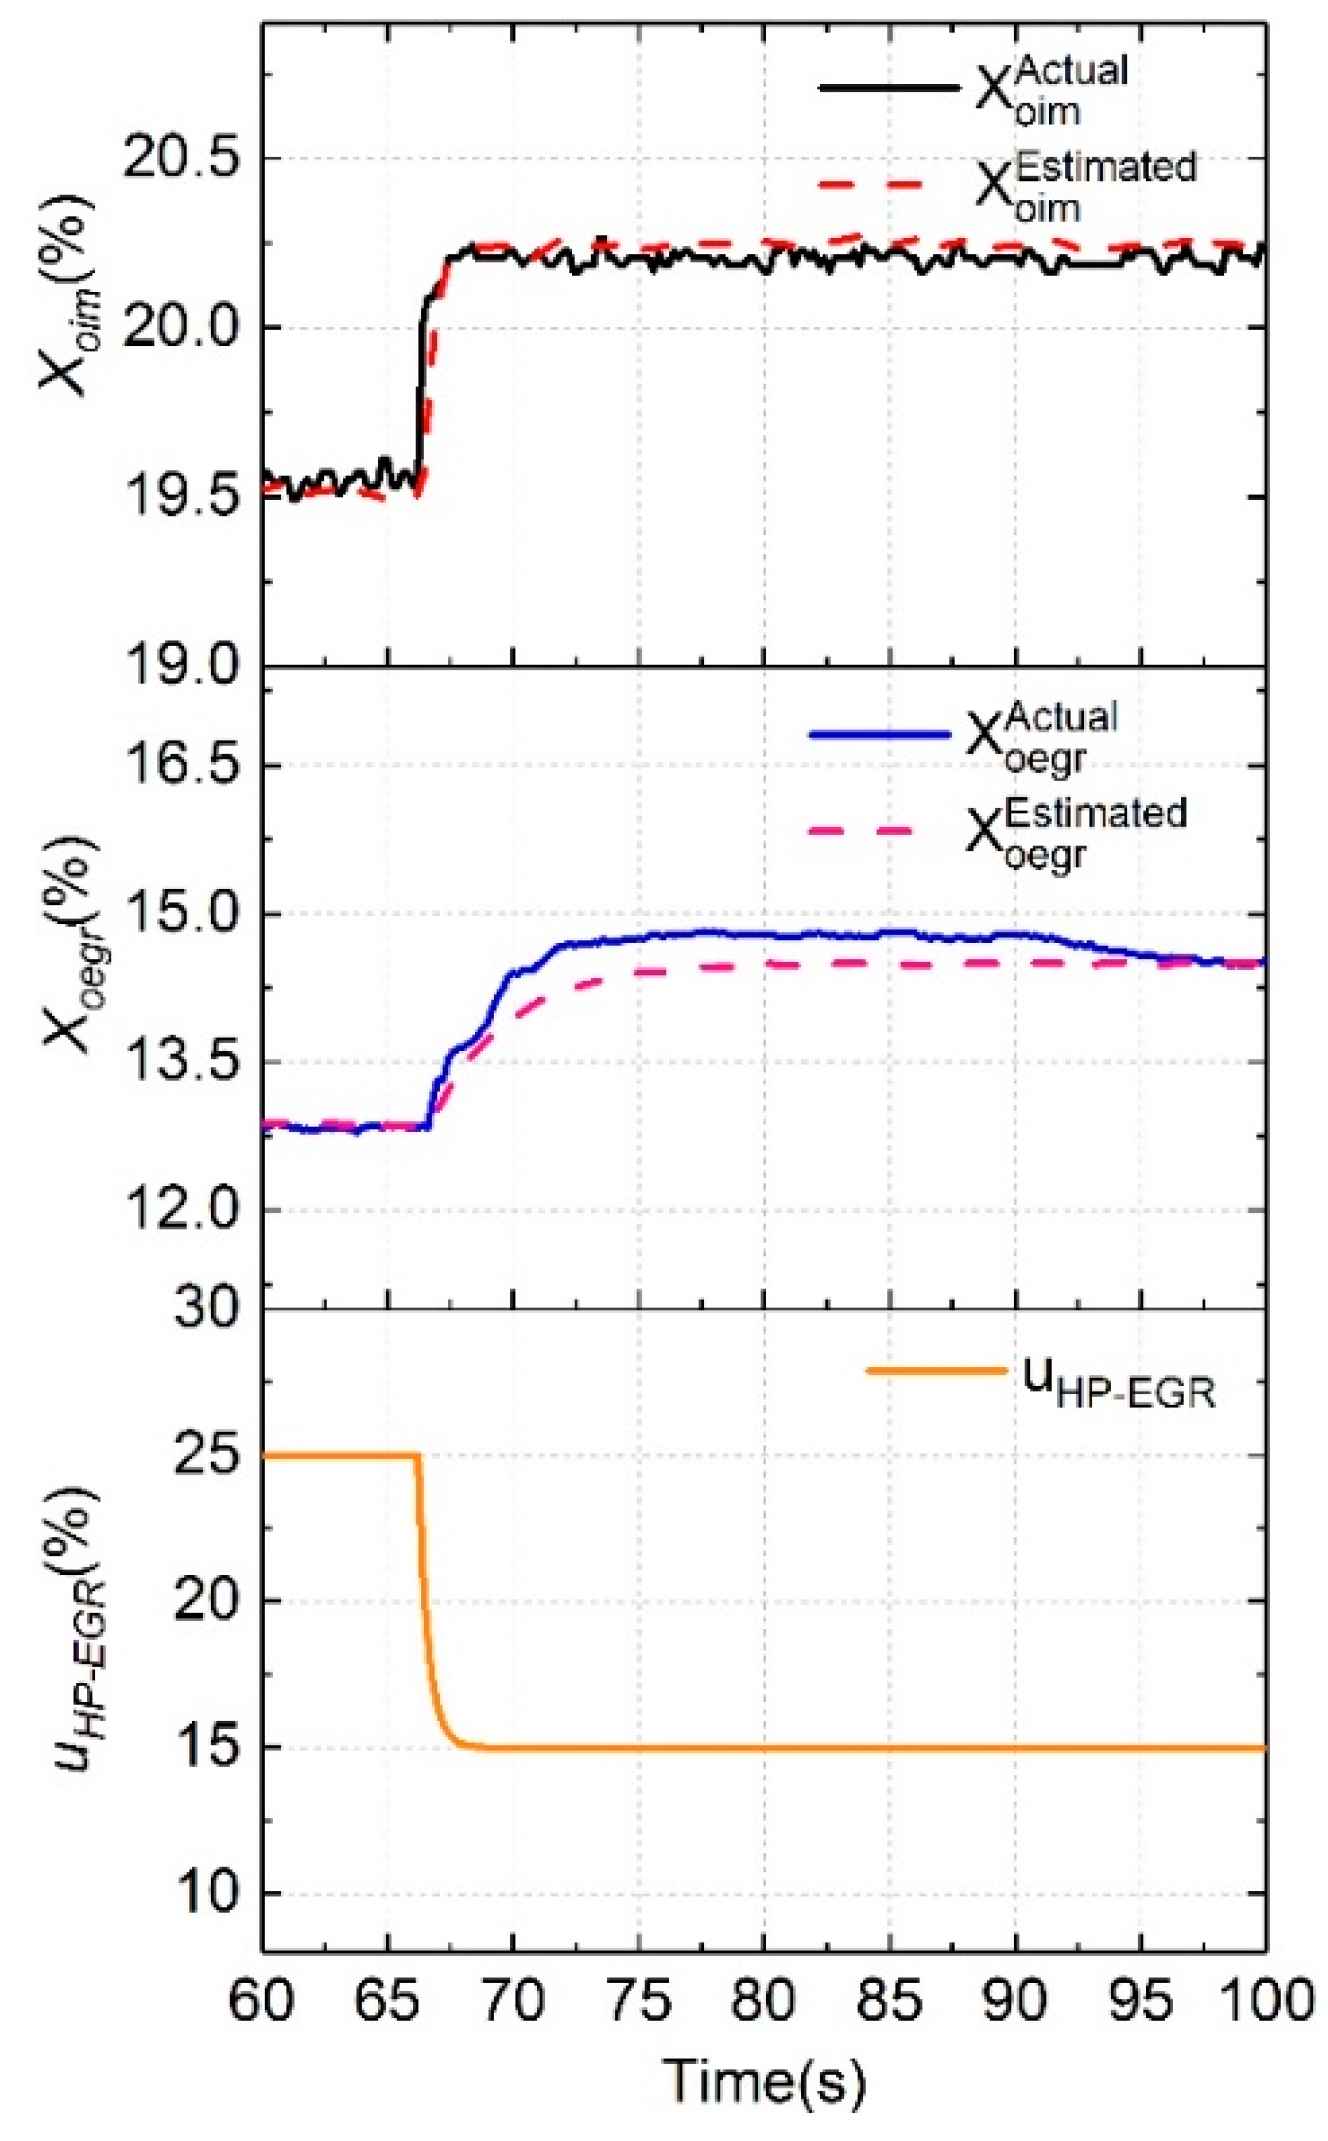
Since the universal oxygen sensor is mounted only on the exhaust side (UEGO), a Xoim observer is necessary. In this paper, the Xoim observer based on the measured p 2 , Xoegr, and estimated m ˙ C , proposed by Park in [23], is used. A brief introduction and experimental validation are provided in the Appendix A for completeness. Then, an active disturbance rejection controller of oxygen concentration in intake manifold (OADRC) was developed with the control structure shown in Figure 12.
For OADRC controller derivation, Equation (18) is rewritten into Equation (19):
X ˙ o i m = R T 2 p 2 V i m [ g m ˙ C ( P T E M G , P T , p 2 ) X o a i r +                                                                                     θ H P E G R g m ˙ H P E G R ( P T E M G , p 2 , m ˙ T , T 3 ) g X o e g r ( P T E M G , N , p 2 , m ˙ f u e l , m ˙ E n g )                                                                                     m ˙ E n g X o i m ] = θ H P E G R R T 2 p 2 V i m g m ˙ H P E G R ( P T E M G , p 2 , m ˙ T , T 3 ) g X o e g r ( P T E M G , N , p 2 , m ˙ f u e l , m ˙ E n g ) +             R T 2 p 2 V i m [ g m ˙ C ( P T E M G , P T , p 2 ) X o a i r m ˙ E n g X o i m ] = θ H P E G R b 0 + f
where b 0 = R T 2 p 2 V i m g m ˙ H P E G R ( P T E M G , p 2 , m ˙ T , T 3 ) g X o e g r ( P T E M G , N , p 2 , m ˙ f u e l , m ˙ E n g ) is the control input gain, and f = R T 2 p 2 V i m [ g m ˙ C ( P T E M G , P T , p 2 ) X o a i r m ˙ E n g X o i m ] is denoted as the “total disturbance”. It is clear that estimation errors in engine flow rate and HP-EGR flow rate as well as the external disturbance are all lumped as total disturbance.
Equation (19) is then rewritten in the state space form for ESO derivation, as shown in Equation (20):
{ x ˙ = A x + B u + E f ˙ y = C x
where A = [ 0 1 0 0 ] , B = [ b 0 0 ] , C = [ 1 0 ] T , E = [ 0 1 ] , i.e., x = [ y f ] T , { x 1 = X o i m x 2 = f are the states, y = x 1 is the output, u is the input ( u = θ H P E G R ), namely the HP-EGR valve position.
Based on Equation (20), a linear first order extended state observer (ESO) is designed as in Equation (21), following the method shown in [31],
{ x ^ ˙ = A x ^ + B u + L ( y y ^ ) y ^ = C x ^ { x ^ ˙ = ( A L C ) x ^ + [ B L ] [ u y ] y ^ = C x ^
where L = [ β 1 β 2 ] is the tunable observer gain matrix, A L C = [ β 1 1 β 2 0 ] , and { x ^ 1 = X ^ o i m x ^ 2 = f ^ y = x ^ 1 are the observed states and output (measurement) estimate, respectively.
The tuning of L matrix is addressed using the bandwidth parameterized method proposed by Gao [31]. This is briefly introduced here for completeness. The characteristic polynomial for the ESO system, Equation (21), is s 2 + β 1 s + β 2 = 0 . Since β 1 and β 2 are design variables, these can be chosen to make the ESO state space Hurwitz stable. If we recognize that the characteristic polynomial may be expressed as a damped second order system, that is: s 2 + β 1 s + β 2 s 2 + 2 ξ ω o s + ω o 2 with ξ and ω o being the damping coefficient and the natural frequency (bandwidth) of the ESO system respectively, the ESO observer gains, β 1 and β 2 are then easily determined by choosing a system bandwidth and damping as follows:
{ β 1 = 2 ξ ω o β 2 = ω o 2
Both ξ and ω o can be time varying and a dynamic selection for ω o is allowed. For simplicity, the damping ratio ξ is fixed at 1 in this paper. Hence, the eigenvalues for A L C in Equation (21) are determined by the system bandwidth ω o . After convergence of ESO, x ^ 1 x 1 X o i m , x ^ 2 x 2 f , and then observed value of disturbance f ^ will approach the actual disturbance f , which realizes the observation of the total disturbance of the system.
With the state observer properly designed, the plant is reduced to an integrator
X ˙ o i m = b 0 u + f = b 0 u + f ^ + ( f f ^ ) u 0
which is easily controlled by a P (proportional) controller
u 0 = k p ( r x ^ 1 )
where r is the set-point for the desired intake oxygen concentration, x ^ 1 is the observed value of oxygen concentration in intake manifold, k p is the proportional gain, which is selected to place the pole of the closed-loop system at the controller bandwidth ω c .
Finally, the control input, namely the HP-EGR valve position can be obtained as:
u = u 0 x ^ 2 b 0 = u 0 f ^ b 0
So far, the active disturbance rejection controller of oxygen concentration in intake manifold of the diesel engine equipped with EAT has been designed and the validation will be discussed in the next section.

6. Simulation Validation of the Proposed Xoim Controller

The OADRC controller was validated through the co-simulation between GT-SUITE and Matlab/Simulink. Compared with the traditional PID algorithm, the response speed and disturbance rejection ability of the OADRC controller were evaluated. Four evaluation metrics were proposed to quantify the control performance, including the settling time (defined as the time required for the response curve of intake oxygen concentration to reach and stay within a range of ±2% of the final intake oxygen concentration, denoted as T S ), steady-state error (defined as the difference between the desired intake oxygen concentration and the actual intake oxygen concentration when the response has reached steady state, denoted as E S S ), overshoot (defined as the maximum peak value of the actual intake oxygen concentration measured from the desired intake oxygen concentration, denoted as M P ) and recovery time (defined as the time it takes to recover to its prior intake oxygen concentration, denoted as T R ).

6.1. Intake Oxygen Concentration Step Response Test

To evaluate the tracking performance of the OADRC controller, a continuous step change of intake oxygen concentration were carried out at 1500 rpm engine speed and 18 mg/cycle fuel injection rate, with 80% VGT vane open. The desired Xoim ( X o i m d e s ) was changed step by step as shown in Figure 13, with the demonstration of the control effect of OADRC controller and the total disturbance observed by the ESO. The estimated intake oxygen concentration in the first plot was the real-time output of the oxygen concentration observer mentioned in Appendix A.
In the step response test of Xoim shown in Figure 14, it is seen that the proposed solution offers faster response compared to that of PID controller. The specific improvement is tabulated in Table 7.

6.2. Disturbance Rejection Capability Test

In order to evaluate the disturbance rejection ability, the NT steps from 20,000 rpm to 15,000 rpm and then to 10,000 rpm by manipulating the PTEMG, as shown in Figure 15. It is observed that the maximum deviation of Xoim from X o i m d e s is reduced by 15.6% using the proposed controller compared to the PID controller, in the time period from 8.1 s to 10.6 s. Detailed performance metrics are provided in Table 8.
Another disturbance to Xoim comes from the VGT vane position, due to its influence on p 3 , i.e., the upstream pressure of the HP-EGR valve. In Figure 16, the VGT vane position steps from 30% to 60% open, it is clear that the proposed solution shows reduced maximum Xoim deviation from the target and takes shorter time to converge to X o i m d e s . Detailed performance assessment are available in Table 9.

7. Conclusions

In this paper, experimental assessment on the impact of EAT on the air system control was conducted, based on a 6.7 L diesel engine. A disturbance rejection controller for the EAT air system was proposed and validated in simulation.
(1)
At 265 Nm engine load and 1400 rpm engine speed condition, up to 7.8% FE benefit can be achieved with the assist function of EAT(assuming the electrical energy is free in the driveline electrical regeneration during vehicle braking), through the reduction of pumping loss from wider VGT vane open, relative to the nominal system. Further FE benefit is limited by the HP-EGR deficit from over-reduced p3 (low HP-EGR flow capability).
(2)
Transient boost response with EAT assist is improved by 52.1% relative to the nominal system. The new dynamics of p2 introduced by EAT must be considered to avoid intake oxygen concentration overshoot and NOx spike. The EGR requirements should be reconsidered because of the excess fresh air from a fast boost response.
(3)
The EGR flow-based control objective should be transformed into the intake oxygen concentration-based control objective, which aligns well with the EAT system and the associated control design. EAT assist improved the volumetric efficiency of the engine (by up to 13.6% with 1.01 kW E-assist power at 265 Nm engine load and 1400 rpm engine speed in this paper), thereby increased the engine mass flow rate. This leads to HP-EGR gas dilution. EGR dilution and enhanced boost response makes the conventional EGR rate-based air system control not applicable to EAT system. Experimental results confirmed that Xoim works better as the control output for EAT system than EGR rate for NOx control.
(4)
In order to attenuate the disturbances from EAT on Xoim, a disturbance rejection based controller was proposed and validated in a high-fidelity GT-SUITE model. Results showed over 36% improvement in settling time and over 43% improvement in recovery time, relative to the conventional PID controller.

Author Contributions

C.W. and S.L. carried out the engine test, and set up the simulation platform. K.S. and C.W. worked together on the experimental data analysis, Xoim controller design and paper writing. H.X. provided a lot of valuable insights on the data analysis and controller validation.

Funding

This research was funded by Ford Motor Company.

Acknowledgments

The authors would like to thank Leon Hu, of Ford Motor Company for several fruitful discussions and his useful insights during the bi-weekly meeting. The authors would like to thank Devesh Upadhyay, Miachiel Van Nieuwstadt, Eric Curtis, and James Yi for their insights. A special thank you to Tongjin Wang from Tianjin University for assisting us in the management and maintenance of the test bench.

Conflicts of Interest

The authors declare no conflict of interest.

Nomenclature

Symbols
J Rotational inertia
m ˙ Mass flow rate
P Power
R Ideal gas constant
T Temperature
V Volume
X o a i r Oxygen concentration in the air
X o i m Oxygen concentration at the outlet of intake manifold
X o c y l Oxygen concentration in the cylinder after combustion
X o c y l _ o u t Oxygen concentration at the exhaust port
X o e g r Oxygen concentration in the recirculated exhaust gas
η Efficiency
X E G R EGR rate
A Cross-sectional area
c p , c Specific heat capacity of air
c p , e Specific heat capacity of exhaust gases
Subscripts
C Compressor
E n g Engine
H P E G R High pressure exhaust gas recirculation
T Turbine
T E M G Turbocharger shaft mounted electrical motor/generator
T C Turbocharger
v o l Volumetric
1 Pre-compressor
2 Post-compressor
3 Pre-turbine
4 Post-turbine
m a x Maximum value
i m Intake manifold
e m Exhaust manifold
c y l Cylinder
d e s Desired value

Appendix A

For Xoim observation, the existed observer, as developed by Park [23], was adopted. For completeness, it is explained briefly here.

Appendix A.1. Lyapunov-Based Observer Design

The state estimation observer is designed by rearranging the mean-value models of the oxygen concentration in the intake manifold and the exhaust manifold into the state-space form, as shown by:
X ^ ˙ = [ a 11 a 12 a 21 a 22 ] X ^ + [ w 1 w 2 ]
y ^ = [ 0 1 ] X ^
where X ^ = [ X ^ o i m X ^ o e g r ] T , a 11 = R T ^ 2 p 2 V i m ( m ˙ ^ E n g ) , a 12 = R T ^ 2 p 2 V i m m ˙ ^ H P E G R , a 21 = R T ^ 3 p ^ 3 V e m ( m ˙ ^ E n g m ˙ f u e l A F R ) , a 22 = R T ^ 3 p ^ 3 V e m ( m ˙ ^ E n g m ˙ f u e l ) , w 1 = R T ^ 2 p 2 V i m m ˙ C X o a i r , w 2 = 0 .
The form of the oxygen concentration observer is designed as:
X ^ ˙ = [ a 11 a 12 a 21 a 22 ] X ^ + [ w 1 w 2 ] + [ l 1 l 2 ] ( y y ^ ) = A X ^ + W + L ( y y ^ )
where l1 and l2 are the observer gains, which are designed on the basis of the Lyapunov stability theorem.

Appendix A.2. Xoim Observer Validation

The Xoim observer was firstly built in Matlab/Simulink, followed by the automatic code generation using the Target-link from dSPACE Inc. Then the validation on the test bench was carried out to evaluate the real-time performance. The engine speed was fixed at 1400 rpm, with a 30% VGT vane open. A step change of HP-EGR valve position was manipulated from 25% to 15%, as shown in Figure A1.
After preliminary calibration of the model corresponding to the test bench, the average relative error of the estimated oxygen concentration in the intake manifold and exhaust manifold are 0.23% and 0.86% respectively. The detailed performance assessment are available in Table A1.
Table A1. Case setup and results for the validation of Xoim observer on the test bench.
Test Case Fuel Injection RateuHP-EGRuVGTXoimXoegr
Avg. XerrorMax. XerrorAvg. XerrorMax. Xerror
-mg/cycle%%%%%%
Case 11825→15300.232.530.863.15
Figure A1. Experimental validation of oxygen concentration observer.
Energies 12 03014 g0a1
From the above experimental results, it can be seen that the oxygen concentration of intake manifold and exhaust manifold estimated by the observer can approximate the actual oxygen concentration accurately, which lays the foundation for the control of oxygen concentration in the intake manifold of diesel engine equipped with EAT.

References

  1. Filipi, Z.; Wang, Y.; Assanis, D.N. Effect of variable geometry turbine (VGT) on diesel engine and vehicle system transient response. SAE Tech. Pap. 2001. [Google Scholar] [CrossRef]
  2. Dambrosio, L.; Pascazio, G.; Fortunato, B. Vgt turbocharger controlled by an adaptive technique. IEEE/ASME Trans. Mechatron. 2003, 8, 492–499. [Google Scholar] [CrossRef]
  3. Song, K.; Upadhyay, D.; Xie, H. An assessment of performance trade-offs in diesel engines equipped with regenerative electrically assisted turbochargers. Int. J. Engine Res. 2018, 20, 510–526. [Google Scholar] [CrossRef]
  4. Chiara, F.; Canova, M. A review of energy consumption, management, and recovery in automotive systems, with considerations of future trends. Proc. Inst. Mech Eng. Part D J. Automob. Eng. 2013, 227, 914–936. [Google Scholar] [CrossRef]
  5. Aghaali, H.; Ångström, H. A review of turbocompounding as a waste heat recovery system for internal combustion engines. Renew. Sustain. Energy Rev. 2015, 49, 813–824. [Google Scholar] [CrossRef]
  6. Dimitriou, P.; Burke, R.; Zhang, Q.; Copeland, C.; Stoffels, H. Electric turbocharging for energy regeneration and increased efficiency at real driving conditions. Appl. Sci. 2017, 7, 350. [Google Scholar] [CrossRef]
  7. Newman, P.; Luard, N.; Jarvis, S.; Richardson, S.; Smith, T.; Jackson, R.; Rochette, C.; Lee, D.; Criddle, M. Electrical supercharging for future diesel powertrain applications. In Proceedings of the 11th International Conference on Turbochargers and Turbocharging, London, UK, 13–14 May 2014. [Google Scholar]
  8. Katsanos, C.O.; Hountalas, D.T.; Zannis, T.C. Simulation of a heavy-duty diesel engine with electrical turbocompounding system using operating charts for turbocharger components and power turbine. Energy Convers. Manag. 2013, 76, 712–724. [Google Scholar] [CrossRef]
  9. Millo, F.; Mallamo, F.; Pautasso, E.; Mego, G.G. The potential of electric exhaust gas turbocharging for HD diesel engines. SAE Tech. Pap. 2006. [Google Scholar] [CrossRef]
  10. Cipollone, R.; di Battista, D.; Gualtieri, A. Turbo compound systems to recover energy in ICE. Int. J. Eng. Innov. Technol. (IJEIT) 2013, 3, 249–257. [Google Scholar]
  11. Briggs, I.; McCullough, G.; Spence, S.; Douglas, R. Whole-vehicle modelling of exhaust energy recovery on a diesel-electric hybrid bus. Energy 2014, 65, 172–181. [Google Scholar] [CrossRef] [Green Version]
  12. Katrašnik, T.; Trenc, F.; Medica, V.; Markič, S. An analysis of turbocharged diesel engine dynamic response improvement by electric assisting systems. J. Eng. Gas Turbines Power 2005, 127, 918–926. [Google Scholar] [CrossRef]
  13. Katrašnik, T.; Rodman, S.; Trenc, F.; Hribernik, A.; Medica, V. Improvement of the dynamic characteristic of an automotive engine by a turbocharger assisted by an electric motor. J. Eng. Gas Turbines Power 2003, 125, 590–595. [Google Scholar] [CrossRef]
  14. Terdich, N.; Martinez-Botas, R. Experimental efficiency characterization of an electrically assisted turbocharger. SAE Tech. Pap. 2013. [Google Scholar] [CrossRef]
  15. Jain, A.; Nueesch, T.; Naegele, C.; Lassus, P.M.; Onder, C.H. Modeling and Control of a Hybrid Electric Vehicle with an Electrically Assisted Turbocharger. IEEE Trans. Veh. Technol. 2016, 65, 4344–4358. [Google Scholar] [CrossRef]
  16. Zhao, D.; Stobart, R.; Dong, G.; Winward, E. Real-Time Energy Management for Diesel Heavy Duty Hybrid Electric Vehicles. IEEE Trans. Control Syst. Technol. 2015, 23, 829–841. [Google Scholar] [CrossRef]
  17. Kolmanovsky, I.; Stefanopoulou, A.G. Evaluation of turbocharger power assist system using optimal control techniques. SAE Trans. 2000, 109, 518–528. [Google Scholar]
  18. Glenn, B.C.; Upadhyay, D.; Washington, G.N. Control Design of Electrically Assisted Boosting Systems for Diesel Powertrain Applications. IEEE Trans. Control Syst. Technol. 2010, 18, 769–778. [Google Scholar] [CrossRef]
  19. Jung, M.; Glover, K.; Christen, U. Comparison of uncertainty parameterisations for robust control of turbocharged diesel engines. Control Eng. Pract. 2005, 13, 15–25. [Google Scholar] [CrossRef]
  20. Nakayama, S.; Fukuma, T.; Matsunaga, A.; Miyake, T.; Wakimoto, T. A New Dynamic Combustion Control Method Based on Charge Oxygen Concentration for Diesel Engines. SAE Tech. Pap. 2003. [Google Scholar] [CrossRef]
  21. Shutty, J.; Benali, H.; Daeubler, L.; Traver, M. Air System Control for Advanced Diesel Engines. SAE Tech. Paper 2007. [Google Scholar] [CrossRef]
  22. Millo, F.; Pautasso, E.; Pasero, P.; Barbero, S.; Vennettilli, N. An Experimental and Numerical Study of an Advanced EGR Control System for Automotive Diesel Engine. SAE Int. J. Engines 2009, 1, 188–197. [Google Scholar] [CrossRef]
  23. Park, Y.; Min, K.; Chung, J.; Sunwoo, M. Control of the air system of a diesel engine using the intake oxygen concentration and the manifold absolute pressure with nitrogen oxide feedback. Proc. Inst. Mech. Eng. Part D J. Automob. Eng. 2015, 230, 240–257. [Google Scholar] [CrossRef]
  24. Chen, S.K.; Yanakiev, O. Transient NOx emission reduction using exhaust oxygen concentration based control for a diesel engine. SAE Tech. Paper 2005. [Google Scholar] [CrossRef]
  25. Han, J. From PID to Active Disturbance Rejection Control. IEEE Trans. Ind. Electron. 2009, 56, 900–906. [Google Scholar] [CrossRef]
  26. Han, J. Active Disturbance Rejection Control Technique-the Technique for Estimating and Compensating the Uncertainties; National Defense Industry Press: Beijing, China, 2008; pp. 197–270. [Google Scholar]
  27. Song, K.; Upadhyay, D.; Xie, H. Control of diesel engines with electrically assisted turbocharging through an extended state observer based nonlinear MPC. Proc. Inst. Mech. Eng. Part D J. Automob. Eng. 2019, 233, 378–395. [Google Scholar] [CrossRef]
  28. Yu, H.; Song, K.; Xie, H. Study on Optimal Control for the Air System of E-Turbo Assisted Diesel Engine Based on Model Prediction. Chin. Intern. Combust. Engine Eng. 2018, 4, 39–46. [Google Scholar]
  29. Eriksson, L.; Nielsen, L. Modeling and Control of Engines and Drivelines; John Wiley & Sons: Hoboken, NJ, USA, 2014. [Google Scholar]
  30. Song, K. Active Disturbance Rejection Based High-Dilution Low-Temperature Combustion Control for P-DI Gasoline Engines; Tianjin University: Tianjin, China, 2015. [Google Scholar]
  31. Gao, Z. Scaling and bandwidth-parameterization based controller tuning. In Proceedings of the American Control Conference, Minneapolis, MN, USA, 14–16 June 2006; Volume 6, pp. 4989–4996. [Google Scholar]
Figure 1. Schematic of the electrically assisted turbocharger (EAT)-assisted diesel engine. The nomenclature for all the symbols can be found in Nomenclature section.
Energies 12 03014 g001
Figure 2. Schematic of experimental platform.
Energies 12 03014 g002
Figure 3. Test bench for diesel engine with EAT.
Energies 12 03014 g003
Figure 4. Validation of the GT-SUITE model over a segment of the hot start FTP-75 drive cycle in terms of boost pressure, pre-turbine pressure, and compressor mass flow rate [27].
Energies 12 03014 g004
Figure 5. Engine fuel efficiency improvement and Xoim surplus.
Energies 12 03014 g005
Figure 6. Volumetric efficiency improvement and in-cylinder composition change.
Energies 12 03014 g006
Figure 7. Comparison of three performance variables with NOx concentration.
Energies 12 03014 g007
Figure 8. Correlation between NOx concentration and three performance variables.
Energies 12 03014 g008
Figure 9. Regulations of three actuators during the transient process.
Energies 12 03014 g009
Figure 10. Tip-in test for the nominal system without assist.
Energies 12 03014 g010
Figure 11. Tip-in test for the EAT system
Energies 12 03014 g011
Figure 12. Control structure of the OADRC controller.
Energies 12 03014 g012
Figure 13. OADRC validation with step changes of desired intake oxygen concentration.
Energies 12 03014 g013
Figure 14. Comparison between OADRC and PID controller with step changes of intake oxygen concentration.
Energies 12 03014 g014
Figure 15. Disturbance rejection performance comparison with step change of NT.
Energies 12 03014 g015
Figure 16. Disturbance rejection performance comparison with step change of variable-geometry turbocharger (VGT) vane.
Energies 12 03014 g016
Table 1. Engine specifications.
VariableValue
Displacement (liter)6.7
CylindersV8
Compression ratio16.2
Maximum injection pressure (MPa)200
Bore (mm)99
Stroke (mm)108
Bore/Stroke Ratio0.92
Maximum torque (Nm)/speed (rpm)1166/2600
Rated power (kW)/speed (rpm)328/2800
Table 2. EAT specifications.
VariableValue
Operating voltage (V)200~400
Maximum power (kW)17  kW in continuous mode and 23  kW in intermittent mode
Shaft speed (krpm)0~140
Type of coolingwater and oil cooling
Table 3. Specifications of test bench.
NumDeviceSpecifications
1AVL INDYS22 AC electric dynamometerMax speed/power8000 rpm/200 kW
2AVL 735S/753 C fuel mass flow meterMax measuring fuel consumption125 kg/h
Max measuring frequency20 Hz
3KWELL EVS-80-800 Battery SimulatorMax output voltage800 V
Rated power80 kW
4Bosch LSU 4.9 oxygen sensorMeasuring rangelambda 0.65–∞
5Continental SNS14 NOx sensorMeasuring accuracy±10% from 100 ppm to 1500 ppm
Table 4. Estimation error of the GT-SUITE model.
VariableGT-SUITE Model
p21.8% points has error > 5 kPa
p32.9% points has error > 10 kPa
m ˙ c 3.3% points has error > 0.01 kg/s
P E n g d t Xerror = 6.7%
Table 5. Test case set-up for steady-state investigation of assist power.
Test caseNEngTEngp2XoimuVGTuHP-EGRPTEMG
-rpmNmbar%%%kW
Case114002651.2415.5Sweep from 15% to 55% openClosed-loop control to maintain XoimClosed-loop control to maintain p2
Table 6. Test case set-up for transient investigation of assist power.
Test CaseNEngTEnguVGTuHP-EGRPTEMG
-rpmNm%%kW
Case11200120→26056→3624→140
Case21200120→26056→3624→14Closed-loop control to trace NT
Table 7. Comparison between OADRC and proportional-integral-differential (PID) controller with step changes of intake oxygen concentration.
ItemOADRCPIDImprovement with OADRC
Average TS (s)1.212.0741%
Maximum TS (s)1.52.3536%
Average ESS (%)0.050.050
MP (%)000
Table 8. Disturbance rejection performance comparison with step change of NT.
ItemOADRCPIDImprovement with OADRC
Average MP (%)0.240.3122.6%
Maximum MP (%)0.270.3215.6%
Average TR(s)1.963.4743.5%
Maximum TR(s)2.484.544.9%
Table 9. Disturbance rejection performance comparison with step change of VGT vane.
ItemOADRCPIDImprovement with OADRC
MP (%)6.186.190.2%
TR (s)1.582.0221.8%

