Abstract
Photovoltaic distributed generation (PVDG) has seen tremendous growth in recent years, especially in the residential sector. Among other concerns, the voltage rise in AC networks is considered the most limiting factor in achieving increased PV penetration levels. A steady-state impact study is performed on a CIGRE low-voltage (LV) residential network. This paper compares six techniques to increase the PV penetration limit in the LV residential network, namely single-phase penetration (SPP), Distribution Scheme 1 (DS1), Distribution Scheme 2 (DS2), alternate phase penetration (APP), offline tap adjustment (OTA) and switched on-load tap adjustment (SOLTA). PSCAD software is used for this study. The best results are obtained for the DS2-SOLTA case that gives the minimum voltage magnitude and voltage unbalance in the system. The steady-state results are validated by a dynamic data study using measured solar irradiance and residential load data. A novel approach is also proposed for calculating the worst day from the data set. The obtained results verify the effectiveness of the proposed approach.
1. Introduction
Photovoltaic (PV) generation can currently be considered as the most popular renewable energy source, and its use is increasing as PV module costs are decreasing day by day. According to [1], this trend has resulted in an increased PV cell generation of up to 45% from 2015 to 2017. Abundant solar irradiation in most parts of the world has led to this clean energy source being widely adapted. Among PV generation plants, the grid integration of residential PVs installed at the low-voltage (LV) distribution level, also known as PV distributed generation (PVDG), has gained much importance [2], partly because solar irradiation is free in nature and also due to its stationary, clean and silent power generation. These PVDGs are usually installed at rooftops, windows or parking lots, leading to clean and sustainable energy generation. The penetration of PVDGs varies by country: for example, in Europe it is estimated at 49% [3], while in Australia it is higher [4]. These PVDGs offer a number of advantages at the LV distribution level, such as an increase in voltage levels where voltages are low, e.g., in rural networks, and reductions in power losses [5,6]. Despite the advantages, there are negative impacts of increased PV penetration on LV distribution networks, especially in urban areas, mainly because increased levels of PV penetration cause reverse power flows, whereas the distribution systems are designed for unidirectional power flow towards the consumers. Many adverse effects arise from high levels of PV penetration, such as voltage sags/swells, unbalance, protection equipment coordination, islanding detection [7], harmonics, etc., among which voltage regulation is the most significant [8]. Voltage rise issue occurs with an increase in PVDGs while the load is minimal in the LV feeder. This is mainly because of the injection of active power into the system. There have been many studies showing this increase in voltage due to PVDGs in distribution networks. Although most of these studies have focused on the medium-voltage (MV) level, recently, there have been some studies published addressing LV-level issues. Since consumers directly connect at LV, it is important that the voltage profile does not violate voltage limits. Therefore, many studies are now focusing on voltage profile issues related to magnitude. However, as most of the residential PVs are single-phase, the voltage unbalance issue is also significant.
Distribution system operators (DSOs) routinely face this challenge. On one hand, they have to operate the system reliably without any violations to allow the maximum PVDG connection in the distribution system, while ensuring the grid standards and regulations are met [9]. This task is not easy to address because of the high rate of installation of PVDGs, especially at residential level.
Typically, these LV distribution networks are more resistive in comparison to higher voltage levels; thus, reactive power compensation techniques might not be that effective [10]. In [11], a reactive power control (RPC) system is proposed using an electric vehicle charging technique that is tested in a real Danish LV grid. The results show a positive effect on voltage conditions that eliminates the voltage magnitude below 0.86 per unit (pu). However, the EN50160 standard was not fully complied with by the proposed RPC. Conventionally, an on-load tap changer (OLTC) is used at the medium and high-voltage levels for voltage regulation purposes. In [12], the utilization of the OLTC is assessed in different LV networks with high PV penetration. However, a small increase in the PV penetration limit is observed. To further increase this limit, a dual control is proposed in [13] that consists of an inverter with real and reactive power control along with the OLTC through a communication link. In this scheme, the primary control is provided by OLTC, and beyond its limits, the secondary control is provided by the inverter. This hybrid scheme is studied in a rural Brazilian network, showing significantly fewer overvoltages as compared to individual approaches. Another effective hybrid approach using an OLTC and reactive power control is proposed in [14]. However, it requires a real-time coordinated control scheme using an energy storage system (ESS) for voltage regulation, which is not cost-effective [15]. In [16], voltage regulation is achieved by controlling the legacy devices; i.e., load tap changers (LTCs) and capacitor banks, smart inverters and all of these combined. While the feeder hosting capacity was increased by using legacy devices, this is not an effective method for regulating secondary voltages. The proposed smart inverter control presents better regulation, but it increased reactive power demand and switching harmonics. An optimal tap control (OTC) method is proposed in [15] to regulate the OLTCs for voltage deviation mitigation. However, the simplified OTC was only as effective as the advanced rule-based voltage level control method.
In this paper, the effects of PVDGs in European LV CIGRE distribution systems are investigated. Six techniques are presented, and their effectiveness in increasing the PV penetration limit are analyzed. This study investigates voltage rise and voltage unbalance using a steady-state and dynamic dataset for solar irradiance and residential load. A novel methodology is proposed to calculate the worst day concerning the voltage rise issue for DSOs, significantly shortening the distribution network planning cycle.
This paper is organized as follows: Section 2 describes the standards, definitions, and assumptions for voltage quality and PV penetration; Section 3 deals with the modeling of the CIGRE LV distribution system and single-phase PV system; in Section 4, the simulation results are presented along with the methodology and discussion; and finally, conclusions are given in Section 5.
2. Basic Definitions
2.1. Voltage Quality Standards
Different countries use different standards for steady-state voltage magnitude variations and unbalance conditions. The European voltage standard EN50160 plays a pivotal role in voltage quality in Europe. This paper uses this standard for LV magnitude limits of 0.9–1.1 pu (230V ± 10%) and voltage unbalance limits as 2–3% for 95% of the week. IEEE 1547 [17], regarding the interconnection of a PVDG with the distribution grid, does not allow inverters to tune voltage levels using reactive power compensation, which makes it the DSO’s responsibility to provide a proper solution.
2.2. Photovoltaic Penetration Definition and Assumptions
PV penetration is a vague term as there is no single definition for this in the literature. In [18], the PV penetration is defined as the ratio of the total PV nameplate to annual peak load, while in [19], it is defined as the ratio of total PV generation to total generation. Others define the PV penetration as the ratio of peak PV power to the peak load apparent power [20]. This paper defines PV penetration as given in Equation (1), which is taken from [21,22,23].
According to the European PV connection guidelines, the installed PV capacity should not exceed the contracted power [24]. Therefore, for simplicity, it is assumed that installed PV penetration depends upon the rated load of load buses, and based on this, different PV penetration levels are analyzed. Single-phase loading is used in the network and, since the scope of study is the effects of PV penetration, the base case is taken as balanced. Without any PV injection, the system is operating well within voltage limits with zero unbalance. Only single-phase PV systems without battery storage are used in this study. The MV grid is considered as a stiff grid with 1 pu voltage.
3. System Description
3.1. LV CIGRE Distribution System
The CIGRE task force has made different transmission and distribution benchmark models to study the impact of various transmission and distribution issues, including the effects of DERs. This paper uses the CIGRE underground residential LV network of the European Benchmark [25]. Figure 1 represents this network; it comprises a 20 kV bus that supplies power to the residential feeder. A residential distribution feeder is modeled with a 200 kVA 20 kV/0.4 kV, ∆−Y distribution transformer, which supplies to different residential loads. Initially, the off-load tap changer is available on the distribution transformer. The whole LV feeder is segmented into equal lengths of 30 m and 35 m from R1–R18. For underground cables and residential load data, the reference is taken from the European Commission IDE4L project [26]. The data used for cables are given in Table 1, in which the capacitance is negligible due to short cable lengths. Loading data are obtained from [26] at different nodes of the CIGRE network. Table 2 illustrates the rated load and power factor at each bus. These loads are evenly distributed among each phase of the load bus.
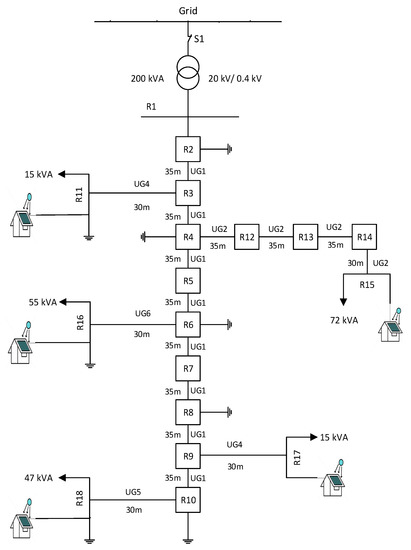
Figure 1.
Single line diagram of the CIGRE underground residential low-voltage (LV) distribution network with photovoltaics (PV).

Table 1.
CIGRE LV distribution network: cable parameters.
Table 2.
CIGRE LV distribution network: three-phase-loads & Power Factor (P.F) at each bus.
This distribution topology mainly represents an urban radial secondary distribution, where distances are small from the distribution transformer as opposed to rural distribution topology. Power is supplied to the 20 kV bus using a three-phase grounded voltage source. The network consists of a total of five loads as represented in Figure 1; all loads have a power factor of 0.95, showing that three-phase loads in the CIGRE network are considered as a cluster of single phase load houses. Since 70% of residential loads have constant power while 30% are constant impedance loads [27], they can be modeled with sufficient accuracy for real-time conditions with a parallel resistor, inductor, and capacitor in PSCAD, as shown in Figure 2, and using Equations (2)–(4) for constant power loads. However, all the loads used in this study are RL loads.
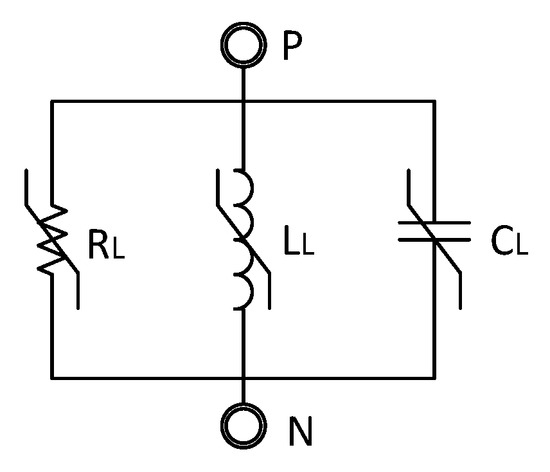
Figure 2.
Constant power load.
Cables are modeled as pi-sections in PSCAD, which gives sufficient accuracy as their lengths are very short [28,29]. Standard PSCAD/EMTDC library components are used to model the grid and ∆−Y step-down distribution transformer, and the star point is grounded with a 3 Ω resistance. The neutral conductor is grounded at different points in the network with 40 Ω resistance.
3.2. PV System
Residential PVs are mostly single-phase PV systems that operate at unity power factor; thus, they inject only active power into the grid. To date, reactive power compensation by PVDGs is not allowed according to IEEE 1547 [30]. The monitoring of the grid voltage, current and frequency is an essential task for the implementation of grid-connected PV inverters. The IEEE grid code defines the voltages and frequency limits for grid connection at the point of common coupling (PCC), where these inverters also synchronize. This is accomplished with the help of a phase-locked loop (PLL) which continuously monitors the grid voltage magnitude and phase. The overall performance of the PV controller is highly dependent on the true determination of the fundamental frequency component from the measured PCC voltage [30]. Figure 3 shows the block diagram of the PV system, where Pmax is the percentage installed capacity of the PV system. It defines the percentage of the PV capacity to be injected at a particular time, where solar irradiance is in W/m2. The control system consists of a single-phase proportional integral current controller. Single-phase PV systems pose a problem in obtaining quadrature components. Therefore, a second-order generalized integrator (SOGI) is used to obtain quadrature components from a single-phase supply [31]. The park transformation converts the obtained quadrature AC components (vα, vβ, Iα, Iβ) to respective DC components (vd, vq, Id, Iq) [32]. Here, Iqref is set to zero for unity power factor operation. To avoid resonance, an active damping term is added in the current controller. Since dynamic performance is not the scope of this study, an ideal voltage source converter is modeled with a controlled voltage source. The active power injected into the grid at the PCC for a particular PV system depends upon Idref, which is calculated using the PQ theory [33]. For detailed modelling, see [34].
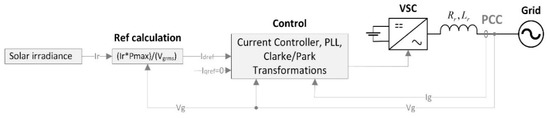
Figure 3.
Single-phase grid-tied PV system block diagram. PCC: point of common coupling, Voltage Source Converter (VSC).
4. Simulations and Results
4.1. Performance Index & Proposed Techniques
A simulation study is performed to increase the PV penetration level by complying with the voltage magnitude and unbalance limits in a benchmark LV CIGRE residential distribution network. Six techniques are analyzed by considering different PV penetration levels and loading scenarios. To quantify the voltage magnitude and unbalance at all buses, a performance index (PI) is defined in Equation (5). Several disparate PIs are proposed in the literature [34,35,36]. Because the assessment of voltage quality highly depends on PI definition, it is crucial to delineate PI. It represents the quality of voltage in terms of magnitude and unbalance in an entire network. With the increase in voltage or unbalance above or below statutory limits, PI increases significantly, indicating deterioration in voltage quality. Here, the weighting factor serves the purpose of adjusting the performance index according to a particular value (in this case, 1) to distinguish between negligible violation and high violation conditions in the network; it is adjusted arbitrarily so that in order to keep the voltage magnitude and voltage unbalance within limits, PI remains well below unity.
where
= performance index of voltage quality, = rated phase voltage at bus i,
= phase-A voltage at bus i, = voltage unbalance at bus i,
= phase-B voltage at bus i, = maximum allowed voltage unbalance,
= phase-C voltage at bus i, = maximum allowed variation from rated voltage,
N = total number of nodes, W = weighting factor (W = 20).
In this paper, two steady.state study cases based on minimum loading (25% loading) and maximum loading (100% loading) are presented for each method. For each case, PV penetration levels are varied from 0–90%. The methods are given below:
- (1)
- Single-phase penetration (SPP): This is simplest scenario, in which all single-phase PV systems are installed at phase-A of the load buses.
- (2)
- Distribution Scheme 1 (DS1): In this case, 80% of PV penetration is done in Phase-A while 10% is done both in Phase-B and C, based on total PV penetration levels.
- (3)
- Distribution Scheme 2 (DS2): In this scenario, 50% of total PV penetration is introduced in Phase-A while 25% is introduced in both Phase-B and C.
- (4)
- Alternate-phase penetration (APP): This selects alternate phases at different load buses of the network for PV system connection. In order to find the optimal solution, PI is analyzed using the particle swarm optimization technique in [37]. This implies that PV system should be connected in phase-A for buses R11 and R18, in phase-B for buses R16 and R17, and in phase-C for the R15 bus. For large networks comprising several LV and MV feeders, the simulation time may increase significantly, putting a constraint on the size of the simulated network.
- (5)
- Offline tap adjustment (OTA): In this method, the tap setting of the distribution transformer is adjusted manually in offline mode. This is useful in reducing the voltage magnitude of the whole LV network to accommodate more PV penetration. However, the voltages should not violate the lower limit when there is no PV injection (e.g., at night), hence restricting the tap position. Also, OTA is applied for all of the above techniques. A tap position of 0% is selected.
- (6)
- Switched on-load tap adjustment (SOLTA): This proposed method has some operational intelligence that can vary the secondary transformer voltage with respect to irradiation level. As PV penetration is directly dependent on the irradiation level, a switching mechanism can be used to vary the tap settings when irradiation exceeds a certain level; here, a 500 W/m2 threshold with a tap position of 5% is selected for switching. This technique is applied to SPP, DS1, DS2, and APP cases.
4.2. Results & Discussions: Steady-State Study
The voltage profiles for both minimum and maximum loading cases are shown in Figure 4. A total of five tap positions are used in the transformer (−5% to 5% with tap step of 2.5%). The 3rd tap position is usually considered as the neutral position. However, a 2nd tap position (−2.5%) is selected to obtain ideal voltage levels at all buses of the system. It can be observed that for the minimum loading case, the voltages remain well below the grid code limits, while for the maximum loading voltages, the voltages are well above the limits.
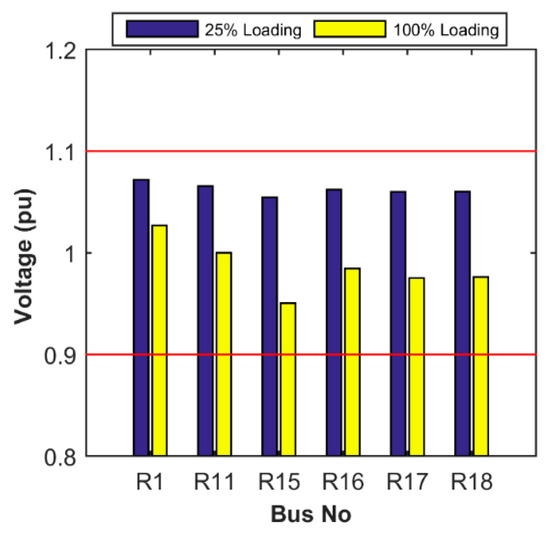
Figure 4.
Bus voltage magnitudes for minimum and maximum loading conditions with no PV.
Simulations are performed from 0–90% PV penetrations for each of the four techniques for both the minimum and maximum loading cases. Currents for each case remained well below the rated capacity of the network distribution cables. Figure 5 shows voltage levels for 0% PV and percentage voltage differences for 30% PV and 60% PV. For 0% PV, SPP, DS1, DS2, and APP have the same voltage levels, while both the OTA and SOLTA present different voltage levels. This is because, for the latter two techniques, the tappings are changed, which lowers the system voltage. It can be observed that all the bus voltages remain well within the limits with no PV injection, with R15 presenting the lowest voltage as it is heavily loaded. For 30% PV penetration, in all other cases, the percentage voltage difference (%Vdiff) remains within limits, while upper voltage limit violation can be observed for SPP, SPP-OTA and SPP-SOLTA techniques at the R15 bus. As the PV penetration level increases to 60%, all the techniques have maximum voltage limit violation at the R15 bus except DS2, DS2-OTA and an insignificant violation in DS2-SOLTA. From these results, it can be inferred that the R15 bus can accommodate the least PV capacity, while the R1 bus remains within the voltage limits at this PV penetration level. In addition, no voltage level violation is observed at the medium-voltage (MV) level. Figure 6 shows the effect of voltage unbalance at distribution buses for different PV penetration levels. With no PV injection (0% PV), the system is balanced. At the 10% PV penetration level, the voltage unbalance in the system increases. SPP, SPP-OTA, SPP-SOLTA, DS1, DS1-OTA, and DS1-SOLTA violate the unbalance limit of 2%. It can be observed that as the PV penetration increases from 10% to 15%, the SPP gives the highest unbalance compared to other techniques. Again, the most critical bus for unbalance is R15, while the R1 bus has the least unbalance. DS2 is the best technique for voltage unbalance minimization, with APP as second best.
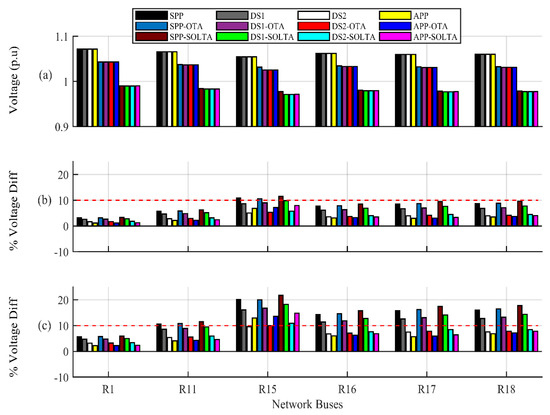
Figure 5.
Voltage magnitude and percentage voltage difference at distribution network buses with PV penetration levels: (a) voltage at 0% PV; (b) percentage voltage difference at 30% PV; (c) percentage voltage difference at 60% PV.
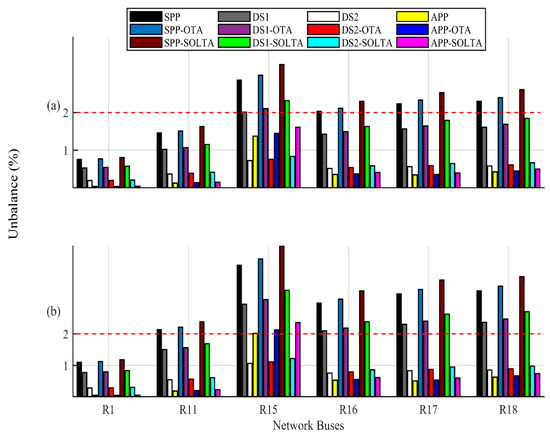
Figure 6.
Voltage unbalance at distribution network buses with PV penetration levels: (a) 10% PV, (b) 15% PV.
DS2-SOLTA provides the maximum PV injection limit with respect to the voltage magnitude level, but again, the voltage unbalance remains the same. The results suggest that the voltage unbalance is a major factor that defines the PV penetration limit in a LV distribution network. A PI plot at 25% loading with all cases is presented in Figure 7, which shows the PI variation from 0%–90% PV injection. For SPP, SPP-OTA, and SPP-SOLTA, with an increase in installed PV injection, there is an exponential increase in the PI value, as both the voltage unbalance and voltage magnitude in phase-A are high. For DS1, DS1-OTA, and DS1-SOLTA, there is also an abrupt increase in PI as can be seen in the figure. In the cases of DS2 and APP, the PI value varies almost linearly. For APP, this is mainly due to the optimal placement of single-phase PV systems to minimize both the voltage unbalance and voltage magnitude. By using DS2-OTA and APP-OTA, no significant improvement can be observed in comparison to DS2 and APP, as the OTA technique further improves by mitigating the voltage rise issue, but still, the voltage unbalance keeps on increasing with increasing PV injection. The best results are obtained by using DS2-SOLTA and APP-SOLTA. Therefore, the PI correctly indicates the steady-state results presented in Table 3. Based on this, it can be stated that the best technique to mitigate the voltage rise issue with an increased PV penetration limit for a LV distribution network is DS2-SOLTA. Note that SOLTA is operational for a certain irradiation band, as defined by the threshold level; however, for steady-state comparison, it is plotted for all PV penetration levels. Significant improvement in DS2-SOLTA and APP-SOLTA is not observed in Figure 7, as the voltage unbalance increases as PV penetration is increased.
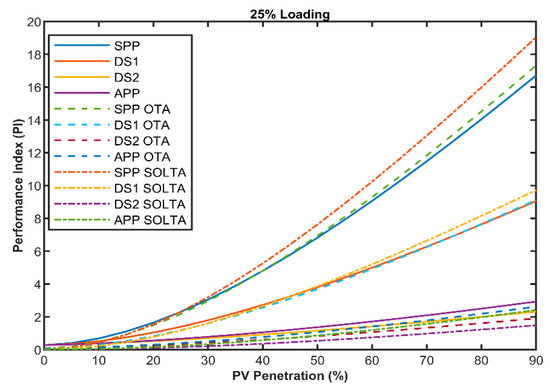
Figure 7.
Performance index for voltage magnitude and voltage unbalance with minimum loading.
Table 3.
Steady-state PV penetration limits for each case. SPP: single phase penetration; DS1: Distribution Scheme 1; DS2: Distribution Scheme 2; APP: alternate phase penetration; OTA: offline tap adjustment; SOLTA: switched on-load tap adjustment.
According to Table 3, for voltage magnitude, the minimum loading puts a limit on the maximum allowed PV penetration, which will be used for the dynamic study in the next section.
4.3. Worst Day Estimation
Since a large amount of data needs to be processed and analyzed before finding the worst day in a year, on which the grid code violations are maximum, a novel estimation criterion is proposed here for the calculation using ∆Max, defined as
where
= irradiation (W/m2), = installed PV capacity (W), = peak load in a year (W),
= loading (W), = designed irradiation level (here, 1000 W/m2),
= rated load (W).
This represents the difference in power injection by PVDGs and power consumption by loads in the network. Ir and are the values obtained from irradiation and loading data, respectively. Equation (6) needs to be evaluated for the whole year with changing levels of irradiation and loading.
All positive values of obtained for a particular day are summed and compared with the next day. The day with the highest ∆Max sum is selected as the worst day (here, September 14). The flowchart for the estimation of the worst day is shown in Figure 8. Several worst cases are proposed in [38]; this study improves on the maximum PVDG with minimum load condition such that the forecasted irradiation and load data can be used to find worst day beforehand for a specific location. This is important for DSOs, as PV penetration level needs to be checked for the maximum possible violations in a year. The calculated worst day is validated by performing simulations for the whole year from July 2016 to June 2017, using the APP with 19% PV penetration. However, any scenario could have been used for validation with any PV penetration level. The maximum voltage magnitude violation occurs at bus R15 on the calculated worst day, as shown in Figure 9, which also shows the ∆Max sum for each day, clearly indicating the worst day for the voltage magnitude violation in the entire year to be the 77th day (September 14).
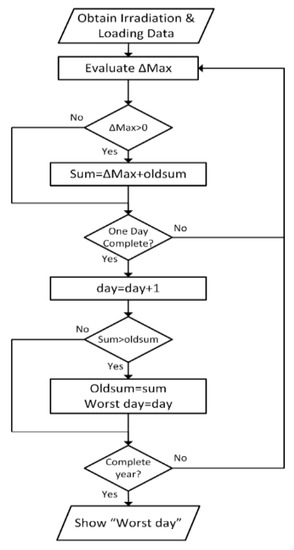
Figure 8.
Flowchart for worst day estimation.
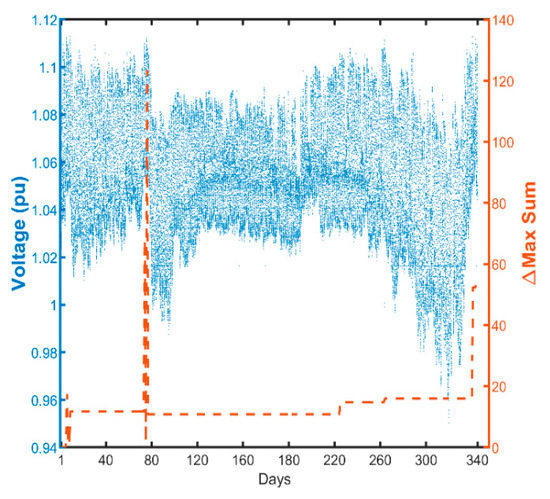
Figure 9.
Worst day estimation from a one-year dataset.
4.4. Results & Discussions: Dynamic Study
The scope of this dynamic data study is only limited to the voltage magnitude issues. Traditionally, stochastic modelling is used for unknown data [39]. However, due to the availability of real-time loading and irradiation data, it was not performed. For the PVDG location, the worst condition is taken for deterministic simulation; the inclusion of PVDG at each load node is taken as the worst case to avoid the prohibitive amount of calculations required for stochastic simulations [40]. Furthermore, it is imperative to study the worst case, because such a fast decline in PV costs is becoming extremely lucrative for prosumers.
To conduct this study, local irradiation data are obtained from a pyranometer installed at the high-precision meteorological weather station at the National University of Science and Technology (NUST) from July 2016 to June 2017. The loading profile dataset is also taken from NUST’s residential distribution system. The obtained irradiation data have a sample time of 10 min, while the loading data are available every 15 min, and linear interpolation is used to calculate loading data every 10 min. Based on the highest irradiation level, a day from the winter season (January 29) and from the summer season (June 19) were selected. In addition, for a comprehensive validation of the steady-state results, the worst day of the year (also defined as the 3rd day), as discussed in the previous section, also need to be tested.
Irradiation profiles for selected days are shown in Figure 10. The summer day shows the highest irradiation, while the winter day shows the lowest irradiation level. The highest irradiation level is observed around noontime for each day. However, there is a period of 1.5 h on June 19 where irradiation almost reached zero, indicating that a dense patch of clouds might have been passing by.
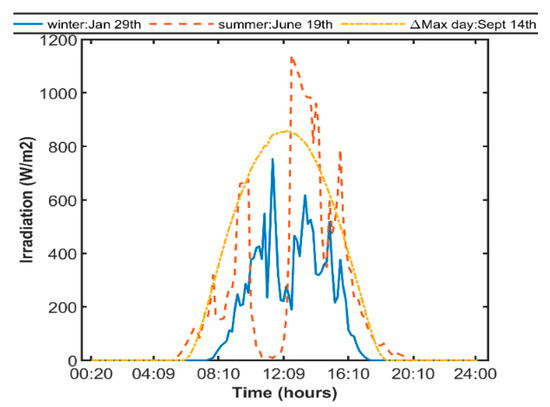
Figure 10.
Irradiation profiles for winter, summer and ∆Max days.
Loading profiles for the selected days are shown in Figure 11. Usually, the loading profile of industrial and commercial feeders is bell-shaped, but for residential feeders, instead, U-shaped profiles are obtained [41,42]. Loads in residential feeders start to decrease at about 00:00 during the night and keep on decreasing up to 06:00, where a slight increase can be observed. This decreasing trend continues up to 12:00, where the loading is minimum for all three days, after which the load starts increasing again. As observed in the steady-state study, the R15 is the critical bus for the dynamic data study as well. As this bus has the highest load, and in turn the highest amount of PV penetration when compared to other buses, the voltage profiles of bus R15 are presented for all six techniques. The maximum allowed PV penetration with DS2-SOLTA—i.e., 74% PV—is used for all three days. For the winter day, the voltage magnitude violates the voltage limit of 1.1 pu in SPP, DS1, DS2, and APP as shown in Figure 12. For the summer day, there is an increase of the voltage magnitude when compared with the winter day, due to its irradiation level. The worst case again for this day is SPP, as can be seen in Figure 13. At this PV penetration level, there is a clear violation of voltage level in the four base cases. Notice that, for each day and method, the voltage profile follows the irradiation profile for that particular day.
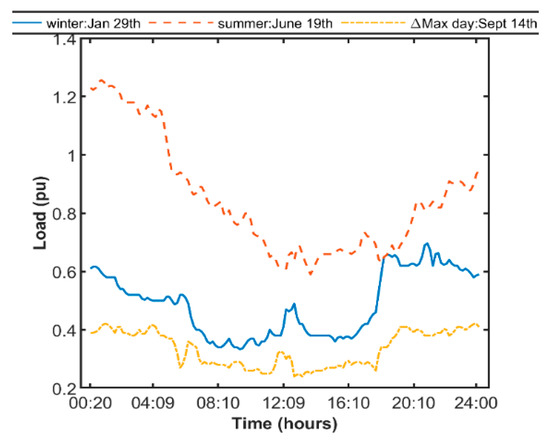
Figure 11.
Loading profiles for winter, summer and ∆Max days.
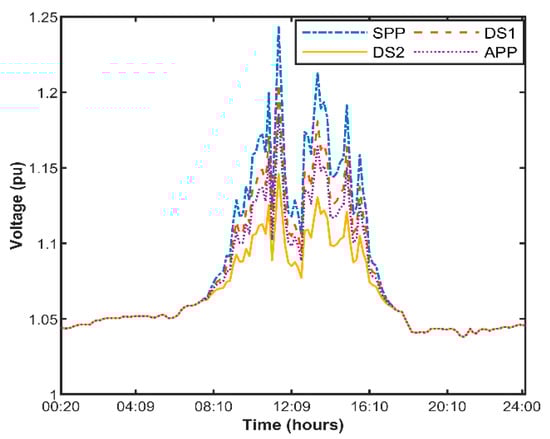
Figure 12.
Winter day voltage profile at critical bus R15: 74% PV penetration.
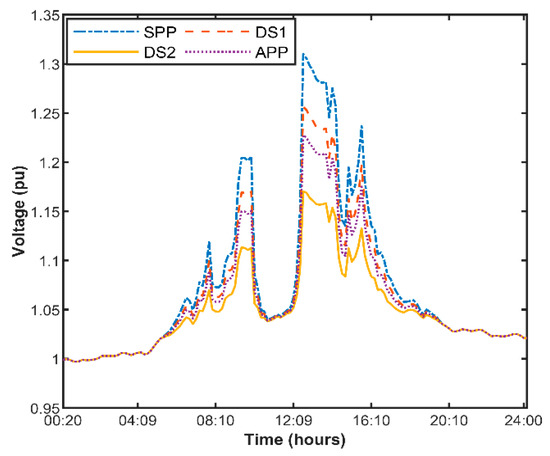
Figure 13.
Summer day voltage profile at critical bus R15: 74% PV penetration.
Lastly, for the selected worst day (3rd day), it is observed that the longest violation of the voltage level occurs on this day for all methods, as shown in Figure 14. All cases show voltage violation except the DS2-SOLTA case. Although the upper voltage limit is exceeded for DS2-SOLTA for about an hour, this violation is acceptable since, according to EN50160, the voltage magnitude needs to be within limits for 95% of the week. The sudden variation of voltage magnitude for SOLTA cases can be observed due to the switching of on-load tappings, as the irradiation level exceeds the set threshold. Therefore, the number of tap switchings depends on the variation in irradiation level. Figure 14 clearly shows the benefit of changing the tap position w.r.t irradiation level to prevent overvoltage. The use of irradiation for regulation can prove extremely valuable; in [43], an algorithm is proposed that estimates voltage fluctuation during service restoration using real-time solar radiation data and changes the tap position of OLTC when a voltage deviation is anticipated. The results obtained are promising. Dynamic data simulation validates the use of 25% loading in a steady state, finding maximum PV penetration to be a reasonable assumption for LV urban residential networks.
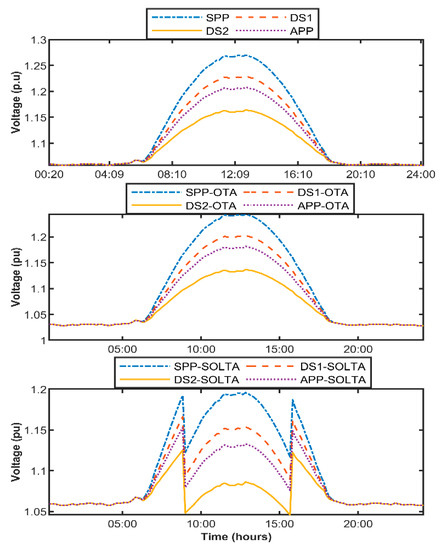
Figure 14.
∆Max day voltage profiles at critical bus R15: 74% PV penetration.
5. Conclusions
It has been observed that the network topology, transformer rating, cable ratings, location of PVDGs, type of PV and critical system buses play a vital role in the determination of the maximum allowed PV penetration. A dynamic study proves the hypothesis of using a 25% loading criterion, which gives the maximum allowed PV penetration levels, with R15 being the critical bus for the LV CIGRE network. The study concludes that, for single-phase PV systems at the distribution level, the DS2-SOLTA and APP-SOLTA techniques can provide the maximum PV penetration levels with the minimum voltage magnitude and unbalance.
The use of OLTC at the LV level is effective for voltage rise mitigation. However, it might be infeasible at large scales, the and inclusion of remote communication for its operation makes it prohibitive; SOLTA provides independent control without any need for communication and with a significant increase in the PV penetration limit. The next effective solution in terms of mitigation as well as cost is the OTA technique. In addition, it is found that the unbalance is more of a limiting factor as compared to voltage magnitude for distributed single-phase PV systems. Furthermore, as defined in the EN50160, at the LV distribution level, the voltage unbalance should be measured at the PCC, significantly limiting the allowed PV penetration. This can be increased further if the unbalance is measured at the secondary transformer in single-phase loaded networks. In addition, the allowed PV penetration is strongly dependent on the loading profile, which is a major limiting factor at the residential feeder. As it changes the curve from bell-shaped to U-shaped, it hampers the ability of the residential distribution network to accommodate more PVDGs. Since the DSOs need to plan for the worst case, this is becoming a challenge due to the increasing PV installations at the distribution level, especially residential rooftop PV. The proposed ∆Max indicator can provide an effective way to perform quick analysis using worst day selection to test a given distribution network for violations.
Author Contributions
Conceptualization, M.W. and H.A.K.; methodology, H.A.K.; software, M.W. and H.A.K.; validation, M.W.; formal analysis, M.W. and H.A.K.; investigation, M.W.; resources, H.A.K.; data curation, M.W.; writing—original draft preparation, M.W.; writing—review and editing, M.W., H.A.K., G.M.B. and C.L.B.; visualization, M.W., H.A.K., G.M.B. and C.L.B.; supervision, H.A.K.; project administration, H.A.K., G.M.B. and C.L.B.; funding acquisition, H.A.K., G.M.B. and C.L.B.
Funding
This research received no external funding.
Conflicts of Interest
The authors declare no conflict of interest.
References
- Jäger-Waldau, A. PV Status Report 2017; EUR-Scie; Publications Office of the European Union: Luxembourg, 2017. [Google Scholar]
- Betancourt, U.; Ackermann, T. Integration of Solar Power into Power Systems. In Proceedings of the 6th Solar Integration Workshop, Vienna, Austria, 14–15 November 2016; p. 9. [Google Scholar]
- Vandenbergh, M.; Craciun, D.; Helmbrecht, V.; Hermes, R.; Lama, R.; Sonvilla, P.M.; Concas, G.; Loew, H.; Mateo, C.; Frias, P.; et al. Prioritization of Technical Solutions Available for the Integration of PV Into the Distribution Grid. DERlab Eur. Distrib. Energy Resour. Lab. D 2013, 12, 1–49. [Google Scholar]
- Noone, B. PV Integration on Australian Distribution Networks; Literature Review; The Australian PV Association: Sydney, Australia, 2013. [Google Scholar]
- Urbanetz, J.; Braun, P.; Rüther, R. Power quality analysis of grid-connected solar photovoltaic generators in Brazil. Energy Convers. Manag. 2012, 64, 8–14. [Google Scholar] [CrossRef]
- Costa, P.M.; Matos, M.A. Avoided losses on LV networks as a result of microgeneration. Electr. Power Syst. Res. 2009, 79, 629–634. [Google Scholar] [CrossRef]
- Laghari, J.A.; Mokhlis, H.; Karimi, M.; Bakar, A.H.A.; Mohamad, H. An islanding detection strategy for distribution network connected with hybrid DG resources. Renew. Sustain. Energy Rev. 2015, 45, 662–676. [Google Scholar] [CrossRef]
- Lopes, J.P.; Hatziargyriou, N.; Mutale, J.; Djapic, P.; Jenkins, N. Integrating distributed generation into electric power systems: A review of drivers, challenges and opportunities. Electr. Power Syst. Res. 2007, 77, 1189–1203. [Google Scholar] [CrossRef]
- van den Oosterkamp, P.; Koutstaal, P.; van der Welle, A.; de Joode, J.; Lenstra, J.; van Hussen, K.; Haffner, R. The Role of DSOs in a Smart Grid Environment; European Commission: Amsterdam/Rotterdam, The Netherlands, 2014.
- Hashemi, S.; Østergaard, J.; Degner, T.; Brandl, R.; Heckmann, W. Efficient Control of Active Transformers for Increasing the PV Hosting Capacity of LV Grids. IEEE Trans. Ind. Inform. 2017, 13, 270–277. [Google Scholar] [CrossRef]
- Knezović, K.; Marinelli, M. Phase-wise enhanced voltage support from electric vehicles in a Danish low-voltage distribution grid. Electr. Power Syst. Res. 2016, 140, 274–283. [Google Scholar] [CrossRef]
- Rauma, K.; Cadoux, F.; Hadj-Saïd, N.; Dufournet, A.; Baudot, C.; Roupioz, G. Assessment of the MV/LV On-Load Tap Changer Technology as a Way to Increase LV Hosting Capacity for Photovoltaic Power Generators; CIRED Workshop: Helsinki, Finland, 2016; pp. 1–4. [Google Scholar]
- Efkarpidis, N.; De Rybel, T.; Driesen, J. Technical assessment of centralized and localized voltage control strategies in low voltage networks. Sustain. Energy Grids Netw. 2016, 8, 85–97. [Google Scholar] [CrossRef]
- Aziz, T.; Ketjoy, N. Enhancing PV Penetration in LV Networks Using Reactive Power Control and on Load Tap Changer with Existing Transformers. IEEE Access 2018, 6, 2683–2691. [Google Scholar] [CrossRef]
- Li, C.; Disfani, V.R.; Pecenak, Z.K.; Mohajeryami, S.; Kleissl, J. Optimal OLTC voltage control scheme to enable high solar penetrations. Electr. Power Syst. Res. 2018, 160, 318–326. [Google Scholar] [CrossRef]
- Dubey, A. Impacts of Voltage Control Methods on Distribution. Inventions 2017, 2, 28. [Google Scholar] [CrossRef]
- IEEE Standards Association. IEEE Std 1159TM-2009, IEEE Recommended Practice for Monitoring Electric Power Quality; IEEE: Piscataway, NJ, USA, 2009. [Google Scholar]
- Cheng, D.; Mather, B.A.; Seguin, R.; Hambrick, J.; Broadwater, R.P. Photovoltaic (PV) Impact Assessment for Very High Penetration Levels. IEEE J. Photovolt. 2016, 6, 295–300. [Google Scholar] [CrossRef]
- Eftekharnejad, S.; Vittal, V.; Heydt, G.T.; Keel, B.; Loehr, J. Impact of increased penetration of photovoltaic generation on power systems. IEEE Trans. Power Syst. 2013, 28, 893–901. [Google Scholar] [CrossRef]
- Hoke, A.; Butler, R.; Hambrick, J.; Kroposki, B. Steady-state analysis of maximum photovoltaic penetration levels on typical distribution feeders. IEEE Trans. Sustain. Energy 2013, 4, 350–357. [Google Scholar] [CrossRef]
- Mohammadi, P.; Mehraeen, S. Challenges of PV Integration in Low-Voltage Secondary Networks. IEEE Trans. Power Deliv. 2017, 32, 525–535. [Google Scholar] [CrossRef]
- Armendariz, M.; Brodén, D.; Honeth, N.; Nordström, L. Nordström, A method to identify exposed nodes in low voltage distribution grids with High PV penetration. In Proceedings of the 2015 IEEE Power & Energy Society General Meeting, Denver, CO, USA, 26–30 July 2015; pp. 1–5. [Google Scholar]
- Ghaffarianfar, M.; Hajizadeh, A. Voltage Stability of Low-Voltage Distribution Grid with High Penetration of Photovoltaic Power Units. Energies 2018, 11, 1960. [Google Scholar] [CrossRef]
- Lucas, A. Single-Phase PV Power Injection Limit due to Voltage Unbalances Applied to an Urban Reference Network Using Real-Time Simulation. Appl. Sci. 2018, 8, 1333. [Google Scholar] [CrossRef]
- Barsali, S. Benchmark Systems for Network Integration of Renewable and Distributed Energy Resources; ELECTRA; CIGRE: Paris, France, 2014. [Google Scholar]
- Catalonia Institute for Energy Research (IREC). Optimal Scheduling Tools for Day-Ahead Operation and Intraday Adjustment; Catalonia Institute for Energy Research (IREC): Latham, NY, USA, 2016. [Google Scholar]
- Lee Willis, H. Power Distribution Planning Reference Book, Second Edition Power Engineering (Willis), 2nd ed.; Revised Editon; CRC Press: Boca Raton, FL, USA, 2004. [Google Scholar]
- Bottaccioli, L.; Estebsari, A.; Patti, E.; Pons, E.; Acquaviva, A. A Novel Integrated Real-time Simulation Platform for Assessing Photovoltaic Penetration Impacts in Smart Grids. Energy Procedia 2017, 111, 780–789. [Google Scholar] [CrossRef]
- Tonkoski, R.; Turcotte, D.; El-Fouly, T.H. Impact of High PV Penetration on Voltage Profiles in Residential Neighbourhoods. IEEE Trans. Sustain. Energy 2012, 3, 518–527. [Google Scholar] [CrossRef]
- Kwon, J.B.; Wang, X.; Blaabjerg, F.; Bak, C.L.; Wood, A.R.; Watson, N.R. Harmonic instability analysis of a single-phase grid-connected converter using a harmonic state-space modeling method. IEEE Trans. Ind. Appl. 2016, 52, 4188–4200. [Google Scholar] [CrossRef]
- Urhekar, R.; Kulkarni, S.U. Study and Simulation of SOGI PLL for Single Phase Grid Connected System. Int. J. Sci. Res. Sci. Eng. Technol. 2016, 2, 741–745. [Google Scholar]
- Teodorescu, R.; Liserre, M.; Rodriguez, P. Grid Converters for Photovoltaic and Wind Power Systems, 1st ed.; John Wiley & Sons, Ltd.: Hoboken, NJ, USA, 2011. [Google Scholar]
- Yang, Y.; Blaabjerg, F. A new power calculation method for single-phase grid-connected systems. In Proceedings of the 2013 IEEE International Symposium on Industrial Electronics, Taipei, Taiwan, 28–31 May 2013. [Google Scholar]
- Pereira, H.; Cupertino, A.; Teodorescu, R.; Silva, S. High Performance Reduced Order Models for Wind Turbines with Full-Scale Converters Applied on Grid Interconnection Studies. Energies 2014, 7, 7694–7716. [Google Scholar] [CrossRef]
- Bollen, M.; Rönnberg, S. Hosting Capacity of the Power Grid for Renewable. Energies 2017, 10, 1325. [Google Scholar] [CrossRef]
- Oliveira, T.; Carvalho, P.; Ribeiro, P.; Bonatto, B. PV Hosting Capacity Dependence on Harmonic Voltage Distortion in Low-Voltage Grids: Model. Energies 2018, 11, 465. [Google Scholar] [CrossRef]
- Lan, H.; Wen, S.; Fu, Q.; Yu, D.C.; Zhang, L. Modeling analysis and improvement of power loss in microgrid. Math. Probl. Eng. 2015, 2015, 8. [Google Scholar] [CrossRef]
- Mahmud, M.A.; Hossain, M.J.; Pota, H.R. Worst Case Scenario for Large Distribution Networks with Distributed Generation. In Proceedings of the IEEE Power and Energy Society General Meeting, San Diego, CA, USA, 24–29 July 2011; pp. 1–7. [Google Scholar]
- Palacios-Garcia, E.; Moreno-Muñoz, A.; Santiago, I.; Moreno-Garcia, I.; Milanés-Montero, M. PV Hosting Capacity Analysis and Enhancement Using High Resolution Stochastic Modeling. Energies 2017, 10, 1488. [Google Scholar] [CrossRef]
- Papaefthymiou, G.; Schavemaker, P.H.; Van der Sluis, L.; Kling, W.L.; Kurowicka, D.; Cooke, R.M. Integration of stochastic generation in power systems. Electr. Power Energy Syst. 2006, 28, 655–667. [Google Scholar] [CrossRef]
- Market Surveillance Administrator. Residential Load Profiles; Market Surveillance Administrator: Calgary, AB, Canada, 2004. [Google Scholar]
- Chuan, L.; Ukil, A. Modeling and Validation of Electrical Load Profilling in Residential Buildings in Singapore. IEEE Trans. Power Syst. 2015, 30, 2800–2809. [Google Scholar] [CrossRef]
- Kawano, S.; Fujimoto, Y.; Wakao, S.; Hayashi, Y.; Takenaka, H.; Irie, H.; Nakajima, T.Y. Voltage Control Method Utilizing Solar Radiation Data in High Spatial Resolution for Service Restoration in Distribution Networks with PV. J. Energy Eng. 2016, 143. [Google Scholar] [CrossRef]
© 2019 by the authors. Licensee MDPI, Basel, Switzerland. This article is an open access article distributed under the terms and conditions of the Creative Commons Attribution (CC BY) license (http://creativecommons.org/licenses/by/4.0/).