Developing Inspection Methodology of Solar Energy Plants by Thermal Infrared Sensor on Board Unmanned Aerial Vehicles

Abstract
1. Introduction
2. Materials and Methods
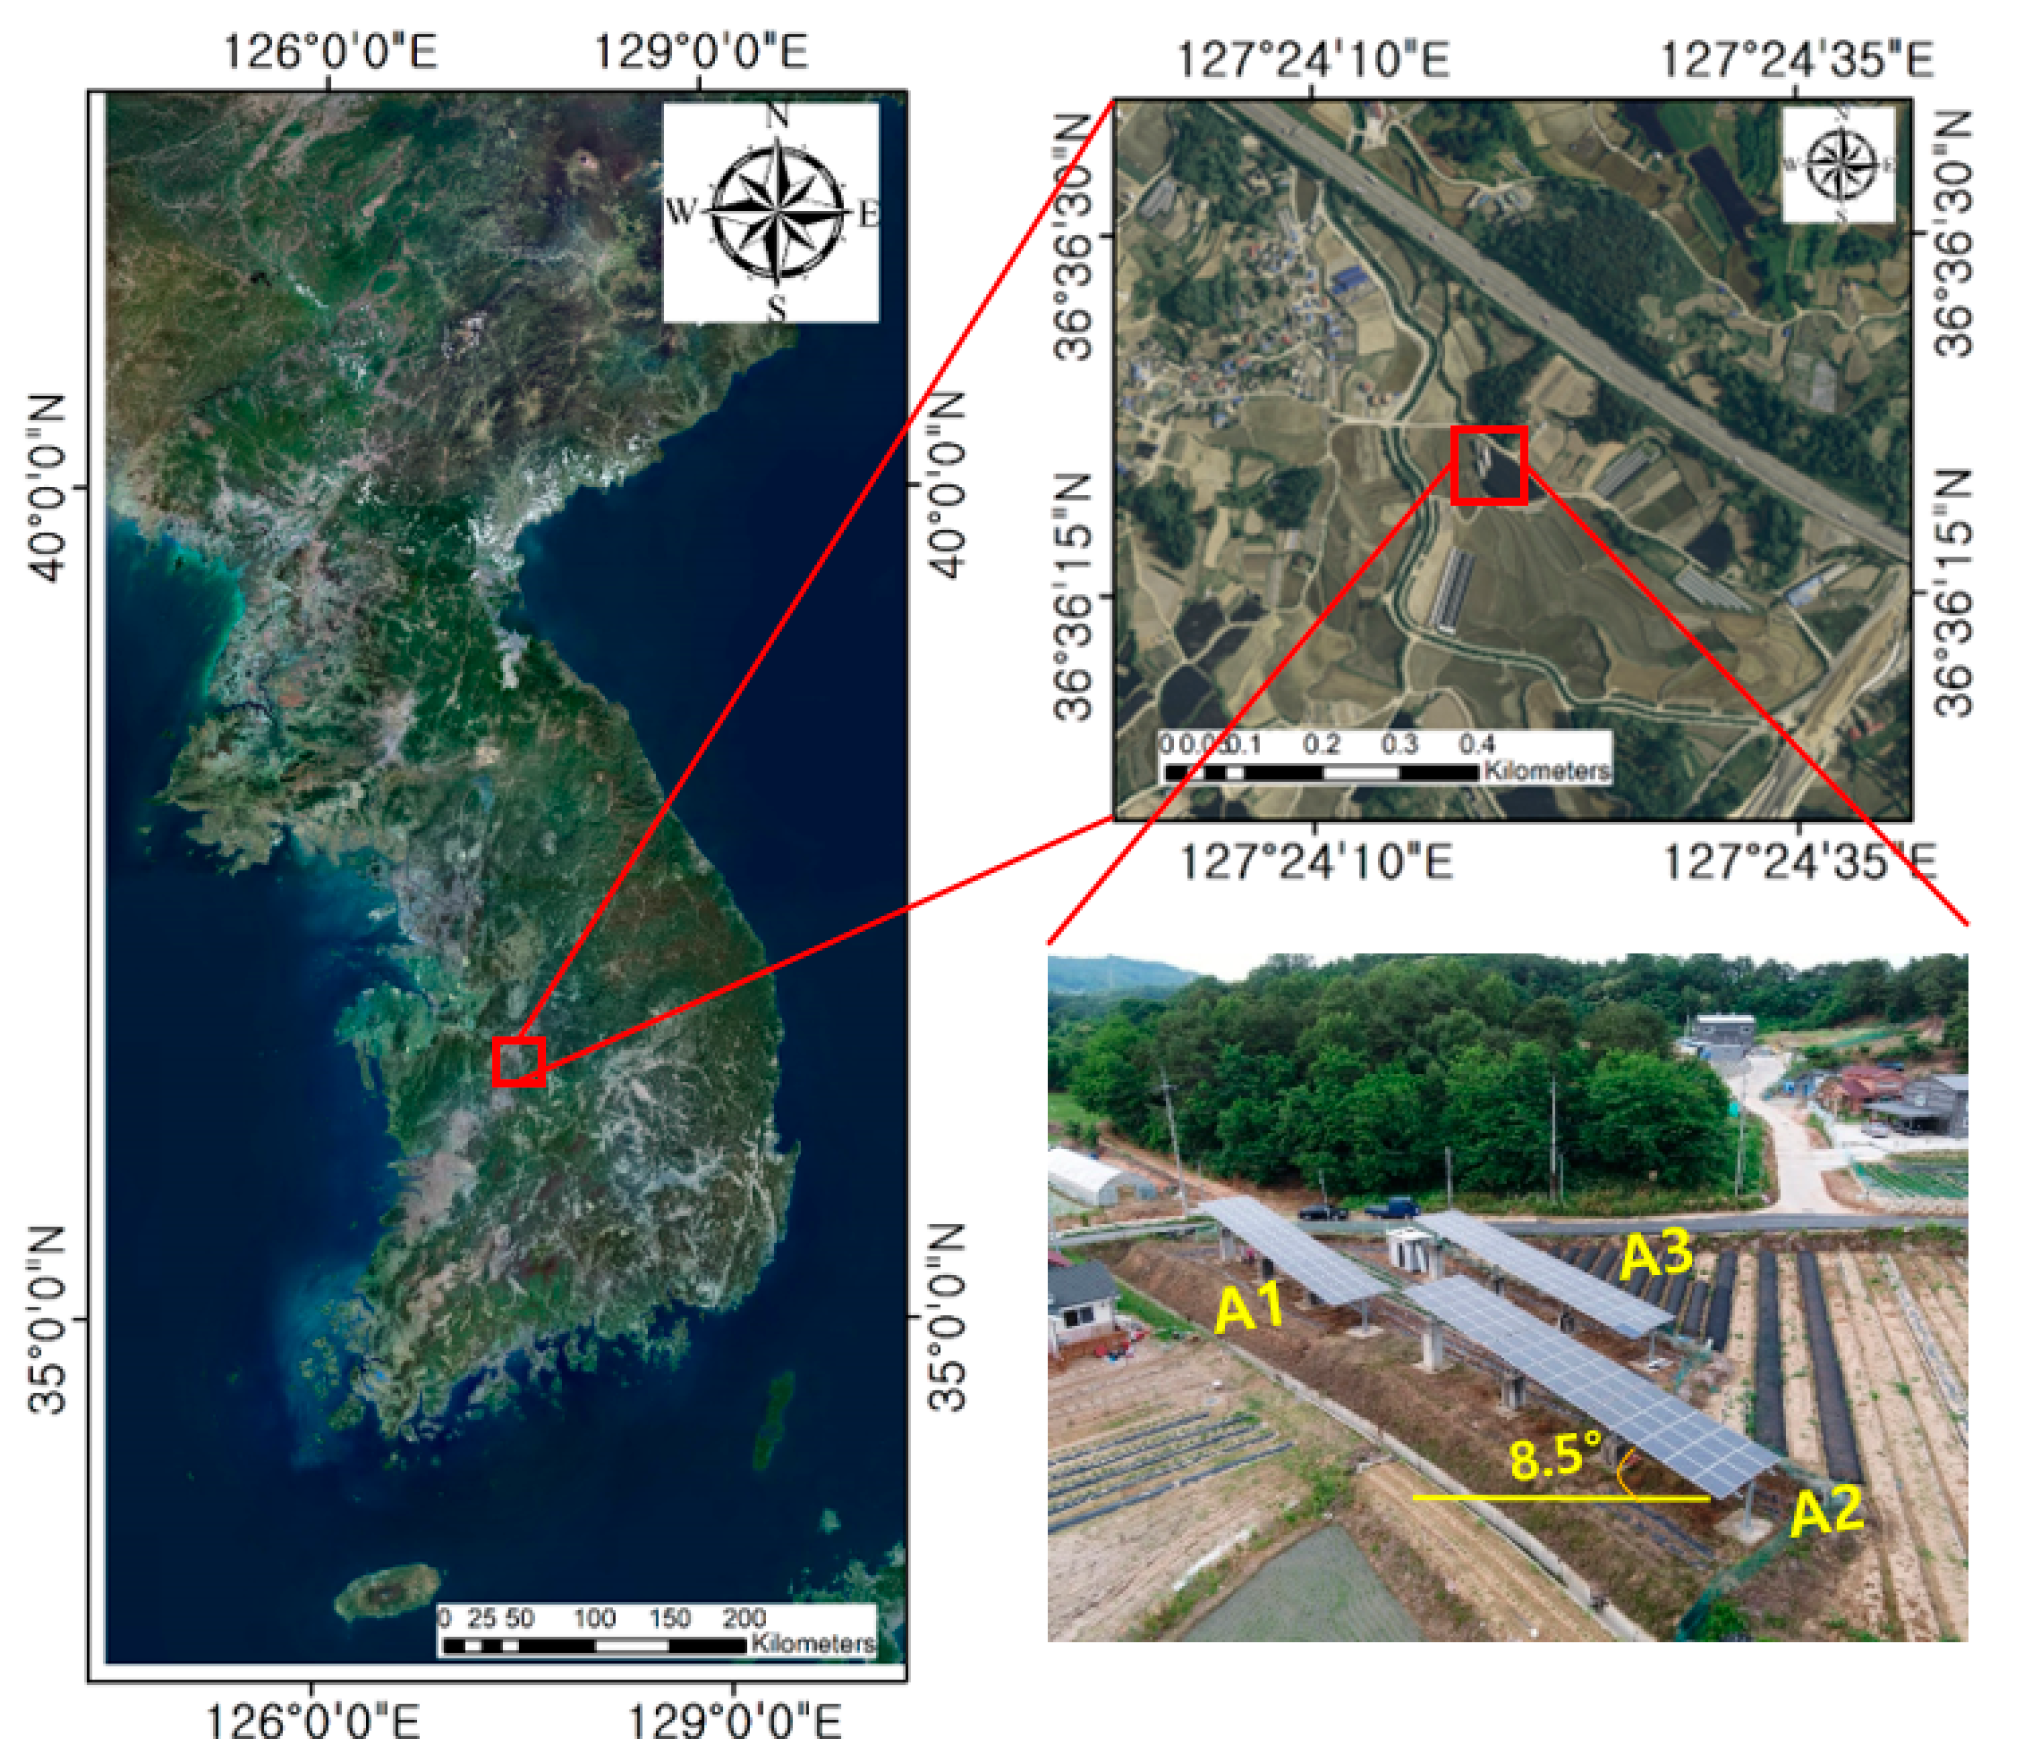
2.1. Study Site
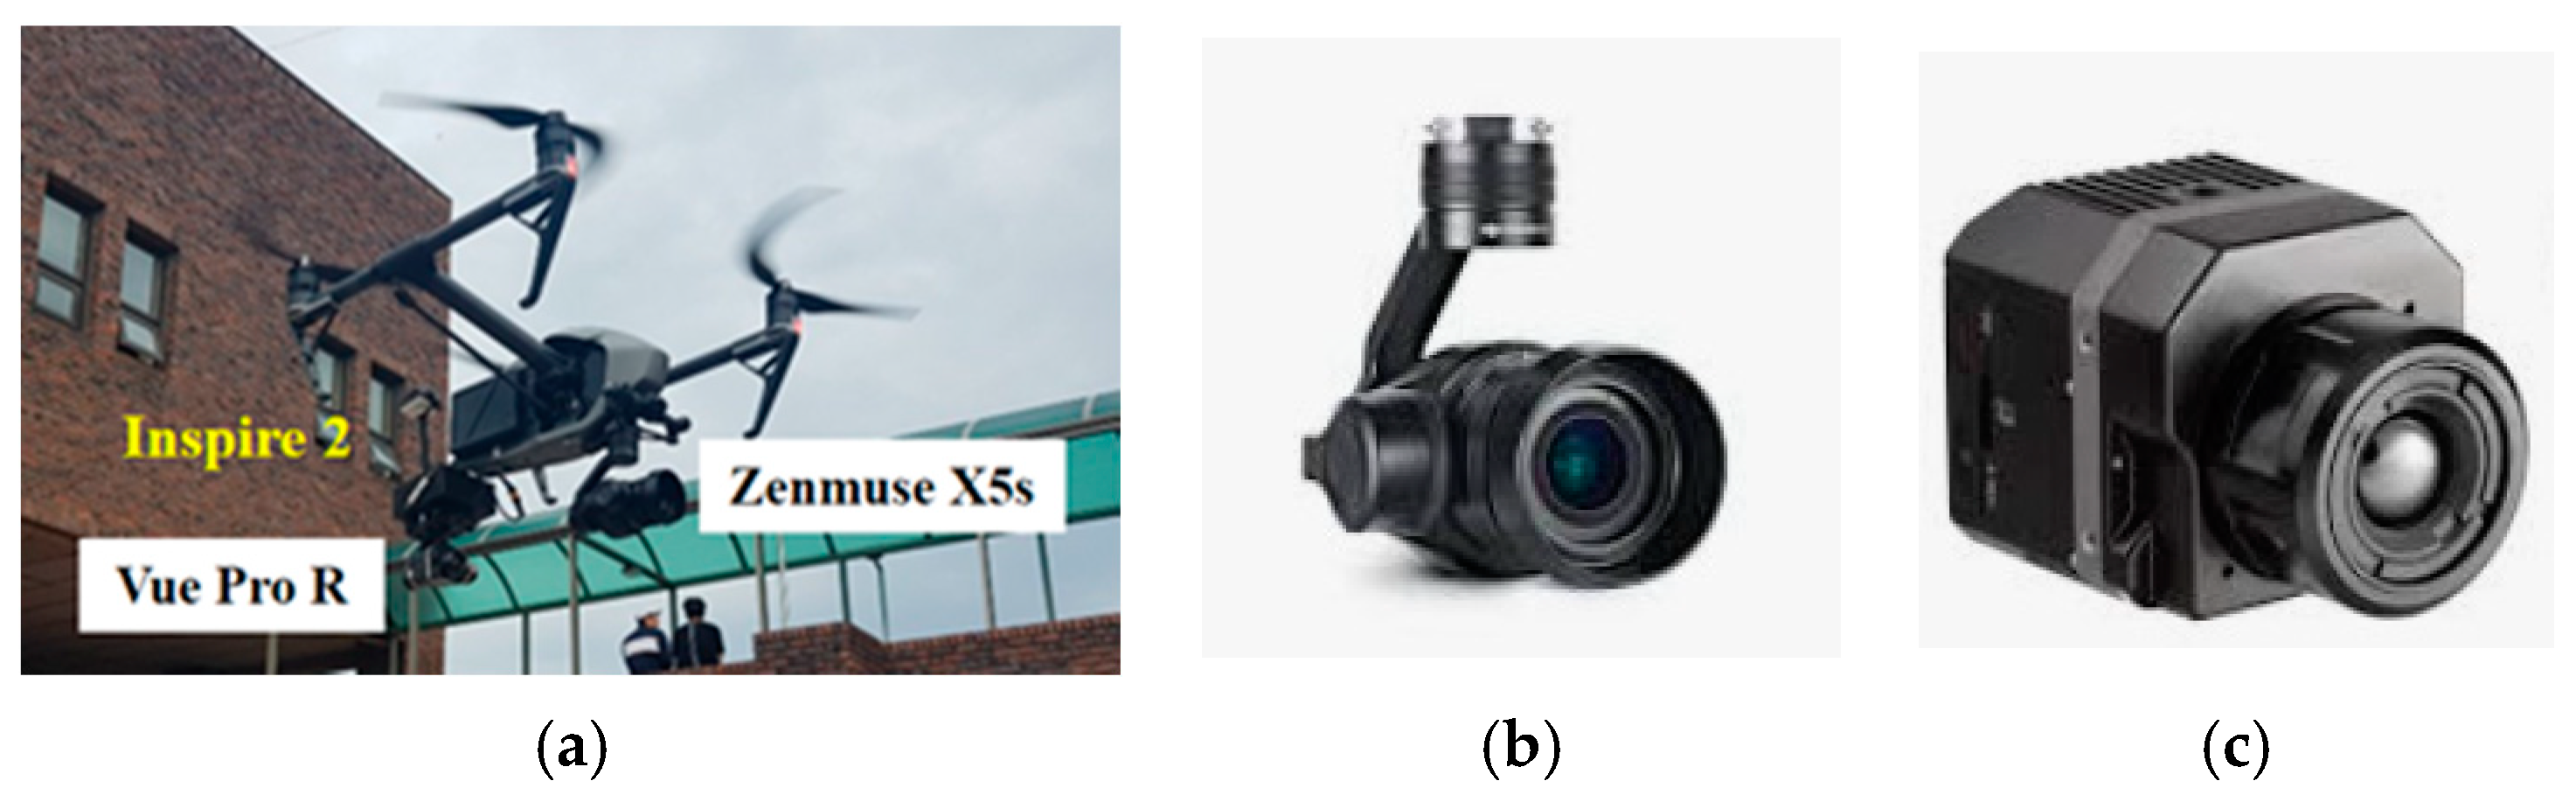
2.2. Materials
2.3. Research Process
- (A)
- Selection of target area: The Republic of Korea has a very diverse PV system. The purpose of this study is to obtain accurate temperature and location information of the problem point by utilizing UAV and thermal infrared sensor for the PV system. Therefore, the target area selected was small with a small installation size that could accurately grasp the solar panel information.
- (B)
- RS/GIS/GPS data collection: UAV-based RGB and thermal infrared imaging and preprocessing were performed around the solar power plant. In particular, to find the sensitivity problem of the thermal infrared sensor, we tried to find the optimum condition by changing the UAV’s height, flight speed, and image overlap. Geographic information system (GIS) information collected property information such as spatial information (location, altitude, area, etc.), social information (land number, landmark etc.), and statistical information. Global positioning system (GPS) information was measured by RTK-VRS method using GCPs, and error of UAV image and field condition was minimized.
- (C)
- Field survey: In order to review and supplement the collected data, UAV imaging was carried out under various conditions such as time change to identify differences according to time, flight altitude, and climatic conditions. Image acquisition was performed at 10:00 am, 12:00 pm, 2:00 pm, and 7:00 pm according to time. The flight altitude was changed by 10 m to search for optimal image acquisition conditions. The effects of weather conditions were observed on sunny days and overcast weather.
- (D)
- Orthographic image production: The orthographic images were produced using RGB (optical sensor) and thermal infrared imaging of UAV and field infrared imaging.
- (E)
- Production of temperature distribution map: The temperature distributions of the PV panels in the study area were prepared by orthographic image.
- (F)
- Review and output of results: The temperature information and field survey results measured by UAV were compared using statistical techniques, and the results were output.
2.4. Methods
3. Results and Discussion
3.1. Optimum UAV Imaging Conditions for Monitoring Solar Panels
3.2. Terrain Measurement and Accuracy Verification Using UAV and RTK-VRS Surveying Technology
3.3. Precise Orthographic Image of Temperature
 , and the module as C
 . Figure 5 shows the optical image and thermal infrared image, which shows temperature distribution of the solar panel.
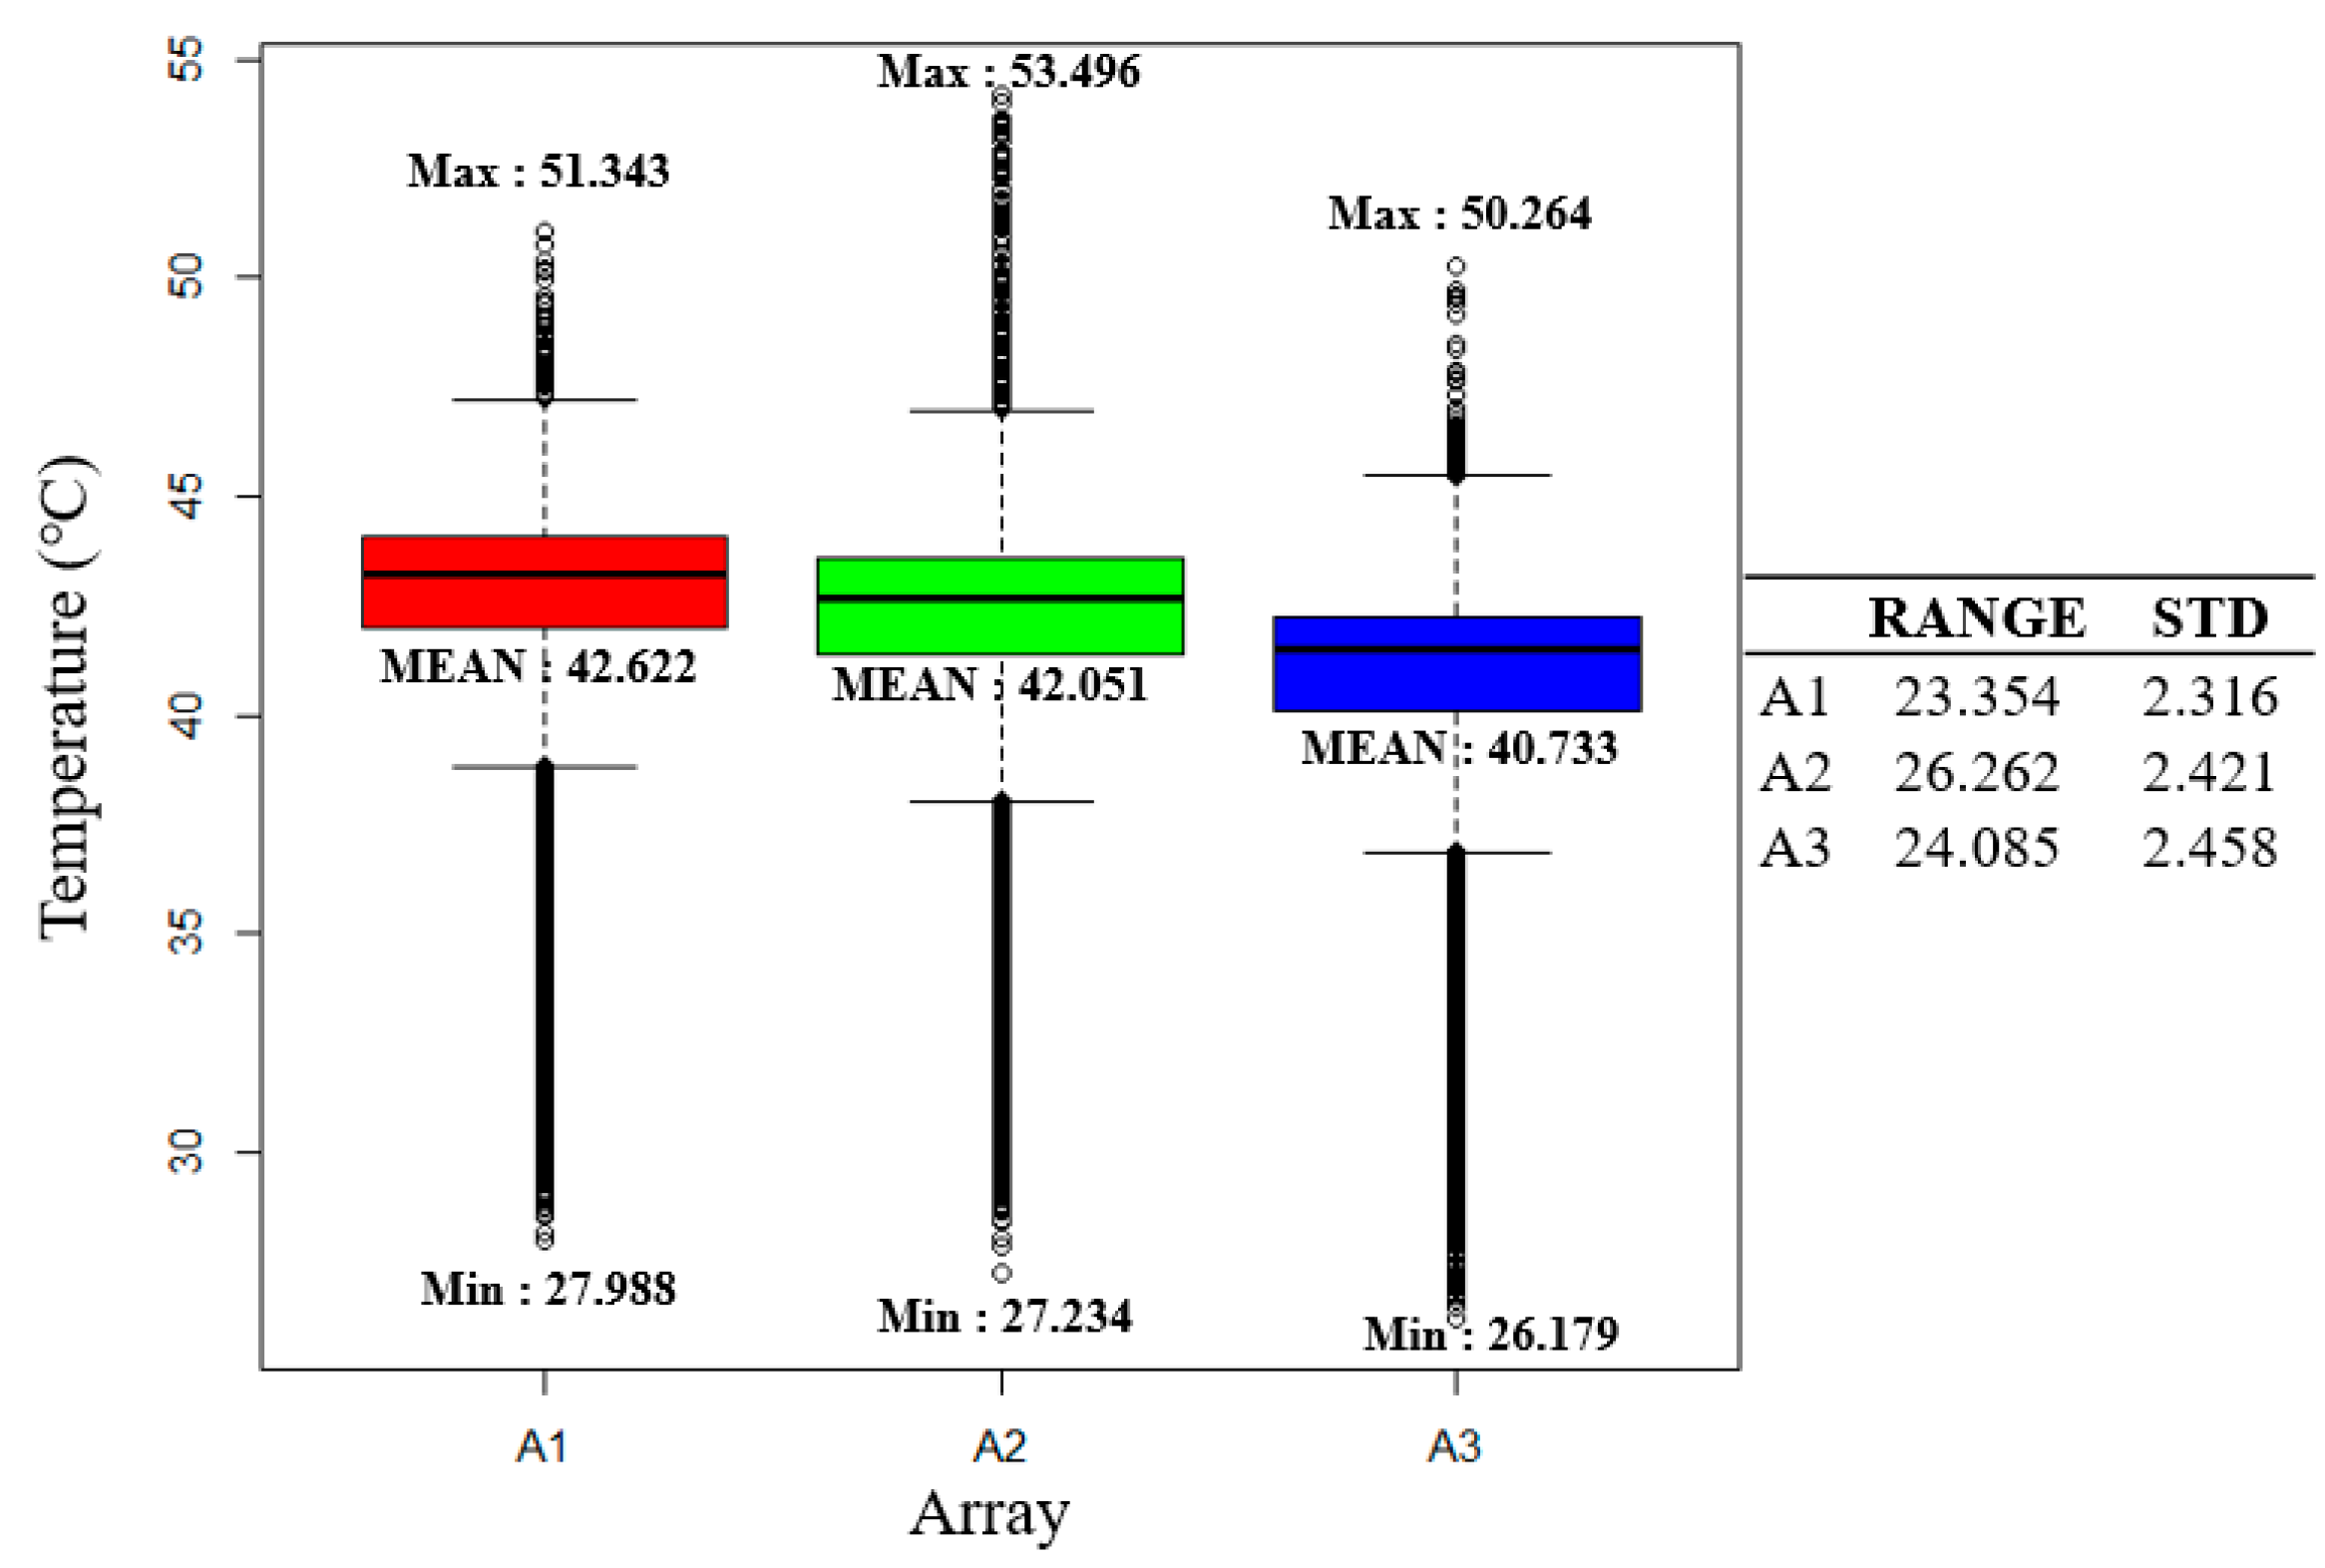
3.4. Evaluation of Fluctuation Component Characteristics of Observation Temperature
4. Conclusions
Author Contributions
Funding
Conflicts of Interest
References
- PV Info Link. Available online: https://en.pvinfolink.com/ (accessed on 19 November 2018).
- Global Market Outlook for Solar Power 2018–2022. Available online: http://www.solarpowereurope.org/global-market-outlook-2018-2022/ (accessed on 27 June 2018).
- Sawin, J.L.; Seybot, K.; Sverrisson, F. Renewables 2018 Global Status Report; Renew. Energy Policy Network 21th Century: Paris, France, 2016. [Google Scholar]
- Madeti, S.R.; Singh, S.N. Monitoring system for photovoltaic plants: A review. Renew. Sust. Energ. Rev. 2016, 67, 1180–1207. [Google Scholar] [CrossRef]
- Gastli, A.; Charabi, Y. Solar electricity prospects in Oman using GIS-based solar radiation maps. Renew. Sust. Energ. Rev. 2010, 14, 790–797. [Google Scholar] [CrossRef]
- García, M.; Marroyo, L.; Lorenzo, E.; Marcos, J.; Perez, M. Observed degradation in photovoltaic plants affected by hot-spots. Prog. Photovolt. Res. Appl. 2014, 22, 1292–1301. [Google Scholar] [CrossRef]
- Herrmann, W.; Wiesner, W.; Vaassen, W. Hot spot investigations on PV modules–new concepts for a test standard and consequences for with respect to bypass diodes. In Proceedings of the 26th IEEE Photovoltaic Specialists Conference, Anaheim, CA, USA, 29 September–3 October 1997; pp. 1129–1132. [Google Scholar]
- Molenbroek, E.; Waddington, D.W.; Emery, K.A. Hot spot susceptibility and testing of PV modules. In Proceedings of the 22nd IEEE Photovoltaic Specialists Conference, Las Vegas, NV, USA, 7–11 October 1991; pp. 547–552. [Google Scholar]
- Wohlgemuth, J.; Herrmann, W. Hot spot tests for crystalline silicon modules. In Proceedings of the 31st IEEE Photovoltaic Specialists Conference, Lake Buena Vista, FL, USA, 3–7 January 2005; pp. 1062–1065. [Google Scholar]
- Sara, G.S.; Luis, H.C.; Oscar, D.P. Technological review of the instrumentation used in aerial thermographic inspection of photovoltaic plants. Renew. Sust. Energ. Rev. 2018, 93, 566–579. [Google Scholar]
- Osterwald, C.R.; McMahon, T.J. History of accelerated and qualification testing of terrestrial photovoltaic modules: A literature review. Prog. Photovolt. Res. Appl. 2009, 17, 11–33. [Google Scholar] [CrossRef]
- Djordjevic, S.; Parlevliet, D.; Jennings, P. Detectable faults on recently installed solar modules in Western Australia. Renew. Energy 2014, 67, 215–221. [Google Scholar] [CrossRef]
- Buerhop, C.; Weißmann, R.; Scheuerpflug, H.; Auer, R.; Brabec, C.J. Quality control of PV-modules in the field using a remote-controlled drone with an infrared camera. In Proceedings of the 27th European Photovoltaic Solar Energy Conference and Exhibition, Frankfurt, Germany, 24–28 September 2012; pp. 3370–3373. [Google Scholar]
- Buerhop, C.; Scheuerpflug, H. Field inspection of PV modules using aerial, drone-mounted thermography. In Proceedings of the 29th European Photovoltaic Solar Energy Conference and Exhibition, Amsterdam, The Netherlands, 22–26 September 2014; pp. 2975–2979. [Google Scholar]
- Quarter, P.B.; Grimaccia, F.; Leva, S.; Mussetta, M.; Aghaei, M. Light Unmanned Aerial Vehicles (UAVs) for Cooperative Inspection of PV Plants. IEEE J. Photpvolt. 2014, 4, 1107–1113. [Google Scholar] [CrossRef]
- Aghaei, M.; Dolara, A.; Leva, S.; Grimaccia, F. Image resolution and defects detection in PV inspection by unmanned technologies. In Proceedings of the 2016 IEEE Power and Energy Society General Meeting (PESGM), Boston, MA, USA, 17–21 July 2016; pp. 1–5. [Google Scholar]
- Morgenthal, G.; Hallermann, N. Quality Assessment of Unmanned Aerial Vehicle (UAV) Based Visual Inspection of Structures. Adv. Struct. Eng. 2014, 17, 289–302. [Google Scholar] [CrossRef]
- Na, S.I.; Park, C.W.; So, K.H.; Ahn, H.Y.; Lee, K.D. Application method of unmanned aerial vehicle for crop monitoring in Korea. KSRS 2018, 34, 829–846. [Google Scholar]
- Park, J.K.; Das, A.; Park, J.H. Application trend of unmanned aerial vehicle (UAV) image in agricultural sector: Review and proposal. CNU. J. Agric. Sci. 2015, 42, 269–276. [Google Scholar]
- Park, J.K.; Park, J.H. Applicability evaluation of agricultural studies inspection using unmanned aerial vehicle. J. Korean Soc. Agric. Eng. 2016, 58, 29–37. [Google Scholar]
- Buerhop, C.; Schlegel, D.; Niess, M.; Vodermayer, C.; Weißmann, R.; Brabec, C.J. Reliability of IR-imaging of PV-plants under operating conditions. Sol. Energy Mater. Sol. Cells 2012, 107, 154–164. [Google Scholar] [CrossRef]
- Grimaccia, F.; Aghaei, M.; Mussetta, M.; Leva, S.; Quater, P.B. Planning for PV plant performance monitoring by means of unmanned aerial systems (UAS). Int. J. Energy Environ. Eng. 2015, 6, 47–54. [Google Scholar] [CrossRef]
- Aghaei, M.; Grimaccia, F.; Gonano, C.; Leva, S. Innovative Automated Control System for PV Fields Inspection and Remote Control. IEEE Trans. Ind. Electron. 2015, 62, 7287–7296. [Google Scholar] [CrossRef]
- Polo, J.; Bernardos, A.; Navarro, A.; Fernandez-Peruchena, C.; Ramirez, L.; Guisado, M.V.; Martinez, S. Solar resources and power potential mapping in Vietnam using satellite-derived and GIS-based information. Energy Convers. Manag. 2015, 98, 348–358. [Google Scholar] [CrossRef]
- Zefri, Y.; Eikettani, A.; Sebari, I.; Lamallam, S.A. Thermal Infrared and Visual Inspection of Photovoltaic Installations by UAV Photogrammetry—Application Case: Morocco. Drones 2018, 2, 41. [Google Scholar] [CrossRef]
- Park, J.K.; Das, A.; Park, J.H. Integrated model for predicting rice yield with climate change. Int. Agrpphys. 2018, 32, 203–215. [Google Scholar] [CrossRef]
- Park, J.K.; Das, A.; Park, J.H. A new approach to estimate the spatial distribution of solar radiation using topographic factor and sunshine duration in South Korea. Energy Convers. Manag. 2015, 101, 30–39. [Google Scholar] [CrossRef]
- Park, J.K.; Park, J.H. Crops classification using imagery of unmanned aerial vehicle (UAV). J. Korean Soc. Agric. Eng. 2015, 57, 91–97. [Google Scholar]
- Jon, C.L.; Ronald, G.D. Surveillance and Reconnaissance Imaging Systems: Modeling and Performance Prediction; Artech House: Boston, MS, USA, 2001; pp. 30–31. ISBN 978-1-58053-132-0. [Google Scholar]
- Shen, L.; Guo, J.; Wang, L. A Self-Organizing Spatial Clustering Approach to Support Large-Scale Network RTK Systems. Sensors 2018, 18, 1855. [Google Scholar] [CrossRef] [PubMed]


| Item | Specifications |
|---|---|
| Weight | 3290 g |
| Diagonal distance (propeller excluded) | 605 mm |
| Max. speed | 94 km/h |
| Max. flight time | 25 min |
| Battery type | LiPo 6S/4280 mAh |
| Item | Specifications | |
|---|---|---|
| Vue Pro R | Zenmuse X5s | |
| Resolution | 640 × 512 | 5280 × 3956 |
| Size (mm) | 63 × 45 × 45 | 140 × 45 × 132 |
| Temperature range (°C) | −25 to 135 | - |
| Spectral range | 7.5 to 13.5 µm | Red, Green, Blue |
| Field of view (FOV) | 32° × 26° | 72° |
| Output Ttype | Radiometric JPEG, TIFF | DNG, JPEG, DNG+JPEG |
| Item | TIR | RGB |
|---|---|---|
| Photographing altitude (m) | 30 | |
| Photographing interval (s) | 1 | - |
| Covered area (km2; ha) | 0.005; 0.5287 | 0.007; 0.7154 |
| Number of photos | 373 | 114 |
| Resolution (cm) | 2.59 | 0.65 |
| Coordinate system | WGS 84/UTM zone 52N (EGM 96 Geoid); same coordinate | |
| Image size (MB) | 86.1 | 318 |
| X | Y | Z | Error X (m) | Error Y (m) | Error Z (m) | |
|---|---|---|---|---|---|---|
| GCP.1 | 357,342.278513 | 4,052,358.77720 | 52.4394019224 | −0.003 | 0.004 | 0.001 |
| GCP.2 | 357,376.697018 | 4,052,332.18593 | 53.7239821130 | 0.002 | −0.003 | −0.010 |
| GCP.3 | 357,377.335893 | 4,052,308.40536 | 53.7136950012 | −0.006 | −0.008 | 0.015 |
| GCP.4 | 357,364.698915 | 4,052,292.90675 | 53.9219348016 | 0.007 | 0.007 | −0.005 |
| Mean | - | - | - | 0.000067 | −0.000154 | 0.000378 |
| RMSE | - | - | - | 0.004808 | 0.006013 | 0.009287 |
© 2019 by the authors. Licensee MDPI, Basel, Switzerland. This article is an open access article distributed under the terms and conditions of the Creative Commons Attribution (CC BY) license (http://creativecommons.org/licenses/by/4.0/).
Share and Cite
Lee, D.H.; Park, J.H. Developing Inspection Methodology of Solar Energy Plants by Thermal Infrared Sensor on Board Unmanned Aerial Vehicles. Energies 2019, 12, 2928. https://doi.org/10.3390/en12152928
Lee DH, Park JH. Developing Inspection Methodology of Solar Energy Plants by Thermal Infrared Sensor on Board Unmanned Aerial Vehicles. Energies. 2019; 12(15):2928. https://doi.org/10.3390/en12152928
Chicago/Turabian StyleLee, Dong Ho, and Jong Hwa Park. 2019. "Developing Inspection Methodology of Solar Energy Plants by Thermal Infrared Sensor on Board Unmanned Aerial Vehicles" Energies 12, no. 15: 2928. https://doi.org/10.3390/en12152928
APA StyleLee, D. H., & Park, J. H. (2019). Developing Inspection Methodology of Solar Energy Plants by Thermal Infrared Sensor on Board Unmanned Aerial Vehicles. Energies, 12(15), 2928. https://doi.org/10.3390/en12152928