1. Introduction
The use of solar photovoltaic (PV) systems for electricity production is expanding with over 390 GWp already installed globally [
1]. Rapid expansion of PV technology is occurring in sunny areas in countries such as those in the Middle East, Northern Africa, Australia, India, China, Latin America, and the United States of America [
1]. Due to the wide availability of solar resource and advancements in conversion technologies, solar energy is fast emerging as a cost-effective source for power generation, with grid parity being achieved in many solar resource-rich countries [
1,
2].
In solar photovoltaics (PV), the efficiency of the overall system has increased through many improvements in cell efficiency, balance of system, and overall management and control [
3]. However, one of the issues outside the scope of such improvements is the effect of environmental conditions, such as the deposition of foreign particles on module surfaces of a solar PV array [
4]. This could be sand, salt, bird droppings, snow, etc. Such deposits reduce the light transmission through the glass cover of the modules impacting photon absorption by the solar cells [
5,
6]. As deposition increases, it results in progressive conversion efficiency losses and hence reduced energy yields from the modules and the overall array [
7]. For example, it was shown that in one month the output from an outdoor PV system in Saudi Arabian conditions reduced by over 5% due to dust accumulation [
8]. A similar experiment in Abu Dhabi showed a reduction of PV output of around 13% for a similar period [
9]. In a review of over eighty recent publications, it was found that the loss in power generation due to dust accumulation on solar PV systems can exceed 40% [
10]. Such reduction, which is often quantified by the soiling rate, is found to be strongly affected by four factors: (1) geographic location; (2) physical properties of dust particles, such as size; (3) PV module surface roughness; and (4) weather conditions [
11]. Other studies showed that there is a clear difference of particle sizes from sand collected from Saudi Arabia and Iraq, which leads to a different level of soiling rate [
12]. Similar observations were made in a study comparing sand samples showing significant difference of particle size from Doha and Namibia [
5].
Furthermore, weather conditions such as rainfall frequency, humidity, and wind velocity have been studied to reveal their influence on soiling rate. For example, it was found that long-lasting rains were capable of cleaning dust or dirt off solar panels, but their effectiveness varies heavily among different seasons with observed system performance loss exceeding 20% during dry summer season [
13]. Additionally, it was observed that if a sandstorm and rainfall happen simultaneously, then the soiling rate is even greater as the accumulated sand adhered strongly to the panel surface, making the subsequent cleaning more difficult [
14]. Further studies on soiling rate in Saudi Arabia, where the deposition of dust varies significantly between seasons from 5 g/m²/month (July) to 28 g/m²/month (August and October) [
15], showed significant dust accumulation due to moisture and humidity, particularly from early-morning dews [
12,
16]. Other studies on the influence of wind velocity on dust accumulation found it to be insignificant [
17]. Results of monitoring the characteristics of dust in Jeddah, Saudi Arabia, showed that its composition varied significantly as a function of changes in weather conditions [
18]. The concentration of crustal elements (Si, Ca, Na, Al, Fe, K, and Mg) increased from 45% to 68% after dust storm events, indicating the origin of the dust deposited by the storms is largely from non-anthropogenic sources, whereas the reverse is true under normal conditions [
18].
Approaches already employed to prevent or remove such deposition vary in terms of technologies and effectiveness. The work in [
19] summarised existing cleaning methods into three categories: Mechanical cleaning, passive approaches using coating materials, and electrodynamic screen (EDS) cleaning. Mechanical cleaning systems commonly comprise either brushes or silicone blades, with additional usage of water to improve the cleaning efficiency [
4]. Mechanical cleaning systems in real applications will need to be individually adjusted to achieve optimal performance, as the proper level of force and pressure vary among different locations [
19]. However, such systems consume a considerable amount of water, which is particularly challenging for desert regions facing water scarcity [
20]. In addition, the brush or wiper systems are likely to cause damage to PV panel surfaces, hence performance losses, requiring regular maintenance and high upfront investment [
6].
Currently, coating for solar systems uses either super-hydrophobic or hydrophilic material [
21,
22] with new transparent super-hydrophobic surfaces being designed for better durability [
23]. However, although the coating materials are effective as applied, their durability and lifetime still require future validation [
6,
20]. Similarly, the application of electrodynamic screens has also shown high efficiency in terms of cleaning, but the screens degrade after a period of use and were found to be less effective when the modules were wet [
6,
24].
In summary, dust deposits can cause significant performance reductions in certain locations and while a number of approaches to cleaning and prevention have been subjected to previous research, there remains a gap for solutions which are both low-maintenance and robust while minimising use of water and energy. This research addresses such issues and delivers a study to understand how modules in an array can be cleaned through sequences of interventions encompassing water jets, air jets, mechanical vibrations, and combinations of these. These interventions are set up on a pilot-scale testbed in Jeddah, Saudi Arabia, that can be remotely operated from anywhere in the world. The aim of the testing is to provide an optimised approach for cleaning solar PV modules that can be scaled up for use in large-scale PV arrays. The following sections provide an indication of the system design philosophy, detailed descriptions of the approaches undertaken, and results achieved.
2. Methodology
The pilot project is situated on the campus of King Abdulaziz University (KAU) in Jeddah, Kingdom of Saudi Arabia (KSA), where, as mentioned above, significant dust deposition and storms can occur, and the background level of soiling is high. The cleaning design philosophy presented here addresses such impacts through a combination of weather and performance event monitoring which will activate the automated cleaning processes. Specifically, the approach encompasses: (1) monitoring the amount of dust deposition on solar systems and the degradation in PV performance, (2) controlling the system in response to commands to operate various cleaning elements either separately or in combination, and (3) investigating the effectiveness of each cleaning intervention.
2.1. Overall System Design Philosophy
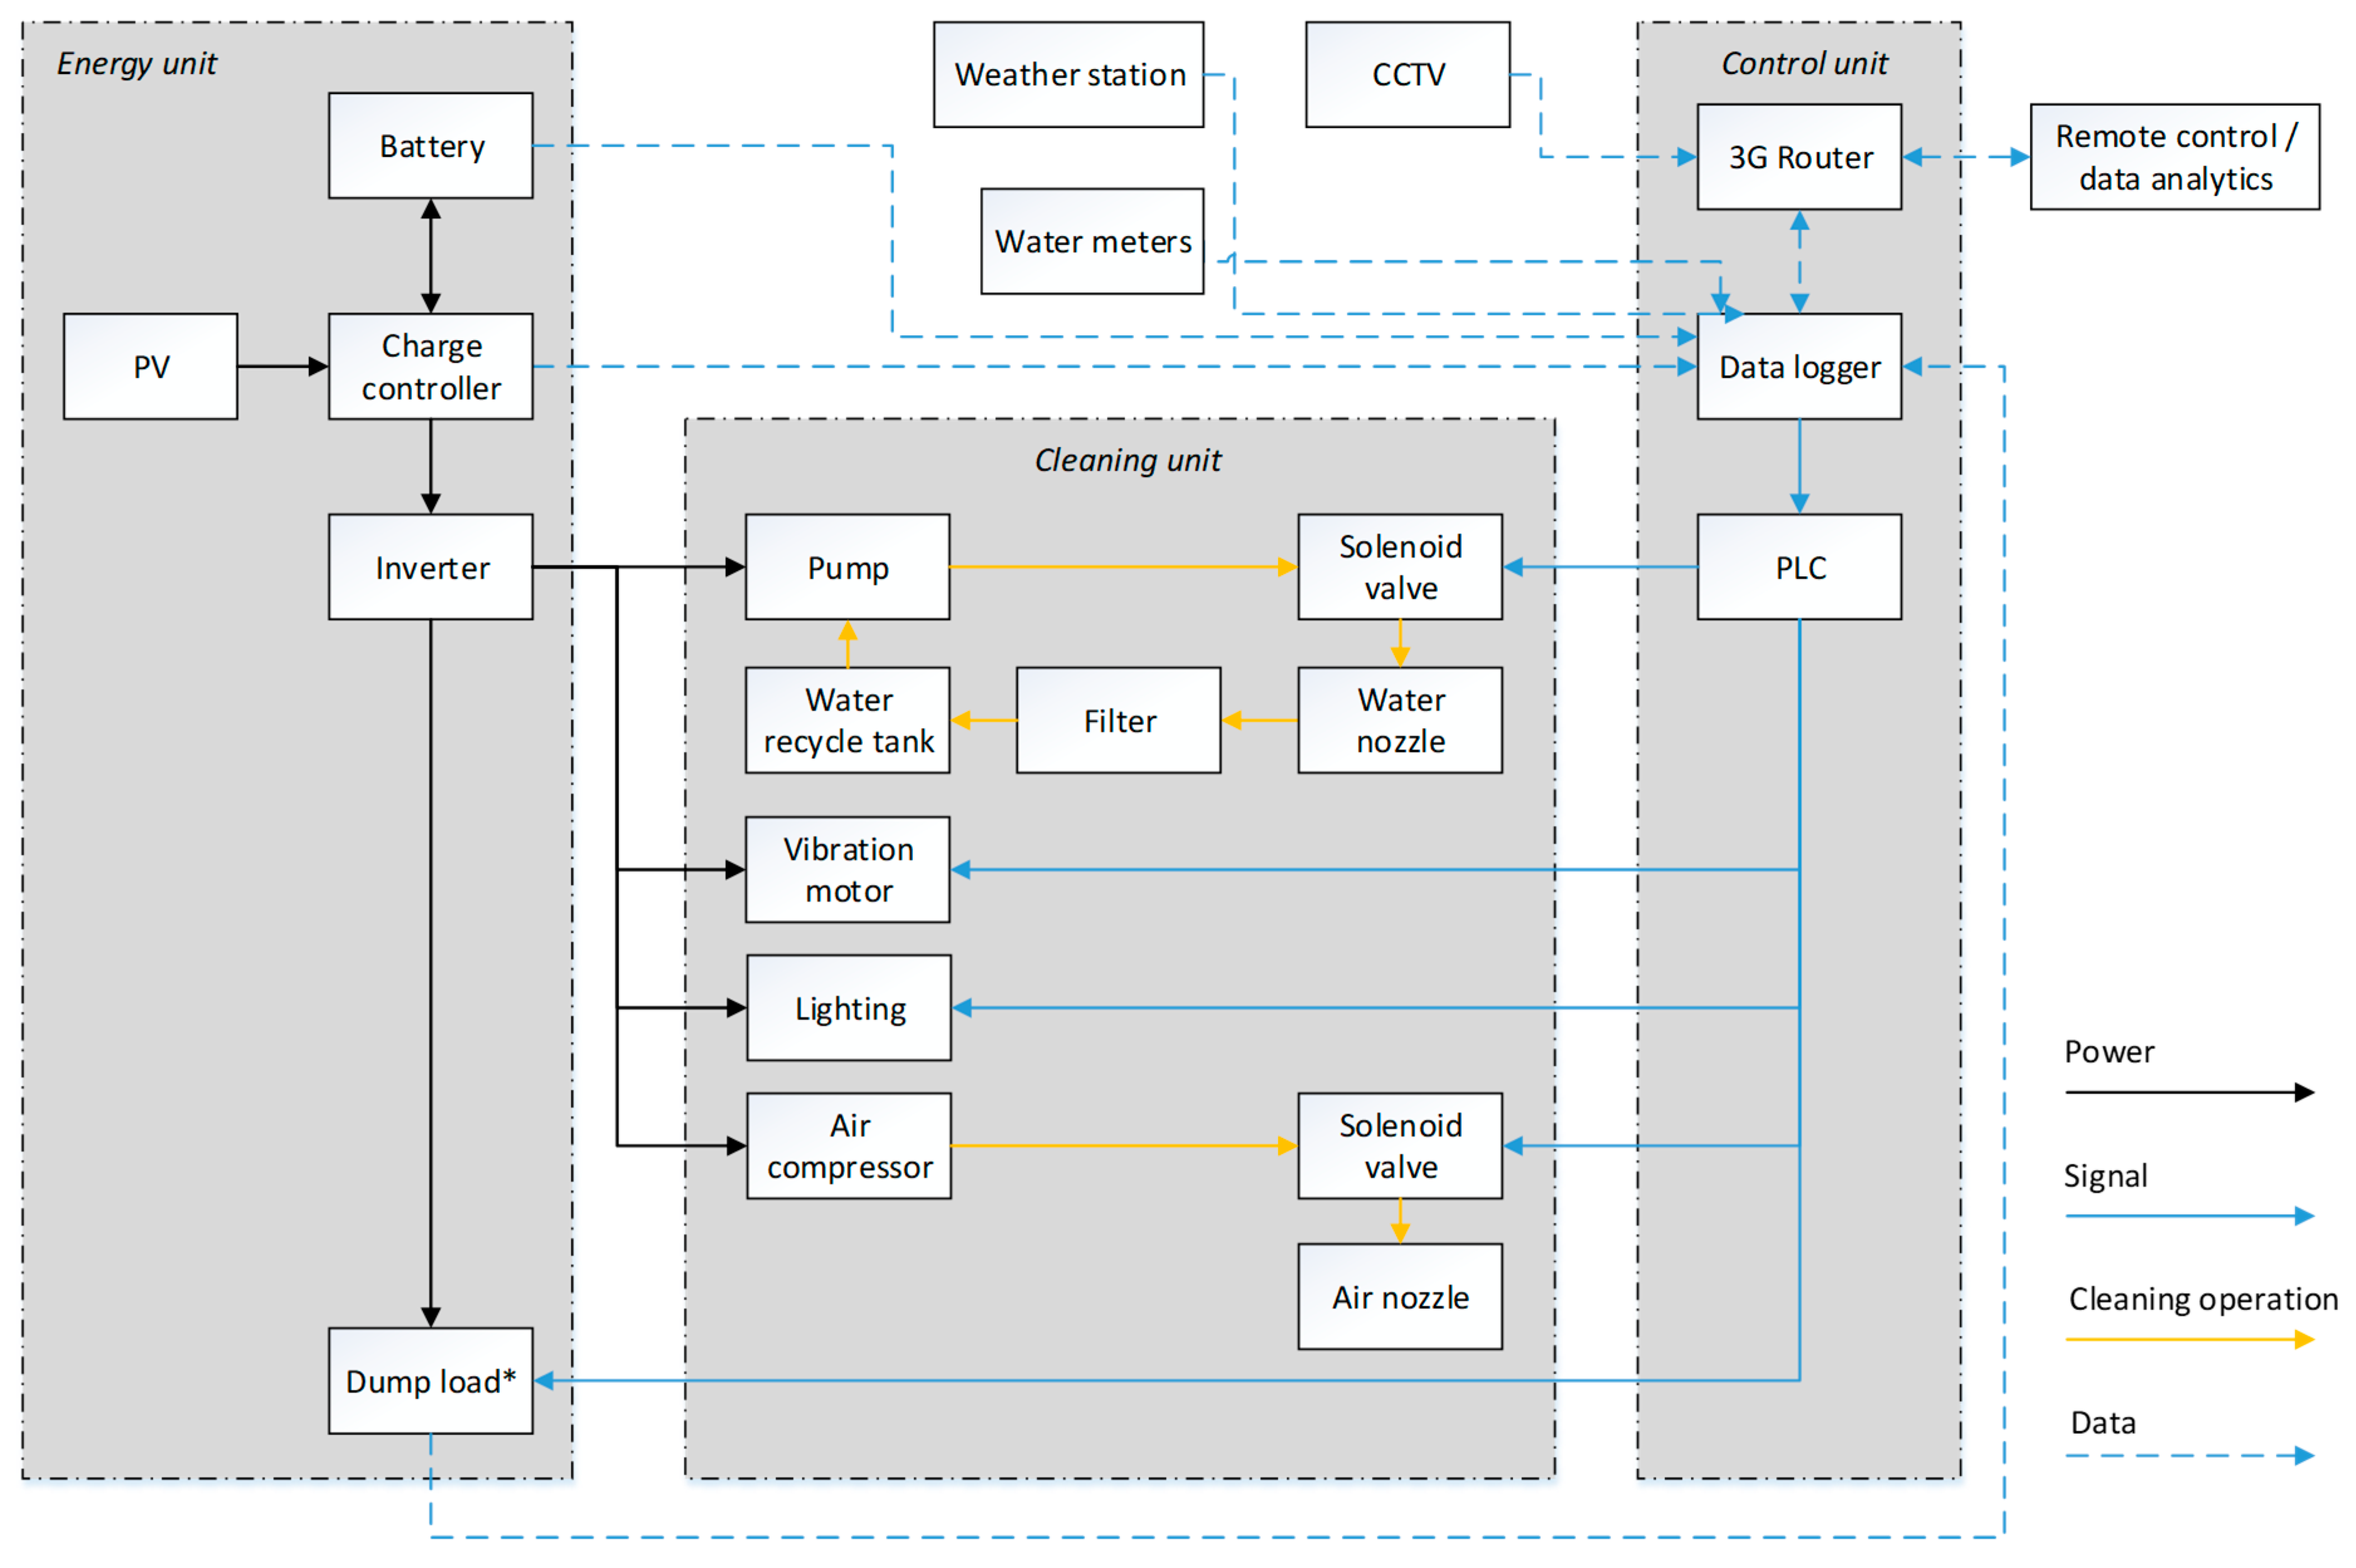
As briefly indicated above, the systems developed and implemented were designed to serve as a test bed where different cleaning modes can be tested and their performance determined and compared. The latter is accomplished through observations of improvement, or otherwise of the energy yield as outputs from the cleaned solar PV arrays. In addition to the infrastructure (carport) on which the deployed pilot plant was built, there are three major components incorporated to support cleaning and monitoring.
Figure 1 depicts components, consisting of: (1) solar PV array, balance of systems and battery storage; (2) cleaning systems; and (3) remote control and data collection unit. Full descriptions of these systems are given in
Section 2.2,
Section 2.3,
Section 2.4,
Section 2.5,
Section 2.6,
Section 2.7,
Section 2.8 and
Section 2.9. The whole plant was designed to be remotely managed, monitored, and controlled. This includes the scheduling of different cleaning modes and any combination of these, as well as determining the effect of such tests on array performance. Furthermore, the system can also be operated fully automatically, whilst detailed data are continuously collected and stored in an online cloud storage platform for later analysis (
Section 2.8).
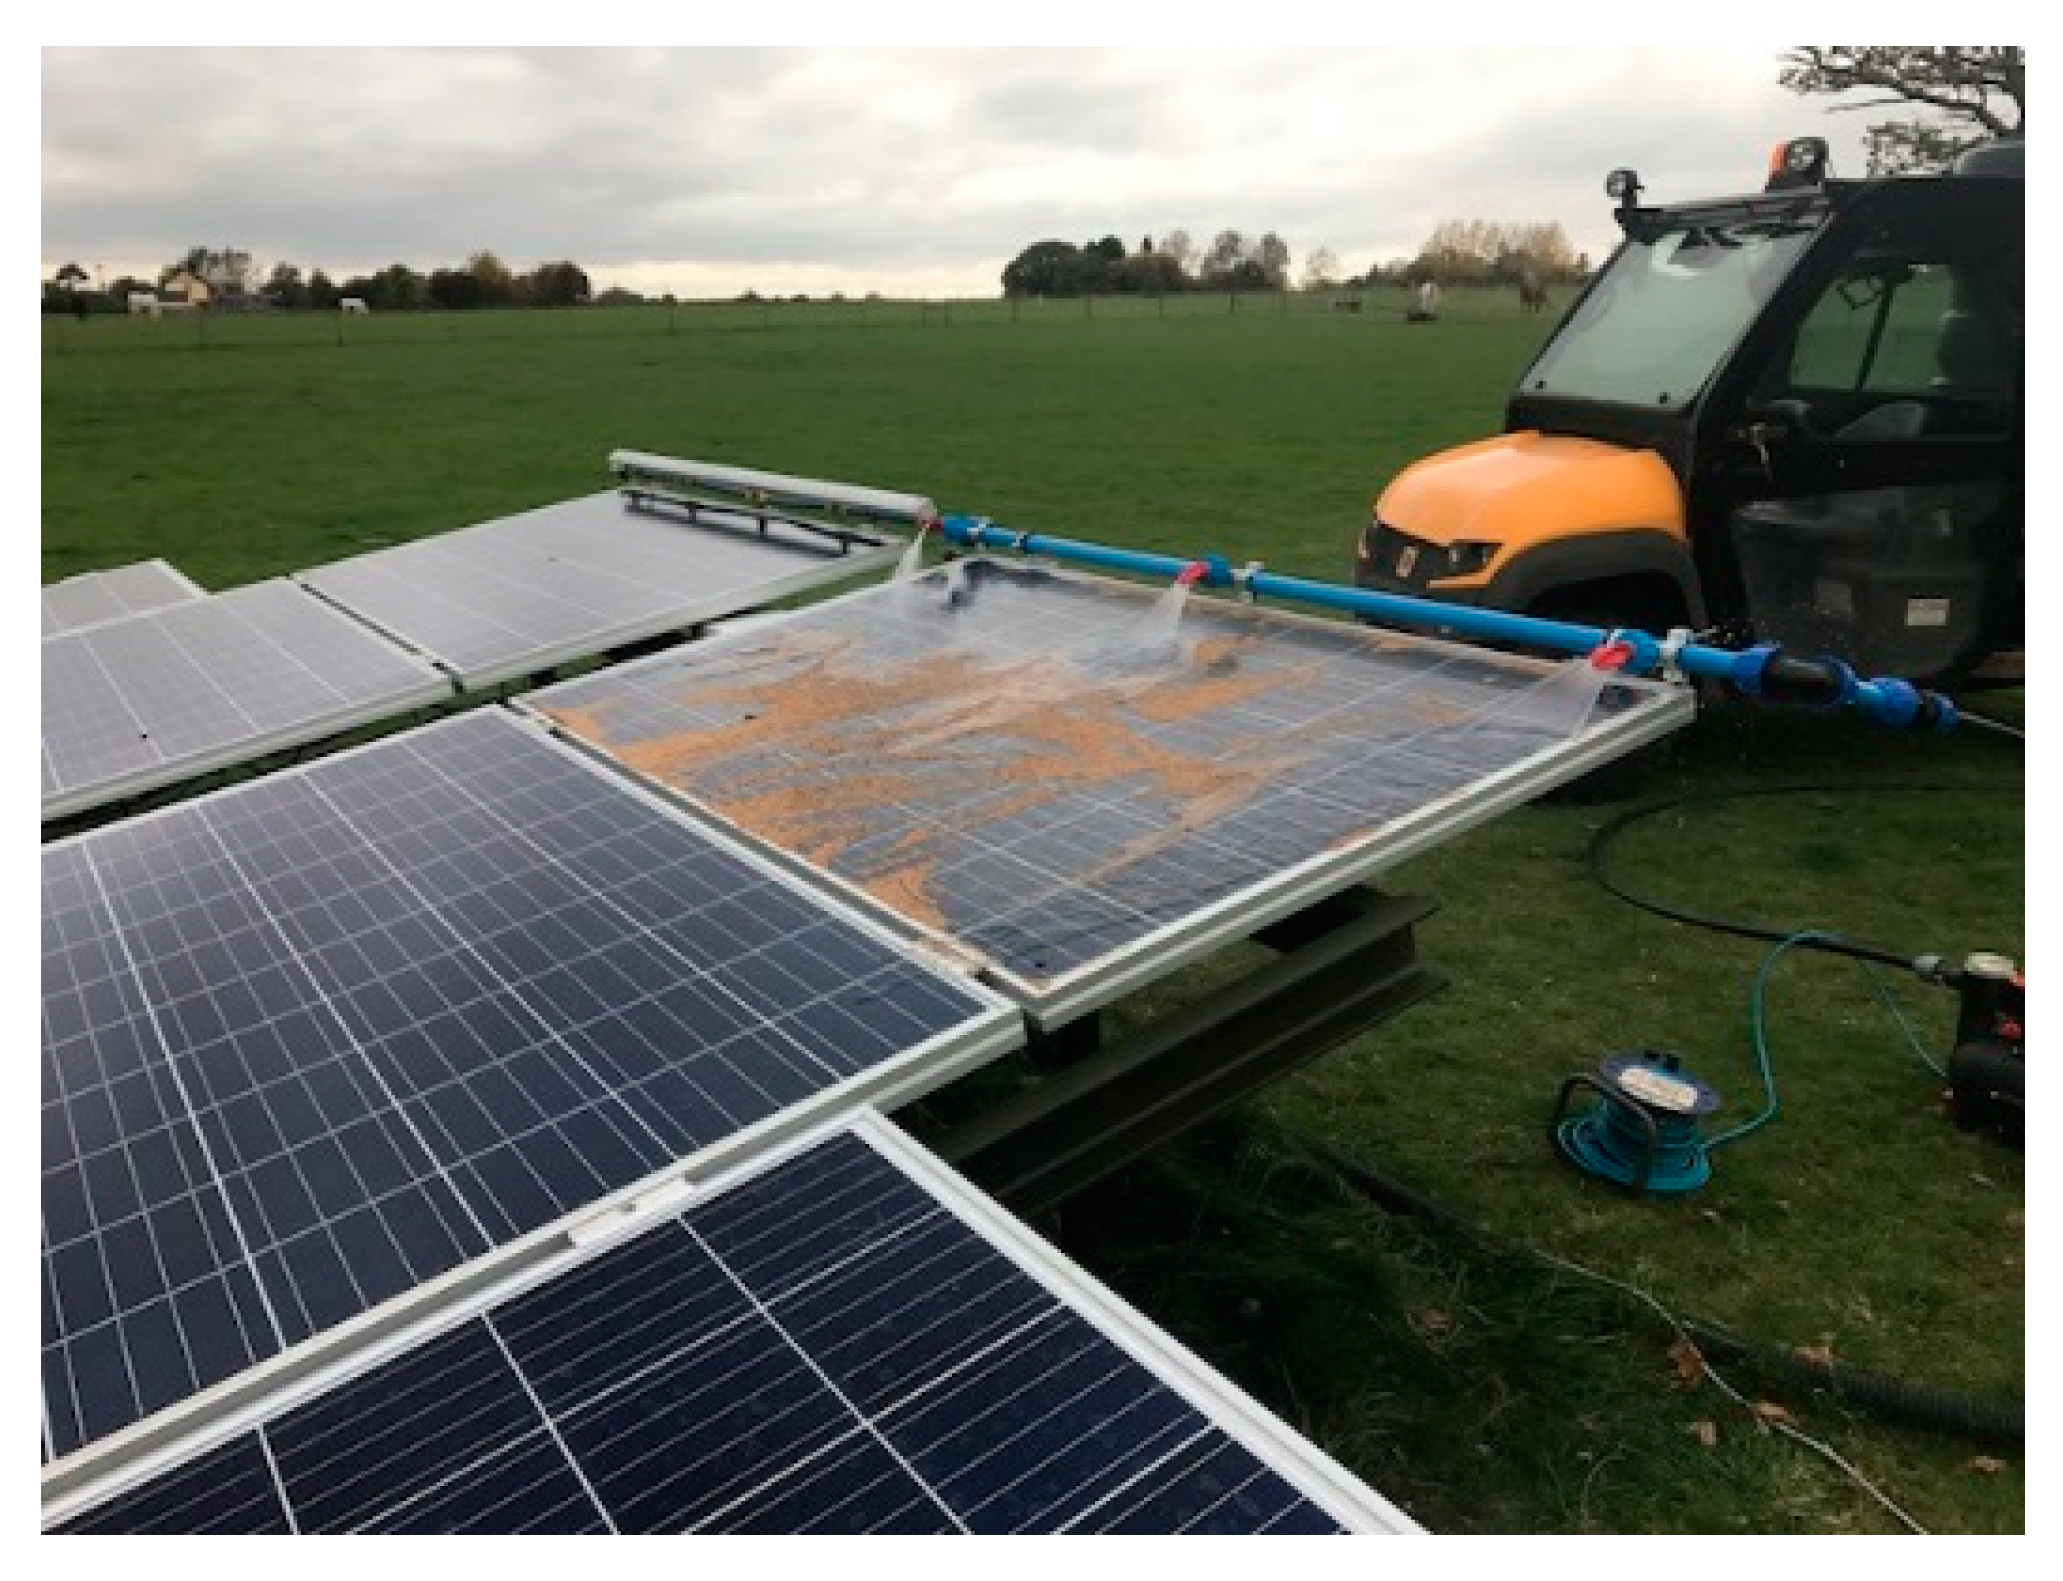
The design philosophy was informed by a series of laboratory investigations in which sand samples from the KAU site, Jeddah, west of Saudi Arabia, were used in a laboratory-scale rig containing solar PV modules to simulate the dust soiling and initial cleaning approach. The tests focused on the dislodgement of sand through various interventions, such as vibration, water jets and air jets, and a combination of these (
Figure 2). The preliminary results from these tests showed that cleaning methods using vibration, water and air jets were able to reduce sand deposition on PV modules. These gave confidence in the approach and allowed progression to design the larger pilot-scale testbed for experimentation at the site in Jeddah.
An outdoor car park in the KAU campus was chosen to deploy the developed power plant and the cleaning system and conduct the in situ tests. The car parks areas in KAU represent around 50% of the campus footprint, having considerable potential for contributing to the power demand of the university through deploying PV systems at scale on carports [
25].
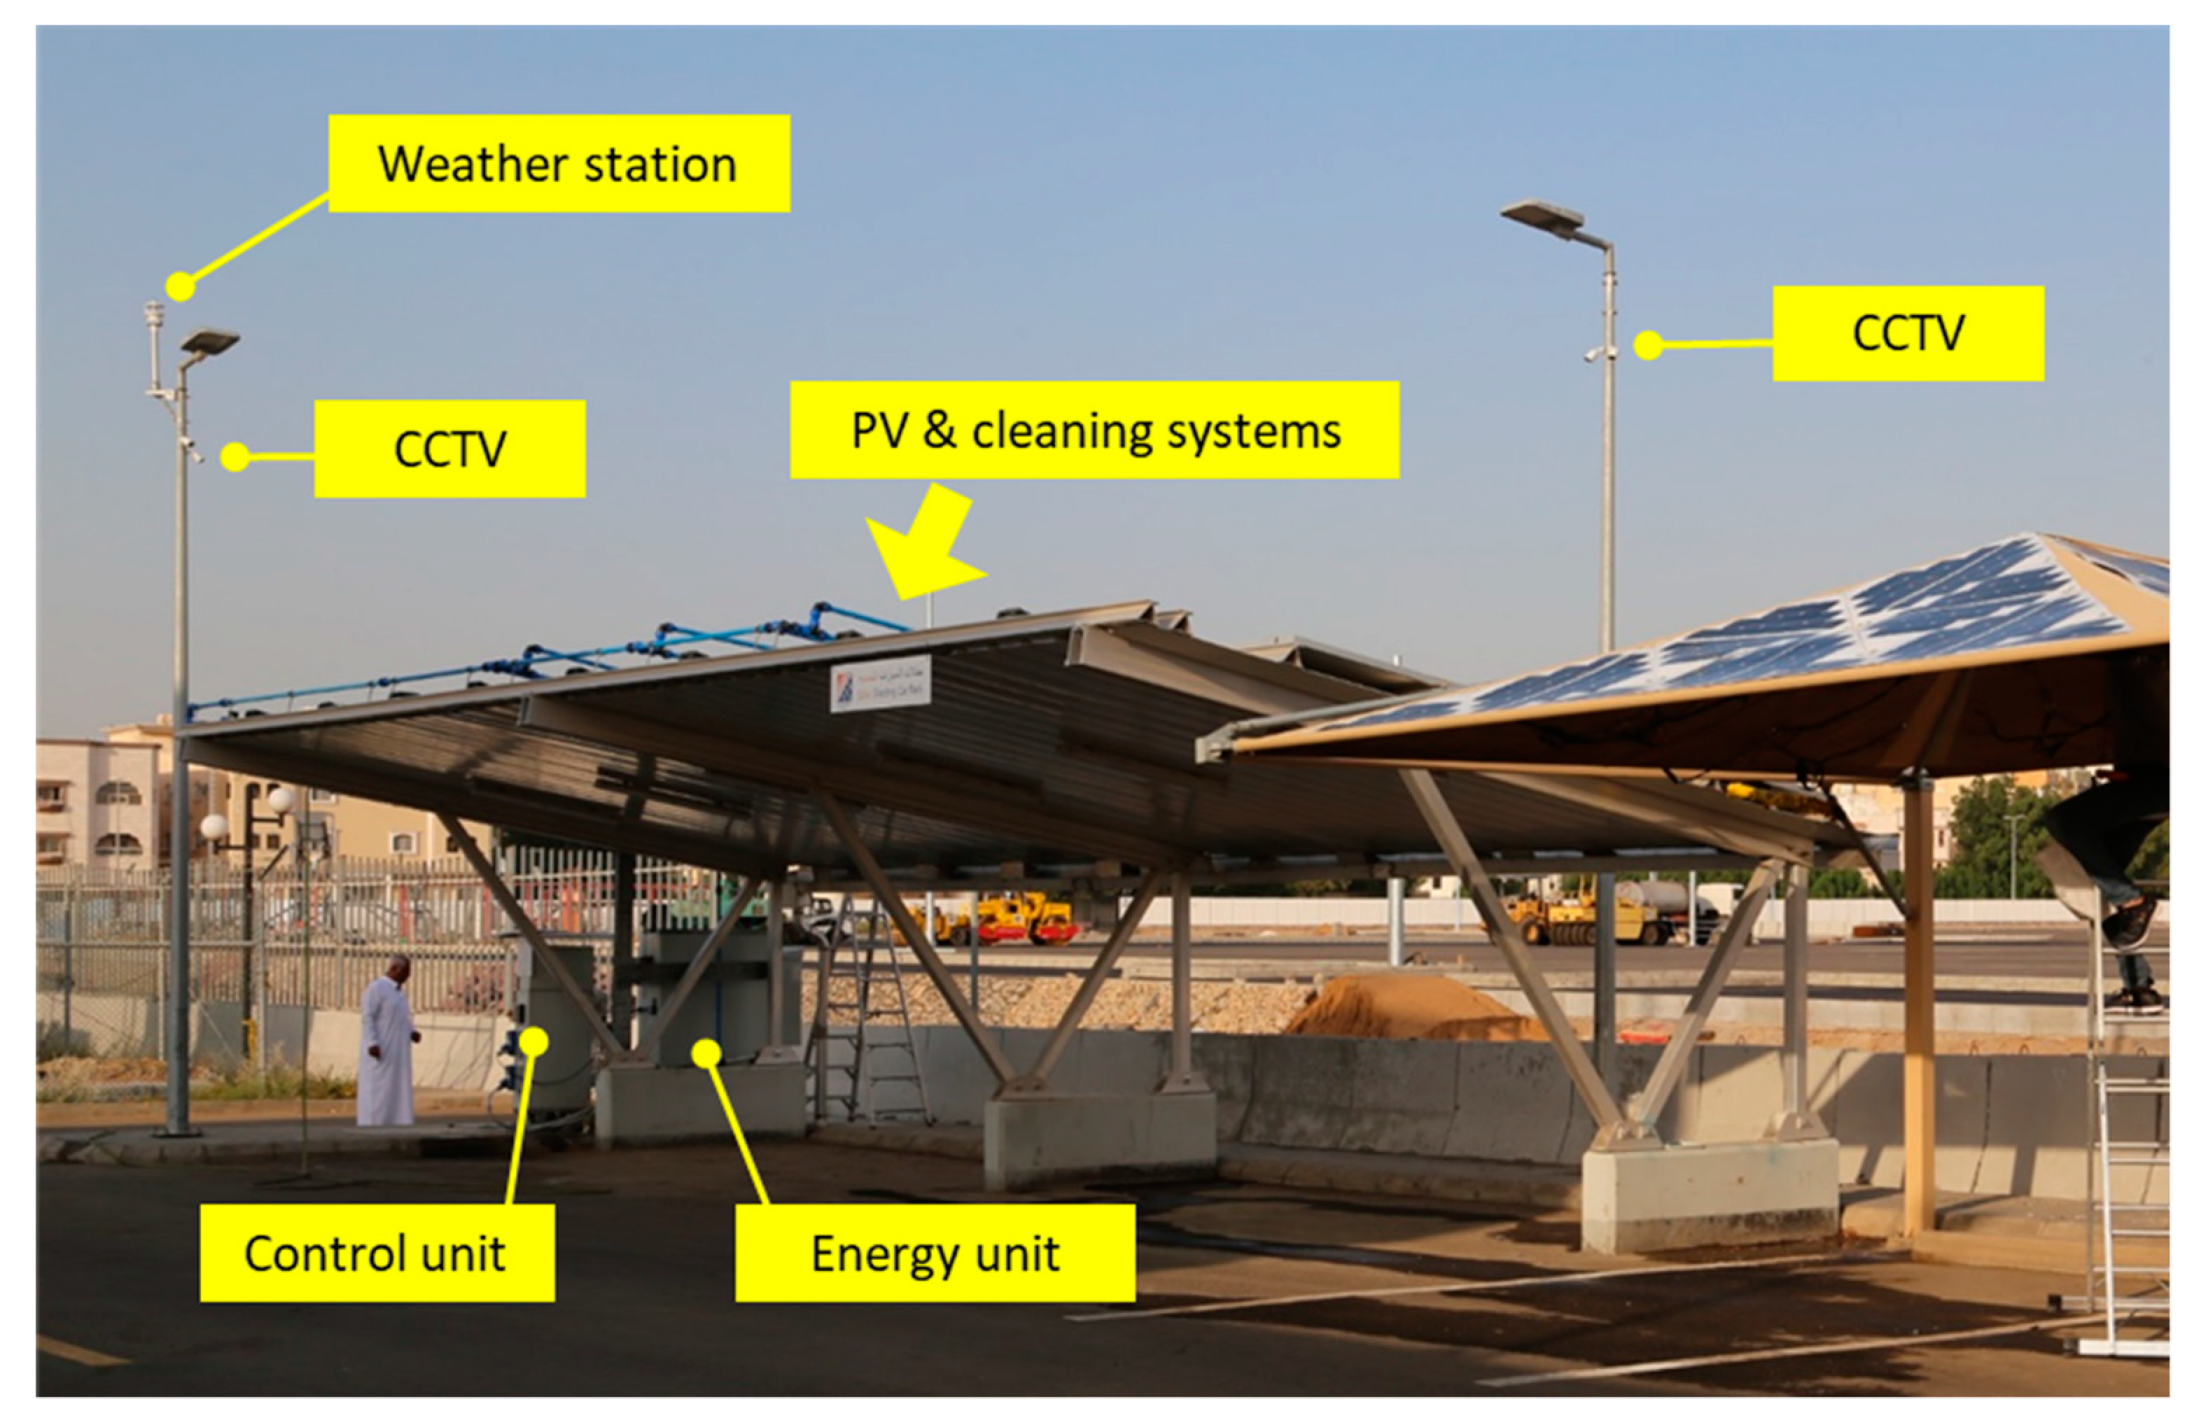
Some of the components of the plant were pre-assembled into two weatherproof enclosures and pre-tested in the UK to allow rapid installation on site. A weather station and two pairs of CCTV cameras were added to the system to provide weather condition monitoring, visual inspection and monitoring of the environmental conditions and dust build-up on the modules.
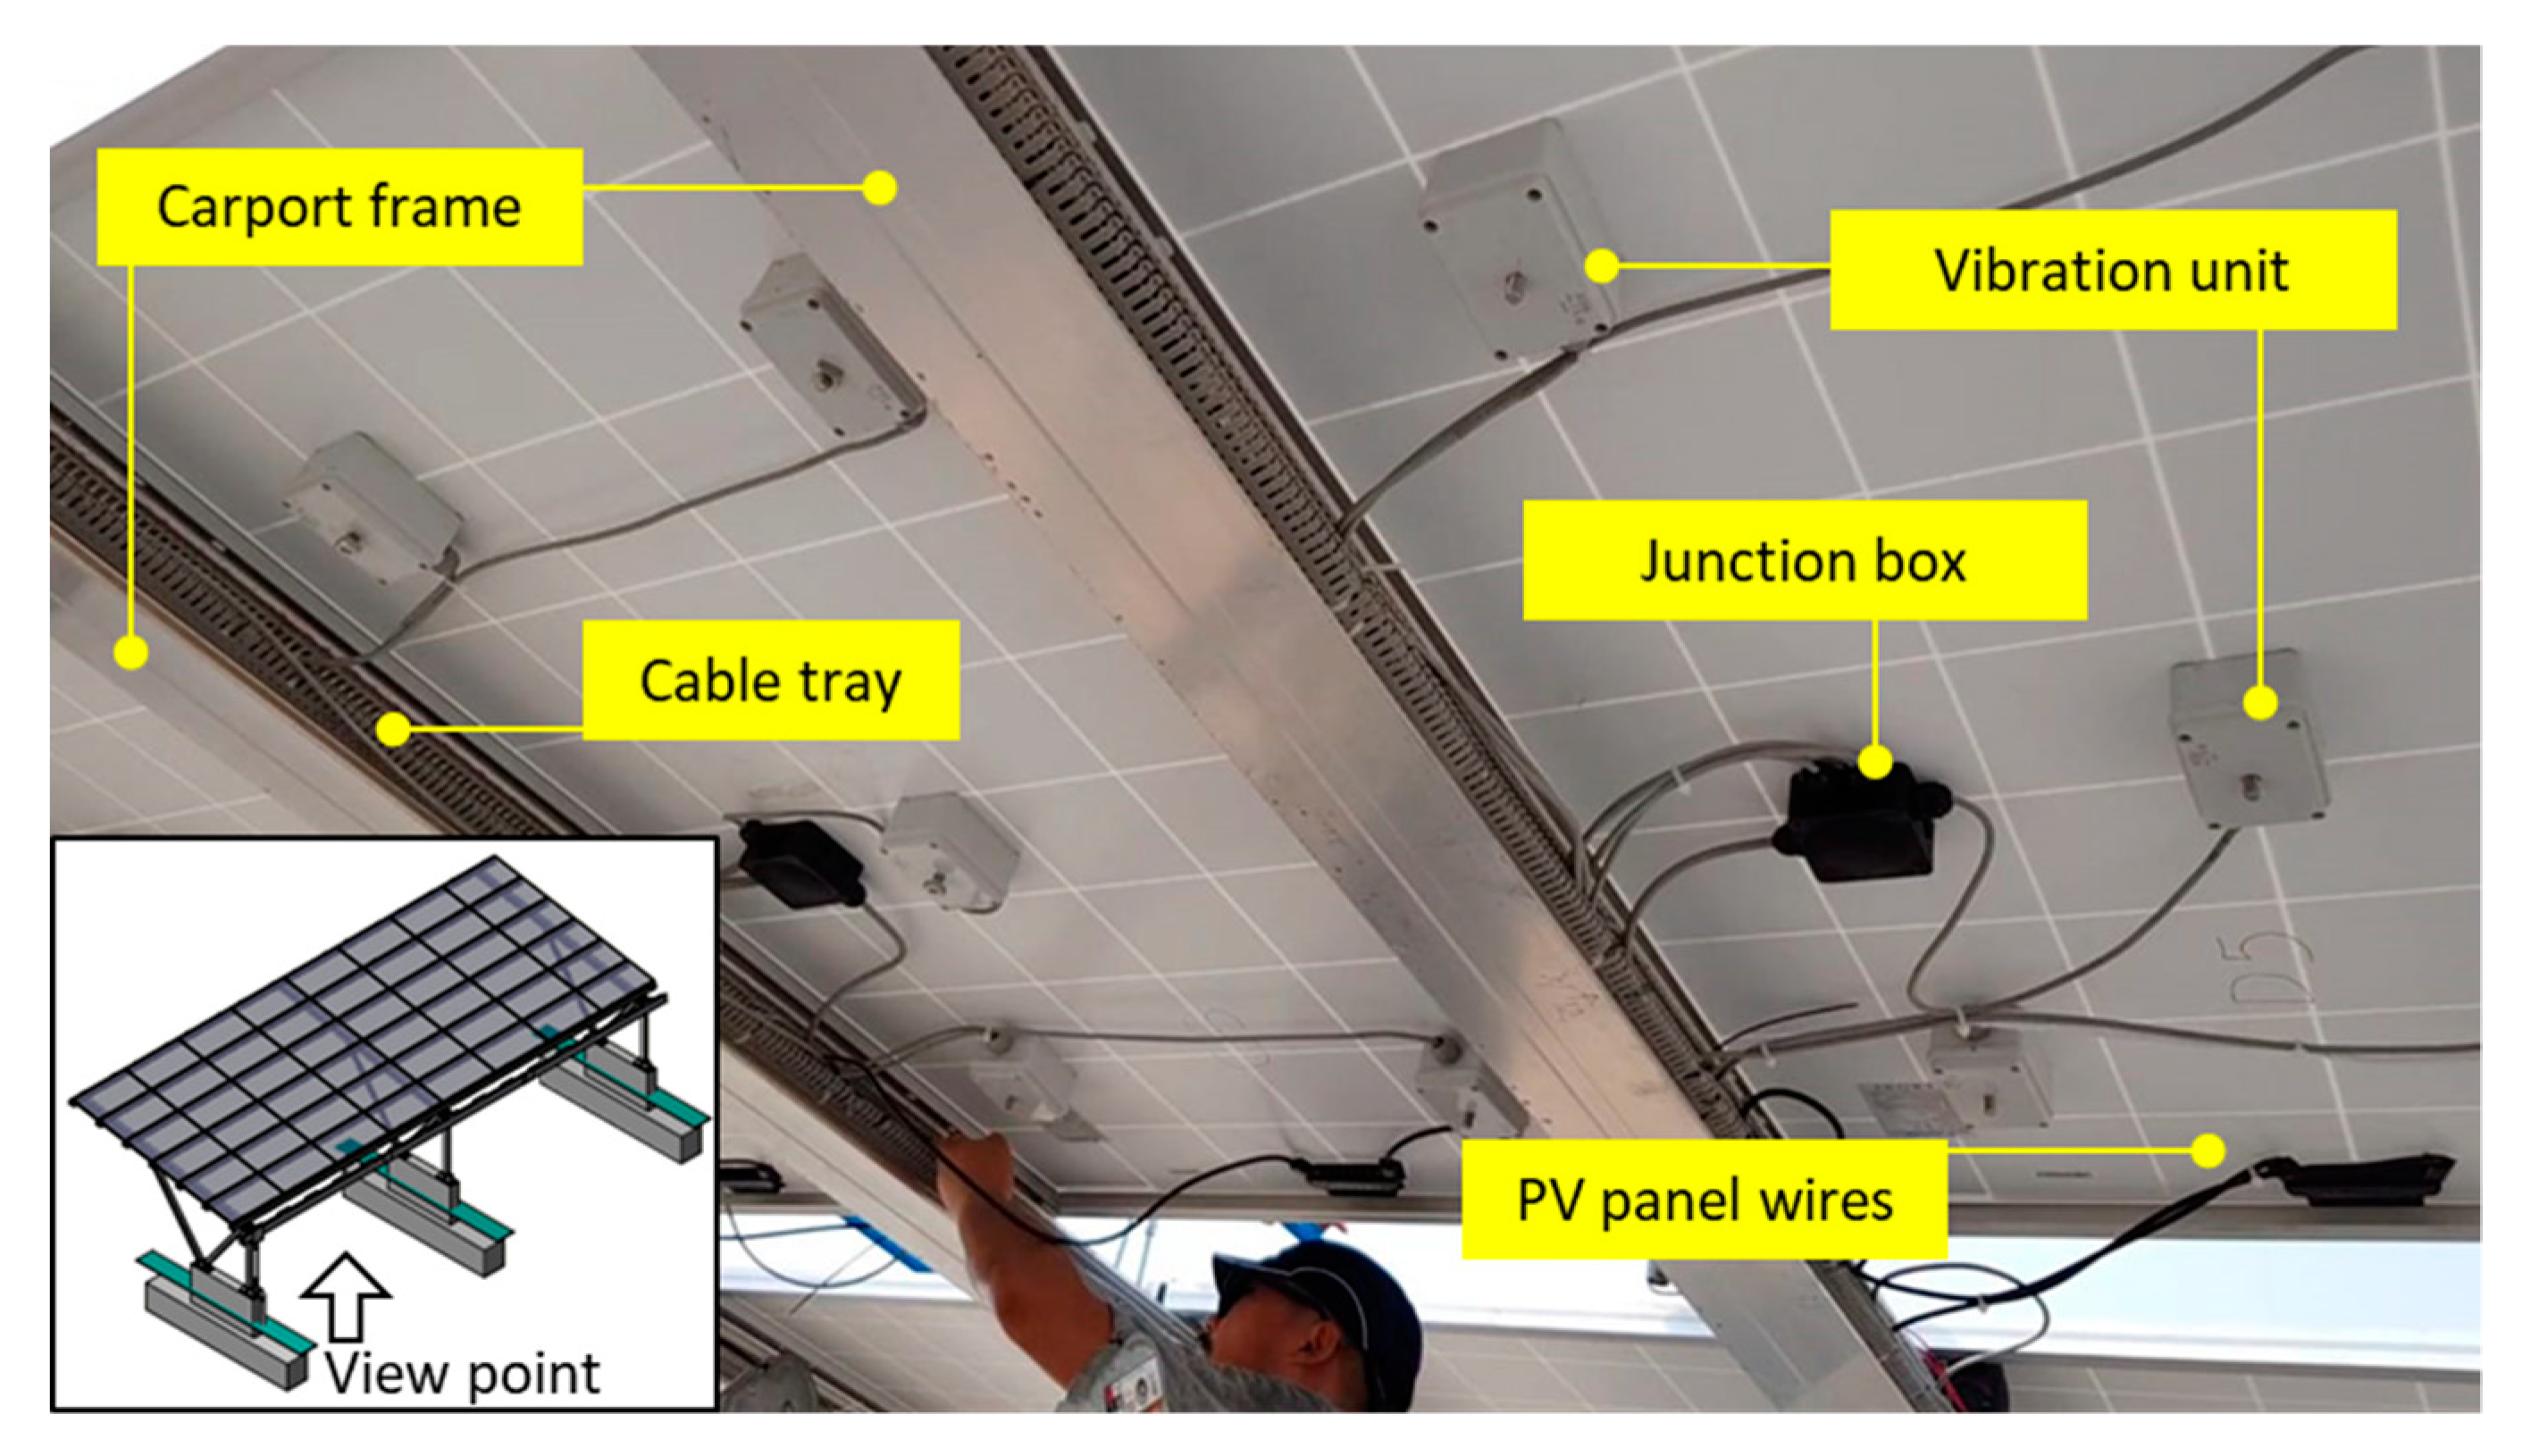
Figure 3 shows the outline of the pilot plant testbed and position of the various components deployed on a working (functioning) carport.
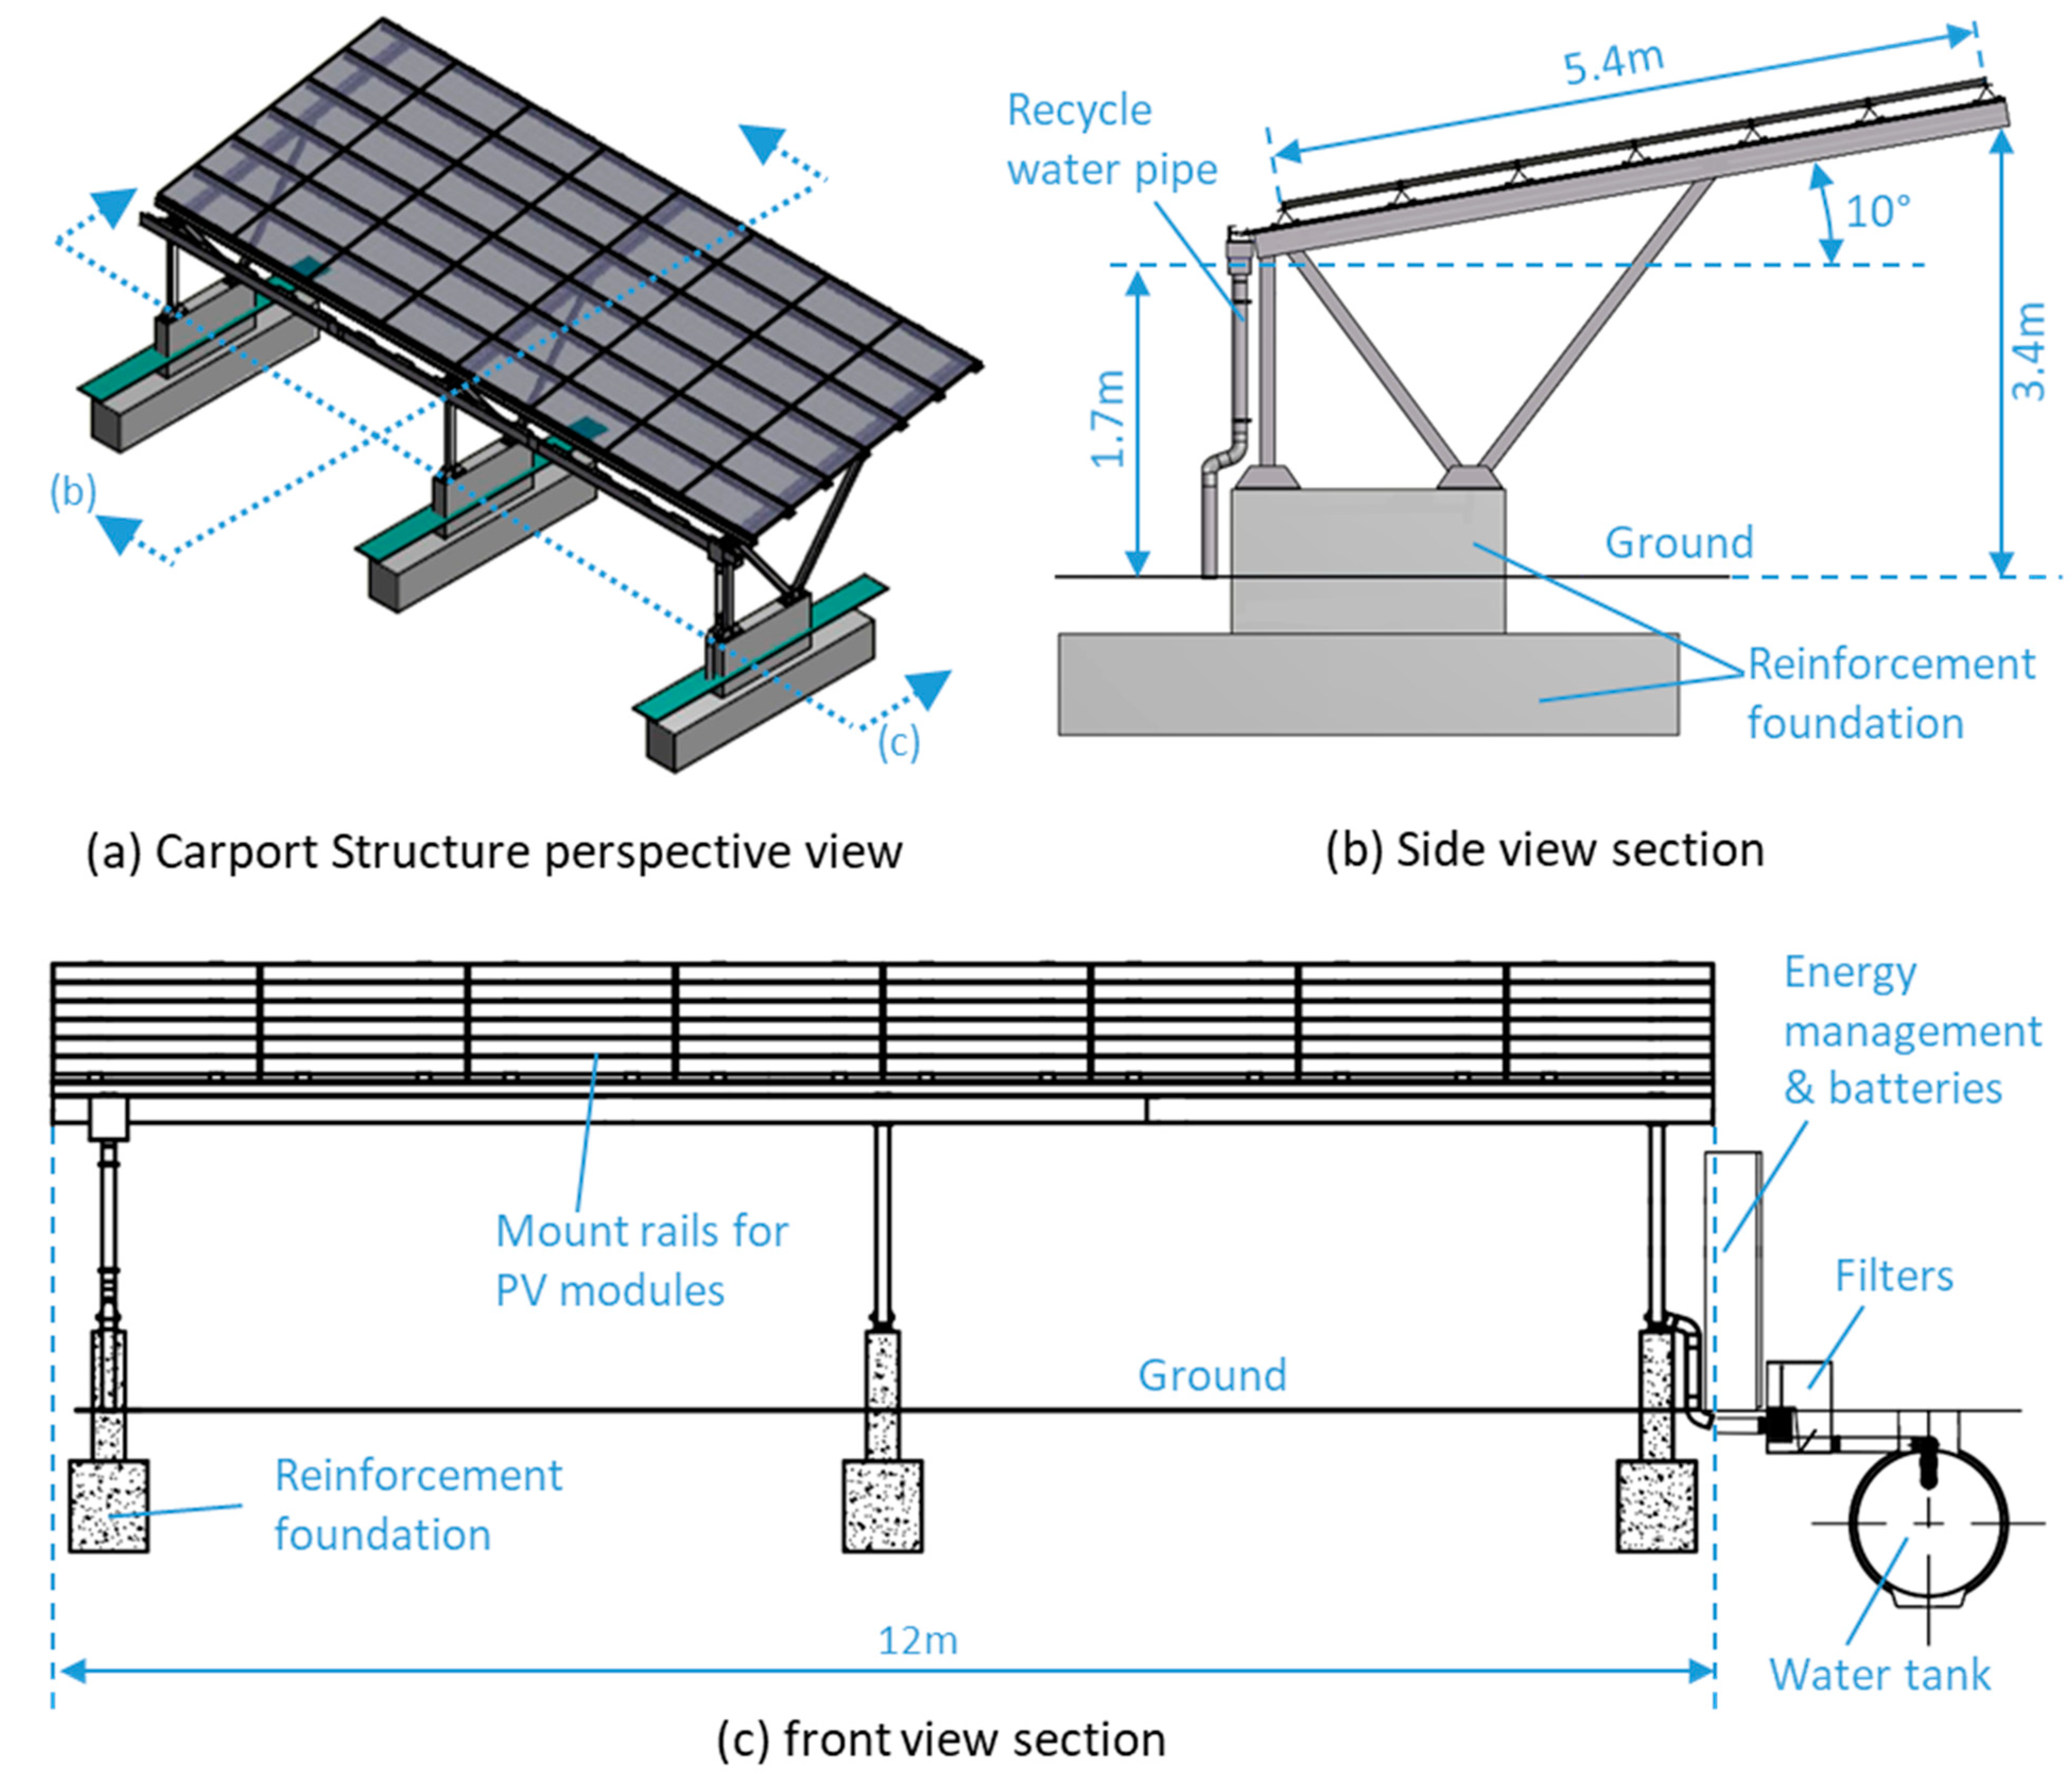
2.2. Carport
The carport structure not only provides shading for vehicles but also serves as the base for the solar PV modules, the cleaning systems, and other accessories. The structure, therefore, needs to have a high level of structural integrity, ability to mount solar modules, and flexibility for future modifications. To ease design needs and deployment and provide overall robustness for the plant, a commercial product by Schletter
® (schletter-group.com),
Park-Sol-B1 (Schletter Solar GmbH, Kirchodorf, Germany), was selected. This consisted of an aluminium roof structure, mounting rails for installing PV panels, cast-in-place concrete foundations (constructed on site), and a steel main structure to support additional loads. The carport is able to accommodate four parked vehicles, occupying a total area of ~65 m² (12.0 × 5.4 m, excluding spaces occupied by the foundations and water tank). Details of the structure as well as some of the systems installed are given in
Figure 4.
The roof of the structure has a 10° inclination, which allows rainwater or water from cleaning to be drained away from solar panels into a collection gutter. The water is collected by aluminium panels fitted under the modules, allowing the water to flow into the gutter installed on the lower end of the roof and then through pipework connected to the underground water storage tank (marked in
Figure 4c). Before entering the water storage tank, the water passes through a three-stage water filter unit to remove sand, dust, and debris (not shown in
Figure 4c). The water storage and reuse system is discussed further in
Section 2.5.
The roof of the carport structure is composed of two main parts. On the top of the roof, six aluminium rails were installed horizontally (
Figure 4c), serving as the base where PV modules can be mounted. The space between each rail is around 0.8 m and can be adjusted, allowing the layout of the PV modules to be rearranged, in the future, to accommodate different cleaning systems.
Aluminium sheeting was fitted underneath the mounting rails to provide a weatherproof barrier from sunlight, dust, and as indicated earlier to collect the water used by the different cleaning systems. The sheeting also prevents parked vehicles and passengers from being affected by the cleaning processes.
The total roof space provided by the carport structure is ~65 m² (
Figure 4). If fully utilised it could accommodate a PV system with a capacity of up to 11 kWp. However, for our study this roof space area was separated into sections (see
Section 2.3) where different cleaning systems can be installed and tested simultaneously.
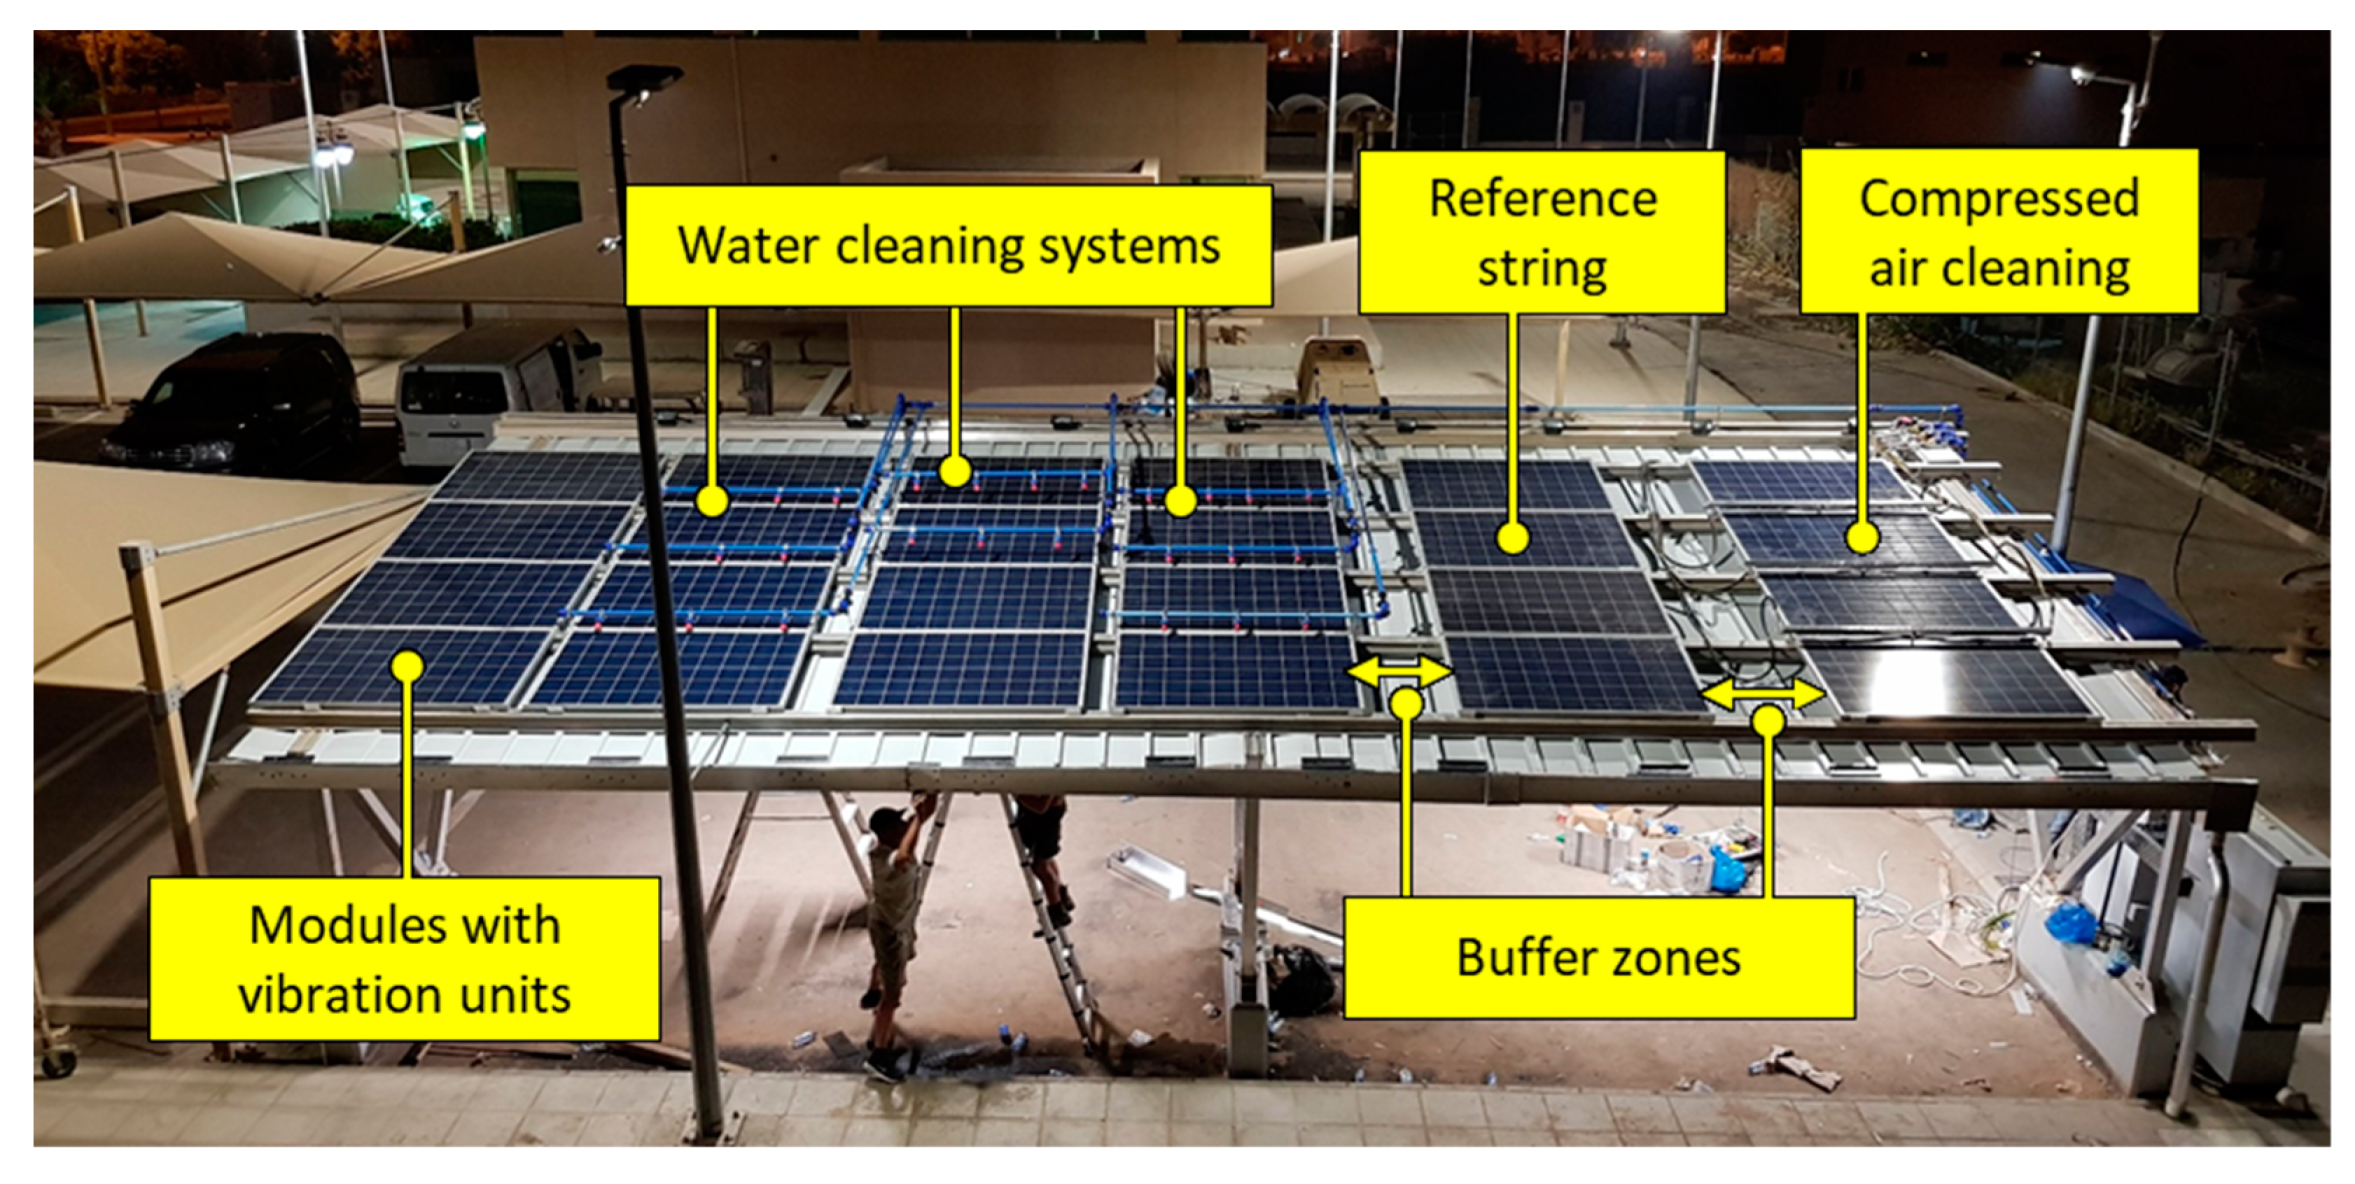
Figure 5 shows the final layout of the array and the carport space utilisation. As can be seen in the figure, buffer zones between sections of each sub-array were created to try to avoid any cross effect of cleaning modes being tested.
2.3. PV System
The photovoltaic modules used were manufactured by CanadianSolar®, model number CS6K-270P (Canadian Solar, Cambridge, ON, Canada) with a dimension of 1650 × 992 × 40 mm (L × W × D) and a rated power of 275 W
p (V
mp = 31 V, I
mp = 8.9 A). Our design consideration indicated that on the site (Jeddah, Saudi Arabia), the typical working module temperature is estimated to be ~60 °C and the irradiance is ~800 W/m
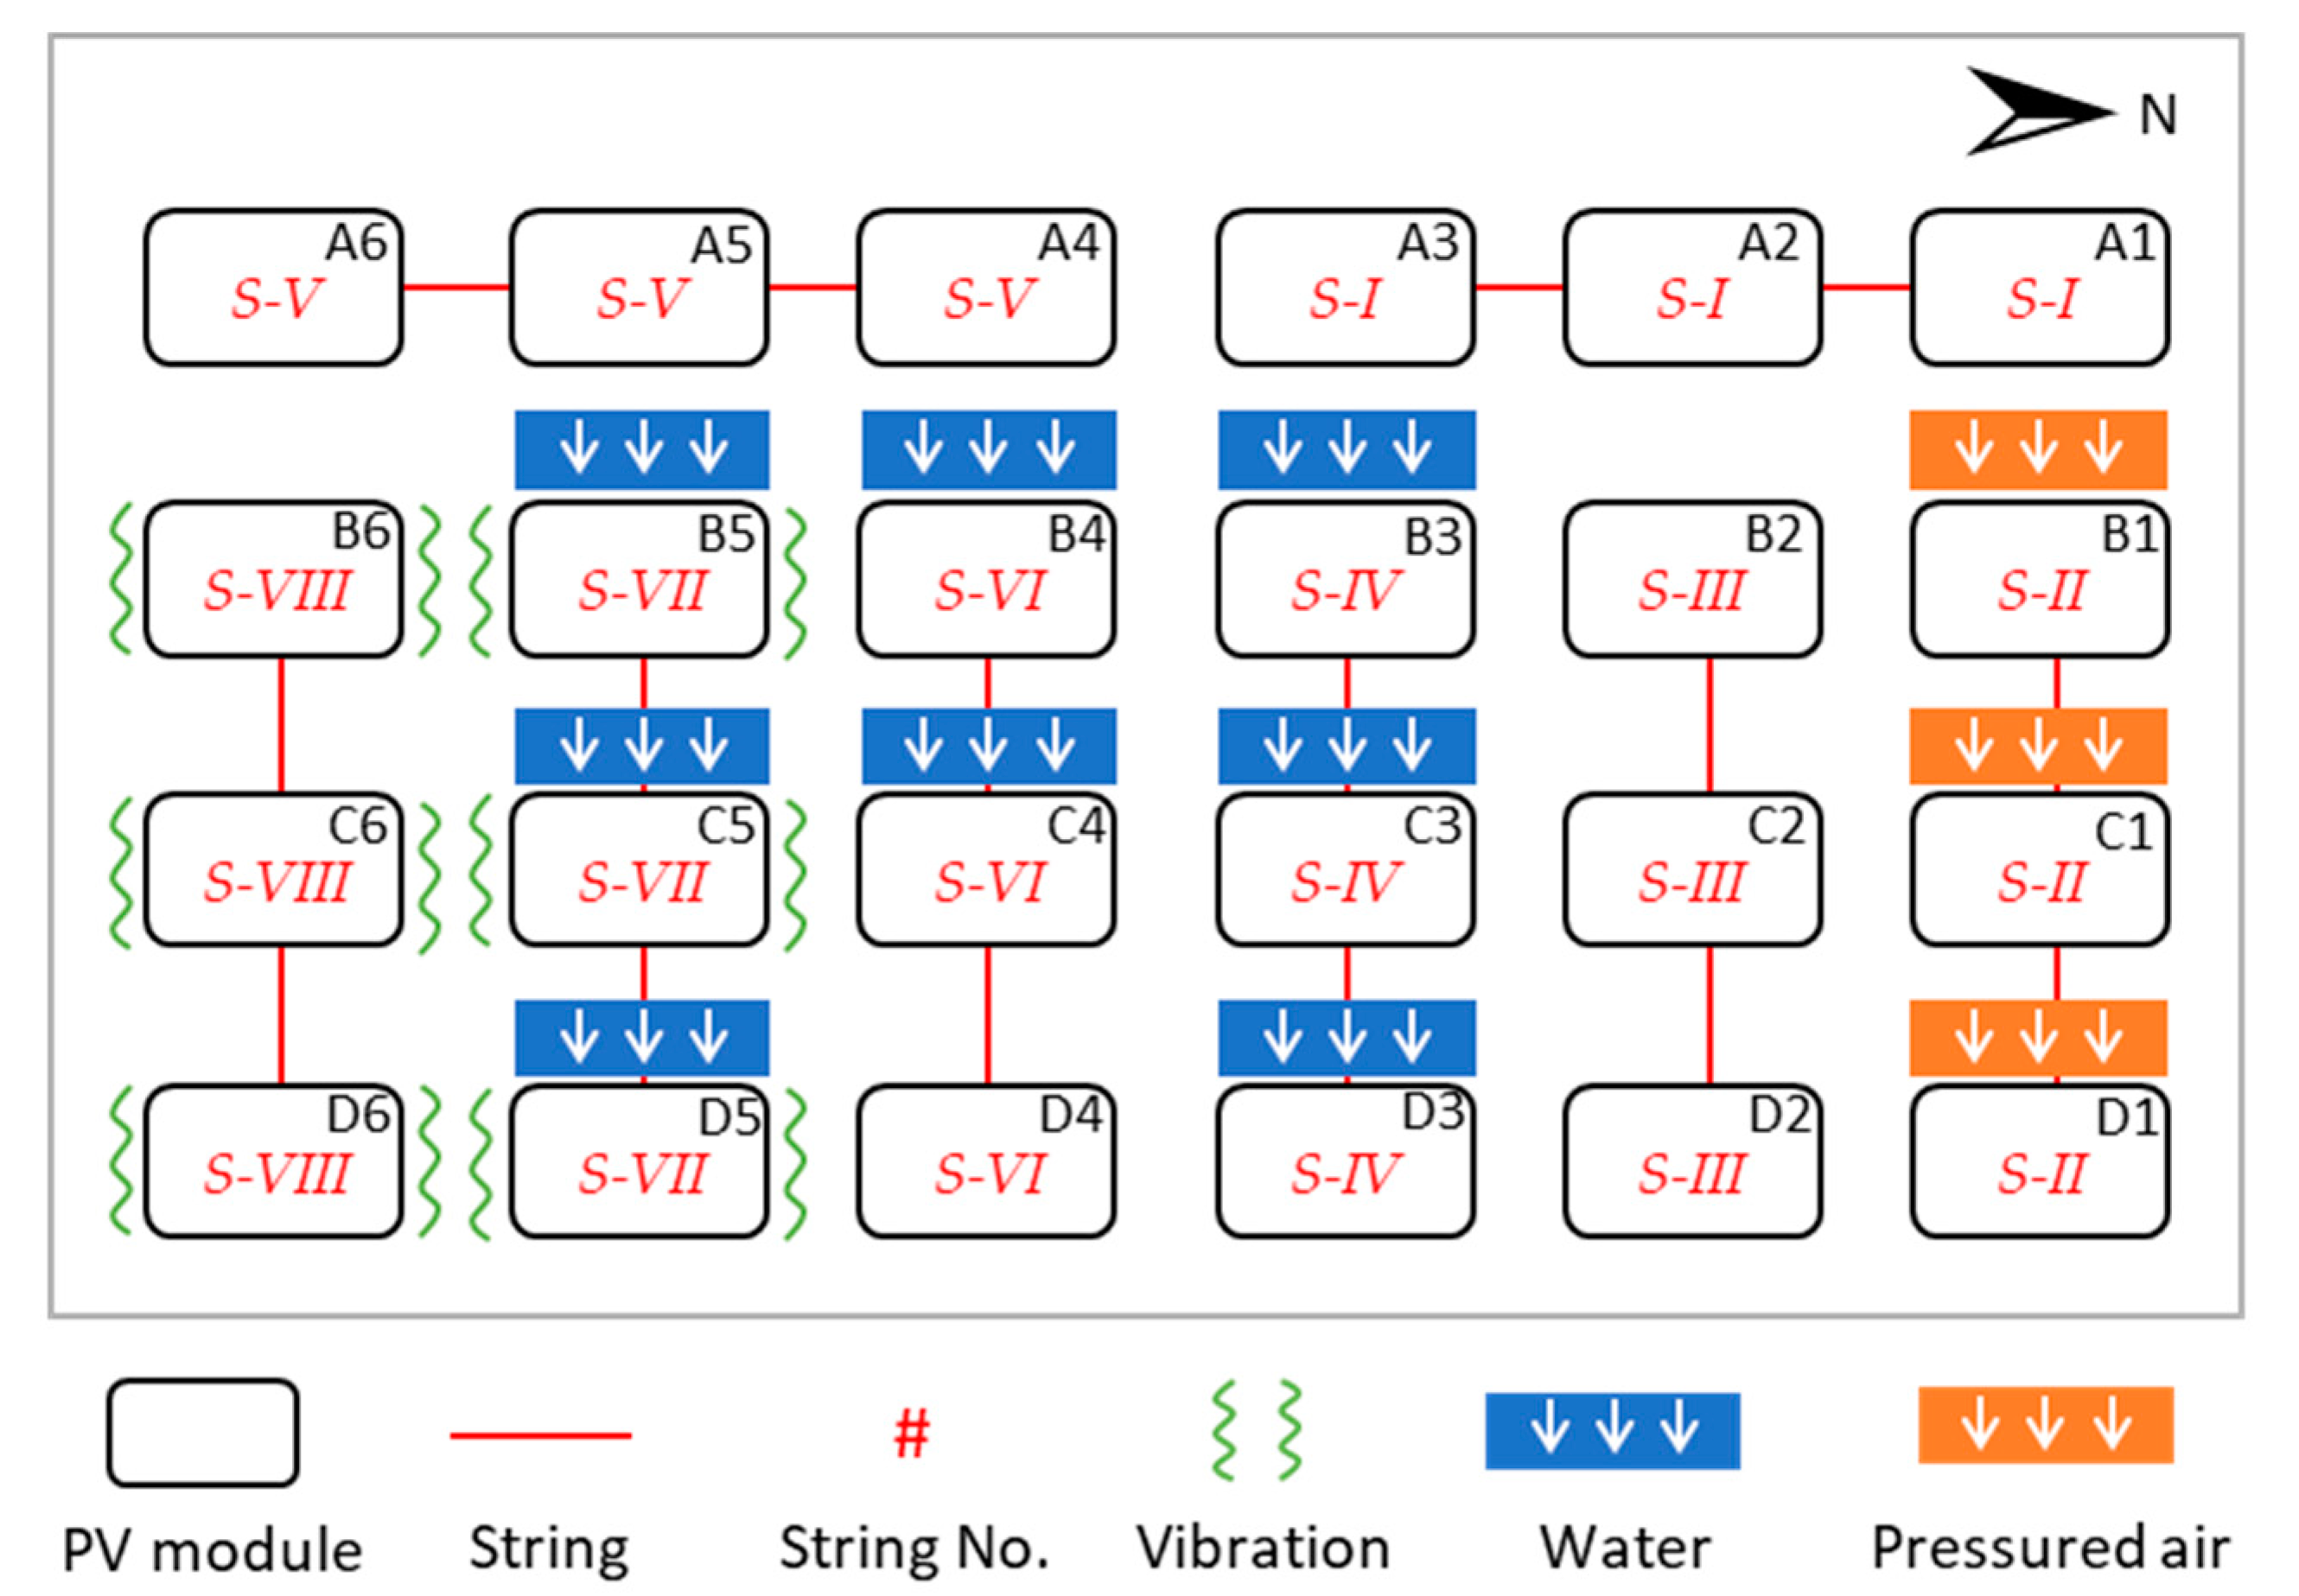
2. Under such conditions, each module would have a peak power output of 185 W (at approximately 28 V and 7 A). The PV system consists of 24 modules installed on the carport structure, forming a 6 × 4 array, as shown in
Figure 5 and
Figure 6. The whole array was configured into eight parallel strings, each of which is composed of three modules that are connected in series, as marked by red lines in
Figure 6. Three of the strings: (
S-I) A1-A2-A3, (
S-V) A4-A5-A6, and (
S-III) B2-C2-D2 are used as a control and are not fitted with any of the cleaning systems.
Such a layout provides an appropriate platform to test multiple cleaning modes either individually or simultaneously in combination for specific PV sub-arrays and to compare the outcomes with the performance determined from control strings where no cleaning takes place. For cleaning, eight sets of water nozzles and three sets of pressurised air nozzles (B1, C1, and D1, string
S-II) were fitted on top of 11 of the PV modules, as shown in
Figure 6, where the arrows marked on the cleaning systems indicate direction of water and airflow. In addition, six modules were also fitted with vibration motors to test the performance of cleaning with vibration only (B6, C6, and D6,
S-VIII). The other three modules—B5, C5, and D5 (
S-VII)—have both water cleaning and vibration fitted to test the effectiveness of cleaning by combining vibration and water modes.
As shown in
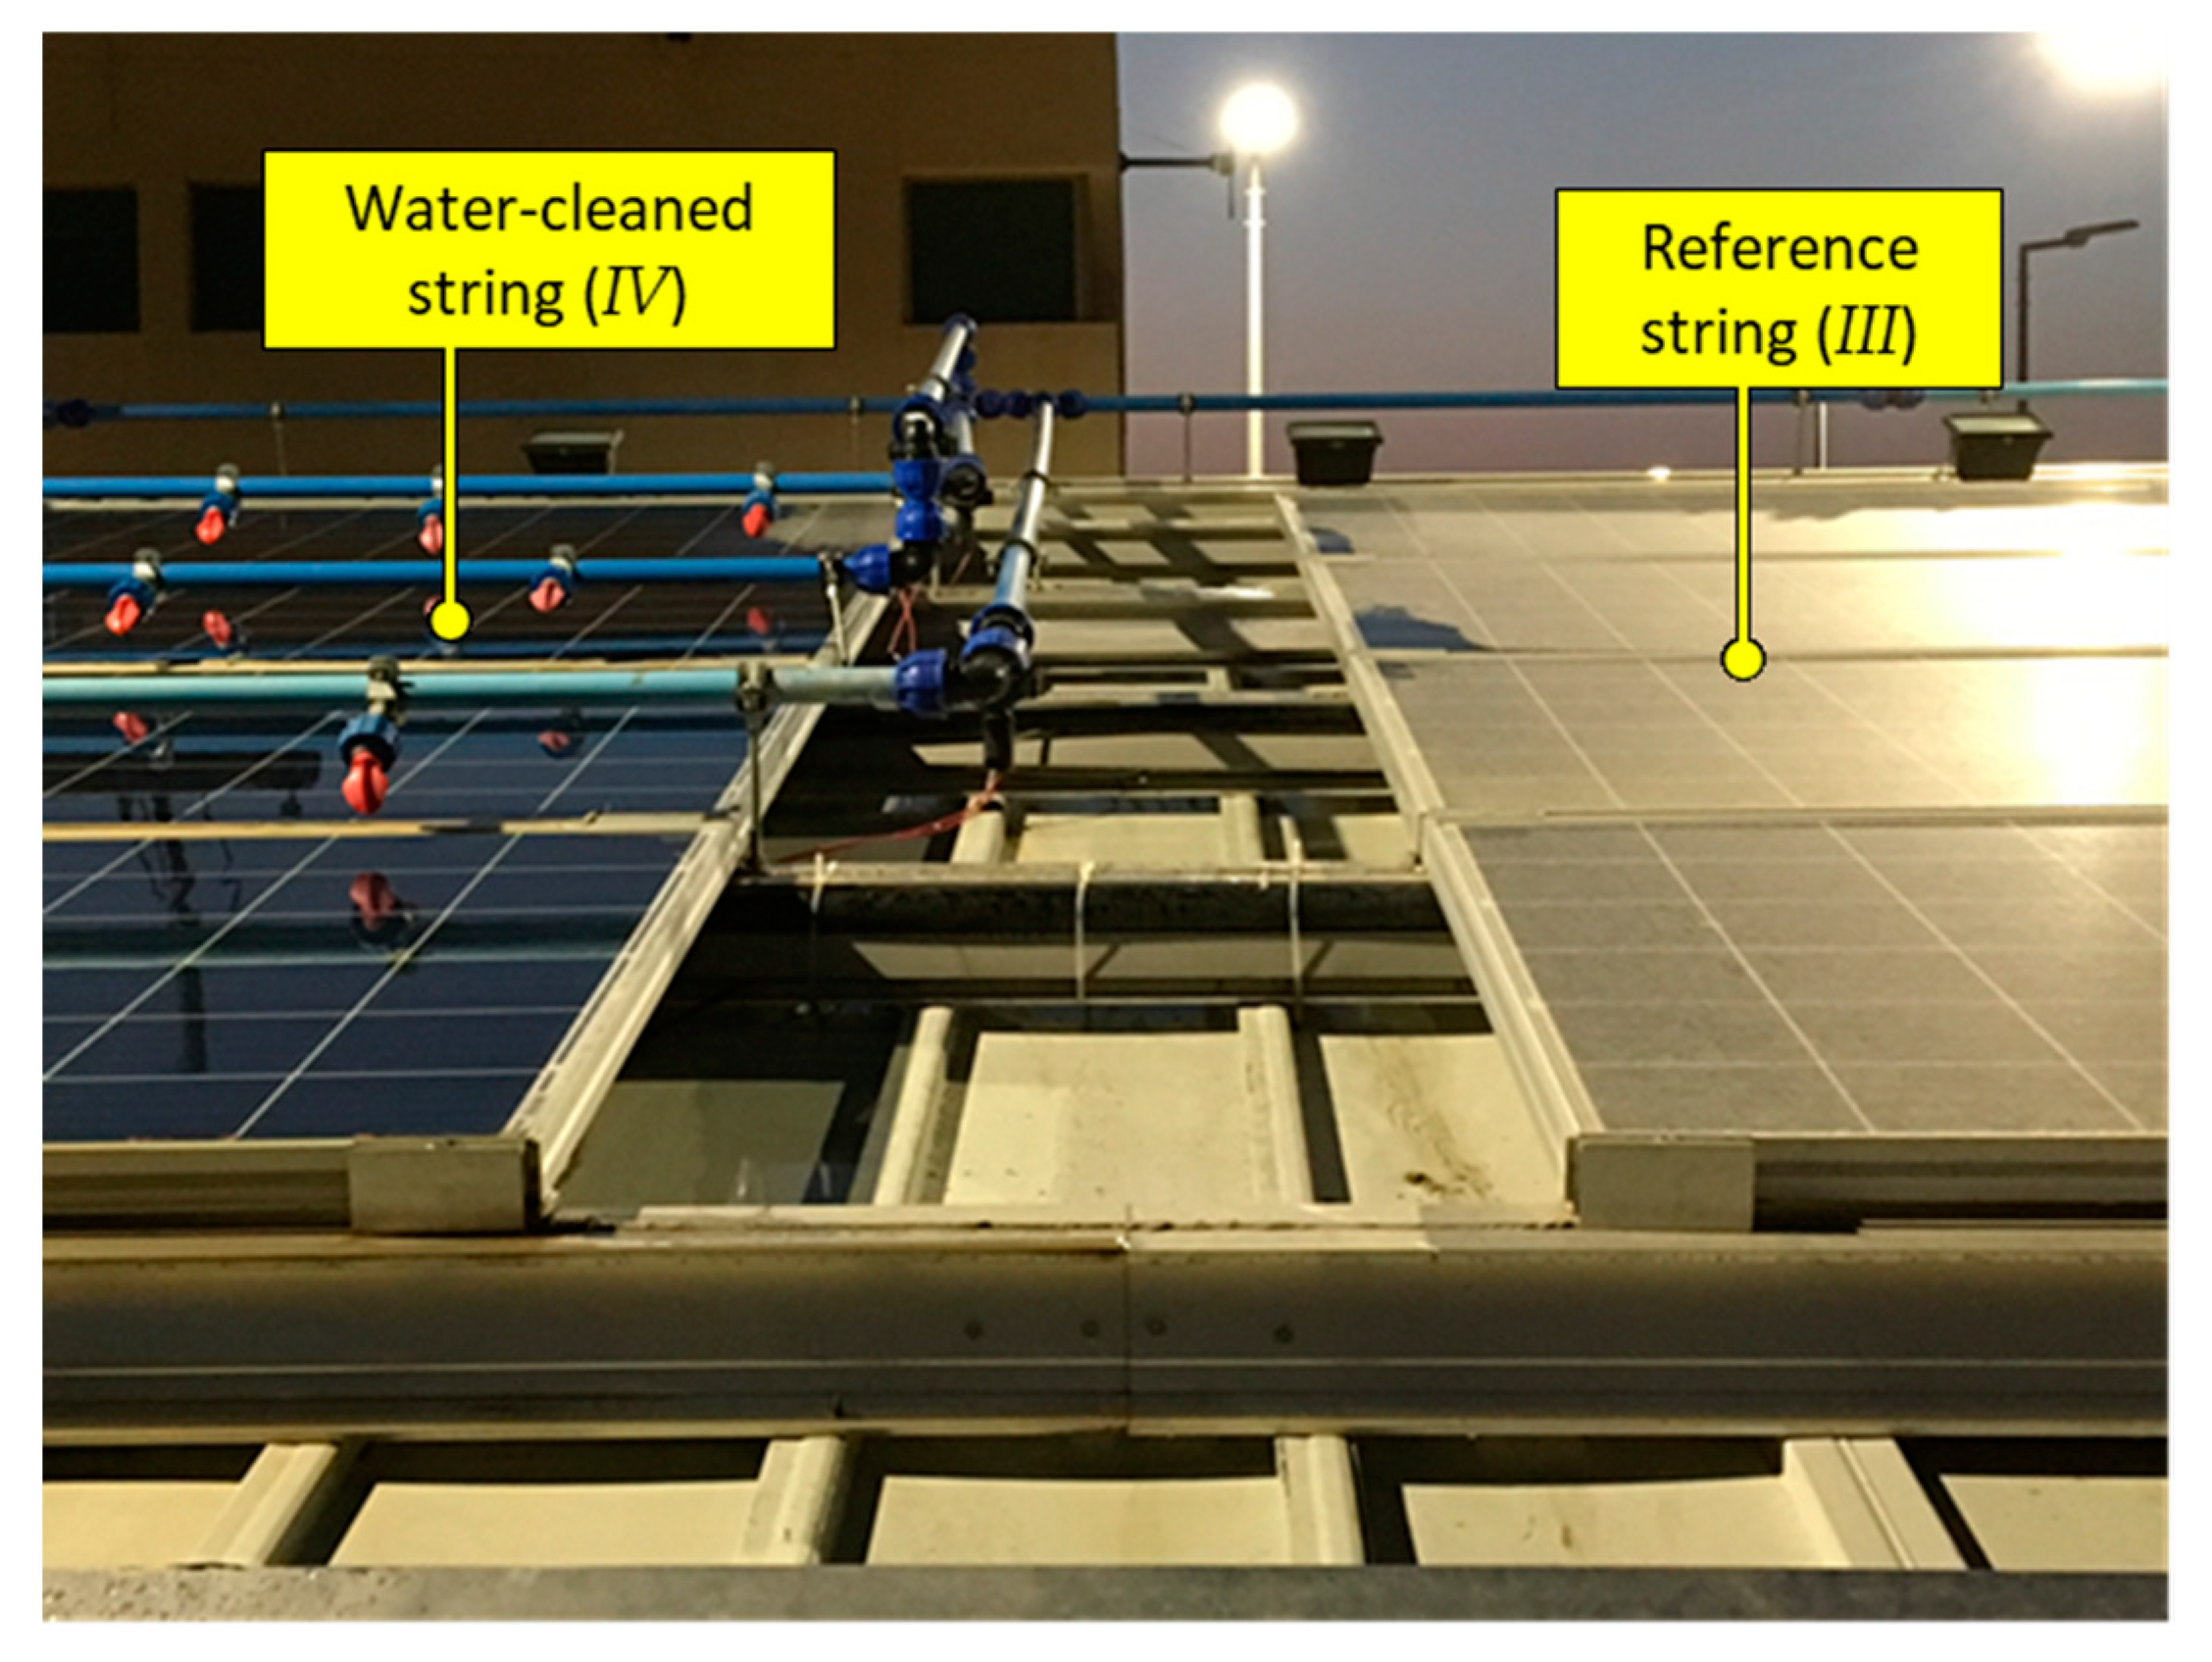
Figure 5 and
Figure 6, the PV module D4 (in string
S-VI), unlike D3 (
S-IV), is not fitted with water nozzles. This feature is added to compare water jet cleaning reach where D4 is cleaned through drenching from the nozzle jets on C4. This is implemented to see if this mode is sufficient to clean subsequent modules in an array where huge savings in water use could be gained, especially in large arrays.
2.4. Energy Storage System
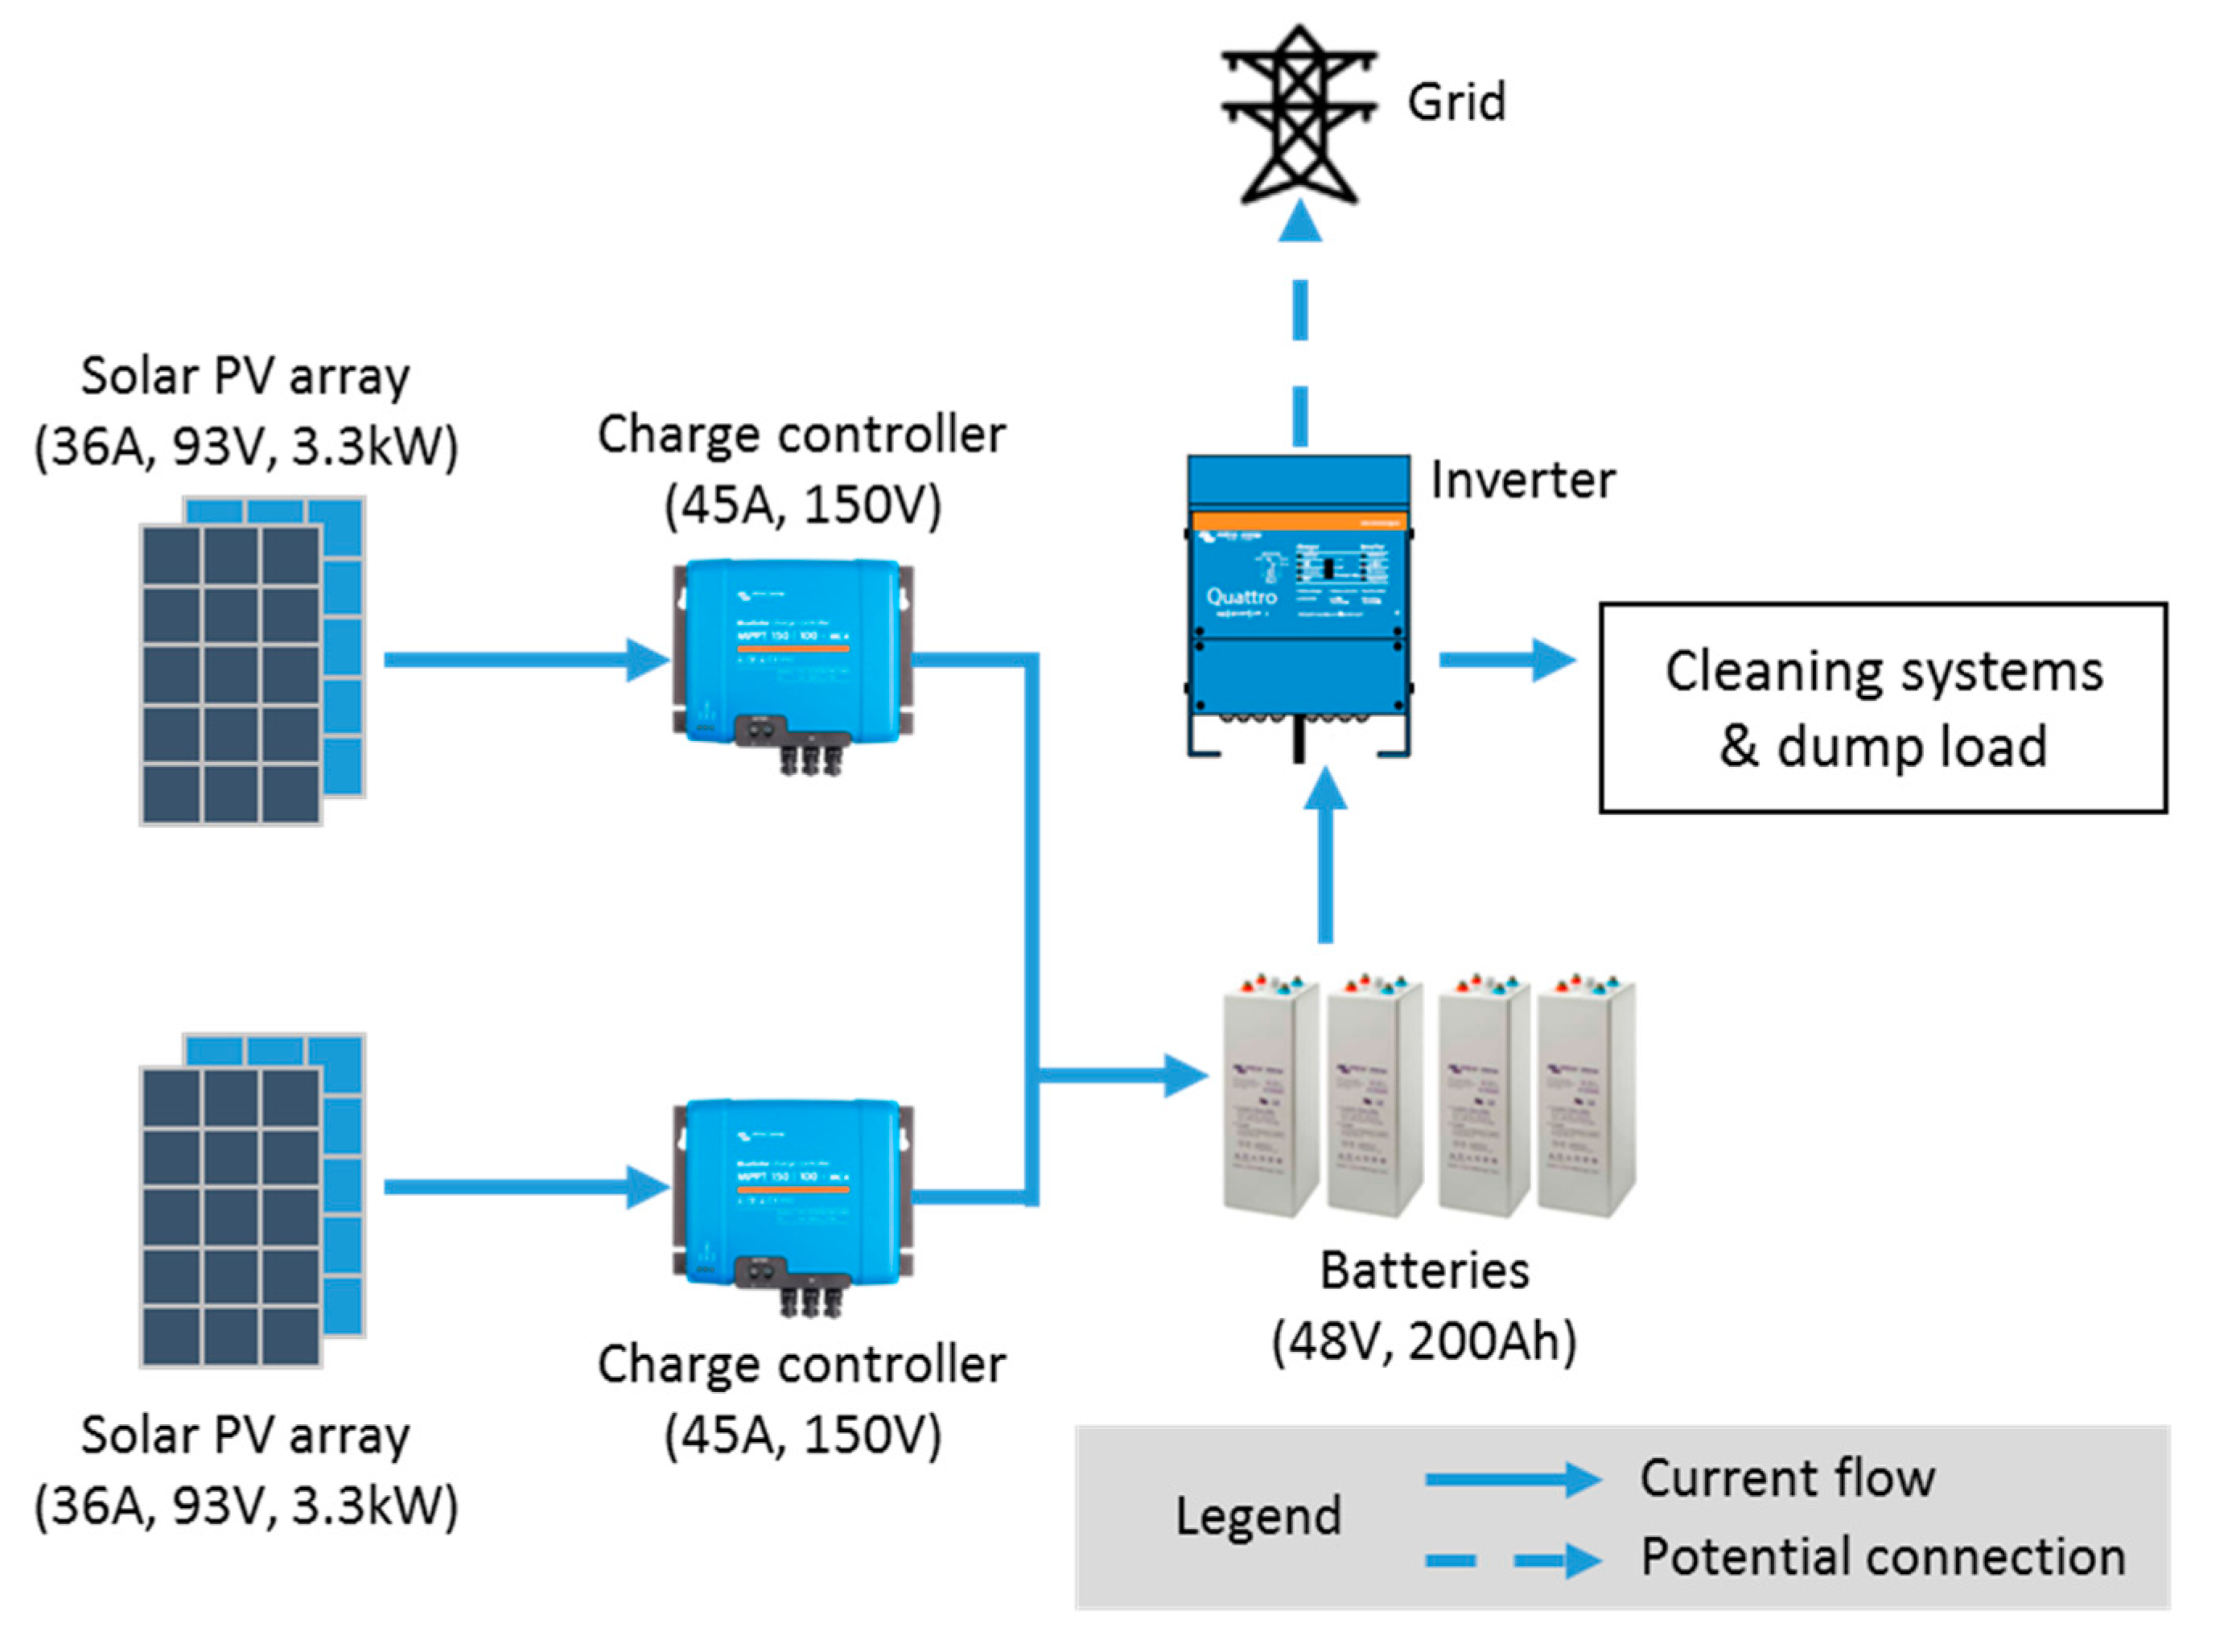
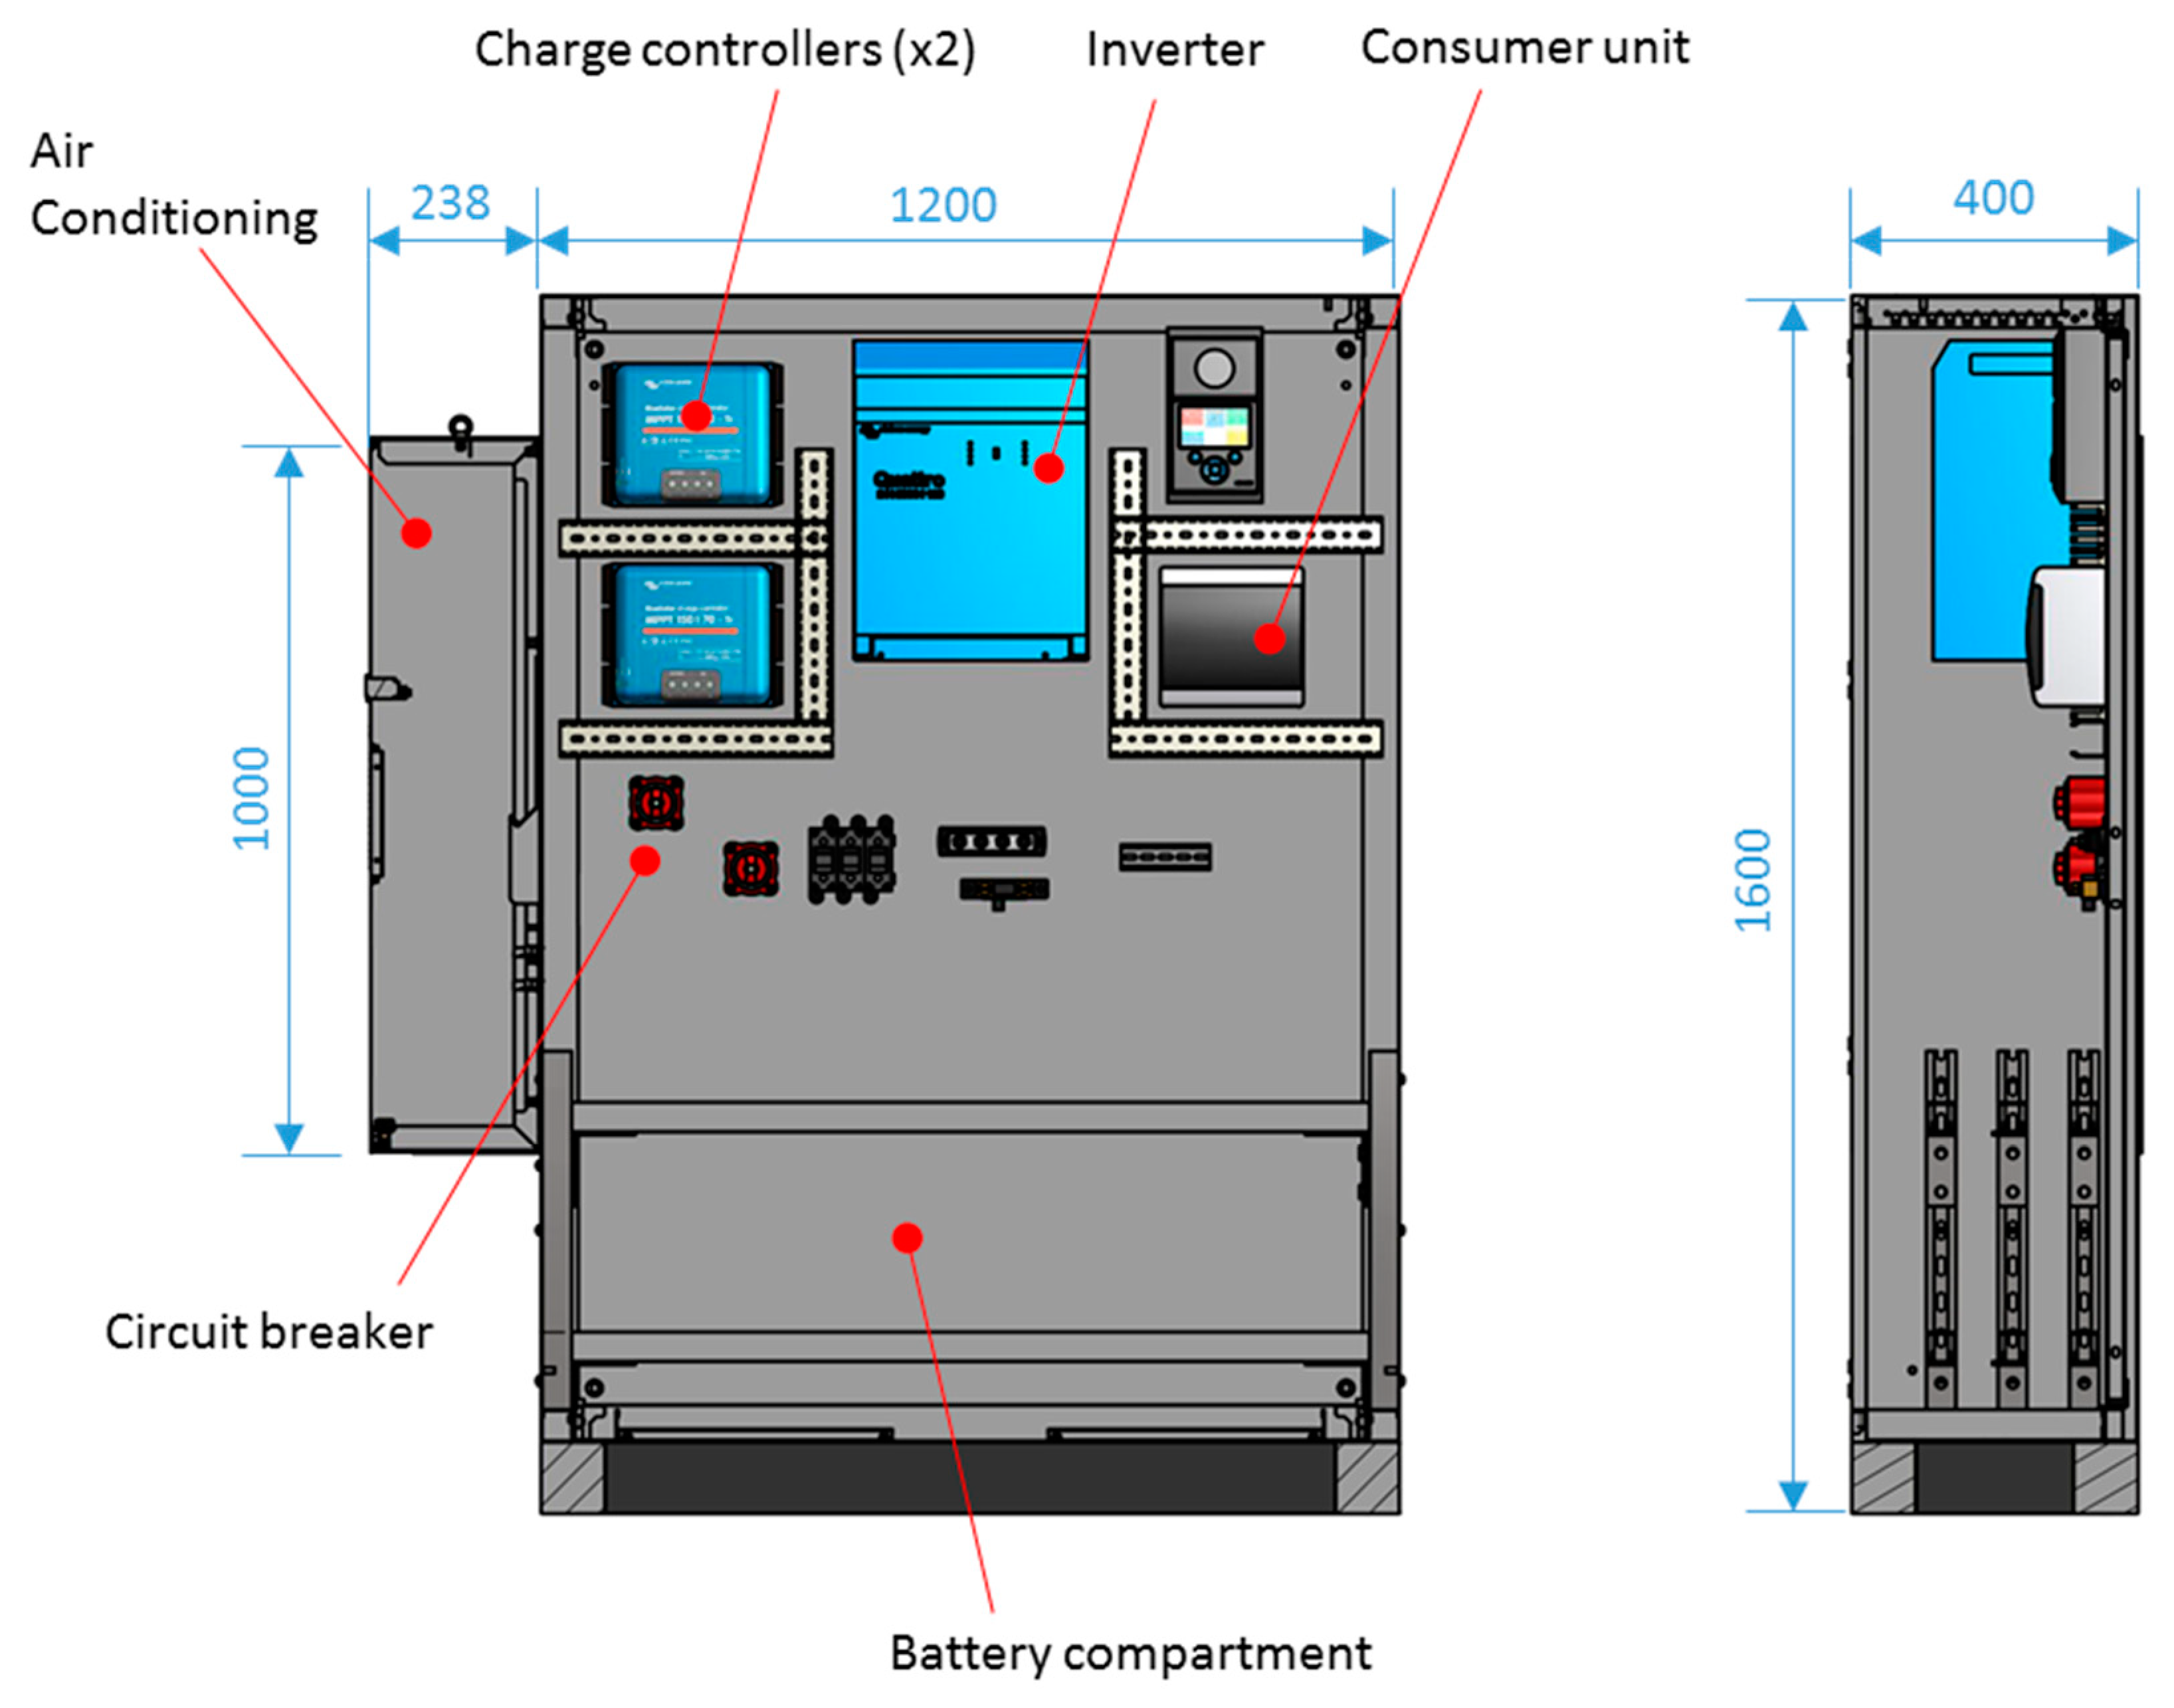
In Saudi Arabia, connecting microgeneration, such as PV to the distribution network is currently not straightforward from a regulatory standpoint. A predicate of the design philosophy is that the plant and its systems should be run independently (standalone) and not connected to the mains (grid). Hence, a battery storage unit with charge controllers and an inverter was installed as part of the overall PV system, as shown in
Figure 7. Gel batteries (lead acid) were chosen based on their high temperature safety and cost effectiveness for static applications. They have a total capacity of 9.6 kWh (48 V, 200 Ah), providing 24-hour power for all cleaning systems and additional loads, such as data logging, safety lighting, and cameras. The PV modules were separated into two arrays, each containing 12 modules with a rated capacity of 3.3 kW (36 A, 93 V). Each array is then connected to an individual charge controller (45 A, 150 V), which manages the state-of-charge of the batteries. As lead acid batteries are known to be prone to deep discharge, the charge controllers are programmed to maintain the state-of-charge at over 50%.
Solar systems installed in car parks are likely to be grid-connected [
25]. To facilitate future studies in this area, the project was also designed to allow connectivity to the grid through a multi-purpose inverter—Victron Quattro. This provided the operational functions needed by the design philosophy, as follows:
In this presented work, we only consider Mode 1, where the inverter is set to be part of an off-grid system, and the connection to the national grid is temporarily disabled. In order to simulate a grid-like current sink for the PV system, a 4 kW dump load was incorporated to the system. This was programmed to be automatically switched on when the current drops below the optimum, forcing a no disconnect from the charge controllers, so the PV system stays operational to study cleaning modes and their impacts on the energy yield.
In order to quantify PV system performance, the current of each PV string is monitored and measured independently through a series of 6 mΩ shunts (60 mV at 10 A) installed within the system cabinet. In addition, shunts (60 mV at 500 A) were also installed to monitor total PV current and battery charging current. All of the measured data are collected by a data logger and stored in a cloud-based database (see
Section 2.8).
The batteries and all energy management devices are contained in a weatherproof enclosure (IP 66), as shown in
Figure 8. The enclosure is air conditioned, preventing the electronic devices from overheating. This is particularly important for applications in the Middle East and other tropical regions, where daytime ambient temperature often exceed 40 °C (50 °C on occasion), which may cause damage to electronic components. The air conditioning unit has a rated capacity of 1 kW
thmeral, and the temperature set point can be adjusted to maintain the cabinet temperature at a required level.
2.5. Water Cleaning System
As mentioned in
Section 2.2, the water-based cleaning systems draw water from a 2 m
3 capacity underground water tank. The inspection cap is accessible from above via a manhole cover.
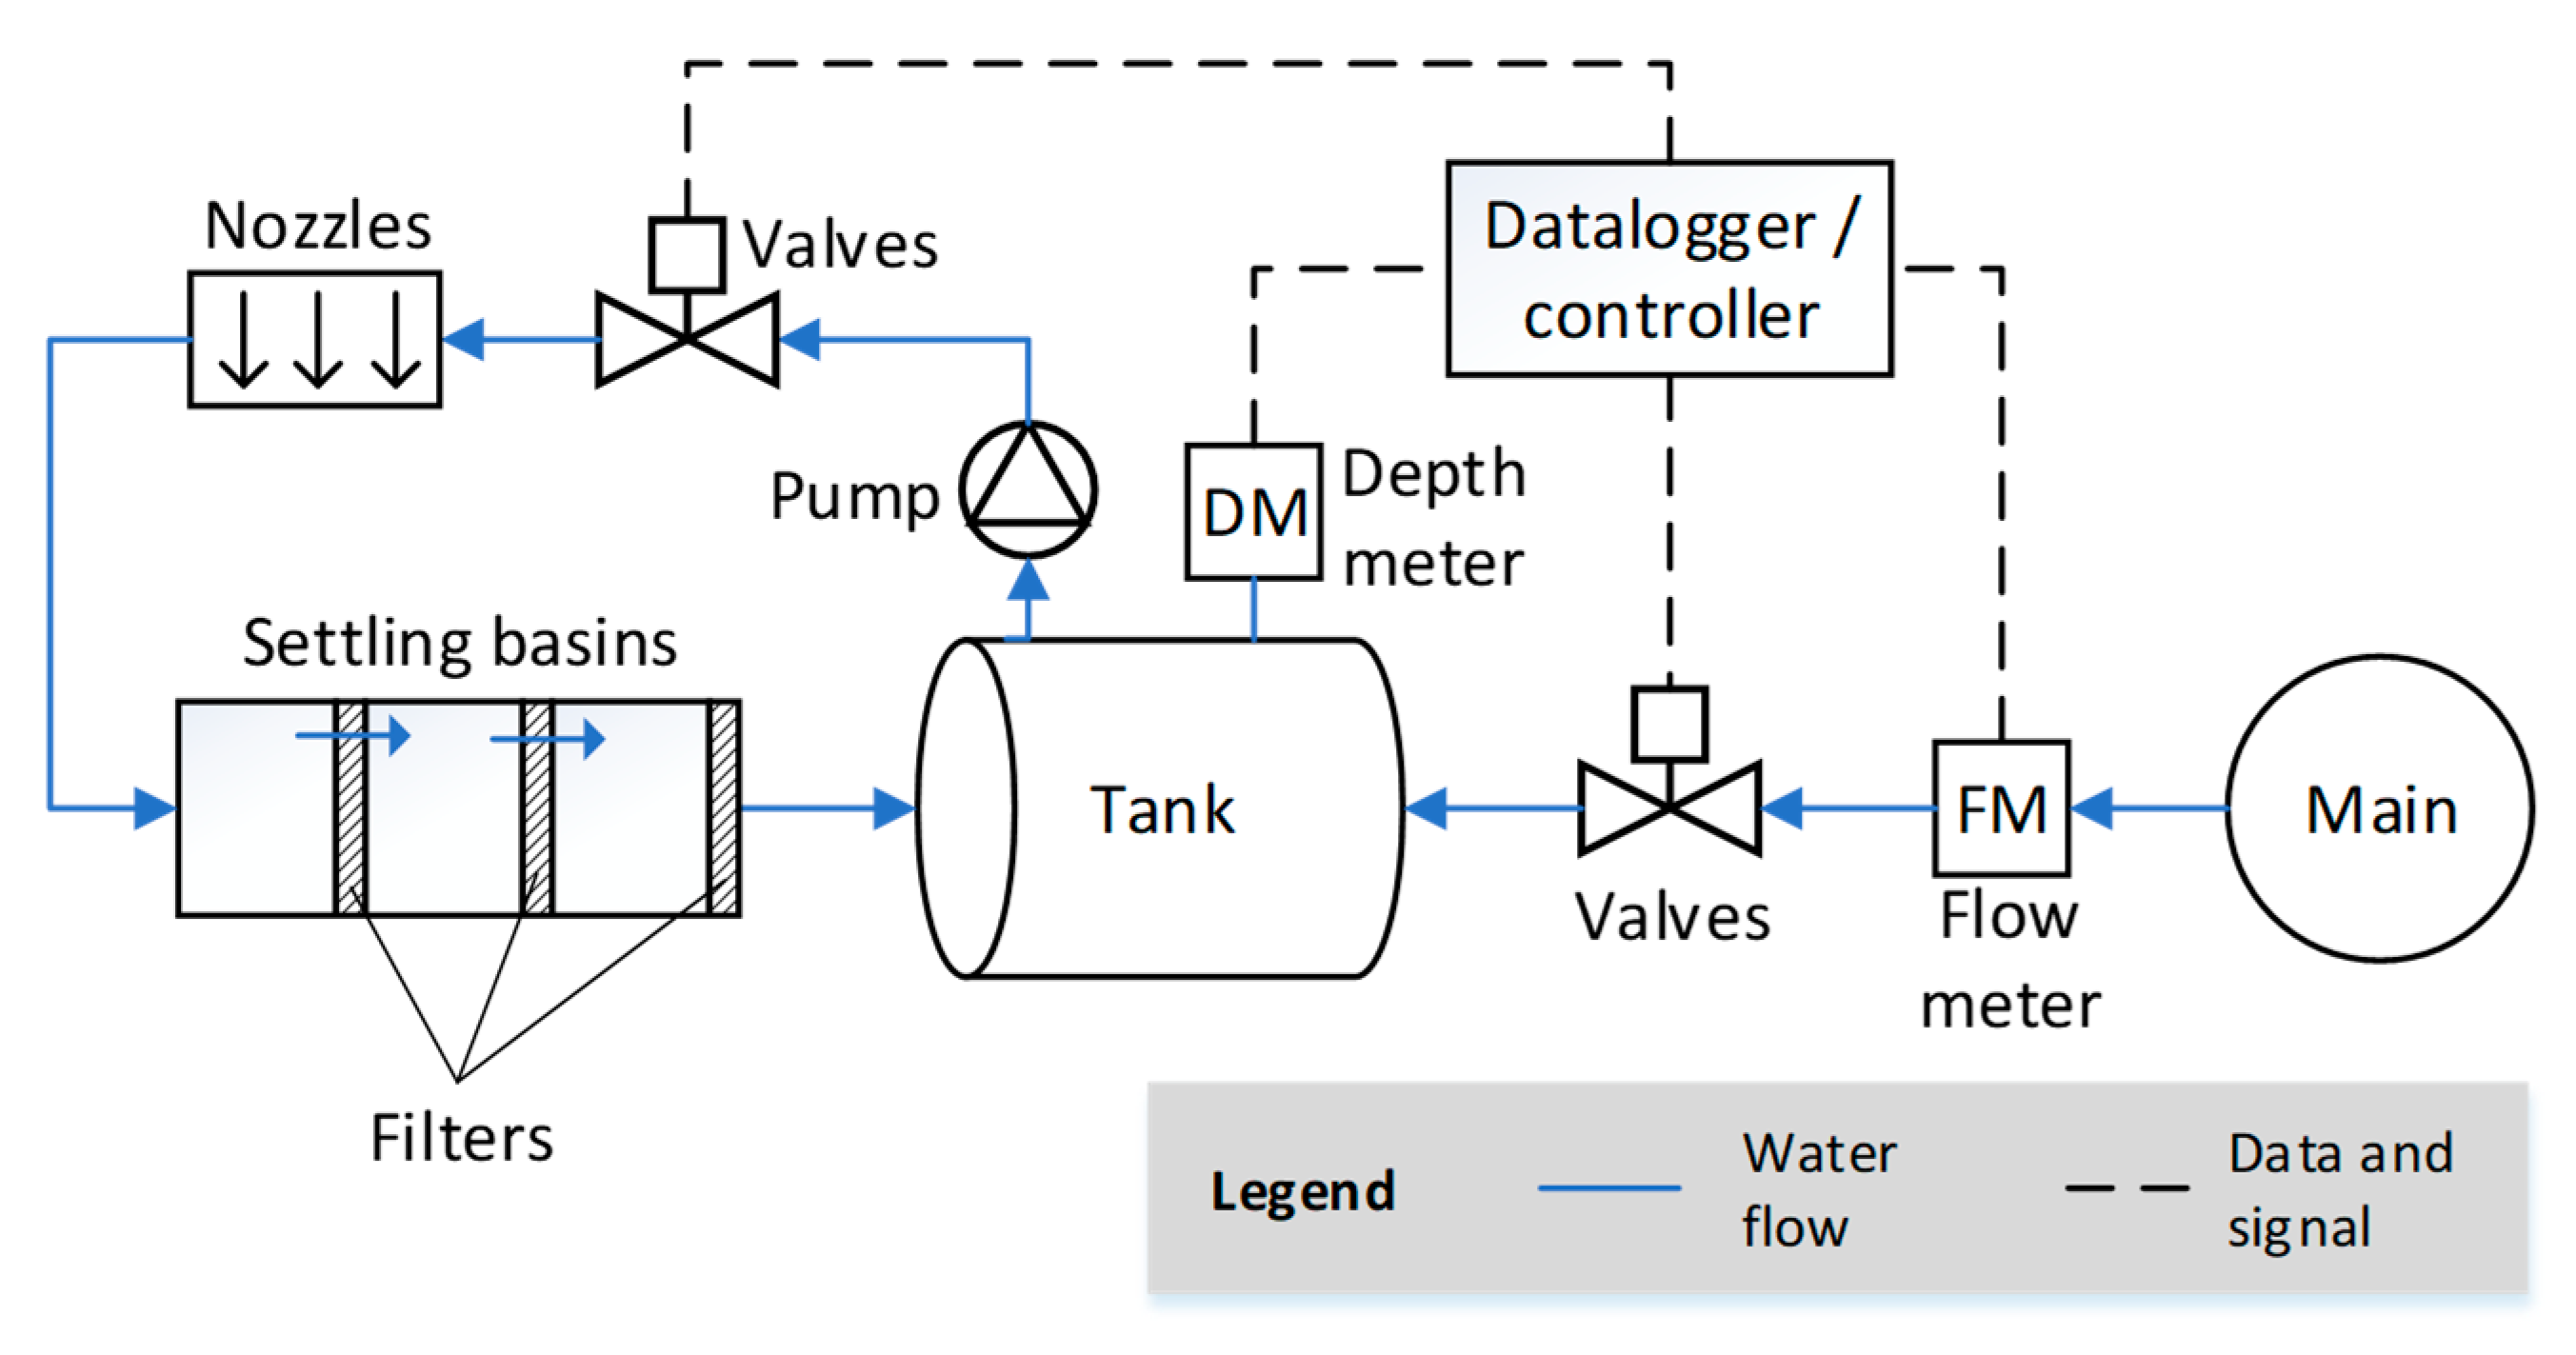
Figure 9 shows the connection of components in the water cleaning system. A three-stage water filter unit was fitted between the PV roof downpipe and the water tank. It is composed of three settling basins (1 m³ each) and three replaceable filters, accessible via manhole covers. The filter unit is able to prevent large debris and significantly reduce dust and sand particle ingress into the water storage tank.
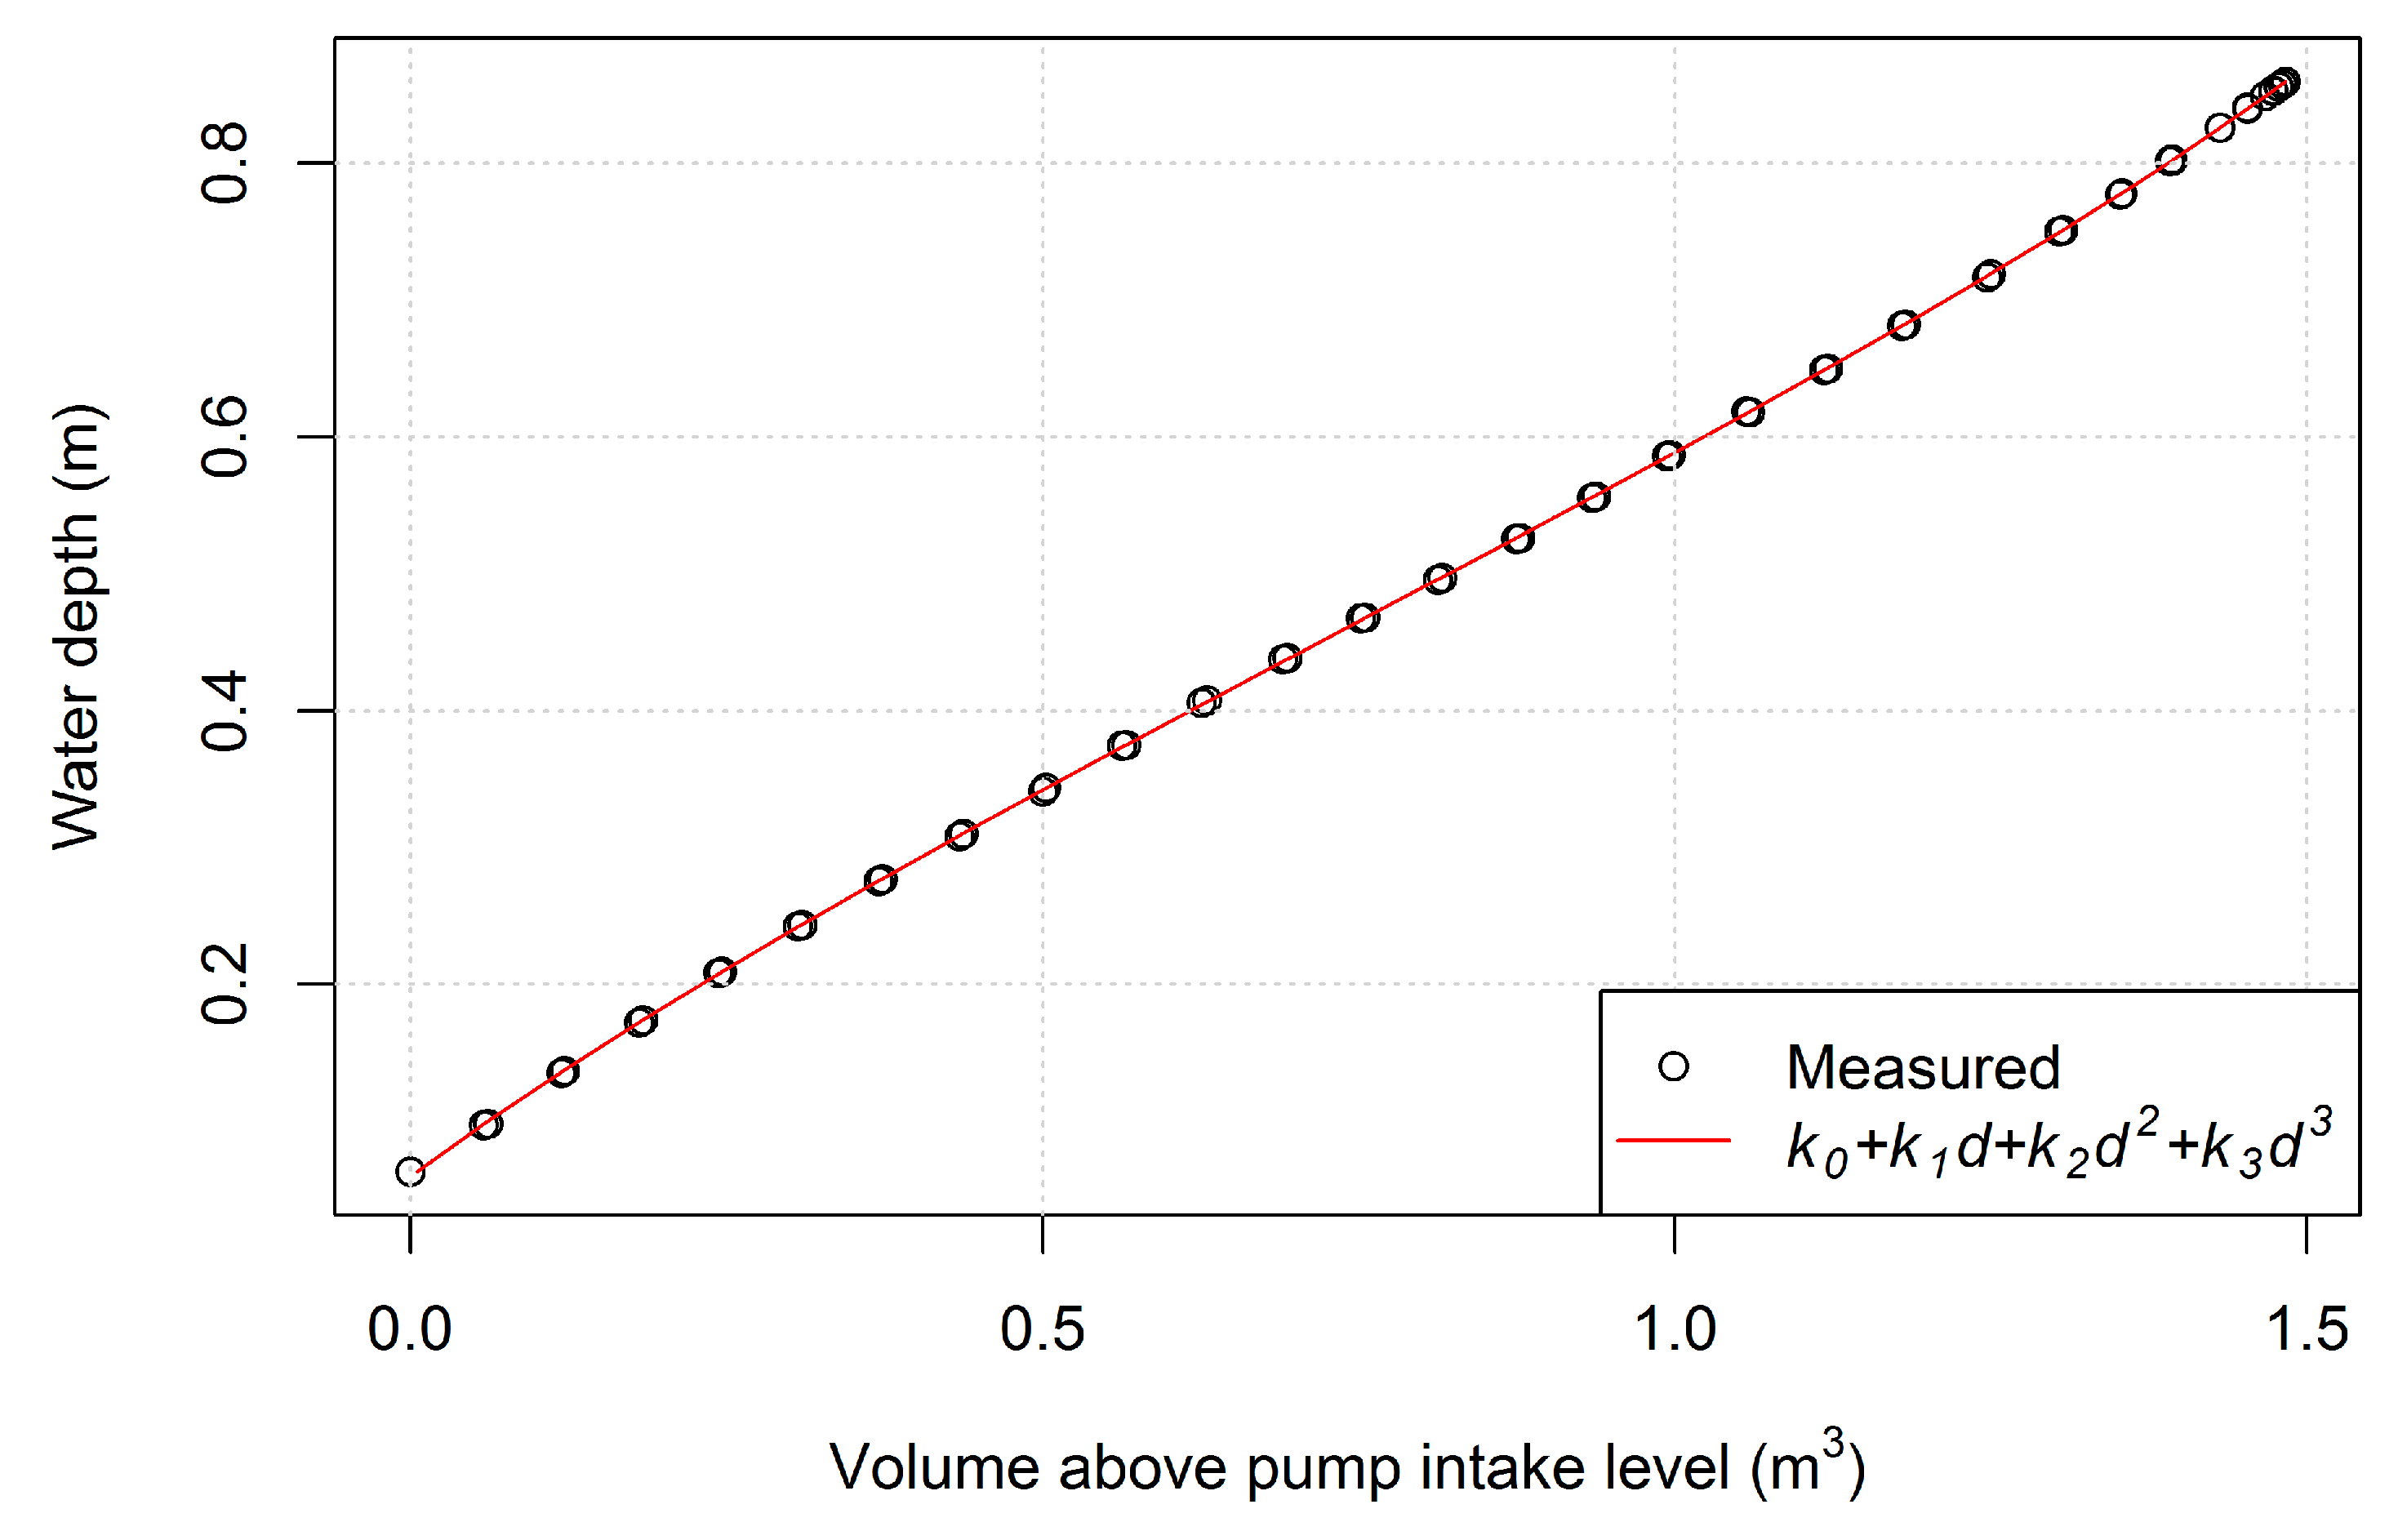
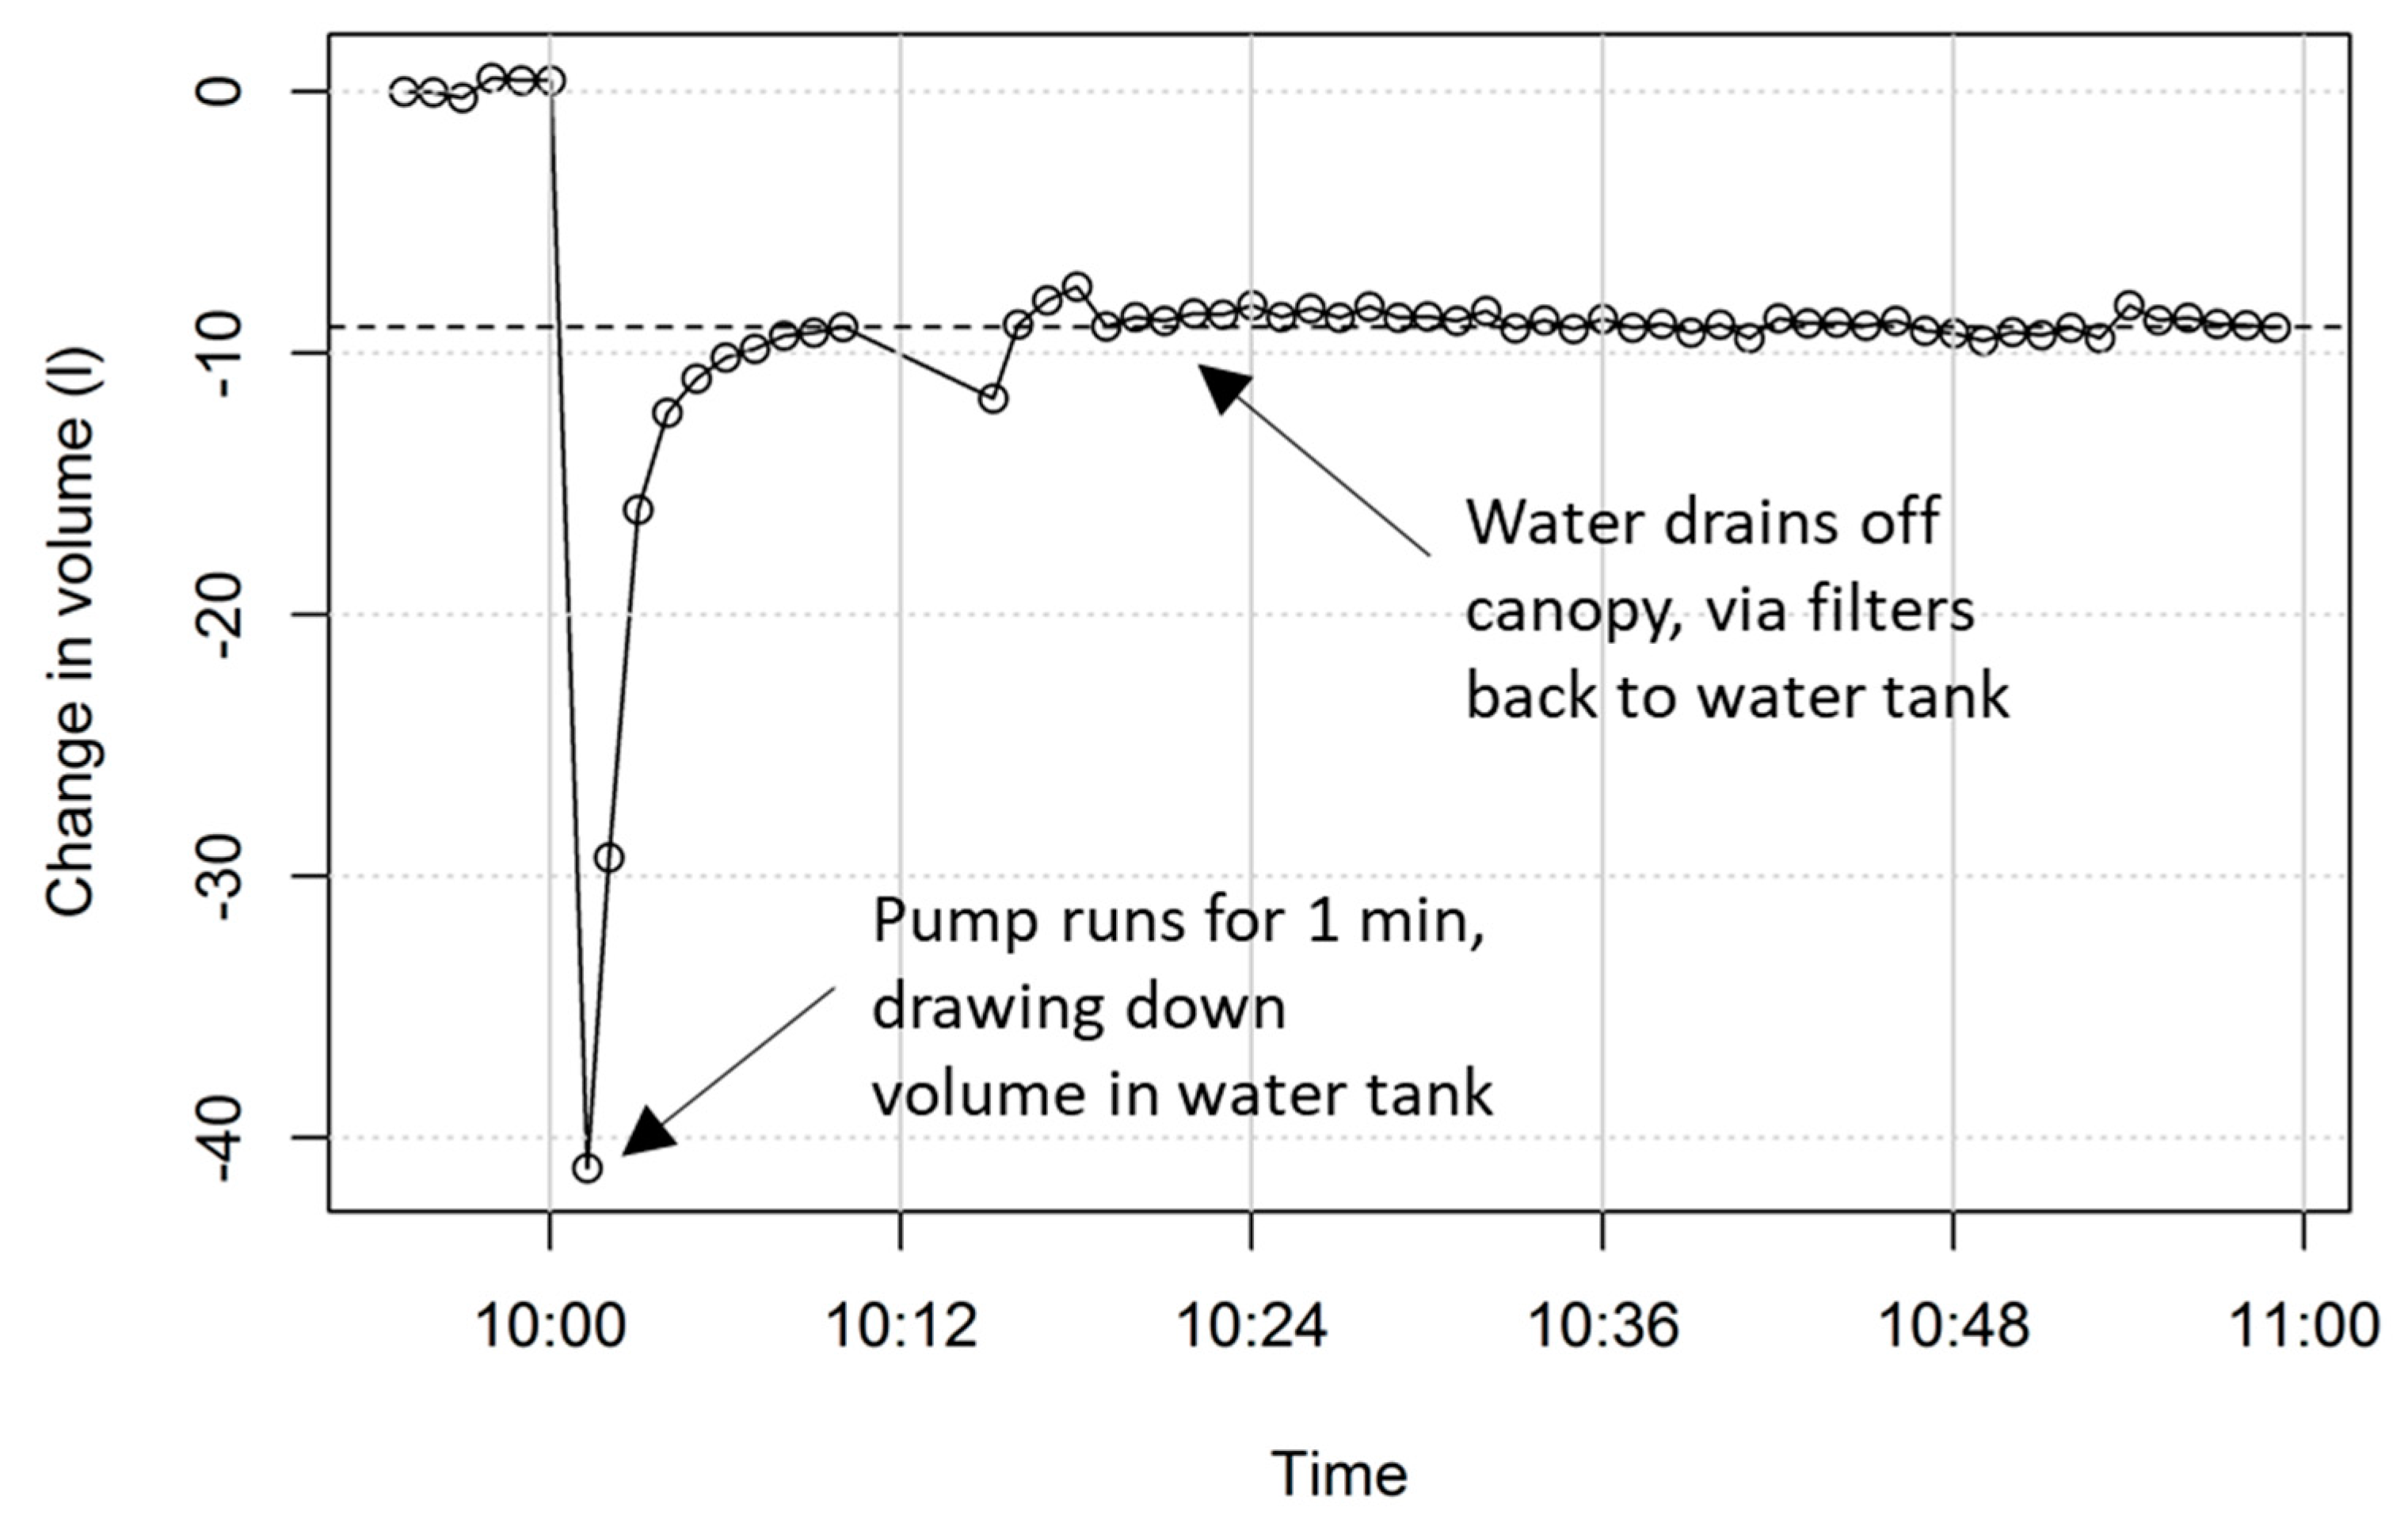
Within the tank, a pressure sensor was installed to monitor both the loss of water from the cleaning systems and detect any rainfall that may occur. The tank is also connected to the mains water supply, allowing it to be topped up when the water surface drops below a certain level. This drop could be caused by water losses during cleaning or water recollection process, i.e., spray droplets blown away from the canopy, evaporation, and any slight leaks from the guttering and downpipes. A water meter was installed on the main water supply with a magnetic pick-up (1 pulse per 0.25 L) to measure the amount of water that has been added into the tank, reflecting the amount of net water consumption. Both the water depth sensor and water meter are connected to a data logger (see
Section 2.8). The data logger is able to collect water depth data and control a solenoid valve, which regulates the amount of water entering the water tank from the main water supply.
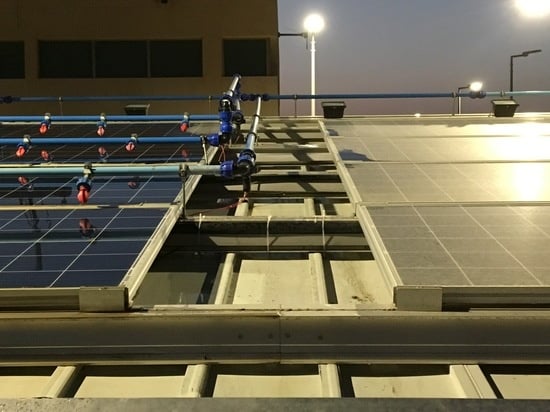
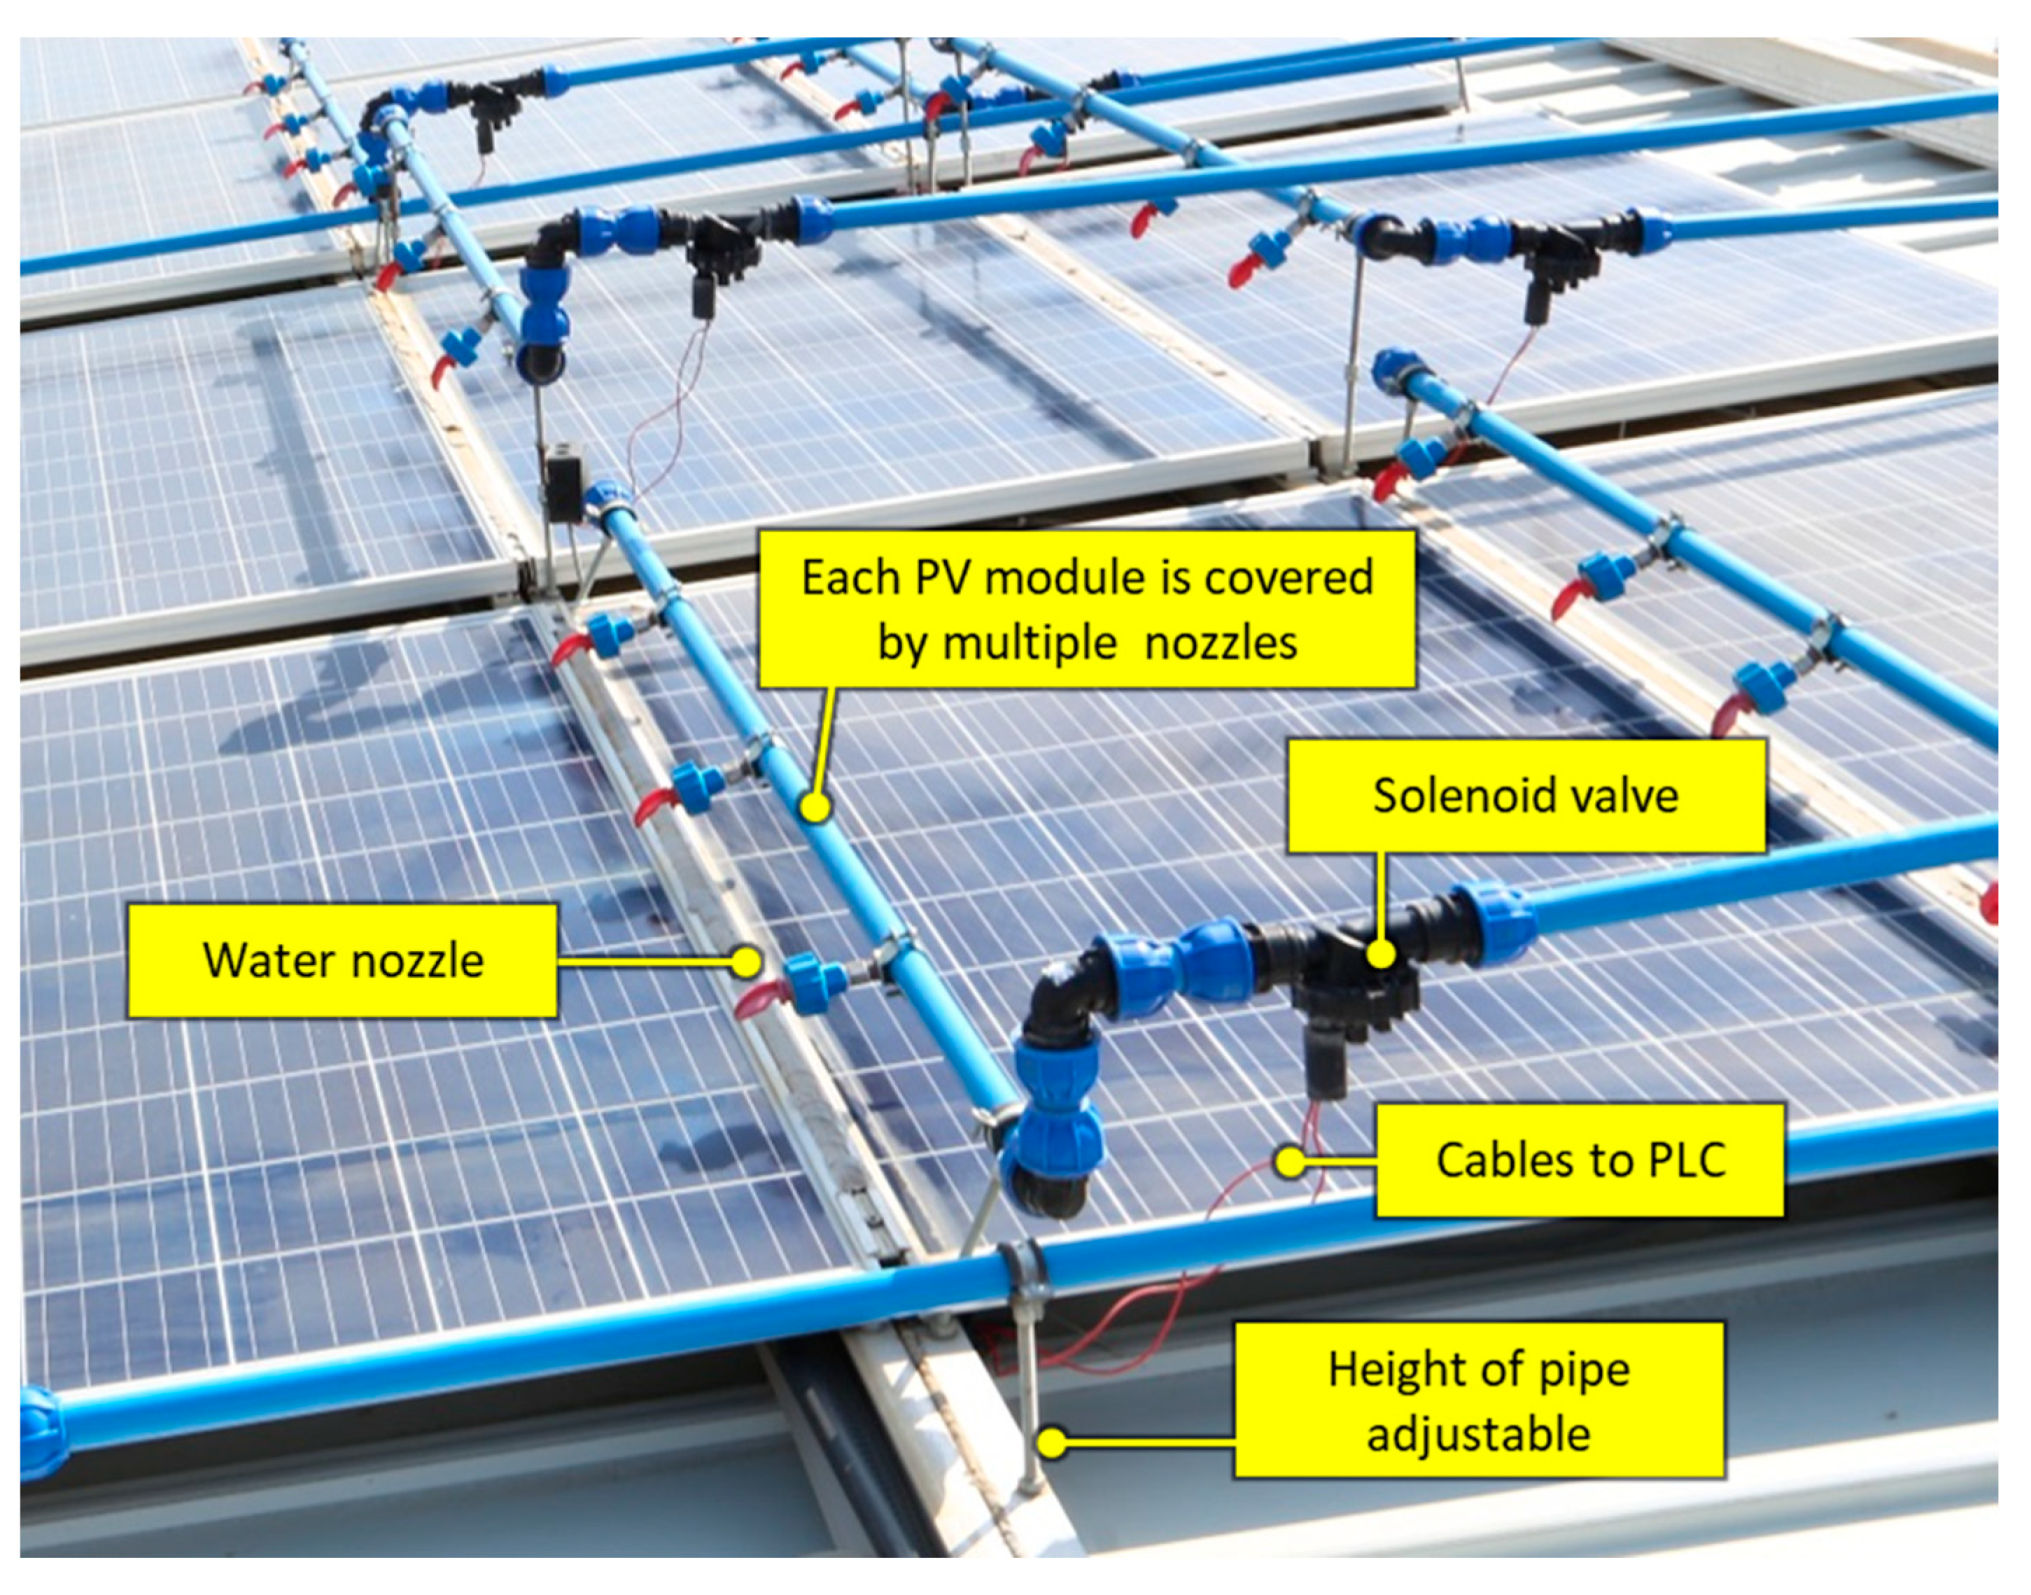
Water stored in the underground tank is lifted and pressurized by a self-priming electrical pump, configured to maintain a constant pressure in the pipework, and sprayed out of eight sets of water nozzles, as shown in
Figure 10. Each PV module is cleaned by a set of three nozzles (
Figure 10), which can be switched on and off by a programmable logic controller (PLC) unit through an electric solenoid valve. The height of the water pipes and nozzles are controlled by a number of supporting studs and are fully adjustable. This feature allows experimentation with nozzle height for effective cleaning as well as determining the impact of water pipe shadows casted on the PV modules. As shown in
Figure 10, the cleaning systems on different PV strings are fitted at various heights, facilitating a cross comparison in order to identify the optimal height. The water nozzles can also be adjusted to optimize the spray angle, water volume and pressure. This is part of the design philosophy to study and identify the most efficient method of cleaning for the PV solar systems whilst minimizing energy and resource consumption.
2.6. Air Cleaning System
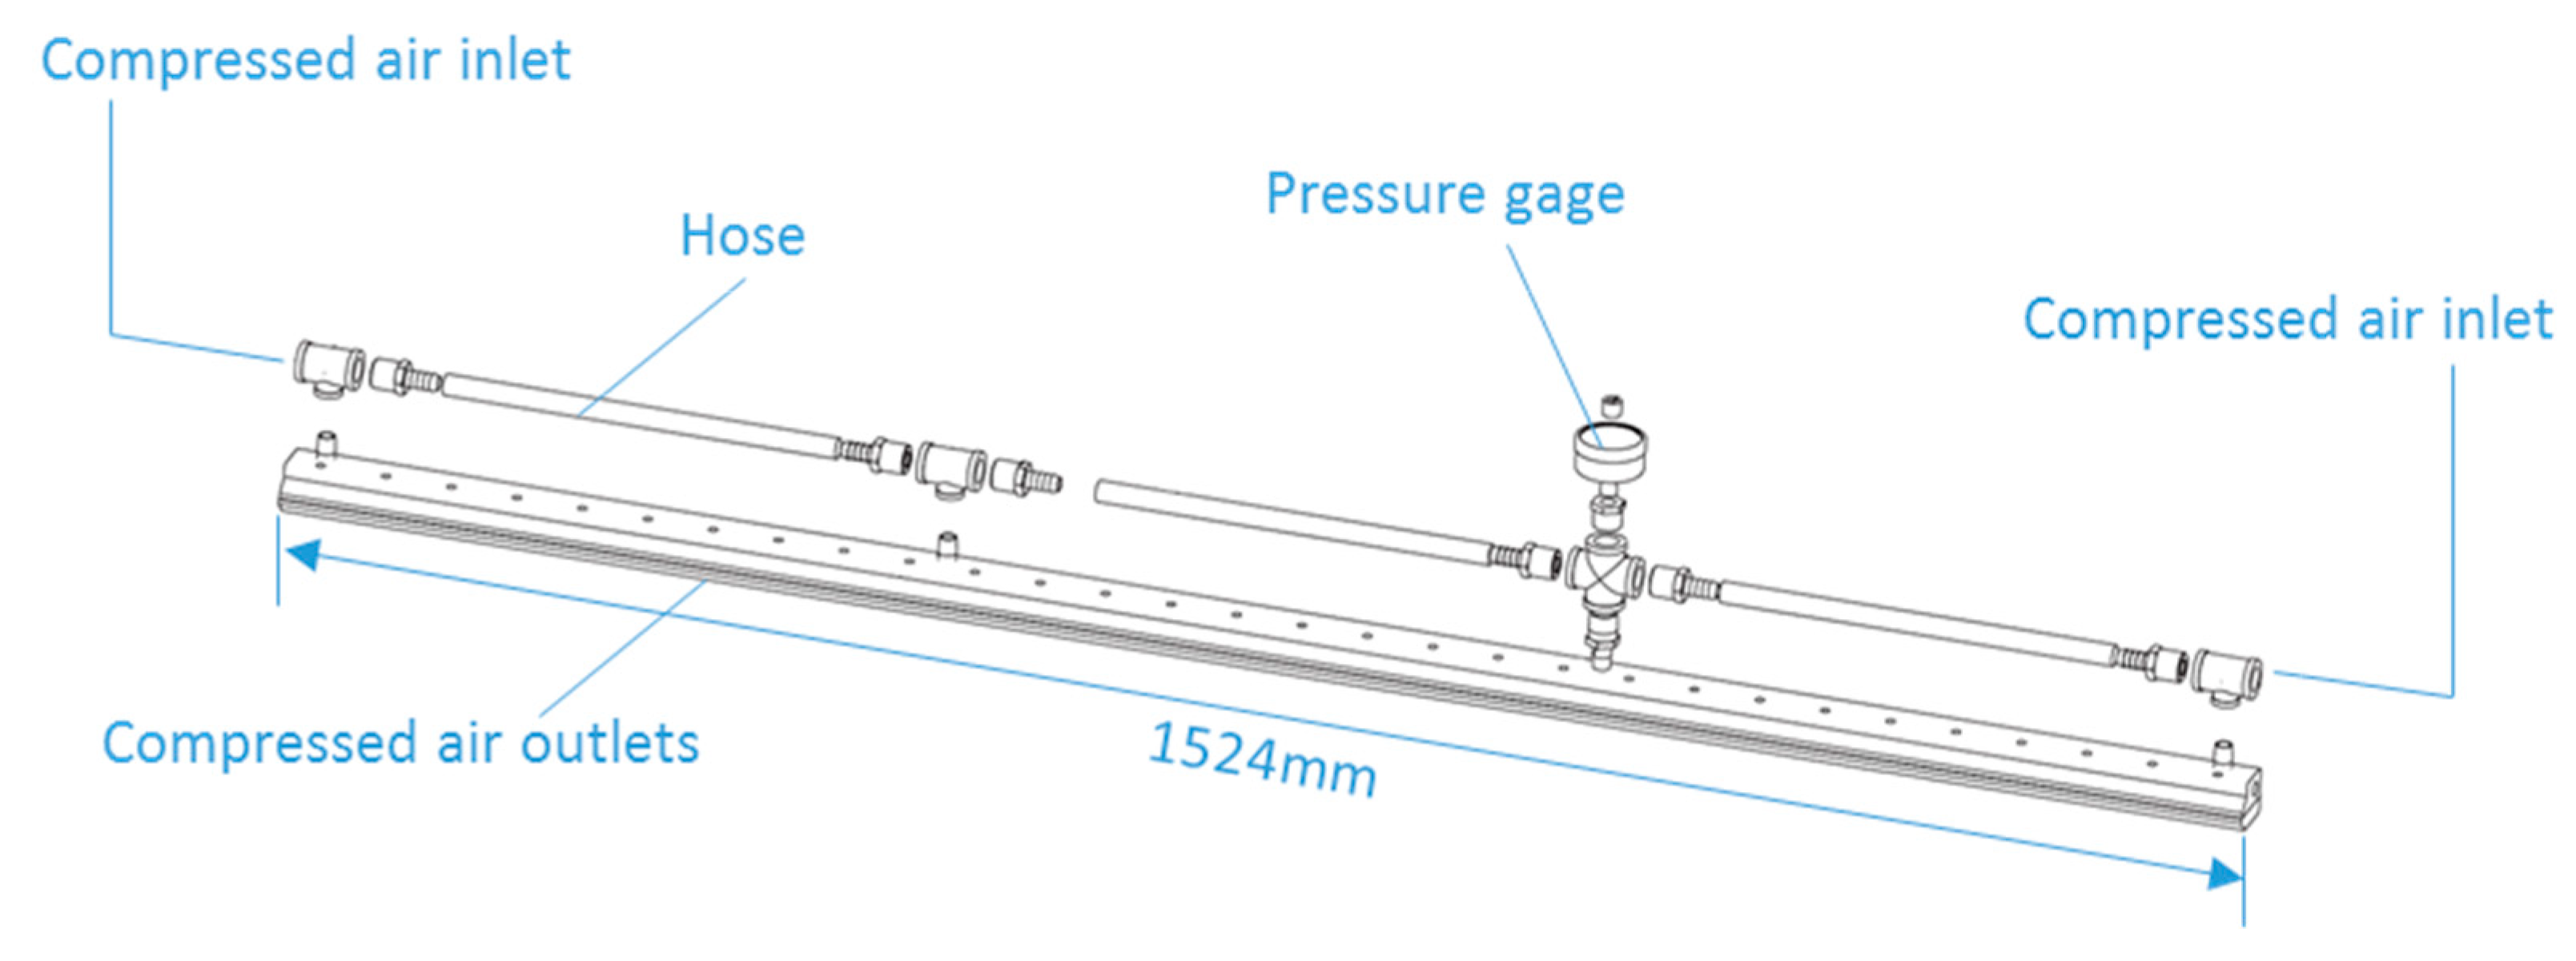
There is a paucity of information on using pressurized air to clean solar PV modules. To address this, a compressed air knife unit manufactured by Exair Corporation, model number 9078 (
Figure 11), was used to provide cleaning for the set of modules highlighted in
Figure 6. Each unit has two compressed air inlets, one at each end of the unit, controlled jointly by a solenoid valve and the PLC. The compressed air is then driven through a narrow slot onto the solar modules.
For testing purposes, the compressed air for the system was provided by a mobile compressor providing approximately 0.05 m3/s at 7 bar. In the future, this will be replaced by an electrical compressor powered by the PV system, coupled to a large air receiver.
2.7. Module Vibration System
A series of vibration units were fitted into the back of the modules to test the potential of using vibration as a water-free method of cleaning PV modules, as shown in
Figure 12. Each unit is composed of a 12 V electric motor and an unbalanced weight, in a waterproof case. Prior to the installation on site, a range of vibration motors were tested in the laboratory trial mentioned earlier, where the performance of the motors at different speeds and weights was tested. It was found that the best motor speed was in the range of 6000 to 8000 RPM, and heavier weights produced stronger motion of sand particles. Moreover, it was also observed that (i) each PV module will require more than three motors working simultaneously to remove dust and (ii) fixing motors loosely enhanced the vibration effect due to the direct hammer impulse of the case striking the panel. As a result, each PV module assigned to vibration test was fitted with five vibration motors, which are installed on the back of the modules (
Figure 6). These five motors were mounted at each of the four corners and one in the centre of the module.
2.8. Data Acquisition and Control
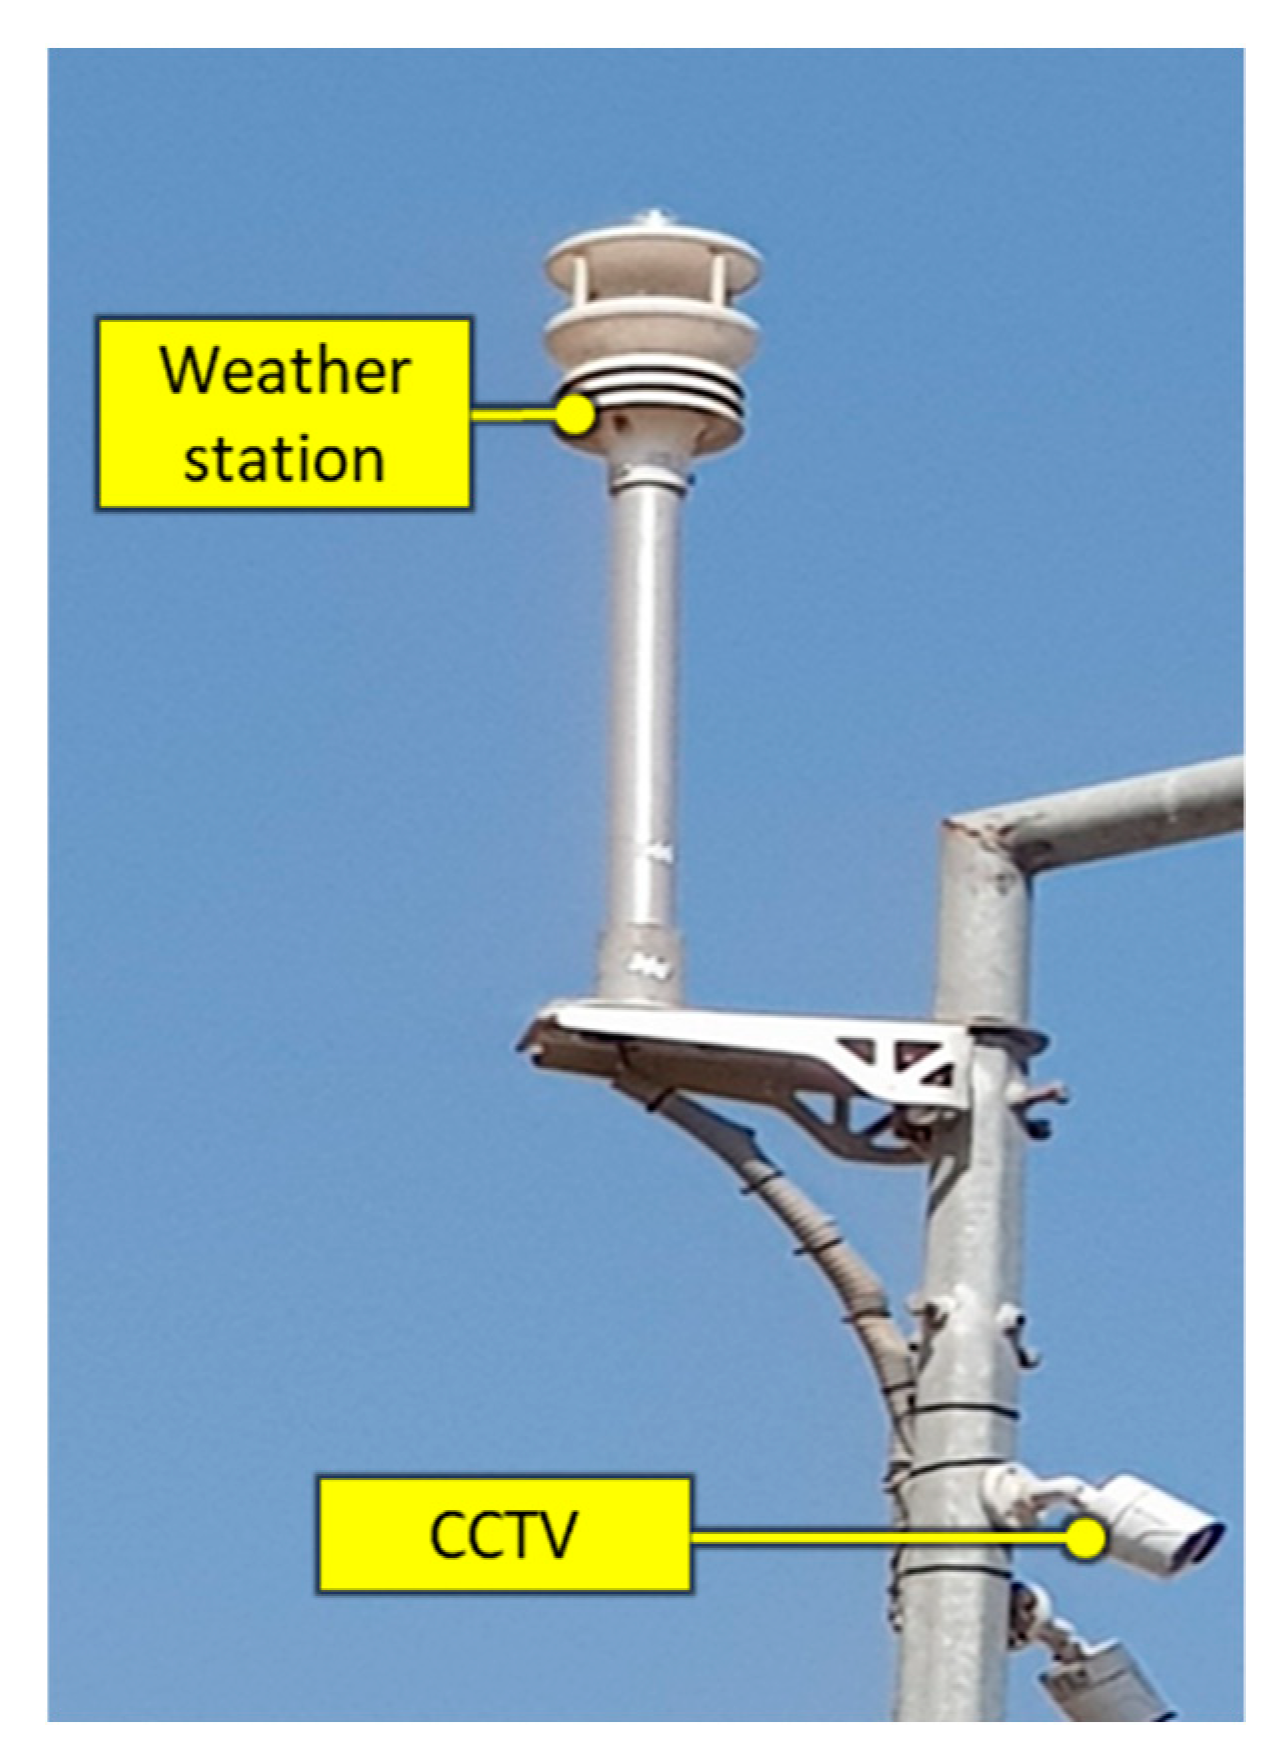
A Gill Maximet 501
® (Gill Instruments Limited, Lymington, UK) weather station (
Figure 13) was installed at 6 m above ground level in order to (a) record relevant variables relating to PV performance and dust accumulation and (b) to provide a signal to control the switching on of the dump load when the PV current drops below optimum for given irradiance. The weather variables measured at two-minute intervals include air pressure, temperature, relative humidity, wind speed, wind direction, and irradiance.
The electrical variables (string currents and voltages), along with the water tank depth and water meter are logged at 1-min intervals by the Datataker® DT85M (Thermo Fisher Scientific Ltd, Waltham, MA, USA) data-logger networked with a Raspberry Pi (Raspberry Pi Foundation, Cambridge, UK), in turn allowing secure two-way communications with a cloud-based server. The weather station communicates with the data-logger over an SDI-12 bus.
In order to visually monitor the system remotely, 4 CCTV cameras with 5-megapixel resolution (Swann Platinum Digital HD, SWNVK-474502, Swann Communications Pty. Ltd., Victoria, Australia), have been installed on the site providing live streaming to the project portal (
Figure 3 and
Figure 13). The cameras were fixed on two of the car park lampposts (5 m high), allowing a clear visual range for monitoring the PV panels and the carport system. The CCTV cameras were also linked to a digital video recorder (DVR) which is connected to the system router, where images of the carport can be viewed live or played back remotely. The DVR has the capacity of recording views for 80 days onto the 1 TB hard disk. The cameras are able to obtain clear views of the PV and cleaning systems, as well as the functionality of various cleaning methods. In addition to the quantitative measurements and testbed local observations, these networked cameras provide online imagery to allow qualitative comparison of dust build-up on the different sets of PV modules.
2.9. Cleaning System Installation Configuration and Control
Programmed cleaning routines were established encompassing single and multiple intervention combinations, which are controlled through the data logger. In order to detect the effectiveness of the various cleaning modes employed to clean dust build-up on any of the strings (other than the control), the cleaning programs are run on alternate days, as indicated in
Table 1.
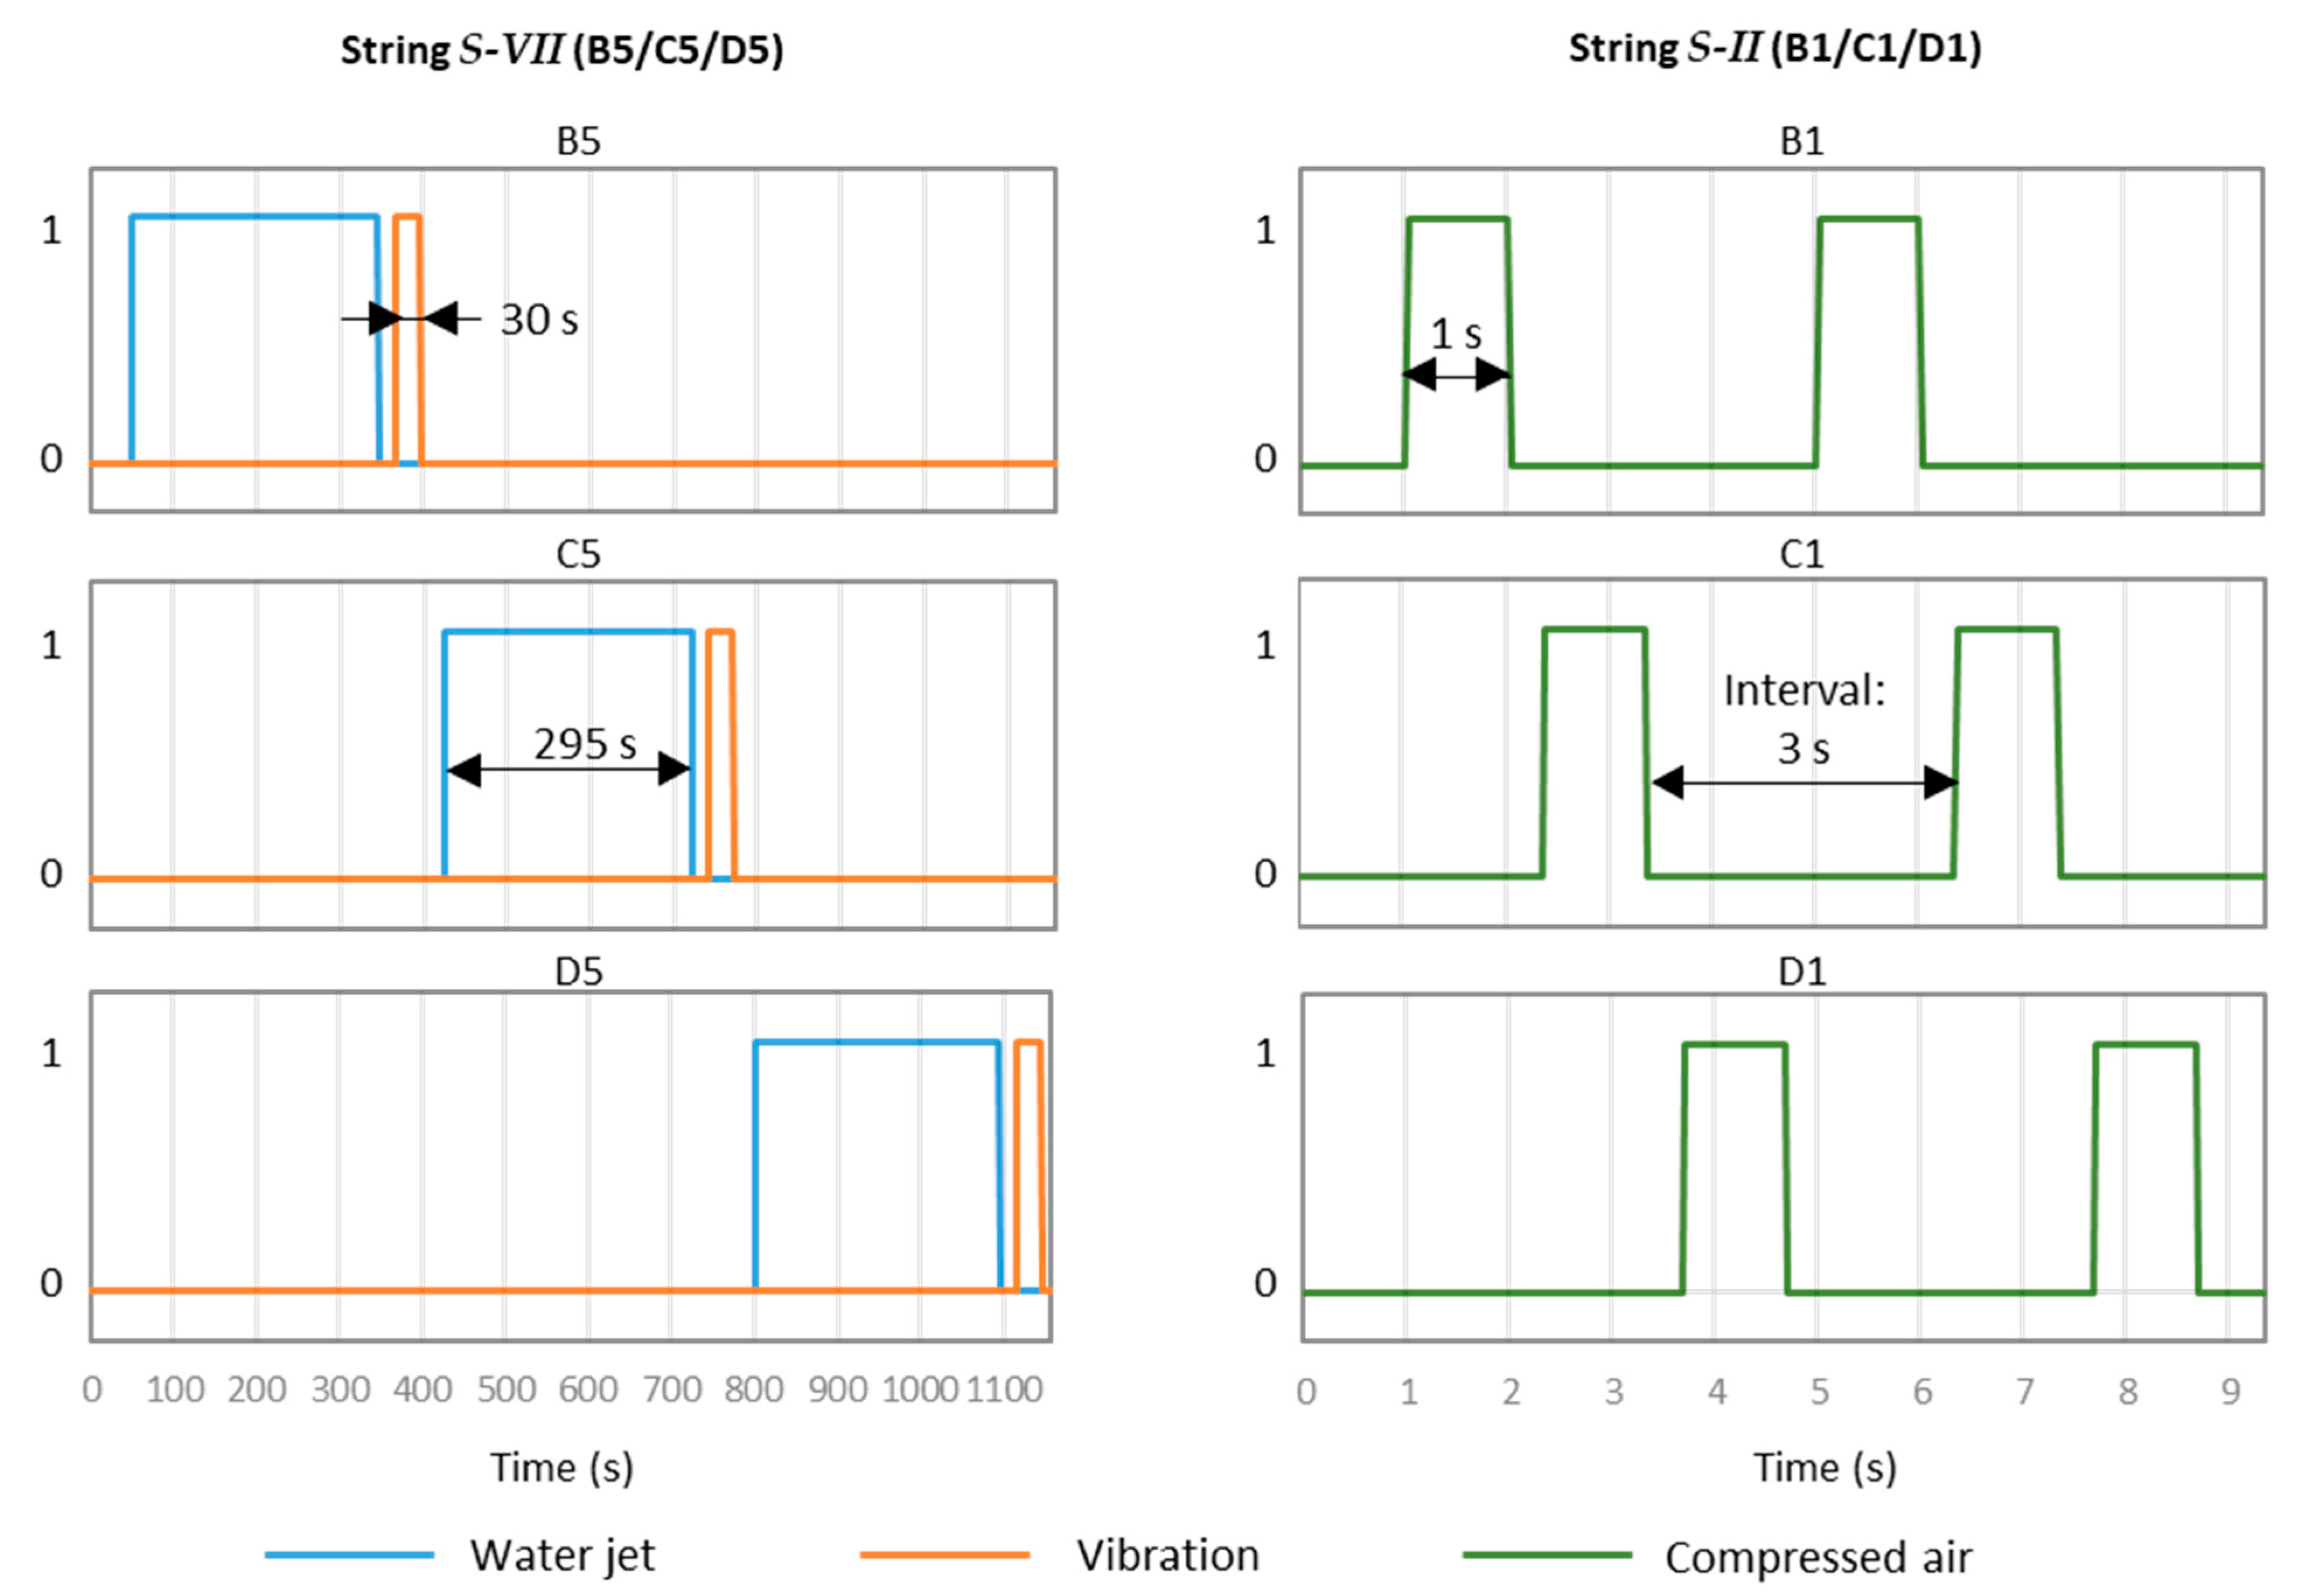
The operation of cleaning modes can be individually controlled by a programme that is designed to provide flexibility of applying options of cleaning modes—including a manual setup at the control panel. For example, the programme in
Figure 14 provides a combination of two cleaning modes (vibration and water jets) for the string
S-VII comprising the PV modules B5, C5, and D5. Each vibration pulse lasts 295 seconds (~5 minutes), followed by a water jet pulse of 30 seconds. The sequence of vibration and water jet cleaning is designed to maximise the removal of dust, as the effectiveness of the water jets is enhanced after dust has been mobilised and loosened by vibration. In addition, the cleaning programme is initiated in sequence from top downwards, as shown in
Figure 14, where the water jet and vibration pulses for C5 only started after the cycle for B5 was completed.
The compressed air cleaning programme for the string
S-II, comprising B1/C1/D1, is also shown in
Figure 14. Each compressed air cleaning pulse lasts around 1 second due to the capacity of the compressed air system. The length of compressed air cleaning operations is also chosen by taking into account the complexity of physical processes involved in removing particles from surfaces such as PV modules, which is an active area of research [
26]. Particles require a threshold of shear stress before they will move, and this will depend on the micro-level properties of the particles and PV module surface and the level of humidity. The key variable of the effectiveness of the cleaning system is air pressure, but the nature of turbulent and coherent fluctuations in air velocity have also been shown in the literature to have a significant effect on particle removal [
26]. The duration of the air pulse is less significant, as air velocities of the order of tens of m/s mean that the time for a particle to cross a PV module, once it has passed the threshold of motion, is extremely short. Therefore, in practice, the duration of the pulse is more likely to be limited by the available air supply and the control system, and longer pulses would be unlikely to improve cleaning effectiveness.
4. Summary and Future Work
This work reported on the design philosophy for an automated cleaning system for PV modules subjected to the harsh desert environment of Saudi Arabia. The system is based on multiple cleaning mechanisms including vibration, air and water, and some combinations of these. The system was equipped to collect the cleaning water for subsequent reuse and installed on a carport canopy in the campus of King Abdulaziz University, Jeddah, Saudi Arabia. The overall system was established as a testbed to investigate the performance of various cleaning systems that were designed to remove dust from solar PV modules.
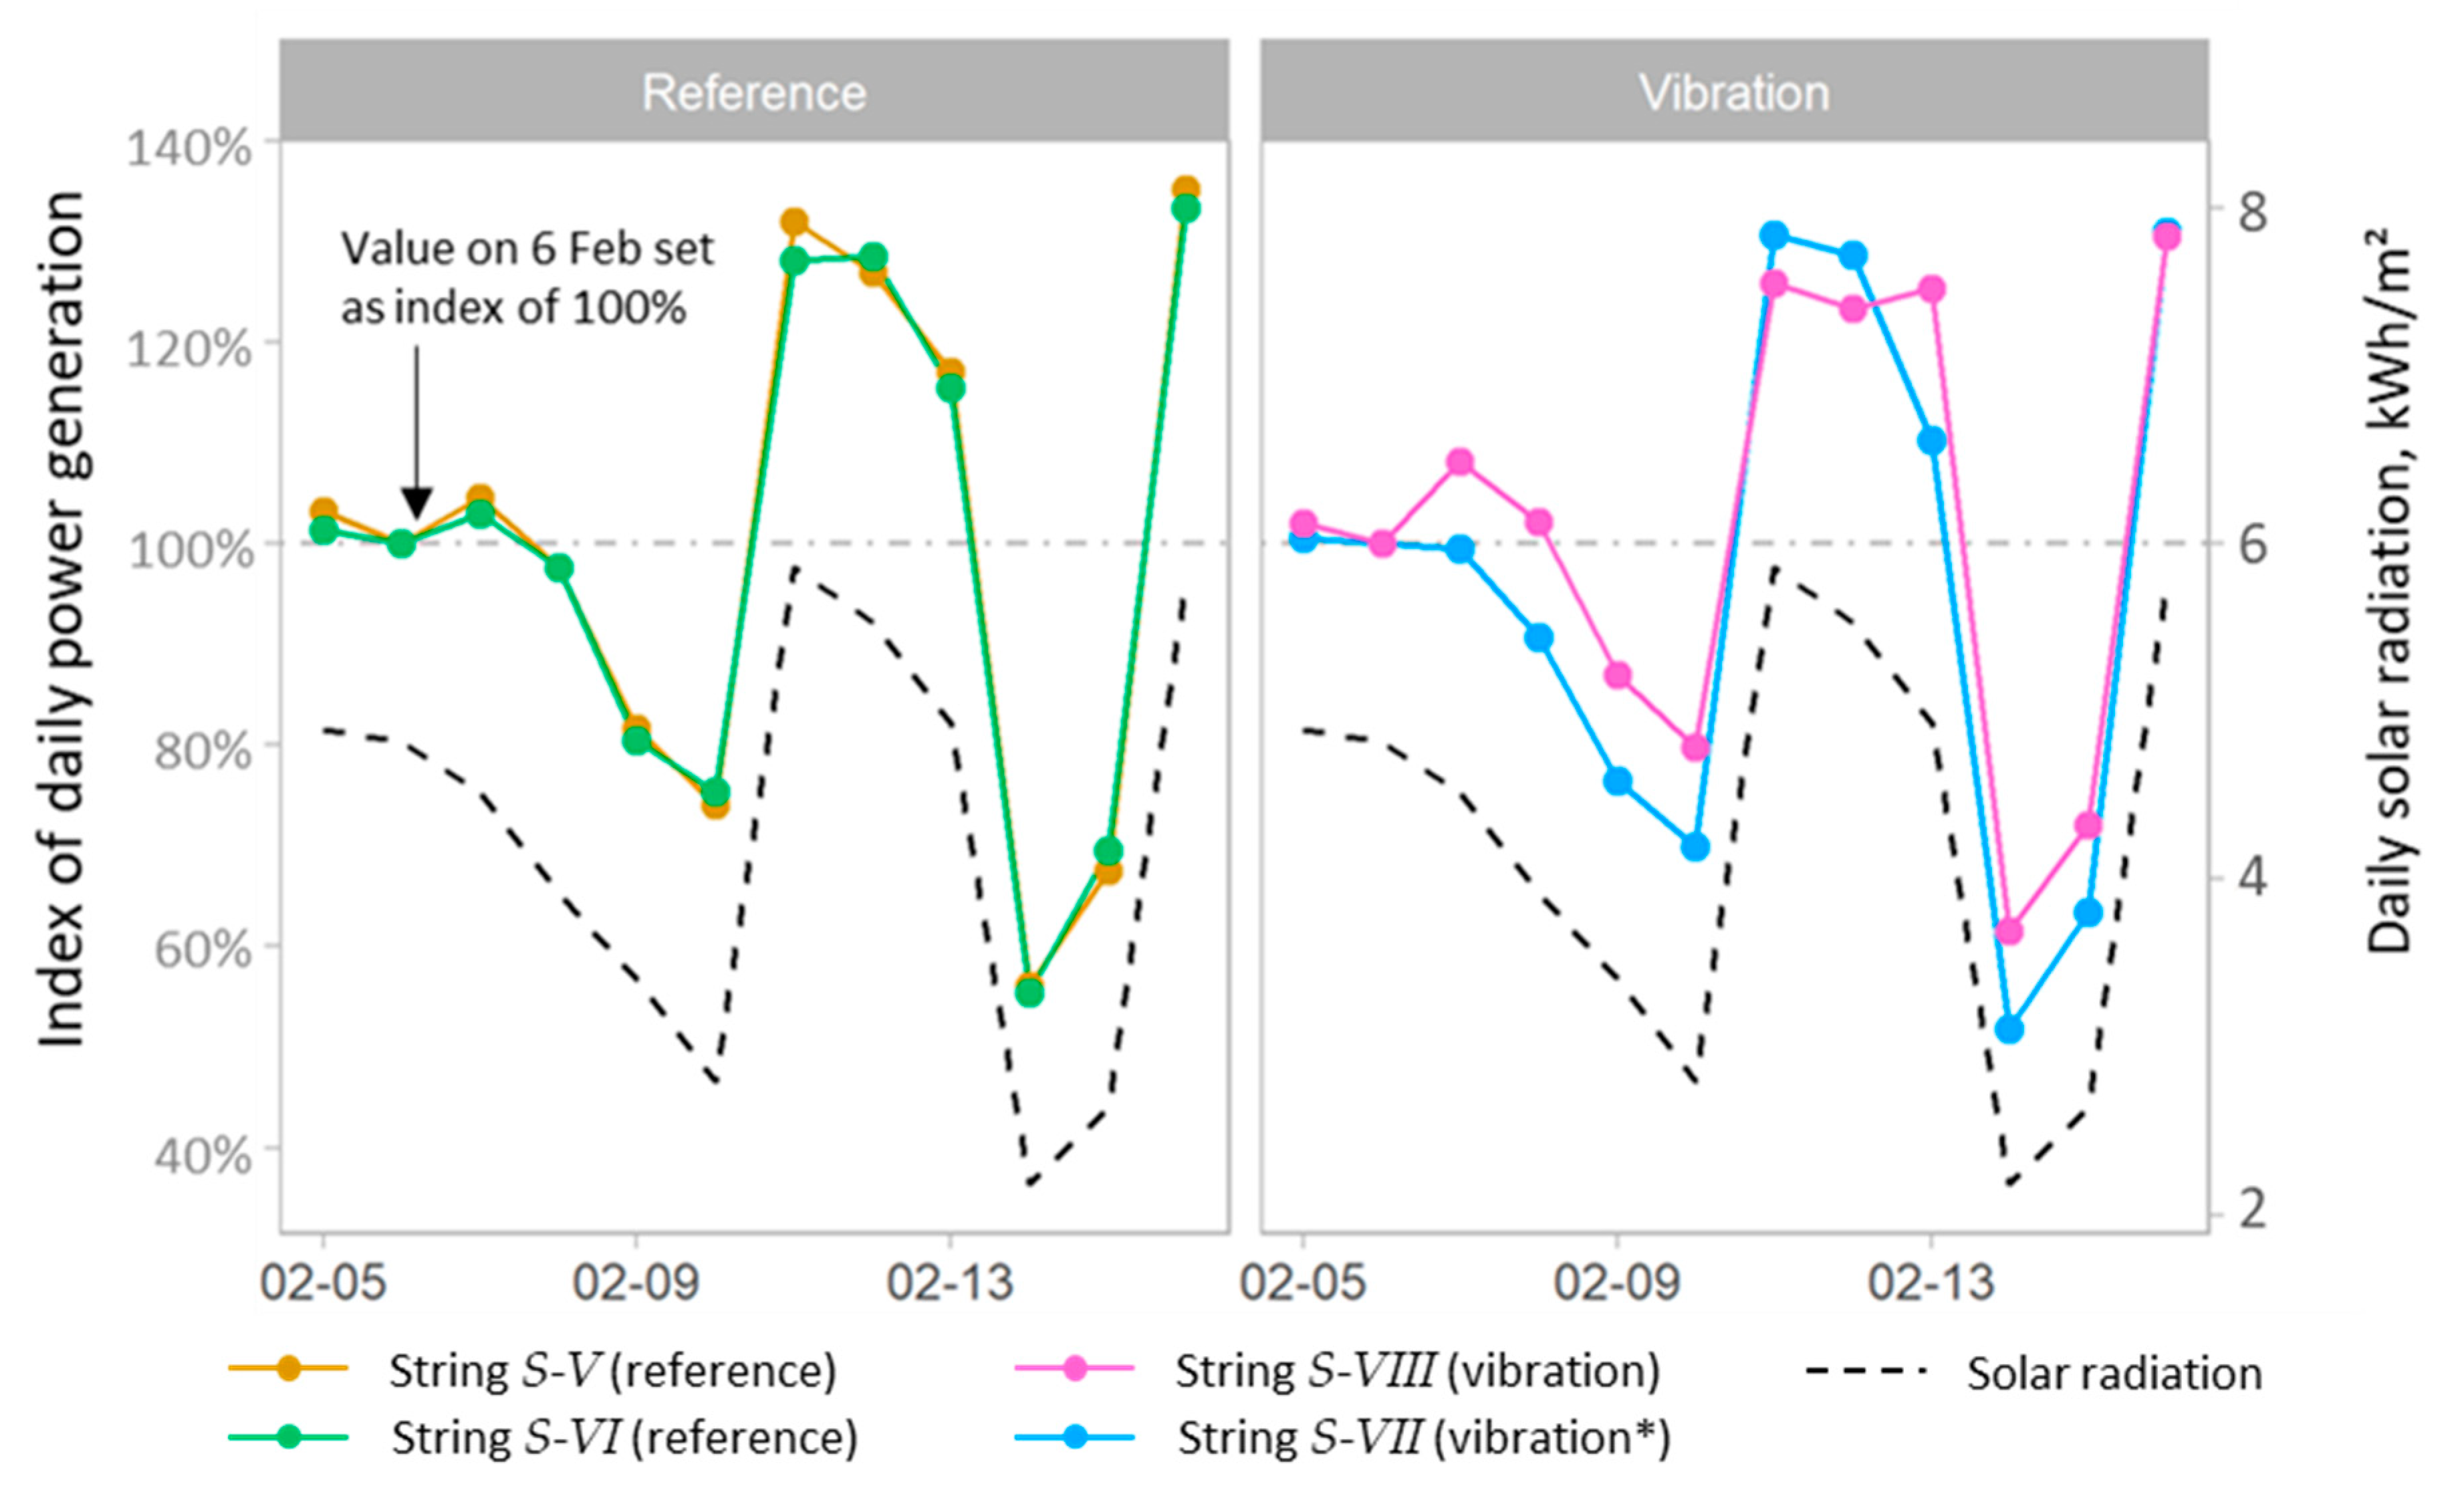
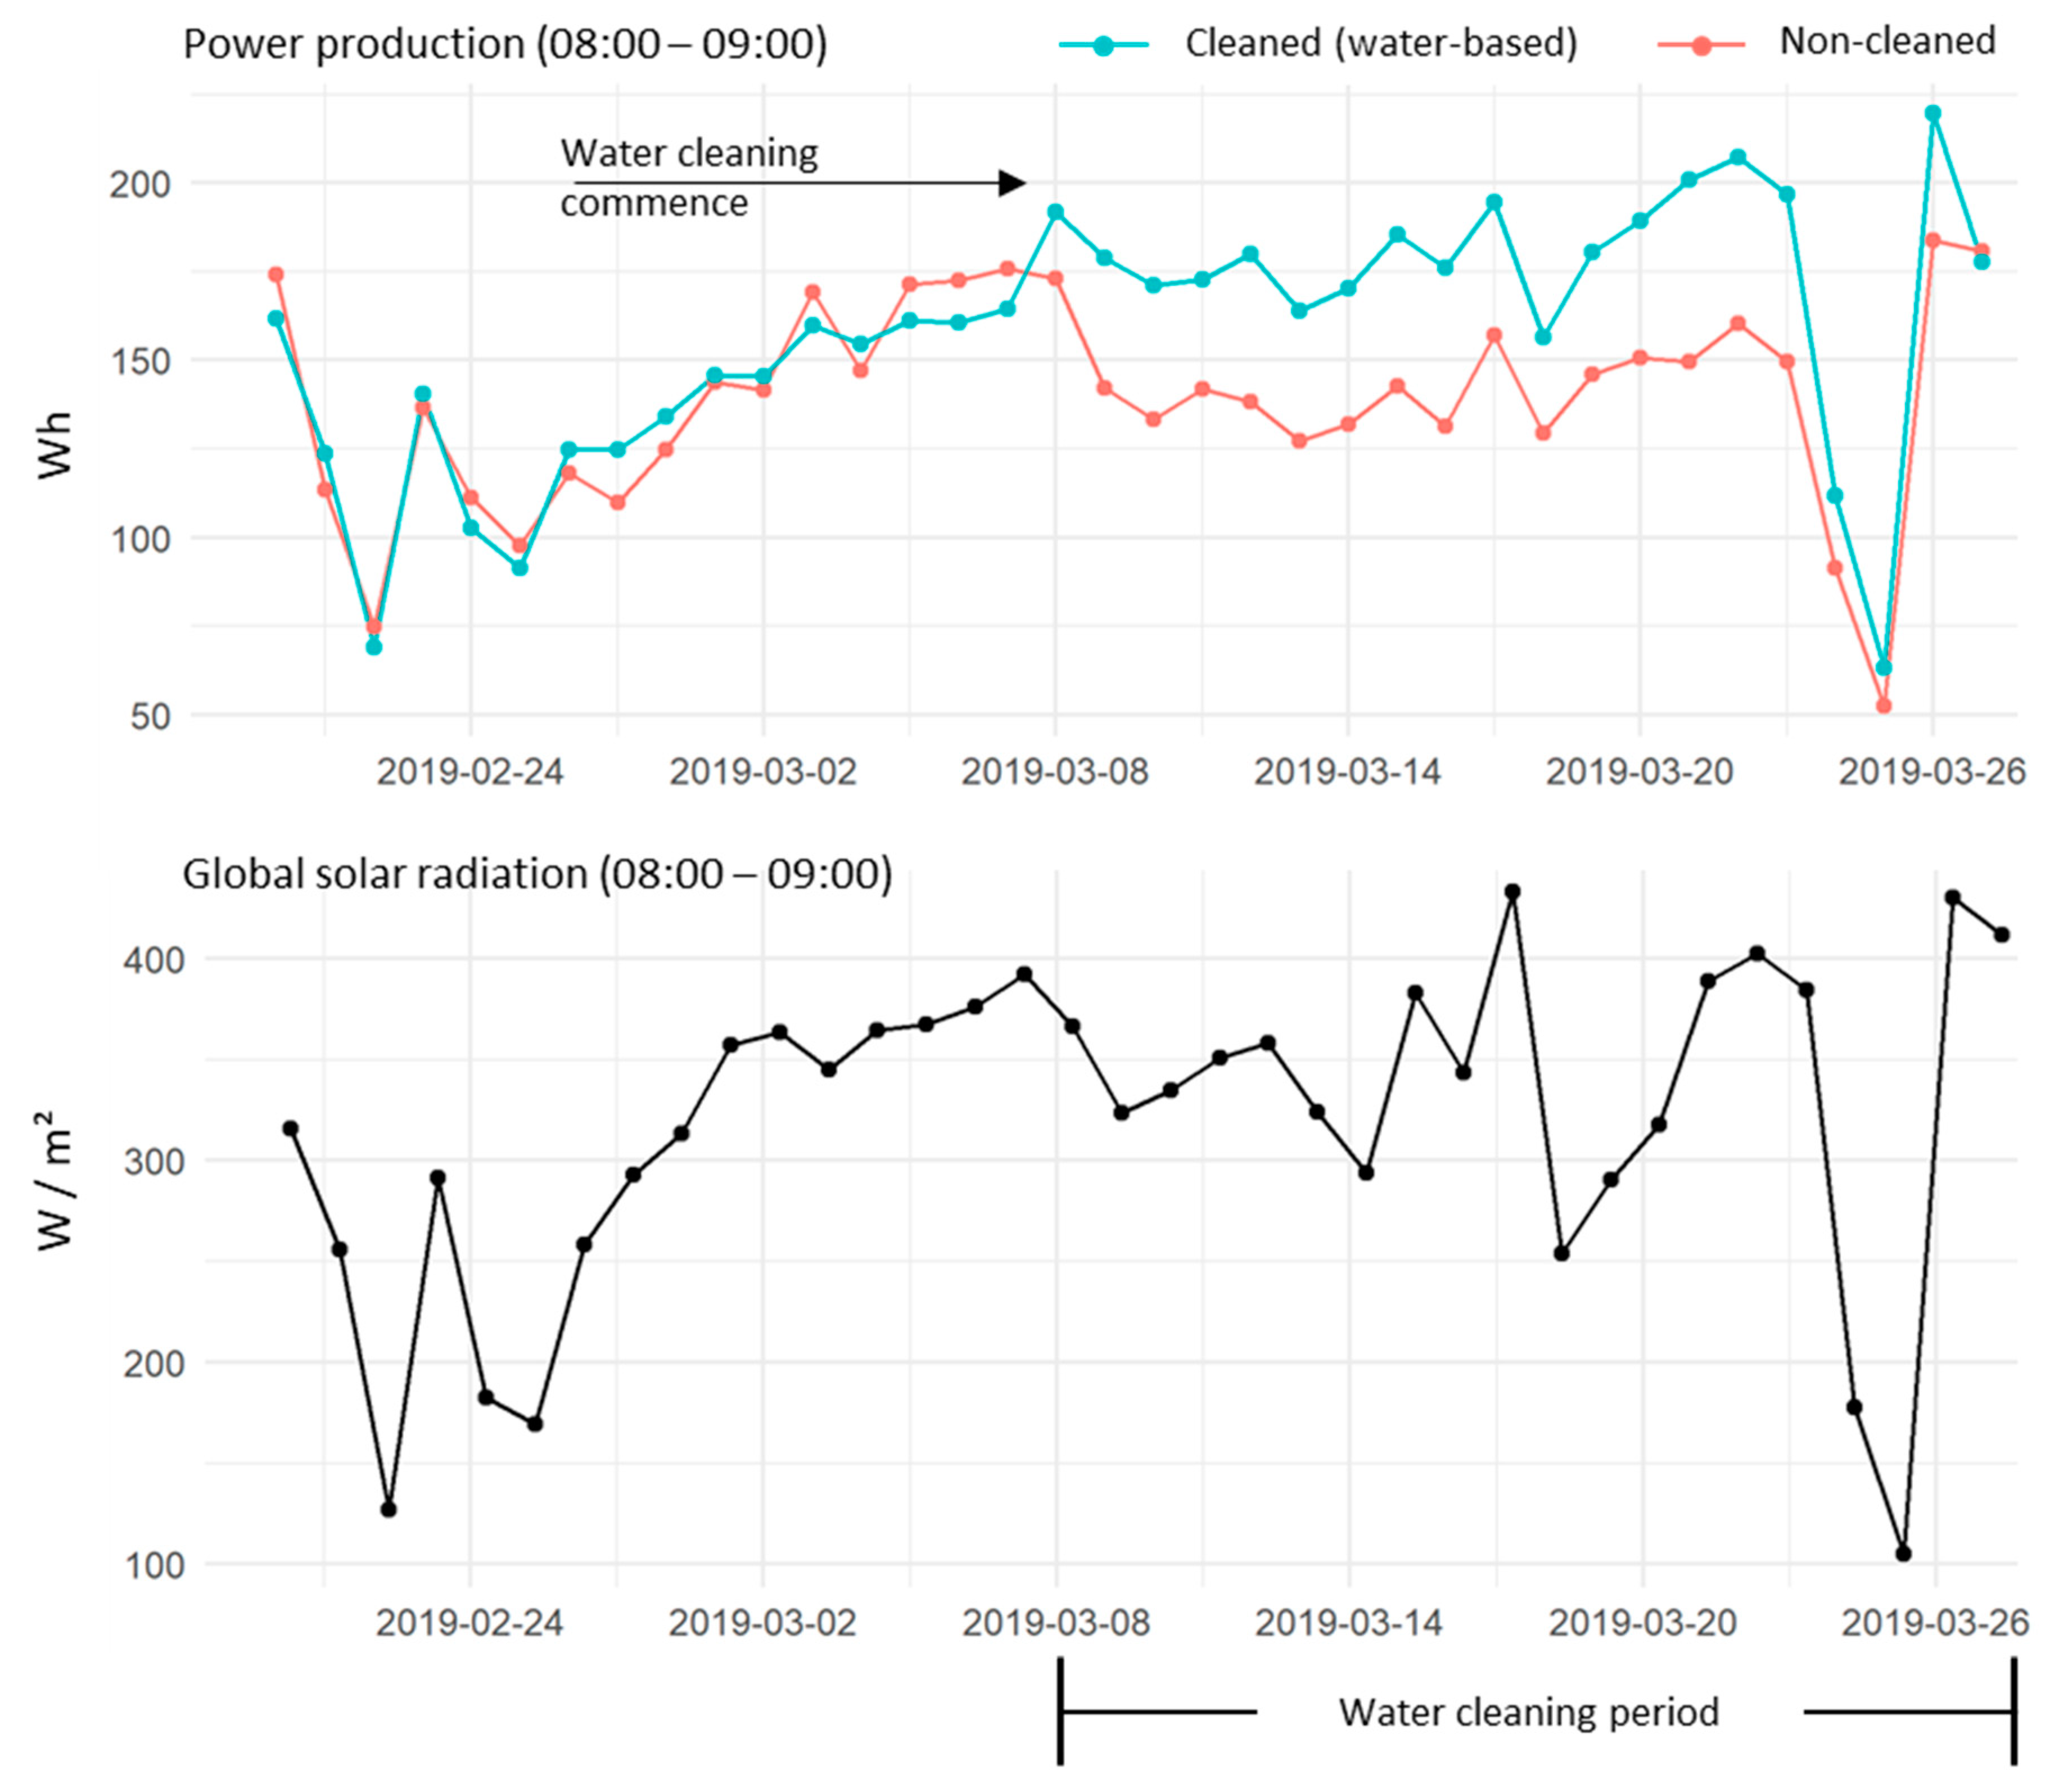
To allow performance analysis of PV power output, eight individually instrumented PV strings in the array were monitored with multiple cleaning methods tested during the same time period. The effectiveness of each cleaning mode was measured in terms of the amount of power produced in comparison with reference strings (control) of PV modules. The results indicate that for water-cleaning mode only, string power output increased by an average of 27% (
Figure 16) compared to non-cleaned, but otherwise identical, strings for the same period of time.
The vibration cleaning mode was not observed to have a significant effect on the performance degradation due to soiling versus the reference panels. The compressed air was not able to be fully trialled due to the use of the temporary air compressor, which did not provide enough continuous air capacity to undertake longer testing. A new air system is currently being designed with further cleaning mode combinations, which will be tested in the future.
Overall, the testbed has provided a new approach to testing a combination of cleaning solutions in the field. Its aim is to identify appropriate combination of cleaning modes to inform the ongoing expansion of PV projects currently being built or planned for the future in Saudi Arabia. These studies will provide the evidence needed to support yield optimisation in large PV arrays through quantifying the efficiency improvements from the cleaning approaches. Furthermore, the testbed has the capacity for additional cleaning units to be added, allowing four more cleaning methods to be tested. These include using blades or PV module surface coatings, integrated pipework and air jets, and new vibration systems. The testbed is providing opportunities for studies of optimised cleaning approaches of solar PV arrays and comparing their performance under the Saudi/Middle Eastern weather conditions, such as sandstorms and humidity. The configuration of the setup and parameters used for the system will be further tested and optimised to identify approaches that would improve dust removal effectiveness and efficiency.
To extend the scope of cleaning mechanisms, more cleaning methods will be tested on the developed solar system to conduct further assessments. This would include (1) combination of vibration and pressurized air, (2) electrostatic dust removal systems, and (3) nanofilm coating. The feasibility of installing additional monitoring equipment, such as high-frequency wind velocity monitoring and visual inspection system to quantify and compare dust soiling, will also be investigated.


