Article

An Air Pollutant Emission Analysis of Brazilian Electricity Production Projections and Other Countries

by
Rafaella de Souza Henriques
1,2,*,
Rodney Rezende Saldanha
1,3 and
Lineker Max Goulart Coelho
4
1
Graduate Program in Electrical Engineering—Universidade Federal de Minas Gerais—Av. Antônio Carlos 6627, 31270-901 Belo Horizonte, MG, Brazil
2
Department of Applied Social Sciences—Centro Federal de Educação Tecnológica de Minas Gerais—Av. Amazonas, 7675, 30510-000 Belo Horizonte, MG, Brazil
3
Department of Electrical Engineering—Universidade Federal de Minas Gerais—Av. Antônio Carlos 6627, 31270-901 Belo Horizonte, MG, Brazil
4
Department of Civil Engineering—Centro Federal de Educação Tecnológica de Minas Gerais—Av. Amazonas, 7675, 30510-000 Belo Horizonte, MG, Brazil
*
Author to whom correspondence should be addressed.
Energies 2019, 12(15), 2851; https://doi.org/10.3390/en12152851
Submission received: 1 July 2019 / Revised: 19 July 2019 / Accepted: 20 July 2019 / Published: 24 July 2019

Abstract

:
In the face of the population’s growing awareness about environmental degradation, air pollutant emissions from electricity production become a very relevant issue. Therefore, the present work aims to evaluate the greenhouse gases (GHG), NOx and SO2 emissions in the Brazilian electricity production, using the expected capacity expansion from Ten-Year Energy Expansion Plan-2027, the current installed capacity of power generation and the electrical load factor. This study was based on data provided by official institutions that are responsible for the electricity sector as well as academic studies of the area. In order to obtain a better analysis of the most likely air pollutant emission values bounds, a Monte Carlo simulation was performed. In addition, the 2017 energy production emissions from Brazil, France, China, and the USA were evaluated and compared. The results indicate that non-renewable sources of energy have a negative environmental impact. In general, the emissions of CO2-eq and NOx per MWh are increasing according to Brazilian energy generation projections, but when compared with global indicator Brazil has an affordable electricity mix in terms of air pollutant emissions.

Graphical Abstract

1. Introduction

1.1. Motivation

According to IEA (International Energy Agency) [1], in 2018 the world’s electricity generation sources were divided into 38% of coal, 23% of natural gas, 19% of hydroelectric and other renewable sources, 10% of nuclear power plants, solar and wind participate together with 7% and 3% of electricity were produced from oil. In 2017, Brazil was the eighth country in the world’s electricity production, with almost 585 TWh [2]. In the same year, the production of Brazilian electricity from renewable sources accounted for almost 80% of the total [3].
According to the report of the Brazilian Electricity Regulatory Agency (BERA) [4], relating to the power plants in operation, hydroelectric plants are still the main source of electricity in Brazil, with 218 projects, which represent 60.18% of installed capacity. On the other hand, the thermoelectric plants totalize 25.80% of the installed power that are distributed among 3001 projects. In addition to hydroelectric and thermoelectric power plants, small hydroelectric plants (SHP) are also part of the electricity mix, with 3.19% of installed capacity, the thermonuclear plants, representing 1.24%, and the hydroelectric generating stations, totaling 0.43%.
It is notorious that Brazil stands out concerning the use of renewable sources of electricity generation when compared to the world scenario. This can be attributed mainly to propitious geographic and hydrological conditions for hydroelectric implementation. However, since this source is dependent on the rainfall cycle, it is necessary to analyze the diversification of energy production.
Actually, the different compositions of the electricity mix do not only influence the availability and cost of energy, but also present a crucial role in environmental protection. Although electricity is a pre-requisite for an efficient and continuous supply of basic human needs, the production and consumption of electricity can result in adverse environmental consequences [5].
In fact, with the growing public awareness of environmental degradation, another relevant issue regarding the production of electricity is the air pollutant emissions caused by this activity. Obviously, energy sources and their shareholdings are decisive in this respect. Therefore, the composition of the power generating park should also be evaluated considering this aspect. Indeed, several studies highlighted the influence of electricity mix strategies on environmental protection [6,7,8,9,10].

1.2. Literature Review

1.2.1. The Brazilian Electric Sector

The Brazilian electricity sector (BES) is made up of a regulatory body, BERA, an operator of the National Electricity System (ONES) and a set of active institutional agents that enable the purchase and sale of electricity [11]. Several changes occurred in the BES from 1996. According to [12], in the old model, there were predominantly state-owned companies that were responsible for the generation, transmission, and distribution of electricity. The activities linked to the sector formed a monopoly since all the consumers were captive and the market was completely regulated.
With the new BES model, the electric power companies were divided according to the segment: Generation, transmission, and distribution. Thus, there was more competition in generation and commercialization with the implementation of auctions. In addition, institutions that are responsible for the commercialization, regulation, and research of electric energy were created [12]. With these changes in the BES, the decree n° 5.163/04 was also established which sets up two spheres for commercial relations of the current model: The regulated contracting environment (RCE) and the free contracting environment (FCE).

1.2.2. The Generation of Electric Energy in Brazil

According to [13] and Electric Energy Commercialization Chamber (EECC) [14], the most common sources of electricity in Brazil are:
  • Biomass: The generation of electricity from biomass provides the conversion of the raw material into an intermediate product that will be used in a power machine which will trigger the electric power generator. Any organic matter that can be transformed into mechanical, thermal or electrical energy is classified as biomass. It can be forestal, agricultural, urban or industrial waste;
  • Fossil: Fossil fuels are used for the generation of electric energy in thermoelectric plants. Through chemical combustion reactions, products such as natural gas, coal and oil release energy. The steam produced in the burning is used to move the turbines that are connected to generators, producing electric energy;
  • Wind: Wind energy is produced by the movements generated during the contact of the wind with the wind vane blades that are elements of the plant. When rotating, these blades give rise to the mechanical energy which drives the rotor of the aero generator that produces the electricity;
  • Hydro: Hydropower is generated by the movement of the water flow in a turbine. In order to classify plants with hydro source, BERA has adopted three classifications: Hydroelectric generating stations (with up to 1 MW of installed capacity), small hydroelectric plants (between 1.1 MW and 30 MW of installed capacity) and hydroelectric power plant (with more than 30 MW);
  • Nuclear: Nuclear energy is obtained through the fission of uranium in the nuclear reactor. There, the nucleus of the atom is subjected to a fission process to generate heat that warms the water inside the reactors in order to produce the steam which moves the turbines, generating the electric energy;
  • Solar: Solar energy comes to Earth and it is captured by photovoltaic cells (photovoltaic panels) which generate electricity.

1.2.3. The Air Pollutant Emissions in the Electric Energy Generation

According to [15], the most relevant air pollutants are CO, CO2, H2S, NOx, O3, SOx, hydrocarbons and other oxidants. According to [16], greenhouse gases (GHG), NOx, and SO2 are the most relevant related emissions from the electricity sector due to their contribution to several critical life cycle assessment (LCA) impact categories and to their importance in decision making and strategic planning.
The CO2 is a greenhouse gas, and it is known as the worst pollutant. In order to analyze the several greenhouse gases’ impact on global warming, the CO2-eq is widely used. It represents the environmental impact of one tone of the greenhouse gases in comparison to the impact of one tone of CO2. According to [17], several studies were dedicated to assessing the environmental impacts of greenhouse gases emissions from electricity generation [18,19,20,21]. Indeed, in [22] a review study that reported 120 papers on the theme of greenhouse gases emissions from electricity generation is presented. Despite being the eighteenth world economy, Brazil takes the eleventh place in the ranking of nations for greenhouse gas emissions due to energy production and consumption [23]. This fact is attributed to the composition of the Brazilian electricity mix, which has a large share of renewable sources. Regarding the electricity generation, in 2017 the world average of emissions was 484 g of CO2 per kWh [1], whereas in Brazil the emissions were 104 g of CO2 per kWh [24]. It is estimated that this amount will be maintained by the incentive for the permanence of renewable sources in the Brazilian electricity mix.
Concerning NOx and SO2, these emissions are related to acidification and eutrophication issues. Actually, emissions of NH3, NOx, and SO2 are largely responsible for acidification which is the process of pH reduction in aquatic or terrestrial environments due to the uptake of acid compounds. In addition, emissions of NOx and NH3 also cause eutrophication, which is the process of nutriments enrichment of an ecosystem, normally related to nitrogen and phosphorus. According to [25,26], a significant majority (75%) of the world’s NH3 anthropogenic-related emissions comes from agriculture and animal waste, whereas the energy sector (heat and electricity) is responsible for only 6% of NH3 releases [27]. On the other hand, the contribution of the energy sector to the global emissions of NOx and SO2 is very relevant, representing 19% and 56% of overall NOx and SO2 emissions, respectively [28]. The contribution to greenhouse gases emissions from electricity production is even more important, corresponding to 45% of total anthropogenic releases [29]. Then the GHG, NOx, and SO2 emissions provide a reasonable analysis for the most relevant air pollutant emissions from electricity generation activity.

1.3. Goals, Contributions, and Paper Organization

Thus, the present work aims to evaluate the GHG, NOx, and SO2 emissions in the Brazilian electricity production, analyzing the current configuration for installed capacity and the projections up to the year 2027. In other words, the main goal of this paper is to assess relevant air pollutant emissions of Brazilian electricity generation based on the official installed capacity plan for the next years. For such, this study was based on data provided by institutions from the electricity sector, as well as academic studies from this area. In order to produce better limits analysis of the most probable values of air pollutant emissions in the time horizon, a Monte Carlo simulation was performed using the Oracle Crystal Ball application. For a better analysis, this work evaluates and compares the pollutant emissions for the 2017 energy production from Brazil, France, China, and the USA.
The main contributions of this paper are:
  • Defining and analyzing future scenarios for Brazilian energy production;
  • Proposition of a procedure to consider uncertainty in pollutant emission for energy production projections based on a Monte Carlo simulation, determining narrower limits which are most likely to occur and better characterize reality;
  • Projecting emission bounds of the most relevant pollutants from electricity sector according to future Brazilian electricity mix scenarios considering official and current data which was provided by the responsible institution of the country (Energy Research Office (ERO));
  • Providing directions on electricity mix strategies to minimize pollutant emissions;
  • Performing a comparison among different countries, highlighting the influence of electricity mix strategies on air pollutant emissions.
In the next section, the methodology of this study is described. Finally, the results and discussion are presented and analyzed together with a Monte Carlo simulation. After, the conclusions of the study are made.

2. Methods

For this study, the following steps were performed:
  • Characterization of the objectives of the study;
  • Data collection and processing;
  • Air pollutant emission calculations;
  • Monte Carlo simulation.
For a better understanding of the study, hereafter these methodological steps will be detailed.

2.1. Characterization of the Object of Study

The installed capacity for Brazilian electricity generation is composed of: Hydro (60.77%), fossil (14.98%), biomass (8.62%), wind (8.57%), nuclear (1.16%) and solar (1.13%), with 4.77% of import [30]. For the first two sources of energy, biomass and fossil, there is a subdivision considering the energy origin, called level 1 sources. For imports, there is no differentiation per energy source.
For biomass, the sources of level 1 are materials with agro-industrial origin (6.74%) and forestry (1.88%). For the former, the shares of sugarcane bagasse (6.69%) and rice hulls (0.03%) are notorious. For the latter, black liquor is the largest participant (1.51%), followed by forest residues (0.24%).
Considering the energy generated from fossil fuels, natural gas (7.73%) and petroleum (5.82%) are the most important sources for level 1. The first is subdivided into process heat (0.02%) and natural gas itself (7.71%). For petroleum, there are five subdivisions, with emphasis on fuel oil (2.41%) and diesel oil (2.61%).

2.2. Data Collection and Processing

To carry out the air pollutant emissions analysis of the Brazilian power generation park the following information was required:
  • Current installed capacity of Brazilian electricity mix;
  • The GHG, NOx, and SO2 emission rate from electricity generation by energy source;
  • Installed capacity projections by energy source for the next years;
The energy production and installed capacity for the same period.
In this paper, reports from institutions of the Brazilian energy sector were used as a data source. After data collection, they were processed using Microsoft Excel worksheet. At the beginning of this study, the data from the Brazilian power generation park were necessary. These data were obtained in terms of installed capacity by source [30], excluding the imported energy, as it is an international production and it is not discriminated by source. In Table 1 it is possible to verify this information.
Further, minimum and maximum values of GHG, NOx, and SO2 emission rates per MWh by source were obtained from [16]. In this study, an effort was made to adopt emission ranges, as these values can vary according to raw materials’ composition and energy efficiency. In Table 2, the obtained values are presented. For GHG, the emission rates adopted in this study include CO2, CH4, and N2O emissions and were expressed in Kg CO2-eq, as presented in Table 2.
Concerning the considered activities in the emission rates adopted in this research, as reported in [16], for each electricity generation source the pollutant emission rates comprise: Fuel provision from the extraction of fuel to the gate of the plant, plant operation, including maintenance and waste disposal, and infrastructure (commissioning and decommissioning). Particularly, according to [16] methane emissions from hydropower reservoirs are included in the emission rates used in this study. More details about the determination of the emission rates are provided in [16].
In order to verify the air pollutant emissions scenario to the next years, this study strives to find installed capacity projections by source. These data were obtained in [31], from the evolution of the installed capacity by electricity source. In this document, the projections were provided in terms of installed MW. It is important to note that the later Ten-Year Energy Expansion Plan was made available in 2018 and we observed minor differences among the current capacity and the capacity projected to 2019. Thus, this study considered two installed capacity projections from 2019 to 2027:
  • Data Set A: The evolution of the installed capacity for the electricity mix which was made in [31], Table 3;
  • Data Set B: The projection of the actual installed capacity for the electricity mix [30], considering the percentage variation evolution obtained in [31], Table 4.
Other data group required by this work was the energy generation. The most recent information available about Brazil’s electricity production is from 2017, provided by [3]. This was called Data Set C and shown in Table 5. It is possible to see that almost 80% of the energy was produced by renewable sources.
To complement details for the Data Set C, the next information collected for this work was the installed capacity for the year 2017 [3]. Table 6, called Data Set D, details the installed capacity per source in 2017 and also shows the majority of renewable sources.
To build the Projection 1, firstly, the average electricity load per source for the year 2017 was calculated based on Data Set C. After, using the Data Set D, the electrical load factor was calculated. Assuming that the electrical load factor for each source would not change over the years, it was possible to calculate the electricity load per source from 2019 to 2027 using the Data Set A. Then, considering the total hours for each year the energy projection was calculated. The Projection 2 was obtained in an analogous way, just substituting the Data Set A for B.
In order to compare different electricity mix generations, the energy production from France [32], China [33] and the USA [34] were added to this study. These countries were chosen because they present an electricity mix quite different from Brazil. Table 7 presents the countries’ energy generation for the year 2017.
It is important to note that USA energy production from Geothermal source was disregarded because emission data for this process was not found. In addition, the category named as “Other” was not considered because there was not a single source of generation which makes impossible to classify the plant. These energy productions represent only 0.71% of the total generation, so their omission in the study does not present significant changes for the analysis.

2.3. Air Pollutant Emission Calculations

From the information aforementioned, this study focused on electricity generation releases of GHG, NOx, and SO2 due to the importance of these emissions to environmental protection, particularly, to the electricity sector. With the installed capacity projections and based on the data of minimum and maximum values of GHG, NOx, and SO2 emission rates per MWh by source, this study strives to achieve the air pollutant emissions from the year 2019 to 2027. Since there is a range of values for the pollutants emissions described in Table 2, values of minimum and maximum emissions were obtained for each pollutant using Projection 1 and Projection 2, considering the maximum output of electricity that the generators can produce under ideal conditions.
Considering the same emission rates from Table 2 and the 2017 energy productions from Brazil, France, China, and the USA presented in Table 7, the pollutant emissions for these countries were calculated in order to perform a comparison among different electricity mix strategies.

2.4. Monte Carlo Simulation

In order to evidence limits with higher occurrence probabilities, a Monte Carlo simulation in Oracle Crystal Ball was performed, using the GHG, NOx, and SO2 emissions values per MWh by source presented in Table 2. A Monte Carlo simulation consists of executing several evaluations of the same calculation, but in each evaluation, the input value whose uncertainty is being assessed is randomly changed following its corresponding probability distribution [35]. In this study, Monte Carlo simulation was carried out according to Equations (1)–(3), representing the emission rate variations for each pollutant considered.
E GHG i k = j J E R GHG i j E P j k ,       i I ,   k   K
E NO x i k = j J E R NO x i j E P j k ,       i I ,   k   K
E SO 2 i k = j J E R SO 2 i j E P j k ,       i I ,   k   K
where:
  • J is the set of sources;
  • K is the set of the years;
  • I is the set of evaluations;
  • ERGHGij is the emission rate for GHG for the energy source j in the evaluation i expressed in kg per MWh;
  • ERNOxij is the emission rate for NOx for the energy source j in the evaluation i expressed in kg per MWh;
  • ERSO2ij is the emission rate for SO2 for the energy source j in the evaluation i expressed in kg per MWh;
  • EGHGik is the total emissions of GHG in the evaluation i for the year k, expressed in kg;
  • ENOxik is the total emissions of NOx in the evaluation i for the year k, expressed in kg;
  • ESO2ik is the total emissions of SO2 in the evaluation i for the year k, expressed in kg;
  • EPjk is the energy production for the energy source j in the year k, expressed in kWh.
Although the data collection of this study provides the minimum and maximum air pollutant emissions values, they represent extreme cases. The work from [16] has used pollutant emission factors from several studies in order to obtain the values presented in Table 2. The authors from [16] use three aspects for analyzing the pollutant emission from electricity generation: Fuel provision, power plant operation, and infrastructure. Thus the work used a sum of random variables to obtain the ranges of values presented in Table 2. According to [36] the variable resulting from a sum of random variables converges to a normal or approximate normal distribution. Therefore, this study will consider that the pollutant emissions of Table 2 follow a normal distribution to perform the Monte Carlo simulation.
The variation of the values from Table 2 was assumed a normal distribution, in which the range from minimum and maximum values comprises 99.7% of the possible pollutant emissions quantities and the average is centered in this range. Table 8 shows the average and standard deviation of these values. The emission rates for each evaluation were obtained considering a normal distribution and the parameters are presented in Table 8.
To obtain lower and upper bounds of pollutant emissions, a simulation with 100,000 evaluations to the annual emissions values from 2019 to 2027 for each pollutant and each energy projection was performed. Moreover, 80% of the highest occurrence values was considered, excluding 10% of each tail of the final histogram. These decisions were made with the aim of providing the emission bounds with the highest probabilities of occurrence. From the results of Monte Carlo simulation for the 100,000 evaluations, the Crystal Ball application built frequency graphs. Since the simulations encompass nine years of electricity production (from 2019 to 2027), three different pollutant emissions (GHG, NOx, and SO2) and two projection scenarios (Projection 1 and Projection 2), a total of 54 histograms were generated.

3. Results and Discussion

3.1. Air Pollutant Emission Projections

The projections of the Brazilian electricity generation are the first results of this study, considering the information obtained in [30,31], respectively. Table 3 and Table 4 show the values obtained for the installed capacity projections. It is noted that the total installed capacity for the year 2019 in Data Set A differs from the current one [30]. Therefore, this study endeavored to obtain a new way of estimating installed capacity over the same period considering the actual installed capacity shown in Table 1. This is the Data Set B. From the procedure described in the last section and considering the Data Set A and B obtained the energy productions from 2019 to 2027, presented in Figure 1: Projection 1 (a) and Projection 2 (b), were obtained respectively.
The energy production from oil, biomass and natural gas sources is lower in Projection 1 than in Projection 2. However, the energy production from hydro, wind and solar sources in Projection 1 is greater than in Projection 2. Thus, it is possible to conclude that the real energy expansion has more non-renewable energy sources participation when compared to the planning (Projection 1), because Projection 2 initiates from the current Brazilian electricity mix.
Both projections indicate a reduction in the percentage of participation for hydro and oil sources in the energy generation, with an increase in the percentage of participation for wind and solar sources along the years. Despite the previously mentioned changes, the Brazilian electricity mix maintains the predominance of renewable sources in its composition, with a percentage greater than 80% through the years.
It is important to mention that electricity production from renewable sources is supported by Brazilian governmental incentives. The Alternative Energy Sources Incentive Program (AESIP), established in 2002, obliges the consumer to purchase energy from wind, biomass and small hydroelectric plants at prices above the marginal cost of expanding the source. These costs are set by the Ministry of Mines and Energy [37]. The transmission and distribution taxes of energy produced from small hydroelectric, wind and solar power plants also have a minimum discount of 50%, called the Incentivized Sources Subsidy. In 2018, the Incentivized Sources Subsidy totaled about US $910 million [38].
After the energy projections, using the values from Table 2, it is possible to establish minimum and maximum values of GHG, NOx, and SO
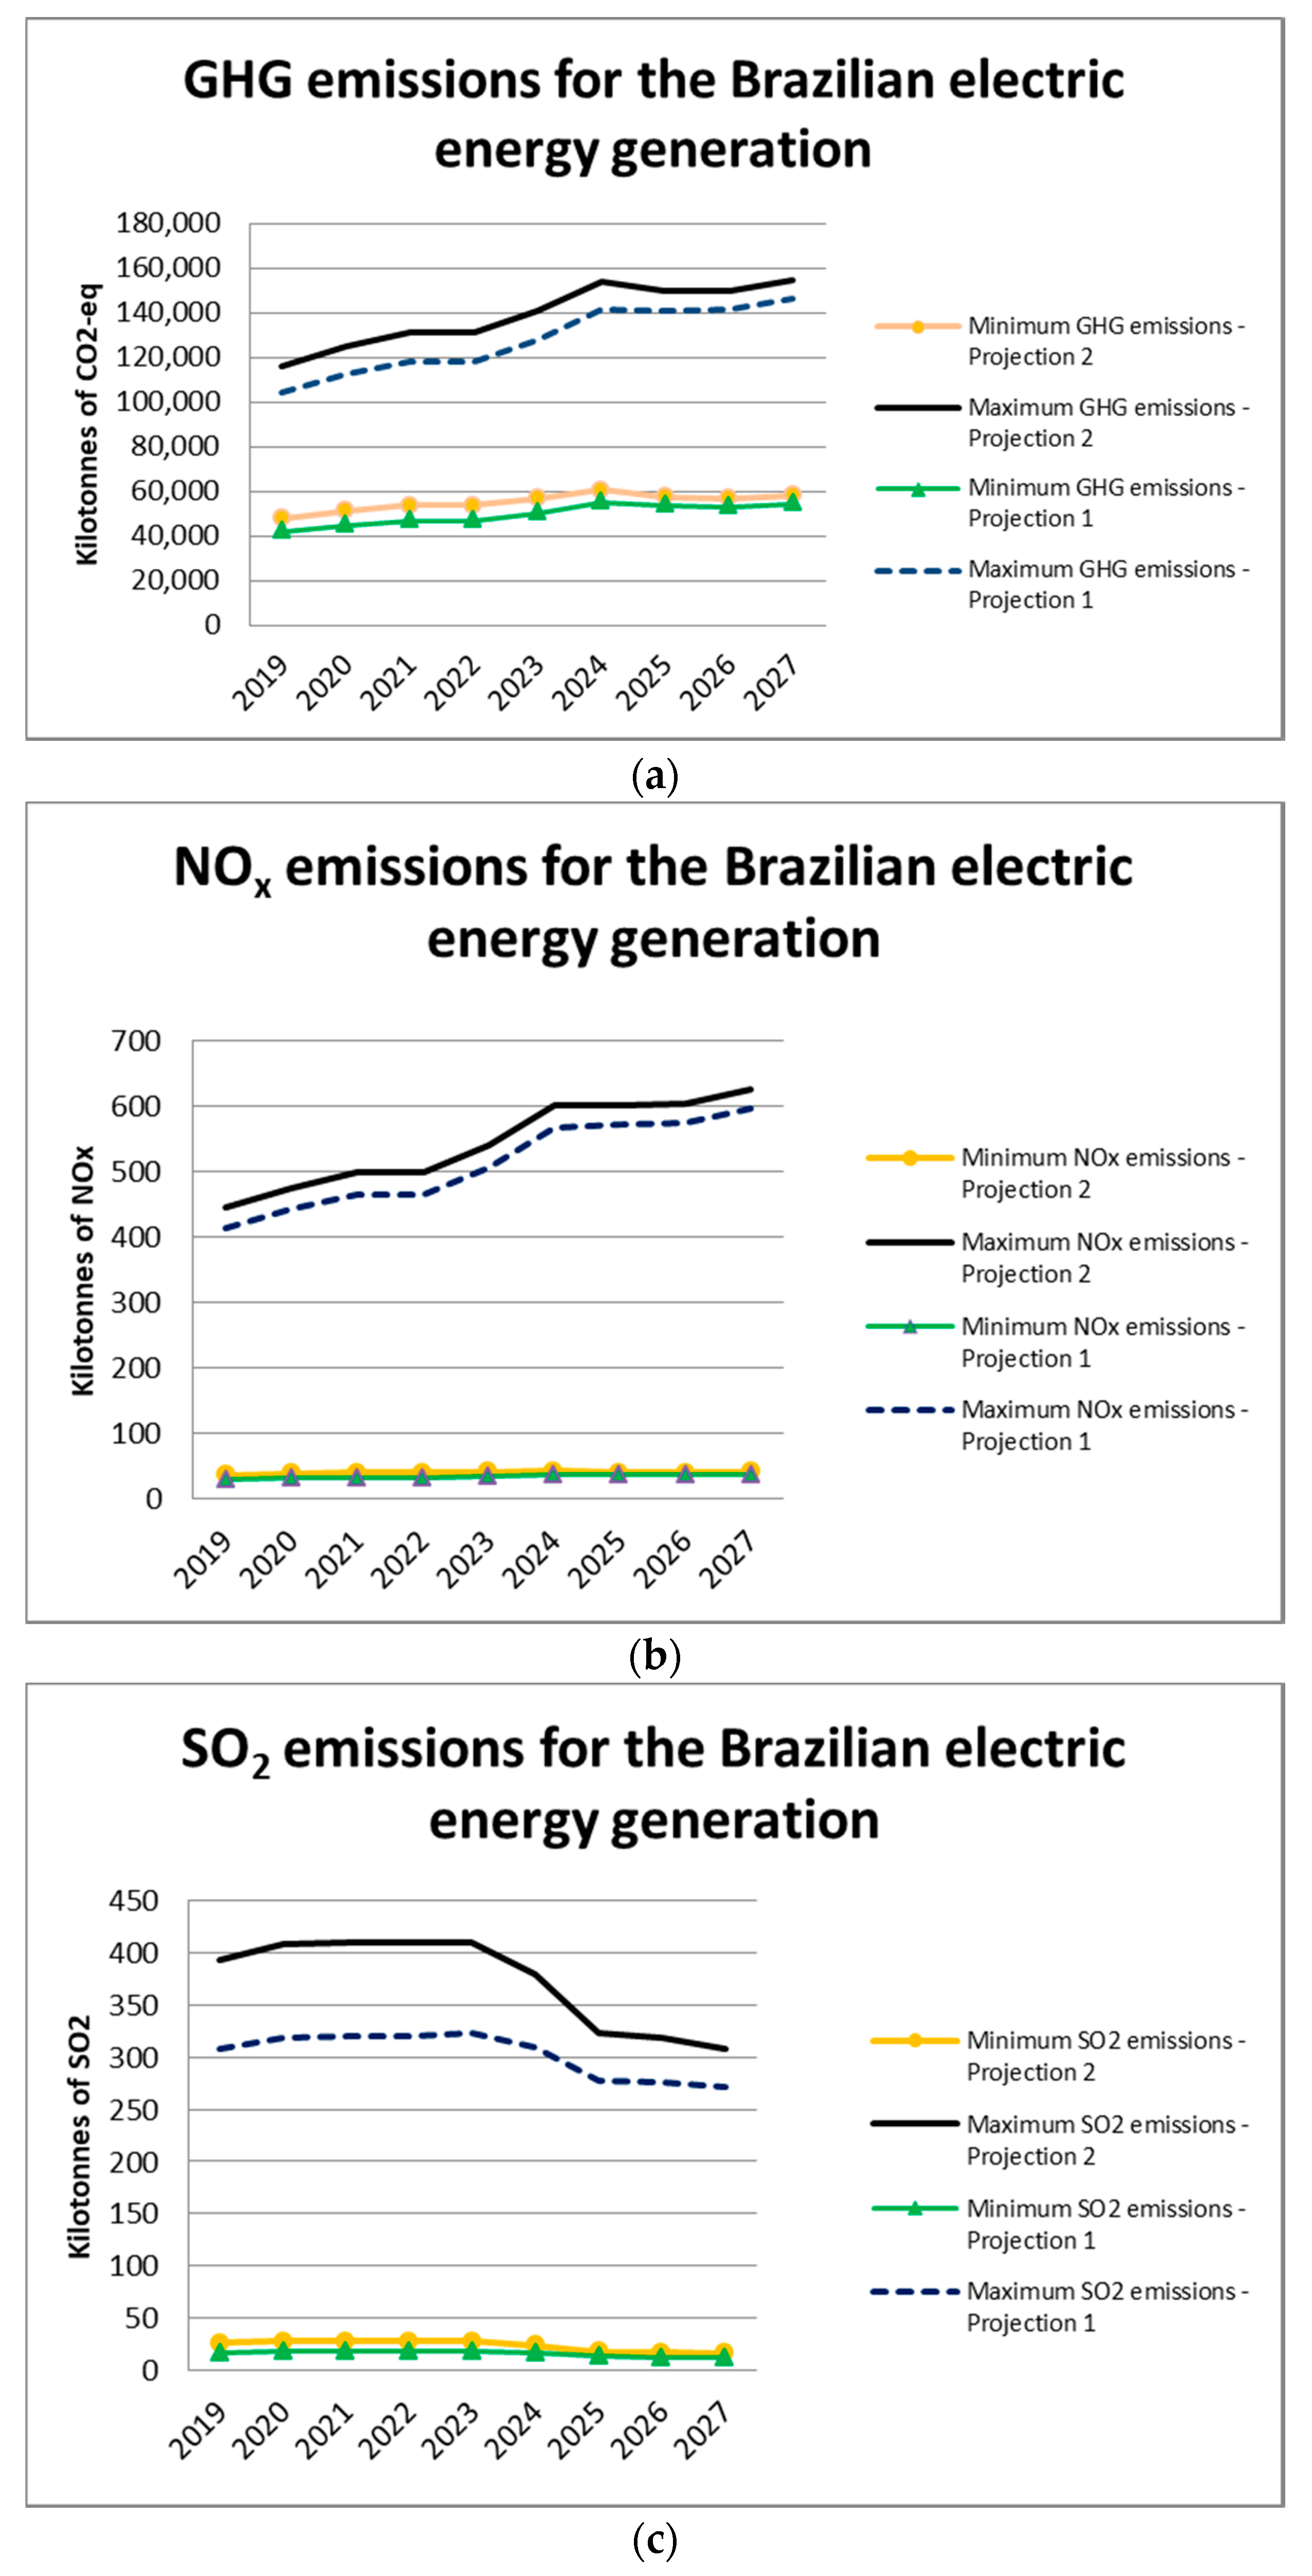
2 emissions per source. In Figure 2, the minimum and maximum of the total GHG, NOx, and SO2 emissions for Projections 1 and 2 are presented. It is worth to mention that the emissions for Projection 2 are always greater than the ones for Projection 1, due to the greater presence of oil and coal sources in the former. These sources present the highest values of air pollutants, as shown in Table 2.
In Figure 2a, it is important to mention that the GHG emission values increase up to the year 2024, then, they decrease slightly and increase again from 2026. It is important to note that the solar and wind sources increase their participation in the production of energy from the year 2024, helping in the decreases of the emission of GHG. The increase can be explained by the installed capacity expansion, with small growths from some sources such as natural gas. However, in 2024, a reduction in the energy provided by oil source is observed.
It is possible to verify in Figure 2b that NOx emission values present an increase along the years, which corresponds to the installed capacity expansion. Figure 2c presents an increase of SO2 emissions until the year 2023, but they decrease considerably from 2024. Similar to the GHG analysis, this increase can be explained by the installed capacity expansion, and the reduction happens with the decrement of the installed capacity of oil sources.
In Table 9 and Table 10 the percentage participation of each air pollutant per source in total emissions, and the percentage composition of the electricity mix, for Projection 1 and 2, are presented respectively. The results show that in both projections, natural gas source is the major factor responsible for GHG emissions, followed by oil and coal sources.
Considering the NOx emissions, the natural gas, oil, coal, and biomass sources stand out in percentage participation in both projections. For SO2 emissions, oil source is the main pollutants for all cases. Indeed, from Table 2 it is noted that oil source presents the highest emission rates of SO2 among all energy sources for both, minimum and maximum limits. Therefore, although oil source has a low percentage of total electricity production (from 1.84 to 3.14%, see Table 9 and Table 10), in terms of SO2 it corresponds to the huge majority of emissions for minimum limit and almost 50% of emissions for the maximum limit. However, Brazilian electricity authorities are looking to implement initiatives addressing this issue.
As presented in [31], installed capacity expansion plan from 2019 to 2027 indicates a substitution of thermal oil power plants by natural gas ones in order to reduce operational costs and decrease SO2 emissions. The intention of Brazilian energy planners is to substitute the offer of almost 3000 MW of thermal electricity from oil source to natural gas one [31]. The natural gas, oil, coal, and biomass sources represent less than 30% of the installed capacity, but they have a large participation in emissions. On the other hand, the hydro, nuclear, wind, and solar sources present low participation in emission for all cases even though they represent more than 70% of the installed capacity. This fact reinforces the importance of reducing the use of thermoelectric plants in the generation of electric energy, in order to reduce air pollution.

3.2. Monte Carlo Simulation

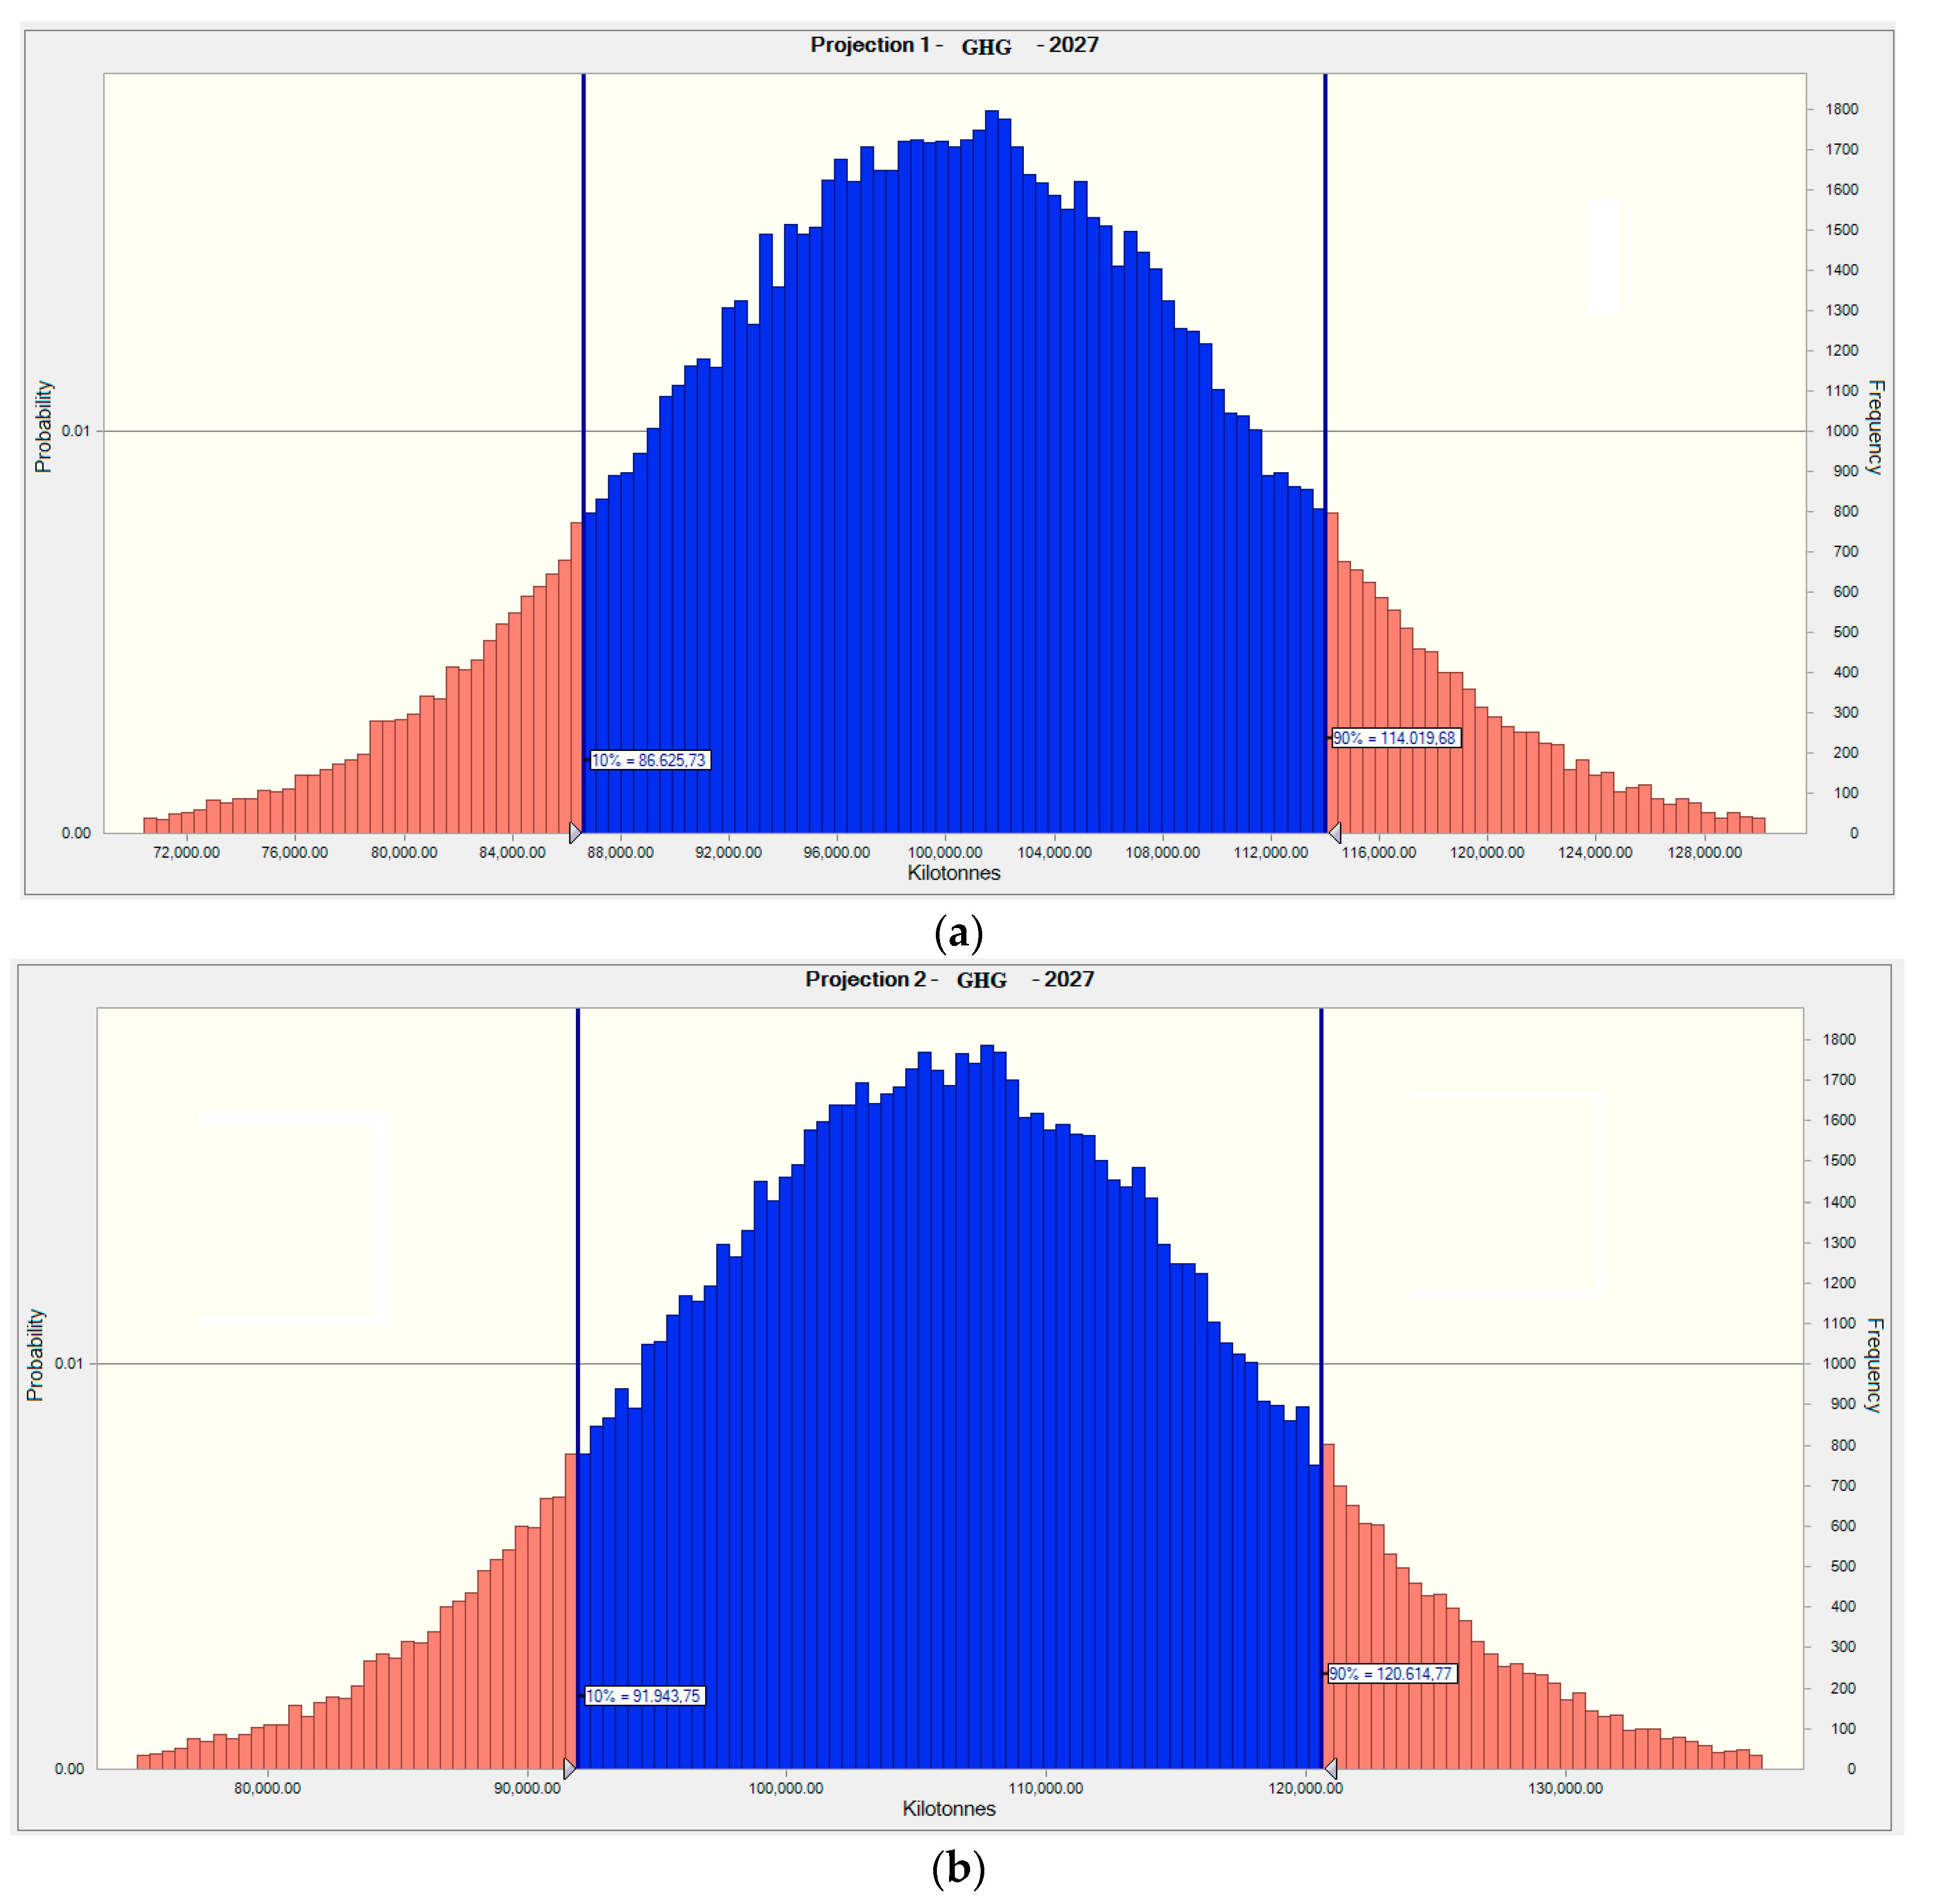
As the maximum and minimum values of GHG, NOx and SO2 emissions have a large amplitude, a Monte Carlo simulation was performed considering that the emission values of the pollutants follow a normal distribution, as explained in the previous section. For this, simulation software and 80% of the most frequent values were used to set the narrower emission bounds, considering 100,000 evaluations. This procedure was performed for each year from 2019 to 2027 for both projections and each pollutant. Then, the set of values in the 10% histogram point produce the lower bound, and the ones from 90% histogram point make the upper bound, considering the same pollutant and projection. There were 54 histograms.
Figure 3 shows the results of the histogram of the Monte Carlo simulation for Projection 1, year 2027, and GHG emissions Figure 3a and for the Projection 2, year 2027 and GHG emissions Figure 3b. In both pictures, the lower bound (10%) and the upper bound (90%) are marked. It is possible to observe that these bounds are narrower than the minimum and maximum values previously obtained. Therefore, the Monte Carlo simulation bound values allow better characterization of the reality because they consider the most likely emission values not only the extreme cases.
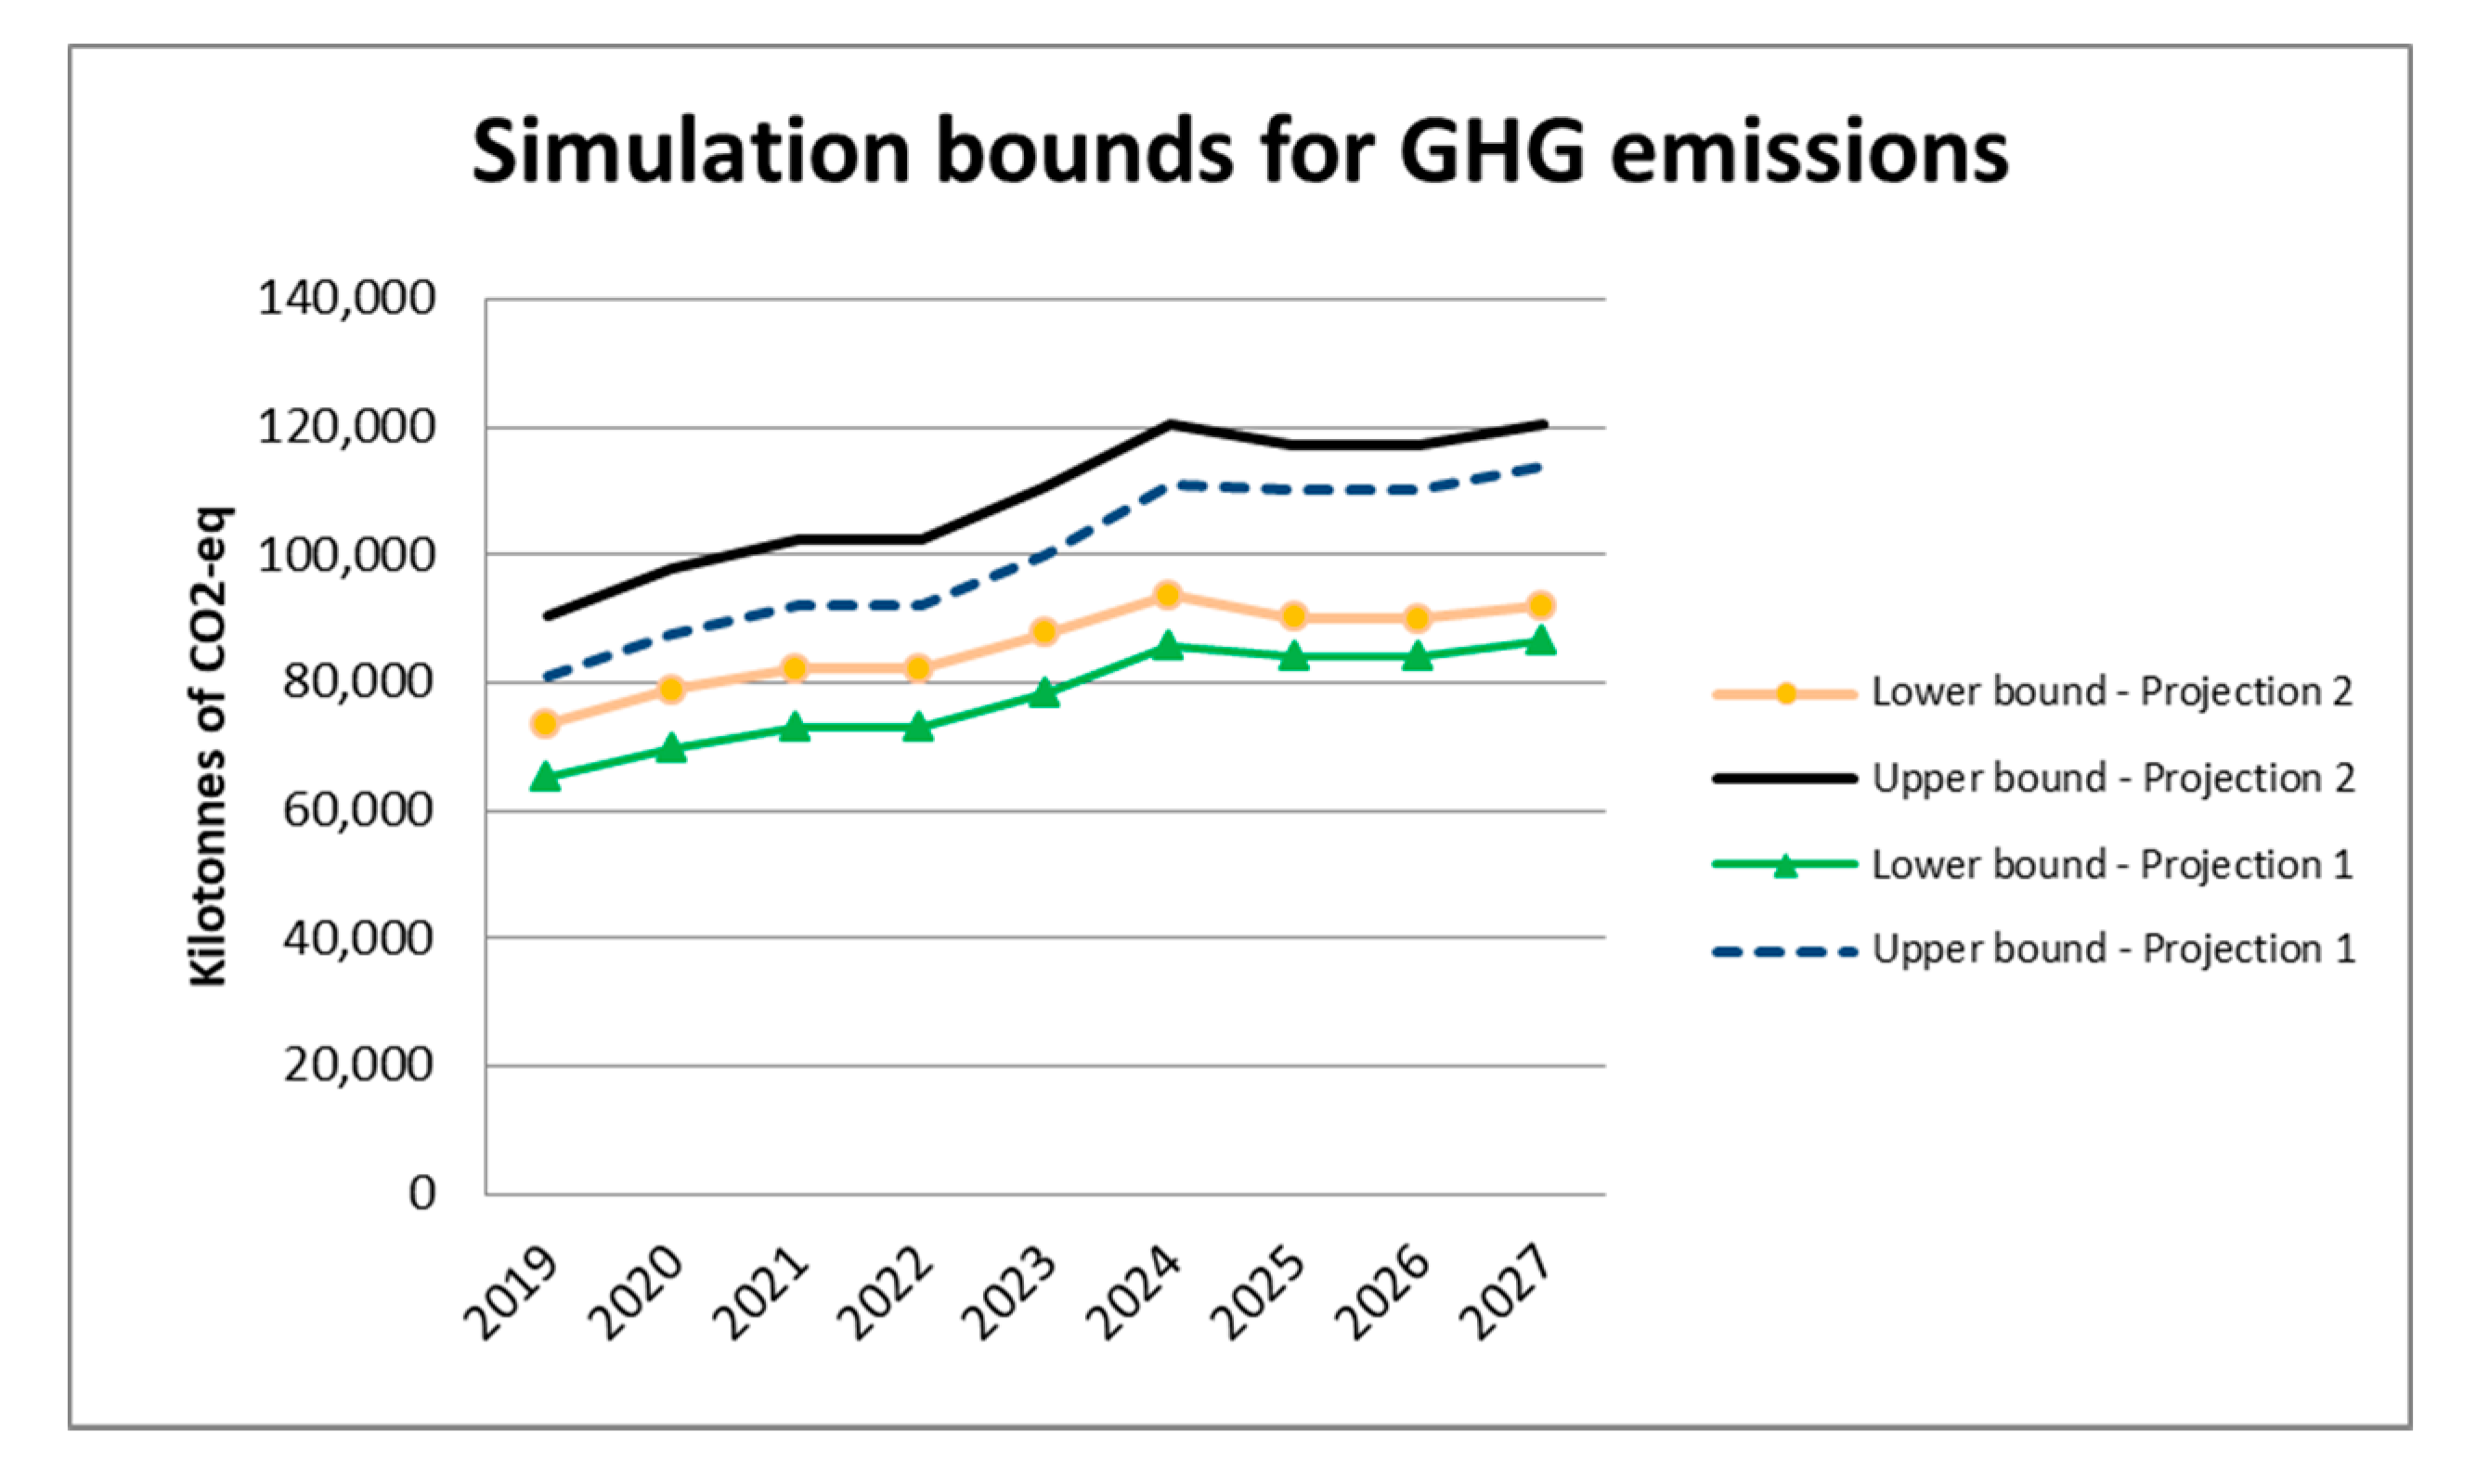
In Figure 4, Figure 5 and Figure 6, it is possible to verify the upper and lower emission bounds obtained for each pollutant along the years provided by Monte Carlo simulation. They represent a range of most likely values of the GHG, NOx, and SO2 emission occurrence. It is observed that the simulation obtained the same tendency of emissions that was already identified by the minimum and maximum values: The GHG emission values increase up to the year 2024, decrease slightly from 2024 and increase again from 2026, the NOx emission values present an increase along the years, and SO2 emission values increase up to the year 2023 and decrease considerably from 2024 to 2027.
As in the simulation only the most probable values of GHG emission were considered, the range of values presented in Figure 4 is on average 72% narrower for Projections 1 and 2, when compared to those in Figure 2a. For the range of NOx emission values, the reduction is around 73% when compared to Figure 2b. Considering these values, it is worth highlighting that the average values for the lower and upper bounds are closer to the reality than the others because they were obtained based on the most likely values from Monte Carlo simulation.
In Figure 6, it is possible to see the bounds obtained by the simulation for the SO2 emissions. They presented a reduction of 77% and 76% for the Projections 1 and 2, respectively, when compared to those from Figure 2c. Therefore, Monte Carlo simulation allows incorporating variations in the emission rates with the definition of more restricted emission limits considering the probability of occurrence. Similarly to GHG and NOx, lower and upper bounds obtained from Monte Carlo simulation for SO2 emissions facilitate result interpretation. Indeed, the tendency of SO2 emission reduction after 2023 discussed in Section 3.1 based on Figure 2c is much more evident in Figure 6 thanks to the lower and upper bounds defined from simulation results.
The observed SO2 emission reduction attests the effectivity of the Brazilian electricity authority strategy of substituting thermal energy generation from oil by natural gas to achieve a decrease in emissions of this pollutant, as discussed in Section 3.1.
However, it is important to emphasize that in Table 2, natural gas source results in lower SO2 emissions and higher GHG and NOx emissions than oil source, considering the maximum rates. Therefore, on the one hand, a simple substitution of oil source by natural gas without any other change in the electricity mix could lead to SO2 emission reductions. On the other hand, this strategy could promote an increase in GHG and NOx releases. This behavior seems to be exactly what is observed in Table 11, which presents the variation of emissions for each pollutant per MWh of electricity generated from 2019 to 2027. From Table 11 it is noted a considerable reduction of SO2 emissions from 2019 to 2017, whereas GHG and NOx emissions increase in general. However, it is noted that SO2 emissions presented a higher reduction than the increase in GHG and NOx emissions. For the minimum NOx emission in Projection 2 there was a reduction because the minimum emission rate for natural gas is smaller than the one from oil.
As discussed in Section 3.1, reducing the use of thermoelectric plants in the electricity generation by replacing them with renewable sources will decrease air pollution. Indeed, an important strategy is presented in Brazilian electricity plan in order to reduce emissions: The increase in the electricity production from solar and wind sources, as both are low intensive in GHG and NOx emissions, as provided in Table 2. In fact, from Table 3 and Table 4 it is noted that year after year solar and wind sources together present a continuous growth in their share in installed capacity changing from 10% or 11% in 2019 to 17% or 18% in 2027, according to the considered projection.
The average values of kilograms of the pollutants emitted per MWh considering annual emissions during the horizon planning (2019 to 2027) obtained in this work are presented in Table 12. The values presented for GHG are lower than the world average emissions in 2017, 484 kg per MWh [1], but in general, they are greater than the Brazilian average from the year 2017, 104 kg per MWh [24].
No reference values of world average emissions of NOx and SO2 from electricity generation were found. Considering only the USA context, from data provided in [34], average values of NOx and SO2 from electricity production in 2017 are 0.37 kg per MWh and 0.41 kg per MWh, respectively. Compared to the USA, the lower bound of Brazilian NOx emissions is quite similar to the USA one in both projections, but considering upper bound results, Brazil shows a much higher emission rate than the USA for this pollutant. Concerning SO2, in general, Brazil presents lower emission rates than the USA in both projections even for upper bounds.

3.3. Comparison of Brazilian Electricity Generation Emissions with Other Countries

In order to conclude the presentation of the results, Table 13 shows the average kilograms of emissions for each pollutant per MWh considering energy production from the year 2017 for Brazil, France, China, and the USA.
Brazil, whose electricity is based on hydropower, and France, whose electric energy is focused on nuclear generation, have lower emission rates among the assessed countries. On the contrary, American and Chinese electricity mix, both with a fossil fuel-based system, generate much higher emissions than Brazil and France for minimum and maximum emission levels of the pollutants considered. These results were expected as nuclear, and hydropower energy source is acknowledged as a system with low air pollutant emission rates, whereas fossil fuel combustion systems present high emission levels of GHG, NOx, and SO2.
The only exception of this pattern is for the minimum level of SO2 emissions, whose value for Brazil is equal to this one of China and higher than the one of the USA. This occurs because the percentage of oil energy source in Brazil is higher than that of China and USA and the minimum SO2 emission limit for oil (0.85 kgSO2/MWh, Table 2) is much higher than those of other energy sources. Therefore, globally, fossil fuel-intensive systems were clearly the ones with the worse results in terms of pollutant emissions from electricity generation. Thus, considering the pollutants investigated, Brazil has an affordable electricity mix in terms of air pollutant emissions control.

4. Conclusions

It is noteworthy that in this study GHG, NOx, and SO2 were used because of their relevance in environmental damage. In this work, it was possible to verify that the large share of renewable sources in the Brazilian electric energy generation, as the hydro source, guarantees good results regarding GHG, NOx, and SO2 emissions. However, it is important to mention that the Brazilian government has renewable sources incentives which cost about US $910 million in 2018. Despite the rise of about 22% in energy generation from the year 2019 up to the year 2027, for the GHG and NOx the emissions increase is greater, in general, and for SO2 there was a decrease. The former can be explained by the rise in the natural gas share for the energy generation, and the latter is due to the reduction in percentage participation of oil source in the installed capacity, with the increase in percentage participation of wind and solar sources along the years. It is important to mention that the rise of the natural gas participation because of cost reasons leads to an increase in the emission pollutants per MWh along the years. If this expansion was from renewable sources, the pollutant emissions would reduce. Therefore, it is necessary to alert the Brazilian government that expanding and changing the sources share of the electricity production without a broader analysis can contribute to the worsening of climate change and environmental degradation.
Considering the 2017 pollutant emissions, Brazil is in the second place, behind only France, which has small rates of emissions due to the large share of the nuclear source. When comparing the average of Brazilian emissions with the world indicators, Brazil occupies a prominent place due to the great participation of renewable energy sources. For future studies, it is recommended to include the analysis of implementation and operation costs of the electric energy generation comparing the different sources. It is also important to evaluate the impact of the Incentivized Sources Subsidy and compare it with the environmental costs avoided by the large share of renewable sources. In addition, it could include the consideration of the technology evolution over time.

Author Contributions

R.d.S.H. proposed the main idea of this paper and contributed with the methodology, obtaining and analyzing results. R.R.S. contributed with the literature review and energy data collection. L.M.G.C. contributed with the literature review and pollutant emissions data collection. All the authors contributed with the manuscript preparation.

Funding

This research received no external funding.

Acknowledgments

The authors thank the Brazilian agencies CAPES, CNPq, FAPEMIG and CEFET-MG for the financial support.

Conflicts of Interest

The authors declare no conflict of interest.

References

  1. IEA. Global Energy and CO2 Status Report; IEA (International Energy Agency): Paris, France, 2019. [Google Scholar]
  2. Enerdata. Global Energy Statistical Yearbook 2018; Enerdata: Grenoble, France, 2018; Available online: https://yearbook.enerdata.net/electricity/world-electricity-production-statistics.html (accessed on 22 May 2018).
  3. MME. Brazilian Energy Review: 2017 Baseline Year; MME (Ministry of Mines and Energy): Brasília, Brazil, 2018. Available online: http://www.eletronuclear.gov.br/Imprensa-e-Midias/Documents/Resenha%20Energ%C3%A9tica%202018%20-MME.pdf (accessed on 30 May 2019).
  4. BERA. Generation Capacity of Brazil; BERA (Brazilian Electricity Regulatory Agency): Brasília, Brazil, 2018. Available online: http://www2.aneel.gov.br/aplicacoes/capacidadebrasil/capacidadebrasil.cfm (accessed on 10 September 2018).
  5. Danthurebandara, M.; Rajapaksha, L. Environmental consequences of different electricity generation mixes in Sri Lanka by 2050. J. Clean. Prod. 2019, 210, 432–444. [Google Scholar] [CrossRef]
  6. Günkaya, Z.; Özdemir, A.; Özkan, A.; Banar, M. Environmental performance of electricity generation based on resources: A life cycle assessment case study in Turkey. Sustainability 2016, 8, 1097. [Google Scholar] [CrossRef]
  7. García-Gusano, D.; Martín-Gamboa, M.; Iribarren, D.; Dufour, J. Prospective analysis of life-cycle indicators through endogenous integration into a national power generation model. Resources 2016, 5, 39. [Google Scholar] [CrossRef]
  8. Atilgan, B.; Azapagic, A. Assessing the environmental sustainability of electricity generation in Turkey on a life cycle basis. Energies 2016, 9, 31. [Google Scholar] [CrossRef]
  9. Song, Q.; Wang, Z.; Li, J.; Duan, H.; Yu, D.; Liu, G. Comparative life cycle GHG emissions from local electricity generation using heavy oil, Natural Gas, and MSW incineration in Macau. Renew. Sustain. Energy Rev. 2018, 81, 2450–2459. [Google Scholar] [CrossRef]
  10. Gaete-Morales, C.; Gallego-Schmid, A.; Stamford, L.; Azapagic, A. Assessing the environmental sustainability of electricity generation in Chile. Sci. Total Environ. 2018, 636, 1155–1170. [Google Scholar] [CrossRef] [Green Version]
  11. Martins, D.M.R. Setor Elétrico Brasileiro: Análise do Investimento de Capital em Usinas Termelétricas. In Dissertação (Mestrado)—Programa de Pós-Graduação em Economia; PUC-Rio: Rio de Janeiro, Brazil, 2008. [Google Scholar]
  12. Lima, F.R. Decisão de Sazonalização para Otimizar Carteira de Contratos com Hidrelétricas e Eólicas no Brasil. In Dissertação (Mestrado); PUC-Rio: Rio de Janeiro, Brazil, 2012. [Google Scholar]
  13. BERA. Atlas of Electric Power in Brazil; BERA (Brazilian Electricity Regulatory Agency): Brasília, Brazil, 2008. [Google Scholar]
  14. EECC. Fontes—Tipos e Fontes de Energia—Geração de Energia Elétrica; (Electric Energy Commercialization Chamber): Bela Vista, Brazil, 2017; Available online: https://www.ccee.org.br/portal (accessed on 28 September 2018).
  15. Vesilind, P.A.; Morgan, S.M.; Heine, L.G. Introduction to Environmental Engineering; Cengage Learning: Boston, MA, USA, 2010. [Google Scholar]
  16. Turconi, R.; Boldrin, A.; Astrup, T. Life cycle assessment (LCA) of electricity generation technologies: Overview, comparability and limitations. Renew. Sustain. Energy Rev. 2013, 28, 555–565. [Google Scholar] [CrossRef] [Green Version]
  17. Kahn, I. Greenhouse gas emission accounting approaches in electricity generation systems: A review. Atmos. Environ. 2019, 200, 131–141. [Google Scholar] [CrossRef]
  18. Barros, M.; Piekarski, C.; Francisco, A. Carbon footprint of electricity generation in Brazil: An analysis of the 2016–2026 period. Energies 2018, 11, 1412. [Google Scholar] [CrossRef]
  19. Elsayed, I.; Nishi, Y. A Feasibility Study on Power Generation from Solar Thermal Wind Tower: Inclusive Impact Assessment Concerning Environmental and Economic Costs. Energies 2018, 11, 3181. [Google Scholar] [CrossRef]
  20. Kommalapati, R.; Kadiyala, A.; Shahriar, M.; Huque, Z. Review of the life cycle greenhouse gas emissions from different photovoltaic and concentrating solar power electricity generation systems. Energies 2017, 10, 350. [Google Scholar] [CrossRef]
  21. Garcia, R.; Freire, F. Marginal life-cycle greenhouse gas emissions of electricity generation in Portugal and implications for electric vehicles. Resources 2016, 5, 41. [Google Scholar] [CrossRef]
  22. Laurent, A.; Espinosa Martinez, N. Environmental impacts of electricity generation at global, regional and national scales in 1980–2011: What can we learn for future energy planning? Energy Environ. Sci. 2015, 8, 689–701. [Google Scholar] [CrossRef]
  23. Boden, T.A.; Marland, G.; Andres, R.J. Global Regional and National Fossil-Fuel CO2 Emissions; Carbon Dioxide Information Analysis Center, Oak Ridge National Laboratory, U.S. Department of Energy: Oak Ridge, TN, USA, 2017. [Google Scholar]
  24. BERO. Brazilian Energy Balance 2018—Summary Report of 2017; BERO (Brazilian Energy Research Office): Brasília, Brazil, 2018. [Google Scholar]
  25. EEA. Ammonia (NH3) Emissions (APE003); EEA (European Environment Agency): Copenhagen, Denmark; Available online: https://www.eea.europa.eu/data-and-maps/indicators/eea-32-ammonia-nh3-emissions-1 (accessed on 20 September 2018).
  26. FAO. Global Estimates of Gaseous Emissions of NH3, NO and N2O from Agricultural Land; FAO (Food and Agriculture Organization): Rome, Italy, 2001. [Google Scholar]
  27. Sapek, A. Ammonia Emissions from Non-Agricultural Sources. Pol. J. Environ. Stud. 2013, 22, 63–70. [Google Scholar]
  28. EEA. Emissions (CO2, SO2, NOx) from Public Electricity and Heat Production––Explanatory Indicators (ENER009). Available online: https://www.eea.europa.eu/data-and-maps/indicators/emissions-co2-so2-nox-from-1/assessment-1 (accessed on 22 October 2018).
  29. Ritchie, H.; Roser, M. CO2 and Other Greenhouse Gas Emissions. Available online: https://ourworldindata.org/co2-and-other-greenhouse-gas-emissions (accessed on 29 June 2019).
  30. BERA. Electricity Mix; BERA (Brazilian Electricity Regulatory Agency): Brasília, Brazil, 2019. Available online: http://www2.aneel.gov.br/aplicacoes/capacidadebrasil/OperacaoCapacidadeBrasil.cfm (accessed on 22 March 2019).
  31. ERO. Ten-Year Energy Expansion Plan—2027; ERO (Energy Research Office): Brasília, Brazil, 2018. Available online: http://www.epe.gov.br/sites-pt/publicacoes-dados-abertos/publicacoes/Documents/PDE%202027_aprovado_OFICIAL.pdf (accessed on 20 May 2019).
  32. ETN. Electricity Report 2017; ETN (Electricity Transmission Network): Paris, France, 2018; Available online: https://www.rte-france.com/sites/default/files/rte_elec_report_2017 (accessed on 20 June 2019).
  33. NEA. 2017 Detailed Electricity Statistics; NEA (National Energy Administration): Beijing, China, 2018; Available online: https://chinaenergyportal.org/en/2017-electricity-other-energy-statistics-update-of-june-2018 (accessed on 15 June 2019).
  34. EIA. Electricity Data Browser; EIA (Energy Information Administration): Washington, DC, USA, 2018. Available online: https://www.eia.gov/electricity/data/browser/ (accessed on 12 June 2019).
  35. Kalos, M.H.; Whitlock, P.A. Monte Carlo Methods, 2nd ed.; John Wiley & Sons: Hoboken, NJ, USA, 2008. [Google Scholar]
  36. Ikelle, L.T.; Lasse, A. Introduction to Petroleum Seismology; Society of Exploration Geophysicists: Tulsa, OK, USA, 2018. [Google Scholar]
  37. Montalvão, E.; Silva, R.M. Discounts in transmission and distribution taxes for Incentivized Sources: An evaluation. In Nucleus of Studies and Research for Legislative Consultancy; Federal Senate: Brasília, Brazil, 2015; Available online: https://www12.senado.leg.br/publicacoes/estudos-legislativos/tipos-de-estudos/textos-para-discussao/td165 (accessed on 14 July 2019).
  38. MME. Energy Development Account: Public or cross-subsidies? Monthly Newsletter on Government Subsidies; ME (Ministry of Economy): Brasília, Brazil, 2019. Available online: http://www.fazenda.gov.br/centrais-de-conteudos/publicacoes/orcamento-de-subsidios-da-uniao/arquivos (accessed on 14 July 2019).
Figure 1. The Brazilian energy production Projection 1 (a) and 2 (b) from 2019 to 2027.
Energies 12 02851 g001
Figure 2. Minimum and maximum GHG (a), NOx (b), and SO2 emissions for Projections 1 and 2 (c).
Energies 12 02851 g002
Figure 3. The resultant Monte Carlo simulation histogram with the lower and upper bounds (a) for the Projection 1, year 2027 and GHG emissions and (b) for the Projection 2, year 2027 and GHG emissions.
Energies 12 02851 g003
Figure 4. Lower and upper bounds of GHG emissions for Projections 1 and 2.
Energies 12 02851 g004
Figure 5. Lower and upper bounds of NOx emissions for Projections 1 and 2.
Energies 12 02851 g005
Figure 6. Lower and upper bounds of SO2 emissions for Projections 1 and 2.
Energies 12 02851 g006
Table 1. Brazilian electricity mix in 2019 [30].
Energy SourceMW
Hydro104,105
Nuclear1990
Natural Gas13,540
Oil8877
Coal3252
Biomass14,761
Wind14,676
Solar1944
Total163,144
Table 2. Emissions of greenhouse gases (GHG), NOx, and SO2 per MWh by energy source [16].
Energy SourceEmissions—kg per MWh
GHG (Kg CO2-eq)NOxSO2
Min.Max.Min.Max.Min.Max.
Hydro2200.0040.060.0010.03
Nuclear3350.010.040.0030.038
Natural Gas38010000.23.80.010.32
Oil5309000.51.50.858
Coal66010500.33.90.036.7
Biomass8.51300.081.70.030.94
Wind3410.020.110.020.09
Solar131900.150.400.120.29
Table 3. Data Set A: The evolution of installed capacity (MW) for the electricity mix [31].
Energy SourceEvolution of Installed Capacity for the Electricity Mix (MW)—PDE 2027—Data Set A
201920202021202220232024202520262027
Hydro104,548.00108,407.00108,569.00108,667.00109,226.00109,694.00110,700.00111,510.00112,278.00
Nuclear1990.001990.001990.001990.001990.001990.001990.003395.003395.00
Natural Gas12,939.0014,454.0015,759.0015,759.0017,898.0021,352.0021,870.0021,870.0023,021.00
Oil5104.005390.005390.005390.005198.004214.002732.002525.002144.00
Coal3420.003420.003420.003420.003420.003420.003420.003420.003420.00
Biomass13,581.0013,595.0013,724.0013,806.0014,463.0014,993.0015,523.0016,053.0016,583.00
Wind14,951.0015,069.0015,171.0015,351.0018,672.0020,672.0022,672.0024,672.0026,672.00
Solar2196.002258.002832.003639.004639.005639.006639.007639.008639.00
Total158,729.00164,583.00166,855.00168,022.00175,506.00181,974.00185,546.00191,084.00196,152.00
Table 4. Data Set B: The projections of the actual installed capacity (MW) for the electricity mix [30,31].
Energy SourceProjections of the Actual Installed Capacity for the Electricity Mix (MW)—Data Set B
201920202021202220232024202520262027
Hydro104,105.25107,947.90108,109.22108,206.80108,763.43109,229.45110,231.19111,037.76111,802.51
Nuclear1990.001990.001990.001990.001990.001990.001990.003395.003395.00
Natural Gas13,539.5215,124.8416,490.4016,490.4018,728.6822,342.9922,885.0322,885.0324,089.45
Oil8877.039374.459374.459374.459040.527329.124751.584391.563728.91
Coal3251.833251.833251.833251.833251.833251.833251.833251.833251.83
Biomass14,760.5414,775.7514,915.9615,005.0815,719.1416,295.1716,871.2017,447.2418,023.27
Wind14,675.7914,791.6214,891.7415,068.4318,328.3020,291.4922,254.6724,217.8626,181.04
Solar1943.801998.682506.763221.084106.234991.395876.546761.697646.85
Total163,143.76169,160.58171,495.77172,695.23180,387.38187,035.28190,706.62196,398.65201,607.61
Table 5. Data Set C: Brazilian electricity production (GWh) in 2017 [3].
Electricity Production in 2017 (GWh)—Data Set C
Energy Source2017
Hydro370,906.00
Nuclear15,739.00
Natural Gas65,593.00
Oil24,990.00
Coal16,257.00
Biomass51,272.00
Wind42,373.00
Solar832.00
Total587,962.00
Table 6. Data Set D: Brazilian installed capacity (MW) in 2017 [3].
Installed Capacity in 2017 (MW)—Data Set D
Energy Source2017
Hydro100,303.00
Nuclear1990.00
Natural Gas14,941.00
Oil8792.00
Coal3324.00
Biomass14,559.00
Wind12,283.00
Solar936.00
Total157,128.00
Table 7. The energy production for the year 2017 from Brazil [3], France [32], China [33], and the USA [34].
Electricity Production in 2017 (GWh)
Energy SourceBrazilFranceChinaUSA
Hydro370,906.0053,600.001,193,062.00300,333.00
Nuclear15,739.00379,100.00248,125.00804,950.00
Natural Gas65,593.0040,900.00202,670.001,308,884.00
Oil24,990.003800.00123,837.0012,414.00
Coal16,257.009700.004,149,763.001,214,811.00
Biomass51,272.009100794,000.0062,762.00
Wind42,373.0024,000.00303,420.00254,303.00
Solar832.009200.00116,618.0077,276.00
Total587,962.00529,400.007,131,495.004,035,733.00
Table 8. Average and standard deviation for GHG, NOx, and SO2 emission rates.
Energy SourceEmissions—kg per MWh
GHG (Kg CO2-eq)NOxSO2
AverageStandard DeviationAverageStandard DeviationAverageStandard Deviation
Hydro11.003.0000.030.0090.020.005
Nuclear19.005.3330.030.0050.020.006
Natural Gas690.00103.3332.000.6000.170.052
Oil715.0061.6671.000.1674.431.192
Coal855.0065.0002.100.6003.371.112
Biomass69.2520.2500.890.2700.490.152
Wind22.006.3330.070.0150.060.012
Solar101.5029.5000.280.0420.210.028
Table 9. Values of percentage participation in electricity mix and GHG, NOx, and SO2 emissions per source for Projection 1.
SourceAverage Participation in Electricity Generation—Projection 1Average Participation in Emissions
GHG (Kg CO2-eq)NOxSO2
Min.Max.Min.Max.Min.Max.
Hydro61.76%1.63%6.32%4.61%4.74%2.62%3.23%
Nuclear2.78%0.11%0.50%0.52%0.14%0.35%0.19%
Natural Gas12.29%61.70%62.92%45.90%59.82%5.22%7.21%
Oil1.84%12.87%8.47%17.16%3.53%66.40%44.81%
Coal2.56%22.28%13.74%14.32%12.76%3.26%28.53%
Biomass7.91%0.89%5.26%11.82%17.22%10.09%14.16%
Wind10.19%0.40%2.14%3.80%1.43%8.66%1.58%
Solar0.67%0.11%0.65%1.86%0.34%3.40%0.30%
Table 10. Values of percentage participation in electricity mix and GHG, NOx, and SO2 emissions per source for Projection 2.
SourceAverage Participation in Electricity Generation—Projection 2Average Participation in Emissions
GHG (Kg CO2-eq)NOxSO2
Min.Max.Min.Max.Min.Max.
Hydro60.32%1.46%5.79%4.00%4.45%1.75%3.23%
Nuclear2.73%0.10%0.46%0.45%0.13%0.24%0.19%
Natural Gas12.62%57.99%60.51%41.83%58.96%3.66%7.21%
Oil3.14%20.10%13.53%25.99%5.78%77.26%44.81%
Coal2.38%19.03%12.00%11.85%11.43%2.07%28.53%
Biomass8.43%0.87%5.26%11.18%17.63%7.33%14.16%
Wind9.81%0.36%1.93%3.25%1.33%5.68%1.58%
Solar0.58%0.09%0.53%1.44%0.28%2.01%0.30%
Table 11. The variation along the period for the average emission pollutant per MWh from 2019 to 2027.
LimitsVariation for Average Emission Per MWh
GHG (Kg CO2-eq)NOxSO2
Projection 1Projection 2Projection 1Projection 2Projection 1Projection 2
Min.6.68%0.23%1.53%−6.85%−42.16%−50.03%
Max.14.43%9.74%17.71%16.49%−27.97%−50.03%
Lower Bound8.83%3.25%11.04%8.52%−28.01%−33.93%
Upper bound14.99%10.04%20.26%18.85%−29.05%−37.46%
Table 12. Average values of emissions for each pollutant considering limits and projections.
LimitsAverage Emissions (kg per MWh)
GHG (Kg CO2-eq)NOxSO2
Projection 1Projection 2Projection 1Projection 2Projection 1Projection 2
Min.75.71882.6720.0540.0620.0240.035
Max.195.387208.5240.7810.8290.4630.571
Lower Bound118.781128.2730.3170.3330.1930.235
Upper bound152.338162.9420.5180.5400.2930.360
Table 13. Average values of pollutant emissions for each country.
CountriesAverage Emissions (kg per MWh)
GHG (Kg CO2-eq)NOxSO2
Min.Max.Min.Max.Min.Max.
Brazil85.49206.960.060.790.040.67
France48.11137.440.040.450.010.26
China405.78678.920.202.620.044.17
USA324.86659.870.162.460.022.18

