Article

Realization of Licensed/Unlicensed Spectrum Sharing Using eICIC in Indoor Small Cells for High Spectral and Energy Efficiencies of 5G Networks

Radio and Spectrum Laboratory, KDDI Research, Inc., 2-1-15 Ohara, Fujimino-shi, Saitama 356-8502, Japan
Energies 2019, 12(14), 2828; https://doi.org/10.3390/en12142828
Submission received: 15 June 2019 / Revised: 17 July 2019 / Accepted: 19 July 2019 / Published: 22 July 2019

Abstract

:
In this paper, we show how to realize numerous spectrum licensing policies by means of time-domain enhanced inter-cell interference coordination (eICIC) technique to share both the licensed and unlicensed spectrums with small cells in order to address the increasing demand of capacity, spectral efficiency, and energy efficiency of future mobile networks. Small cells are deployed only in 3-dimensional (3D) buildings within a macrocell coverage of a mobile network operator (MNO). We exploit the external wall penetration loss of each building to realize traditional dedicated access, co-primary shared access (CoPSA), and licensed shared access (LSA) techniques for the licensed spectrum access, whereas, for the unlicensed spectrum access, the licensed assisted access (LAA) technique operating in the 60 GHz unlicensed band is realized. We consider that small cells are facilitated with dual-band, and derive the average capacity, spectral efficiency, and energy efficiency metrics for each technique. We perform extensive evaluation of various performance metrics and show that LAA outperforms considerably all other techniques concerning particularly spectral and energy efficiencies. Finally, we define an optimal density of small cells satisfying both the spectral efficiency and energy efficiency requirements for the fifth-generation (5G) mobile networks.

Graphical Abstract

1. Introduction

1.1. Background

Envisioned and ever-increasing demand for high user data rate and network capacity impose many challenges on existing mobile networks due to the cost of licensing and the scarcity of available radio spectrum. Mobile network operators (MNOs) are facing both technical and business issues, particularly to provide users with high quality-of-service (QoS) at a low cost per bit transmission. Several technologies and techniques have already been proposed in the literature to address both the QoS and the reduction of cost of the use of mobile services. In line with this, instead of dedicating spectrum exclusively to an MNO, the same spectrum is proposed to be shared with multiple players of the same or different systems to improve the spectrum utilization as well to distribute the spectrum licensing cost among the players.
An important feature of spectrum sharing is spectrum trading involving considerably the commercial aspects in addition to the technical ones [1,2]. It helps more efficient use of spectrum economically by allowing primary users assigned with licensed spectrum initially to trade all or part of the spectrum with other secondary users. Unlike spectrum sharing where shared users are allowed to get access in a temporary basis to the spectrum of primary users retaining the spectrum license, in spectrum trading, spectrum usage rights are transferred completely to secondary users for a certain period of time [3]. Hence, spectrum trading as a secondary mechanism for assigning the spectrum of primary users has a crucial impact on the overall spectrum utilization efficiency. Spectrum trading may occur due to both macro factors involving external condition changes such as demand, technology and policy, and micro factors such as the economically inefficient assignment of the primary spectrum by company managers, and changes in strategy, service, and other aspects of a company [4]. Irrespective of mechanisms used for the initial allocation of spectrum to primary users, e.g., auction, beauty contests, first-come-first-serve, the rationale to employ secondary spectrum trading to enhance the spectrum efficiency holds.
However, because of asymmetric and enormous network capacity demand of the future fifth-generation (5G) system, addressing only the spectrum sharing and trading would seem insufficient, which necessitates exploiting other domains of the capacity improvement such as space and spectral efficiency improvement techniques. For the spatial-domain, network densification with small cells, particularly in indoors and hotspots in urban environments within the coverage of a large macrocell, is considered as one of the most effective techniques to serve users within the short distances and low transmit power. Small cells share typically the same spectrum as that of the large macrocell to avoid spending additional spectrum licensing fee. However, one of the major drawbacks of the spectrum sharing is its inherent co-channel interference generated from sharing the common spectrum. Though several techniques have been proposed to address co-channel interference between cells in the literature, the time-domain enhanced inter-cell interference coordination (eICIC) technique employing almost blank subframes (ABSs), primarily proposed for the long-term evolution (LTE) systems, has been considered as one of the most effective ones to address such co-channel interference.

1.2. Related Work

Numerous spectrum sharing techniques both for the licensed and unlicensed bands have already been proposed to operate small cells at the same spectrum by avoiding the co-channel interference using the eICIC technique, namely dedicated access, co-primary shared access (CoPSA), and licensed shared access (LSA) for the licensed access as well as licensed assisted access (LAA) operating in the 60 GHz unlicensed band for the unlicensed access as shown in Figure 1.
For the spectrum sharing, MNOs that adhere with the strict QoS requirements, licensed access horizontal spectrum sharing licensing policies, particularly, the CoPSA policy has been proposed where any MNO can explore the shared spectrum allocated for the 5G mobile systems [5]. In the existing literature, numerous researches have studied CoPSA [5,6,7,8,9]. The CoPSS includes mainly two access techniques, namely spectrum pooling and mutual renting [6]. In spectrum pooling, licensed spectrum bands are shared by the national regulatory agency (NRA) among different MNOs, whereas in mutual renting, the spectrum allocated to one MNO can be rented by another to address mainly the temporal capacity shortage [6].
In [10], LSA has been proposed to exploit for the inter-cell interference coordination (ICIC) by intelligently allocating the LSA spectrum to center and cell-edge of cells in an MNO to reduce interference considerably. In [11], the use of the dedicated spectrum and the shared spectrum to in-building small cells have been discussed. In addition, the challenges for operating indoor wireless systems with the shared spectrum as compared to the dedicated spectrum and the importance of interference coordination due to the massive deployment of small cells in indoor wireless systems have been emphasized. In [12], co-channel interference in indoor systems due to sharing the satellite spectrum with indoor small cells have been analyzed. A study item for 5G mobile systems to support Non-Terrestrial Networks such as satellite system has been recently initiated by the third generation partnership project (3GPP) [13,14,15]. Moreover, the Federal Communications Commission (FCC) has also proposed to share spectrum between small cells of mobile systems and satellite systems at 3.5 GHz [16].
Likewise, LAA has been proposed for the LTE to operate at unlicensed bands with an incumbent system such as WiFi with or without employing the Listen-Before-Talk (LBT) function to avoid the collision with the WiFi system. In line with this, to address interference between the WiFi system and the LAA based LTE system without LBT, in [17] the authors have proposed a modified ABS based scheme such that the LTE system is absolutely inactive in a certain number of subframes per ABS pattern period (APP). The authors in [18] have discussed the potentials and challenges of coexisting WiFi and small cells of LTE systems sharing the same unlicensed spectrum. In addition, authors have presented the ABS mechanism and an interference avoidance scheme to address interference between LTE and WiFi systems. Besides, numerous studies such as [6,19] have also addressed, mainly qualitatively, the overview of different spectrum sharing techniques. A number of studies have also studied the performance comparison among a number of spectrum sharing techniques such as [6,9,20].

1.3. Problem Statement and Contribution

Nevertheless, realizing these widely recognized spectrum sharing techniques as shown in Figure 1 for an MNO and evaluating their relative performances under a common scenario is not obvious. Since the ABS-based eICIC technique has already been well adopted by the standardization bodies due to its effectiveness in addressing the co-channel interference and hence improving the spectral and energy efficiencies of heterogeneous networks by sharing the spectrum spatially with small cells, we consider realizing these spectrum sharing techniques using the eICIC technique. More specifically, unlike addressing individually (e.g., [21]), in this paper, we focus on realizing all these major spectrum licensing policies mentioned in Figure 1 to share both the licensed and unlicensed spectrum with in-building small cells of an MNO using the ABS-based eICIC technique in order to address the ever increasing demand of high user data rate, network capacity, and spectral and energy efficiencies of the MNO. To realize these techniques, we consider multiband, specifically, dual-band, enabled in-building small cell base stations (SBSs) as shown in Figure 2 where one of the two transceivers operates at the default licensed spectrum of the concerned MNO, namely MNO 1. However, the second transceiver of each SBS is explored to operate at the spectrum of another system, which can be either the same homogeneous mobile system or a different heterogeneous system (e.g., space-satellite system) based on the spectrum sharing technique. For example, since LSA is applied to a heterogeneous system where the spectrum of other systems than that of a mobile system is shared with the mobile system (i.e., MNO 1), as shown in Figure 2, LSA is shown as a technique requiring both the mobile spectrum and the satellite spectrum operating respectively at the transceiver 1 and transceiver 2. Note that in Figure 2, even though a number of spectrum bands are shown for the transceiver 2, only one of the spectrum bands can operate in any time depending on the spectrum sharing technique. Further, if the second transceiver is not used, then an SBS can be considered as a single-band enabled SBS. In such cases, because the transceiver 1 operates at the same spectrum as that of the MNO 1, this kind of sharing is referred to as intra-system spectrum sharing. However, in all other cases so long as the transceiver 2 is explored, such a kind of spectrum sharing is termed as inter-system spectrum sharing. Hence, in short, the following three major attributes must be in place to realize the spectrum sharing techniques shown in Figure 1:
  • Dual-band enabled SBSs,
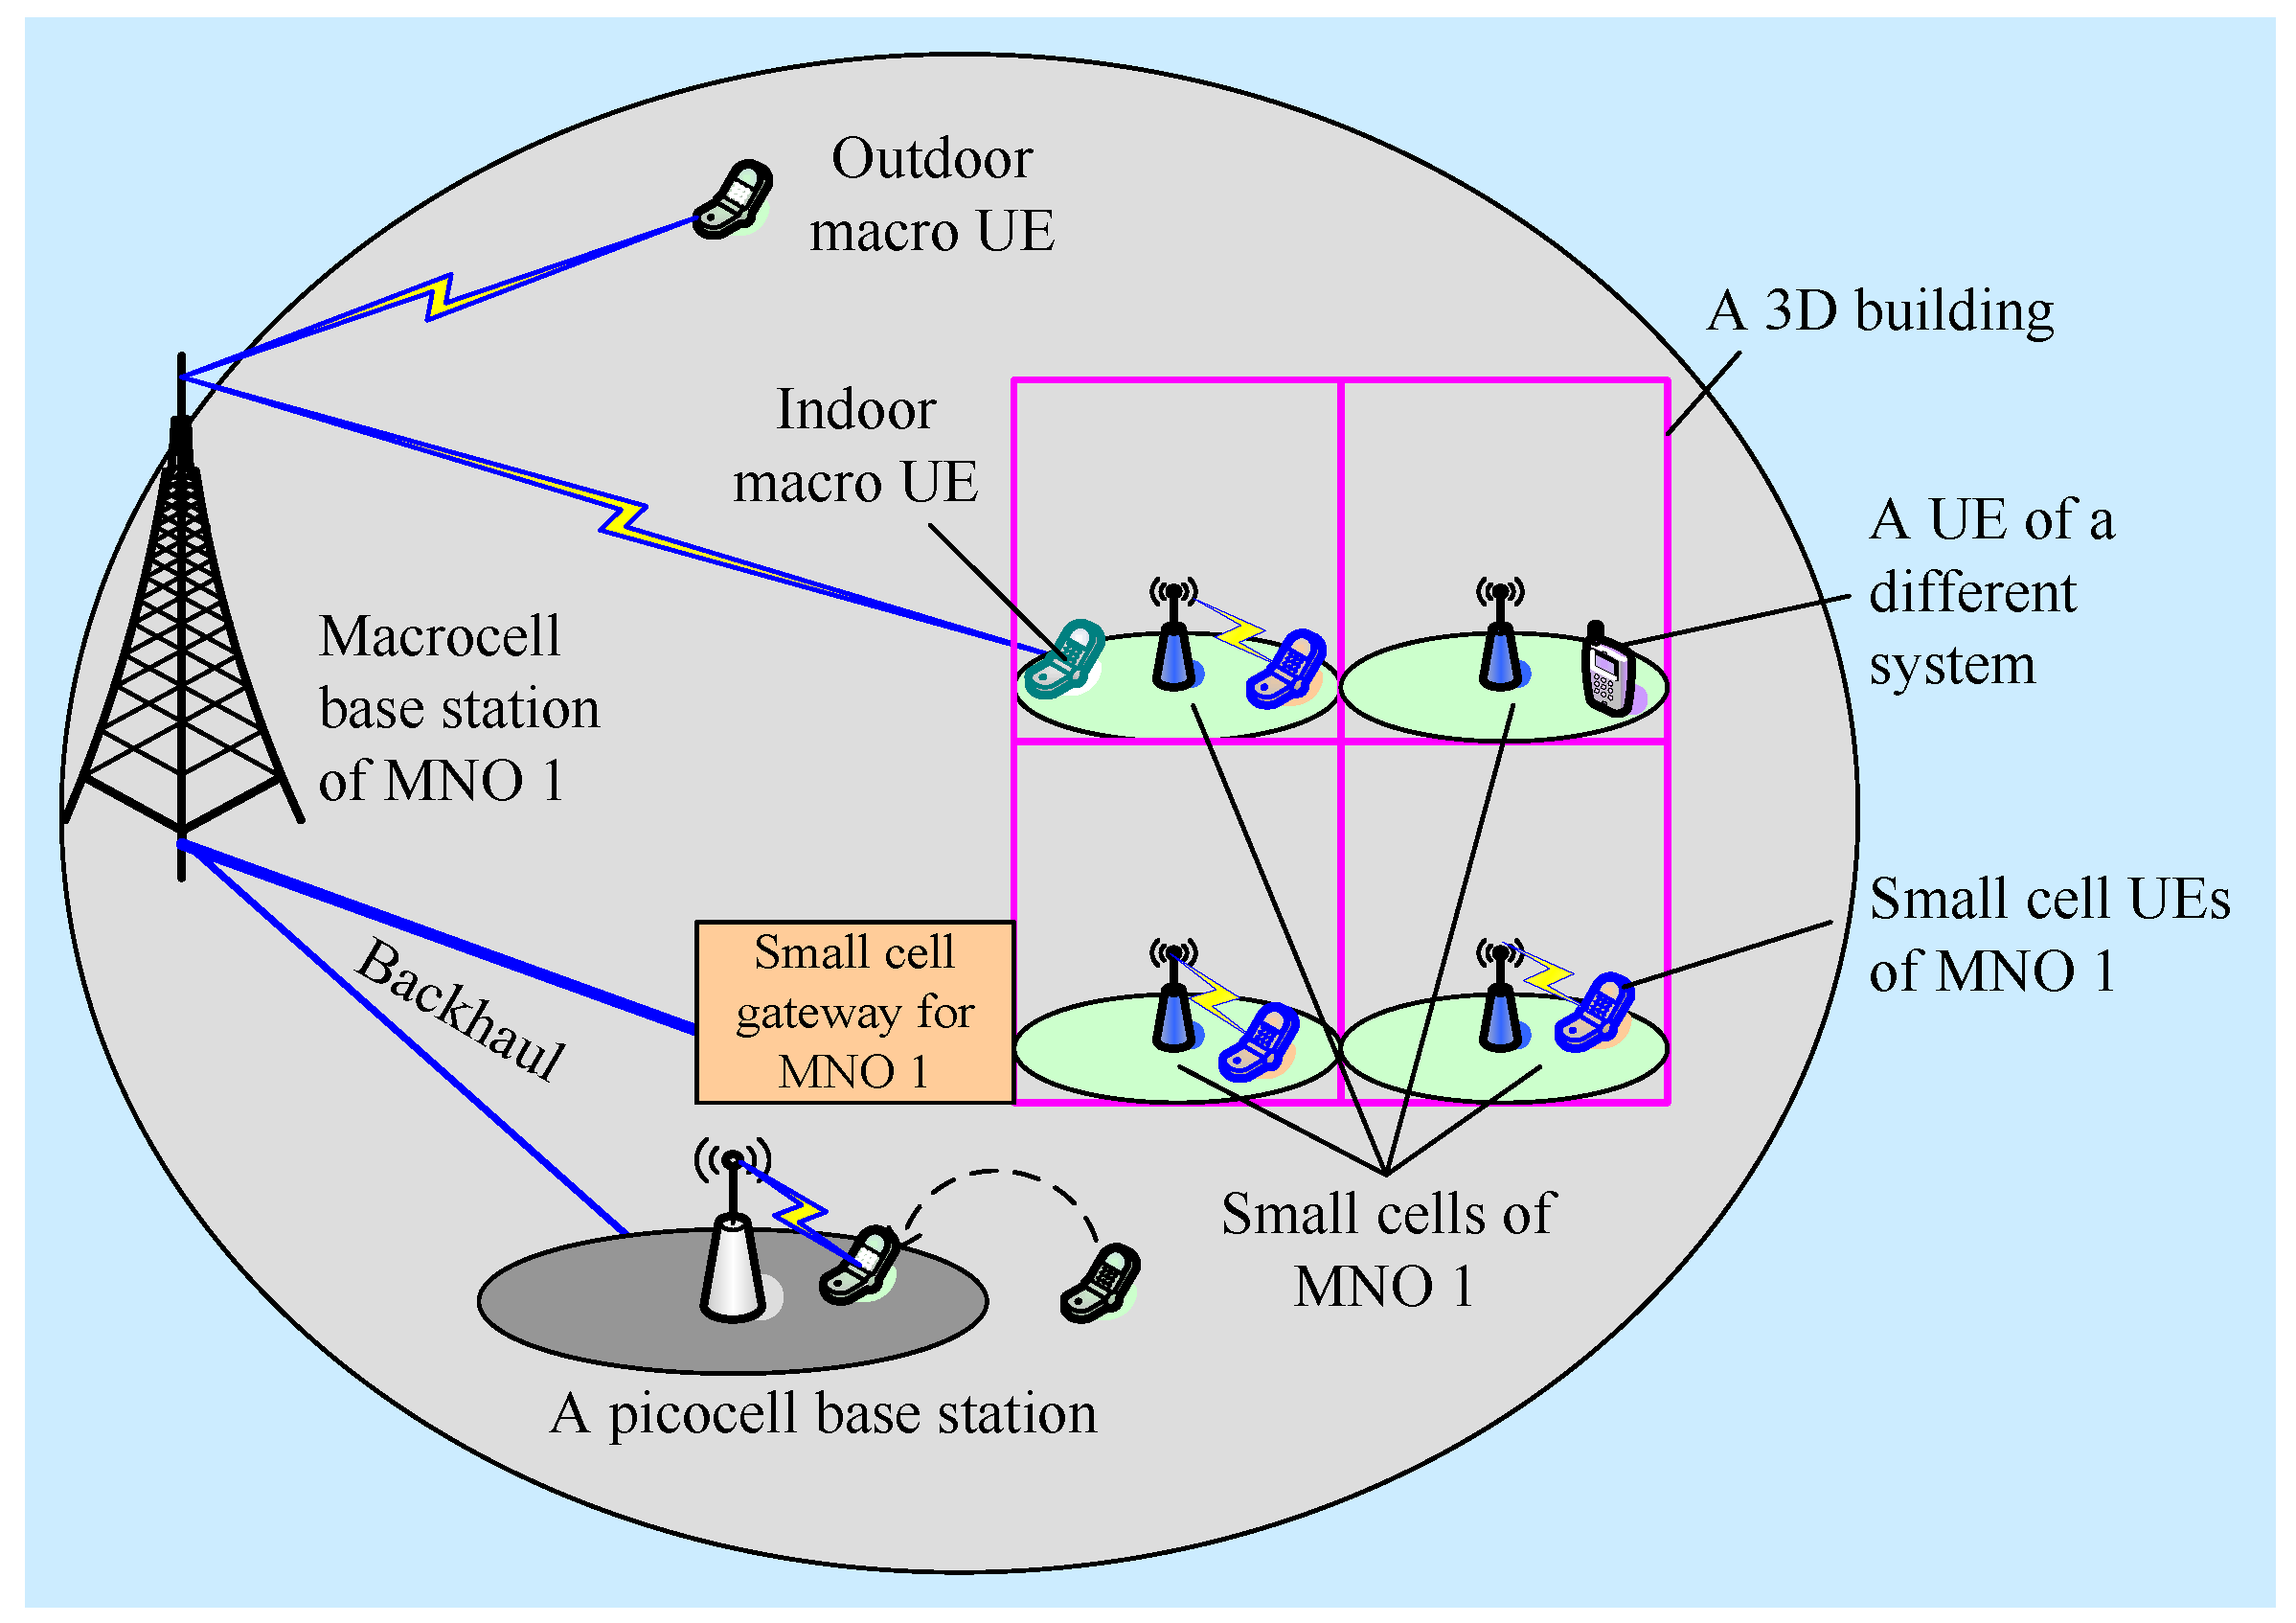
  • A set of small cell deployed 3D buildings, and
  • TD ABS based eICIC technique.

1.4. Organization

This paper is organized as follows: all the considered spectrum sharing techniques are detailed conceptually along with their associated interference management schemes in Section 2. In addition, an algorithm to execute all these techniques is presented. Then expressions for the average capacity, spectral efficiency, and energy efficiency for each technique are derived in Section 3. An optimal number of ABSs is then derived for each technique and the system parameters and assumptions to evaluate performances are given in Section 4. In Section 5, an extensive system-level performance evaluation and discuss the relative outperformance of one technique to another is performed. Finally the performance of all techniques is compared in terms of spectral and energy efficiencies and find an optimal small cell density for each technique that can satisfy both the spectral and energy efficiency performance requirements for the 5G system. The paper is concluded in Section 6. A list of acronyms (Table 1) and a list of notations (Table 2) are given in the following section.

1.5. Declaration

A small section of this paper addressing only the CoPSA for SBSs operating at a single-band, has been submitted to the IEEE GLOBECOM 2019 Workshop on Advancement in Spectrum Sharing, Waikoloa, HI, USA, 09-13 December 2019. Particularly, in contrast to a single-band enabled SBSs addressed in the conference article [21], this paper addresses the multiband enabled SBSs to realize numerous widely recognized spectrum sharing access techniques, including dedicated access, CoPSA, LSA, and LAA in [21].

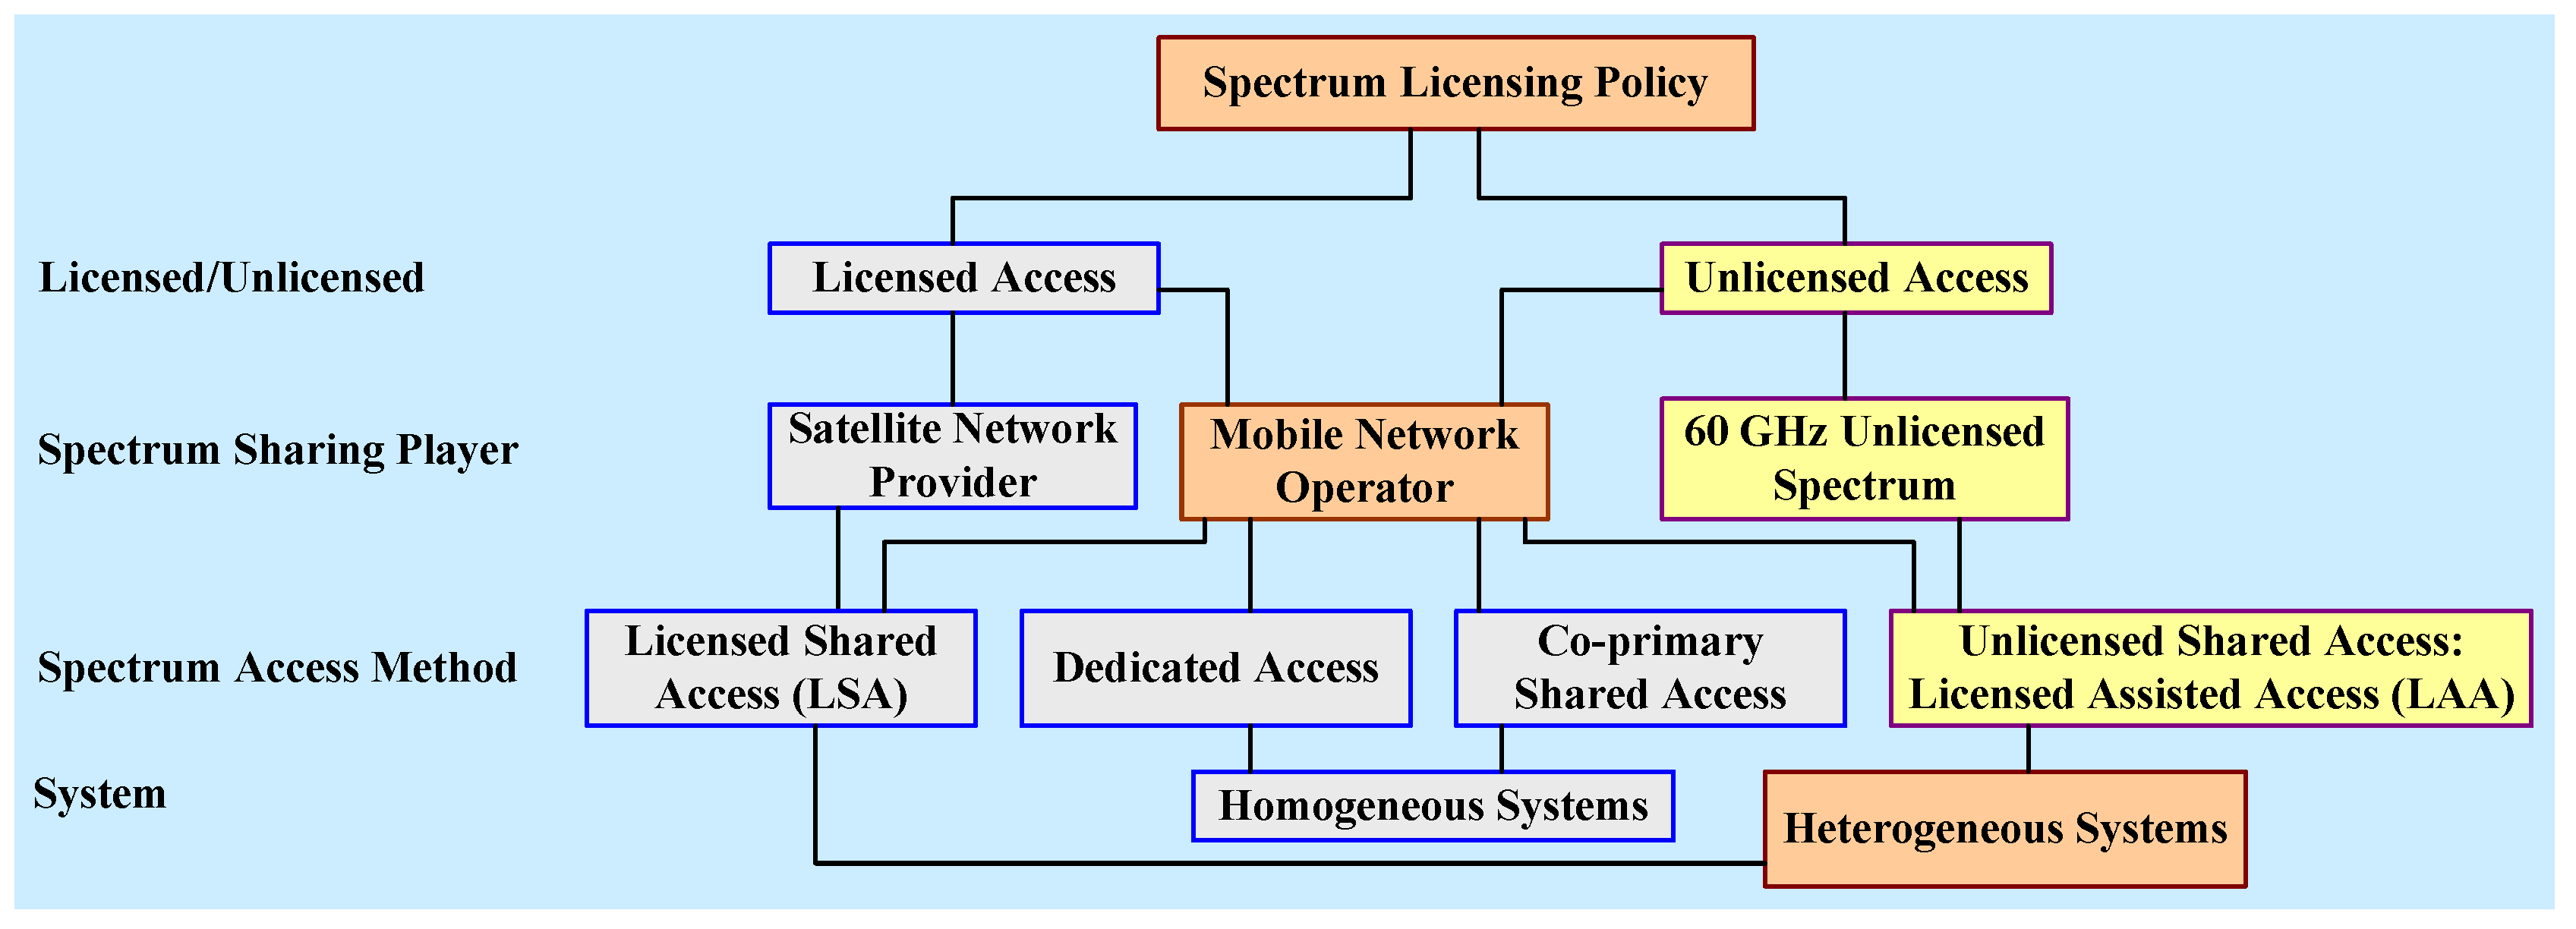
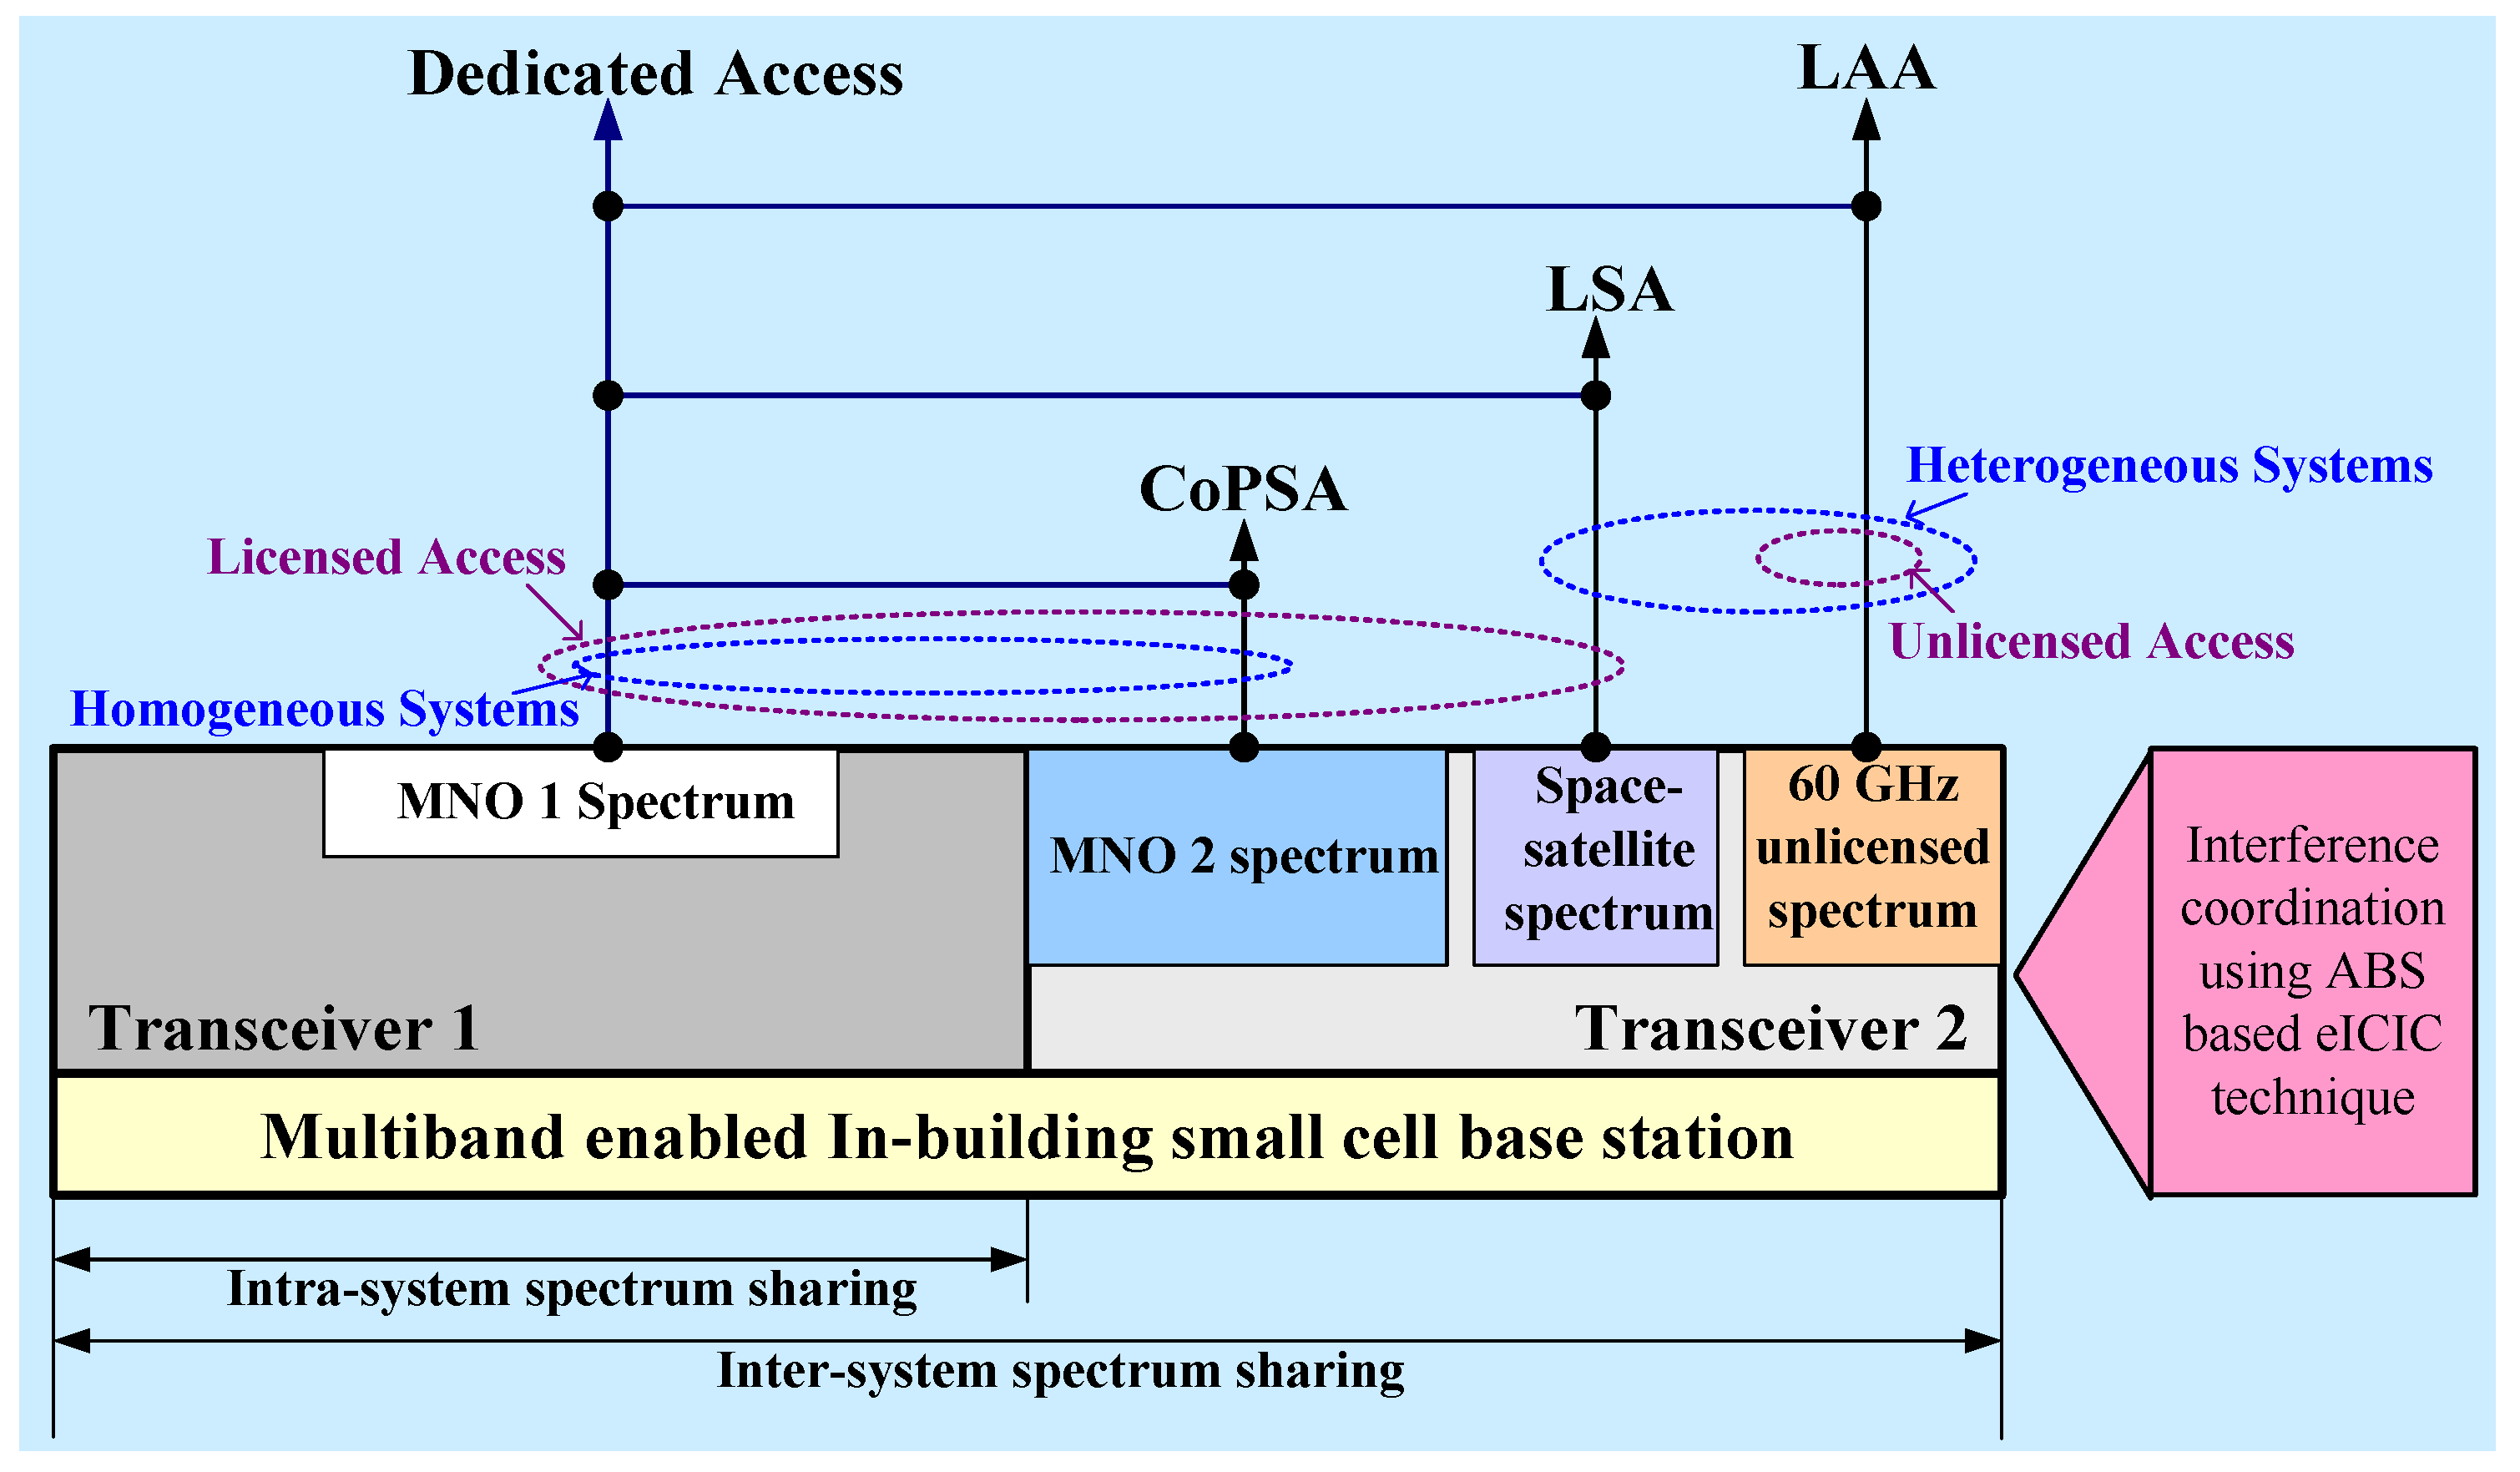
2. System Architecture, Spectrum Sharing Technique, and Interference Management

2.1. System Architecture

We consider evaluating the performance of the spectrum sharing techniques by employing them in an MNO termed MNO 1. Figure 3 shows the system architecture of the MNO 1. A part of the macro user equipment (UE) is assumed inside the buildings as well as offloaded to a number of picocells. A set of SBSs are considered deployed within a building, and a number of such buildings are deployed over the coverage of a macrocell of MNO 1. SBSs are located within buildings at the center of the ceiling of each apartment. For simplicity, only one building is shown in Figure 3. In the following, we briefly describe how each of the well-known spectrum sharing techniques is realized using ABS based eICIC in 3D in-building small cells. We contextualize the general concept of each technique to in-building small cells using eICIC. Numerous new approaches are proposed to realize a number of aforementioned spectrum sharing techniques and manage relevant co-channel interference.

2.2. Dedicated Access

This access method can be interpreted as the traditional spectrum allocation method to MNOs where each MNO has the sole right to use the allocated spectrum exclusively without facing any interference issues from other MNOs. Such dedicated access to spectrum guarantees the QoS. However, an MNO with dedicated access can usually operate only at its allocated spectrum bandwidth, which results in facing the scarcity of spectrum to serve all its users, particularly, in the peak hours. Moreover, since the spectrum is allocated to a dedicated MNO, and no reuse of the same spectrum can be made to other MNOs, there is a high possibility of wasting spectrum resources during the light load demand. Furthermore, because of having an exclusive right to the allocated spectrum, the license fees of the dedicated spectrum are also very high. The dedicated access method can be realized using the eICIC technique in small cells deployed in 3D buildings as follows.
In dedicated access, we assume that the whole spectrum of an MNO, i.e., MNO 1, is reused to operate small cells deployed in each building simultaneously with its macro UEs. We employ eICIC techniques to avoid the co-channel interference due to the presence of macro UEs within any building with small cells and their UEs such that any in-building macro UEs can be scheduled during ABSs and in-building small cell UEs can be scheduled during non-ABSs of every APP. An optimal value of ABSs can be derived based on the ratio of the rate of in-building macro UEs to the rate of in-building small cell UEs. Since the same spectrum of an MNO is reused to in-building small cells, the dedicated access can be regarded as intra-operator spectrum sharing technique.

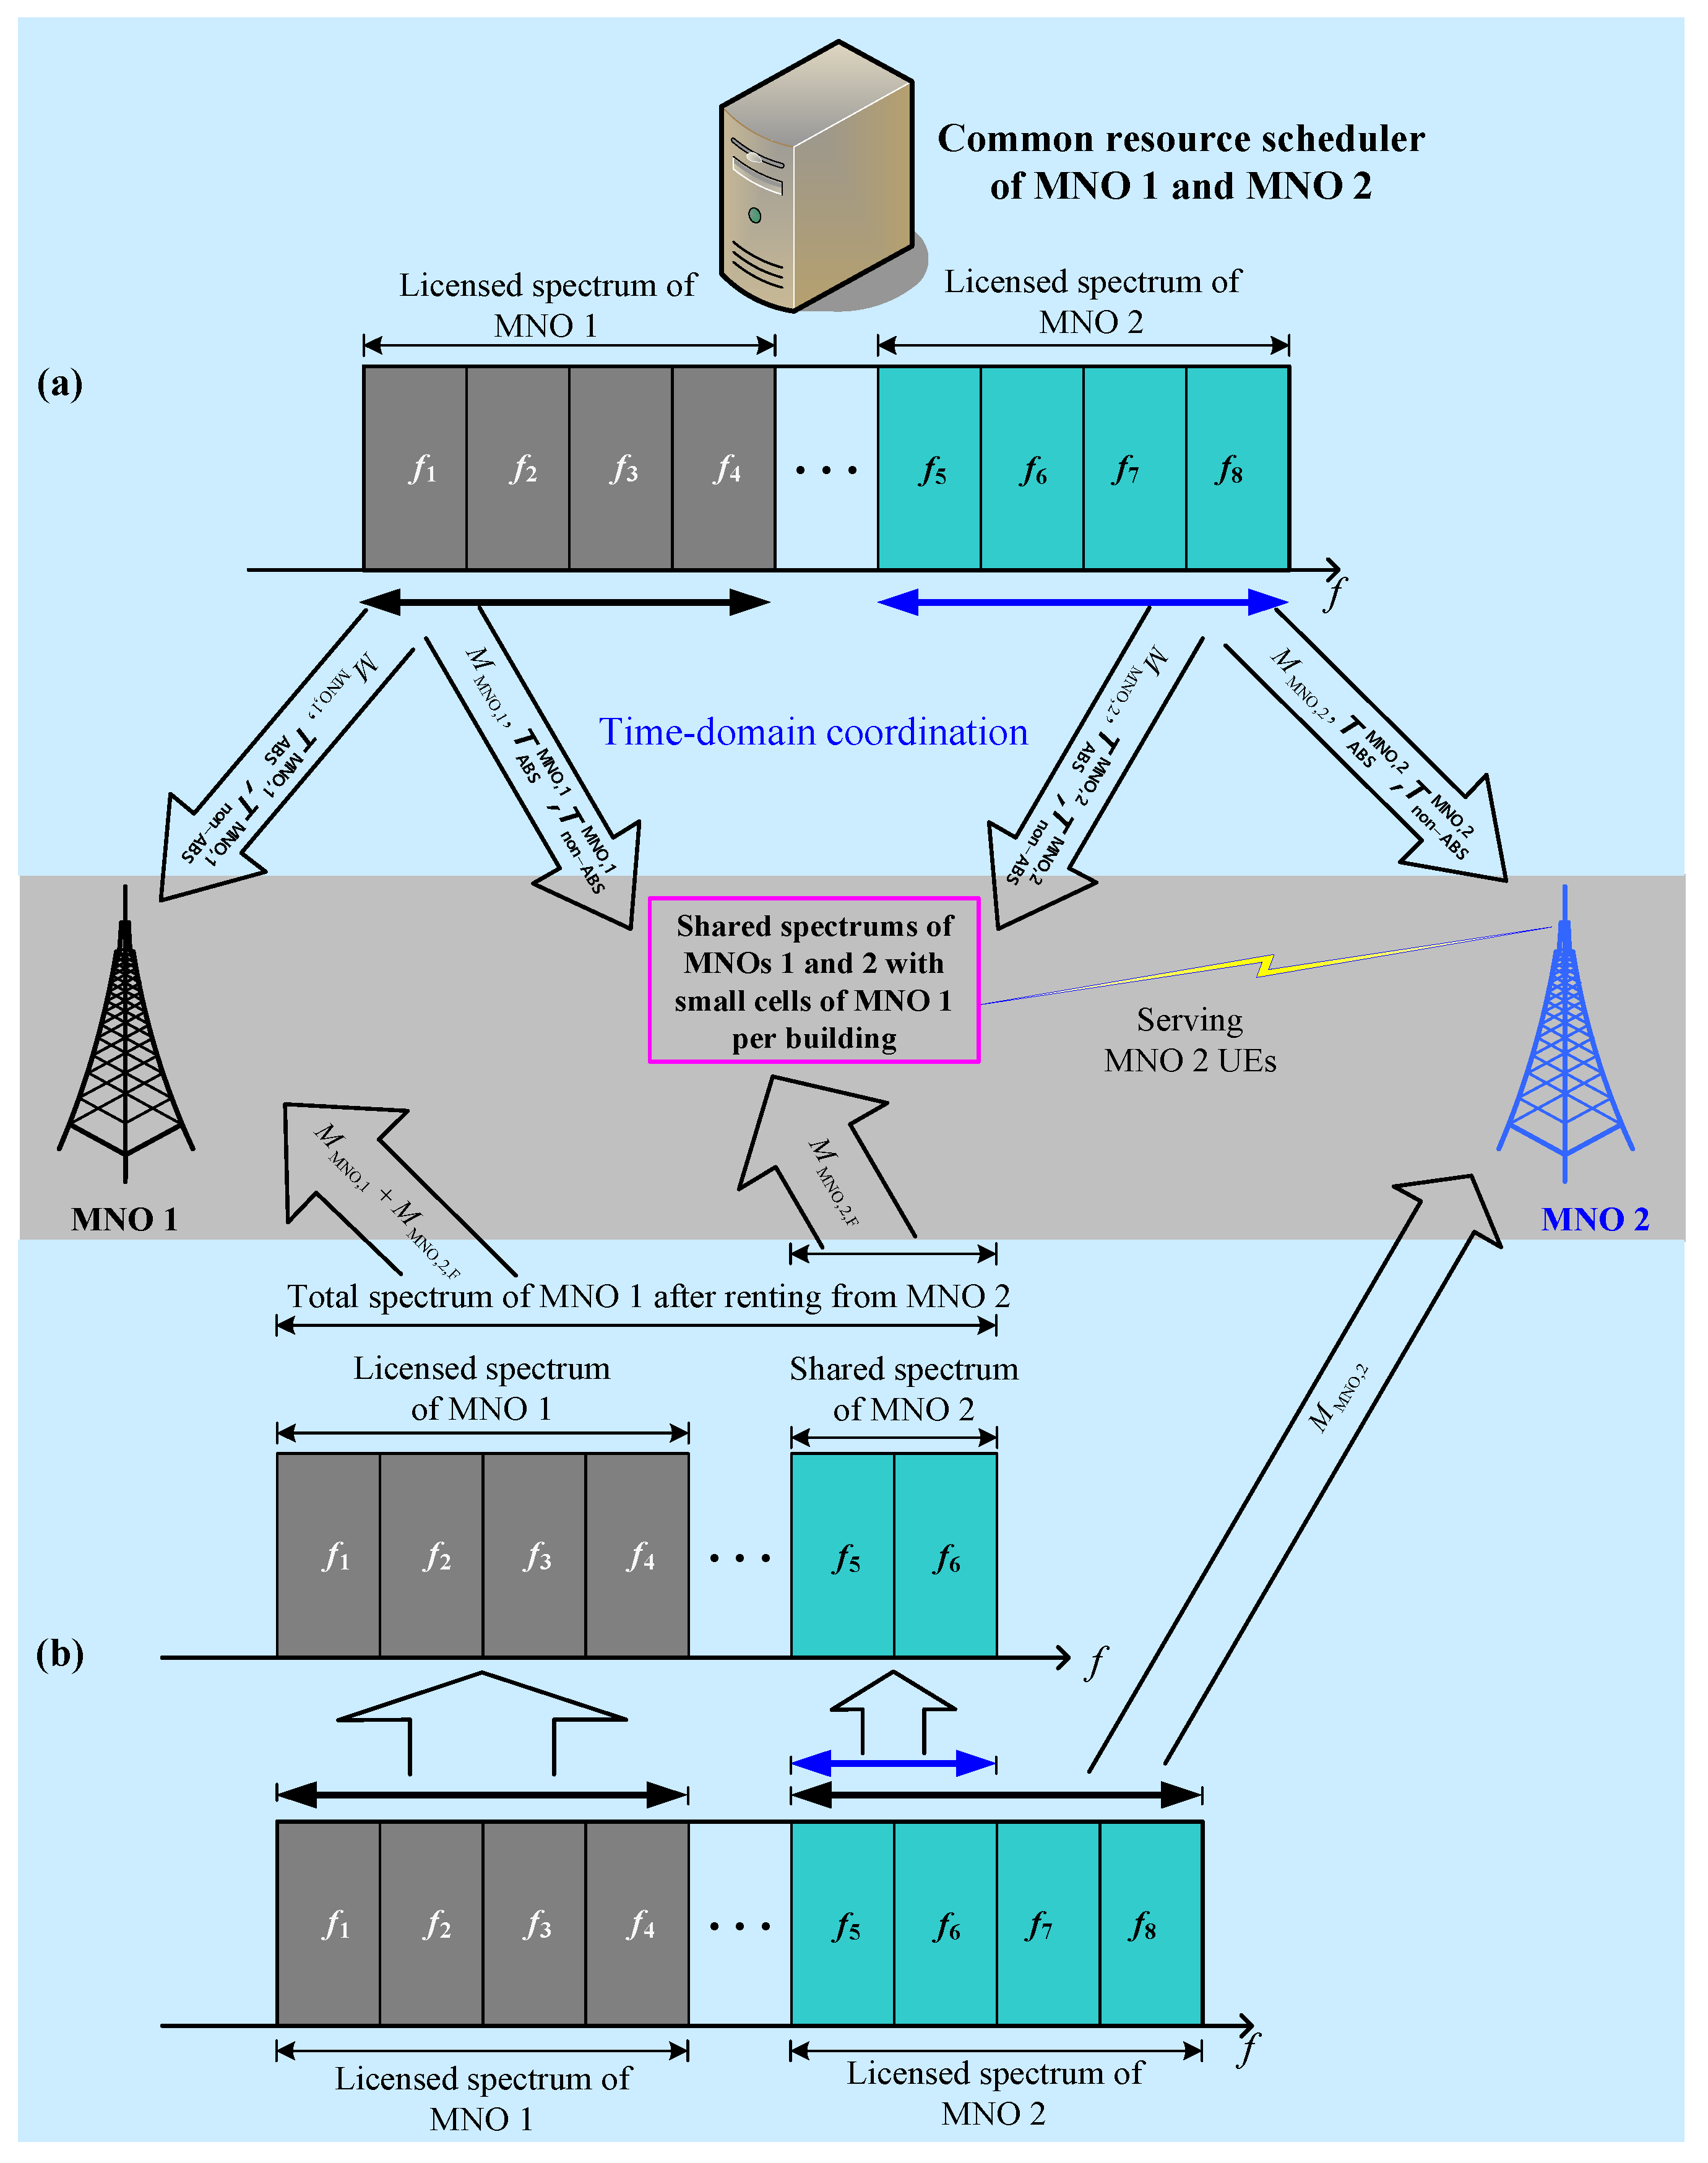
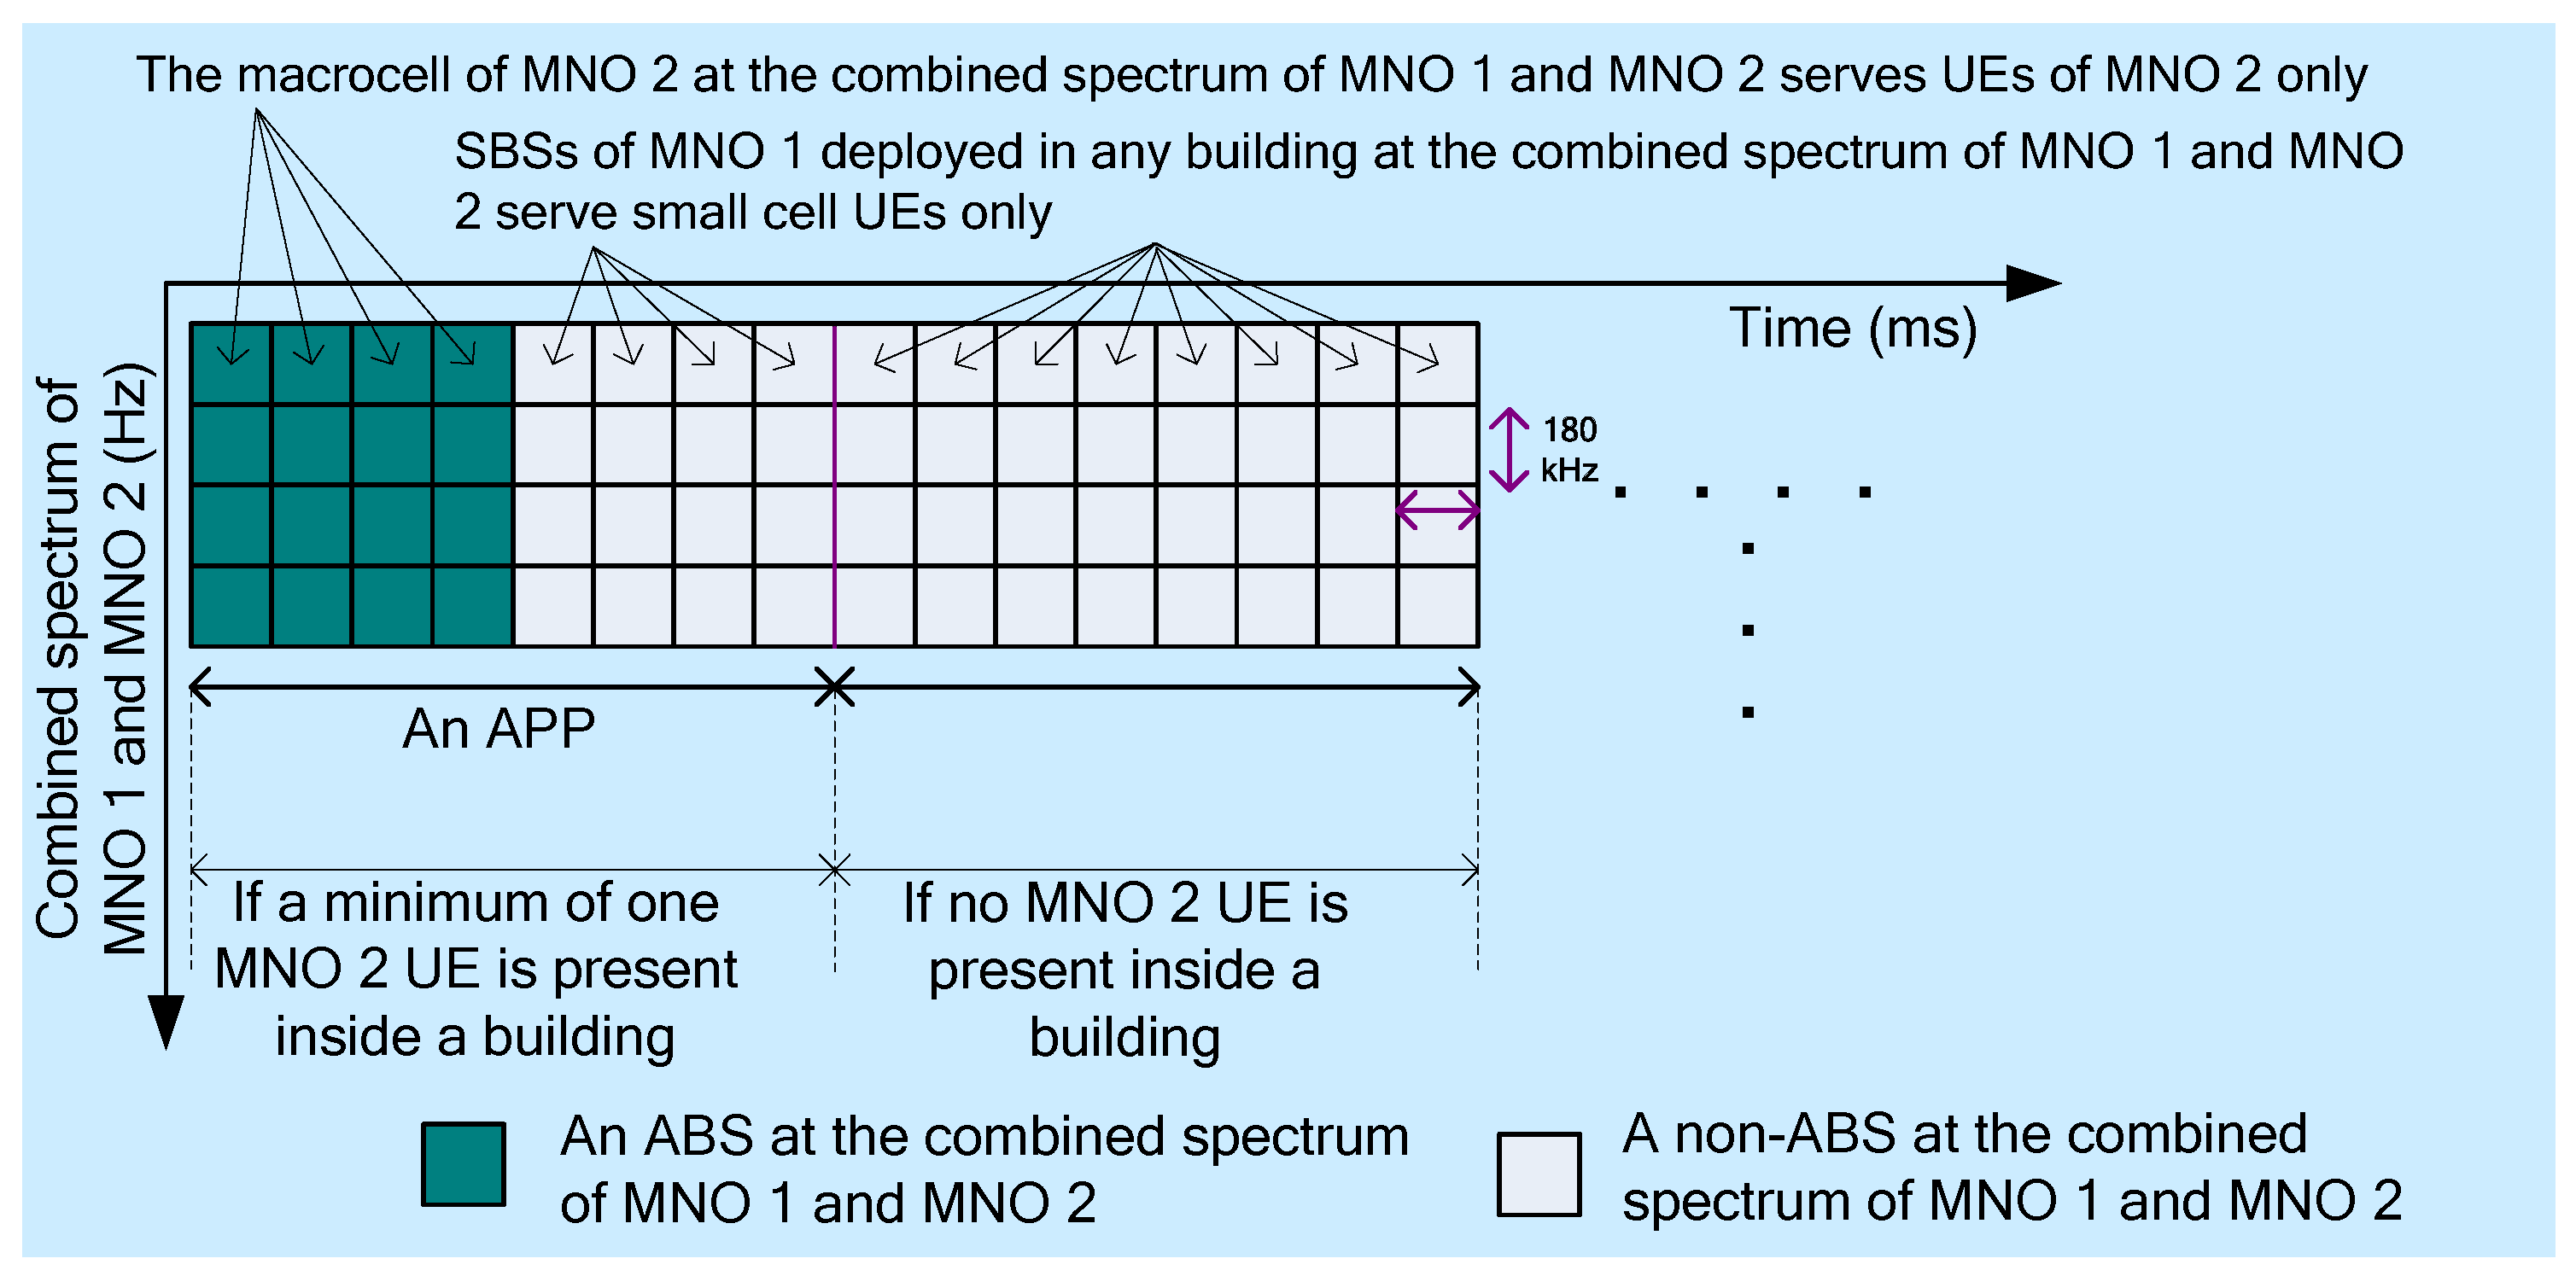
2.3. Co-primary Shared Access

For CoPSA, we consider another MNO termed MNO 2 collocated with the concerned MNO 1 as shown in Figure 4. Both MNO 1 and MNO 2 serve their outdoor macro UEs by their respective entire licensed spectrums. MNO 1 serves its indoor UEs by reusing its macrocell spectrum to small cells deployed within a number of buildings because of the high external wall penetration loss of a building. Assume that the spectrum of MNO 1 is not enough to serve all its indoor UEs and MNO 2 has surplus spectrum so that MNO 2 comes to an agreement with the MNO 1 to share its licensed spectrum. Like MNO 1, by exploring the high external wall penetration loss of each building, MNO 2 shares its macrocell spectrum as well with the small cells of MNO 1 within each building. Hence, each SBS operates at two transceivers where transceiver 1 operates at the spectrum of MNO 1 and transceiver 2 operates in the spectrum of MNO 2, both subject to the respective co-channel interference management strategies. Due to sharing between different MNOs, such kinds of sharing of the spectrum are termed as inter-operator spectrum sharing. We consider two usual cases of CoPSA [6], namely dynamic spectrum sharing by pooling (DySP) and static spectrum sharing by renting (StSR). In DySP, the TD resource scheduling for both MNOs is performed at a commonplace by a TD common resource scheduler (CoRS) whereas the frequency-domain (FD) resource scheduling is performed by local FD schedulers, i.e., one FD scheduler for all macro UEs and one FD scheduler for SBSs per building for both MNO 1 and MNO 2. However, for StSR, TD and FD schedulers of MNO 1 and MNO 2 are located at their respective macrocell base stations (MBSs). Both DySP and StSR are discussed in detail in what follows.

2.3.1. Dynamic Spectrum Sharing by Pooling

In this sharing strategy, MNO 1 shares the entire spectrum of MNO 2 with its in-building small cells. Due to reusing the spectrum of MNO 2, co-channel interference may occur with UEs of MNO 2 wherever they exist within the building. CoRS aggregating the spectrums of both MNOs in a common pool manages such interference by employing the ABS based eICIC technique as shown in Figure 4a. CoRS works as follows to coordinate the operation cycle of the base stations (BSs) of MNO 2 and the SBSs of MNO 1 so that transmission time intervals (TTIs) can be allocated properly to both MNOs. Whenever a UE of MNO 2 exists within a building of small cells of MNO 1, the CoRS informs the FD scheduler of small cells of the corresponding building to mute the transmission of all the SBSs within the building during ABSs and to allow small cells of MNO 1 to transmit only during non-ABSs (Figure 5) per APP.
To ensure the fairness in allocating resources by the CoRS, an optimal number of ABSs per APP to operate both MNO 1 and MNO 2 is derived later based on the ratio of the average of rate of small cell UEs of MNO 1 to the average rate of UEs of MNO 2 within a building at any time. The average rate of UEs of both MNOs is updated in each APP. The value of APP could be 40 TTIs to 60 TTIs depending on the characteristics of the physical medium exchanging information for coordination between the CoRS and MNOs. In general, it is recommended to set the value of APP as high as possible to reduce control signaling for the coordination between entities and hence to reduce spending of the spectrum to carry these signaling such that the update in APP can still capture the characteristics of user traffic dynamics to keep intact the minimum QoS demand of each MNO. Note that the average rate of arrival of UEs of each MNO to a building can be defined by modeling the rate of arrival of UEs of any MNO using the Poisson process.

2.3.2. Static Spectrum Sharing by Renting

In general, the density of UEs of an MNO within a building constitutes a fraction of the total number of UEs served simultaneously at any time by the network. This rationale underpins the fact that the whole spectrum of MNO 2 may not be necessary to share with the average number of small cells per building of MNO 1. Saying it another way, a fraction of the whole shared spectrum would be enough to serve small cell UEs per building. Hence, unlike DySP, instead of sharing the whole spectrum of MNO 2 subject to the interference management with UEs of MNO 2, a portion of the spectrum of MNO 2 would be shared with small cells per building for each TTI. UEs of MNO 2 are served only within the remaining portion of the spectrum of MNO 2. Such kind of static allocation of the spectrum of one MNO through renting for a certain period of time by another is termed as StSR. Over the period of agreement between MNOs, one cannot get access to the spectrum of the other even though one of the MNOs rents the spectrum from the other.
A noticeable advantage of this spectrum sharing policy is that no control signaling for the TD co-ordination is needed to exchange in order to update the number of ABSs per APP dynamically for both MNOs per building by CoRS, which helps overcome the requirement of spectrum usage for exchanging control signaling overhead over the backhauls between MNOs. Hence, based on the above discussion, in StSR, by exploiting the external wall penetration loss of a 3D building, MNO 1 typically asks for renting certain portion of the spectrum of MNO 2 to use exclusively only within the building such that the co-channel interference with outdoor UEs of MNO 2 can be avoided (Figure 4b).
In StSR, both TD and FD schedulers of each MNO schedule their respective UEs. As the LTE system bandwidth can be allocated to an MNO in various amounts, e.g., 1.5, 5, 10, 20, 40, and 100 MHz, StSR gives a flexibility in renting spectrum from MNO 2 such that an appropriate amount of spectrum can be rented to serve the user demand per building to improve the spectral utilization of MNO 1. Note that the rented spectrum can be flexibly operated with the existing spectrum of MNO 1 without any significant network modification. For example, following the contiguous/non-contiguous carrier aggregation techniques, the shared spectrum of MNO 2 can be aggregated to that of MNO 1’s own spectrum. Further, the shared spectrum is rented by MNO 1 by a fixed amount and does not vary with the time irrespective of the load demand of small cells. Hence, no coordination signaling is required.
Furthermore, for the multiband enabled small cells, the whole spectrum of an MNO itself can be shared with its in-building small cells within each building to avoid additional spectrum licensing fee. However, because of different operating mechanisms for sharing the spectrums of different MNOs to address issues such as interference management, both spectrums of different MNOs cannot be operated by the same transceiver. This requires an additional transceiver on top of the existing transceiver operating at the spectrum of MNO itself resulting in each small cell is enabled with dual transceivers. Hence, in such dual-transceiver enabled small cells, one of the transceivers of each small cell operates at its own MNO spectrum and the other transceiver operates at a portion or the whole spectrum of the other MNO.
Hence, for the small cells of MNO 1, transceiver 1 of a small cell operates at the spectrum of MNO 1 itself. Since all macro UEs and small cell UEs are served at the same MNO 1 spectrum, whenever a macro UE is present in the building within the coverage of any SBS, such an indoor macro UE causes co-channel interference to small cells and their UEs. To avoid such co-channel interference between indoor macro UEs and small cells and its UEs, we consider employing the ABS based eICIC technique with the small cells within a building such that indoor macro UEs are only allowed to operate during ABSs, whereas small cell UEs operate during non-ABSs. However, small cells can serve their UEs in all TTIs of all APPs at the absence of all macro UEs within the building (Figure 6). The transceiver 2 of a small cell of MNO 1 operates following either the DySP or the StSR techniques as described before.
A number of notable features of static sharing that seems to be beneficial as compared to dynamic spectrum sharing are as follows:
  • The strategy can help generate some revenues for MNO 2.
  • No coordination between networks of MNOs 1 and 2 is needed.
  • Unlike dynamic spectrum sharing, no CoRS is needed for real-time update and allocation of spectrum to the UEs of both MNOs.
  • No spectrum is wasted because of the coordination control signaling exchanging over the backhaul between MNOs’ networks.
  • Less complex and cost-effective solution in realization and maintenance as compared to the dynamic spectrum sharing since there is no cost associated with the CoRS implementation.
  • No need for the interference management for static sharing since small cell UEs of MNO 1 and UEs of MNO 2 operate at the orthogonal spectrum of MNO 2.
Remark 1.
Note that the spectrum renting and spectrum pooling are the typical co-primary licensed spectrum sharing techniques to use the licensed spectrum of one operator exclusively at equal rights under the approval of NRA [6].

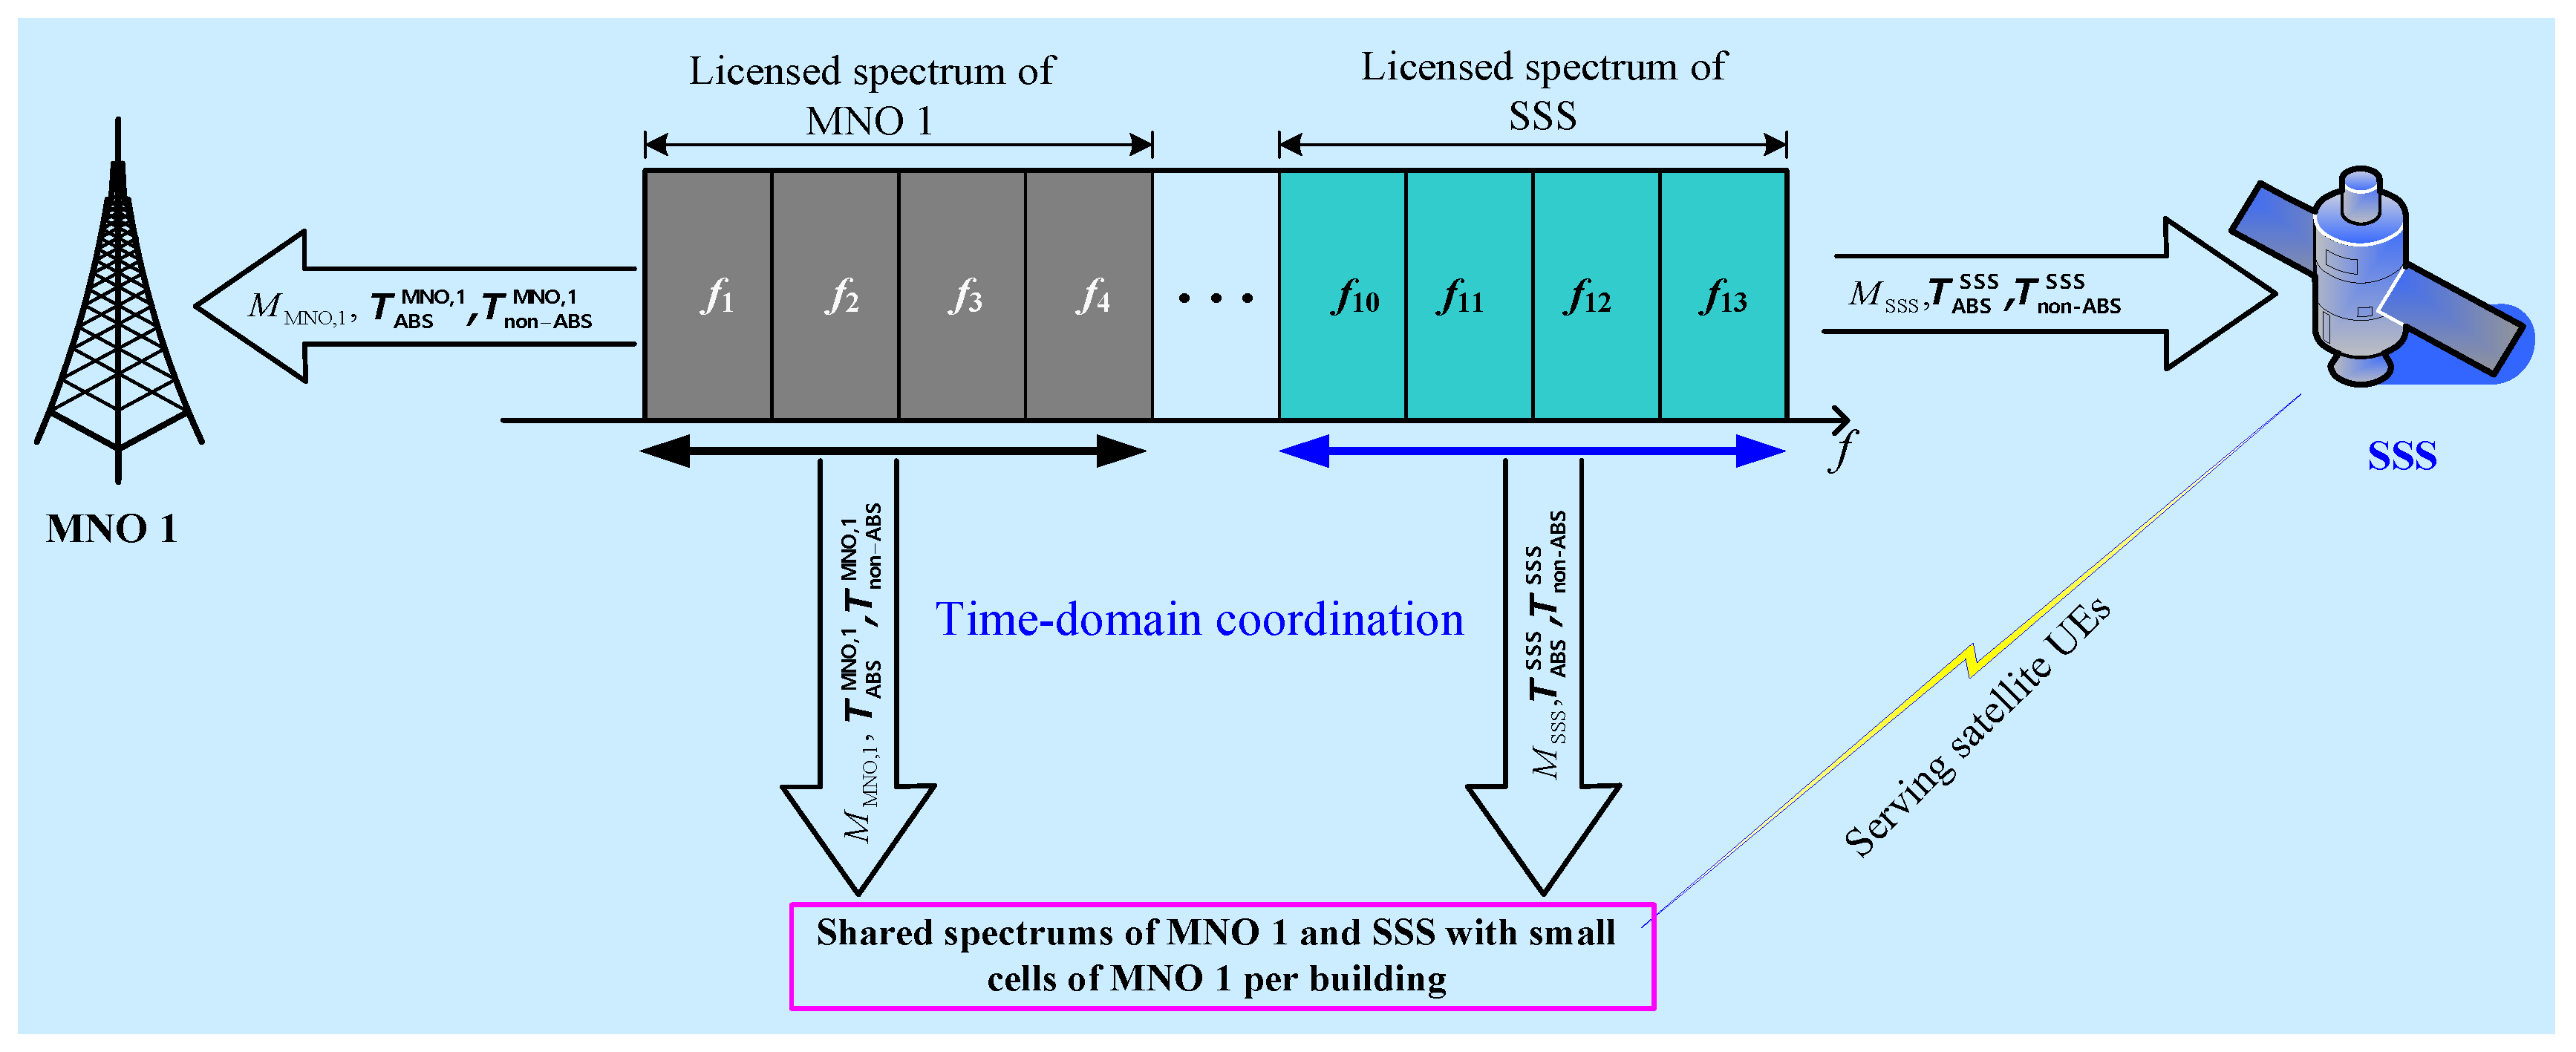
2.4. Licensed Shared Access

In LSA, other than only between MNOs, non-MNOs can also share their spectrums with one or more MNOs. LSA differs mainly from the Authorized Shared Access (ASA) by the fact that ASA addresses mainly spectrum sharing between MNOs only. In this paper, we consider a satellite system license holder also known as the incumbent as a non-MNO, which shares its spectrum with MNO 1 as shown in Figure 7. Due to high external wall penetration loss of any building, we consider sharing the entire satellite spectrum to one transceiver and the spectrum of MNO 1 to the other transceiver of small cells of MNO 1 deployed in each building. Both the satellite and mobile spectrums are allocated orthogonally to all small cells. We assume that the multiband enabled SBSs can serve satellite UEs only at the satellite spectrum. However, small cell UEs can be served at both the satellite and mobile spectrums by SBSs within a building. The presence of any satellite UE inside a building causes co-channel interference with the SBSs, which is avoided according to the following interference management strategies as shown in Figure 5:
  • Multiband enabled SBSs serve small cell UEs at the satellite spectrum as follows. If a satellite UE is present inside a building, during non-ABSs t non ABS SPS T | T ABS SPS of an APP, small cell UEs can be served and during ABSs t non ABS SPS T ABS SPS , satellite UEs can be served. However, if no satellite UE is present inside a building, in any TTI of an APP, small cell UEs can be served (Figure 5).
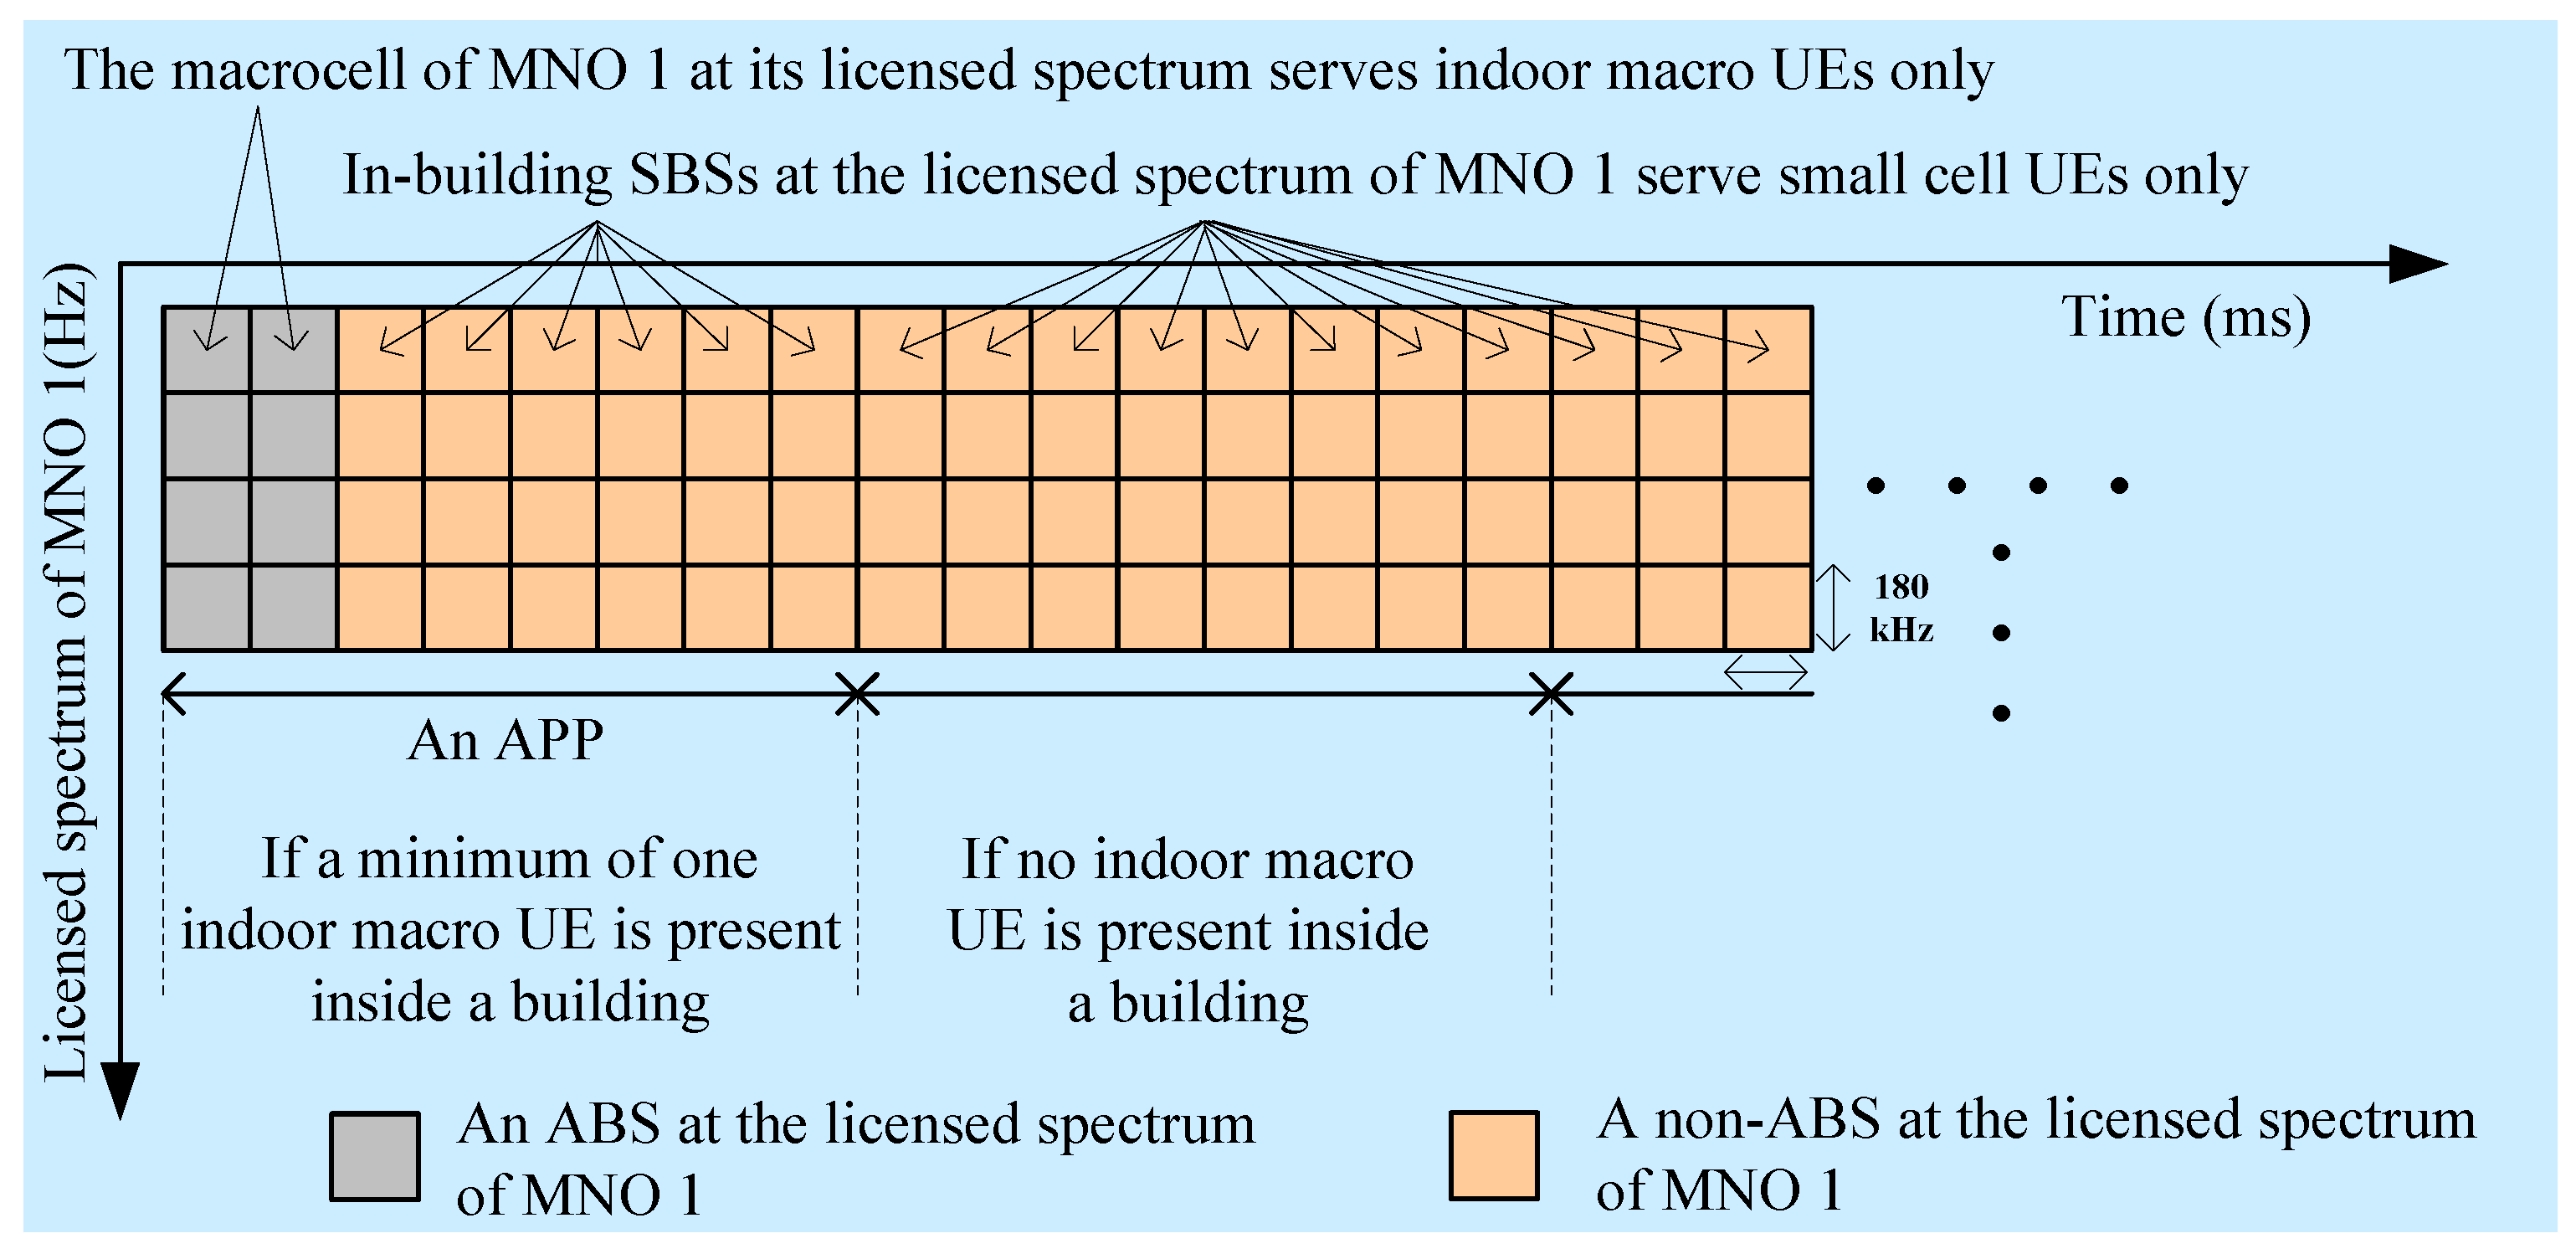
  • Similarly, small cells UEs can be served by multiband enabled SBSs at the mobile spectrum as follows. At the presence of an indoor macro UE, during non-ABSs t non ABS MNO , 1 T | T ABS MNO , 1 of an APP, small cell UEs can be served and during ABSs t ABS MNO , 1 T ABS MNO , 1 , indoor macro UEs can be served. In the absence of an indoor macro UE within a building, small cell UEs can be served at the mobile spectrum in any TTI of an APP (Figure 6).

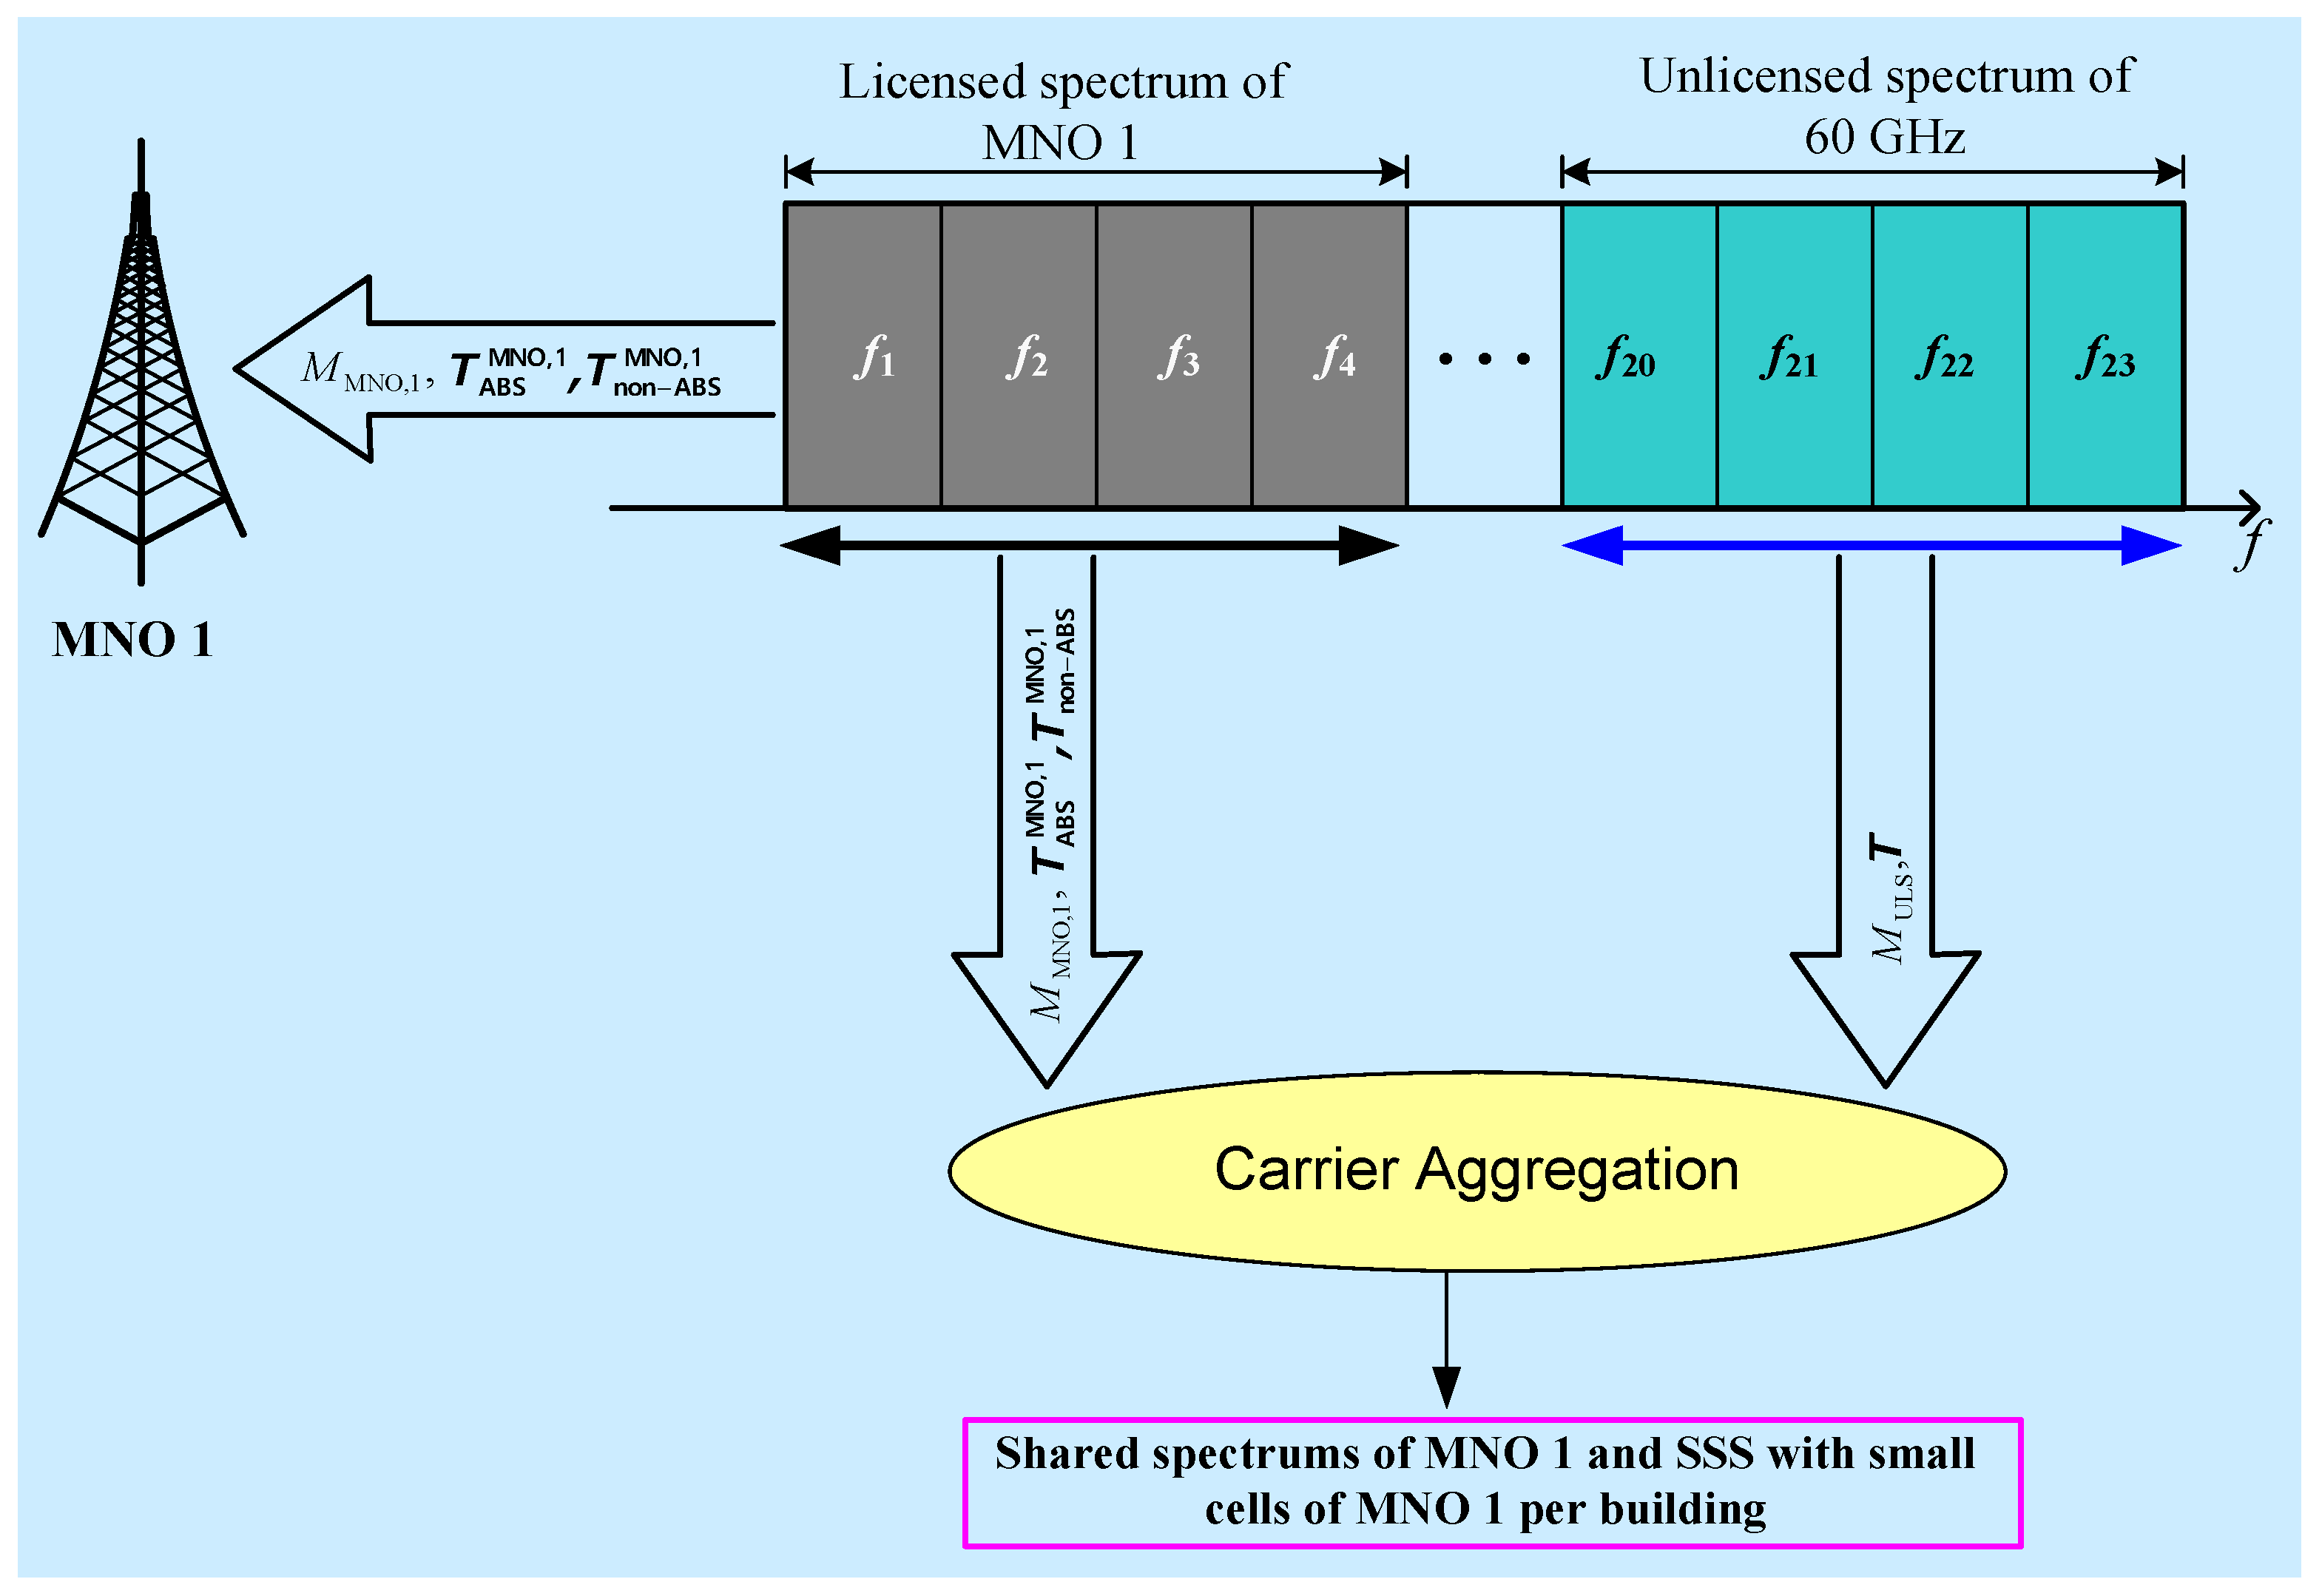
2.5. Licensed Assisted Access

Since small cells can operate at multiple bands, unlike LSA, a licensed spectrum band can also be operated simultaneously along with an unlicensed or license-exempt spectrum band by using the well-known carrier aggregation (CA) techniques to increase the system bandwidth and hence the spectral efficiency. Such spectrum access methods are termed as LAA. Typically, license-exempt bands include 60 GHz, 5 GHz, and 2.4 GHz industrial, scientific, and medical (ISM) bands. Due to no licensing fee and no need for considerable modifications on the existing mobile infrastructure because of using the existing CA techniques to aggregate both the licensed and unlicensed bands, LAA is considered as one of the cost-effective solutions to increase the system spectrum bandwidth. The only requirement to enable LAA is to enable SBSs of an MNO with multiple bands. Though operating at ISM bands has a common advantage of no licensing fee, 60 GHz band benefits from a number of aspects as compared to 2.4 GHz and 5 GHz bands, particularly in short range indoor communications, as follows:
  • Availability of a huge amount of unused spectrum (57 to 66 GHz) can address high network capacity,
  • High attenuation (specifically, additional free-space losses of 27.96 and 21.58 dB, respectively, on top of what at 2.4 GHz and 5 GHz for the same distance [22]) and large in-building material absorption results in low co-channel interference from neighboring cells,
  • Small wavelength resulting in low aperture areas and hence enabling an array of antennas to deploy in small spaces to support high antenna directivity, and
  • Low level of multipath effect and hence high possibility of the existence of line-of-sight (LOS) components at 60 GHz band than that at 2.4 GHz and 5 GHz band
Due to the aforementioned benefits, we consider 60 GHz as an unlicensed spectrum to aggregate with a licensed spectrum for LAA. Figure 8 shows a multiband enabled small cell operating at the licensed spectrum of MNO 1 and unlicensed spectrum of 60 GHz.

2.6. Algorithm

Algorithm 1 shows the logical operation of the realized spectrum sharing access techniques, including dedicated access, co-primary shared access, LSA, and LAA. Other than static spectrum renting and LAA techniques, the degree of shared spectrum allocated to SBSs per building depends directly on the ABS pattern per APP for all techniques. The dedicated spectrum access technique needs only the transceiver 1 of each SBS. Since all other techniques work on both transceiver 1 and transceiver 2, implicitly, the dedicated spectrum access technique is an integral part of CoPSA, LSA, and LAA techniques.
Algorithm 1. Realized spectrum sharing techniques
01: Input: MNO 1 spectrum, MNO 2 spectrum, satellite spectrum,
     60 GHz unlicensed spectrum, TAPP, L
02: For Transceiver 1
03:  For Dedicated Spectrum Access
04:     If an indoor macro UE exists within a building
05:      TTI→ABS
06:      MNO 1 spectrum → indoor macro UEs
07:     Elseif an indoor macro UE does not exist within a building
08:      TTI→non-ABS
09:      MNO 1 spectrum → Transceiver 1 of in-building SBSs
10:     End
11:  End
12:  For CoPSA||LSA||LAA
13:    Run lines 04-11 once for each technique, i.e., CoPSA, LSA, and LAA
14:  End
15: End                              // End of Transceiver 1
16: For Transceiver 2
17:   If CoPSA
18:    Spectrum of MNO 2 → Transceiver 2 of small cells
19:     If Dynamic spectrum sharing by pooling (DySP)
20:      Allocate the outdoor UEs of MNO 1 to anywhere over the whole spectrum of MNO 1
21:      Allocate the outdoor UEs of MNO 2 to anywhere over the whole spectrum of MNO 2
22:      If TTI==ABS
23:       Allocate the spectrum of MNO 2 to UEs of MNO 2 within each 3D building
24:      Elseif TTI==non-ABS
25:       Allocate the spectrum of MNO 2 to small cell UEs of MNO 1 within each 3D building
26:      End
27:     Elseif Static spectrum sharing by renting (StSR)
28:      Allocate the outdoor UEs of MNO 1 to anywhere over the whole spectrum of MNO 1
29:      If a UE of MNO 2 exists within a 3D building
30:       Allocate rented shared spectrum of MNO 2 to small cell UEs of MNO 1
         within each 3D building
31:       Allocate the UE of MNO 2 to the rest of the spectrum of MNO 2 orthogonal
         to the rented shared spectrum for MNO 1 within each 3D Building
32:      Elseif a UE of MNO 2 exists outside of any 3D building
33:       Allocate the UE of MNO 2 to anywhere over the whole spectrum of MNO 2
34:      End
35:     End
36:  Elseif LSA
37:    Spectrum of a Satellite System → Transceiver 2 of small cells
38:     If TTI==ABS
39:      Allocate the spectrum of a satellite system to satellite UEs within each 3D building
40:     Elseif TTI==non-ABS
41:      Allocate the spectrum of a satellite system to small cell UEs of MNO 1
         within each 3D building
42:     End
43:  Elseif LAA
44:    60 GHz Unlicensed Spectrum→ Transceiver 2 of small cells
45:      Allocate the 60 GHz Unlicensed Spectrum to small cell UEs of MNO 1
        within each 3D building
46:  End
47: End                              // End of Transceiver 2
48: Estimate and Output: Aggregate capacity, spectral efficiency, energy efficiency
            of UEs of MNO 1 for multiband enabled small cells

3. Problem Formulation

3.1. Preliminaries

Denote N as the total number of macro UEs of which a certain percentage of macro UEs denoted as µMI is considered inside a number of buildings over the coverage of a macrocell of MNO 1. The maximum number of buildings and the number of small cells, i.e., femtocells, per building are denoted respectively by L and SF. We assume that SF is the same for all buildings and each small cell serves exactly one UE in any TTI. Though in general, the number of small cell UEs in one building is independent of the other, for simplicity, we assume that in each of the L buildings, the same number of small cells is deployed.
Denote T as the simulation run time such that T = {1, 2, 3, …, Q} where Q represents the maximum time. Let TABS denote the number of ABSs in every APP where an APP consists of eight subframes such that TABS = {t: t = 8v + z; v = 0, 1, 2, …, Q/8; z = 1, …, TABS}. Note that TABS = 1, 2, …, 8 that corresponds to ABS patterns φ = 1/8, 2/8, …, 8/8, respectively. Let tABS and tnon-ABS denote respectively an ABS and a non-ABS such that t n o n A B S T A B S and t non ABS T \ T A B S S P S .
Let M MNO , 1 denote the number of RBs in the spectrum bandwidth of MNO 1 where an RB is equal to 180 kHz. Let SP and SM denote respectively the number of picocell BSs (PBSs) per MBS and the number of MBSs in the system. Recall that there are SF SBSs per 3D building such that s ∈ {1, 2, …, SF}. Let PSC,1 and PSC,1 denote respectively the transmitting power of transceiver 1 and transceiver 2 of an SBS.
The downlink received signal-to-interference-plus-noise ratio for a UE at resource block (RB) = i in TTI = t can be expressed as:
ρ t , i = ( P t , i / ( N t , i s + I t , i ) ) × H t , i
where Pt,i is the transmit power, N t , i s is the noise power, It,i is the total interference signal power, and Ht,i is the link loss for a link between a UE and a BS at RB = i in TTI = t.
Ht,i can be expressed in dB as:
H t , i ( dB ) = ( G t + G r ) ( L F + P L t , i ) + ( L S t , i + S S t , i )
where (Gt + Gr) and LF are respectively the total antenna gain and connector loss. LSt,i, SSt,i, and PLt,i, respectively, denote the large scale shadowing effect, small scale Rayleigh or Rician fading, and distance-dependent path loss between a BS and a UE at RB = i in TTI = t [23].
Let β denote the implementation loss factor. Using Shannon’s capacity formula, a link throughput at RB = i in TTI = t in bps per Hz is given by [24,25]:
σ t , i ( ρ t , i ) = { 0 , ρ t , i < 10   dB β log 2 ( 1 + 10 ( ρ t , i ( dB ) / 10 ) ) , 10   dB ρ t , i 22   dB 4.4 , ρ t , i > 22   dB }

3.2. Dedicated Access

For a single building, i.e., L = 1, the aggregate capacity of all macro UEs of MNO 1 can be expressed as:
σ MNO , 1 MC , WIM = t = 1 Q i = 1 M MNO , 1 σ t , i ( ρ t , i )
where σ and ρ are the responses over MMNO,1 RBs in t T such that indoor macro UEs are scheduled only during t ABS T A B S M N O , 1 and all other macro UEs are scheduled during t non ABS T n o n A B S M N O , 1 .
Since in dedicated access, SBSs per building operate at the same spectrum of MNO,1 in non-ABSs t non ABS T n o n A B S M N O , 1 , the capacity served by an SBS is then given by:
σ s , DedA = t = t non - ABS T \ T ABS MNO , 1 i = 1 M MNO , 1 σ t , i ( ρ t , i )
Then for all SBSs per building, the aggregate capacity can be expressed as:
σ MNO , 1 SC , DedA = s = 1 S F σ s , DedA
Hence, using Equation (4), the system level capacity of MNO 1 for the dedicated access technique is given by:
σ MNO , 1 SYS , DedA = σ MNO , 1 MC , WIM + σ MNO , 1 SC , DedA
Using (7), the average spectral efficiency of MNO 1 for L = 1 is given by:
σ MNO , 1 SE , DedA = σ MNO , 1 SYS , DedA / ( M MNO , 1 × Q )
Likewise, the average energy efficiency of MNO 1 in Joules/bit (J/b) for L = 1 is given by:
σ MNO , 1 EE , DedA = ( ( S F × ( | T n o n A B S M N O , 1 | / | T | ) × P SC , 1 ) + + ( S P × P PC ) + ( S M × P MC ) ) / ( σ MNO , 1 SYS , DedA / Q )
where T n o n A B S M N O , 1 represents a set of non-ABSs when SBSs are scheduled to serve small cell UEs.
For L > 1, we assume that the indoor propagation characteristics and the distance of UEs from their respective SBSs in each of the L buildings do not deviate significantly from one another [26] such that by linear approximation the average aggregate capacity for the dedicated access technique is roughly given by for L > 1:
σ MNO , 1 , L SYS , DedA = σ MNO , 1 MC , WIM + ( L × σ MNO , 1 SC , DedA )
Using (10), for L buildings, the spectral efficiency is given by:
σ MNO , 1 , L SE , DedA = σ MNO , 1 , L SYS , DedA / ( M MNO , 1 × Q )
Similarly, the energy efficiency is given by:
σ MNO , 1 , L EE , DedA = ( ( L × S F × ( | T n o n A B S M N O , 1 | / | T | ) × P SC , 1 ) + + ( S P × P PC ) + ( S M × P MC ) ) / ( σ MNO , 1 , L SYS , DedA / Q )

3.3. Co-primary Shared Access

3.3.1. Dynamic Spectrum Pooling Technique

If M MNO , 2 denotes the total number of RBs in MNO 2 spectrum the total spectrum due to spectrum pooling at CoRS is given by:
M MNO , T = M MNO , 1 + M MNO , 2
Since the transceiver 2 of all SBSs of MNO 1 per building operate at the spectrum of MNO 2 at CoRS during non-ABSs t non ABS T \ T A B S M N O , 2 , the capacity served by an SBS at MNO 2 spectrum is then given by:
σ s DySP = t = t non - ABS T \ T ABS MNO , 2 i = 1 M MNO , 2 σ t , i ( ρ t , i )
Now following (6), the aggregate capacity for all SBSs per 3D building due to MNO 2 spectrum is given by:
σ DySP , Trans 2 SC = s = 1 S F σ s DySP
Recall that the transceiver 1 of each SBS operates at the MNO 1 spectrum, which contributed the capacity as given by (6) as follows:
σ DySP , Trans 1 SC = σ MNO , 1 SC , DedA = s = 1 S F σ s , DedA
Now using (15) and (16), the aggregate capacity of all SBSs by per building enabled with both spectrums of MNO 1 and MNO 2 for the DySP technique is given by:
σ DySP , MB SC = σ DySP , Trans 1 SC + σ DySP , Trans 2 SC
So, using (4) and (17), the aggregate capacity of MNO 1 for all dual-band enabled SBSs per building is given by:
σ DySP , MB SYS = σ MNO , 1 MC , WIM + σ DySP , MB SC
Remark 2.
Note that, in estimating the spectral efficiency, we consider only the licensed spectrum of an MNO, not the shared or reused spectrum from other MNOs or systems. Hence, the capacity that is achieved by the spectrum of MNO 2 using SBSs for MNO 1 can be interpreted as the capacity achieved because of sharing the same MNO 2 spectrum with MNO 1 [26] such that the effective spectrum of MNO 1 is its licensed spectrum of M MNO , 1 RBs only.
Now, after sharing the spectrum with its SBSs, the average spectral efficiency of MNO 1 is given by:
σ DySP , MB SE = σ DySP , MB SYS / ( M MNO , 1 × Q )
Similarly, the average system-level energy efficiency of MNO 1 after sharing spectrums with its SBSs per building in Joules/bit (J/b) is given by [13]:
σ DySP , MB EE = ( ( S F × ( | T n o n A B S M N O , 1 | / | T | ) × P SC , 1 ) + ( S F × ( | T n o n A B S M N O , 2 | / | T | ) × P SC , 2 ) + + ( S P × P PC ) + ( S M × P MC ) ) / ( σ DySP , MB SYS / Q )
where T n o n A B S M N O , 1 denotes the set of non-ABSs when SBSs operate at the MNO 1 spectrum to serve small cell UEs and T n o n A B S M N O , 2 denotes the set of non-ABSs when SBSs serve small cell UEs at the MNO 2 spectrum.
For L > 1, applying the assumption for (10), the average aggregate capacity of MNO 1 is roughly given by for DySP:
σ DySP , MB , L SYS = σ MNO , 1 MC , WIM + ( L × σ DySP , MB SC )
Now, the spectral efficiency is given by:
σ DySP , MB , L SE = σ DySP , MB , L SYS / ( M MNO , 1 × Q )
Similarly, the energy efficiency is given by:
σ DySP , MB , L EE = ( ( L × S F × ( | T n o n A B S M N O , 1 | / | T | ) × P SC , 1 ) + ( L × S F × ( | T n o n A B S M N O , 2 | / | T | ) × P SC , 2 ) + + ( S P × P PC ) + ( S M × P MC ) ) / ( σ DySP , MB , L SYS / Q )

3.3.2. Static Spectrum Renting Technique

Let MStSR denote the number of RBs of MNO 2 that is rented to MNO 1 such that MStSR < MMNO,1. Then, the total spectrum of MNO 1 due to spectrum renting is given by:
M MNO , 1 , SR = M MNO , 1 + M StSR
For the StSR technique, Since the transceiver 2 of all SBSs of MNO 1 per building operate only at the shared rented spectrum, i.e., MStSR RBs, in all TTIs tT, then the capacity served by an SBS is then given by,
σ s StSR = t T i = 1 M StSR σ t , i ( ρ t , i )
For all SBSs per 3D building, if serving simultaneously in tT at the rented spectrum of MStSR RBs on transceiver 2, the aggregate capacity per 3D building for static spectrum renting technique is then given by,
σ StSR , Trans 2 SC = s = 1 S F σ s StSR
Like DySP, in StSR, the transceiver 1 of each SBS operates at the MNO 1 spectrum, such that the aggregate capacity of all N macro UEs for M MNO , 1 RBs and Q TTIs is given by:
σ StSR , Trans 1 SC = σ MNO , 1 SC , DedA = s = 1 S F σ s , DedA
Then, the overall aggregate capacity served by all SBSs enabled both the MNO 1 spectrum and the rented MNO 2 spectrum in StSR technique is given by in a 3D building, i.e., L = 1:
σ StSR , MB SC = σ StSR , Trans 1 SC + σ StSR , Trans 2 SC
Conversely, using (4), the system level capacity of MNO 1 for the dual-band enabled SBSs is given by:
σ StSR , MB SYS = σ MNO , 1 MC , WIM + σ StSR , MB SC
Now, the average spectral efficiency of MNO 1 after sharing the spectrum with its SBSs is given by:
σ StSR , MB SE = σ StSR , MB SYS / ( ( M MNO , 1 + M StSR ) × Q )
Note that in estimating spectral efficiency above, we assume that the rented spectrum given to MNO 1 is with exclusive right and MNO 2 gets paid for the license of the rented spectrum such that MNO 2 cannot use the rented spectrum for a particular duration of time as negotiated between MNOs. Hence, the rented spectrum is treated as the licensed spectrum. Similarly, the average energy efficiency of MNO 1 per building in Joules/bit (J/b) is given for multiband enabled SBSs by:
σ StSR , MB EE = ( ( S F × ( | T n o n A B S M N O , 1 | / | T | ) × P SC , 1 ) + ( S F × P SC , 2 ) + ( S P × P PC ) + ( S M × P MC ) ) / ( σ DySP , MB SYS / Q )
Now, following the assumption for dynamic spectrum pooling for L > 1, the average aggregate capacity of MNO 1 for static spectrum renting technique is roughly given by:
σ StSR , MB , L SYS = σ MNO , 1 MC , WIM + ( L × σ StSR , MB SC )
Now, the spectral efficiency is given by:
σ StSR , MB , L SE = σ StSR , MB , L SYS / ( ( M MNO , 1 + M StSR ) × Q )
Similarly, the energy efficiency is given by:
σ StSR , MB , L EE = ( ( L × S F × ( | T n o n A B S M N O , 1 | / | T | ) × P SC , 1 ) + ( L × S F × P SC , 2 ) + ( S P × P PC ) + ( S M × P MC ) ) / ( σ StSR , MB , L SYS / Q )

3.4. Licensed Shared Access

Denote M SPS as the number of RBs in the space-satellite system (SPS) spectrum. Since the transceiver 2 of all SBSs of MNO 1 per building operate at the SPS spectrum bandwidth at CoRS during non-ABSs t non ABS SPS T | T A B S S P S , the aggregate capacity from the SPS spectrum is then for a single SBS is given by:
σ s LSA = t = t non - ABS SPS T \ T A B S S P S i = 1 M SPS σ t , i ( ρ t , i )
Hence, for SF small cells, the aggregate capacity per 3D building is given by:
σ LSA , Tran 2 SC = s = 1 S F σ s LSA
Since the transceiver 1 of each SBS operates at the MNO 1 spectrum, the capacity is given by (6) as follows:
σ LSA , Trans 1 SC = σ MNO , 1 SC , DedA = s = 1 S F σ s , DedA
Hence, the overall aggregate capacity served by all SBSs enabled with multiband in a 3D building is given by:
σ LSA , MB SC = σ LSA , Trans 1 SC + σ LSA ,   Trans 2   SC
Conversely, using (4) the system level capacity of MNO 1 for the multiband enabled SBSs with LSA is given by:
σ LSA , MB SYS = σ MNO , 1 MC , WIM + σ LSA , MB SC
Now, following the consideration mentioned in Remark 2 the average system-level spectral efficiency of MNO 1 after sharing the incumbent satellite spectrum with its SBSs is given by:
σ MNO , 1 LSA , SE = σ LSA , MB SYS / ( M MNO , 1 × Q )
Similarly, the average system-level energy efficiency of MNO 1 after sharing satellite and MNO 1 spectrums with its SBSs per building in Joules/bit (J/b) is given by:
σ MNO , 1 LSA , EE = ( ( S F × ( | T n o n A B S M N O , 1 | / | T | ) × P SC , 1 ) + ( S F × ( | T n o n A B S S P S | / | T | ) × P SC , 2 ) + + ( S P × P PC ) + ( S M × P MC ) ) / ( σ MNO , 1 LSA , SYS / Q )
For L > 1, applying the assumption for (10), the average aggregate capacity of MNO 1 is roughly given by for LSA:
σ LSA , MB , L SYS = σ MNO , 1 MC , WIM + ( L × σ LSA , MB SC )
Now, the spectral efficiency for L buildings is given by:
σ LSA , MB , L SE = σ LSA , MB , L SYS / ( M MNO , 1 × Q )
Similarly, the energy efficiency for L buildings is given by:
σ LSA , MB , L EE = ( ( L × S F × ( | T n o n A B S M N O , 1 | / | T | ) × P SC , 1 ) + ( L × S F × ( | T n o n A B S S P S | / | T | ) × P SC , 2 ) + + ( S P × P PC ) + ( S M × P MC ) ) / ( σ LSA , MB , L SYS / Q )

3.5. Unlicensed Shared Access

Let M ULS denote the number of RBs in the 60 GHz unlicensed spectrum (ULS) bandwidth. Since MNO 1 operates at a different frequency from that of the ULS, the transceiver 2 of SBSs in LAA enabled with the ULS can operate in all TTIs t ULS T . The capacity served by the ULS enabled transceiver of an SBS is given by:
σ s ULS = t = t ULS T i = 1 M ULS σ t , i ( ρ t , i )
Hence, for SF SBSs, the aggregate capacity per 3D building is given by:
σ LSA , Trans 2 SC = s = 1 S F σ s ULS
However, the transceiver 1 of each SBS operates at the MNO 1 spectrum, the capacity which is given by:
σ LAA , Trans 1 SC = σ MNO , 1 SC , DedA = s = 1 S F σ s , DedA
Now with LAA, the total capacity served by all the SBSs enabled with both the MNO 1 spectrum and the ULS in a 3D building is given by:
σ LAA , MB SC = σ LAA , Trans 1 SC + σ LAA , Trans   2 SC
Now, using (4), the system level capacity of MNO 1 for the multiband enabled SBSs with LAA per building is given by:
σ LAA , MB SYS = σ MNO , 1 MC , WIM + σ LAA , MB SC
Note that, since ULS is license free, then following the consideration mentioned in Remark 2, the average system-level spectral efficiency of MNO 1 for LAA per building is given by:
σ LAA , MB SE = σ LAA , MB SYS / ( M MNO , 1 × Q )
The average system-level energy efficiency of MNO 1 for LAA per building in Joules/bit (J/b) is given by:
σ LAA , MB EE = ( ( S F × ( | T n o n A B S M N O , 1 | / | T | ) × P SC , 1 ) + ( S F × P SC , 2 ) + + ( S P × P PC ) + ( S M × P MC ) ) / ( σ LAA , MB SYS / Q )
Now, following the assumptions for L > 1, the average aggregate capacity of MNO 1 with LAA is roughly given by:
σ LAA , MB , L SYS = σ MNO , 1 MC , WIM + ( L × σ LAA , MB , L SC )
Hence, the spectral efficiency for L buildings is then given by:
σ LAA , MB , L SE = σ LAA , MB , L SYS / ( M MNO , 1 × Q )
Similarly, the energy efficiency for L buildings is given by:
σ LAA , MB , L EE = ( ( L × S F × ( | T n o n A B S M N O , 1 | / | T | ) × P SC , 1 ) + ( L × S F × P SC , 2 ) + ( S P × P PC ) + ( S M × P MC ) ) / ( σ LAA , MB , L SYS / Q )

4. Optimal Number of ABSs and Default Parameters and Assumptions

4.1. Optimal Number of ABSs Estimation

The UE traffic activity can be modeled as an exponentially distributed continuous time Poisson process since sessions or call arrivals can be modeled as a Poisson process [24,25,26]. Let λ 1 and λ 2 denote respectively the average rate of arrivals of user group 1 and user group 2 to a system and are served during TABS and Tnon-ABS of an APP TAPP, respectively. Considering a fair allocation of time resources to each group of users, the allocation of TABS and Tnon-ABS is defined in proportionate with λ 1 and λ 2 respectively. In such cases, an optimal value of Tnon-ABS can be found by solving the following optimization problem:
min T non - ABS subject   to : ( a )   λ 2 / λ 1 = T non - ABS / T ABS ( b )   T APP = T ABS + T non - ABS
The optimal solution of (55) in favor of λ 2 is given by:
T non - ABS = λ 2 / ( λ 1 + λ 2 ) × T APP
Proof 1.
Using constraints (55) (a) and (b):
λ 1 / λ 2 = T ABS / T non - ABS
Solving the above equation, we get the following:
T ABS = [ 1 / ( λ 2 / λ 1 + 1 ) ] × T APP
Since TABS and Tnon-ABS are strictly integers, by allowing a favor to λ 2 , the optimal value of Tnon-ABS is given by:
T ABS = λ 1 / ( λ 1 + λ 2 ) × T APP
T non - ABS = T APP [ λ 1 / ( λ 1 + λ 2 ) ] × T APP
T non - ABS = [ λ 2 / ( λ 1 + λ 2 ) ] × T APP
Let λ MNO , 1 , SU , λ MNO , 2 , λ SPS , and λ MNO , 1 ,   iMU denote respectively the average rate of arrival of small cell UEs of MNO 1, UEs of MNO 2, satellite UEs of SPS, and indoor macro UEs of MNO 1 into a building. Now, applying the above analogy for the solution T non - ABS , an optimal value of Tnon-ABS for dedicated, DySP, and LSA techniques can be found respectively as follows.
For the dedicated access technique:
T non - ABS , DedA = [ λ MNO , 1 , SU / ( λ MNO , 1 , iMU + λ MNO , 1 , SU ) ] × T APP , DedA
For the DySP technique:
T non - ABS , DySP = [ λ MNO , 1 , SU / ( λ MNO , 2 + λ MNO , 1 , SU ) ] × T APP , DySP
For the LSA technique:
T non - ABS , LSA = [ λ MNO , 1 , SU / ( λ SPS + λ MNO , 1 , SU ) ] × T APP , LSA
where T APP , DedA , T APP , DySP , and   T APP , LSA denote the value of TAPP for the dedicated, DySP and LSA techniques, respectively.

4.2. Default System Parameters and Assumptions

Table 3 shows the default parameters and assumptions to evaluate the performance of all the realized spectrum sharing techniques. We evaluate the downlink performance of all techniques, namely dedicated access, DySP, StSR, LSA, and LAA as well as analyze the relative outperformance of one to another in view of MNO 1. For the evaluation, we consider that MNO 1, MNO 2, and the satellite service provider have their own licensed spectrum of 20 MHz each (10 MHz for the downlink and 10 MHz for the uplink). Hence, for dedicated access, the scheduler of MNO 1 allocates its licensed 10 MHz downlink spectrum to both macro UEs and small cell UEs according to the ABS based eICIC technique in each TTI. For DySP, there is a pool of 40 MHz spectra available at the CoRS to share between MNO 1 and MNO 2. We assume that there is a mutual agreement between MNO 1 and MNO 2 for StSR such that 20% of the licensed downlink spectrum of MNO 2 (i.e., 2 MHz downlink) is rented exclusively by MNO 1 to share only with its in-building small cells.
Like DySP, for LSA, the whole satellite spectrum is shared with in-building small cells per building following the ABS based eICIC technique. However, for LAA, no eICIC technique is applied to in-building small cells such that the whole spectrum of 60 GHz unlicensed band is shared with small cells in all TTIs.
Note that the transceiver 1 of in-building small cells operates only on its licensed dedicated spectrum of MNO 1 and the transceiver 2 operates on either licensed or unlicensed shared spectrum of different providers varies with the type of spectrum sharing technique employed on small cells. Moreover, the shared spectrum considered for the evaluation of each technique is arbitrary. Any values other than these aforementioned ones can be considered. However, choosing such different values will not alter the performance evaluation results concluded in this section.

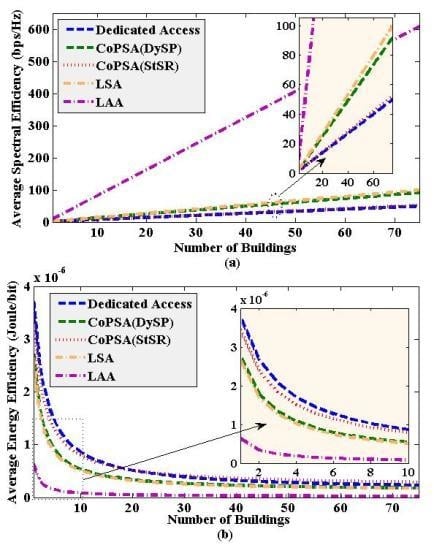
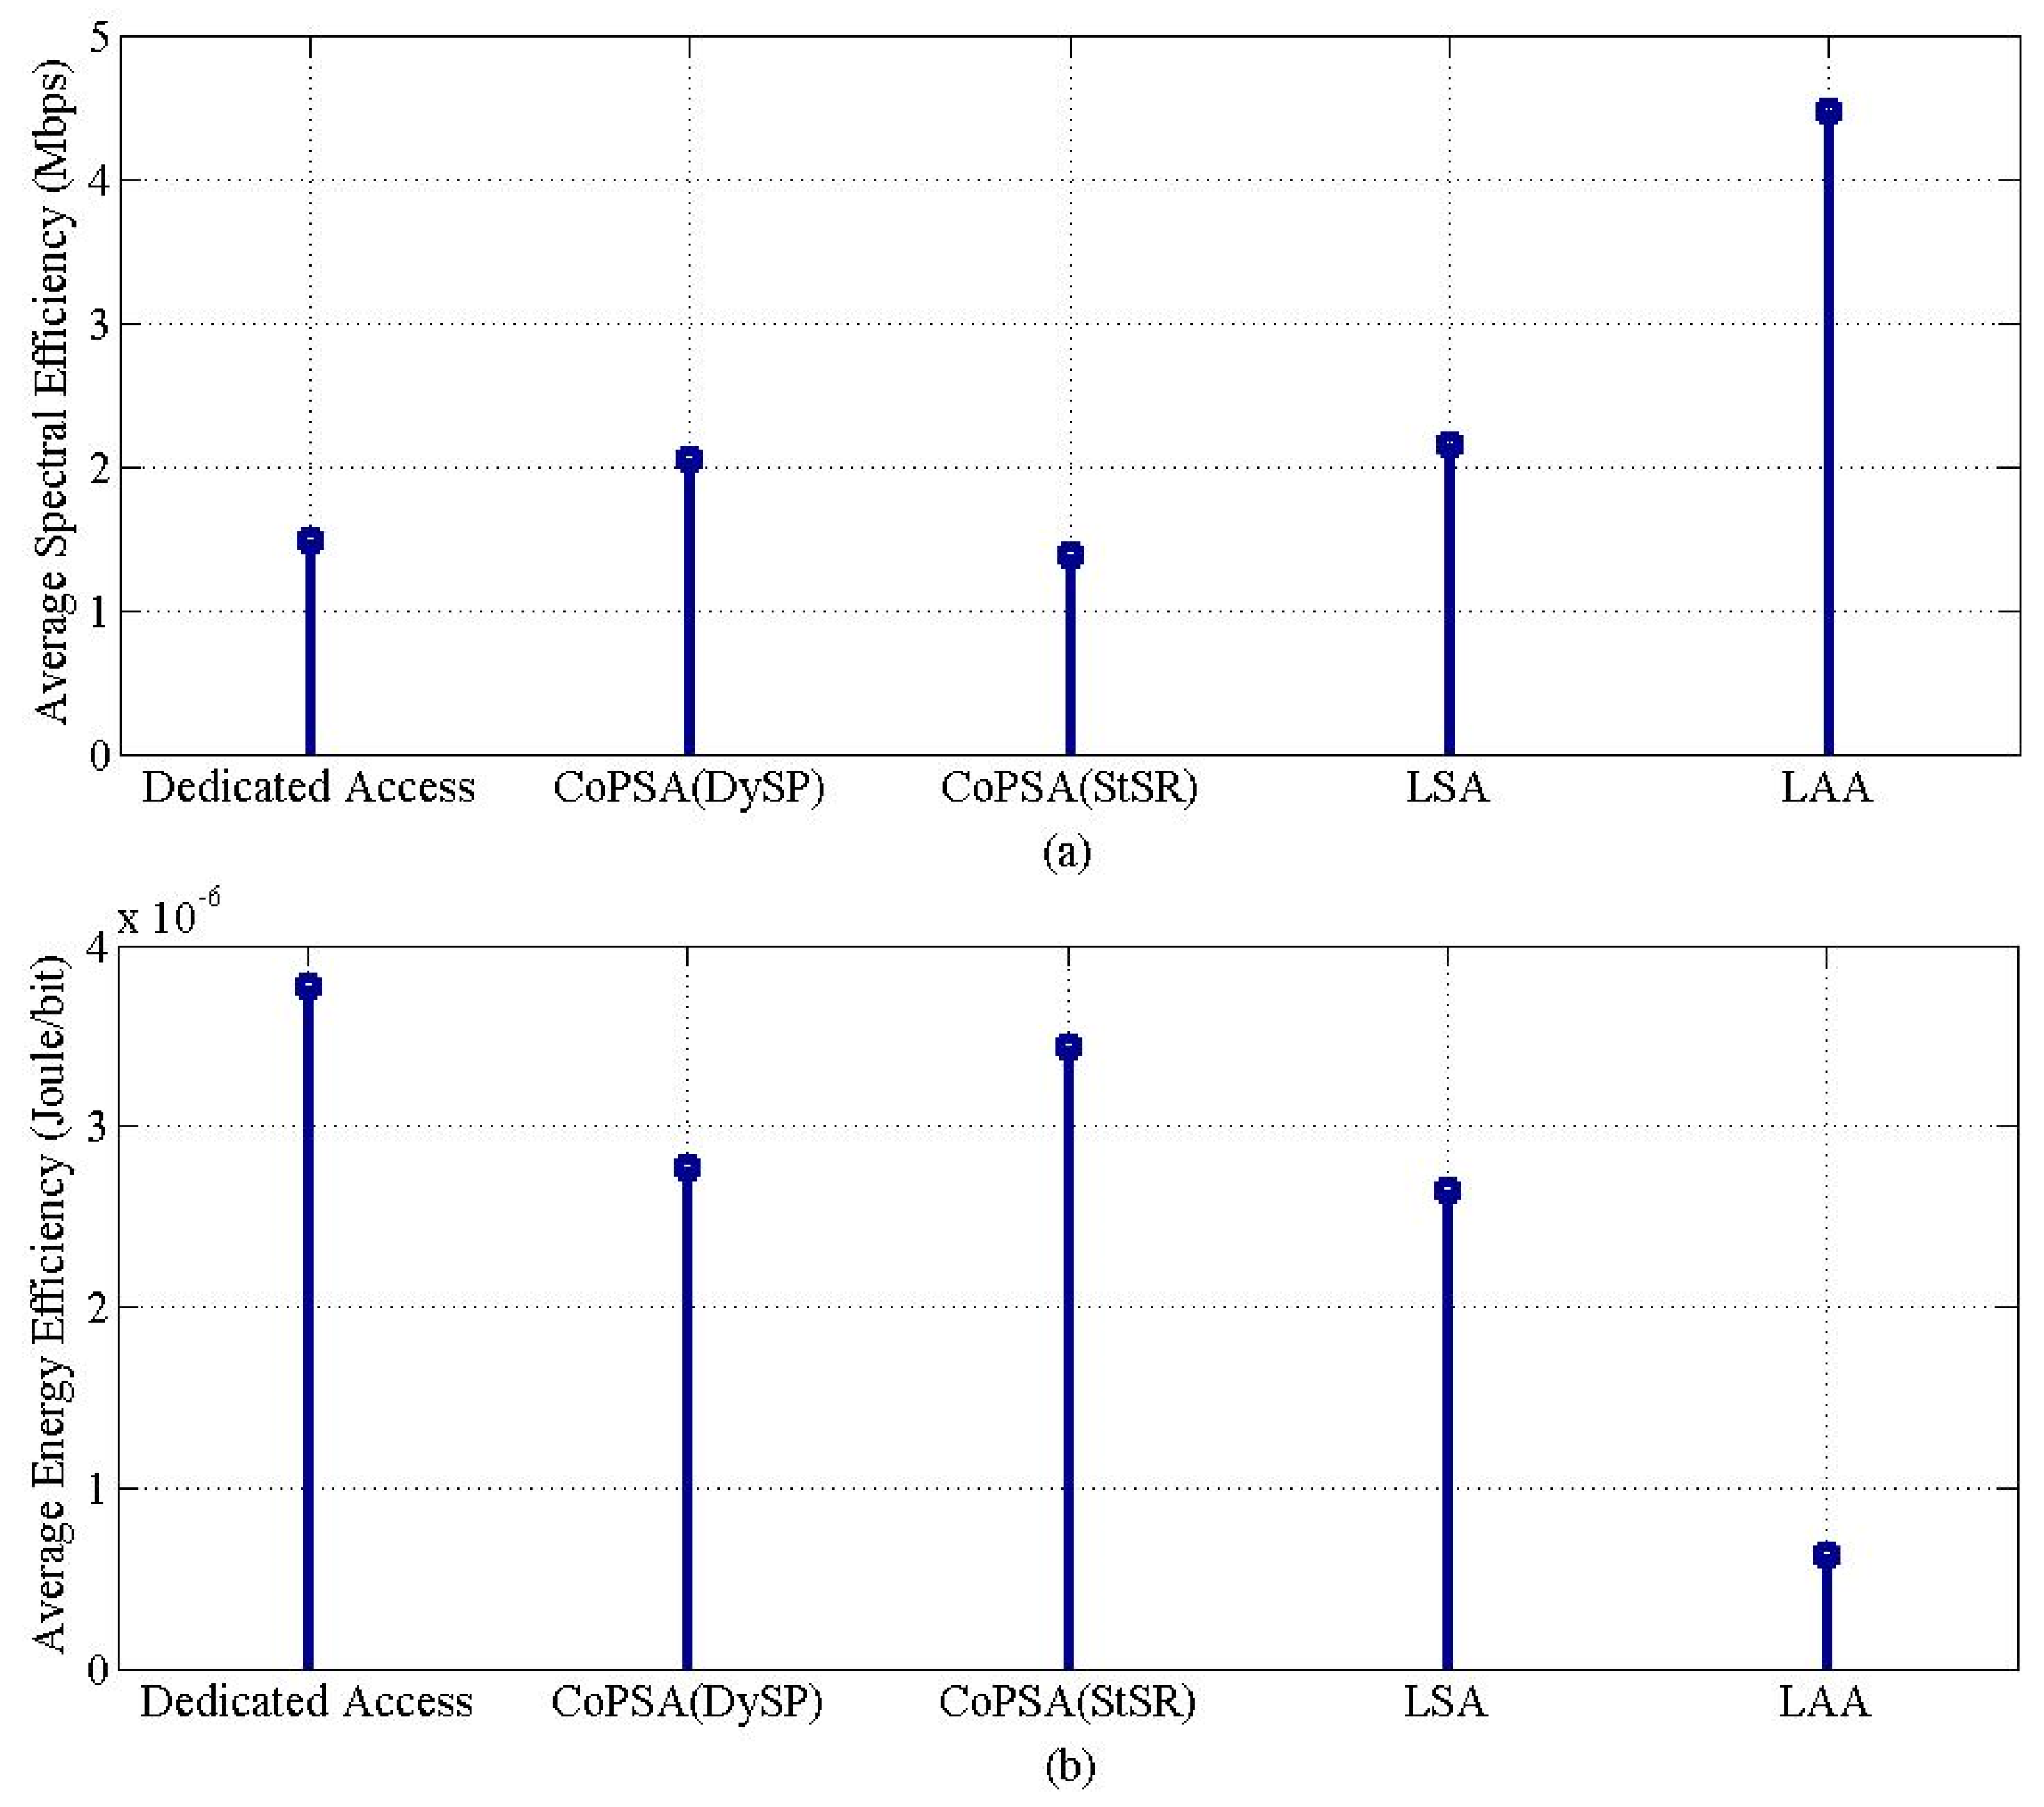
5. Performance Evaluation and Comparison

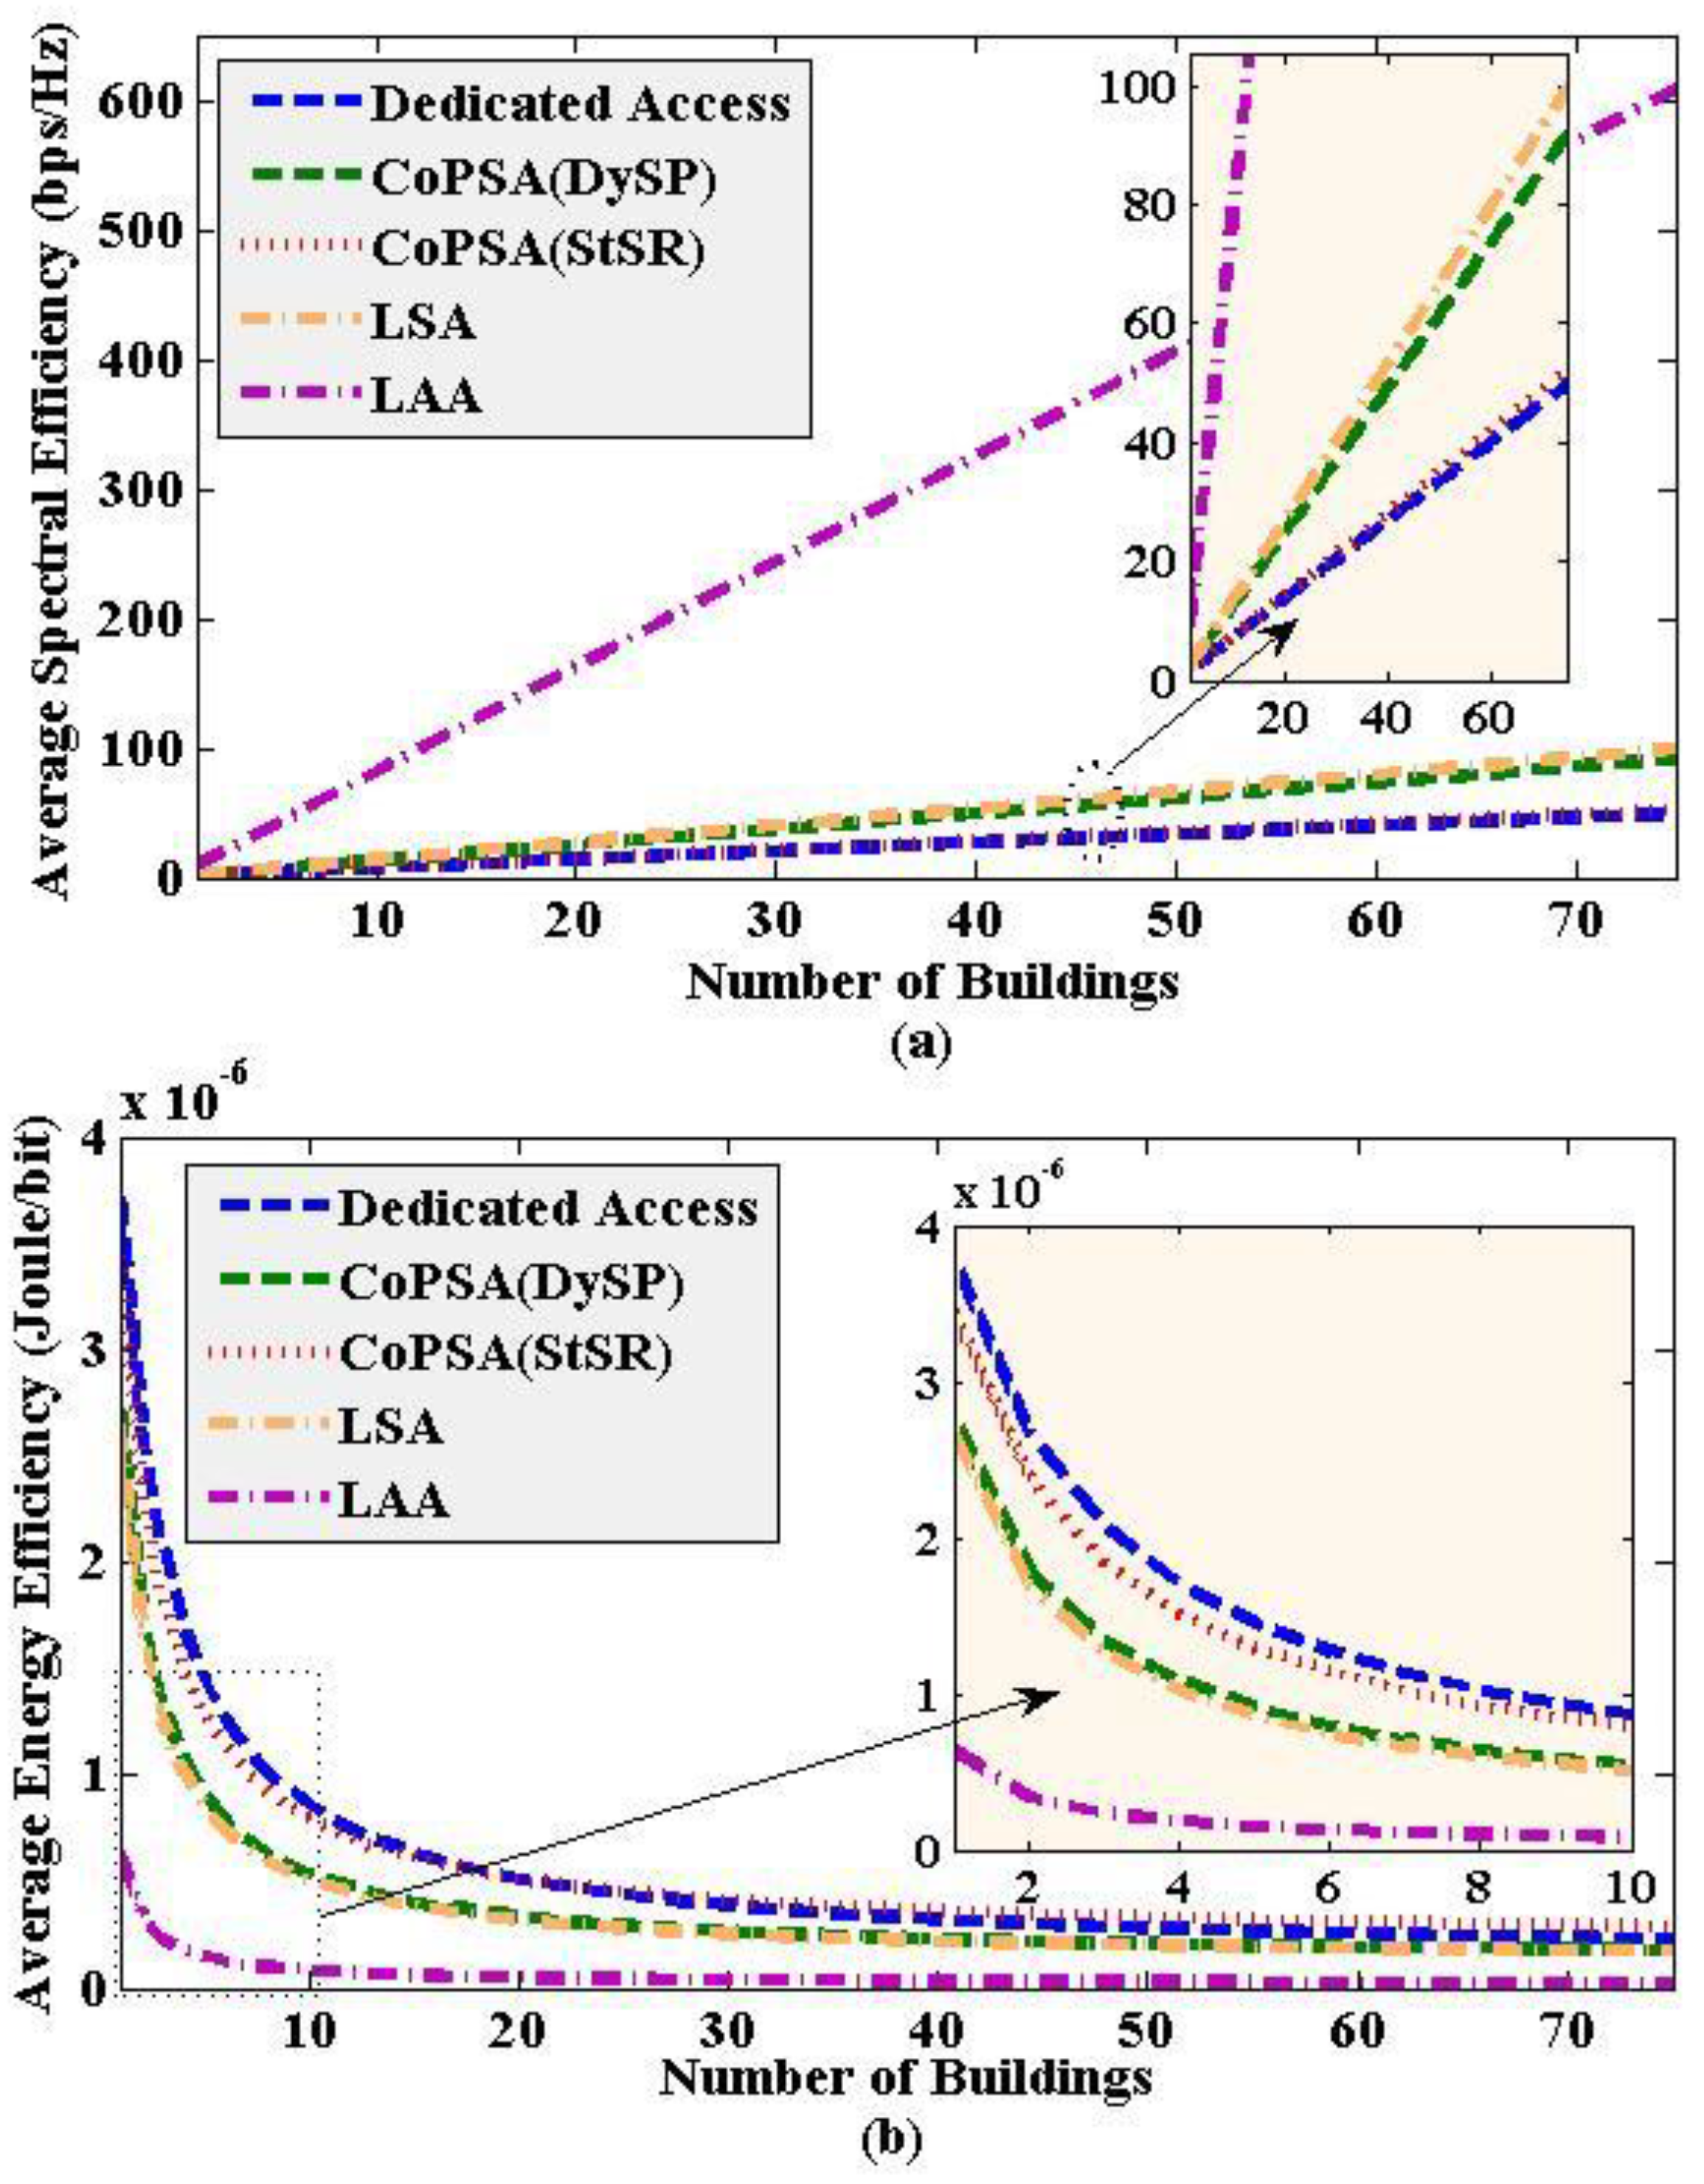
5.1. Performance Evaluation

Figure 9 and Figure 10 show the spectral efficiency and energy efficiency responses of all the realized spectrum access techniques for small cells in a single building (i.e., L = 1) and for an ultra-dense deployment of small cells in multiple buildings (i.e., L > 1) respectively. In general, an increase in L increases the spectral efficiency linearly and energy efficiency exponentially for all techniques. Moreover, unlike the spectral efficiency performance, for large values of L (i.e., for the dense small cell deployment), the energy efficiency performance of all techniques does not vary considerably from one another. This is due to the fact that as L gets large, the capacity of small cell UEs dominates that of macro UEs as can be found from (10), (21), (32), (42) and (52) such that the ratio of the transmit power of small cells to the capacity achieved by them gets eventually almost fixed as given by (12), (23), (34), (44), and (54). Hence, unlike the spectral efficiency, it signifies that there is a limit to the density of small cells such that the energy efficiency cannot be improved considerably with an increase in the density of small cells. Note that even though dedicated access (DedA) and StSR benefit from the less or no coordination signaling overhead in the backhauls and associated complexities, DySP, LSA, and LAA pay that off by providing with significant outperformance in capacity, spectral efficiency, and energy efficiency responses.
Note that except LAA, one of the major concerns with other techniques is the number of TTIs during which the transceiver 2 of all small cells are assigned with the shared spectrum. In general, an increase in the number of TTIs increases the capacity achieved by the transceiver 2, and the maximum capacity can be achieved when all TTIs are assigned to small cells. However, since we consider arbitrary rates of UEs for the shared systems into a building, using the condition for optimality of the number of non-ABSs derived in (57)–(59), the optimal number of ABSs is non-zero such that a number of TTIs over an APP are not assigned to small cells. Hence, the performances shown in Figure 9 and Figure 10 are not the best ones. Rather, the best of performances can be obtained when all small cell UEs of MNO 1 per building can be scheduled 100% of the time, i.e., in all TTIs over any APP.
Furthermore, from Figure 9 and Figure 10, LAA provides the best performance of all techniques in terms of spectral and energy efficiencies. This is due to the fact that, in LAA, transceiver 2 operates in the 60 GHz band signal, which is much less affected by the multipath fading effect due to the high possibility of the presence of line-of-sight (LOS) components that causes the signal help experience a good channel gain within a short distance. The average channel gain at 60 GHz in terms of the number of transmitted bits per second per Hz approaches near the maximum value of 4.4 bps/Hz as given by (3). Further, the transceiver 2 can serve traffic in each TTI since the ABS based eICIC technique is not needed for LAA. Furthermore, due to its best spectral efficiency performance, LAA also provides with the best energy efficiency performance, i.e., it spends the lowest amount of energy to transmit information per bit.
Unlike the LAA, the performance of LSA depends on a number of factors, including the characteristics of the spectrum band for the transceiver 2, the type of system that shares its spectrum with the concerned MNO, and the considered interference management policy. For example, from Figure 9, since we consider the same spectrum band for the DySP and LSA, both techniques give almost similar spectral efficiency and energy efficiency responses. However, since the DedA technique operates only at a single frequency spectrum band, which is reused to small cells by applying the ABS based eICIC techniques, DedA provides with the minimum amount of spectral efficiency and hence requires the maximum amount energy to transmit one-bit information per second.
Note also that even though StSR technique operates at both transceivers, the performance responses are almost the same as for DedA because of choosing a small percentage of the spectrum of MNO 2 (i.e., 20%), which is rented by MNO 1 to operate its transceiver 2. However, due to the investment in renting spectrums from another MNO, the additional capacity gain is compensated by the rented spectrum. Hence, so long as the amount of rented spectrum from other operators is not large enough, DedA technique is preferable to StSR due to avoiding the cost from the additional spectrum licensing fee and the complexity from the coordination between MNOs. Note that in evaluating the spectral efficiency, we only consider the spectrum that is explicitly owned by an MNO at the cost of paying the licensing fee. Particularly, we avoid considering the spectrum of a different system for MNO 1 in LSA and the unlicensed spectrum in LAA to evaluate the spectral efficiency performance. This is due to the fact that in LSA we assume implicitly that the same amount of spectrum of MNO 1 is shared by the MNO 2 each other, whereas, in LAA, the spectrum is unlicensed such that there is no cost for licensing the additional spectrum to operate the transceiver 2.

5.2. Optimal Value of L and Performance Comparison with 5G Mobile Network Requirements

We define an optimal value of L as the value of L that can satisfy both the spectral efficiency and energy efficiency requirements for 5G networks, which can be found as follows. Let for any spectrum sharing technique S S { DedA , DySP ,   StSR ,   LSA , LAA } , σ L SE and σ L EE , respectively, denote the spectral efficiency and the energy efficiency for any value of L Ν > 0 . Let σ 5 G SE and σ 5 G EE denote the minimum spectral efficiency and energy efficiency requirements for 5G mobile systems. An optimal value of L can be found for any spectrum sharing technique S S by solving the following optimization problem:
min L subject   to : ( a )   L σ L SE σ 5 G SE ( b )   L σ L EE σ 5 G EE
An optimal value of L, i.e., L , for all SS can be found as follows:
L = { 56 , for   S S = DedA 30 , for   S S = DySP 54 , for   S S = StSR 28 , for   S S = LSA 5 , for   S S = LAA
Proof 2.
For the 5G mobile system, it is expected that an average spectral efficiency of σ 5 G SE = 24   37 bps / Hz [32] and energy efficiency of σ 5 G EE = 3   μ J / b [32,33] need to be satisfied. Now, using Figure 10, Table 4 shows the minimum values of L for any S S { DedA , DySP ,   StSR ,   LSA , LAA } .
Hence, from Table 4, it can be found that an optimal value of L that can satisfy both σ 5 G SE and σ 5 G EE for any S S { DedA , DySP ,   StSR ,   LSA , LAA } are given respectively by 56, 30, 54, 28, and 5. □
So, based on the above solution and proof to find an optimal value of L for all SS, the spectral efficiency and energy efficiency requirements for 5G mobile systems (i.e., σ 5 G SE = 24 37 bps / Hz [32] and σ 5 G EE = 3   μ J / b [32,33] respectively) can be easily met by employing each of the realized spectrum sharing technique. More specifically, unlike the spectral efficiency (SE) requirement, the EE requirement for the 5G can be easily met with a low value of L such that the density of small cells, i.e., an optimal value of L can be defined solely by the spectral efficiency requirement for the 5G mobile networks to satisfy both the spectral efficiency and energy efficiency requirements.

6. Conclusions

In this paper, we have realized a number of spectrum sharing techniques for in-building small cells, namely dedicated access, CoPSA, LSA, and LAA by exploiting the high external wall penetration loss of 3D buildings. The ABS based eICIC technique has been used to avoid or minimize co-channel interference signal generated due to sharing the same spectrum in space simultaneously. Small cells are considered to be enabled with multiple bands to realize spectrum sharing techniques for them. For each technique, system-level average capacity, spectral efficiency, and energy efficiency metrics by defining an optimal number of ABSs have been derived. Irrespective of the type of technique, the spectral efficiency varies linearly with L and the energy efficiency shows a negative exponential decays with L.
It has been found that LAA provides the best spectral efficiency and energy efficiency performances due to the good indoor channel conditions and no need for imposing ABSs to LAA because of operating the transceiver 2 at a different spectrum. Moreover, the spectrum bandwidth available in the 60 GHz is huge enough to achieve a high data rate. An optimal value of L that trade-offs both the spectrum and energy efficiencies has been defined and it has been shown that the spectrum sharing techniques can meet the spectral efficiency and energy efficiency requirements for 5G mobile systems. Furthermore, LAA has been found to be more cost effective since it requires the lowest density of small cells (i.e., L) of all other techniques to satisfy the spectral efficiency and energy efficiency requirements for the 5G mobile networks.

Funding

This research received no external funding.

Acknowledgments

This paper is partly submitted to IEEE GLOBECOM 2019 Workshop on Advancement in Spectrum Sharing, Waikoloa, HI, USA, 9–13 December 2019 [21].

Conflicts of Interest

The author declares no conflict of interest.

References

  1. Li, F.; Lam, K.; Li, X.; Liu, X.; Wang, L.; Leung, V.C.M. Dynamic spectrum access networks with heterogeneous users: How to price the spectrum? IEEE Trans. Veh. Technol. 2018, 67, 5203–5216. [Google Scholar] [CrossRef]
  2. Garg, P.K.; Dua, T.R.; Chandra, A. Spectrum challenges for modern mobile services. J. ICT Standard. 2013, 1, 137–158. [Google Scholar] [CrossRef]
  3. Prasad, R. 5G: 2020 and Beyond; River Publishers: Aalborg, Denmark, 2014; p. 65. [Google Scholar]
  4. Song, Q.; You, M.; Lv, T. Incentives to spectrum trading. In Proceedings of the 2009 IEEE International Conference on Network Infrastructure and Digital Content, Beijing, China, 6–8 November 2009; pp. 948–952. [Google Scholar]
  5. Luoto, P.; Pirinen, P.; Bennis, M.; Samarakoon, S.; Scott, S.; Latva-aho, M. Co-primary multi-operator resource sharing for small cell network. IEEE Trans. Wirel. Commun. 2015, 14, 3120–3130. [Google Scholar] [CrossRef]
  6. Tehrani, R.H.; Vahid, S.; Triantafyllopoulou, D.; Lee, H.; Moessner, K. Licensed spectrum sharing schemes for mobile operators: A survey and outlook. IEEE Commun. Surv. Tutor. 2016, 18, 2591–2623. [Google Scholar] [CrossRef]
  7. Singh, B.; Hailu, S.; Koufos, K.; Dowhusko, A.A.; Tirkkonen, O.; Jäntti, R.; Berry, R. Coordination protocol for inter-operator spectrum sharing in co-primary 5G small cell networks. IEEE Commun. Mag. 2015, 53, 34–40. [Google Scholar] [CrossRef] [Green Version]
  8. Hailu, S.; Dowhuszko, A.A.; Tirkkonen, O. Adaptive co-primary shared access between co-located radio access networks. In Proceedings of the 2014 9th International Conference on Cognitive Radio Oriented Wireless Networks and Communications (CROWNCOM), Oulu, Finland, 2–4 June 2014; pp. 131–135. [Google Scholar]
  9. Teng, Y.; Wang, Y.; Horneman, K. Co-primary spectrum sharing for denser networks in local area. In Proceedings of the 2014 9th International Conference on Cognitive Radio Oriented Wireless Networks and Communications (CROWNCOM), Oulu, Finland, 2–4 June 2014; pp. 120–124. [Google Scholar]
  10. Mueck, M.D.; Srikanteswara, S.; Badic, B. Spectrum Sharing: Licensed Shared Access (LSA) and Spectrum Access Systems (SAS); Intel, Version 1.0, White Paper; Intel Corporation: Santa Clara, CA, USA, October 2015. [Google Scholar]
  11. Kang, D.H. Interference Coordination for Low-Cost Indoor Wireless Systems in Shared Spectrum. Ph.D. Thesis, KTH, Stockholm, Sweden, May 2014. [Google Scholar]
  12. Khawar, A.; Ahmad, I.; Sulyman, A.I. Spectrum sharing between small cells and satellites: Opportunities and challenges. In Proceedings of the 2015 IEEE International Conference on Communication Workshop (ICCW), London, UK, 8–12 June 2015; pp. 1600–1605. [Google Scholar]
  13. Saha, R.K. Spectrum sharing in satellite-mobile multisystem using 3D in-building small cells for high spectral and energy efficiencies in 5G and beyond era. IEEE Access 2019, 7, 43846–43868. [Google Scholar] [CrossRef]
  14. 3GPP. Study on New (NR) to Support non Terrestrial Networks (Release 15), Document 3GPP TR 38.811; 3rd Generation Partnership Project: Valbonne, France, June 2018. [Google Scholar]
  15. Guidotti, A.; Vanelli-Coralli, A.; Conti, M.; Andrenacci, S.; Chatzinotas, S.; Maturo, N.; Evans, B.; Awoseyila, A.; Ugolini, A.; Foggi, T.; et al. Architectures and key technical challenges for 5G systems incorporating satellites. IEEE Trans. Veh. Technol. 2019, 68, 2624–2639. [Google Scholar] [CrossRef]
  16. FCC. News 202/418-0500. 12 December 2012. Available online: https://www.fcc.gov/document/fcc-proposes-innovative-small-cell-use-35-ghzband (accessed on 29 October 2018).
  17. Almeida, E.; Cavalcante, A.M.; Paiva, R.C.D.; Chaves, F.S.; Abinader, F.M.; Vieira, R.D.; Choudhury, S.; Tuomaala, E.; Doppler, K. Enabling LTE/WiFi coexistence by LTE blank subframe allocation. In Proceedings of the 2013 IEEE International Conference on Communications (ICC), Budapest, Hungary, 9–13 June 2013; pp. 5083–5088. [Google Scholar]
  18. Zhang, H.; Chu, X.; Guo, W.; Wang, S. Coexistence of Wi-Fi and heterogeneous small cell networks sharing unlicensed spectrum. IEEE Commun. Mag. 2015, 53, 158–164. [Google Scholar] [CrossRef] [Green Version]
  19. Bhattarai, S.; Park, J.J.; Gao, B.; Bian, K.; Lehr, W. An overview of dynamic spectrum sharing: Ongoing initiatives, challenges, and a roadmap for future research. IEEE Trans. Cogn. Commun. Netw. 2016, 2, 110–128. [Google Scholar] [CrossRef]
  20. Salami, G.; Durowoju, O.; Attar, A.; Holland, O.; Tafazolli, R.; Aghvami, H. A Comparison between the centralized and distributed approaches for spectrum management. IEEE Commun. Surv. Tutor. 2011, 13, 274–290. [Google Scholar] [CrossRef]
  21. Saha, R.K. Inter-operator licensed spectrum sharing techniques for indoor small cells in 5G networks. In Proceedings of the IEEE GLOBECOM 2019 Workshop on Advancement in Spectrum Sharing, Waikoloa, HI, USA, 9–13 December 2019. [Google Scholar]
  22. Yilmaz, T.; Fadel, E.; Akan, O.B. Employing 60 GHz ISM band for 5G wireless communications. In Proceedings of the 2014 IEEE International Black Sea Conference on Communications and Networking (BlackSeaCom), Odessa, Ukraine, 27–30 May 2014; pp. 77–82. [Google Scholar]
  23. Saha, R.K.; Aswakul, C. A novel frequency reuse technique for in-building small cells in dense heterogeneous networks. IEEJ Trans. Electr. Electron. Eng. 2018, 13, 98–111. [Google Scholar] [CrossRef]
  24. Mustafa, H.A.U.; Imran, M.A.; Shakir, M.Z.; Imran, A.; Tafazolli, R. Separation framework: An enabler for cooperative and D2D communication for future 5G networks. IEEE Commun. Surv. Tutor. 2016, 18, 419–445. [Google Scholar] [CrossRef]
  25. Cui, Q.; Song, H.; Wang, H.; Valkama, M.; Dowhuszko, A.A. Capacity analysis of joint transmission CoMP with adaptive modulation. IEEE Trans. Veh. Technol. 2017, 66, 1876–1881. [Google Scholar] [CrossRef]
  26. Saha, R.K. A hybrid system and technique for sharing multiple spectrums of satellite plus mobile systems with indoor small cells in 5G and beyond era. IEEE Access 2019, 7, 77569–77596. [Google Scholar] [CrossRef]
  27. 3GPP. E-UTRA; Radio Frequency (RF) System Scenarios, Document 3GPP TR 36.942, V.1.2.0; 3rd Generation Partnership Project: Valbonne, France, July 2007. [Google Scholar]
  28. 3GPP. Simulation Assumptions and Parameters for FDD HeNB RF Requirements, Document TSG RAN WG4 (Radio) Meeting #51, R4-092042; 3rd Generation Partnership Project: Valbonne, France, May 2009. [Google Scholar]
  29. Geng, S.; Kivinen, J.; Zhao, X.; Vainikainen, P. Millimeter-wave propagation channel characterization for short-range wireless communications. IEEE Trans. Veh. Technol. 2009, 58, 3–13. [Google Scholar] [CrossRef]
  30. Saha, R.K.; Saengudomlert, P.; Aswakul, C. Evolution toward 5G mobile networks—A survey on enabling technologies. Eng. J. 2016, 20, 87–119. [Google Scholar] [CrossRef]
  31. Saha, R.K.; Aswakul, C. Incentive and architecture of multi-band enabled small cell and UE for up-/down-link and control-/user-plane splitting for 5G mobile networks. Freq. J. RF-Eng. Telecommun. 2017, 71, 95–118. [Google Scholar] [CrossRef]
  32. Wang, C.-X.; Haider, F.; Gao, X.; You, X.-H.; Yang, Y.; Yuan, D.; Aggoune, H.M.; Haas, H.; Fletcher, S.; Hepsaydir, E. Cellular architecture and key technologies for 5G wireless communication networks. IEEE Commun. Mag. 2014, 52, 122–130. [Google Scholar] [CrossRef]
  33. Auer, G.; Giannini, V.; Gódor, I.; Blume, O.; Fehske, A.; Rubio, J.A.; Frenger, P.; Olsson, M.; Sabella, D.; Gonzalez, M.J.; et al. How much energy is needed to run a wireless network? In Green Radio Communication Networks; Cambridge University Press: Cambridge, UK, 2012; Chapter 1; p. 20. [Google Scholar]
Figure 1. Scopes of the spectrum licensing policies realized using eICIC technique in multiband in-building small cells.
Energies 12 02828 g001
Figure 2. An example multiband enabled small cell configuration with major attributes for the realized spectrum access methods.
Energies 12 02828 g002
Figure 3. The system architecture of the concerned MNO1 and the use of the dedicated spectrum access technique to MNO 1.
Energies 12 02828 g003
Figure 4. Techniques for MNO 1 and MNO 2: (a) DySP; (b) StSR.
Energies 12 02828 g004
Figure 5. Interference management for DySP. For static spectrum sharing, there is no need for interference management.
Energies 12 02828 g005
Figure 6. Intra-operator spectrum sharing technique and co-channel interference management using the ABS based eICIC technique for sharing mobile spectrums of MNO 1 with the transceiver 1 of its multiband enabled SBSs.
Energies 12 02828 g006
Figure 7. LSA techniques.
Energies 12 02828 g007
Figure 8. A small cell configuration for LAA.
Energies 12 02828 g008
Figure 9. Performance responses of all the realized spectrum access techniques for small cells in a single building (i.e., L = 1): (a) The spectral efficiency and (b) energy efficiency.
Energies 12 02828 g009
Figure 10. Performance responses of all the realized spectrum access techniques for an ultra-dense deployment of small cells in multiple buildings (i.e., L > 1): (a) The spectral efficiency and (b) energy efficiency.
Energies 12 02828 g010
Table 1. List of acronyms.
AbbreviationExplanation
3D3-Dimensional
3GPPThird Generation Partnership Project
5GFifth Generation
ABSAlmost Blank Subframe
APPABS Pattern Period
ASAAuthorized Shared Access
BSBase Station
CACarrier Aggregation
CoPSACo-Primary Shared Access
CoRSCommon Resource Scheduler
CSIChannel State Information
DedADedicated Access
DySPDynamic Spectrum Sharing by Pooling
EEEnergy Efficiency
eICICEnhanced Inter-Cell Interference Coordination
FCCFederal Communications Commission
FDFrequency-Domain
ICICInter-Cell Interference Coordination
ISDInter-Site Distance
ISDInter-site distance
ISMIndustrial, Scientific, and Medical
J/bJoules/Bit
LAALicensed Assisted Access
LBTListen-Before-Talk
LOSLine-of-Sight
LSALicensed Shared Access
LTELong-Term Evolution
MBSMacrocell Base station
MNOMobile Network Operator
NRANational Regulatory Agency
PBSPicocell Base Station
PFProportional Fair
QoSQuality-of-Service
RBResource Block
SBSSmall Cell Base Station
SESpectral Efficiency
SPSSpace Satellite System
StSRStatic Spectrum Sharing by Renting
TDTime-Domain
TTITransmission Time Interval
UEUser Equipment
ULSUnlicensed Spectrum
Table 2. List of notations.
NotationDefinition
σ MNO , 1 MC , WIM The aggregate capacity of all N macro UEs for M MNO , 1 RBs, Q TTIs, and L = 1
σ MNO , 1 SYS , DedA The system-level capacity of MNO 1 for the dedicated access technique
NNumber of macro UEs of MNO 1
ϕ ABS pattern
TSimulation run time
QMaximum number of TTIs in T each lasting 1 ms
TABSA set of ABSs in T
t and iIndex of TTIs and RBs respectively
ρ t , i Signal-to-interference-plus-noise ratio at RB = i in TTI = t
H t , i Link loss at RB = i in TTI = t
σ t , i Link throughput at RB = i in TTI = t
M MNO , 1 Number of RBs in the MNO 1 spectrum
M MNO , 2 Number of RBs in the MNO 2 spectrum
M MNO , T Total spectrum due to the spectrum pooling at CoRS
M StSR Number of RBs of MNO 2 that is rented to MNO 1
M ULS Number of RBs in the 60 GHz unlicensed spectrum
M SPS Number of RBs in SPS spectrum
SFNumber of small cells per building
SPNumber of picocells per macrocell
SMNumber of macrocells in the system
PPCTransmit power of a picocell
PMCTransmit power of a macrocell
PSC,1Transmit power of transceiver 1 of an SBS
PSC,2Transmit power of transceiver 2 of an SBS
T A B S S P S A set of ABSs in the satellite spectrum
T A B S M N O , 1 A set of ABSs in the MNO 1 spectrum
T n o n A B S M N O , 1 A set of non-ABSs in the MNO 1 spectrum
T A B S M N O , 2 A set of ABSs in the MNO 2 spectrum
T n o n A B S S P S A set of non-ABSs in the satellite spectrum
T n o n A B S M N O , 2 A set of non-ABSs in the satellite spectrum
LTotal number of buildings per macrocell
λ MNO , 1 , SU The average rate of arrival of small cell UEs of MNO 1 into a building
λ MNO , 2 The average rate of arrival of UEs of MNO 2 into a building
λ SPS The average rate of arrival of satellite UEs of SPS into a building
λ MNO , 1 , iMU The average rate of arrival of indoor macro UEs of MNO 1 into a building
T APP , DedA The value of TAPP for the dedicated access technique
T APP , DySP The value of TAPP for the DySP technique
  T APP , LSA The value of TAPP for the LSA technique
LowExternal wall penetration loss
σ L SE Spectral efficiency for any value of L Ν > 0
σ L EE Energy efficiency for any value of L Ν > 0
σ 5 G SE The minimum spectral efficiency requirement for 5G mobile systems
σ 5 G EE The minimum energy efficiency requirement for 5G mobile systems
L An optimal value of L
Table 3. Default parameters and assumptions.
Parameters and AssumptionsValue
E-UTRA simulation case13GPP case 3
Cellular layout 2 and Inter-site distance (ISD) 1,2,5Hexagonal grid, dense urban, 3 sectors per macrocell site and 1732 m
Carrier frequency 2,3 and transmit direction2 GHz (microwave), 60 GHz (millimeter wave line-of-sight), and downlink
System bandwidth10 MHz downlink (for both 2 GHz and 60 GHz)
Number of cells1 macrocell, 2 picocells, 8 SBSs per building for MNO 1
Total BS transmit power 1 (dBm)46 for microcell 1,4, 37 for picocell1, 20 (for 2 GHz) and 17.3 (for 60 GHz) for femtocell 1,3,4
Co-channel fading model 1Frequency selective Rayleigh for the macrocell and picocells, and Rician for SBSs (for 2 GHz)
External wall penetration loss 1 (Low)20 dB
Path lossMBS and a UE 1,5Indoor macro UEPL(dB) = 15.3 + 37.6log10R, R is in m
Outdoor macro UEPL(dB) = 15.3 + 37.6log10R + Low, R is in m
PBS and a UE 1PL(dB) = 140.7 + 36.7log10R, R is in km
SBS and a UE 1,2,3,6PL(dB) = 127 + 30log10(R/1000), R in m (for 2 GHz),
PL(dB) = 68 + 21.7log10(R), R in m (for 60 GHz)
Lognormal shadowing standard deviation (dB)8 for MBS 2, 10 for PBS 1, and 10 (for 2 GHz) and 0.88 (for 60 GHz) for FCBS 2,3,6
Antenna configurationSingle-input single-output for all terrestrial mobile BSs and UEs
Antenna pattern (horizontal)Directional (1200) for microcell 1, omnidirectional for picocell 1 and SBS 1
Antenna gain plus connector loss (dBi)14 for MCBS 2, 5 for PCBS 1, 5 (for 2 GHz) and 5 (for 60 GHz, Biconical horn) for FCBS 1,3,6
UE antenna gain 2,30 dBi (for 2 GHz), 5 dBi (for 60 GHz, Biconical horn)
UE noise figure 2 and UE speed 19 dB, 3 km/hr
Total number of macro UEs for MNO 1 and Indoor macro UEs 130 and 35%
Picocell coverage and macro UEs offloaded to all picocells 140 m (radius), 2/15
3D multi-storage building, and SBS models (regular square-grid)Number of buildingsL
Number of floors per building2
Number of apartments per floor4
Number of SBSs per apartment1
SBS activation ratio100%
SBS deployment ratio1
Total number of SBSs per building8
Area of an apartment10 × 10 m2
Location of an SBS in an apartmentcenter
Scheduler and traffic model 2,5Proportional Fair (PF) and full buffer
Type of SBSs 5Closed Subscriber Group femtocell BSs
λ MNO , 1 , SU , λ MNO , 1 , iMU , λ MNO , 2 , λ SPS 8/8, 2/8, 4/8, 2/8
T APP , DedA , T APP , DySP , and T APP , LSA 8 ms, 8 ms, and 8 ms
Channel State Information (CSI)Ideal
TTI1, and scheduler time constant (tc)1 ms and 100 ms
Total simulation run time8 ms
Taken 1 from [27], 2 from [28], 3 from [29], 4 from [30], 5 from [26], 6 from [31].
Table 4. Minimum values of L to satisfy 5G mobile system requirements.
Spectrum Sharing Technique (SS)L (To Meet the 5G Mobile System Requirements)
Spectral Efficiency (bps/Hz/cell)Energy Efficiency (μJ/b)Both Spectral and Energy Efficiencies ( L )
Dedicated access56256
CoPSA (DySP)30130
CoPSA (StSR)54254
LSA28128
LAA515

