Article

The Self-Degradation Mechanism of Polyvinyl Chloride-Modified Slag/Fly Ash Binder for Geothermal Wells

School of Engineering and Technology, China University of Geosciences (Beijing), Beijing 100083, China
*
Author to whom correspondence should be addressed.
Energies 2019, 12(14), 2821; https://doi.org/10.3390/en12142821
Submission received: 23 April 2019 / Revised: 13 July 2019 / Accepted: 18 July 2019 / Published: 22 July 2019

Abstract

:
Polyvinyl chloride (PVC) releases hydrochloric acid (HCl) during its thermal degradation, and hydrochloric acid can react with hydration products of alkali-activated binders. According to this characteristic of PVC and the temperature change that occurs during the development of a geothermal well, the PVC was added into slag/fly ash binder to develop self-degradable materials. The thermal degradation properties of PVC, compressive strength, hydration products, and microstructure of binders at different stages were tested, in order to study the degradation mechanism of the material. It was found that 20% PVC reduced the compressive strength, decreasing the level of binder from 13.95% to 76.63%. The mechanism of PVC promoting the material degradation mainly includes the following: (1) the thermal degradation of PVC increases the number of multiple damage pores in the material, at a high temperature; (2) HCl generated by the PVC thermal degradation reacts with the binder gels, and breaks them into particles; and (3) HCl also reacts with other substances in the binder, including CaCO3 and NaOH in the pore solution.

1. Introduction

According to the development process of geothermal wells, the temporary sealing material (TSM) should provide sufficient strength to seal the fractured formations for drilling operations, but degrade later on to open the sealed fractures for hydraulic-stimulation or the production process [1,2]. In order to develop this material, sodium carboxymethyl cellulose has been introduced into sodium silicate-activated slag/fly ash cementitious materials [1,3,4,5]. In addition, poly-lactic acid and starch, as self-degradable additives, have been introduced into the materials to improve the rheological and degradation properties in our previous studies [2,6]. All of the developed materials can self-degrade to certain degrees. However, the degradation products of these additives are CO2, H2O, and CH3COOH, etc. They have relatively weaker effects on binders when compared to the mineral acids, such as hydrochloric acid (HCl), sulfuric acid (H2SO4), and hydrofluoric acid (HF).
Hydrochloric acid has been widely used in the operation of acid fracturing and releasing stuck cement. At present, the most widely used acid fluid in the acid fracturing operation is composed of 15%–28% hydrochloric acid + corrosion inhibitor + surface active agent [7,8]. The acid solution has been used to acidize and remove the cement, which blocks stuck drilling tools, thus solving the accident of cement sticking during operation [9]. The mechanism underlying this is the reaction that occurs between HCl and cement, producing soluble salts. Polyvinyl chloride (PVC) molecules easily decompose in an aerobic environment, especially at a high temperature, with a large amount of HCl being released [10]. Therefore, it should be able to be applied as a self-degradable additive to manufacture TSM for geothermal wells.
PVC shows excellent corrosion resistance and mechanical properties at room temperature, and thus its products are widely used in construction, chemical, electrical, and other industries. As the second largest general plastic, its annual amount of waste is very huge [11,12,13,14,15]. In early 2018, China’s plastic limit order was implemented for ten years, but the effect was not obvious. The white pollution is still serious. At present, about 3 million tons of plastic are produced every year in the world, but only 20% of these waste plastics are recycled or incinerated, and most are dumped in landfills or discarded into the sea, causing the ubiquitous pollution of plastic waste [16].
On the one hand, the TSM should effectively seal the formation cracks during the drilling process at about 85 °C, according to the variety rule of temperature in the geothermal wells [5]. Although there have been a few cases of slag/fly ash binder (SFB) being used in geothermal wells, its characteristic of a high thermal stability [17,18,19] could meet the high-temperature resistance requirements of geothermal wells. The SFB’s strength increased with the heat-curing temperature rose, when the temperature was below 90 °C [20], indicating that the binders are applicable for the 85 °C geothermal environment [2,21]. Additionally, the cement containing slag also exhibited a better compressive strength and water permeability than the Portland cement [22].
On the other hand, the TSM should degrade after the drilling, when the wellbore temperature rises to 200–300 °C, or even higher [5]. When the thermal degradation of PVC generates HCl to acidize binder at an elevated temperature, the material should degrade. If this method of developing TSM is practical, it will not only promote the development of the TSM for geothermal wells, but also recycle some waste plastics to reduce the environmental pollution at the same time.
The main research approaches are as follows: (1) firstly, the thermal degradation property of PVC is tested to decide on the applicable temperature of the TSM; (2) secondly, the compressive strength of the PVC-modified binders is tested after different treatment stages, to determine the optimal content of PVC; and finally, (3) the molecular structure of PVC, pore structure, hydration products, and microstructure of binders are tested to investigate the self-degradation mechanism.

2. Materials and Methods

2.1. Materials

The sources of SFB and the chemical compositions of slag and fly ash were the same as in our previous study (Table 2) [2]. The PVC was obtained from Xingwang Plastic Material Co., Ltd. (Dongguan, China). The slag, fly ash, and PVC’s particle size distributions were determined by a Malvern laser particle size analyzer, as shown in Figure 1a. The X-ray powder diffraction spectrometry (XRD) was carried out on slag and fly ash, the results are shown in Figure 1b. The main peaks in the XRD patterns of slag and fly ash are Calcite due to the carbonation. Additionally, there are small amounts of amorphous SiO2 in both slag and fly ash. Besides that, there are amorphous humps in the slag and fly ash’s patterns, indicating that they are mainly composed of glass phase material [23]. The mix proportions of all mortars are shown in Table 1. The mixing procedure, the prepared conditions and processes, and the size of specimens, as well as the treatment of filtrate-treated PVC, are also the same as previously reported [2].

2.2. Measurements

The thermal degradation property of PVC was studied by Thermogravimetric Analysis (TGA). XRD was utilized to identify the crystalline phases of the specimens. Fourier Transform Infrared (FTIR) Spectrometry was used to investigate the molecular structures of PVC and binder gels. The experimental conditions and sample preparation were also the same as in the previous report [2]. The micro-pore structure of the specimens was explored by mercury intrusion porosimetry (MIP AutoPore-IV9500, Micromeritics, USA) testing, with a contact angle of 130° and range of 0.003–369 μm. Scanning Electron Microscopy (SEM JSM-7401F, JEOL Ltd., Japan) and Energy Dispersive Spectroscopy (EDS GENESIS, EDAX, USA) analyses were performed to investigate the microstructures and chemical compositions of the 300 °C-heated Control and PVC20, at an accelerating voltage of 5 kV.

3. Results and Discussion

3.1. TGA

As shown in Figure 2a, the thermal degradation of PVC raw materials at room temperature ~600 °C is divided into two stages: 210–370 °C and 370–550 °C, with the weight loss rates of 62.41% and 26.93%, respectively. The positions of the maximum weight loss rate in the two stages are 304 °C and 466 °C, respectively, with corresponding peak values of 1.17 and 0.45 %/°C. The thermal degradation rate of the first stage is faster and the weight loss rate is higher than that of the second stage. The major chemical reaction of the first stage is the dechlorination reaction of PVC, with the main degradation product of HCl and a small amount of Cl2 [24,25,26,27,28].
Figure 2b shows the TG-DTG curves of filtrate-treated PVC. The thermal degradation of filtrate-treated PVC also presents two stages: 230–390 °C and 390–550 °C, with the weight loss rates of 54.87% and 24.96%, respectively. The peak values of the weight loss rate in the two stages are 299 °C and 467 °C, with corresponding peak values of 1.51 and 0.34%/°C. The first-stage weight loss of PVC decreases by 7.54% and the peak temperature is also reduced by 4 °C; however, the peak value increases by 0.34%/°C. The major degradation stage of PVC is still the first stage, in which the dechlorination reaction took place. Considering that the peak temperatures of PVC’s thermal weight loss rate are around 300 °C, PVC was used to develop the self-degradable TSM for 300 °C geothermal wells.

3.2. Compressive Strength

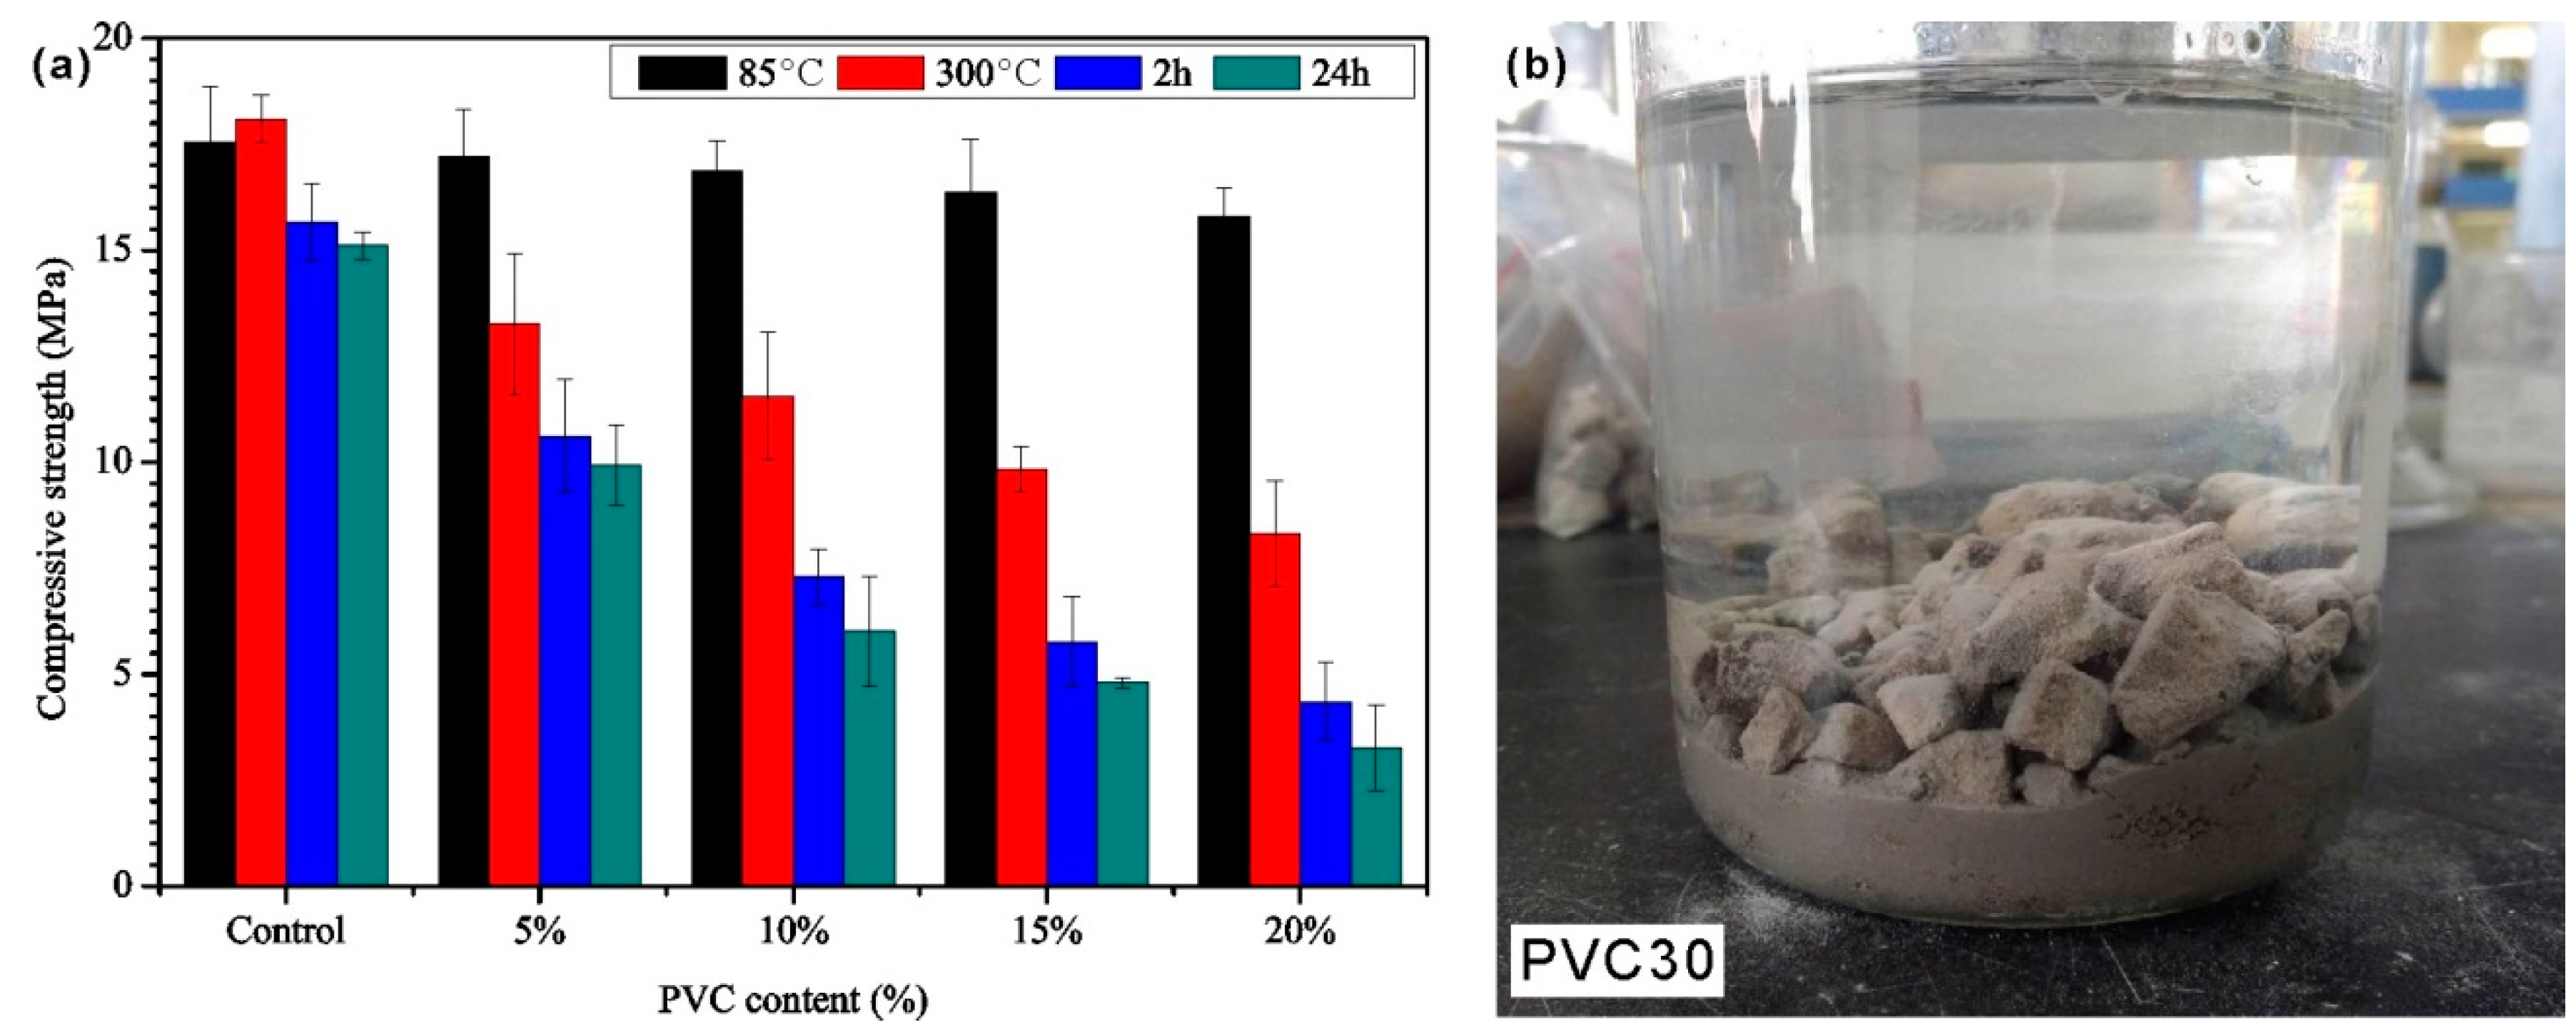
As shown in Figure 3, the 85 °C-cured, 300 °C-heated, 2 h-immersed, and 24 h-immersed compressive strength of the control are 17.56, 18.10, 15.66, and 15.11 MPa, and the PVC20’s are 15.79, 9.53, 5.61, and 3.69 MPa, respectively. The 300 °C-heated compressive strength of the Control increases slightly after being heated, when compared with the 85 °C-cured specimen. The phenomenon is consistent with ealier findings [17,29], which pointed out that a high temperature caused the cracks in specimens to disappear and the microstructure to become more compact, due to excessive shrinkage. Additionally, we consider that the further hydration of binder before the free water was lost completely during the heating also contributed to the strength increment, as the specimens were cured for a short time (4 days) in our study. The strength of SFB without PVC can remain above 15.0 MPa after 300 °C heating and water immersion, indicating that the SFB has a good high-temperature resistance, and is thus suitable as sealing material for high-temperature geothermal wells. Furthermore, although the 85 °C-cured compressive strength of binder decreases slightly with the increase of PVC content, the strength of PVC20 is greater than 14.80 MPa.
When compared with the 85 °C-cured specimens, the compressive strength of the 300 °C-heated Control increases slightly; on the contrary, the cement with PVC decreases. The compressive strength decreasing level of the Control is only 13.95% after 24 h water-immersion. The level increases with the increasing of PVC content, and reaches 76.63% when the PVC content is 20%. The maximum PVC content in this paper is 20%, in order to avoid PVC thermal degradation generating excessive HCl, which is harmful to down-hole environments. The 20% PVC is selected as the optimal content. It is worth noting that when the PVC content reaches 30%, the 300 °C-heated specimens immediately break into fragments and powder upon making contact with water. Figure 3b shows the image of PVC30 after the water-immersion and 2 h of rest.
In our previous studies [2,6,30,31], the self-degradation mechanism of the TSM has been much discussed. It was considered that the heat shock on the hot binders when exposed to water, the dissolution of the solid substance in the dry hot samples, the leaching behavior of soluble ions, and the high heat generated in exothermic reactions all contributed to the self-degradation. However, this paper focuses on the process of PVC promoting the material degradation, and thus the function of the PVC thermal degradation acidizing binder is the emphasis.

3.3. MIP Results

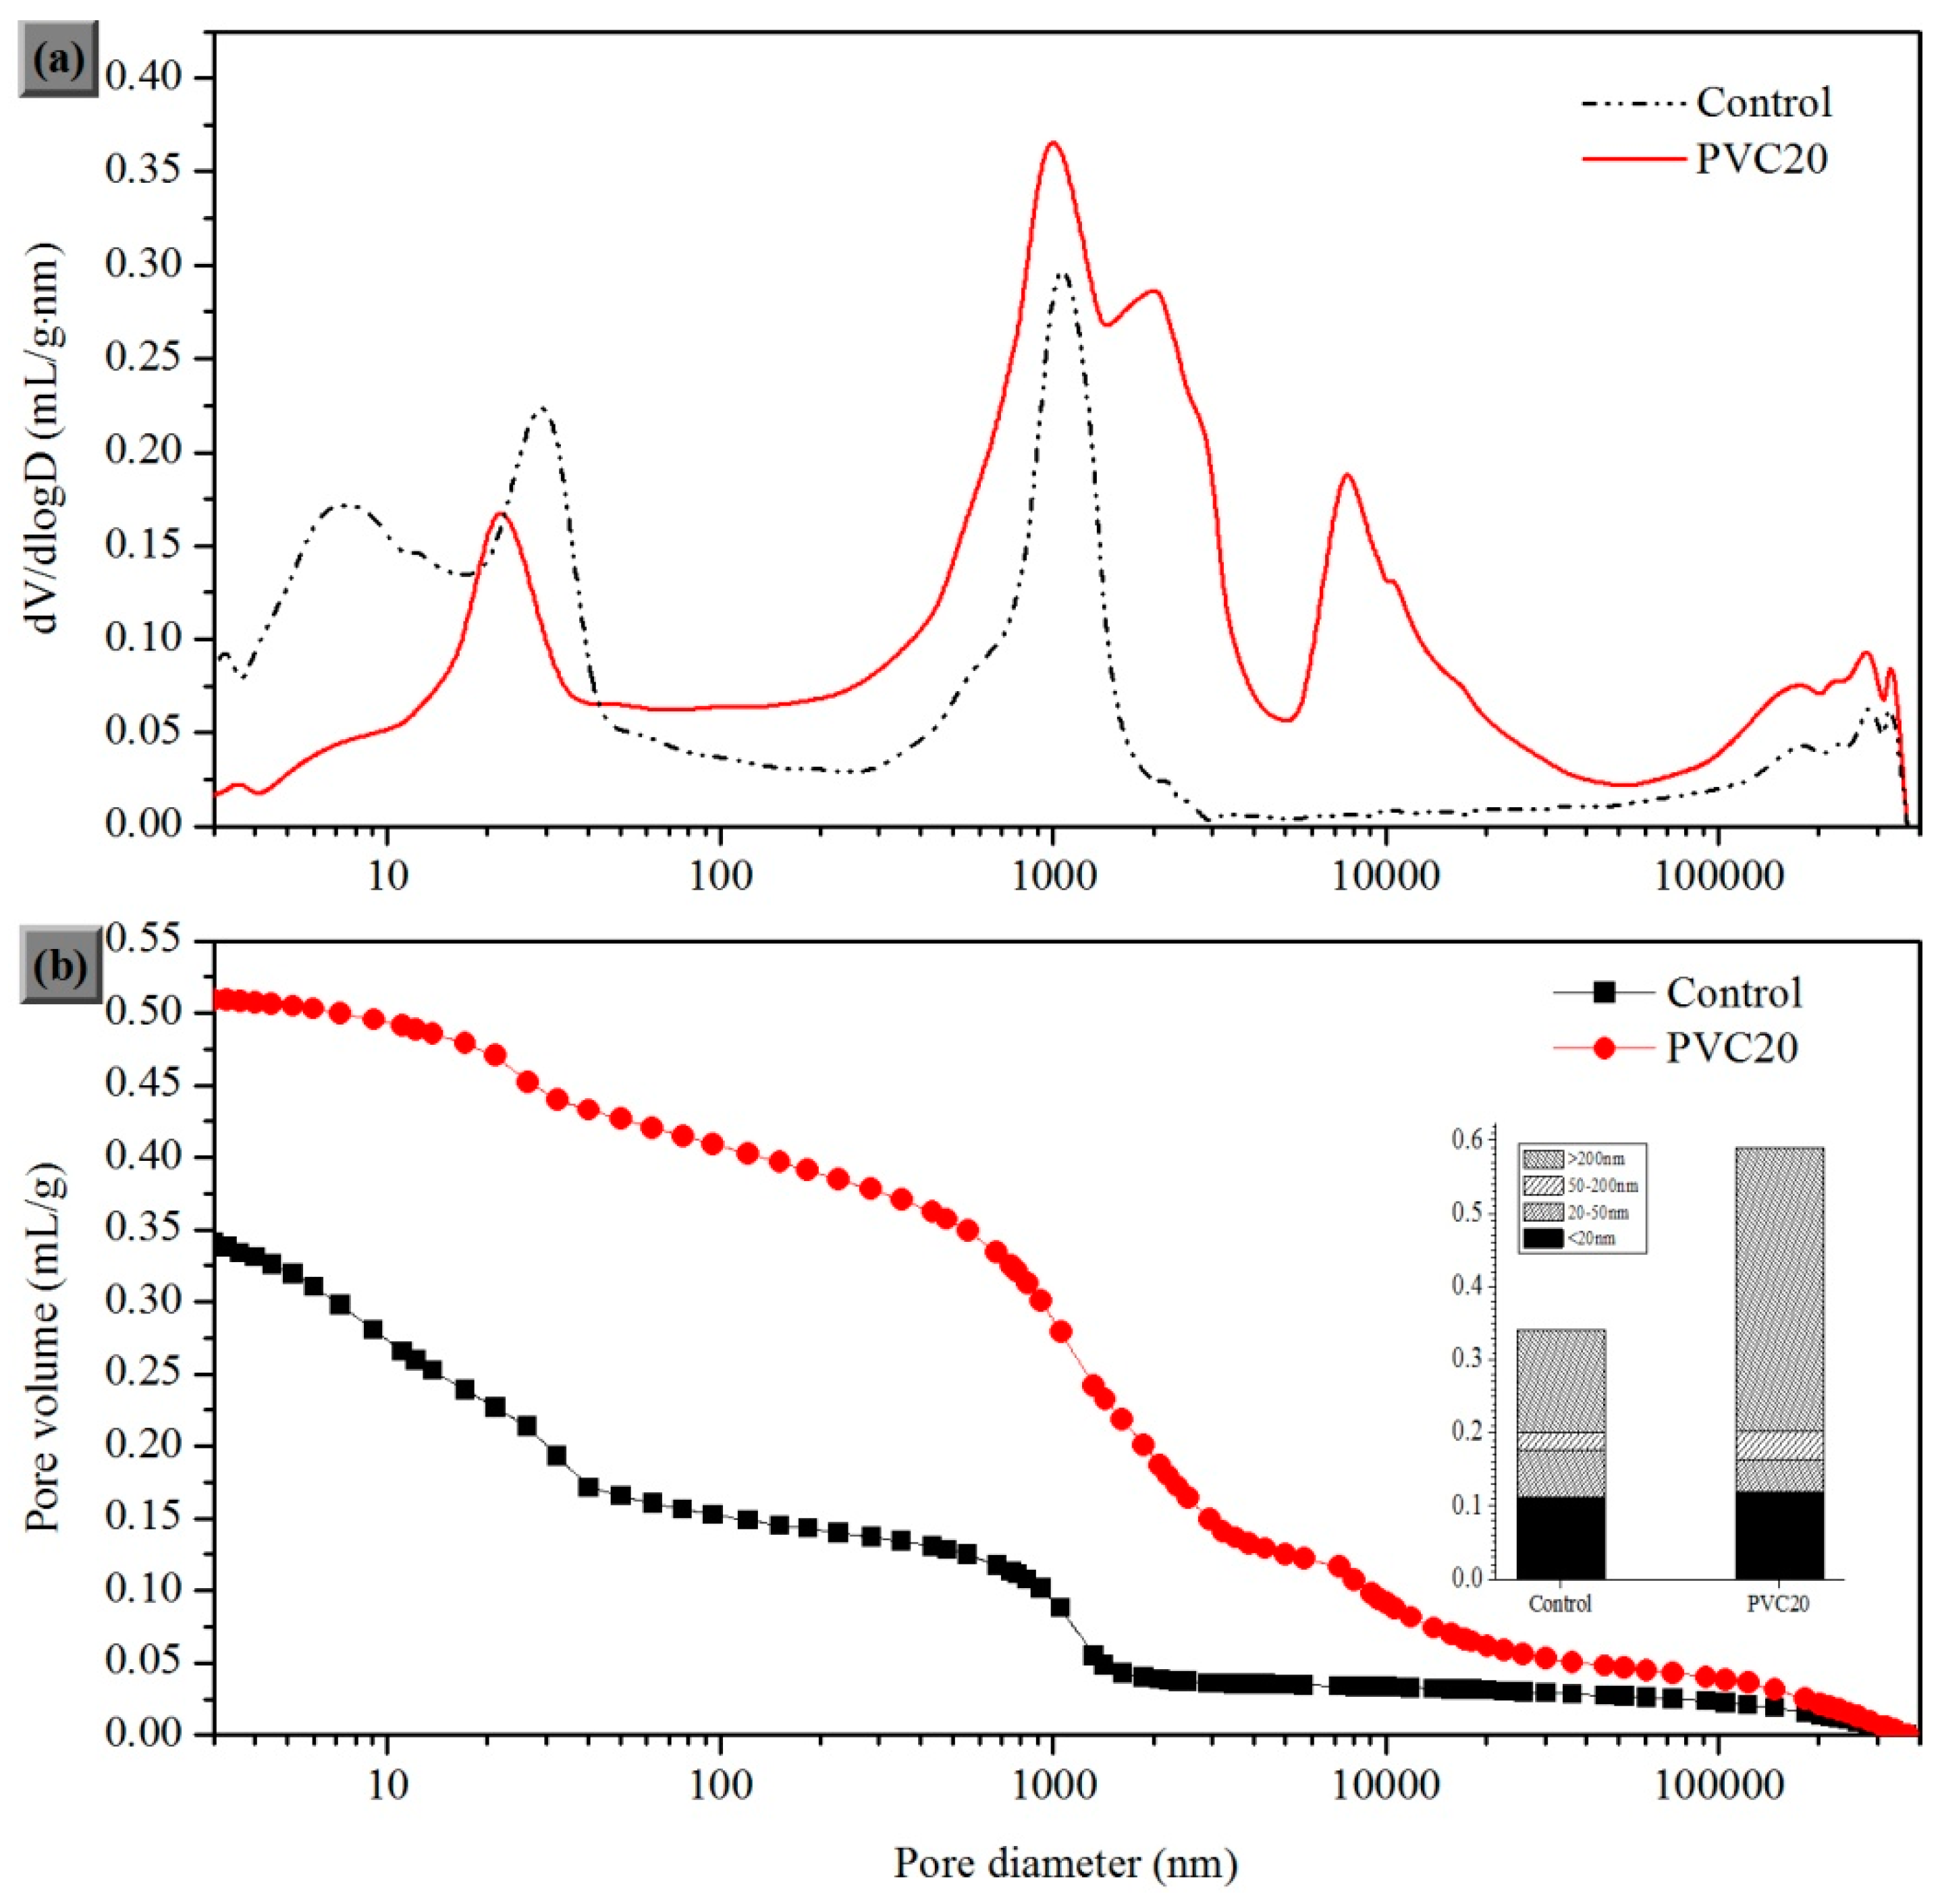
The differential pore volume and cumulative pore volume of the 300 °C-heated Control and PVC20 are shown in Figure 4. The total pore volume of the Control and PVC20 are 0.3413 mL/g and 0.5093 mL/g, respectively. The result of the differential curve of pore volume shows that there are three characteristic peaks for the Control, at 7.5 nm, 28.9 nm, and 1063.1 nm, while PVC20 has four characteristic peaks at 21.8 nm, 1005.0 nm, 2009.8 nm, and 7742.3 nm.
According to the influence of different sizes of holes on the cement strength, the holes in cement can be classified as non-hazardous pores (<20 nm), less harmful pores (20–50 nm), harmful pores (50–100 nm), and multiple harmful pores (>200 nm) [32]. There are two characteristic peaks of the Control at <50 nm, and only one peak of multiple harmful pores at >200 nm. However, there are three peaks of multiple harmful pores at >200 nm in PVC20. Moreover, the pore volume of >200 nm in the Control is 0.1419 mL/g, but the pore volume in PVC20 is 0.3886 mL/g, indicating that the addition of PVC increases the volume of multiple harmful pores of binder, but has a smaller impact on the other parts.

3.4. XRD

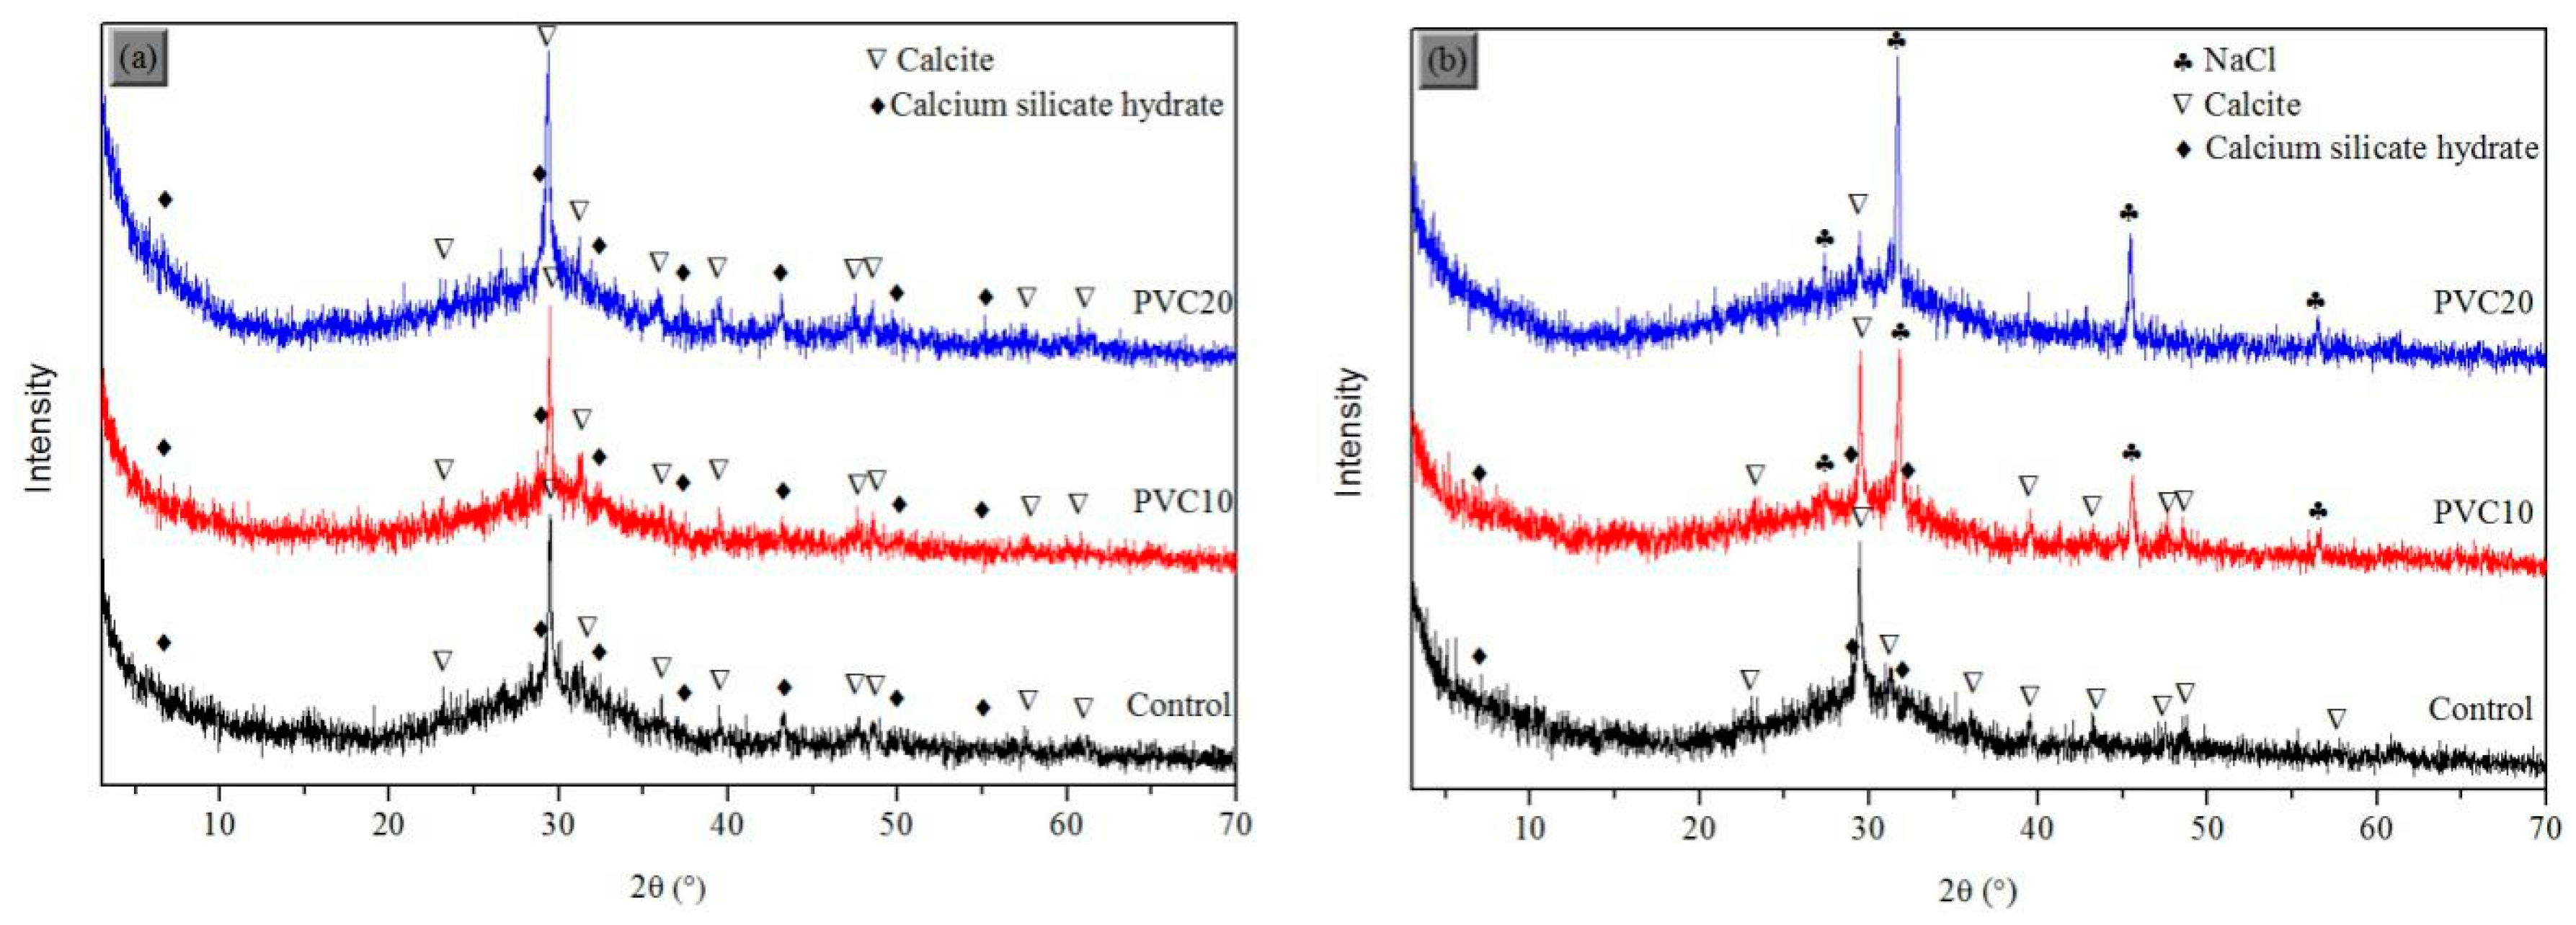
As shown in Figure 5a, the addition of both 10% and 20% PVC has little effect on the peak positions in XRD patterns of 85 °C-cured binder. There is an amorphous hump between 2θ = 20–38° in each of the XRD patterns of Figure 5a, with the most obvious diffraction peak of Calcite 2θ = 29.4°. This phenomenon indicates that PVC does not affect the composition of the hydration products.
As shown in Figure 5b, after the 300 °C-heating, the most obvious peak of the Control is still the diffraction peak of Calcite 2θ = 29.4°, due to the carbonization. However, the CaCO3 diffraction peak’s intensity declines with the appearance of NaCl diffraction peaks in the XRD patterns of 300 °C-heated binders with PVC. The intensity of CaCO3 diffraction peaks decreases as the PVC content increases; on the contrary, the NaCl’s increases. When the PVC content reaches 20%, the diffraction peak intensity of NaCl is relatively higher when compared to PVC10. Meanwhile, the peak intensities of CaCO3 diffraction peaks in XRD patterns of 300 °C-heated PVC20 almost disappear.
The function of the generation of NaCl has been analyzed as follows. Firstly, polyvinyl chloride is mainly composed of C, H, O, and Cl elements, thus its thermal degradation cannot produce NaCl. Secondly, both the patterns of the 85 °C-cured and 300 °C-heated Control do not show NaCl diffraction peaks, indicating that the generation of NaCl in 300 °C-heated PVC10 and PVC20 directly relates to the addition of PVC. Finally, there is no NaCl diffraction peak in 85 °C-cured PVC10 and PVC20, indicating that the chemical reaction between PVC and SFB cannot generate NaCl at 85 °C. In summary, the products of PVC thermal degradation react with the substances in binders to generate NaCl at 300 °C.
By comparing 85 °C-cured and 300 °C-heated PVC20, it can be found that the diffraction peaks of CaCO3 change from sharp and obvious multi-peaks to only two diffraction peaks with a low intensity, indicating that CaCO3 was consumed in large quantities during the heating process. The diffraction peak intensity of CaCO3 decreases with the increasing PVC content, proving that the thermal degradation of PVC generates a large amount of HCl, which could react with CaCO3, as follows:
2HCl+CaCO3→CaCl2+H2O+CO2
CaCl2 did not show obvious diffraction peaks in the XRD patterns of 300 °C-heated PVC10 and PVC20. The reason for this might be that, as a commonly used desiccant, CaCl2 has an extremely strong moisture absorption property and is easily deliquescent when exposed to air. During the process of being ground into powder and subjected to an XRD test, CaCl2 in the binder is deliquescent, and thus could not show significant diffraction peaks in the patterns. Besides that, the 300 °C-heated PVC20 specimens became noticeably wet after being cooled in the air for a period of time.
It is worth noting that a few kinds of crystal products could be found in all samples. We believe that binder gels are the main hydration products. Similar results were reported by the 75 wt.% slag/25 wt.% fly ash sample cured for 14 days in paper [33] and sample GFM0N10 cured for 3 days in paper [34]. However, different results were obtained by paper [35] and [36]. The main reasons for this phenomenon are the different curing conditions and times, the slag/fly ash ratio, and the chemical composition of original materials, etc.
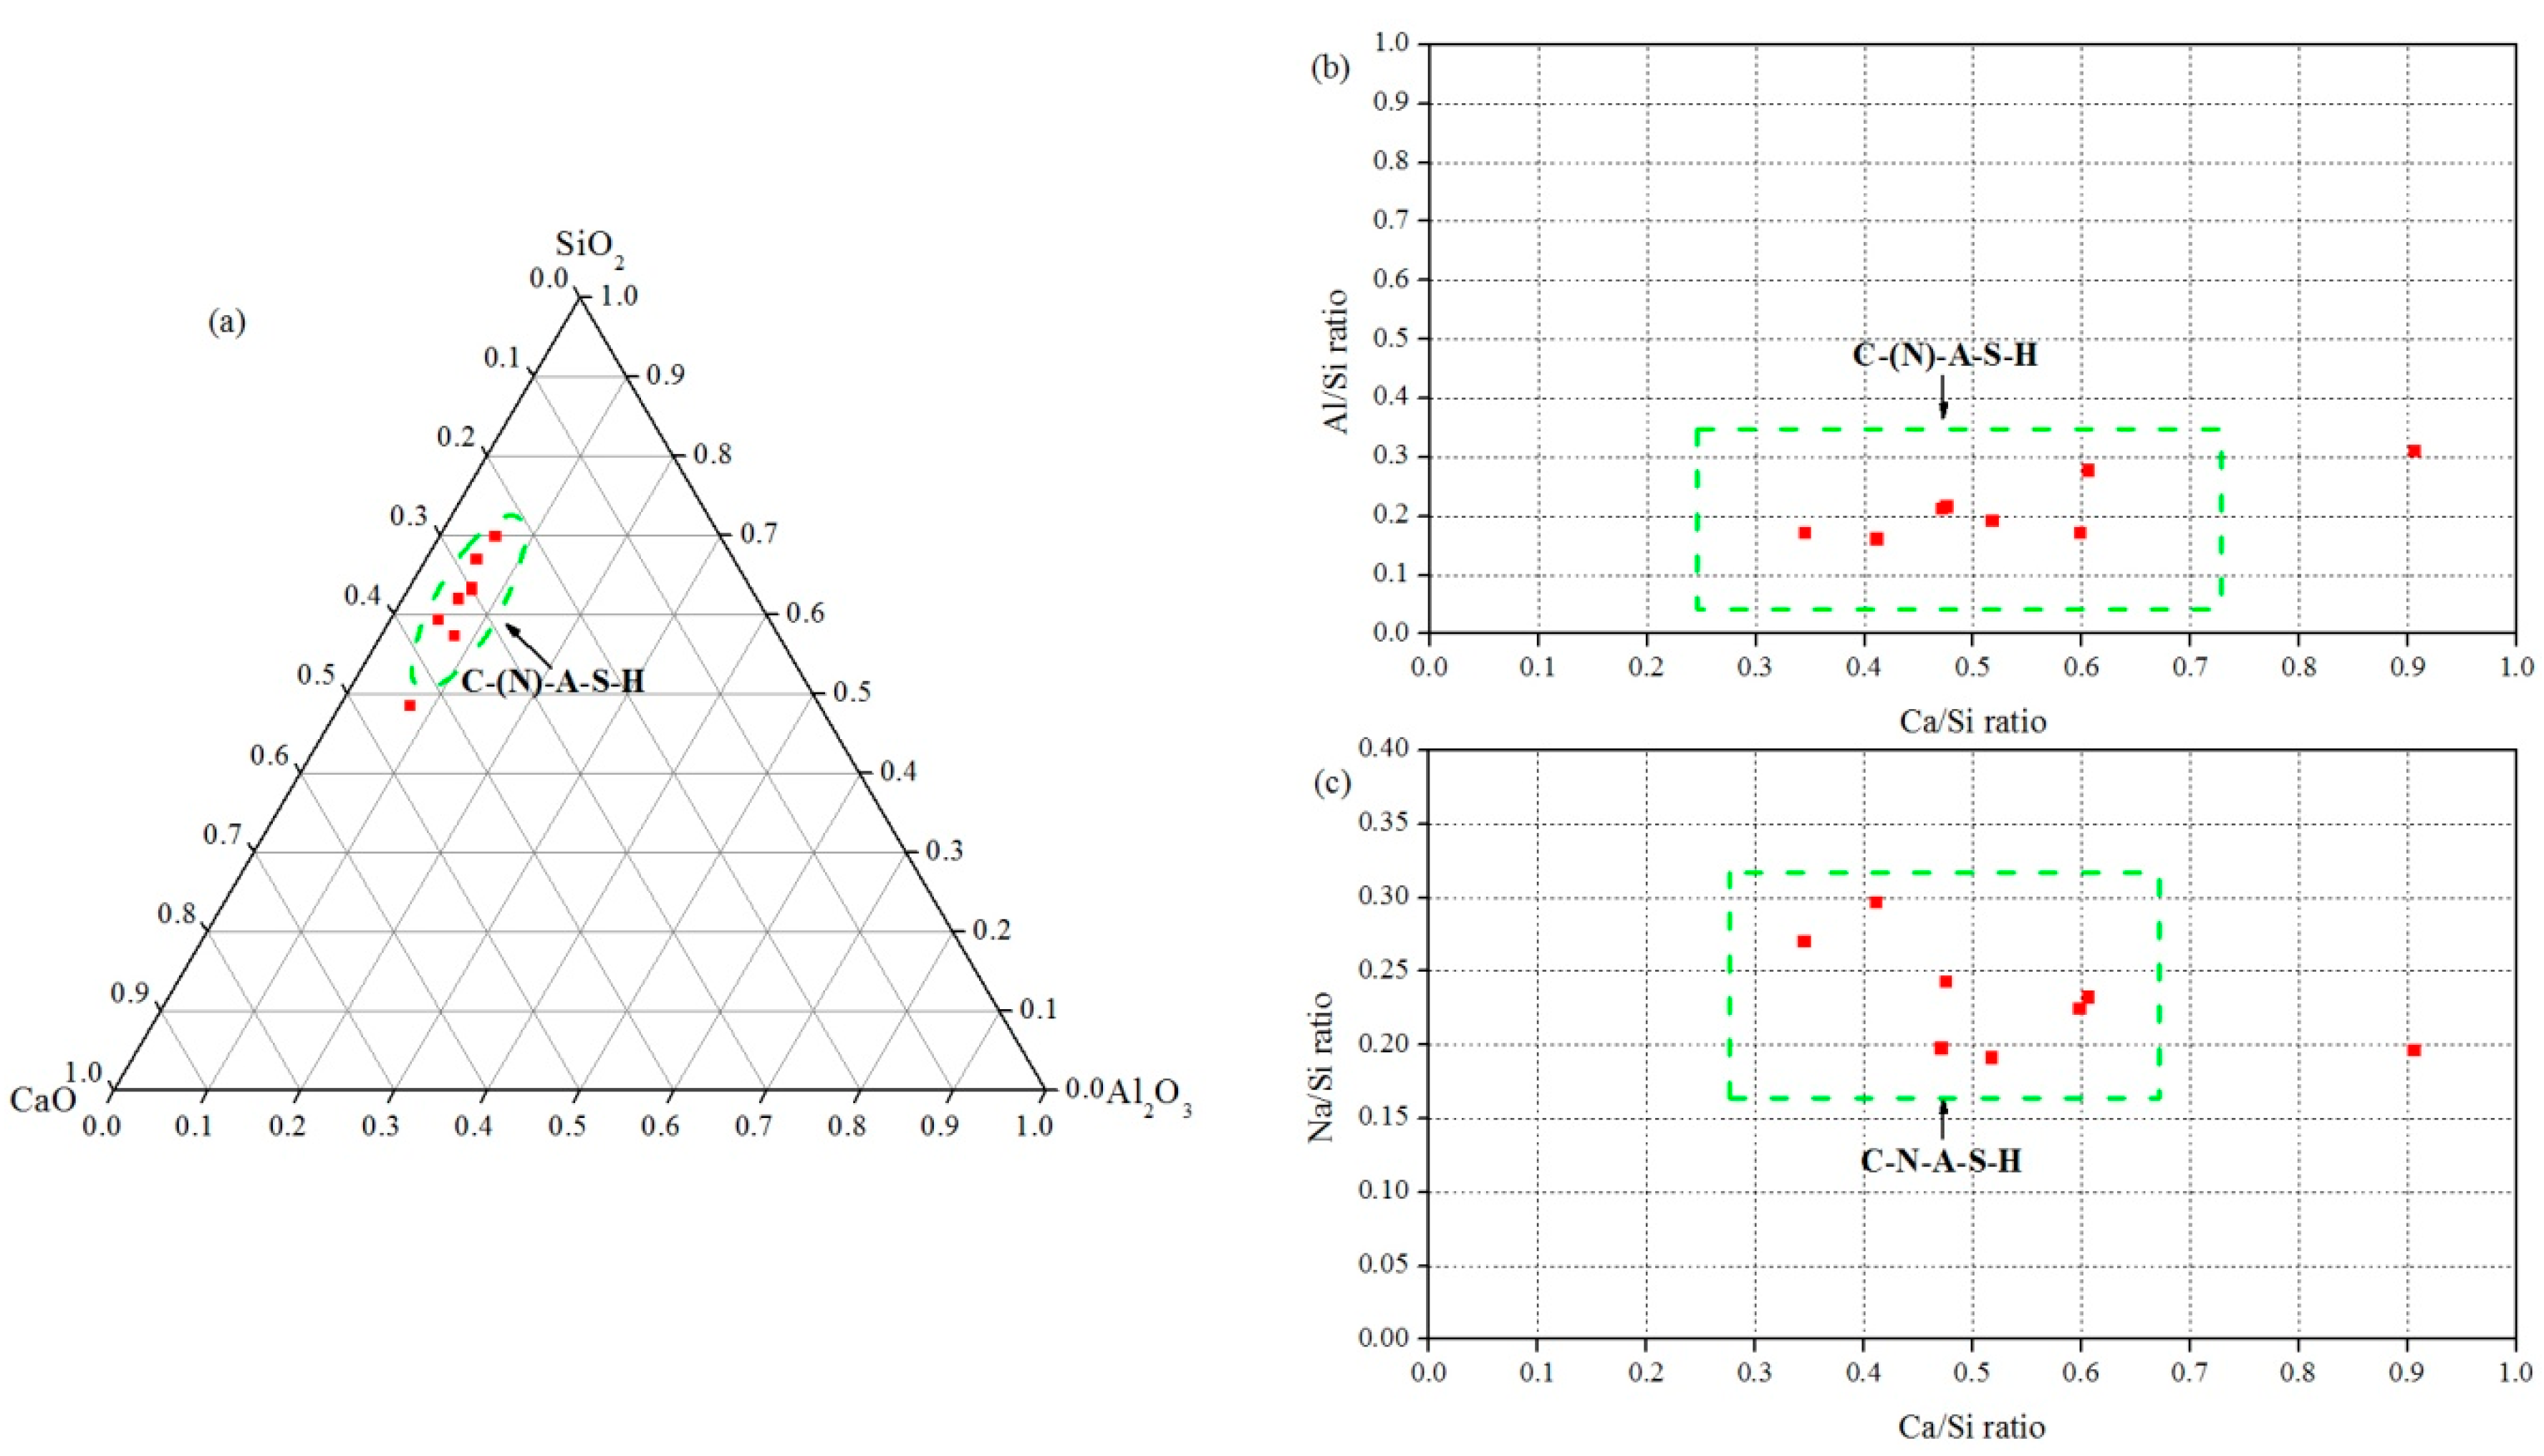
The EDS test was conducted on the 300 °C-heated Control to analyze the gel composition of SFBs. The statistical results of EDS are shown in Table 2, and the ternary representations (a) referred to in paper [34,35] and the plots of the Al/Si ratio versus Ca/Si ratio (b) and Na/Si ratio versus Ca/Si ratio (c) referred to in paper [37] are shown in Figure 6. The hydration products of the Control assessed by Figure 6 are likely to be C-(N)-A-S-H or C-N-A-S-H. Both C-(N)-A-S-H and C-N-A-S-H gel might be hybrid-type phases of the N-A-S-H gel and the C-A-S-H gel [34]. However, paper [34] also reported that the SFBs displayed the co-existence of clearly distinguishable C-A-S-H and N-A-S-H gels, at an earlier age. As the curing time of all samples in this paper is no longer than 6 days, we consider that the binder gels should be composed of C-A-S-H and N-A-S-H gels.

3.5. FT-IR

3.5.1. PVC

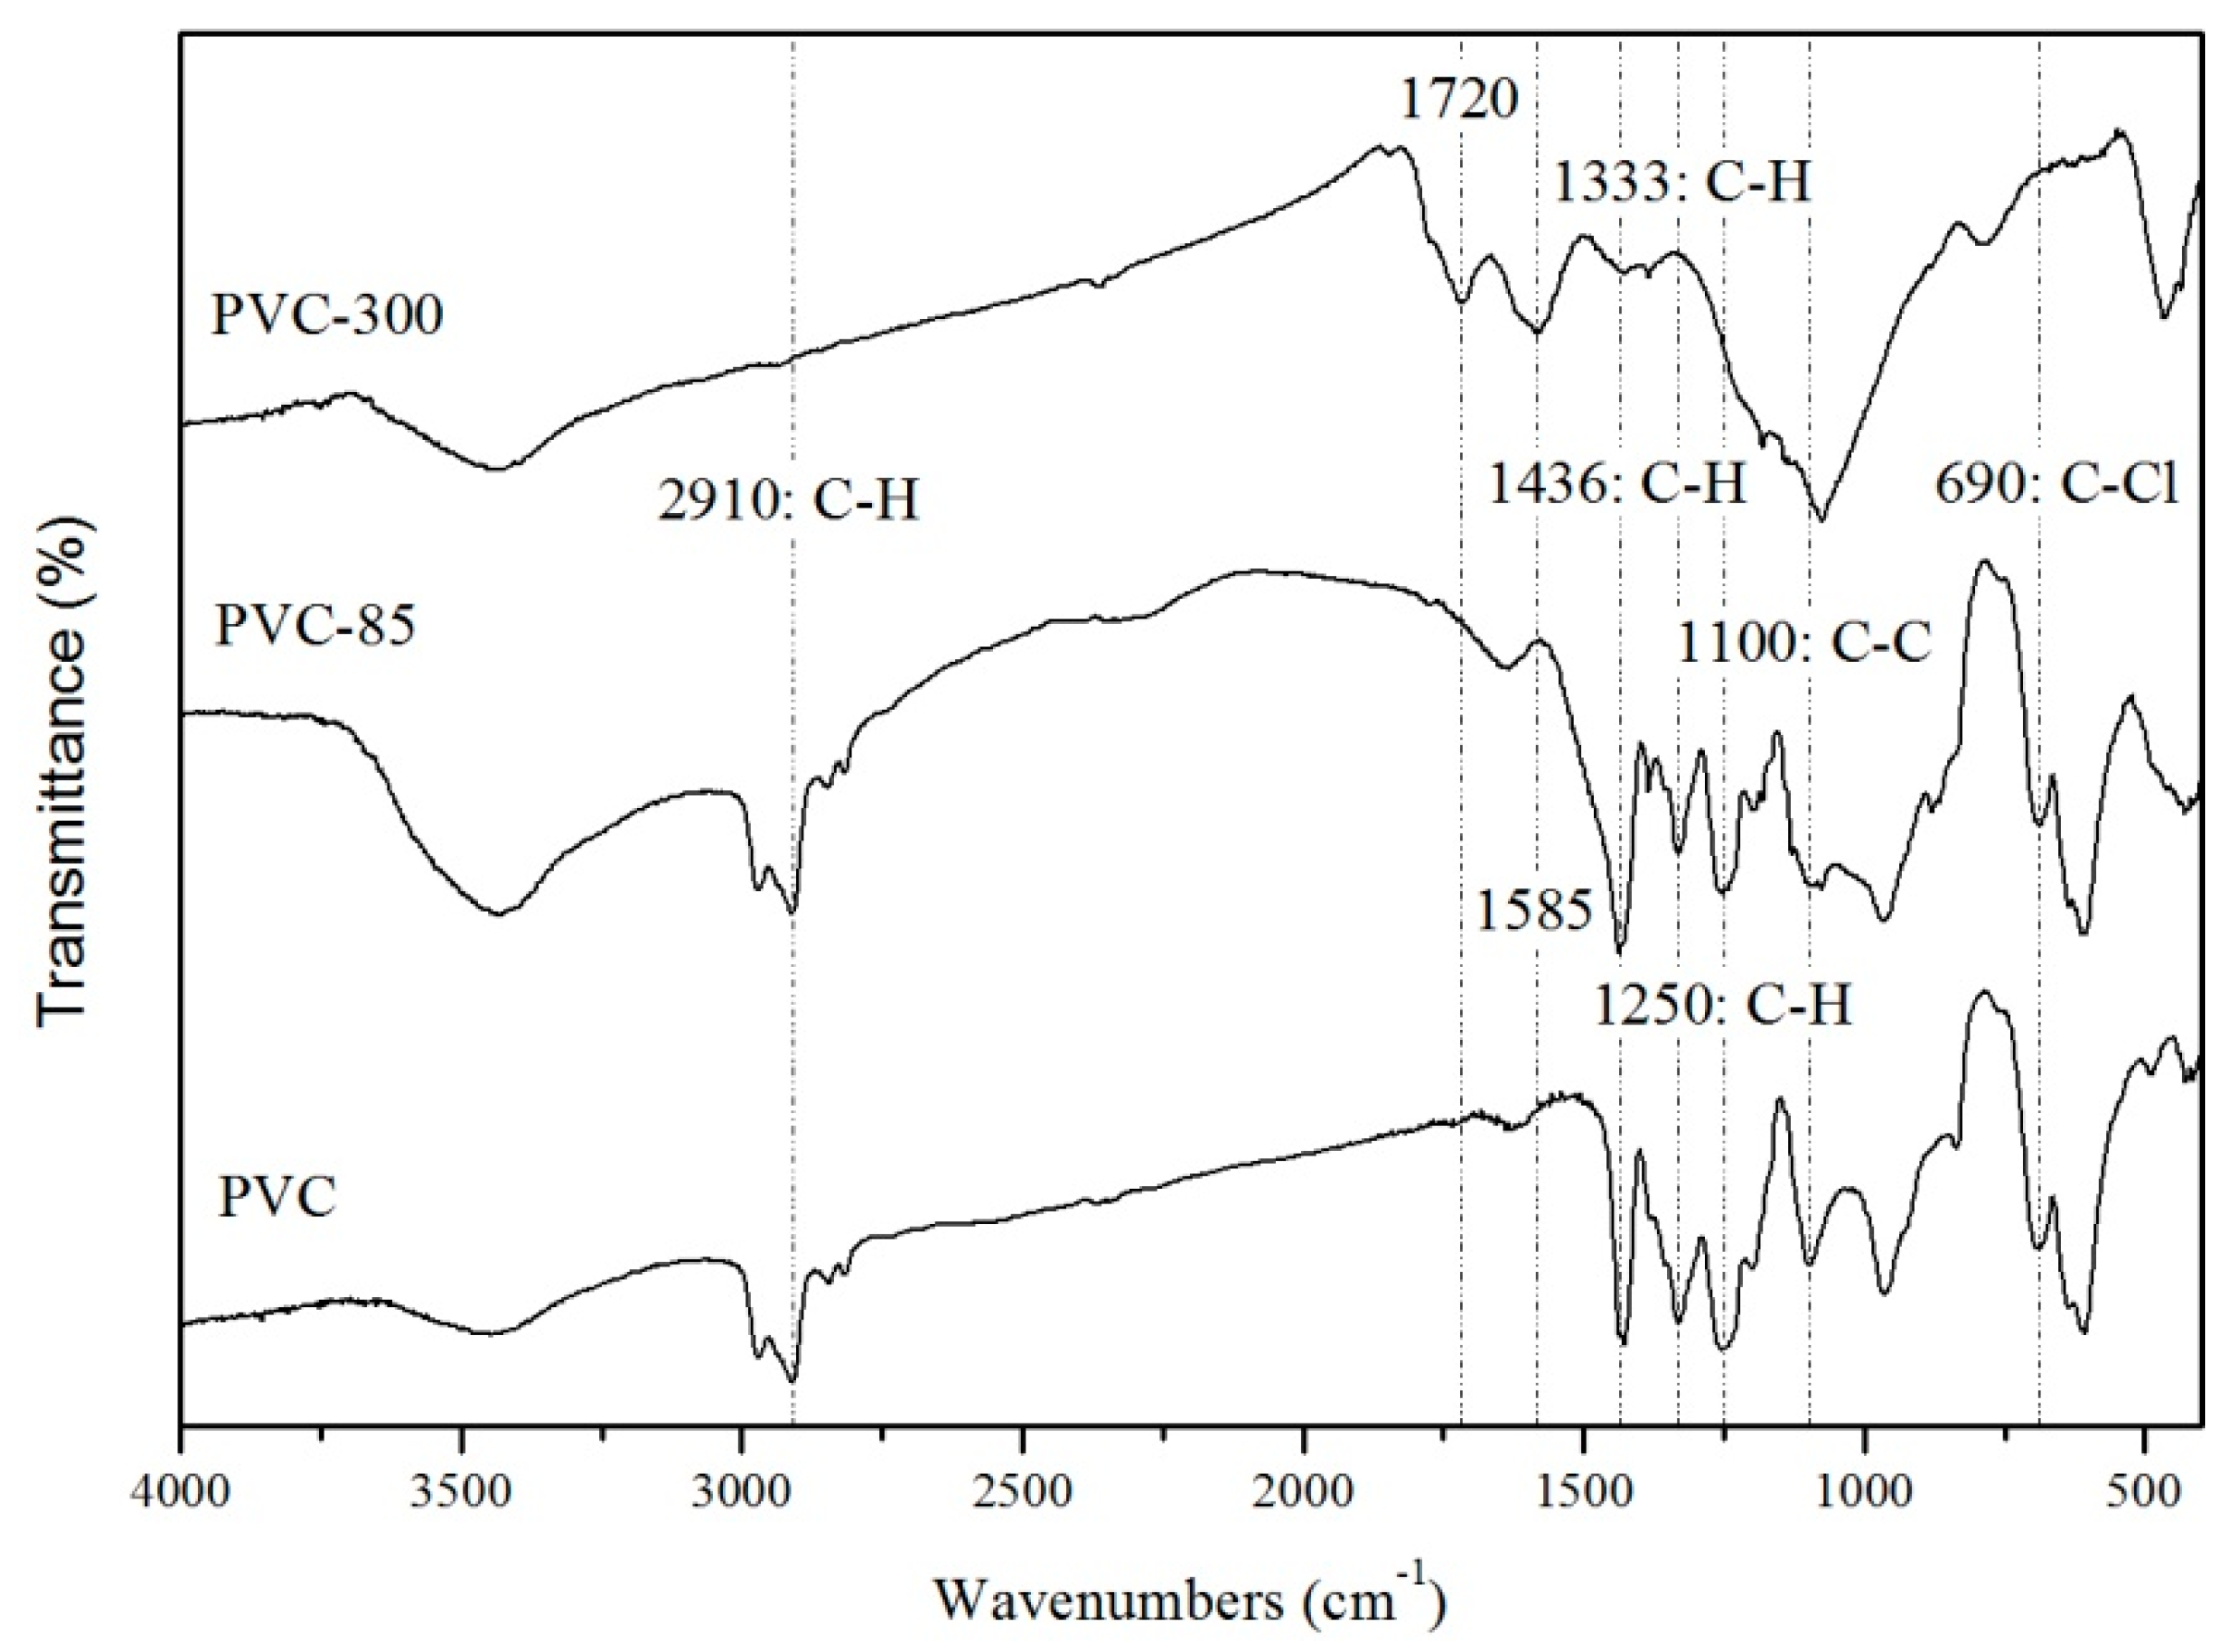
Figure 7 shows the FTIR spectra of the original (PVC), 85 °C filtrate-treated (PVC-85) and 300 °C-heated (PVC-300) PVC. It is found that the difference between the FTIR spectra of PVC and PVC-85 is not significant, indicating that the filtrate-treatment does not change much in PVC’s molecular structure. The strongest bands of PVC-300 at 1100 cm−1 assigned to the C-C skeletal stretching vibration, indicating that the carbon is the main solid product of the PVC’s thermal degradation. Meanwhile, there are two bands at 1585 cm−1 and 1720 cm−1 assigned to COO, suggesting the existence of carboxylate in the PVC’s solid degradation product.
As shown in the FTIR spectra of PVC and PVC-85, the bands around 1333 cm−1 and 1250 cm−1 can be attributed to the bending vibration of -CH- in -CHCl-, the band at 1436 cm-−1 can be attributed to the deformation vibration of -CH2- in -CH2-(CHCl)-, and the band at 690 cm−1 can be attributed to the stretching vibration of C-Cl. All of the bands above belong to the characteristic peaks of PVC [14]. The bands at 2910 cm−1 can be assigned to the stretching vibration peak of CH in -CH2-. All of these bands weaken or even disappear in PVC-300, indicating that the groups of CH and C-Cl were consumed during the 5 h heating process [38]. This phenomenon also verifies that the dechlorination reaction happens during the thermal degradation of PVC, generating HCl.

3.5.2. SFB

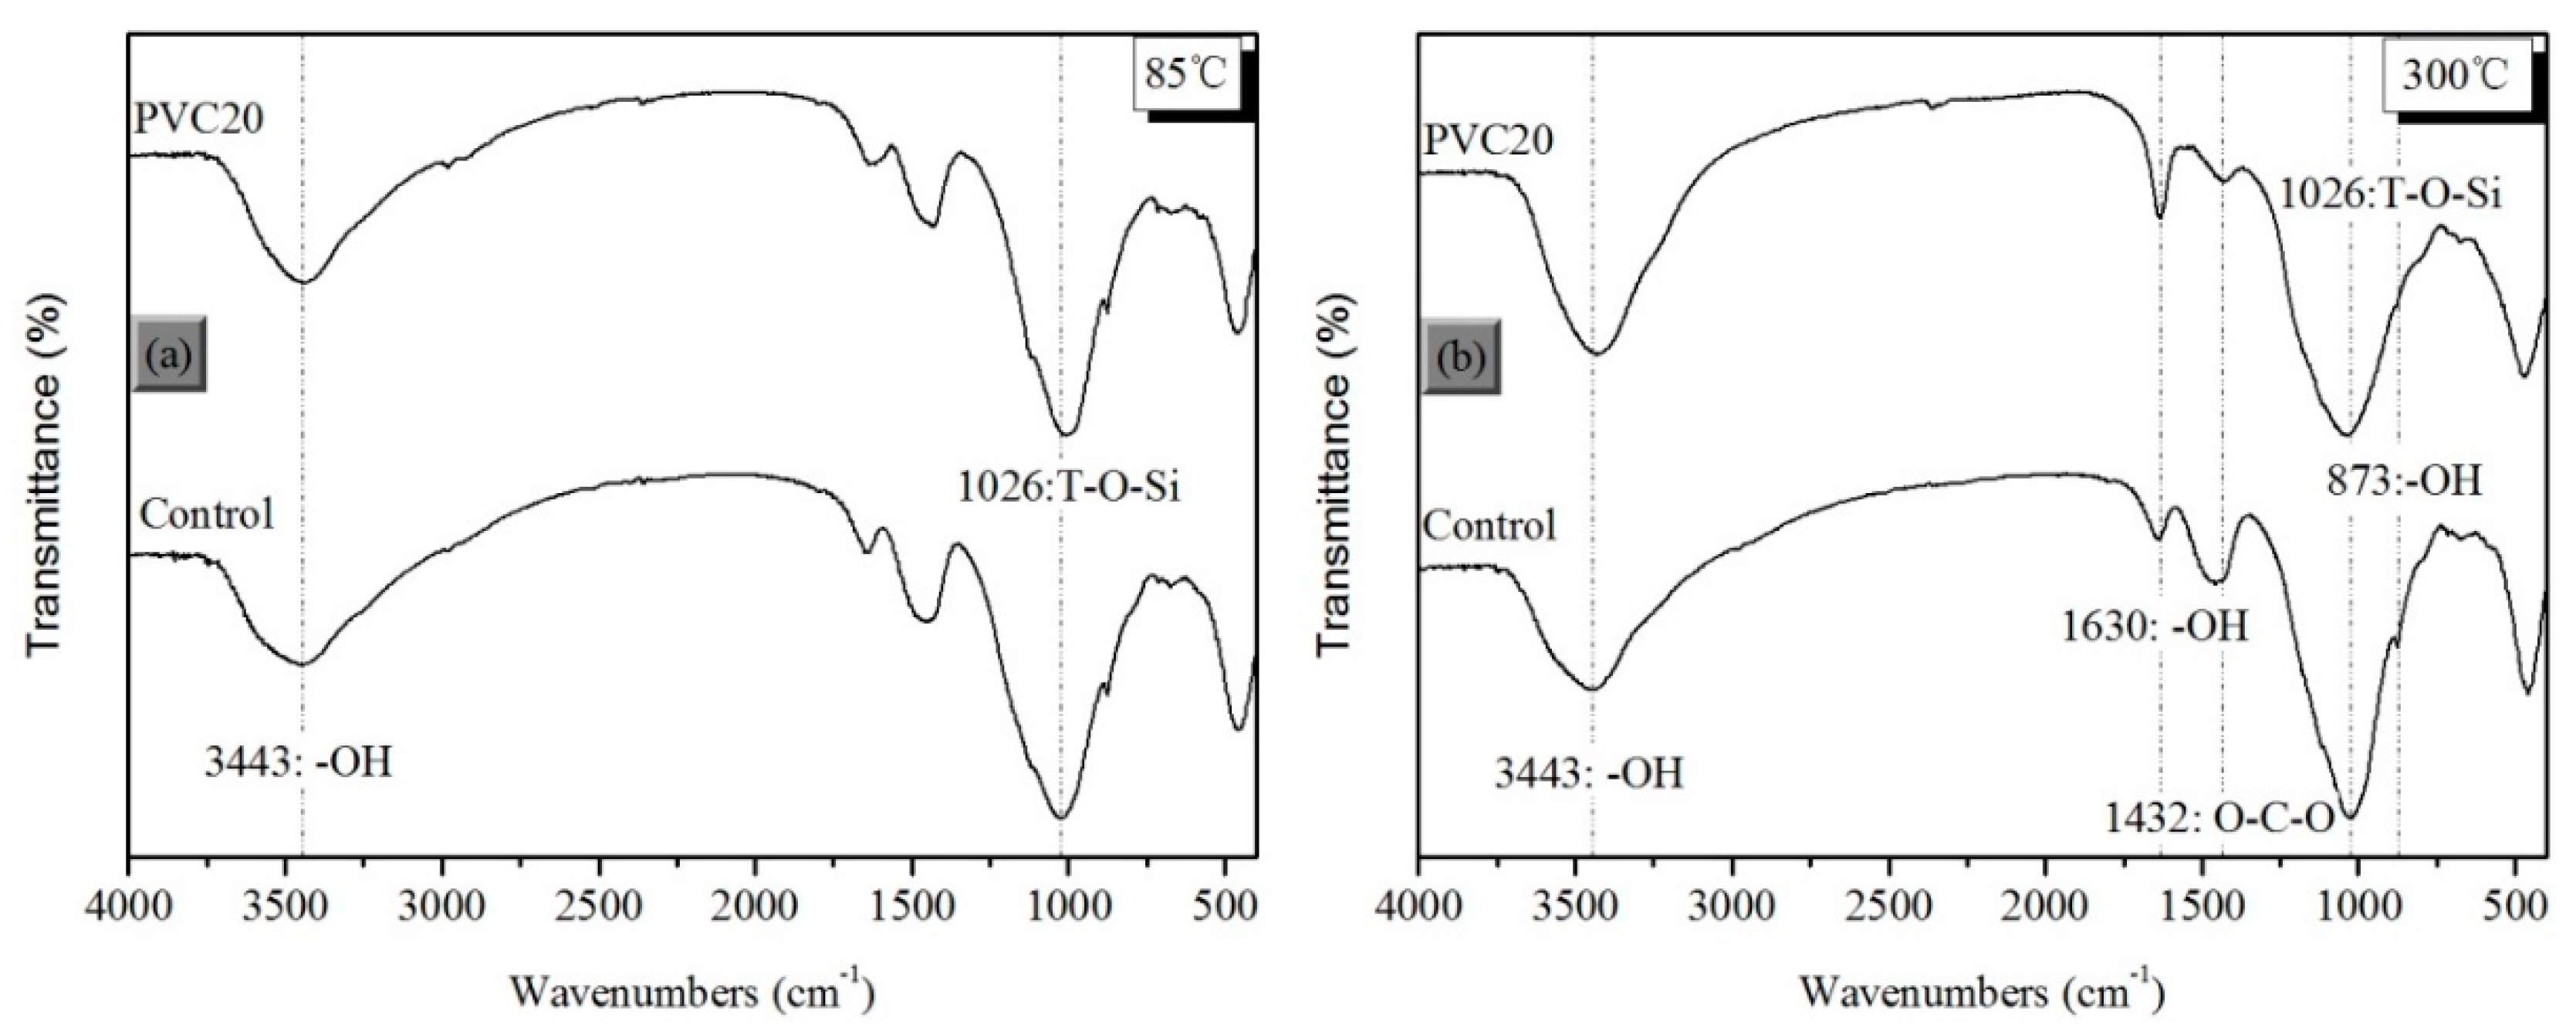
Figure 8 shows the FTIR spectra of the 85 °C-cured (a) and 300 °C-heated (b) samples of the Control and PVC20. As shown in Figure 8a, the difference between the FTIR spectra of the 85 °C-cured Control and PVC20 is not obvious, indicating that PVC does not affect the composition of the hydration products of binder at 85 °C. However, there is a significant difference between the two spectra in Figure 8b, where the band of PVC20 at 1432 cm−1 significantly reduces and the bands at 873 cm−1 disappear. Both of the two bands attributed to the O-C-O stretching vibration correspond to the CaCO3 in the binder, which is consistent with the characteristic peak of CaCO3 appearing in the XRD results.
The bands at 3443 cm−1 and 1630 cm−1 are assigned to -OH stretching vibration and H-O-H bending vibration, respectively, suggesting that there was chemically bound water in the samples. The band at 1630 cm−1 in 300 °C-heated PVC20 is significantly stronger than that of the Control and 85 °C-cured PVC20. The reason for this is that HCl generated by the thermal degradation of PVC reacts with the binder to produce CaCl2, which is hygroscopic. When the heated PVC20 powders were exposed to air, water was quickly bound by CaCl2 in the form of dihydrate to hexahydrate, resulting in stronger bands. Meanwhile, the bands at 1432 cm−1 and 873 cm−1 that correspond to CaCO3 show a significant decrease in the 300 °C-heated PVC20, verifying that CaCO3 in PVC20 was consumed during the heating.
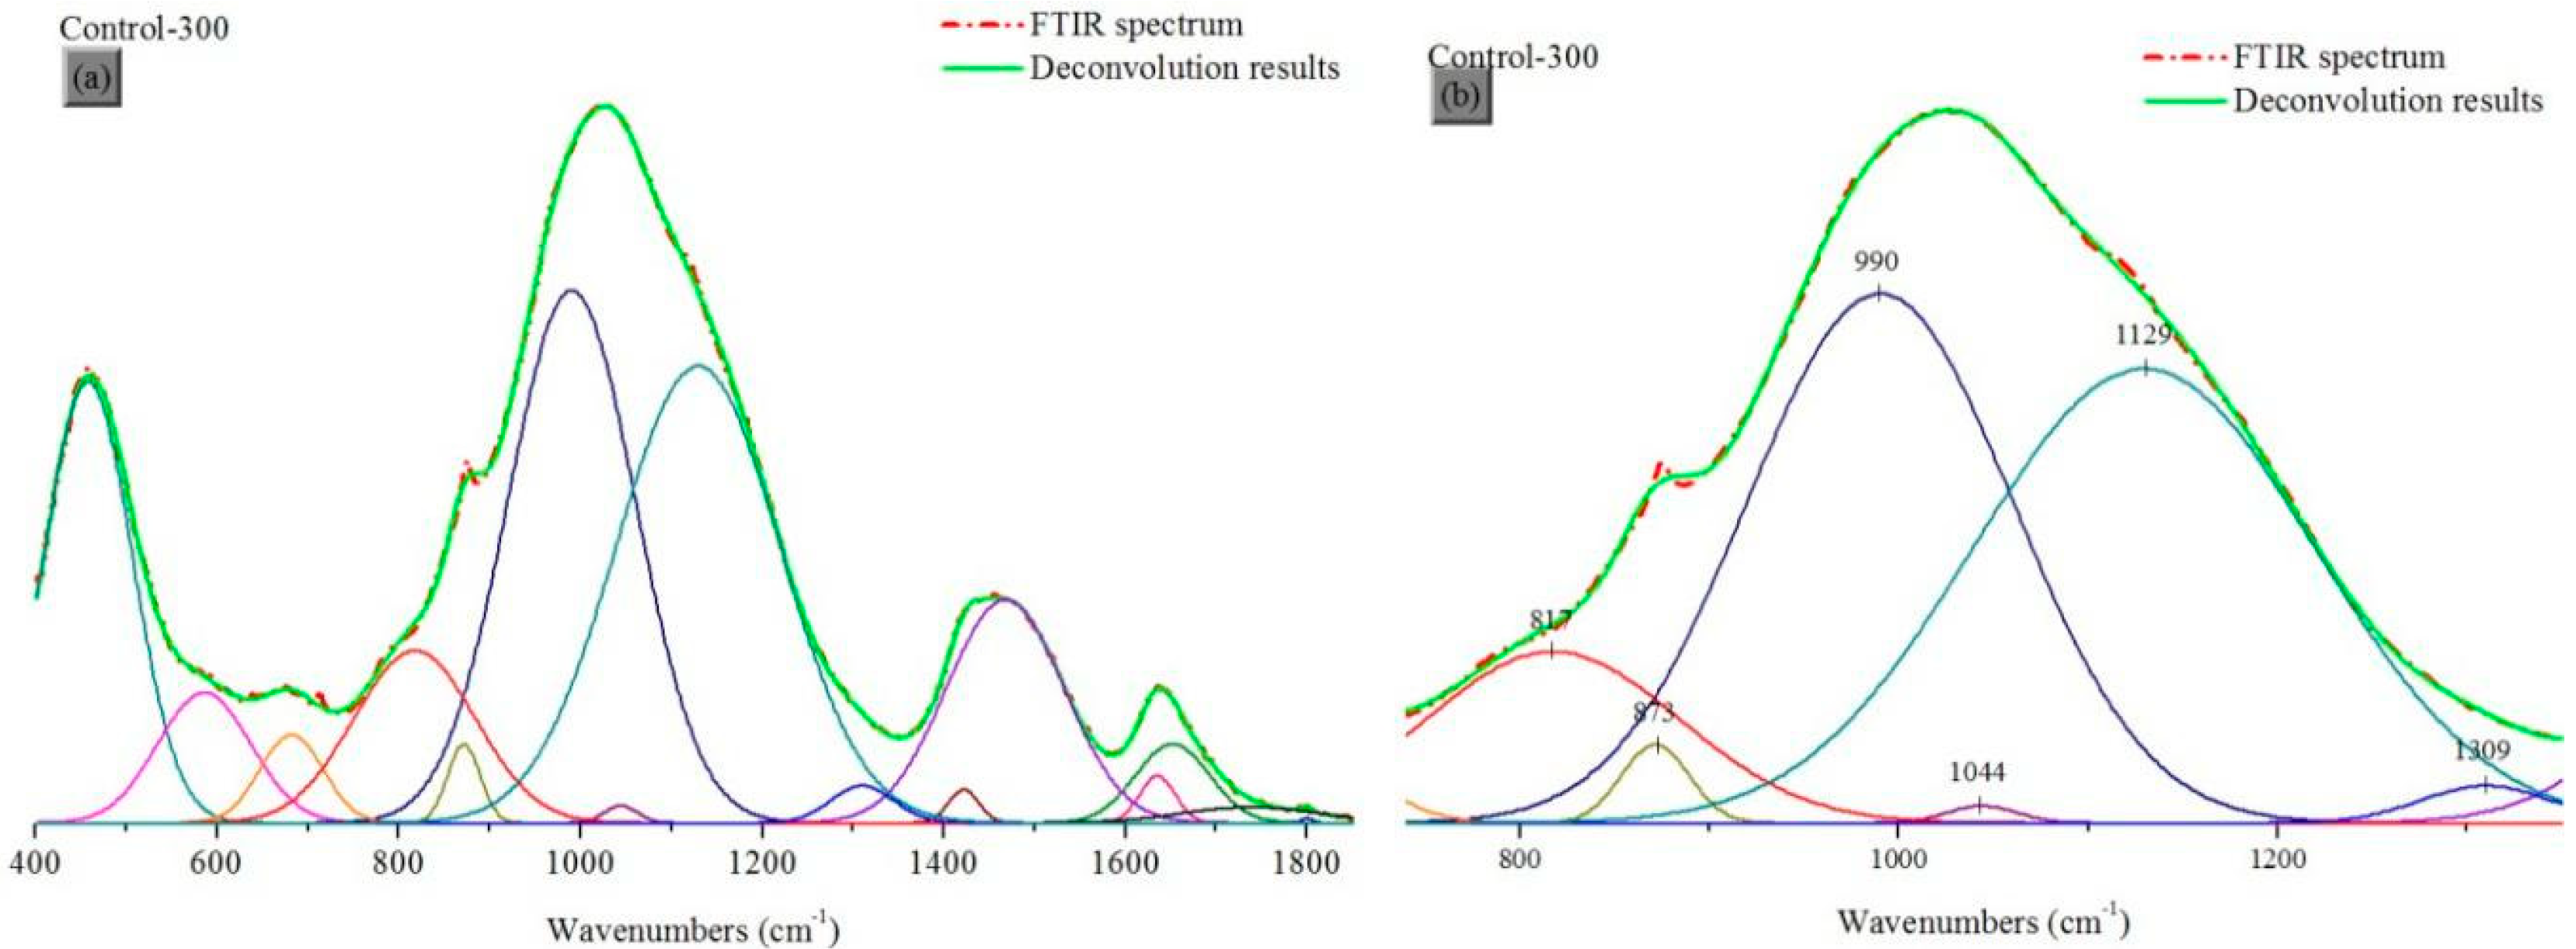
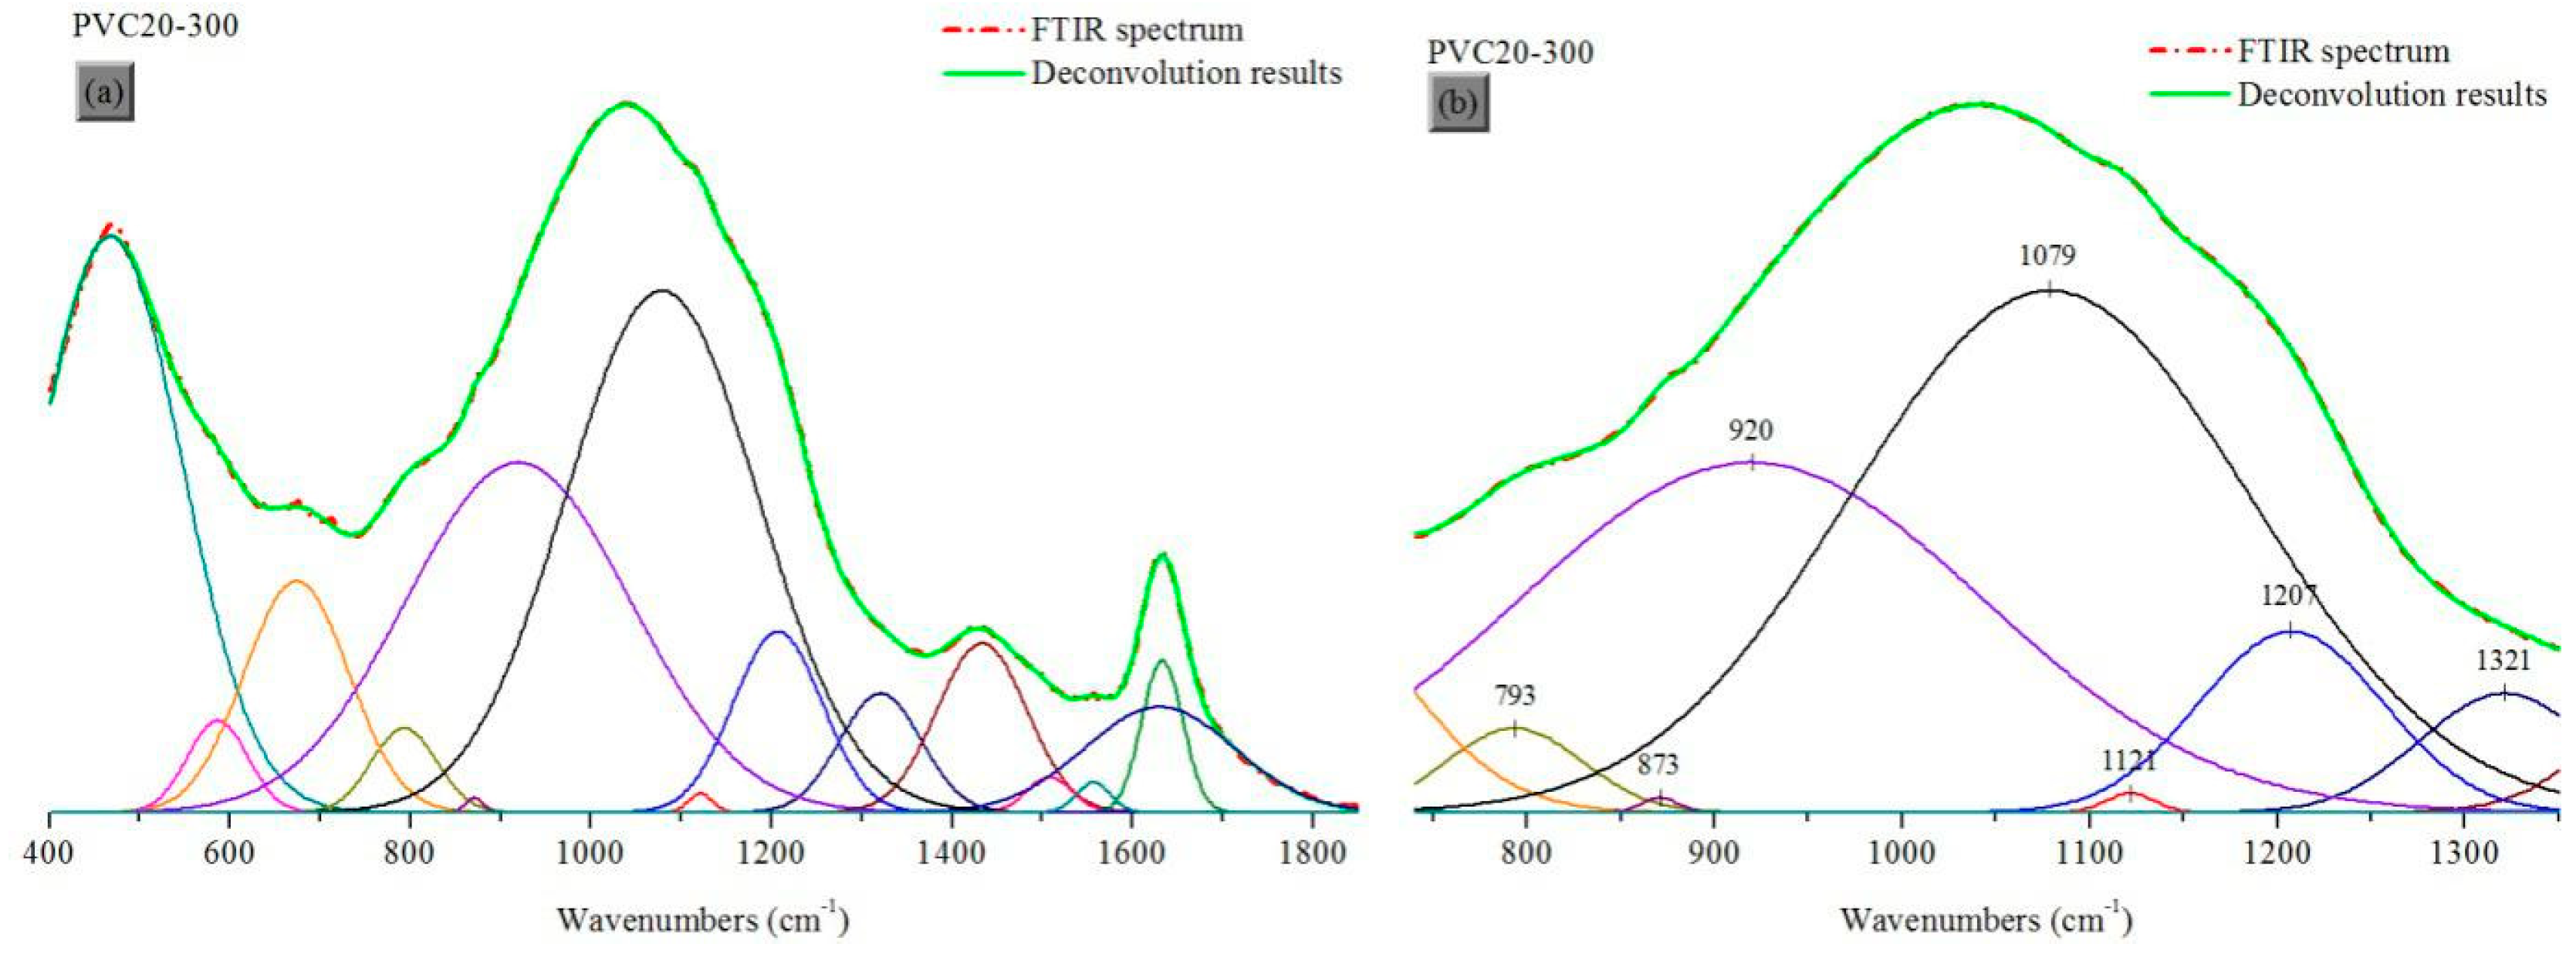
The main band between 800 and 1300 cm−1 in the PVC20 spectrum shifts to a higher wave-number after the 300 °C-heating, when compared to the Control. The main bands correspond to the Si–O bond in the hydrated gel products. This peak consists of five overlapping peaks, which represent the different tetrahedral structures SiQn (n = 0~4, the number of bridge oxygen atoms in each tetrahedral unit). Moreover, the main peak is also affected by the adjacent absorption peaks. Therefore, the bands of Control-300 and PVC20-300 in the range of 400 to 1850 cm−1 were subjected to a peak-fitting process using the software Peakfit [39]. The results are as follows.
Figure 9a and Figure 10a show the deconvolution fitting results of the 300 °C-heated Control and PVC20’s spectra in the range of 400–1850 cm−1. The green solid lines show the fitting results, and the red dotted line shows the test result. Both of the fitting results display 15 peaks. As mentioned before, the most obvious difference between the two 300 °C-heated spectra is the bands at 1432 cm−1 and 873 cm−1 assigned to O-C-O in CaCO3. The heights of the absorption peak at 1432 cm−1 of the Control and PVC20 are 28.08 and 21.50, and the heights of the peak at 873 cm−1 are 9.88 and 1.88, again verifying that the addition of PVC leads to the consumption of CaCO3 during the heating.
Figure 9b and Figure 10b show the deconvolution fitting results of the 300 °C-heated Control and PVC20’s spectra in the range of 740–1350 cm−1. In this range, there are six peaks of the result for the Control, at 817, 873, 990, 1044, 1129, and 1309 cm−1, with the peak heights of 21.62, 9.88, 66.75, 2.18, 57.30, and 4.69, respectively. There are seven peaks of the result for PVC20, at 793, 873, 920, 1079, 1121, 1207, and 1321 cm−1, with the heights of 10.73, 1.89, 44.43, 66.21, 2.48, 22.96, and 15.12, respectively.
The peak at 1129 cm−1 with a height of 57.30 among the Control’s fitting results is assigned to the Si-O asymmetrical stretching vibration band of SiQ3. The peak at 990 cm−1 with a height of 66.75 is assigned to the Si-O vibration band of the Si-O-Na structure of SiQ2 in the hydrated product’s N-A-S-H gel [40]. In the spectrum of PVC20, the height of the peaks at 1079 cm−1 and 920 cm−1 assigned to Si-O in SiQ3 and the Si-O-Na structure of SiQ2 are 66.21 and 44.43, respectively. This phenomenon suggests that both of the main bands of the Control and PVC20 are the absorption peaks of Si-O in SiQ2 and SiQ3, and the tetrahedral structural units in the gel products are mainly composed of these two types, after the 300 °C-heating process. However, the relative heights of these two peaks are different as the peak height of the SiQ2 of Control is larger than that of PVC20, and the height of the SiQ3 of the Control is lower than that of PVC20, indicating that the addition of PVC led to the consumption of the Si-O-Na of SiQ2, but promoted the generation of SiQ3 in the hydration products, during the heating.
Combined with the NaCl in the products of 300 °C-heated PVC20, it could be suggested that HCl generated by the thermal degradation reacts with the Si-O-Na structure of N-A-S-H gel. Besides that, the peak around 1207 cm−1 appears in the PVC20’s spectrum with the height of 22.96. This band corresponds to the tetrahedral structural unit of SiQ4. This unit is formed by the reaction between HCl and hydrated calcium silicate gels, and is generally considered to be a sign of SiO2 formation. The relative height of bands at 465 cm−1 assigned to the bending vibration of O-Si-O [34] also increases from 48.81 to 80.11 in PVC20, when compared with the Control, also suggesting the increase of SiQ4 tetrahedral structural units in PVC20.
The changes in the tetrahedral structural units of the acid-attacked cement have been discussed by researchers. Gutberlet [41] found that the HCl attack resulted in decalcification of C-A-S-H gel, and thus led to polycondensation reactions and growth of the average gel chain length. Chen [42] reported that the static immersing reaction of HCl and cement formed SiO2 crystal, which was indicated by its typical diffraction peak of 2θ = 26.26° in the XRD pattern. In this paper, there is no obvious SiO2 diffraction peak in the XRD spectrum of 300 °C-heated PVC20, but the absorption peak of the SiQ4 tetrahedral structural unit appears in the FTIR spectrum, suggesting that SiO2 might be generated in this process, but in an amorphous state.
Because HCl consumes the Si-O-Na structure of SiQ2 in the N-A-S-H gel, and the acid attack causes a polycondensation reaction in the gel product, these two functions make the degree of polymerization of gel increase [41]. The SiQ3 and SiQ4 tetrahedral structural units increase and the characteristic peak’s main band between 800 and 1300 cm−1 shifts to the higher wave-numbers. The reaction might be simplified as follows:
O Al O Si O Na + Na O Si O Al O + 2 HCl H 2 O + 2 NaCl + O Al O Si O Si O Al O
Moreover, the decalcification and polycondensation of C-A-S-H should also take place at the same time, as follows:
O Al O Si O Ca O Si O Al O + 2 HCl H 2 O + CaCl 2 + O Al O Si O Si O Al O
In the heating process, the thermal degradation of PVC caused HCl to react with the binder gels, resulting in the increment of SiQ3 and SiQ4 tetrahedral structural units and generation of NaCl and CaCl2. In addition, study [43] about the composition of the pore solution of alkali-activated material showed that the main ingredient of alkali in the material is NaOH, which is different from that in Portland cement of Ca(OH)2. The HCl formed by the degradation of PVC also reacted with the NaOH in the pore solution and produced part of NaCl.

3.6. Microstructure

3.6.1. Polarizing Microscope

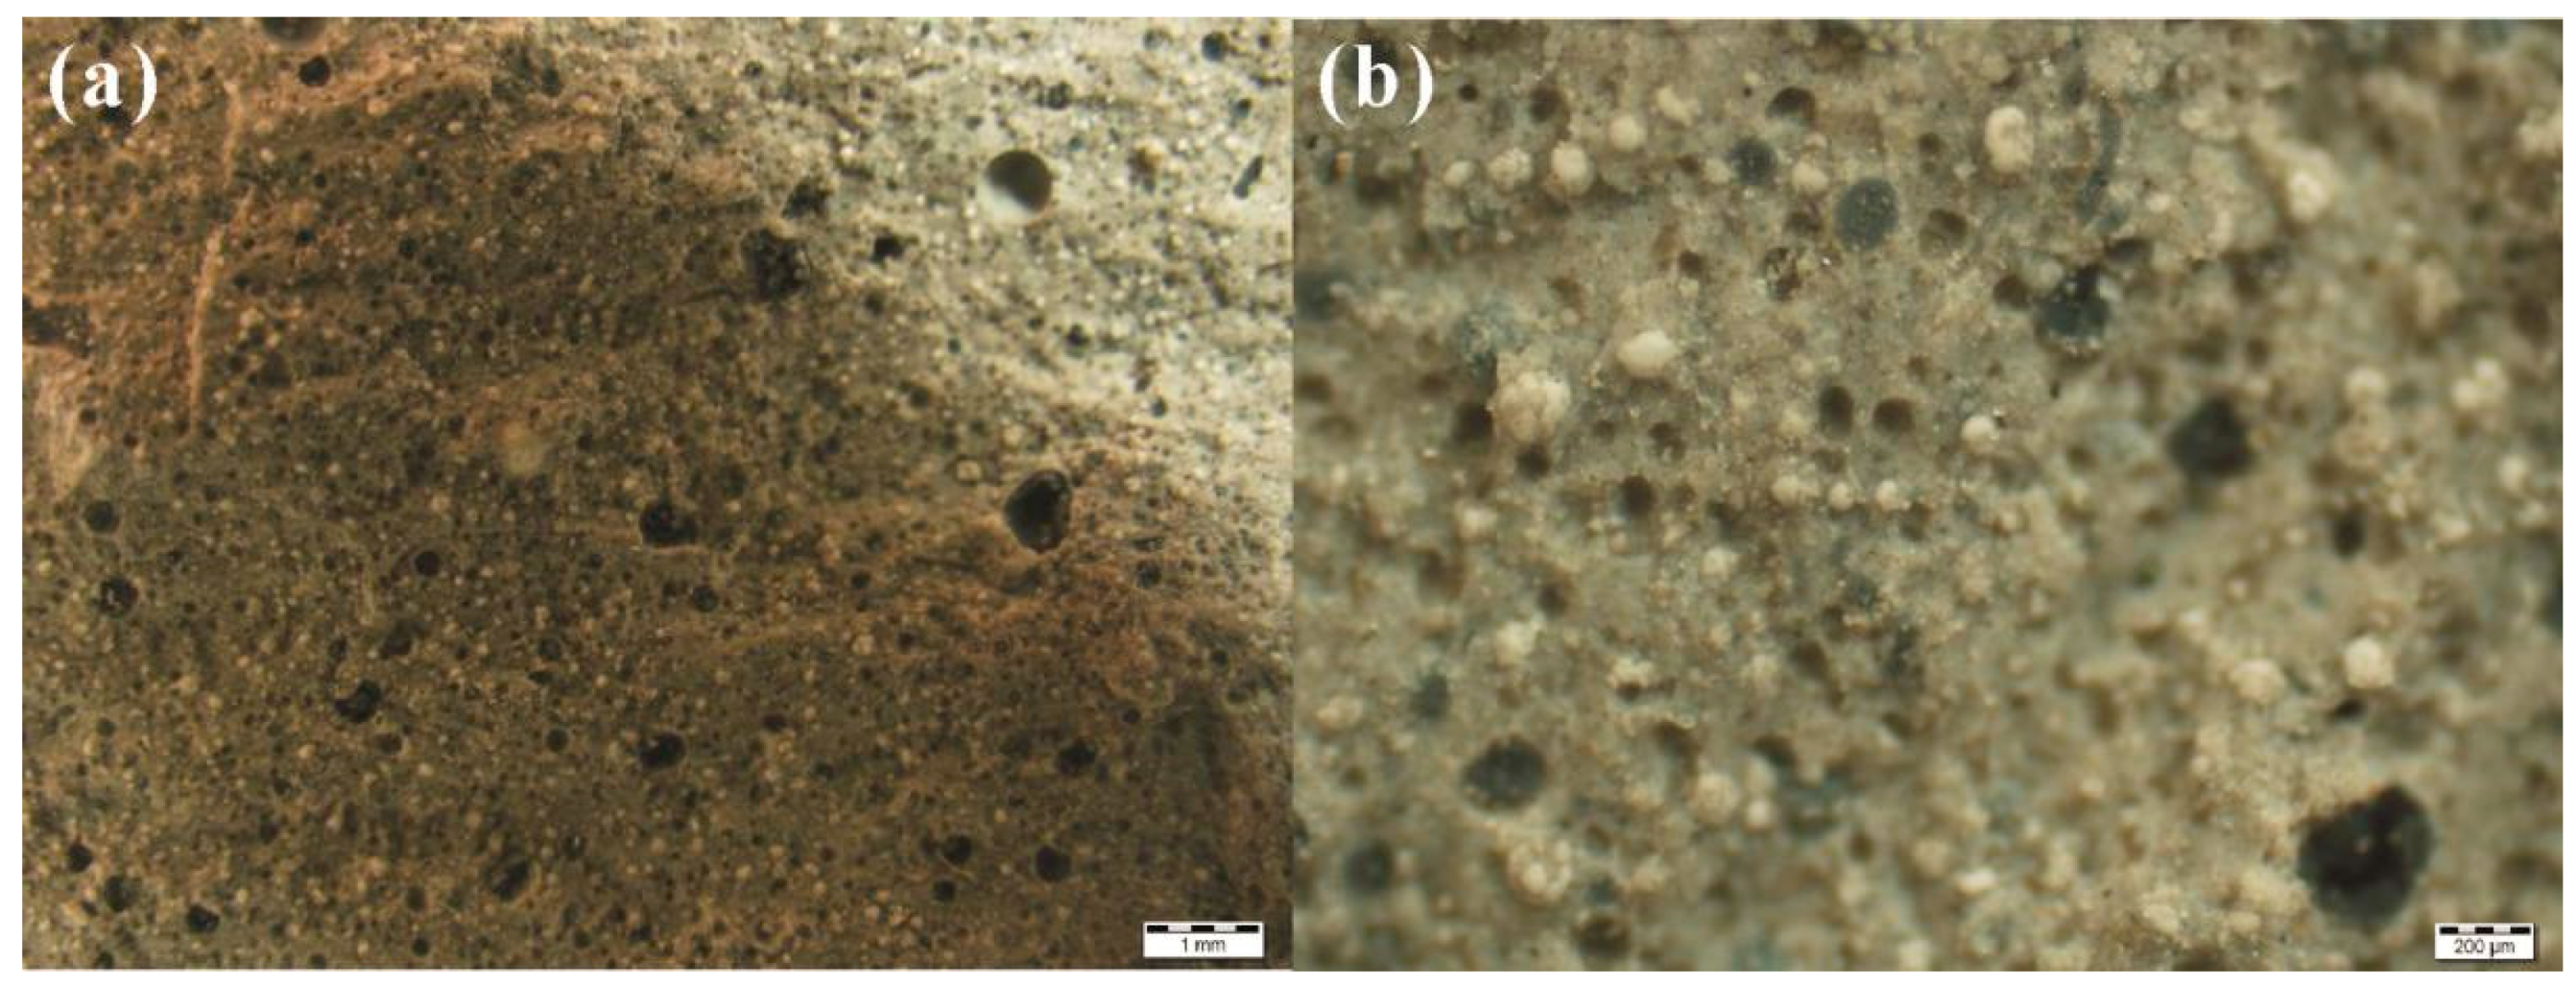
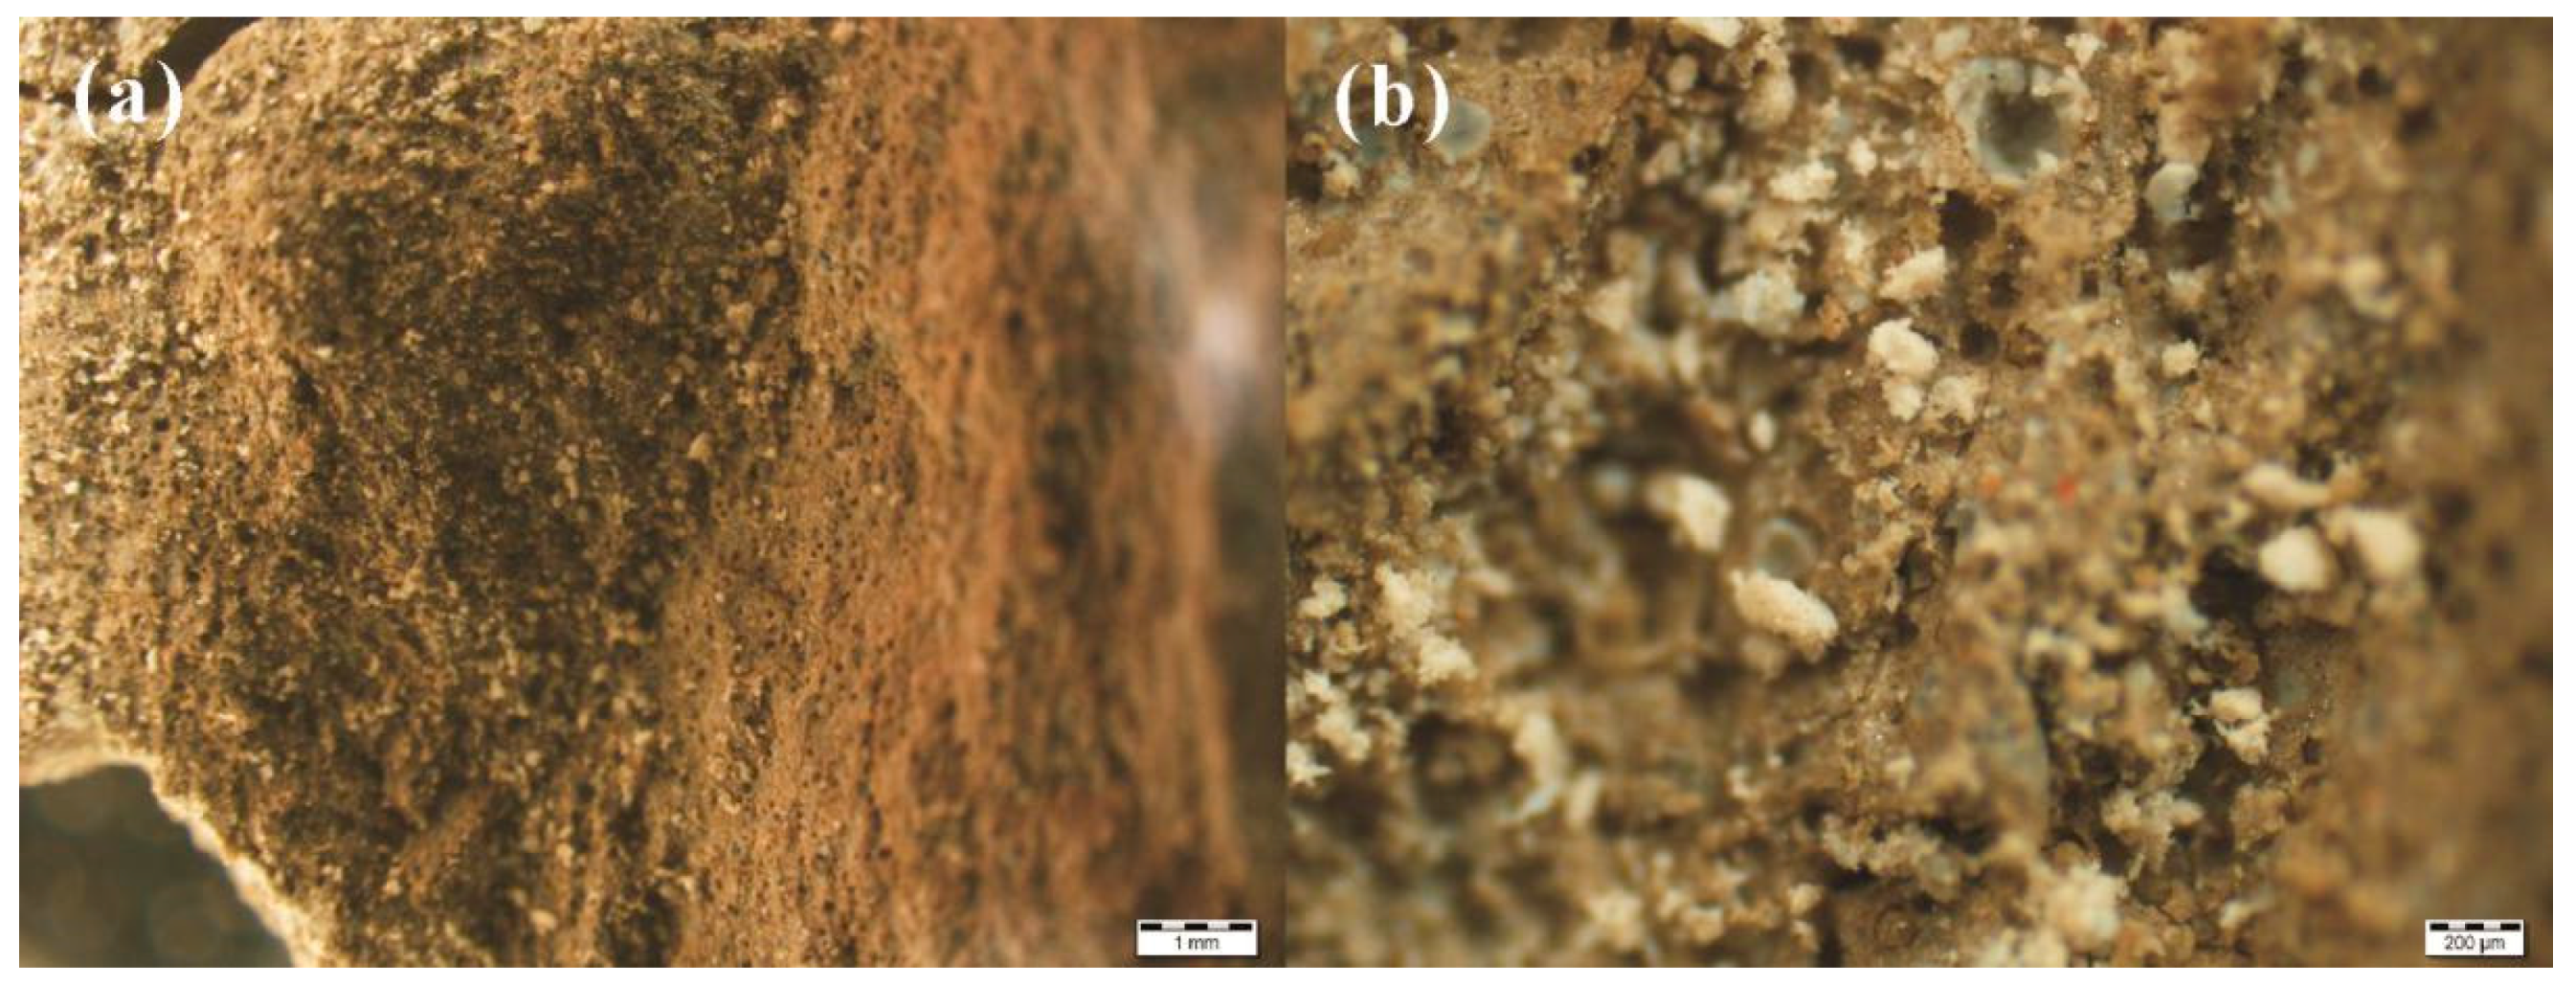
As shown in Figure 11, there are a few big holes formed by the air introduced during stirring, and some small holes as the PVC particles were detached from the sample. Additionally, the white PVC particles display no obvious color or shape change in the 85 °C-cured PVC20. As shown in Figure 12, the white PVC particles disappeared and the pores in the binder increased with some small light-grey fragments after heating at 300 °C for 24 hours. The increment of the pores is consistent with the MIP results in Figure 4. This indicates that the thermal degradation of PVC resulted in the looser structures of binder, and thus the lower strength. Besides that, after heating and immersion in water, the pores formed in the 300 °C-heated material were broken. The dissolution, leaching behavior, and high in-situ exothermic energy also contributed to this self-degradation process, and those processes have been discussed in our previous studies [2,6].

3.6.2. SEM-EDS

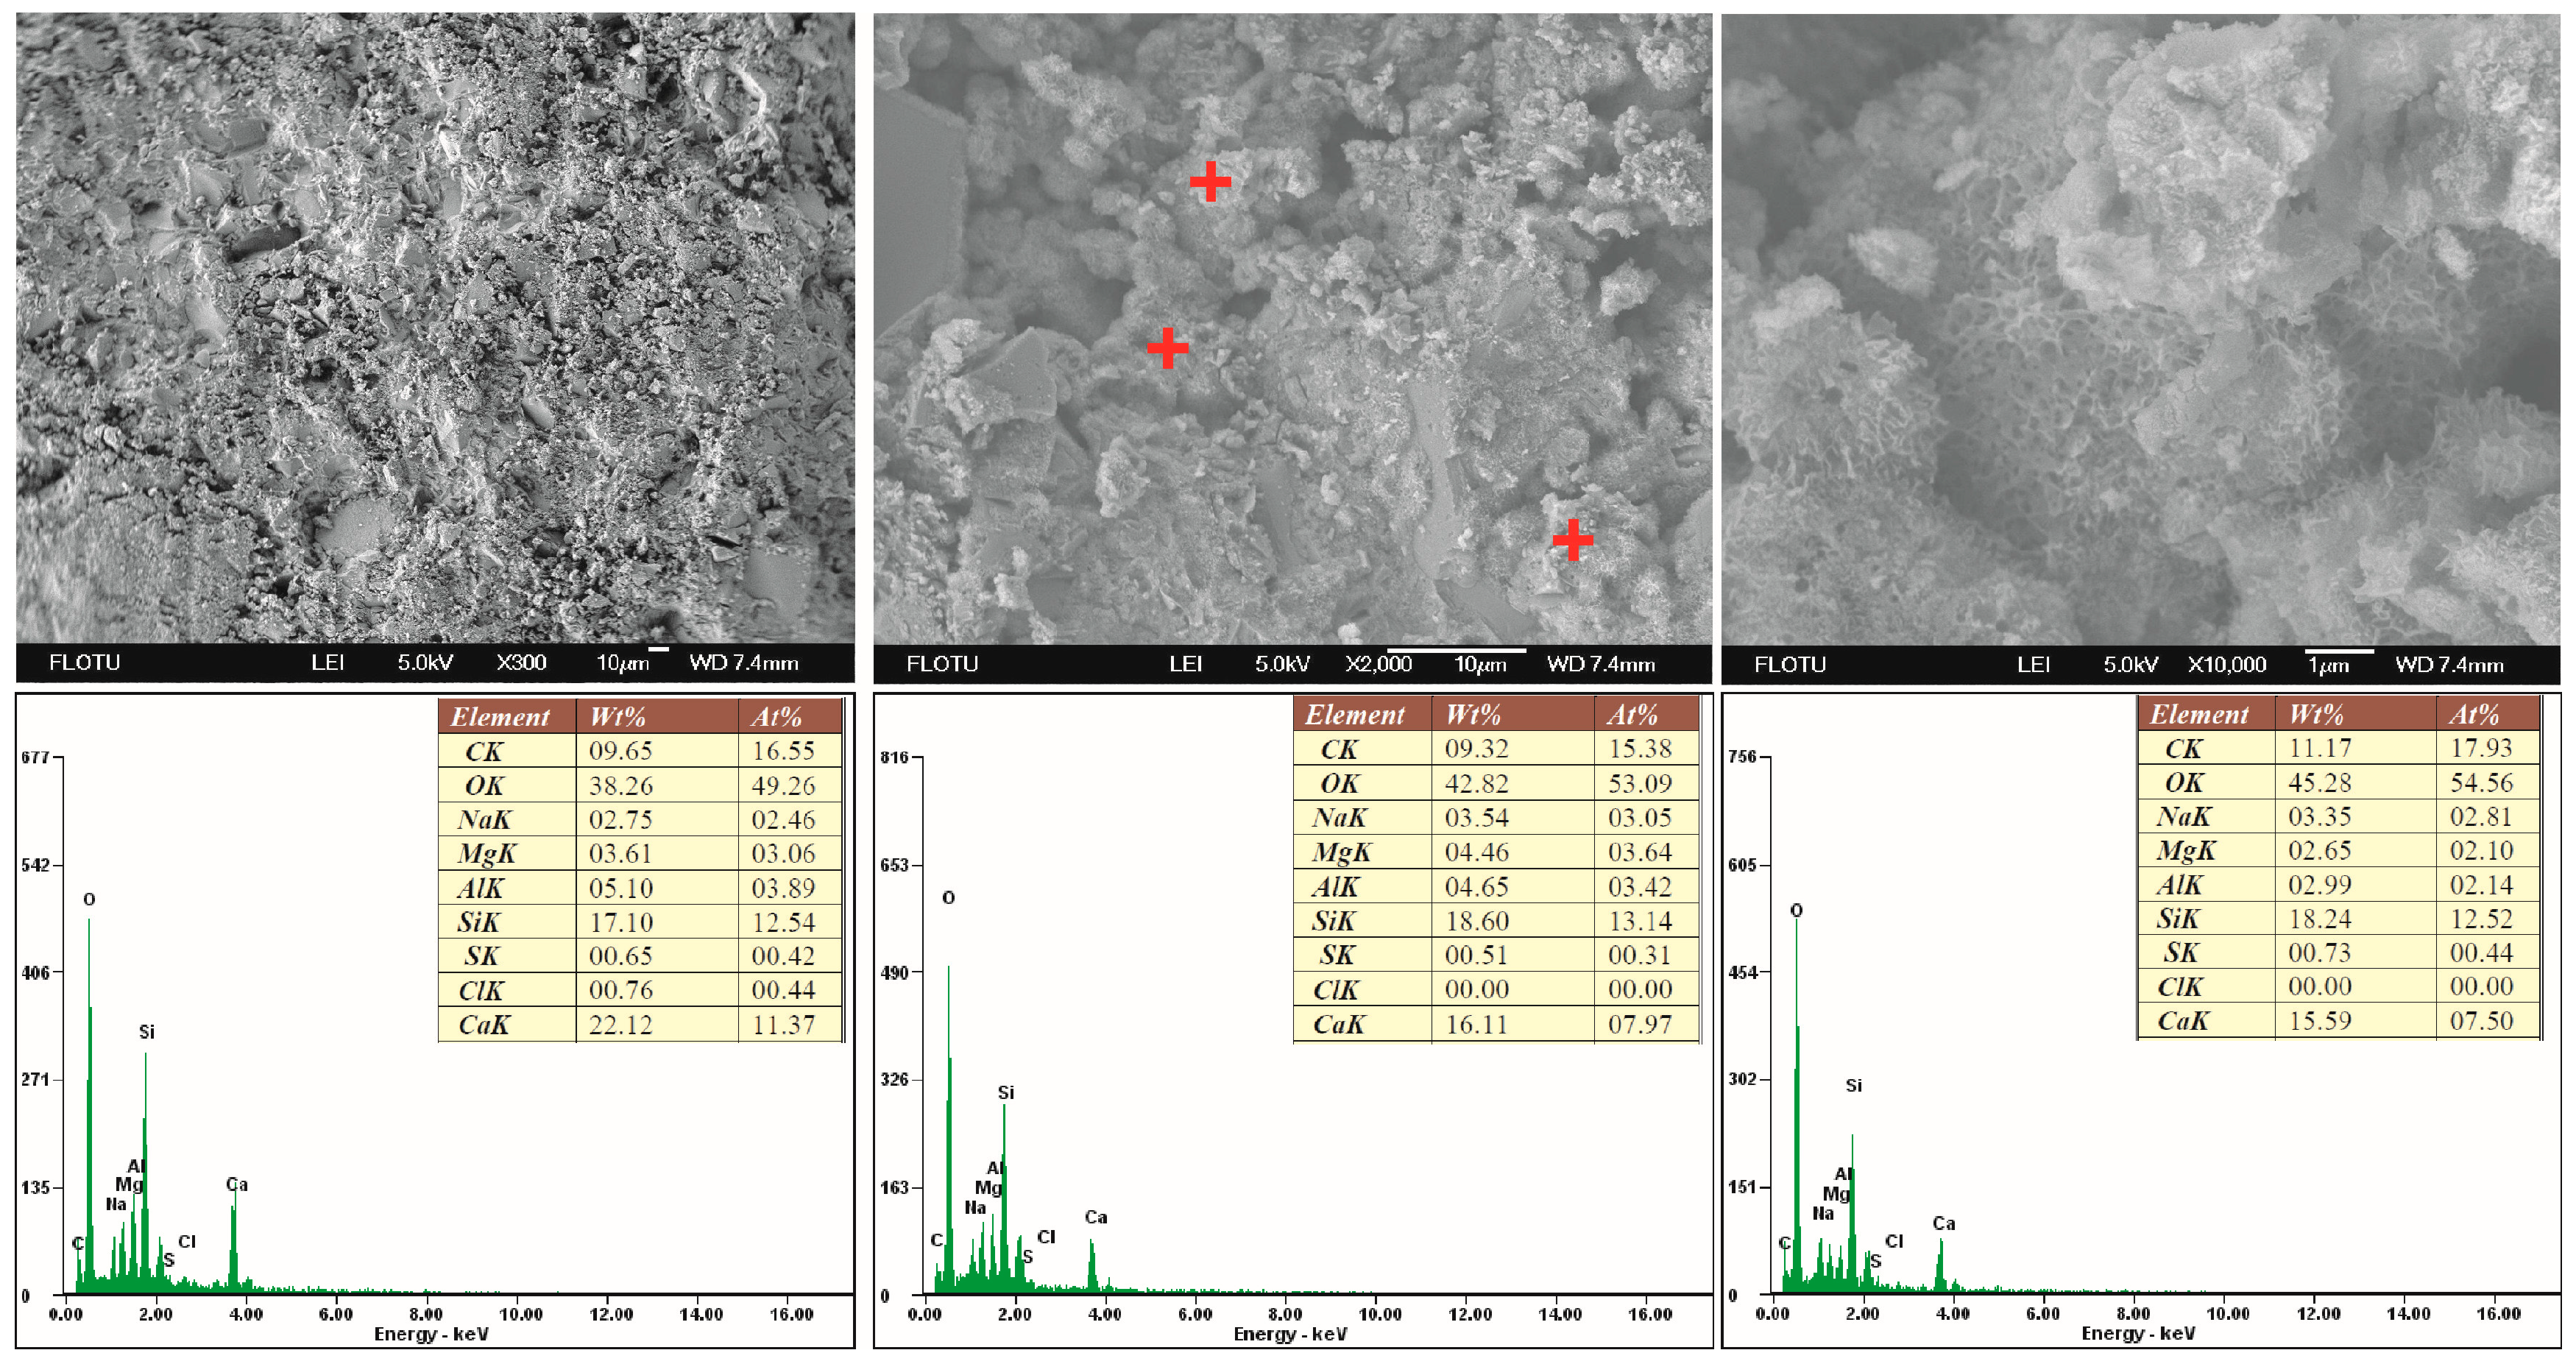
The SEM-EDS test was performed on the 300 °C-heated Control and PVC20 to observe the effect of PVC on the microstructure of the material and study the mechanism of PVC promoting the self-degradation. As shown in the SEM images of Figure 13 and Figure 14, the microstructure of the Control is more compact than the fragmentation microstructure of PVC20. This phenomenon is consistent with the compressive strength and MIP test results. The gel products explicated in the Control are covered by some granular substances in PVC20. According to the XRD results and FTIR analysis, these particles should be mainly composed of NaCl and gel products formed by a polycondensation reaction. The acid attack on the gels resulted in the structure weakening and porosity increasing, and thus led to a strength decrement and the material’s degradation.
As shown in the EDS spectra of Figure 13 and Figure 14, the average mass fractions of C and O elements in the Control are 10.05% and 42.12%, respectively, both of which are higher than in PVC20. Meanwhile, there is little or no Cl element in the Control, but the average mass fraction of the Cl element in PVC20 is 23.36 wt%. Besides the variation of the mass fraction of elements, paper [41] reported that a higher NBO = mol(O)/[mol(Si + Al)] (non-bridging oxygen atoms) value indicates a lower degradation extent of the cement immersed in HCl. The average NBO value of the Control is 3.31, but the value of PVC20 is 0.89, indicating the greater degradation level.
The decrease of C was caused by the reaction between HCl produced by PVC and CaCO3, which generated CO2. In addition to this reaction, the decrease of the NBO value and O element was also caused by the polycondensation reaction of acid attacking the gels, as the polycondensation reaction-generated H2O evaporated at a high temperature. The polycondensation reaction also resulted in the increment of the chain length of gels, and thus led to the increment of SiQ3 and SiQ4 structural units in binder.
Summing up the foregoing, it is considered that the different mechanisms of PVC promoting the self-degradation of the TSM, when compared to our previous studies, mainly involve the following: (1) the thermal degradation of PVC at high temperatures increases the volume of multiple harmful pores in the binder; (2) HCl generated by PVC thermal degradation attacks gelatinous hydration products of the binder, breaking them into particles and thus weakening the binder structure; and (3) HCl also reacts with other constituents in the binder, including NaOH in the pore solution and CaCO3.

4. Conclusions

In this paper, the TSM for geothermal wells has been developed by utilizing the thermal degradation of PVC that generates HCl at a high temperature. Additionally, the self-degradation mechanism of this material has been investigated by analyzing the molecular structure of PVC, the pore structure, the hydration products, and the microstructure of binders. The main conclusions are as follows:
(a)
PVC is suitable for developing the TSM for 300 °C geothermal wells, based on its thermal property. The compressive strength decreasing level of the binder increases with the increasing PVC content, and achieves 76.63% as the content reaches 20%, after 24 h water-immersion. Considering that the excessive HCl is harmful to down-hole environments, the 20% PVC is selected as the optimal content;
(b)
The addition of PVC increases the porosity of the heated binder by mainly increasing the number of multiple damage pores, and having little influence on the other parts;
(c)
The binder gels are composed of C-A-S-H and N-A-S-H gels. In the heating process, HCl attacks these gels, resulting in the polycondensation reactions. The reactions lead to the decrease of the average NBO value and the increase of SiQ3 and SiQ4 structural units;
(d)
The characteristics of the mechanism of PVC promoting the material degradation are mainly as follows: (1) the thermal degradation of PVC increases the number of multiple damage pores in the binder, at a high temperature; (2) HCl generated by the PVC thermal degradation attacks the binder gels, and breaks them into particles; and (3) HCl also reacts with other substances in the binder, including CaCO3 and NaOH in the pore solution.
The results confirm the feasibility of using the thermal degradation of PVC to develop self-degradable TSM for geothermal wells. This paper provides a reference for the development direction of the material, and is helpful for the recycling of waste plastics. Due to its high degradation temperature, PVC can only be used in high-temperature geothermal wells of 300 °C. Future work should explore methods for reducing its degradation temperature, for the application in medium–low temperature geothermal wells.

Author Contributions

Writing—original draft preparation, H.T.; writing—review and editing, X.Z.; formal analysis, L.C.; data curation, K.L. and W.Z.; methodology, B.X.

Funding

This work was funded by the National Natural Science Foundation of China, grant number 41572361.

Acknowledgments

The authors would like to thank the Key Laboratory of Deep Geodrilling Technology, Ministry of Natural Resources of the People’s Republic of China, the Demonstration Center for Experimental Geological Resources Exploration Education, and the National International Joint Research Center of Deep Geodrilling Equipment.

Conflicts of Interest

The authors declare no conflict of interest.

References

  1. Sugama, T.; Butcher, T.; Brothers, L.; Bour, D. Self-Degradable Cementitious Sealing Materials; Brookhaven National Laboratory (BNL): Upton, NY, USA, 2010. [Google Scholar]
  2. Tan, H.J.; Zheng, X.H.; Ma, L.M.L.; Huang, H.X.; Xia, B.R. A Study on the Effects of Starches on the Properties of Alkali-Activated Cement and the Potential of Starch as a Self-Degradable Additive. Energies 2017, 10, 1048. [Google Scholar] [CrossRef]
  3. Sugama, T.; Butcher, T.; Brothers, L.; Bour, D. Temporary cementitious sealing materials. In Proceedings of the Geothermal Resources Council 2011 Annual Meeting, San Diego, CA, USA, 23–26 October 2011. [Google Scholar]
  4. Sugama, T.; Pyatina, T. Utilization of PVA Flakes in Promoting Self-Degradation of Temporary Cementitious Fracture Sealing Material. GRC Trans. 2014, 38, 331–338. [Google Scholar]
  5. Sugama, T.; Pyatina, T. Effect of sodium carboxymethyl celluloses on water-catalyzed self-degradation of 200 degrees C-heated alkali-activated cement. Cem. Concr. Compos. 2015, 55, 281–289. [Google Scholar] [CrossRef]
  6. Tan, H.J.; Zheng, X.H.; Duan, C.Y.; Xia, B.R. Polylactic Acid Improves the Rheological Properties, and Promotes the Degradation of Sodium Carboxymethyl Cellulose-Modified Alkali-Activated Cement. Energies 2016, 9, 823. [Google Scholar] [CrossRef]
  7. Chao, R. Acid Fluid for Treating High-temperature Sandstone Formation. Inn. Mong. Petrochem. Ind. 2009, 35, 49–50. [Google Scholar]
  8. Li, X.H. Brief analysis on acidizing fracturing status and environmental protection of oil drilling. Petrochem. Ind. Technol. 2017, 24, 199. [Google Scholar]
  9. Liang, B.; Lu, H.J.; Zhu, H.M.; Wu, Z.G. Removal of cement Sticking Accident in workover operation by acidizing method. Sci. Technol. Innov. Her. 2008, 28, 12–13. [Google Scholar]
  10. Wang, K.J.; Tang, X.M.; Cao, W.D. Removal of cement Sticking Accident in workover operation by acidizing method. Gansu Sci. Technol. 2009, 25, 53–55. [Google Scholar]
  11. Zhang, D.H.; He, M.; Qin, S.H.; Yu, J. Preparation and Performance of Polyvinyl Chloride/Quaternary Ammonium Salt Antistatic Composites. Chin. J. Colloid Polym. 2017, 35, 7–9. [Google Scholar]
  12. Sun, G.Y.; Xu, S.H.; Miao, J.J.; Gao, X.F.; Wang, Z.Z. Effect of Ammonium Polyphosphate Microcapsules on Properties of Flexible Polyvinyl Chloride. Polym. Mater. Sci. Eng. 2013, 29, 117–119, 124. [Google Scholar]
  13. Chen, A.Z.; Yin, J.P.; Wu, D.Z. Study on the relationship between structure and its static thermal properties of PVC. China Plast. 2013, 27, 25–29. [Google Scholar]
  14. Huang, H.; Liu, N.S.; Yu, Y.H.; Yue, D.L.; Li, Z.J.; Zheng, J.G. Identification Technology of Recycled PVC Plastics for Packaging. Packag. Eng. 2014, 35, 63–66. [Google Scholar]
  15. Li, D.F.; Ding, H.C.; Zhou, T. Covalent immobilization of mixed proteases, trypsin and chymotrypsin, onto modified polyvinyl chloride microspheres. J. Agric. Food Chem. 2013, 61, 10447–10453. [Google Scholar] [CrossRef] [PubMed]
  16. Microplastics: The Neglected White Pollution. Available online: http://www.cecol.com.cn/zsrc/20180111/0117242211.html (accessed on 20 September 2017).
  17. Lee, N.K.; Koh, K.T.; An, G.H.; Ryu, G.S. Influence of binder composition on the gel structure in alkali activated fly ash/slag pastes exposed to elevated temperatures. Ceram. Int. 2017, 43, 2471–2480. [Google Scholar] [CrossRef]
  18. Pan, Z.; Tao, Z.; Cao, Y.F.; Wuhrer, R. Measurement and prediction of thermal properties of alkali-activated fly ash/slag binders at elevated temperatures. Mater. Struct. 2018, 51, 108. [Google Scholar] [CrossRef]
  19. Chindaprasirt, P.; Chareerat, T.; Hatanaka, S.; Cao, T. High-Strength geopolymer using fine high-calcium fly ash. J. Mater. Civ. Eng. 2011, 23, 264–270. [Google Scholar] [CrossRef]
  20. Duan, P.; Shui, Z.; Chen, W. Effects of metakaolin, silica fume and slag on pore structure, interfacial transition zone and compressive strength of concrete. Constr. Build. Mater. 2013, 44, 1–6. [Google Scholar] [CrossRef]
  21. Blanco, A.; Colina, A.; Rodriguez, W.; Bolivar, R. Effective Pay Zone Isolation of Steam Injection Wells; Society Petroleum Engineers: Richardson, TX, USA, 1999; pp. 1–8. [Google Scholar] [CrossRef]
  22. Rivera, O.; Long, W.; Weiss, C., Jr.; Moser, R.; Williams, B.; Torres-Cancel, K.; Gore, E.; Allison, P. Effect of elevated temperature on alkali-activated geopolymeric binders compared to portland cement-based binders. Cem. Concr. Res. 2016, 90, 43–51. [Google Scholar] [CrossRef]
  23. Yang, T.; Yao, X.; Gu, G.W.; Zhu, H.J. Effects of slag on reaction and composition of alkali-activated fly ash-slag blends. J. Nanjing Univ. Technol. (Nat. Sci. Ed.) 2015, 37, 19–26. [Google Scholar]
  24. Lin, H.Y.; Lin, Y.; Zhang, W.; Zhang, Q. Analysis of pyrolysis products of polyvinylchloride (PVC) by GC-MS. Chin. J. Health Lab. Technol. 2008, 18, 587–589. [Google Scholar]
  25. Ma, Y.; Wang, Q.; Gao, J.; Tang, J.; Zhao, X.; Ding, C.L. Study on thermal decomposition of PVC by pyrolysis GC/MS. Chem. Reag. 2009, 31, 910–912. [Google Scholar]
  26. Wang, Q.; Wang, J.; Cao, Y.L.; Zhang, Z.F.; Tang, J. Research on the Thermal Pyrolytic Behaviour of PVC through Pyrolysis-Gas Chromatography-Mass Spectrometry. Plast. Sci. Technol. 2012, 40, 93–95. [Google Scholar]
  27. Li, R.X.; Liang, K.; Guan, Y.D.; Liu, G.Y. Application of TG-FTIR Analyzing Technology in Thermal Degradation of PVC. Plast. Sci. Technol. 2010, 38, 85–88. [Google Scholar]
  28. Gui, B. Products and Mechanisms During Poly (Vinyl Chloride) Pyrolysis Based on the Minimization of Secondary Reaction. PH.D. Thesis, Huazhong University of Science and Technology, Wuhan, China, 2013. [Google Scholar]
  29. Han, T.; Jin, X.Z.; Wang, H.Q.; Li, X.J.; Zhang, K.X. Influence and mechanism analysis of high temperature on the structure and properties of hydrated cement pastes. J. North Univ. China 2015, 36, 378–383. [Google Scholar]
  30. Tan, H.J.; Zheng, X.H.; Li, F.Y.; Duan, C.Y. Optimization and Characterization of the Self-Degradable Cement for Geothermal Wells. Geotherm. Resour. Counc. Trans. 2016, 40, 255–261. [Google Scholar]
  31. Tan, H.J.; Zheng, X.H.; Yang, S.W.; Lei, Z.L.; Xia, B.R. Effects of Sodium Silicate on Self-Degradable Cementitious Composites. Am. Lab. 2018, 50, 34–36. [Google Scholar]
  32. Xu, J.T.; Lu, D.Y.; Zhang, S.H.; Lin, G.K.; Xu, Z.Z. Pore Structures of Mortars with Dolomite and Limestone Powders Cured at Various Temperatures. J. Chin. Ceram. Soc. 2017, 45, 268–273. [Google Scholar]
  33. Abdalqader, A.F.; Jin, F.; Al-Tabbaa, A. Characterisation of reactive magnesia and sodium carbonate-activated fly ash/slag paste blends. Constr. Build. Mater. 2015, 93, 506–513. [Google Scholar] [CrossRef] [Green Version]
  34. Ismail, I.; Bernal, S.A.; Provis, J.L.; San Nicolas, R.; Hamdan, S.; van Deventer, J.S. Modification of phase evolution in alkali-activated blast furnace slag by the incorporation of fly ash. Cem. Concr. Compos. 2014, 45, 125–135. [Google Scholar] [CrossRef]
  35. Djobo, J.N.Y.; Tchakouté, H.K.; Ranjbar, N.; Elimbi, A.; Tchadjié, L.N.; Njopwouo, D. Gel Composition and Strength Properties of Alkali-Activated Oyster Shell-Volcanic Ash: Effect of Synthesis Conditions. J. Am. Ceram. Soc. 2016, 99, 3159–3166. [Google Scholar] [CrossRef]
  36. Lee, N.K.; Lee, H.K. Influence of the slag content on the chloride and sulfuric acid resistances of alkali-activated fly ash/slag paste. Cem. Concr. Compos. 2016, 72, 168–179. [Google Scholar] [CrossRef]
  37. Lee, N.K.; Lee, H.K. Reactivity and reaction products of alkali-activated, fly ash/slag paste. Constr. Build. Mater. 2015, 81, 303–312. [Google Scholar] [CrossRef]
  38. Chang, M.; Yun, H.L.; Zhang, D.H.; Chen, Y.W.; Wang, S.R.; Du, J.; Zhao, C.X.; Yu, H.W. Study on Fourier Transform Attenuated Total Reflection Two-dimensional Infrared Spectroscopy of Polyvinyl Chloride C-Cl Stretching Vibration. Infrared Technol. 2016, 38, 529–535. [Google Scholar]
  39. Timakul, P.; Rattanaprasit, W.; Aungkavattana, P. Enhancement of compressive strength and thermal shock resistance of fly ash-based geopolymer composites. Constr. Build. Mater. 2016, 121, 653–658. [Google Scholar] [CrossRef]
  40. Zhang, Z.H.; Wang, H.; Provis, J.L.; Bullen, F.; Reid, A.; Zhu, Y.C. Quantitative kinetic and structural analysis of geopolymers. Part 2. Thermodynamics of sodium silicate activation of metakaolin. Thermochim. Acta 2013, 565, 163–171. [Google Scholar] [CrossRef]
  41. Gutberlet, T.; Hilbig, H.; Beddoe, R.E. Acid attack on hydrated cement—Effect of mineral acids on the degradation process. Cem. Concr. Res. 2015, 74, 35–43. [Google Scholar] [CrossRef]
  42. Chen, G.; Han, R.L.; Liu, X.J.; Zhang, W.W.; He, J.Y.; Zhang, Y.P. Corrosion of Surface of Set Cement by Different Acids. Drill. Fluid Complet. Fluid 2015, 32, 67–69, 109. [Google Scholar]
  43. He, J. Research on the Carbonation Behavior and Mechanism of Hardened Alkali-Activated Slag Cement Pastes. PH.D. Thesis, Chongqing University, Chongqing, China, 2011. [Google Scholar]
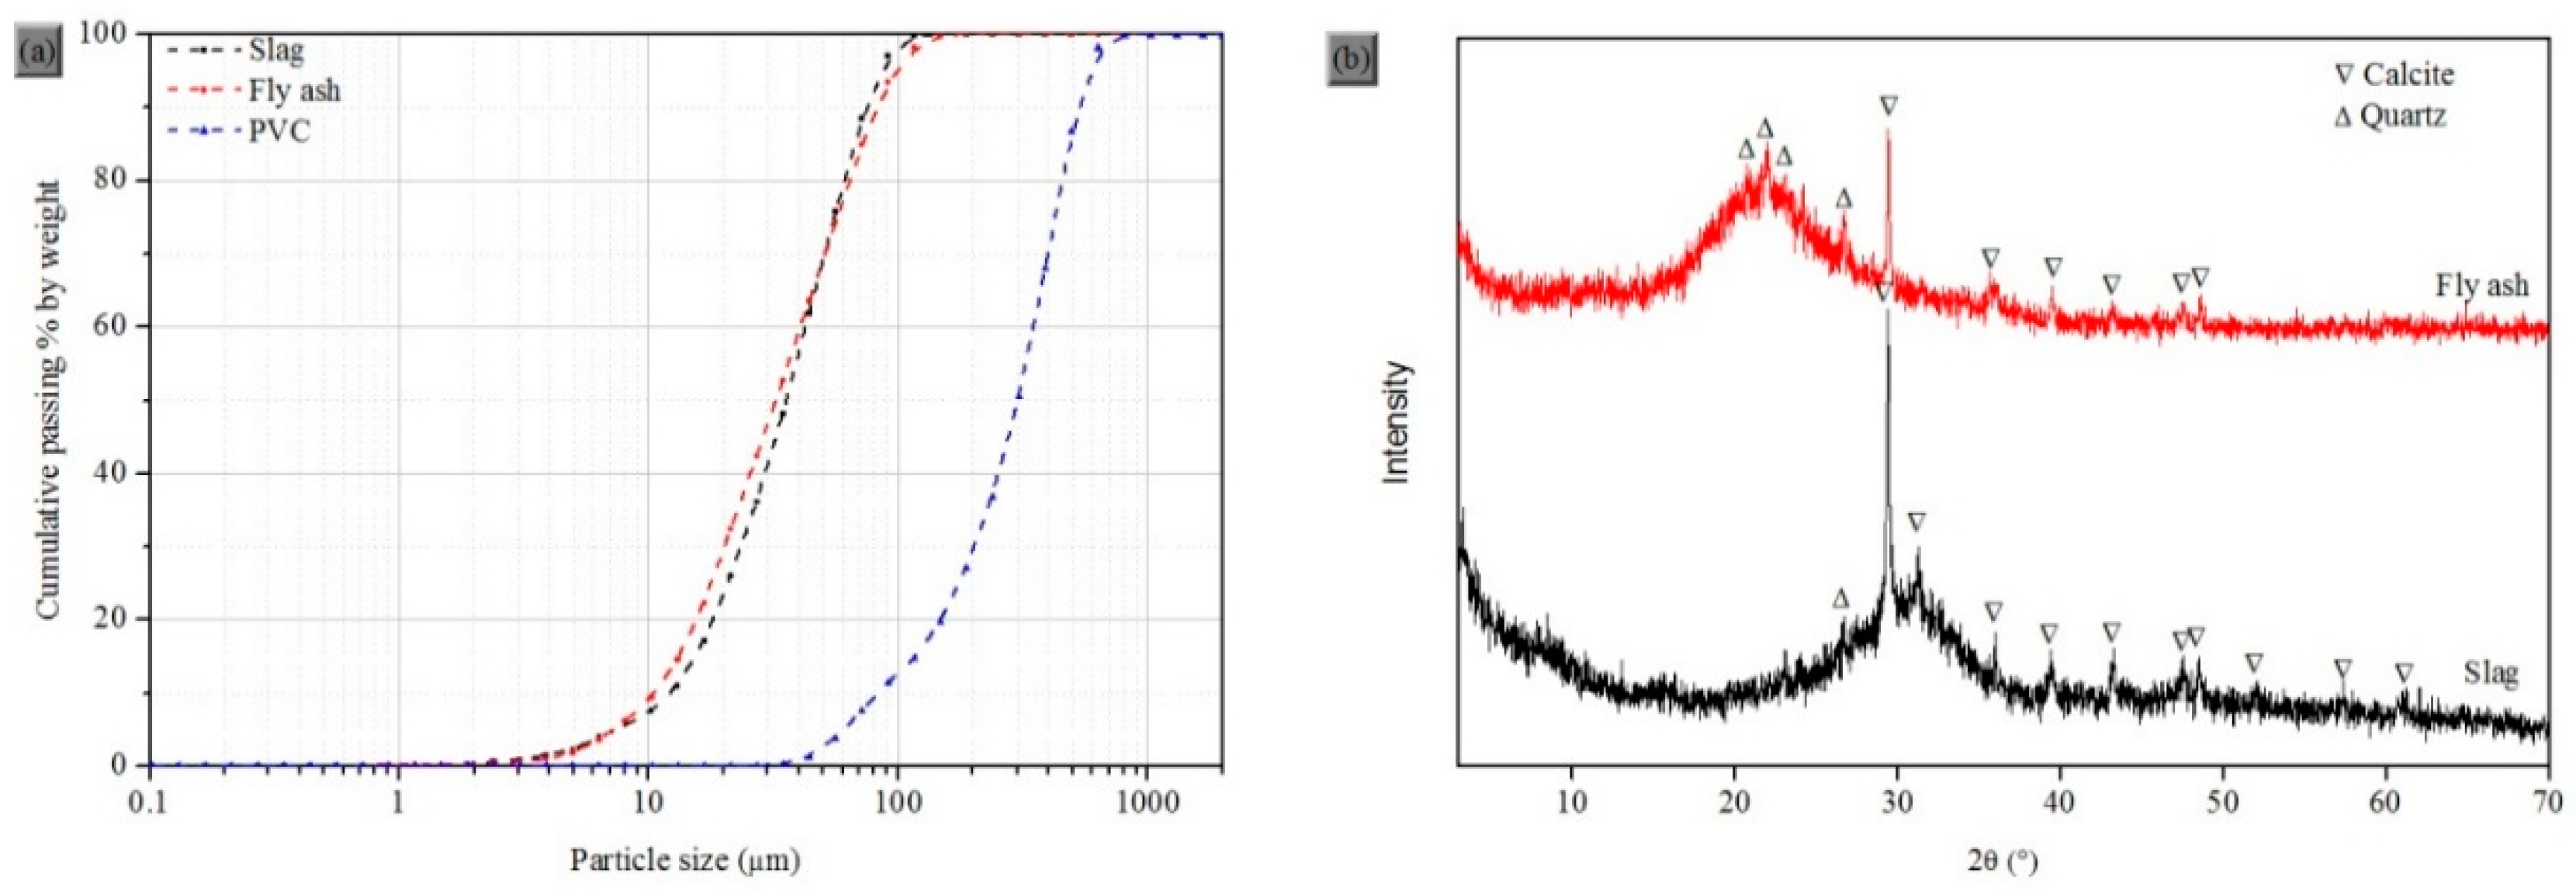
Figure 1. Particle size distribution (a) of slag, fly ash, and polyvinyl chloride (PVC) and X-ray powder diffraction spectrometry (XRD) patterns of slag and fly ash (b).
Energies 12 02821 g001
Figure 2. The thermogravimetry/differential thermal gravity (TG-DTG) curves of original polyvinyl chloride (PVC) (a) and filtrate-treated PVC (b).
Energies 12 02821 g002
Figure 3. Compressive strength of samples with different polyvinyl chloride (PVC) contents after different periods (a) and image of water-immersed PVC30 (b).
Energies 12 02821 g003
Figure 4. The differential pore volume (a) and cumulative pore volume (b) of the 300 °C-heated Control and PVC20.
Energies 12 02821 g004
Figure 5. X-ray powder diffraction spectrometry (XRD) patterns of the Control, PVC10, and PVC20 after the 85 °C-curing (a) and 300 °C-heating (b) steps.
Energies 12 02821 g005
Figure 6. Energy Dispersive Spectroscopy (EDS) analysis of the reaction products of the Control: (a) Ternary representations; (b) Al/Si ratio versus Ca/Si ratio; and (c) Na/Si ratio versus Ca/Si ratio.
Energies 12 02821 g006
Figure 7. The Fourier Transform Infrared (FTIR) spectra of the original, 85 °C filtrate-treated, and 300 °C-heated PVC.
Energies 12 02821 g007
Figure 8. The Fourier Transform Infrared (FTIR) spectra of the Control and PVC20 after 85 °C-curing (a) and 300 °C-heating (b) processes.
Energies 12 02821 g008
Figure 9. The deconvolution fitting results of the 300 °C-heated Control’s spectrum in the ranges of 400–1850 cm−1 (a) and 740–1350 cm−1 (b).
Energies 12 02821 g009
Figure 10. The deconvolution fitting results of 300 °C-heated PVC20’s spectrum in the ranges of 400–1850 cm−1 (a) and 740–1350 cm−1 (b).
Energies 12 02821 g010
Figure 11. Images observed by a polarizing microscope of 85 °C-cured PVC20, with the scale of 1 mm (a) and 200 μm (b).
Energies 12 02821 g011
Figure 12. Images observed by a polarizing microscope of 300 °C-heated PVC20, with the scale of 1 mm (a) and 200 μm (b).
Energies 12 02821 g012
Figure 13. The Scanning Electron Microscopy (SEM) images and Energy Dispersive Spectroscopy (EDS) data of the 300 °C-heated Control (point 1, 2, and 3).
Energies 12 02821 g013
Figure 14. The Scanning Electron Microscopy (SEM) images and Energy Dispersive Spectroscopy (EDS) data of 300 °C-heated PVC20.
Energies 12 02821 g014
Table 1. Mix proportions of all mortars.
Mix IDw/s RatioPVC (%)Slag (%)Fly Ash (%)
Control0.6-8020
PVC50.657619
PVC100.6107218
PVC150.6156817
PVC200.6206416
PVC300.6305614
Table 2. The statistical results of the Energy Dispersive Spectroscopy (EDS) test of the 300 °C-heated Control.
PositionConcentration (at%)Molar Ratios
AlSiCaNaCa/SiAl/SiNa/Si
13.8912.5411.372.460.910.310.20
23.6413.147.973.050.610.280.23
32.1412.527.502.810.600.170.22
43.6116.747.974.060.480.220.24
52.7714.507.512.770.520.190.19
64.6922.1310.444.370.470.210.20
72.9618.447.595.460.410.160.30
83.6021.047.275.680.350.170.27