Enhancement Effect of Bimetallic Amide K2Mn(NH2)4 and In-Situ Formed KH and Mn4N on the Dehydrogenation/Hydrogenation Properties of Li–Mg–N–H System

 ,
,  ,
,  ,
,
Abstract
1. Introduction
2. Materials and Methods
3. Results and Discussion
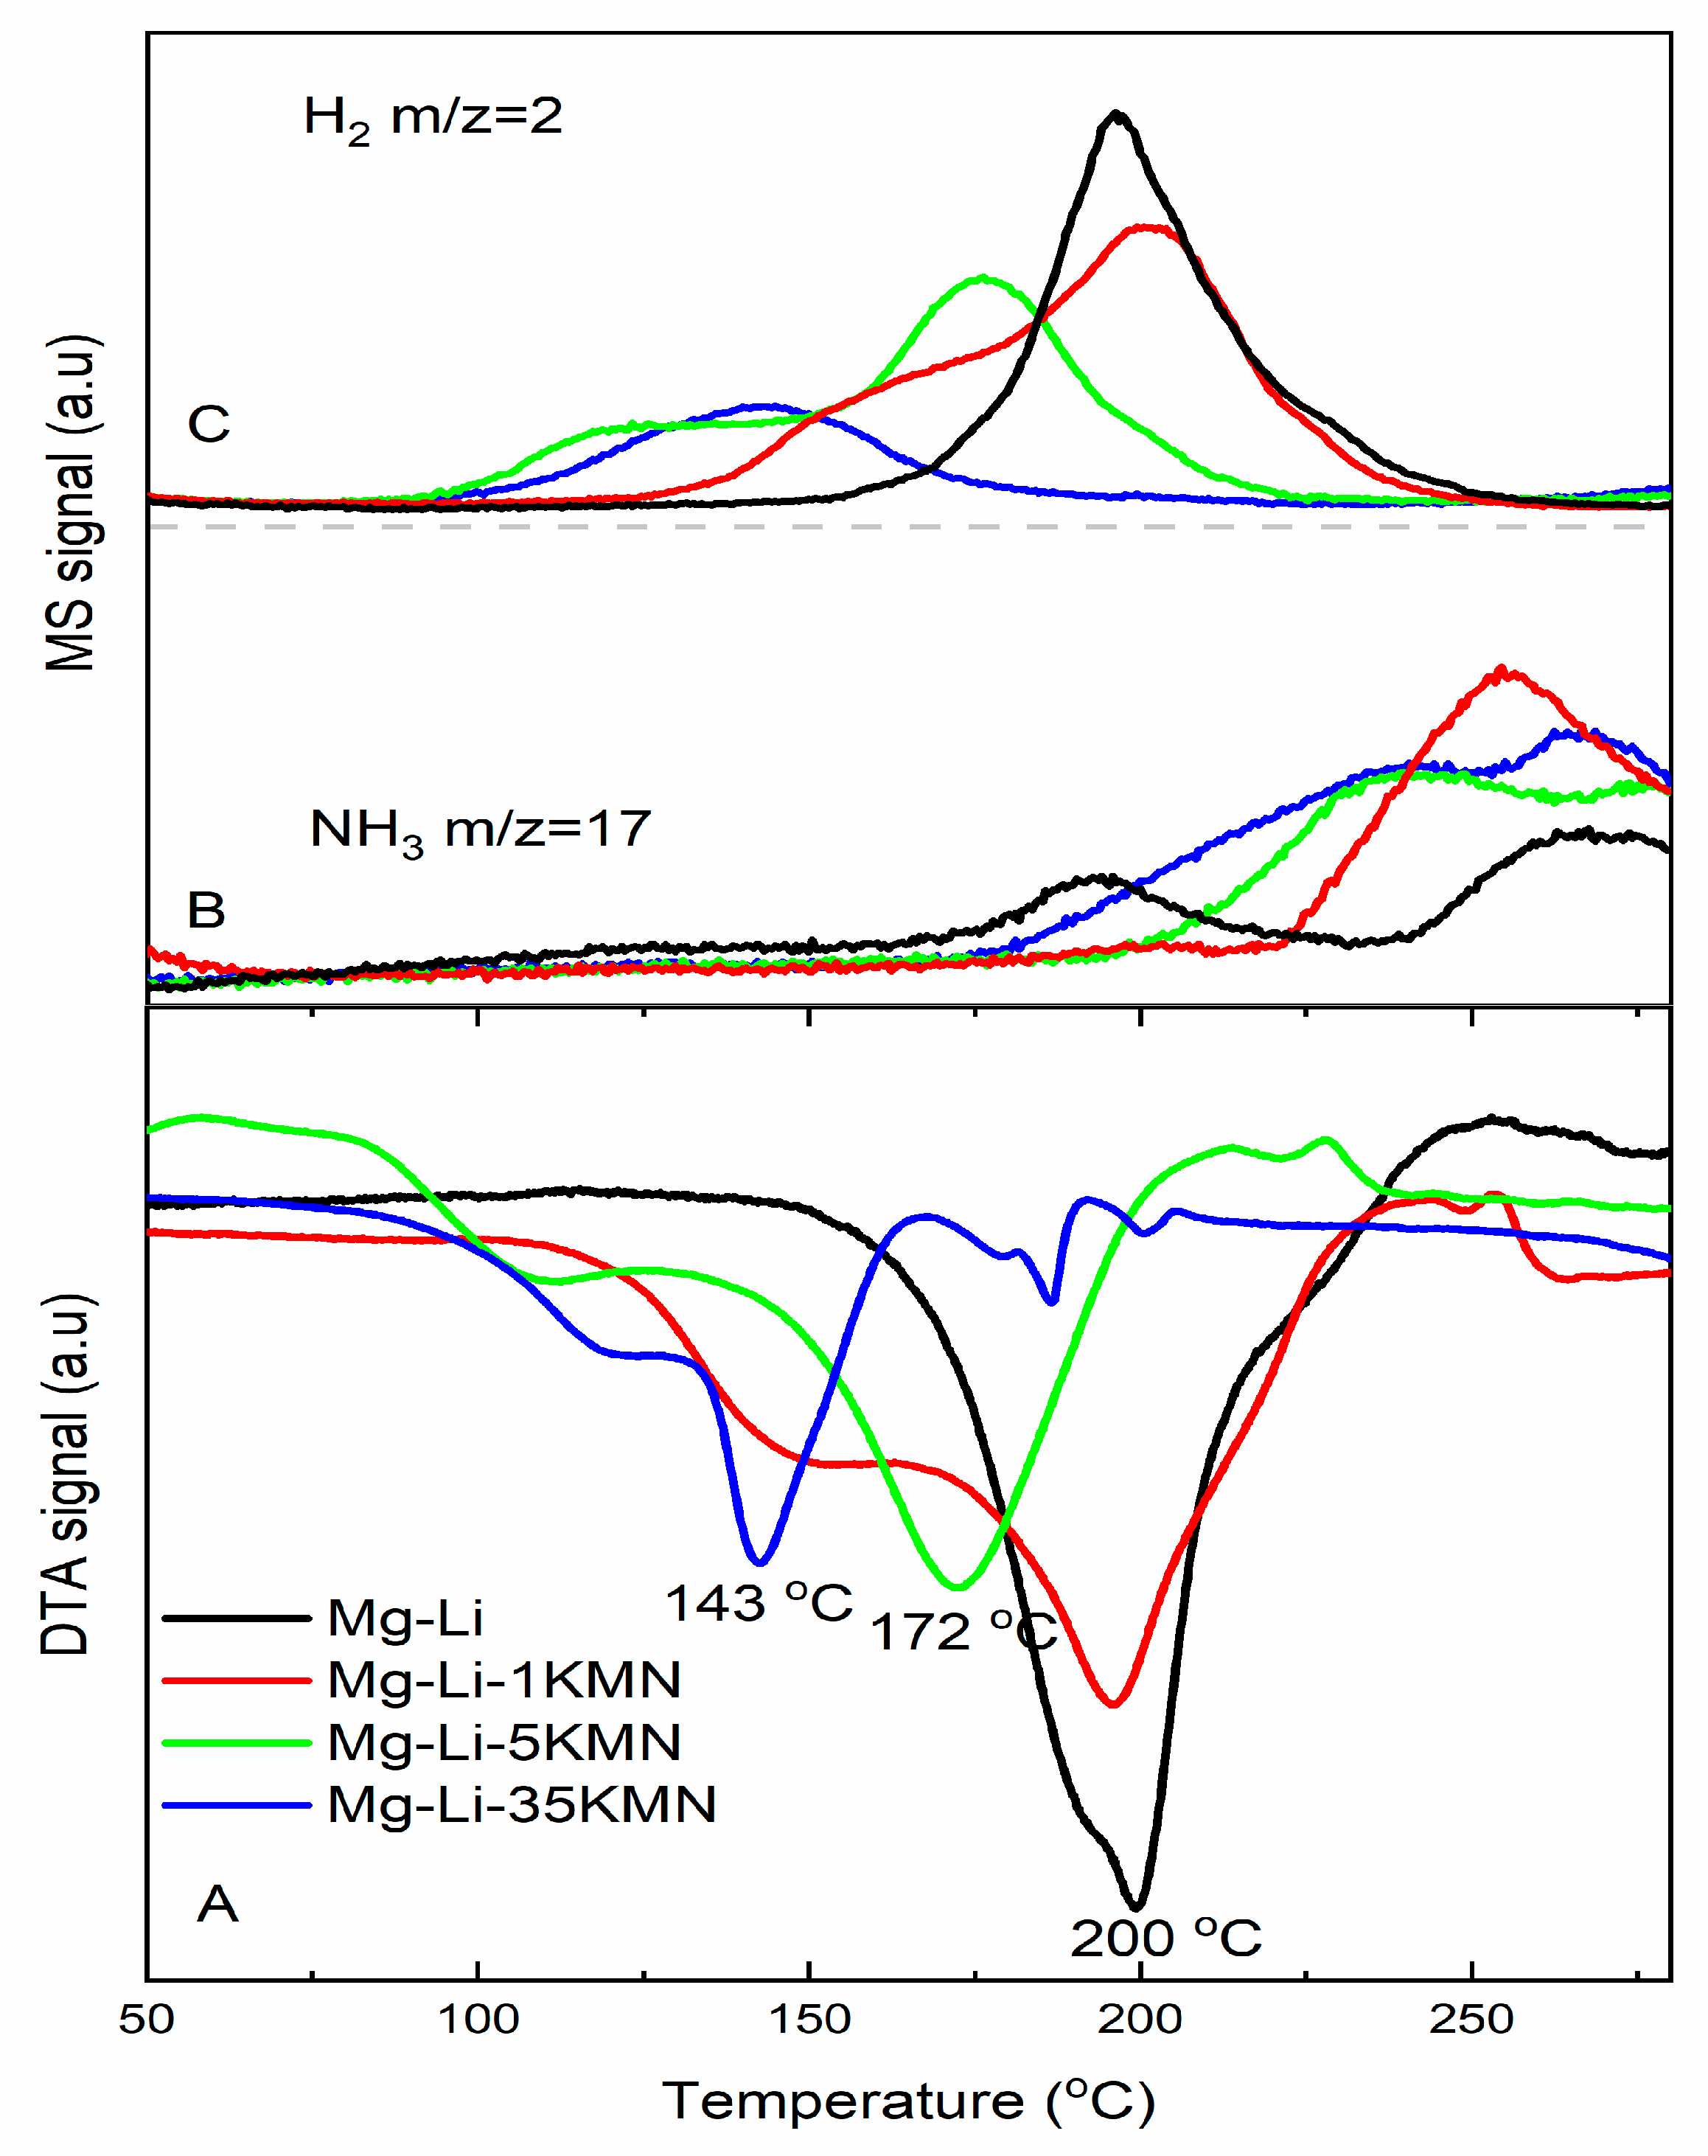
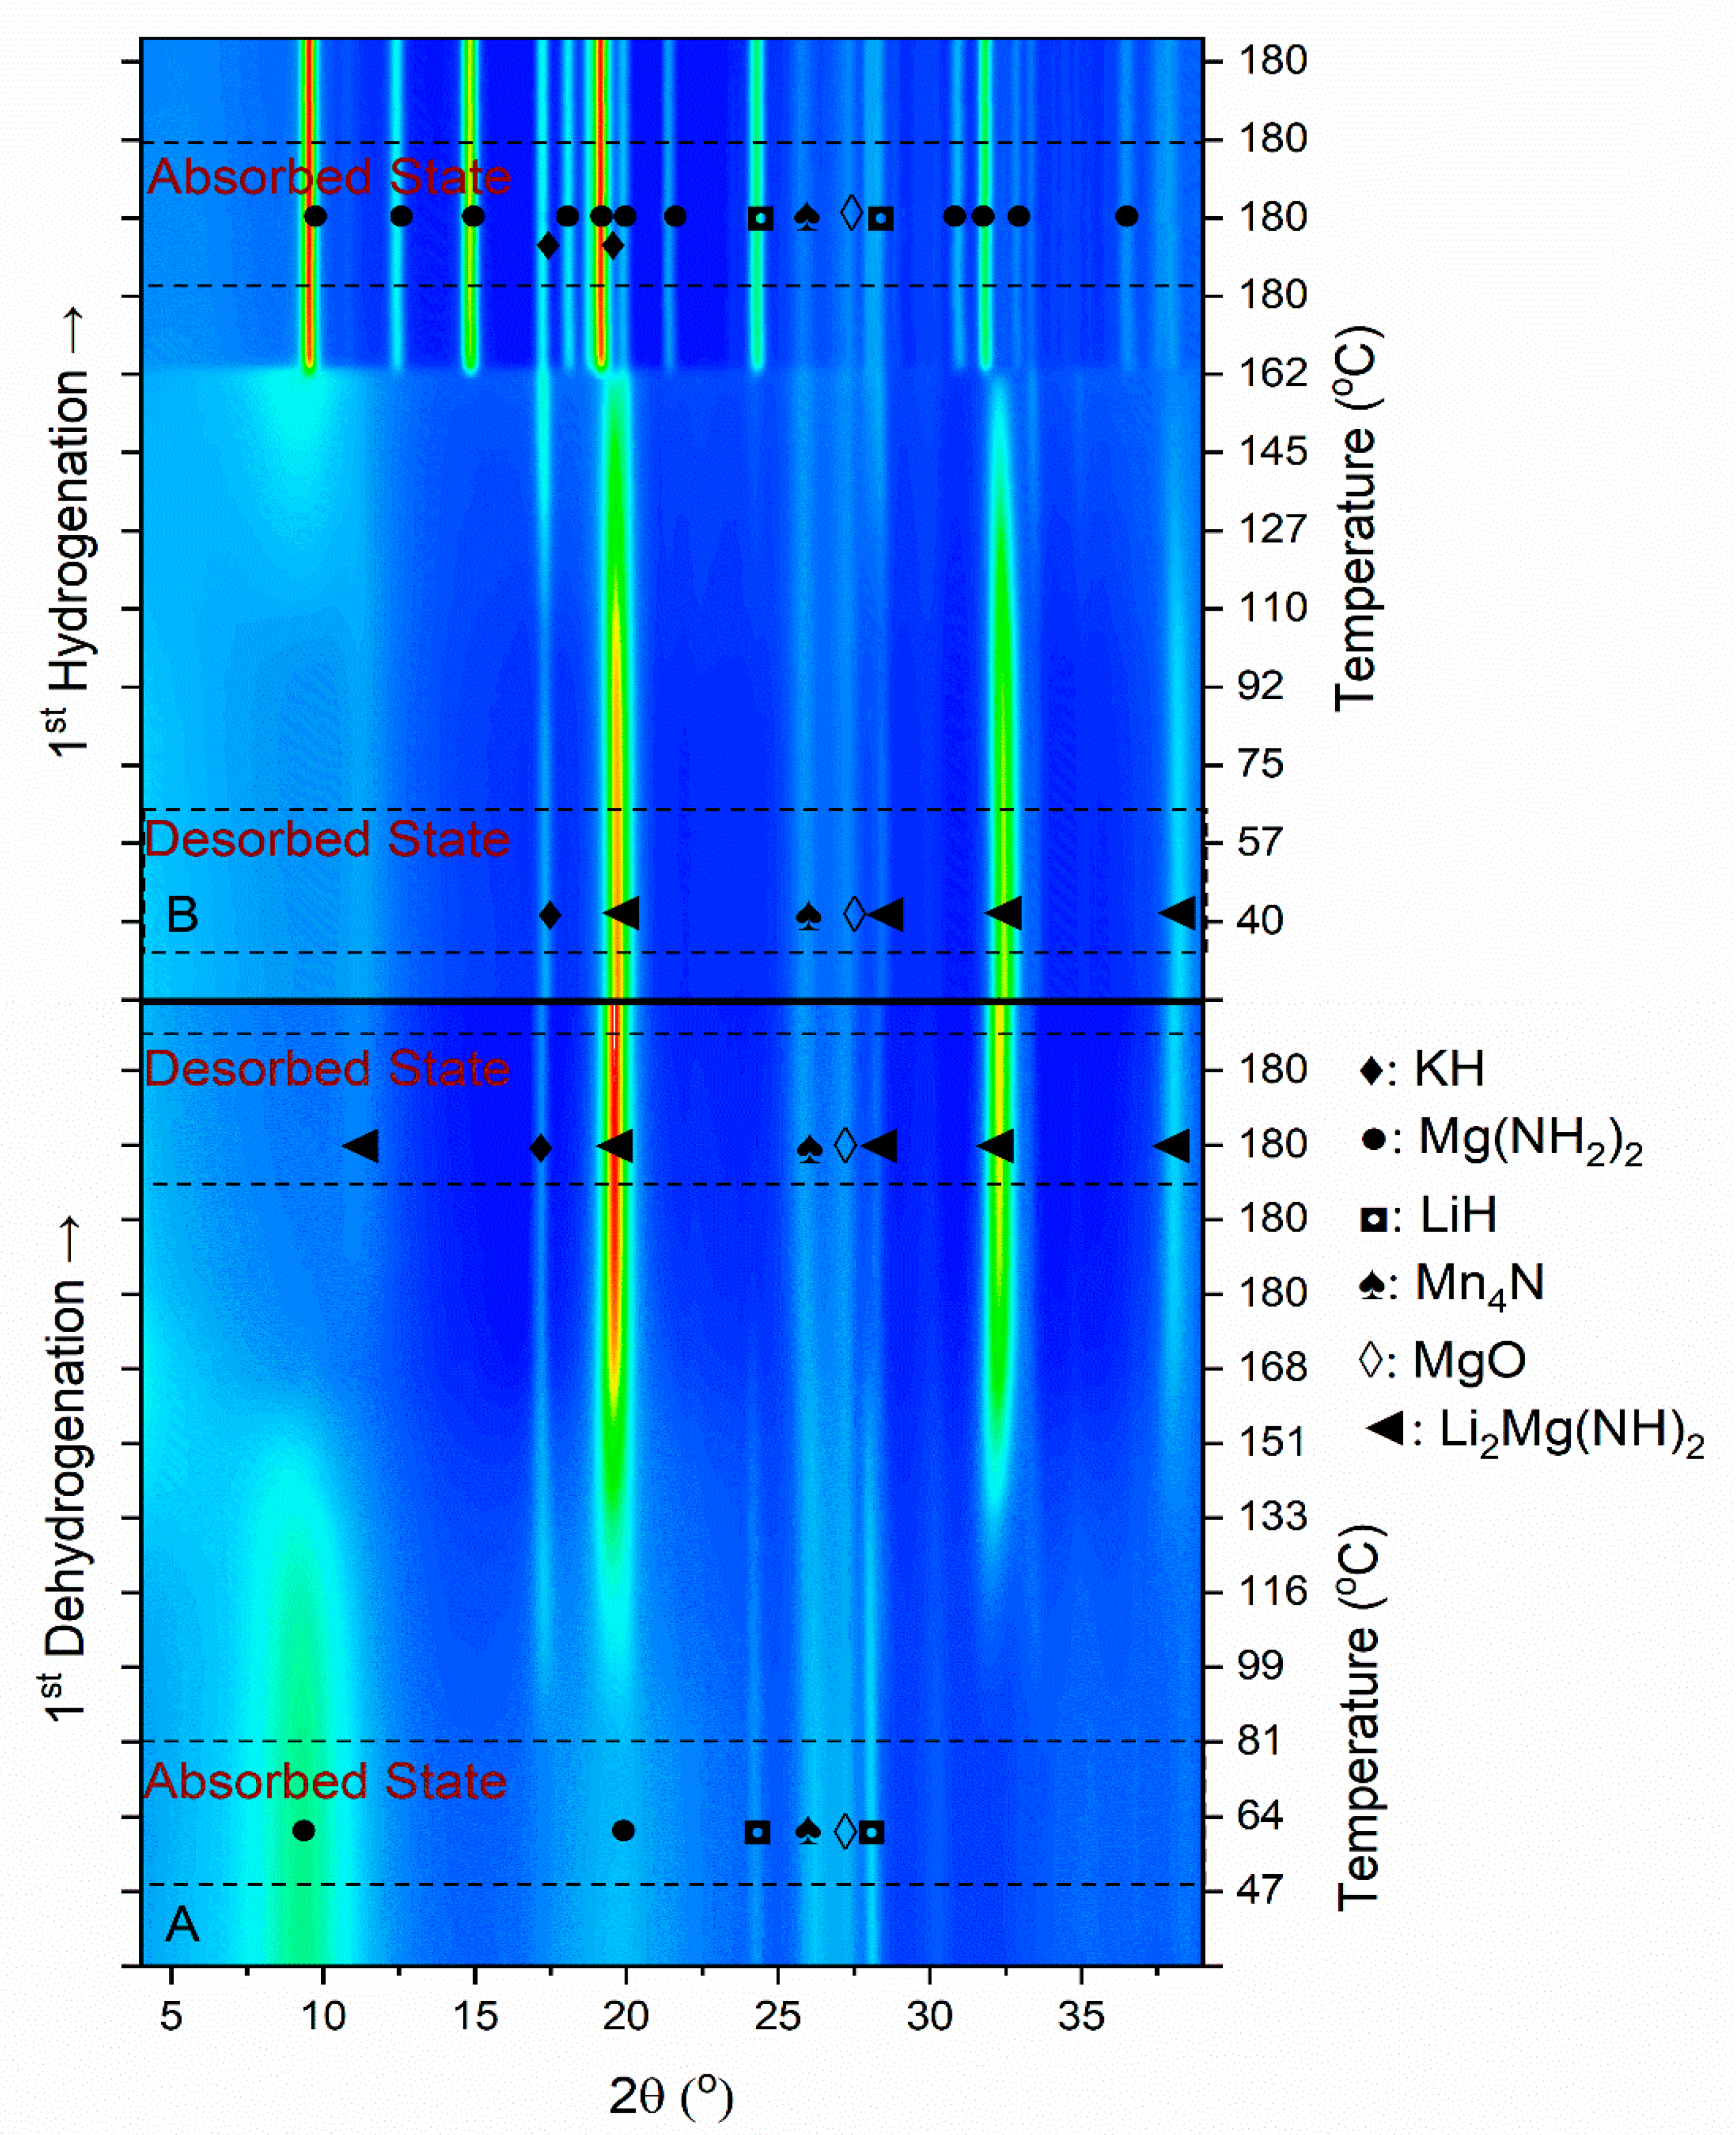
3.1. First Dehydrogenation/Hydrogenation Properties
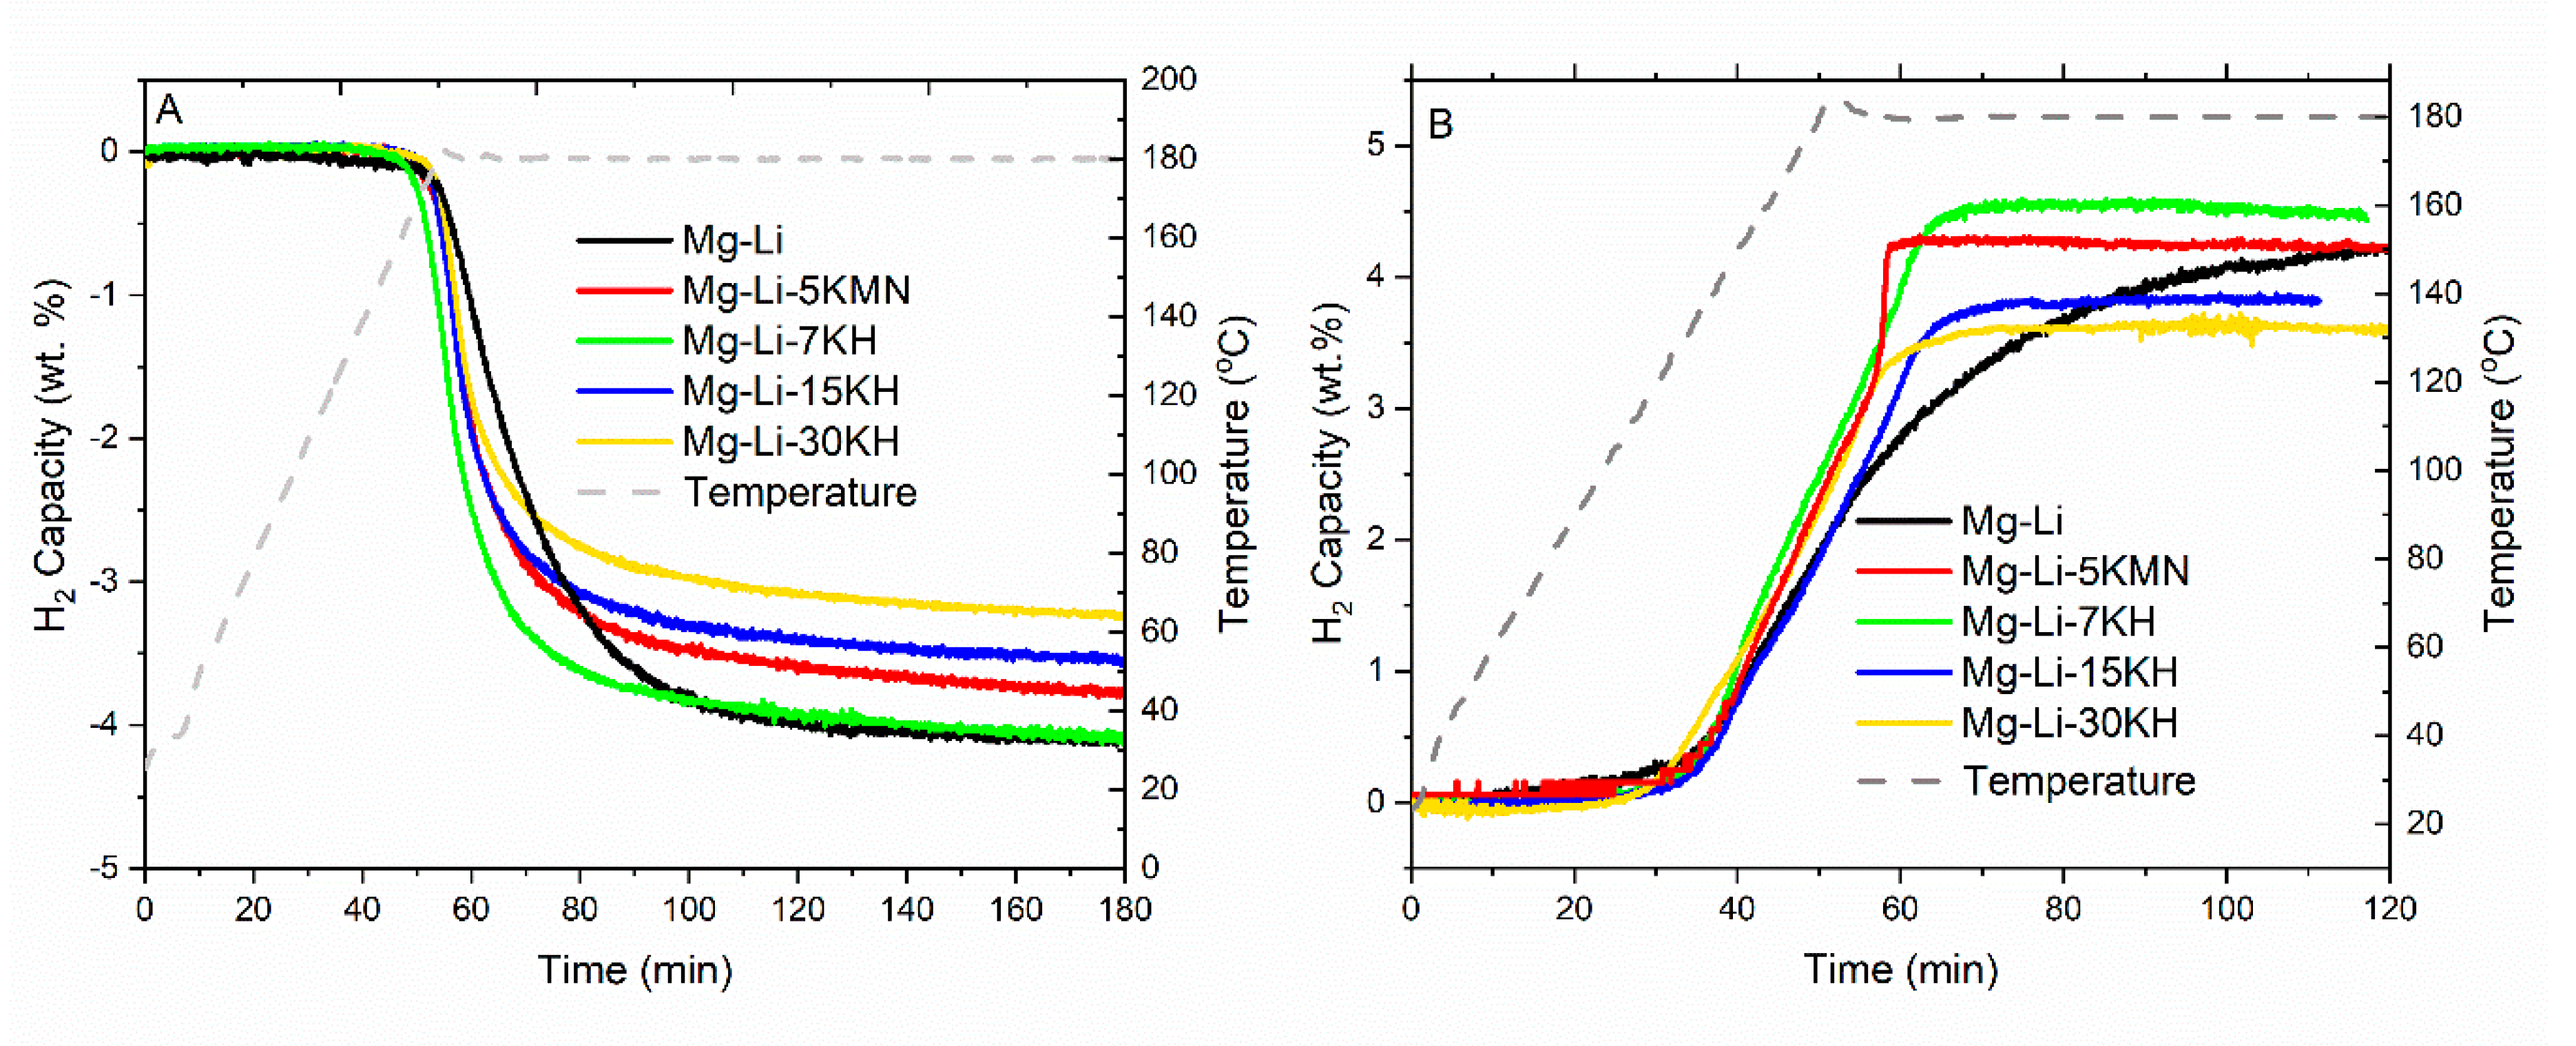
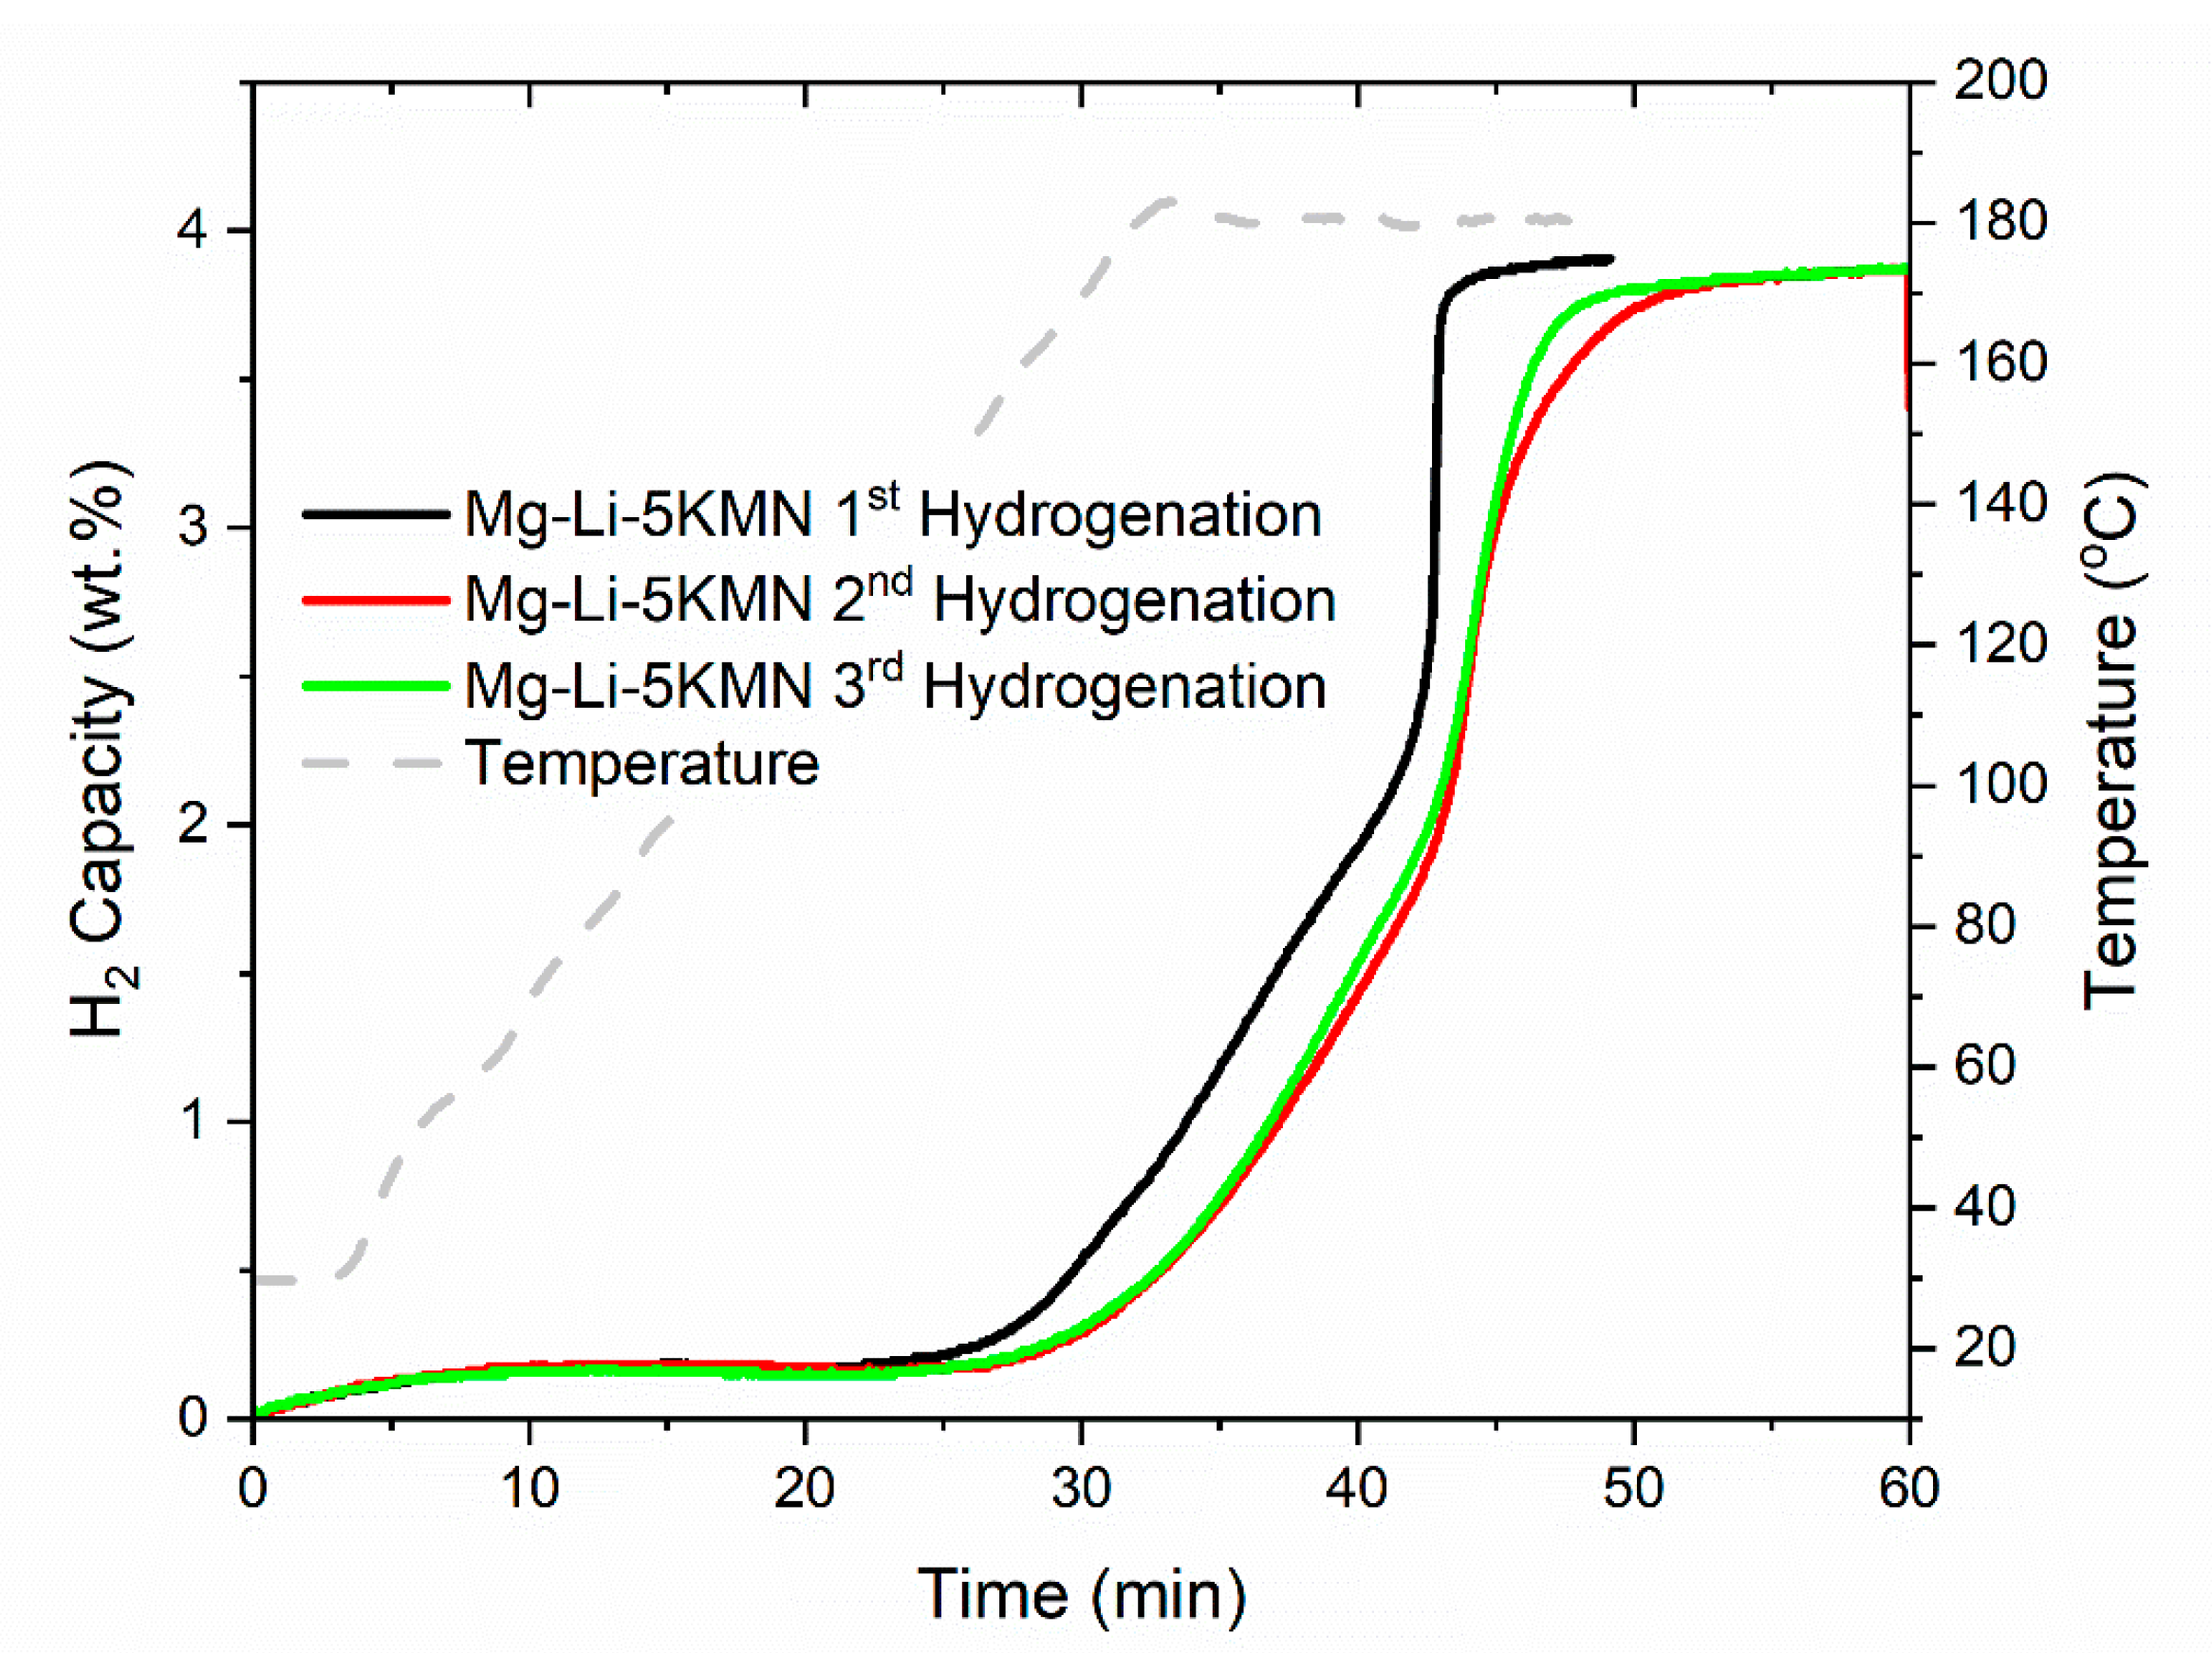
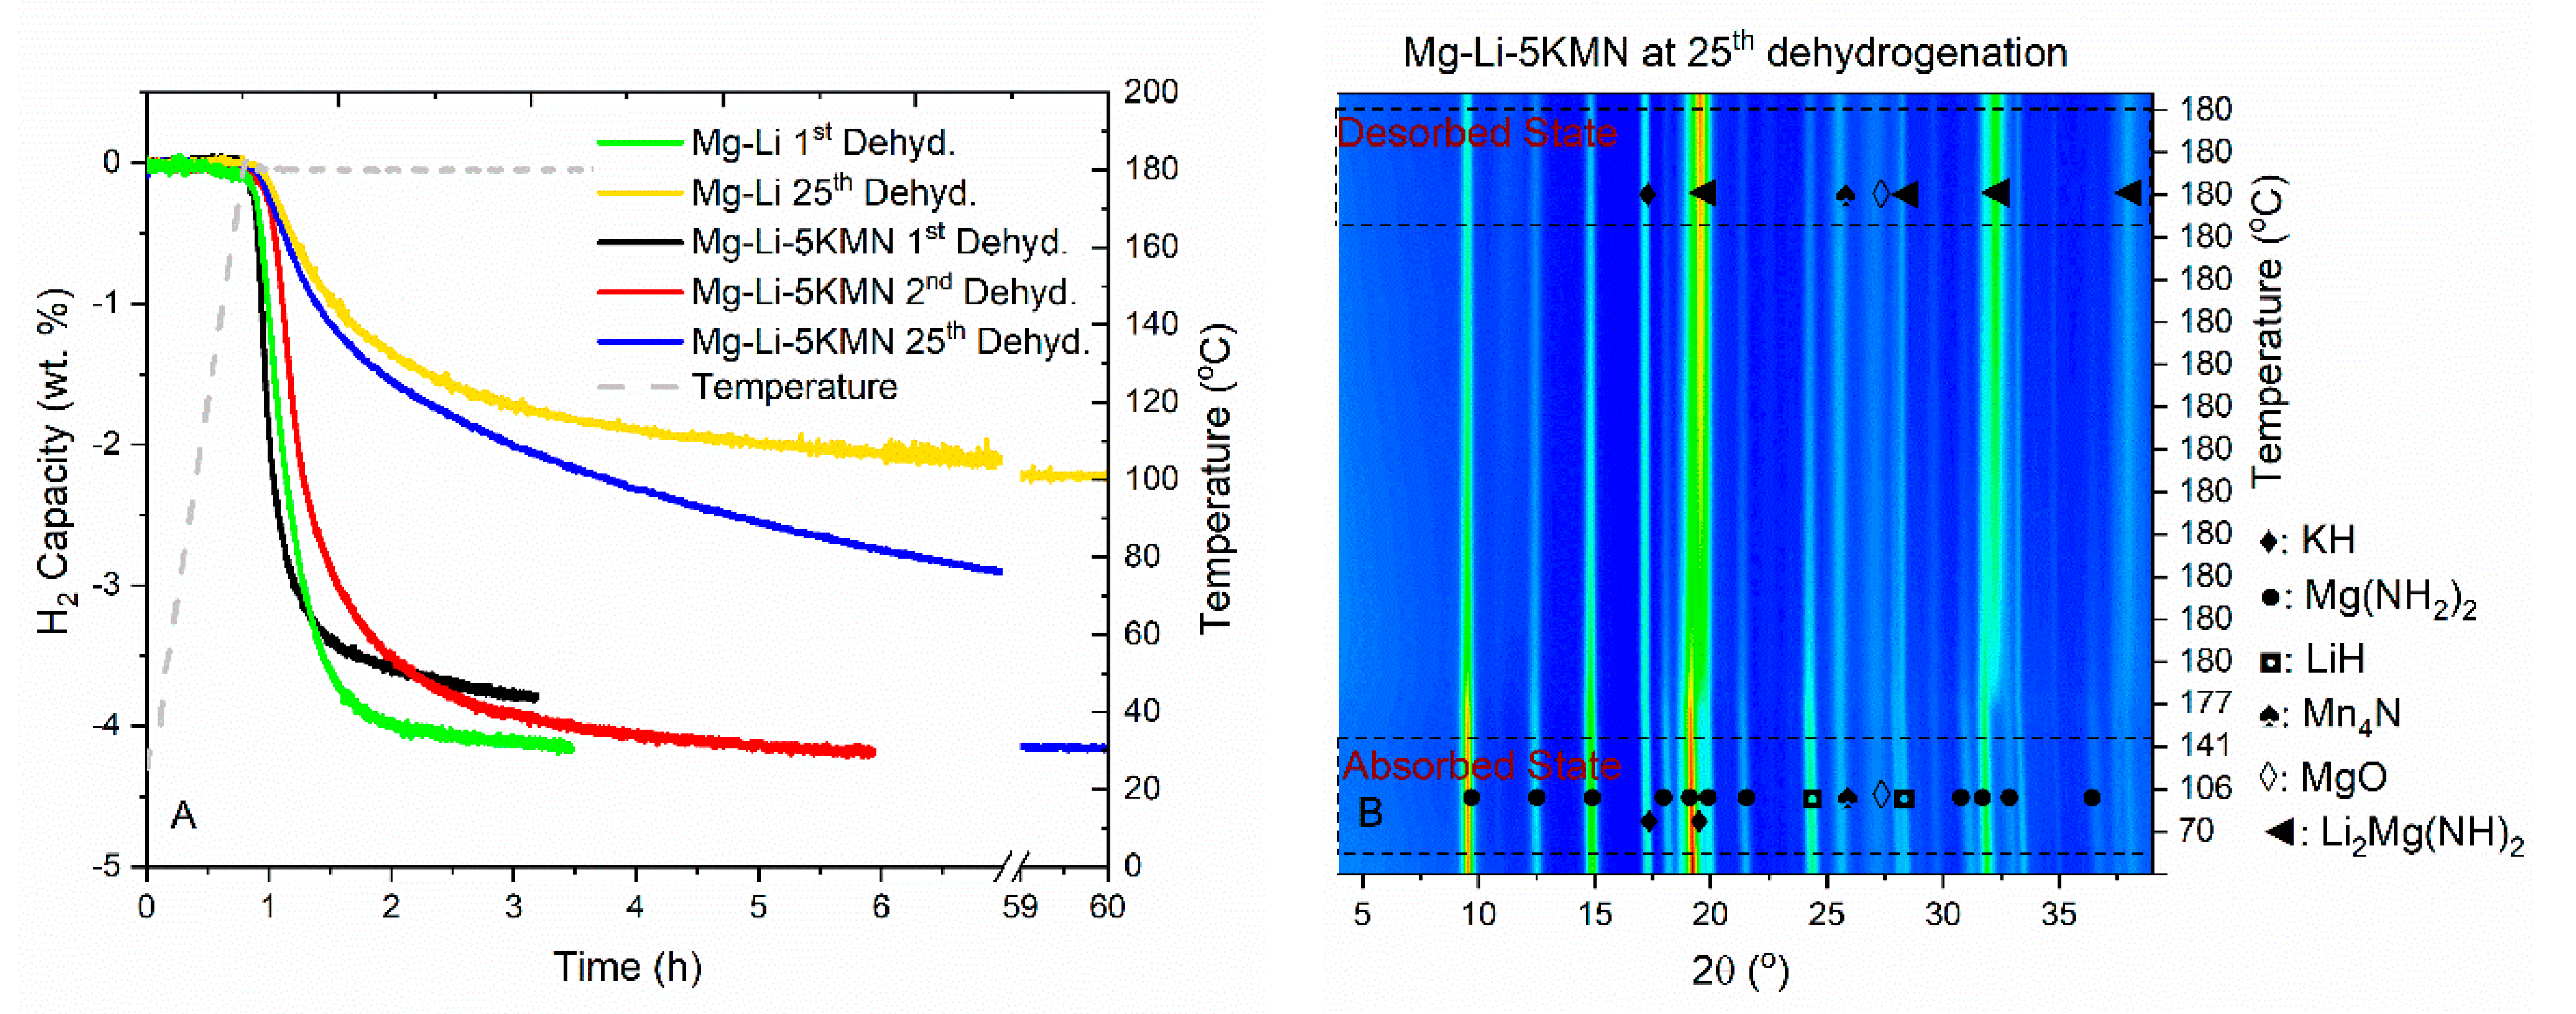
3.2. Dehydrogenation/Rehydrogenation Properties upon Cycling
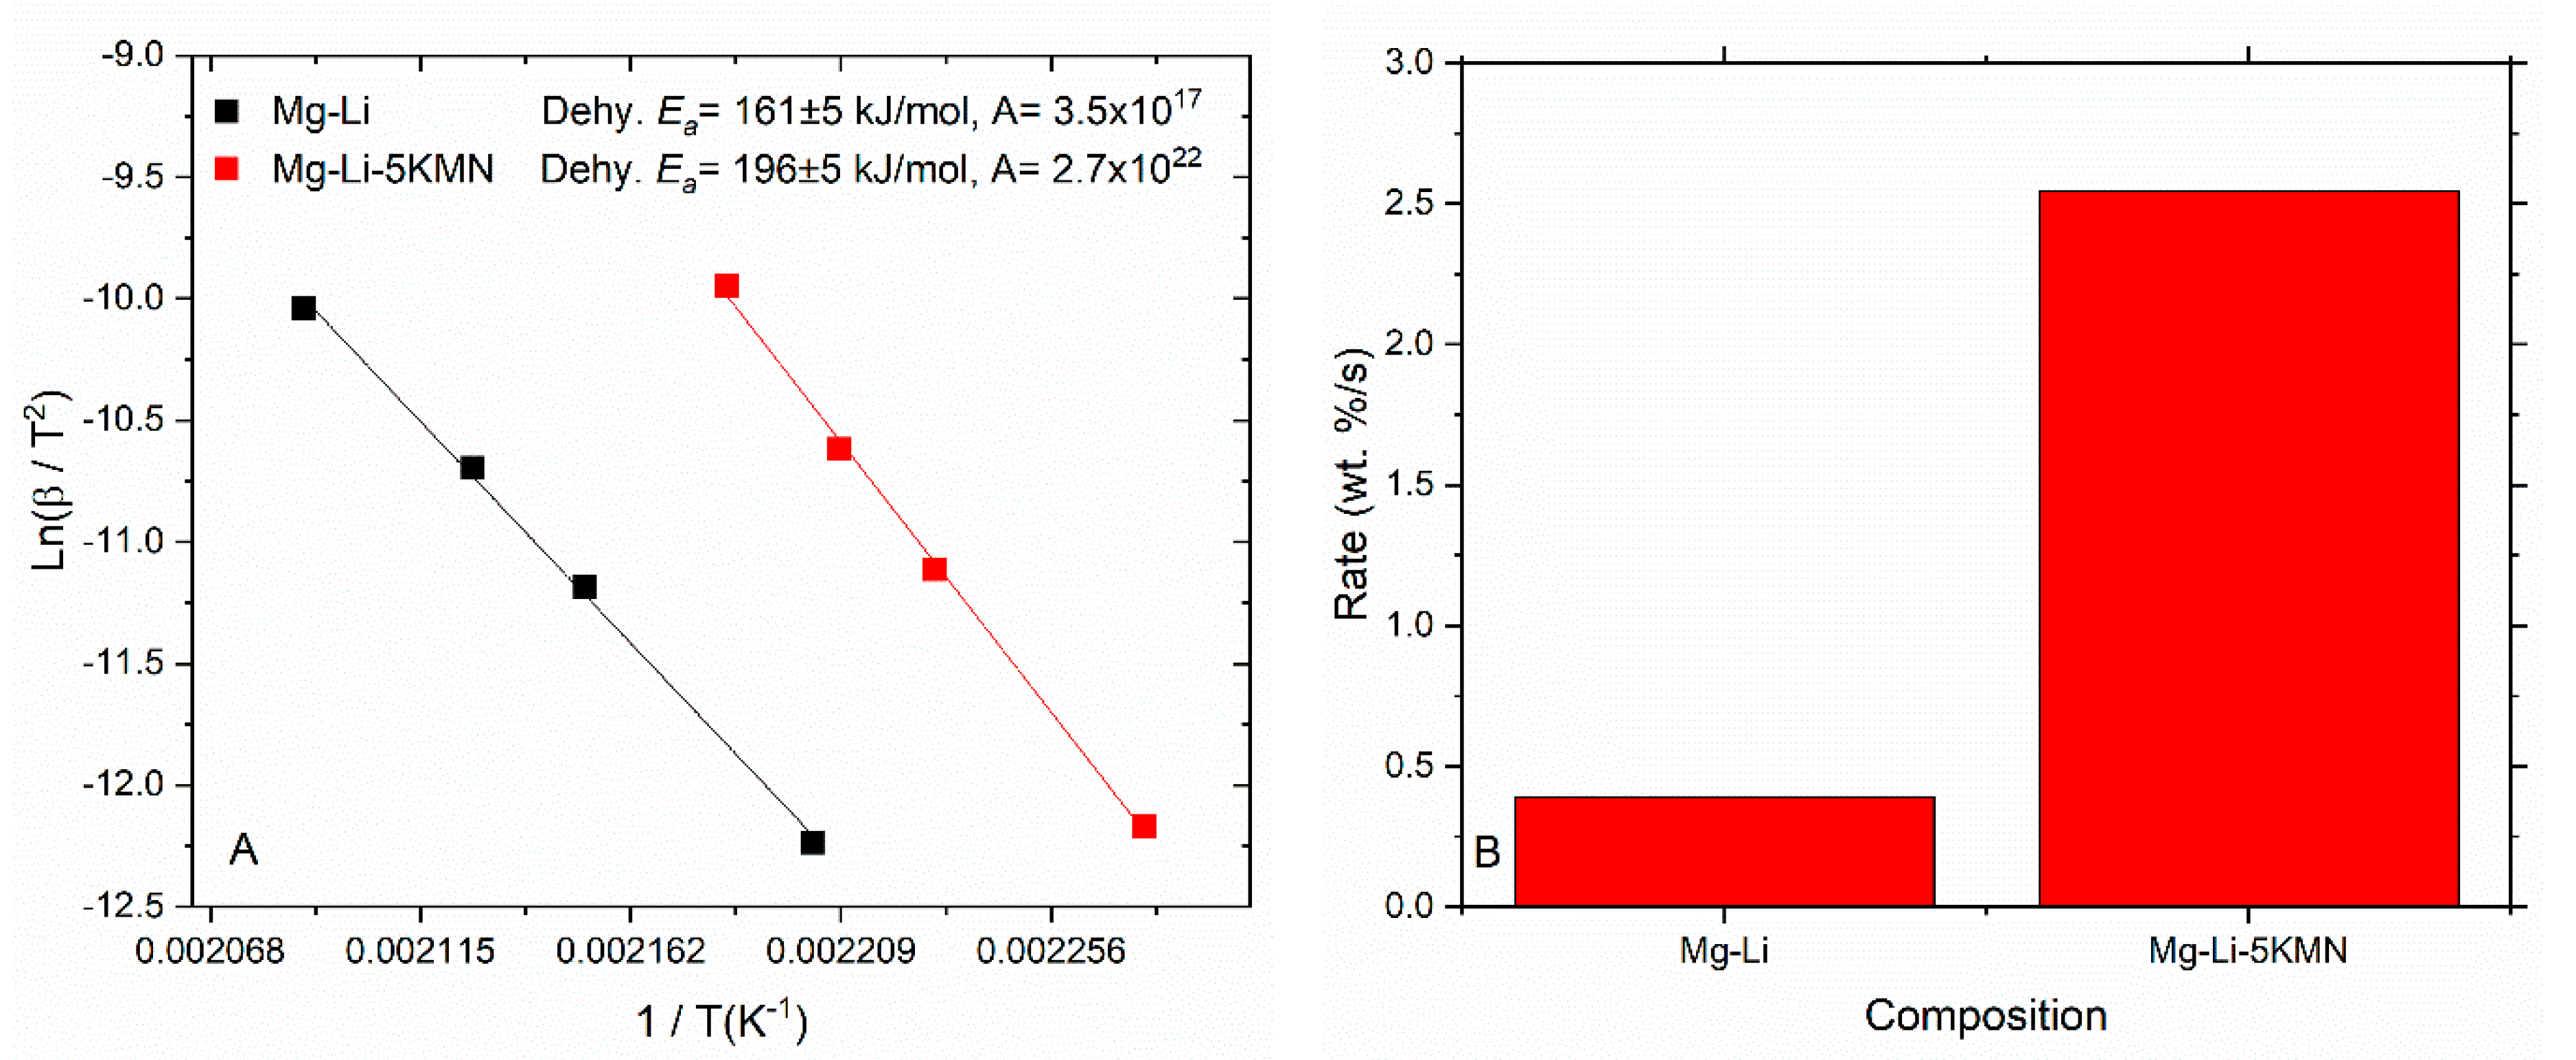
3.3. Apparent Activation Energies and Rate Constants
4. Conclusions
Supplementary Materials
Author Contributions
Funding
Conflicts of Interest
References
- Saldan, I. A prospect for LiBH4 as on-board hydrogen storage. Cent. Eur. J. Chem. 2011, 9, 761–775. [Google Scholar] [CrossRef]
- Klebanoff, L.E.; Keller, J.O. 5 Years of hydrogen storage research in the U.S. DOE Metal Hydride Center of Excellence (MHCoE). Int. J. Hydrogen Energy 2013, 38, 4533–4576. [Google Scholar] [CrossRef]
- Hirscher, M. Handbook of Hydrogen Storage; Wiley-VCH Verlag GmbH & Co. KGaA: Weinheim, Germany, 2010. [Google Scholar]
- Varin, R.A.; Czujko, T.; Wronski, Z. Nanomaterials for Solid State Hydrogen Storage; Springer Publishing Company: New York, NY, USA, 2009. [Google Scholar]
- Eberle, U.; Felderhoff, M.; Schüth, F. Chemische und physikalische Lösungen für die Speicherung von Wasserstoff. Angew. Chemie 2009, 121, 6732–6757. [Google Scholar] [CrossRef]
- von Colbe, J.M.B.; Lozano, G.; Metz, O.; Buecherl, T.; Bormann, R.; Klassen, T.; Dornheim, M. Design, sorption behaviour and energy management in a sodium alanate-based lightweight hydrogen storage tank. Int. J. Hydrogen Energy 2015, 40, 2984–2988. [Google Scholar] [CrossRef]
- Orimo, S.; Nakamori, Y.; Eliseo, J.R.; Züttle, A.; Jensen, C.; Complex, M. Hydrides for Hydrogen Storage. Chem. Rev. 2007, 107, 4111–4132. [Google Scholar] [CrossRef]
- Wang, J.; Li, H.W.; Chen, P. Amides and borohydrides for high-capacity solid-state hydrogen storage-Materials design and kinetic improvements. Mater. Res. Soc. 2013, 38, 480–487. [Google Scholar] [CrossRef]
- Chen, P.; Xiong, Z.; Luo, J.; Lin, J.; Tan, K.L. Interaction of hydrogen with metal nitrides and imides. Nature 2002, 420, 302–304. [Google Scholar] [CrossRef]
- Milanese, C.; Jensen, T.R.; Hauback, B.C.; Pistidda, C.; Dornheim, M.; Yang, H.; de Jongh, P.E. Complex hydrides for energy storage. Int. J. Hydrogen Energy 2019, 44, 7860–7874. [Google Scholar] [CrossRef]
- Garroni, S.; Santoru, A.; Cao, H.; Dornheim, M.; Klassen, T.; Milanese, C.; Pistidda, C. Recent progress and new perspectives on metal amide and imide systems for solid-state hydrogen storage. Energies 2018, 11, 1027. [Google Scholar] [CrossRef]
- Wang, H.; Cao, H.; Wu, G.; He, T.; Chen, P. The improved hydrogen storage performances of the multi-component composite: 2Mg(NH2)2-3LiH-LiBH4. Energies 2015, 8, 6898–6909. [Google Scholar] [CrossRef]
- Wang, H.; Cao, H.; Pistidda, C.; Garroni, S.; Wu, G.; Klassen, T.; Chen, P. Effects of Stoichiometry on the H2 -Storage Properties of Mg(NH2)2–LiH–LiBH4 Tri-Component Systems. Chem. Asian J. 2017, 12, 1758–1764. [Google Scholar] [CrossRef] [PubMed]
- Leng, H.Y.; Ichikawa, T.; Hino, S.; Hanada, N.; Isobe, S.; Fujii, H. Synthesis and decomposition reactions of metal amides in metal-N-H hydrogen storage system. J. Power Sources 2006, 156, 166–170. [Google Scholar] [CrossRef]
- Luo, W.; Sickafoose, S. Thermodynamic and structural characterization of the Mg-Li-N-H hydrogen storage system. J. Alloys Compd. 2006, 407, 274–281. [Google Scholar] [CrossRef]
- Luo, W.; Rönnebro, E. Towards a viable hydrogen storage system for transportation application. J. Alloys Compd. 2005, 404, 392–395. [Google Scholar] [CrossRef]
- Xiong, Z.; Hu, J.; Wu, G.; Chen, P.; Luo, W.; Gross, K.; Wang, J. Thermodynamic and kinetic investigations of the hydrogen storage in the Li-Mg-N.-H. system. J. Alloys Compd. 2005, 398, 235–239. [Google Scholar] [CrossRef]
- Wang, J.; Li, H.; Wang, S.; Liu, X.; Li, Y.; Jiang, L. The desorption kinetics of the Mg(NH2)2 + LiH mixture. Int. J. Hydrogen Energy 2009, 34, 1411–1416. [Google Scholar] [CrossRef]
- Li, C.; Liu, Y.; Ma, R.; Zhang, X.; Li, Y.; Gao, M.; Pan, H. Superior dehydrogenation/hydrogenation kinetics and long-term cycling performance of K and Rb Cocatalyzed Mg(NH2)2-2LiH system. ACS Appl. Mater. Interfaces 2014, 6, 17024–17033. [Google Scholar] [CrossRef] [PubMed]
- Ma, L.P.; Wang, P.; Dai, H.B.; Cheng, H.M. Catalytically enhanced dehydrogenation of Li-Mg-N-H hydrogen storage material by transition metal nitrides. J. Alloys Compd. 2009, 468, L21–L24. [Google Scholar] [CrossRef]
- Wang, J.; Liu, T.; Wu, G.; Li, W.; Liu, Y.; Araújo, C.M.; Yang, P. Potassium-modified Mg(NH2)2/2LiH system for hydrogen storage. Angew. Chemie Int. Ed. 2009, 48, 5828–5832. [Google Scholar] [CrossRef]
- Amica, G.; Larochette, P.A.; Gennari, F.C. Hydrogen storage properties of LiNH2 –LiH system with MgH2, CaH2 and TiH2 added. Int. J. Hydrogen Energy 2015, 40, 9335–9346. [Google Scholar] [CrossRef]
- Zhao, W.; Jiang, L.; Yuanfang, W.U.; Jianhua, Y.E.; Yuan, B.; Zhinian, L.I.; Shumao, W. Improved dehydrogenation cycle performance of the 1.1MgH2-2LiNH2-0.1LiBH4 system by addition of LaNi4.5Mn0.5 alloy. J. Rare Earths 2015, 33, 783–790. [Google Scholar]
- Dong, B.X.; Ge, J.; Teng, Y.L.; Gao, J.J.; Song, L. Improved dehydrogenation properties of the LiNH2 –LiH system by doping with alkali metal hydroxide. J. Mater. Chem. A 2015, 3, 905–911. [Google Scholar] [CrossRef]
- Torre, F.; Valentoni, A.; Milanese, C.; Pistidda, C.; Marini, A.; Dornheim, M.; Garroni, S. Kinetic improvement on the CaH2-catalyzed Mg(NH2)2 + 2LiH system. J. Alloys Compd. 2015, 645, S284–S287. [Google Scholar] [CrossRef]
- Liang, C.; Liu, Y.; Gao, M.; Pan, H. Understanding the role of K in the significantly improved hydrogen storage properties of a KOH-doped Li-Mg-N.-H. system. J. Mater. Chem. A 2013, 1, 5031–5036. [Google Scholar] [CrossRef]
- Wang, J.; Chen, P.; Pan, H.; Xiong, Z.; Gao, M.; Wu, G.; Wang, J. Solid-solid heterogeneous catalysis: The role of potassium in promoting the dehydrogenation of the Mg(NH2)2/2LiH composite. ChemSusChem 2013, 6, 2181–2189. [Google Scholar] [CrossRef] [PubMed]
- Zhang, Y.; Xiong, Z.; Cao, H.; Wu, G.; Chen, P. The enhanced hydrogen storage performance of (Mg-B-N-H)-doped Mg(NH2)2-2LiH system. Int. J. Hydrogen Energy 2014, 39, 1710–1718. [Google Scholar] [CrossRef]
- Shahi, R.R.; Yadav, T.P.; Shaz, M.A.; Srivastva, O.N. Studies on dehydrogenation characteristic of Mg(NH2)2/LiH mixture admixed with vanadium and vanadium based catalysts (V, V2O5 and VCl3). Int. J. Hydrogen Energy 2010, 35, 238–246. [Google Scholar] [CrossRef]
- Barison, S.; Agresti, F.; Russo, S.L.; Maddalena, A.; Palade, P.; Principi, G.; Torzo, G. A study of the LiNH2-MgH2 system for solid state hydrogen storage. J. Alloys Compd. 2008, 459, 343–347. [Google Scholar] [CrossRef]
- Luo, W.; Wang, J.; Stewart, K.; Clift, M.; Gross, K. Li-Mg-N-H: Recent investigations and development. J. Alloys Compd. 2007, 336–341. [Google Scholar] [CrossRef]
- Li, C.; Liu, Y.; Pang, Y.; Gu, Y.; Gao, M.; Pan, H. Compositional effects on the hydrogen storage properties of Mg(NH2)2-2LiH-xKH and the activity of KH during dehydrogenation reactions. Dalt. Trans. 2014, 43, 2369–2377. [Google Scholar] [CrossRef]
- Durojaiye, T.; Hayes, J.; Goudy, A. Rubidium hydride: An exceptional dehydrogenation catalyst for the lithium amide/magnesium hydride system. J. Phys. Chem. C 2013, 13, 6554–6560. [Google Scholar] [CrossRef]
- Durojaiye, T.; Hayes, J.; Goudy, A. Potassium, rubidium and cesium hydrides as dehydrogenation catalysts for the lithium amide/magnesium hydride system. Int. J. Hydrogen Energy 2015, 40, 2266–2273. [Google Scholar] [CrossRef]
- Cao, H.; Santoru, A.; Pistidda, C.; Richter, T.M.; Chaudhary, A.L.; Gizer, G.; Dornheim, M. New synthesis route for ternary transition metal amides as well as ultrafast amide-hydride hydrogen storage materials. Chem. Commun. 2016, 52, 5100–5103. [Google Scholar]
- Cao, H.; Richter, T.M.M.; Pistidda, C.; Chaudhary, A. Ternary Amides containing transition metals for hydrogen storage: A Case study with alkali metal amidozincates. ChemSusChem 2015, 8, 3777–3782. [Google Scholar] [CrossRef] [PubMed]
- Cao, H.; Pistidda, C.; Richter, T.M.; Santoru, A.; Milanese, C.; Garroni, S.; Niewa, R. In situ x-ray diffraction studies on the de/rehydrogenation processes of the K2[Zn(NH2)4]-8LiH system. J. Phys. Chem. C 2017, 121, 1546–1551. [Google Scholar] [CrossRef]
- Cerenius, Y.; Ståhl, K.; Svensson, L.A.; Ursby, T.; Oskarsson, Å; Albertsson, J.; Liljas, A. The crystallography beamline I711 at MAX II. J. Synchrotron Radiat. 2000, 7, 203–208. [Google Scholar] [CrossRef]
- Rietveld, H.M. A profile refinement method for nuclear and magnetic structures. J. Appl. Crystallogr. 1968, 2, 65–71. [Google Scholar] [CrossRef]
- Lutterotti, L. Total pattern fitting for the combined size-strain-stress-texture determination in thin film diffraction. Nucl. Instrum. Methods Phys. Res. Sect. B Beam Interact. Mater. Atoms 2010, 268, 334–340. [Google Scholar] [CrossRef]
- Bösenberg, U.; Pistidda, C.; Tolkiehn, M.; Busch, N.; Saldan, I.; Suarez-Alcantara, K.; Dornheim, M. Characterization of metal hydrides by in-situ XRD. Int. J. Hydrogen Energy 2014, 39, 9899–9903. [Google Scholar] [CrossRef]
- Pistidda, C.; Santoru, A.; Garroni, S.; Bergemann, N.; Rzeszutek, A.; Horstmann, C.; Dornheim, M. First direct study of the ammonolysis reaction in the most common alkaline and alkaline earth metal hydrides by in situ SR-PXD. J. Phys. Chem. C 2015, 119, 934–943. [Google Scholar] [CrossRef]
- Hammersley, A.P. FIT2D: AN Introduction and Overview; ESRF internal report ESRF97HA02T; European Synchrotron Radiation Facility (ESRF): Grenoble, France, 1997; Available online: http://www.esrf.eu/computing/scientific/FIT2D/FIT2D_INTRO/fit2d.html (accessed on 1 May 2019).
- Kissinger, H.E. Reaction kinetics in differential thermal analysis. Anal. Chem. 1957, 29, 1702–1706. [Google Scholar] [CrossRef]
- Hu, J.; Liu, Y.; Wu, G.; Xiong, Z.; Chen, P. Structural and compositional changes during hydrogenation/dehydrogenation of the Li-Mg-N.-H. system. J. Phys. Chem. C 2007, 111, 18439–18443. [Google Scholar] [CrossRef]
- Wang, P.; Chang, F.; Gao, W.; Guo, J.; Wu, G.; He, T.; Chen, P. Breaking scaling relations to achieve low-temperature ammonia synthesis through LiH-mediated nitrogen transfer and hydrogenation. Nat. Chem. 2017, 9, 64–70. [Google Scholar] [CrossRef] [PubMed]
- Dornheim, M. Thermodynamics of Metal Hydrides: Tailoring Reaction Enthalpies of Hydrogen Storage Materials. In Thermodynamics-Interaction Studies-Solids, Liquids and Gases; InTech: Rijeka, Croatia, 2012; pp. 892–918. [Google Scholar]
- Bogdanovic, B.; Ritter, A.; Spliethoff, B. Active MgH2-Mg systems for reversible chemical energy storage. Angew. Chem. 1990, 29, 223–328. [Google Scholar] [CrossRef]
- Capurso, G.; Schiavo, B.; Jepsen, J.; Lozano, G.A.; Metz, O.; Klassen, T.; Dornheim, M. Metal hydride-based hydrogen storage tank coupled with an urban concept fuel cell vehicle: Off board tests. Adv. Sustain. Syst. 2018, 2, 1800004. [Google Scholar] [CrossRef]
- Baricco, M.; Bang, M.; Fichtner, M.; Hauback, B.; Linder, M.; Luetto, C.; Sgroi, M. SSH2S: Hydrogen storage in complex hydrides for an auxiliary power unit based on high temperature proton exchange membrane fuel cells. J. Power Source 2017, 342, 853–860. [Google Scholar] [CrossRef]
- Li, C.; Liu, Y.; Yang, Y.; Gao, M.; Pan, H. High-temperature failure behaviour and mechanism of K-based additives in Li-Mg-N-H hydrogen storage systems. J. Mater. Chem. A 2014, 2, 7345–7353. [Google Scholar] [CrossRef]
- Liu, Y.; Yang, Y.; Zhang, X.; Li, Y.; Gao, M.; Pan, H. Insights into the dehydrogenation reaction process of a K-containing Mg(NH2)2-2LiH system. Dalt. Trans. 2015, 44, 18012–18018. [Google Scholar] [CrossRef]
- Liu, Y.; Li, C.; Li, B.; Gao, M.; Pan, H. Metathesis reaction-induced significant improvement in hydrogen storage properties of the KF-added Mg(NH2)2-2LiH system. J. Phys. Chem. C 2013, 117, 866–875. [Google Scholar] [CrossRef]


| Sample Composition | Sample Code |
|---|---|
| Mg(NH2)2 + 2LiH | Mg–Li |
| Mg(NH2)2 + 2LiH + 0.01K2Mn(NH2)4 | Mg–Li–1KMN |
| Mg(NH2)2 + 2LiH + 0.05K2Mn(NH2)4 | Mg–Li–5KMN |
| Mg(NH2)2 + 2LiH + 0.35K2Mn(NH2)4 | Mg–Li–35KMN |
| Mg(NH2)2 + 2LiH + 0.07KH | Mg–Li–7KH |
| Mg(NH2)2 + 2LiH + 0.15KH | Mg–Li–15KH |
| Mg(NH2)2 + 2LiH + 0.30KH | Mg–Li–30KH |
© 2019 by the authors. Licensee MDPI, Basel, Switzerland. This article is an open access article distributed under the terms and conditions of the Creative Commons Attribution (CC BY) license (http://creativecommons.org/licenses/by/4.0/).
Share and Cite
Gizer, G.; Cao, H.; Puszkiel, J.; Pistidda, C.; Santoru, A.; Zhang, W.; He, T.; Chen, P.; Klassen, T.; Dornheim, M. Enhancement Effect of Bimetallic Amide K2Mn(NH2)4 and In-Situ Formed KH and Mn4N on the Dehydrogenation/Hydrogenation Properties of Li–Mg–N–H System. Energies 2019, 12, 2779. https://doi.org/10.3390/en12142779
Gizer G, Cao H, Puszkiel J, Pistidda C, Santoru A, Zhang W, He T, Chen P, Klassen T, Dornheim M. Enhancement Effect of Bimetallic Amide K2Mn(NH2)4 and In-Situ Formed KH and Mn4N on the Dehydrogenation/Hydrogenation Properties of Li–Mg–N–H System. Energies. 2019; 12(14):2779. https://doi.org/10.3390/en12142779
Chicago/Turabian StyleGizer, Gökhan, Hujun Cao, Julián Puszkiel, Claudio Pistidda, Antonio Santoru, Weijin Zhang, Teng He, Ping Chen, Thomas Klassen, and Martin Dornheim. 2019. "Enhancement Effect of Bimetallic Amide K2Mn(NH2)4 and In-Situ Formed KH and Mn4N on the Dehydrogenation/Hydrogenation Properties of Li–Mg–N–H System" Energies 12, no. 14: 2779. https://doi.org/10.3390/en12142779
APA StyleGizer, G., Cao, H., Puszkiel, J., Pistidda, C., Santoru, A., Zhang, W., He, T., Chen, P., Klassen, T., & Dornheim, M. (2019). Enhancement Effect of Bimetallic Amide K2Mn(NH2)4 and In-Situ Formed KH and Mn4N on the Dehydrogenation/Hydrogenation Properties of Li–Mg–N–H System. Energies, 12(14), 2779. https://doi.org/10.3390/en12142779