1. Introduction
1.1. Particulate Mater Emission of Gasoline Engines
The gasoline engine has been widely used in cars and trucks, and the technology of gasoline direct injection (GDI) has been highly regarded during the application and development of the gasoline engine, as it has good dynamic characteristics and fuel economy. Since fuel is directly injected into the cylinder when preparing the mixed gas, the fuel can absorb the heat in the cylinder after atomization and evaporation, which decreases the temperature, increases the volumetric efficiency, and reduces the knocking tendency. Therefore, GDI engines generally have higher, compression ratios and higher thermal efficiencies, and the stratified charge lean burn can further improve their performance. GDI engines can reduce fuel consumption by 15–20% comparing with traditional port fuel injection (PFI) engines [
1]. The GDI technology also accurately measures and controls the amount of fuel injected, which avoids the extra fuel supply due to the low speed at idling, thus improving the engine response and reducing emissions [
2].
GDI engines are widely used because of their many advantages, but particulate emissions are greatly increased while reducing gaseous pollutants. The generation of particulate matter (PM) is mainly caused by the direct injection of gasoline into the cylinder, and the preparation process of the mixed gas is then completed in the cylinder so that the gas is ignited without being sufficiently mixed; hence, the combustion is also insufficient. In addition, wall wetting is also a cause of PM [
3,
4]. It has been reported that the PM emissions per kilometer of GDI engines is approximately 10 mg, and the particulate number (PN) can reach up to 10
13 #/km, while the emissions per kilometer of PFI engines is less than 1 mg and the PN is only 12
12 #/km [
5].The particles of GDI engines are smaller than those of diesel engines. Graskow et al. [
6] studied the distribution range of the particle size of GDI engines. The results show that the average geometric diameter distribution of the particles is 68–88 nm, and the average PN concentration is 10
8 #/cm
3 [
7]. Theoretically, smaller particles have a larger surface, and smaller particles per unit mass can carry more toxic and harmful substances. In addition, the small particle volume makes it easier to enter the respiratory tract and threaten human health; the particles can travel through the lungs and may eventually enter the cellular membranes and finally enter the bloodstream of the human body [
8,
9,
10].
In previous studies, most researchers have focused on diesel engines when considering PM emission research. However, in urban areas where vehicles are intensively used, diesel vehicles are relatively scarce; most vehicles are gasoline vehicles, so the PM emitted by gasoline vehicles must be seriously considered. Fujita et al. [
11] and Gildemeister et al. [
12] studied the PM concentration emitted by gasoline vehicles in the Denver and Detroit regions of the United States. The results showed that three more PM emissions are generated by gasoline vehicles than by diesel vehicles. For this and similar reasons, the emission standards of gasoline vehicles have been raised repeatedly by relevant emissions regulations in different countries. In Europe, the Euro-6 emissions regulations stipulate a PM emissions limit of GDI engines (6 × 10
11 #/km) [
13,
14]. The emission standards of PM for GDI engines are rising in many countries. Therefore, how to reduce the PM emissions from GDI engines needs to be thoroughly studied.
Currently, the methods for reducing the PM emissions of GDI engines are mainly internal purification and exhaust aftertreatment systems (EATS). The principle of internal purification to reduce PM emissions is to take various measures to optimize the combustion process and accurately control the fuel injection, ignition timing, and other parameters, so that the gas mixture is more evenly mixed, the combustion is more complete, and more PM is directly burned in the cylinder, which in turn reduces the particulate emissions. Internal purification has high requirements for engine design and manufacturing and may increase the emissions of other pollutants when adjusting the in-cylinder combustion parameters; internal purification is very effective, but it is still not sufficient to meet stringent emissions limits.
1.2. EATS and Gasoline Particulate Filter
The principle of the exhaust aftertreatment method is to connect an aftertreatment device in the vehicle exhaust system to physically and chemically eliminate the PM in the exhaust gas. Three-way catalytic converters, four-way catalytic converters, particulate filters, etc. [
15,
16] are different EATS components used to reduce particulate emissions. Although the three-way catalytic converter has a certain effect on the soluble organic fractions (SOFs) in the particles, its processing ability is limited. The four-way catalytic converter actually combines an oxidation catalyst, particulate filter and NO
x reduction catalyst to form a complete EATS. At present, research on the four-way catalytic converter is still in the exploration stage. The gasoline particulate filter (GPF) is a porous medium that is utilized to capture PM in the exhaust.
The GPF has characteristics of a moderately high filtration efficiency, versatility, and flexibility and has been widely studied by researchers. At present, there are few models equipped with GPFs on the Chinese market, and only automobile companies such as Mercedes-Benz and Toyota are equipping their luxury models with filter devices. With the further popularization of GDI engines and the increasingly strict environmental regulations, the research and application of particulate filters for GDI engines will need to be deeply studied.
The performance of GPFs is mainly influenced by the monolith. Currently, silicon carbide (SiC), cordierite, aluminum titanate (AT) and foam metals are the most widely studied monolith materials, and these materials have been applied worldwide. Due to the different structural characteristics of the different filter materials, their filtration performance levels are also different.
Cordierite is well suited for GPFs during gasoline engine operation (rapid heating and cooling conditions), and it has good thermal shock performance and a low coefficient of thermal expansion. Other materials, like SiC and AT, due to their inherent high density and high heat capacity, are widely used in the high soot load applications that are typical of diesel. Compared with those in diesel engines, the smaller soot loads in GDI engines make cordierite the material of choice for GPF applications [
17], and cordierite has higher regeneration efficiencies and chemical robustness than SiC and AT [
18]. Moreover, cordierite can withstand the ash interaction of gasoline applications [
19].
The structural design of the GPF is very important, and designing sophisticated aftertreatment systems is extremely challenging when considering the efficacy and pressure drop of every device within a limited space.
To address the pressure drop, previous research on DPFs has focused on the filter monolith itself together with the deposited soot, which generates most of the overall pressure drop [
20,
21,
22]. The results can also be applied to GPFs. Methods of reducing pressure drop have been investigated from multiple perspectives, such as channel structure optimization, new material development, and particle deposition [
20,
21,
23,
24]. Some methods address the flow uniformity improvement in the monolith; however, flow management before the monolith has received scant attention in previous studies.
1.3. Connection Cone Optimization
The connection cone can affect the flow into the monolith, as the cross-section changes from the inlet to the monolith. A linear cone has been used as the simplest way to connect the exhaust pipes and the monolith. However, a linear cone with a large expansion angle will separate the flow and create a recirculation zone inside the cone, which deteriorates flow uniformity. The exhaust flow in a linear cone usually concentrates near the center, (approximately 88% of the flow passes through 53% of the filter cross-sectional area in certain case); accordingly, the researchers proposed a streamlined cone using a unipolar sigmoid function, which avoids the recirculation zone and increases the flow uniformity approximately 30% [
25]. The flow uniformity of other EATSs, like the catalytic convertor, has also been studied. An increase in both the inlet flow velocity and the expansion angle can worsen the flow uniformity [
26,
27]. Flow nonuniformity will decrease the monolith performance during the cold-start operations [
28].
To improve flow uniformity, flow-tailoring devices placed before the monolith have been studied to ensure a uniform flow distribution, but these devices cause the pressure drop to increase [
29,
30]. One special cone called the enhanced and diagonal (EDH) cone tube has shown promise for reducing the pressure drop, which makes the catalyst structure more compact and improves the flow distribution [
31,
32,
33]; however, the tube also requires a relatively large installation space. Reducing the cone expansion angle represents another method of improving the flow distribution [
34]. Moreover, the monolith has an installation limit, and if it is close to the engine, it can lead to highly nonuniform flow behavior [
35,
36], which will affect the monolith performance.
1.4. NURBS Cone Application
The streamlined (nonuniform rational B-splines, NURBS) cone’s improvement of the flow uniformity has been verified from previous experimental results, and the overall pressure drop of the test system can be reduced up to 12% in a special case [
37,
38]. Simulation results revealed significant changes to the flow structures before the monolith, which illustrates the value of the NURBS cone.
The influence of the cone on the monolith flow distribution and the pressure drop has been researched both experimentally and via simulation [
38]. However, its influence on the particle distribution has rarely been studied through experiments because it is difficult to obtain a precise and stable test bench, and the use of simulations makes the study more convenient and safer. However, during full-scale simulations, the detailed geometry and flow inside the monolith must be described in a coarse, averaged manner to make the simulations feasible. For example, the parameters to define the monolith in the commercial computational fluid dynamics (CFD) software contain the viscous resistance and void fraction, but the inertial resistance is often ignored [
39], and the three-dimensional passage from the inlet to outlet channels is typically unresolved. Experimental results, on the other hand, innately account for all relevant factors and can thus be used to establish correction factors and subgrid models for the validation and verification of the simulation procedures. To obtain accurate data inside the monolith from a full-scale simulation, experimental results are required to make the simulation data more credible, especially for a newly designed cone.
In addition to flow uniformity and pressure drop, the connection cone can also affect the regeneration temperature, which is highly relevant to the particle distribution. E et al. contrasted three different cones to the same DPF, and the distributions of the radial and axial temperatures were detected [
40]. The researchers found that the cone had a lower temperature gradient with better flow uniformity. It could be concluded that such a cone would have a longer service life.
Thus, the cone’s influence on the particle distribution needs to be determined. There is also a trend for aftertreatment devices to be more compact; therefore, how to save space and make more efficient use of the filterability should also be considered in cone optimization. In addition, NURBS cones can be applied not only to GPFs but also to other devices. With the improvement of manufacturing, the NURBS cone can be promoted in the future.
2. Experimental Setup and Test Procedure
2.1. Setup
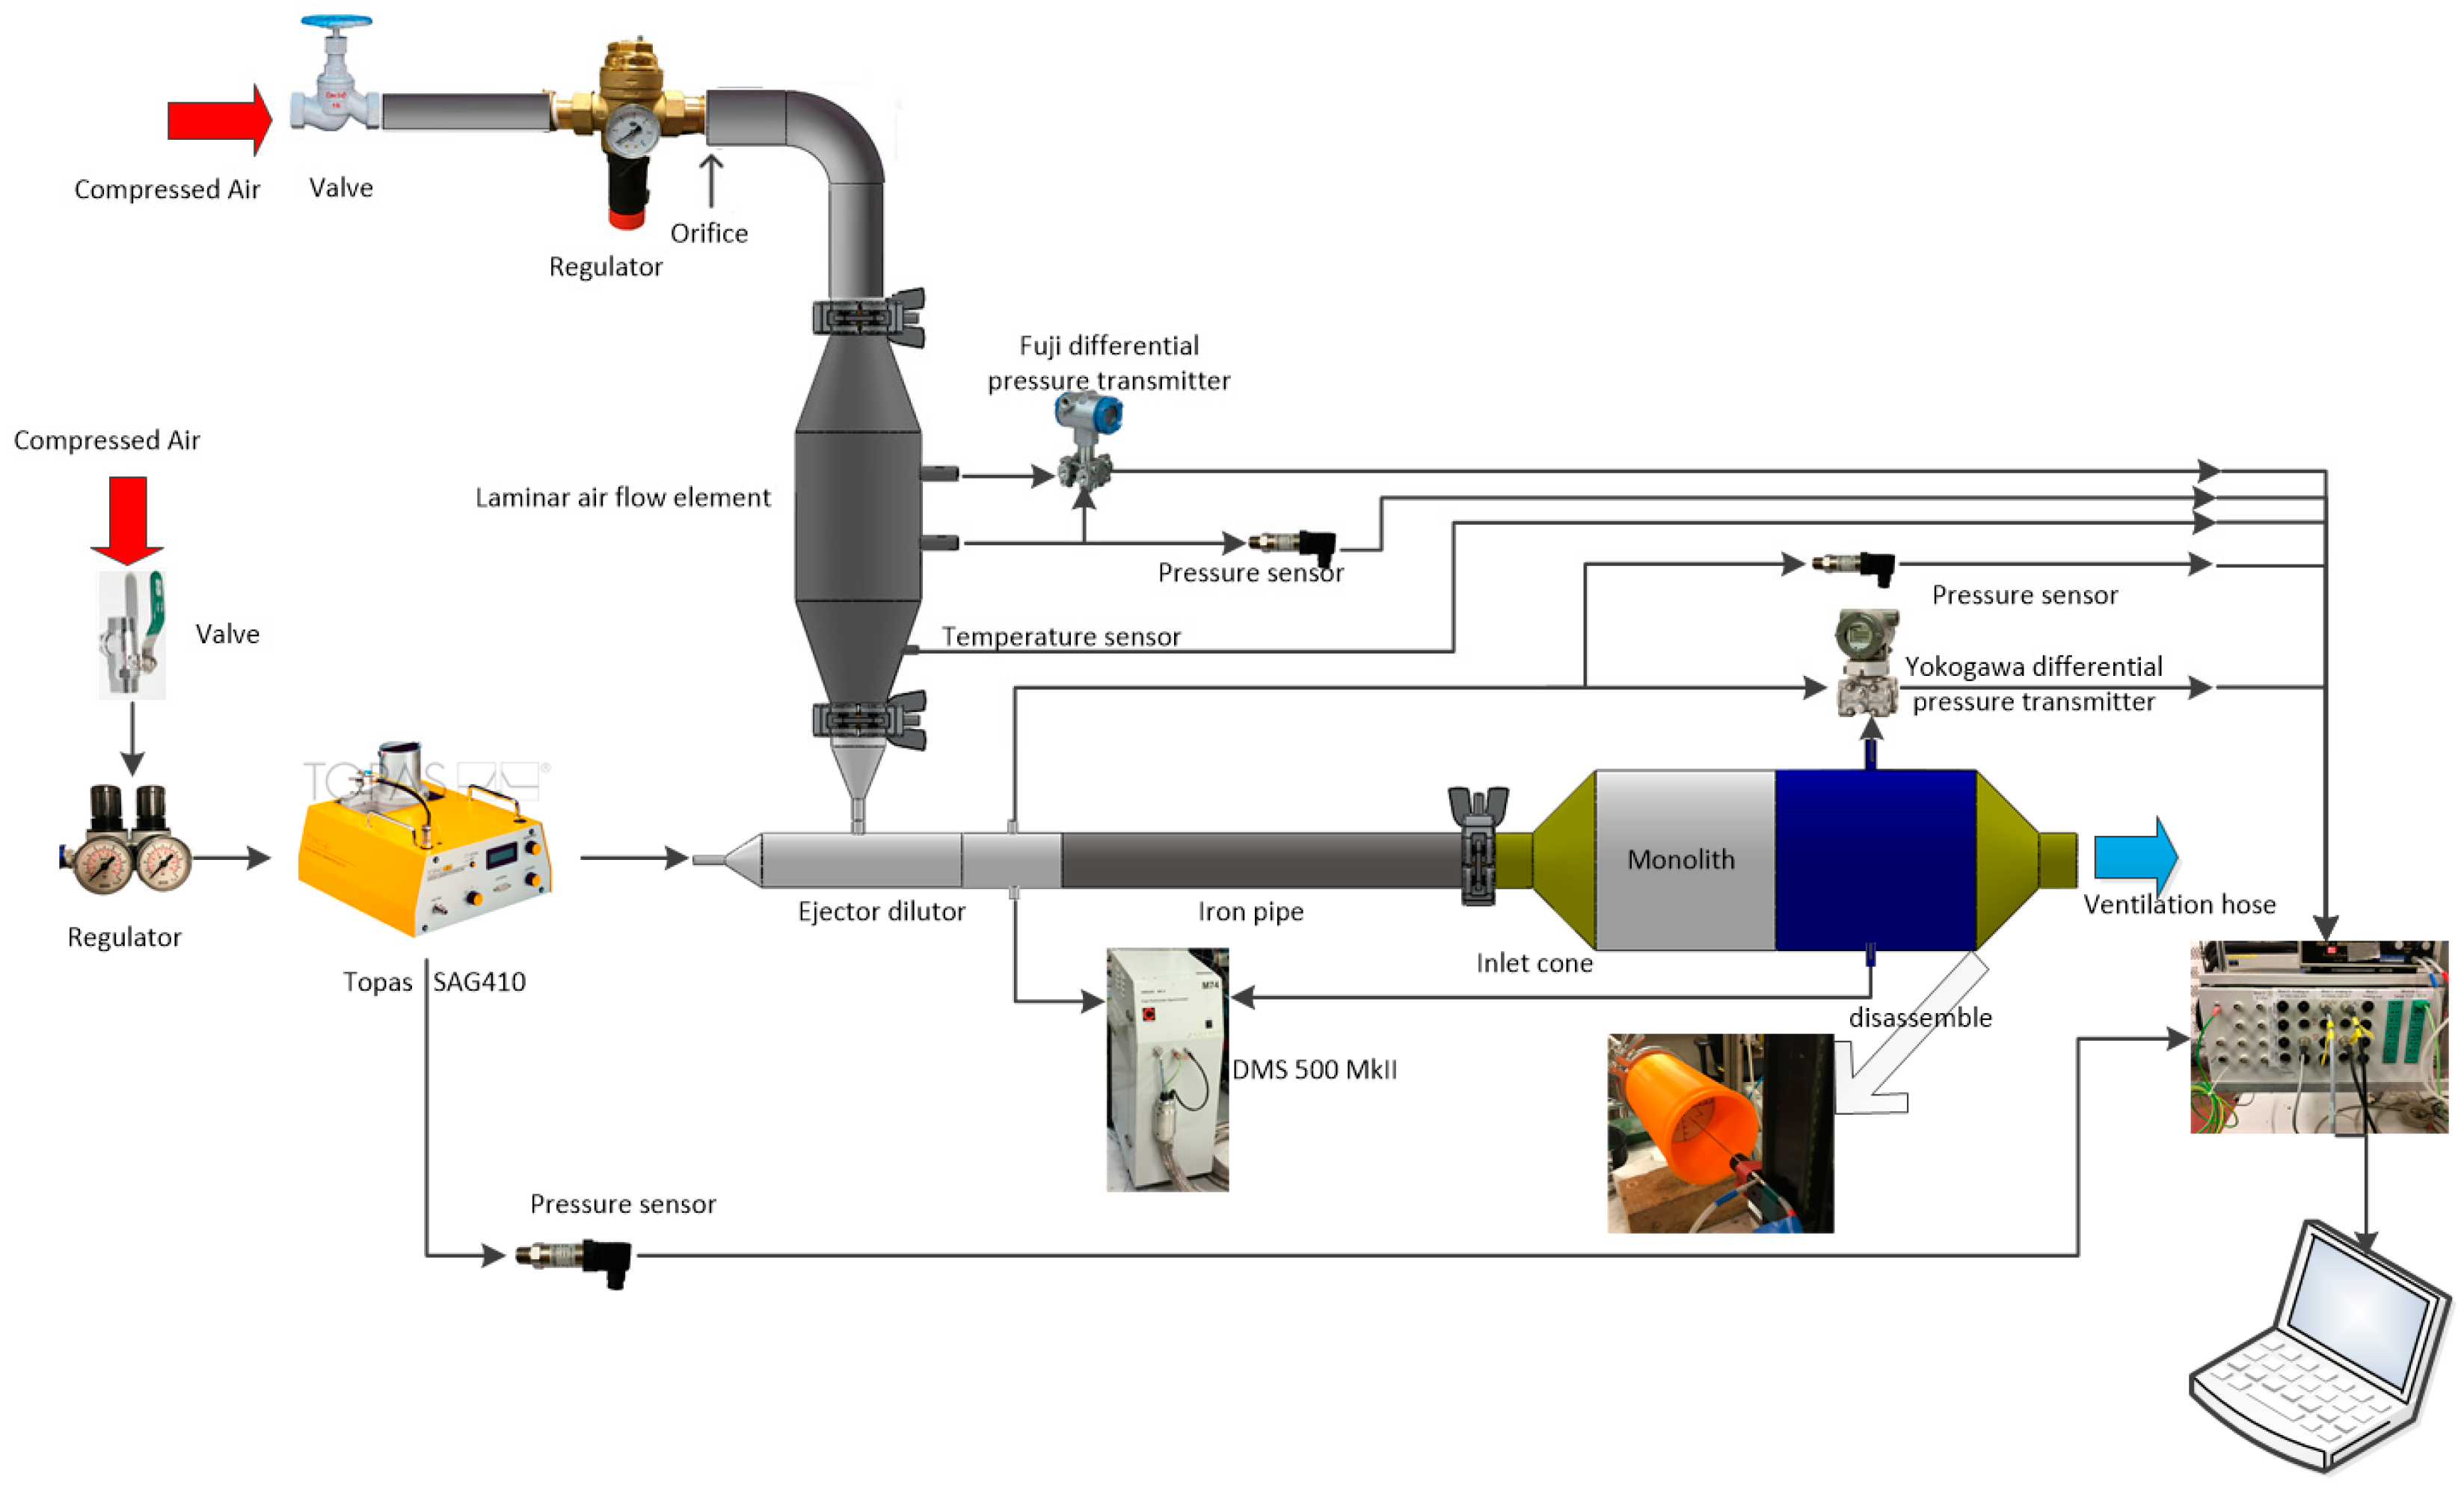
Figure 1 shows the particle loading and velocity measurement system, which was similar to the system described in our previous paper [
38], contained a gas source system, operation part (monolith and inlet cone), data acquisition system, ventilation system, and an extra particle source system. The gas source system provided the gas needed in the experiment, and included the compressed air, pressure regulator, laminar air flow element, and the ejector dilutor. The data acquisition system included the pressure transmitters, pressure sensors, Prandtl tube, fast particle analyzer DMS 500, and the links to the laptop. The ventilation system included the hose, the fan and the filter inserted in the hose; the particle source system provides the particle aerosol in the system, connected with the gas source system by the ejector dilutor, including the compressed air, pressure regulator to control the flow, and the Topas Solid Aerosol Generator (SAG) 410 to produce the particle aerosol. To determine the influences of the cones on the particle distribution in the equilibrium state, the gas and particle source needed to be easy to control, the cones to be easily replaceable, the system needed to have no leakage during particle loading for safety and health considerations, and the Prandtl tube sensor had to be easy to move to different locations. The experimental equipment with focus points are listed below.
2.1.1. Gas Source
In the laboratory, a flow restrictor and a laminar air flow element (Tsukasa Sokken, LFE-50B) were used to control the compressed and dried air. A differential pressure transmitter (Fuji, FKC-5) and one pressure sensor (VEGA, VEGABAR 14) were connected to the laminar air flow element.
The compressed air provided stable gas flows at different velocities. The pressure regulator controlled the volumetric flow into the monolith. An orifice with a diameter of 4.2 mm was inserted between the laminar air flow element and the pressure regulator to reduce the flow passing through. The laminar air flow element provided uniform flow. Then, the air was blown into an injector dilutor to mix the particle aerosols from the particle source system.
2.1.2. Particle Source
The components of the particles (soot) were influenced by the types of engines, fuels, and operating conditions, and carbon black (Printex-U, PU), which has been widely used as a commercial diesel and gasoline soot surrogate due to its repeatability [
18,
41,
42,
43,
44]. In this study, the focus was on the cone’s influence on flow field with particle deposition, the particle size’s influence on the flow filed is not involved. However, the precious papers about the particle oxidation all using the standard size carbon black, and the authors also will proceed to thermal study in the future, for the convenience of the continuity, repeatability, and the comparison with previous papers, a carbon black the same size as those in the reference papers was chosen in this study. The physical properties of the carbon black (supplied by Orion Engineered Carbons) are summarized in
Table 1.
The particle aerosol was generated in the Topas Solid Aerosol Generator (SAG) 410, which also needed compressed air. The concentration of the aerosol could be adjusted through the feeding unit speed and the injection pressure in the Topas SAG 410.
The particle aerosol was mixed with the air from the laminar flow element in the ejector dilutor, after which a differential pressure transmitter (Yokogawa, EJA110E) was connected to measure the pressure drop between the ejector dilutor and ventilation hose, and another pressure sensor (VEGA, VEGABAR 14) was used to measure the absolute pressure change. Then, the mixed gas passed through the steel pipe and reached the cone and the monolith.
2.1.3. Inlet Cone
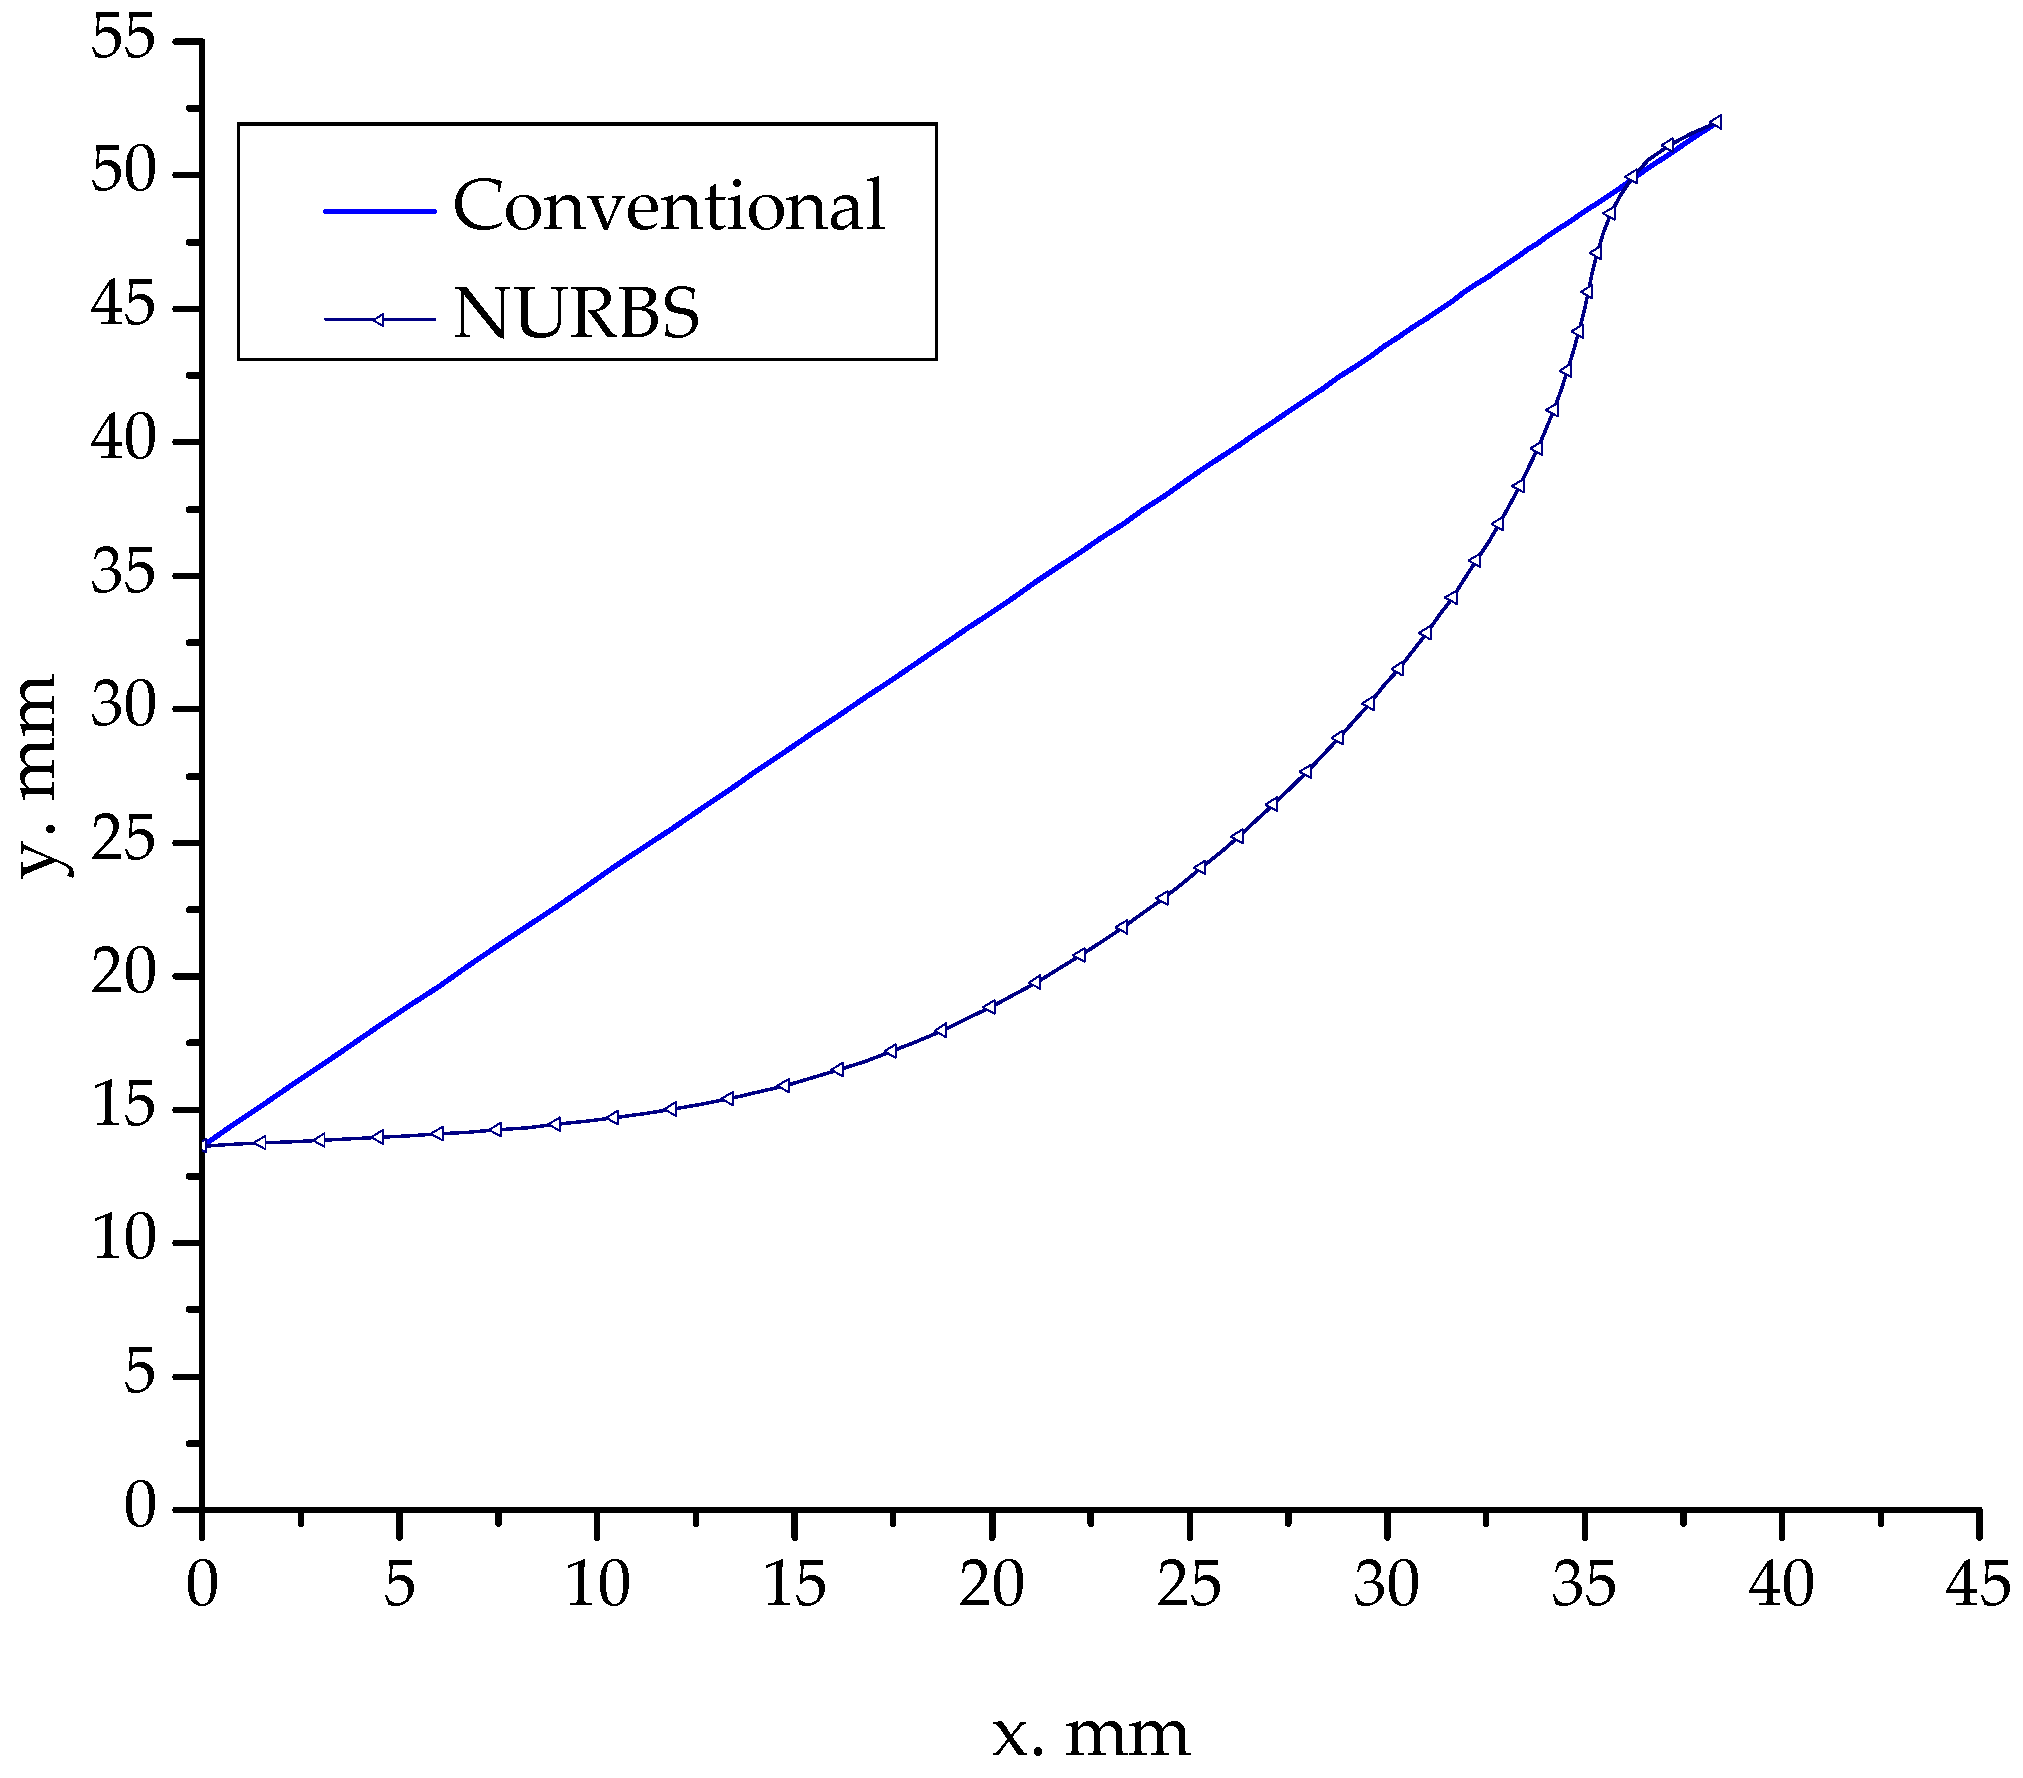
Two inlet cone shapes were employed: conventional and NURBS. The conventional cone was a straight linear cone, and the NURBS cone was the streamlined cone. The shape of the NURBS was drawn by choosing points along the flow lines from the convention cone simulations in drawing and meshing software (Gambit 2.4.6) [
38].
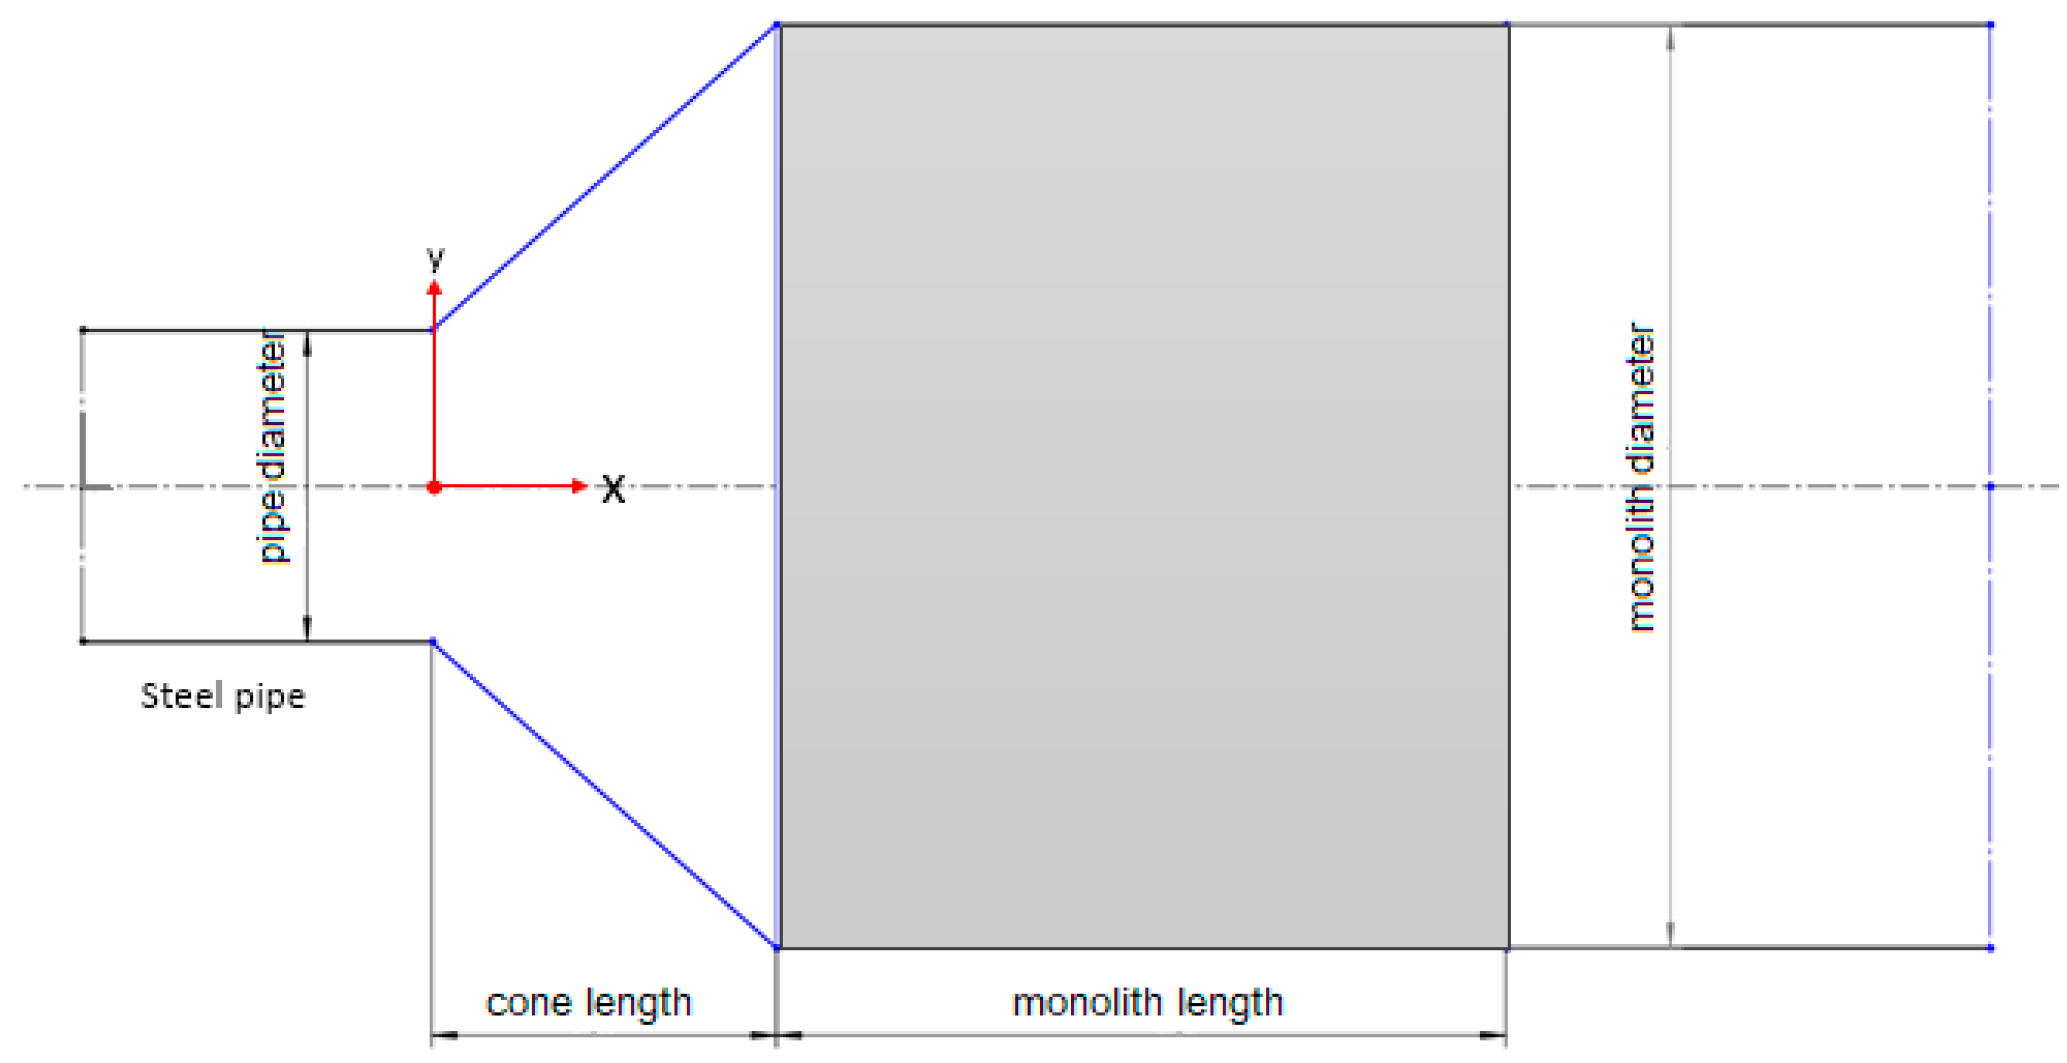
Both cones had
d = 27.3 mm and
D = 104 mm and an expansion angle, α, of 45°. To fit the monolith and steel pipe, the two cones were manufactured via 3D printing, as shown in
Table 2, and the shape of GPF is shown in
Figure 2. The cone shapes are shown in
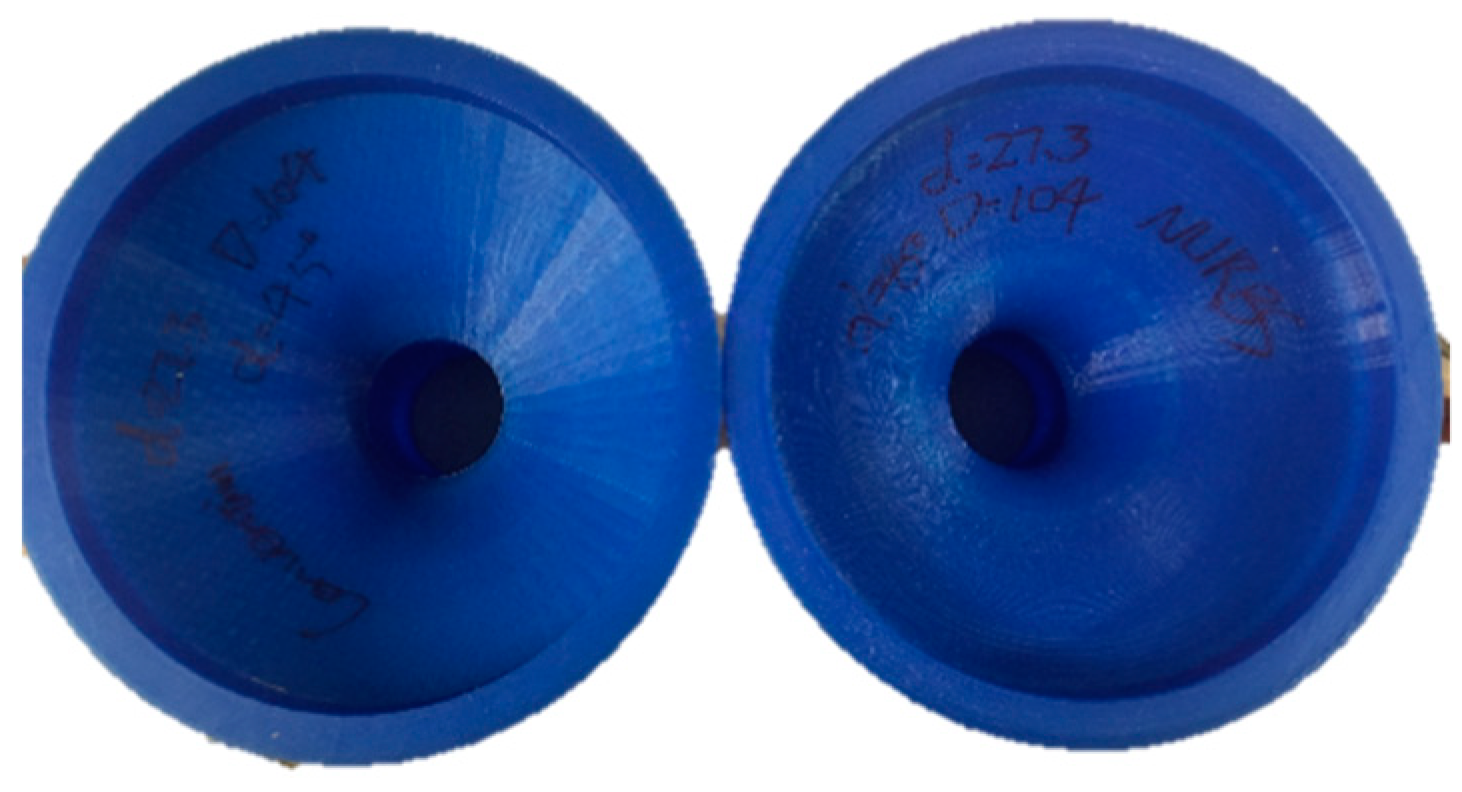
Figure 3, and
Figure 4 shows the printed cones. The NURBS cone occupied a smaller volume.
2.1.4. Monolith
The GPF monolith used in this work was made of cordierite without any catalytic coating from Corning Inc. The properties are shown in
Table 3.
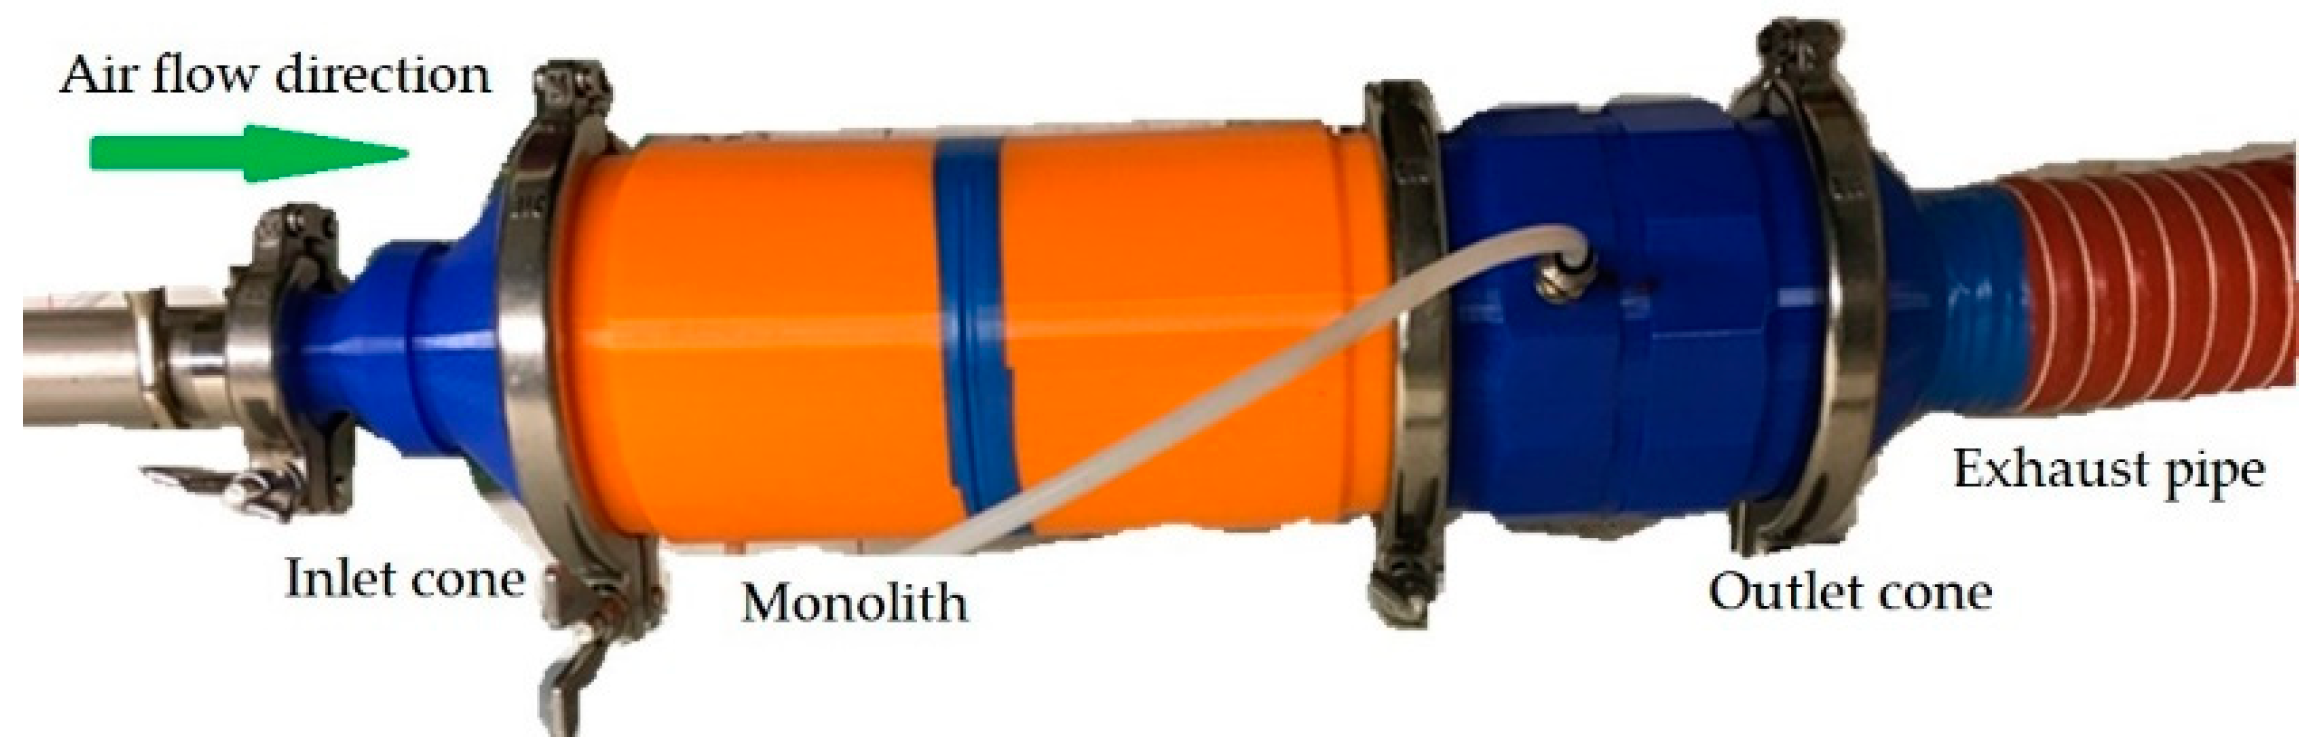
After the monolith, the mixed gas-particle aerosol traveled through a straight pipe and then a contraction (outlet) cone, as shown in
Figure 5. Before being emitted into ambient conditions, the mixed gas was filtered by an additional particulate filter in the exhaust pipe (ventilation hose) to ensure that there was no particle leakage. A differential pressure transmitter (Yokogawa, EJA110E) was connected between the ejector dilutor and the monolith to measure the pressure drop.
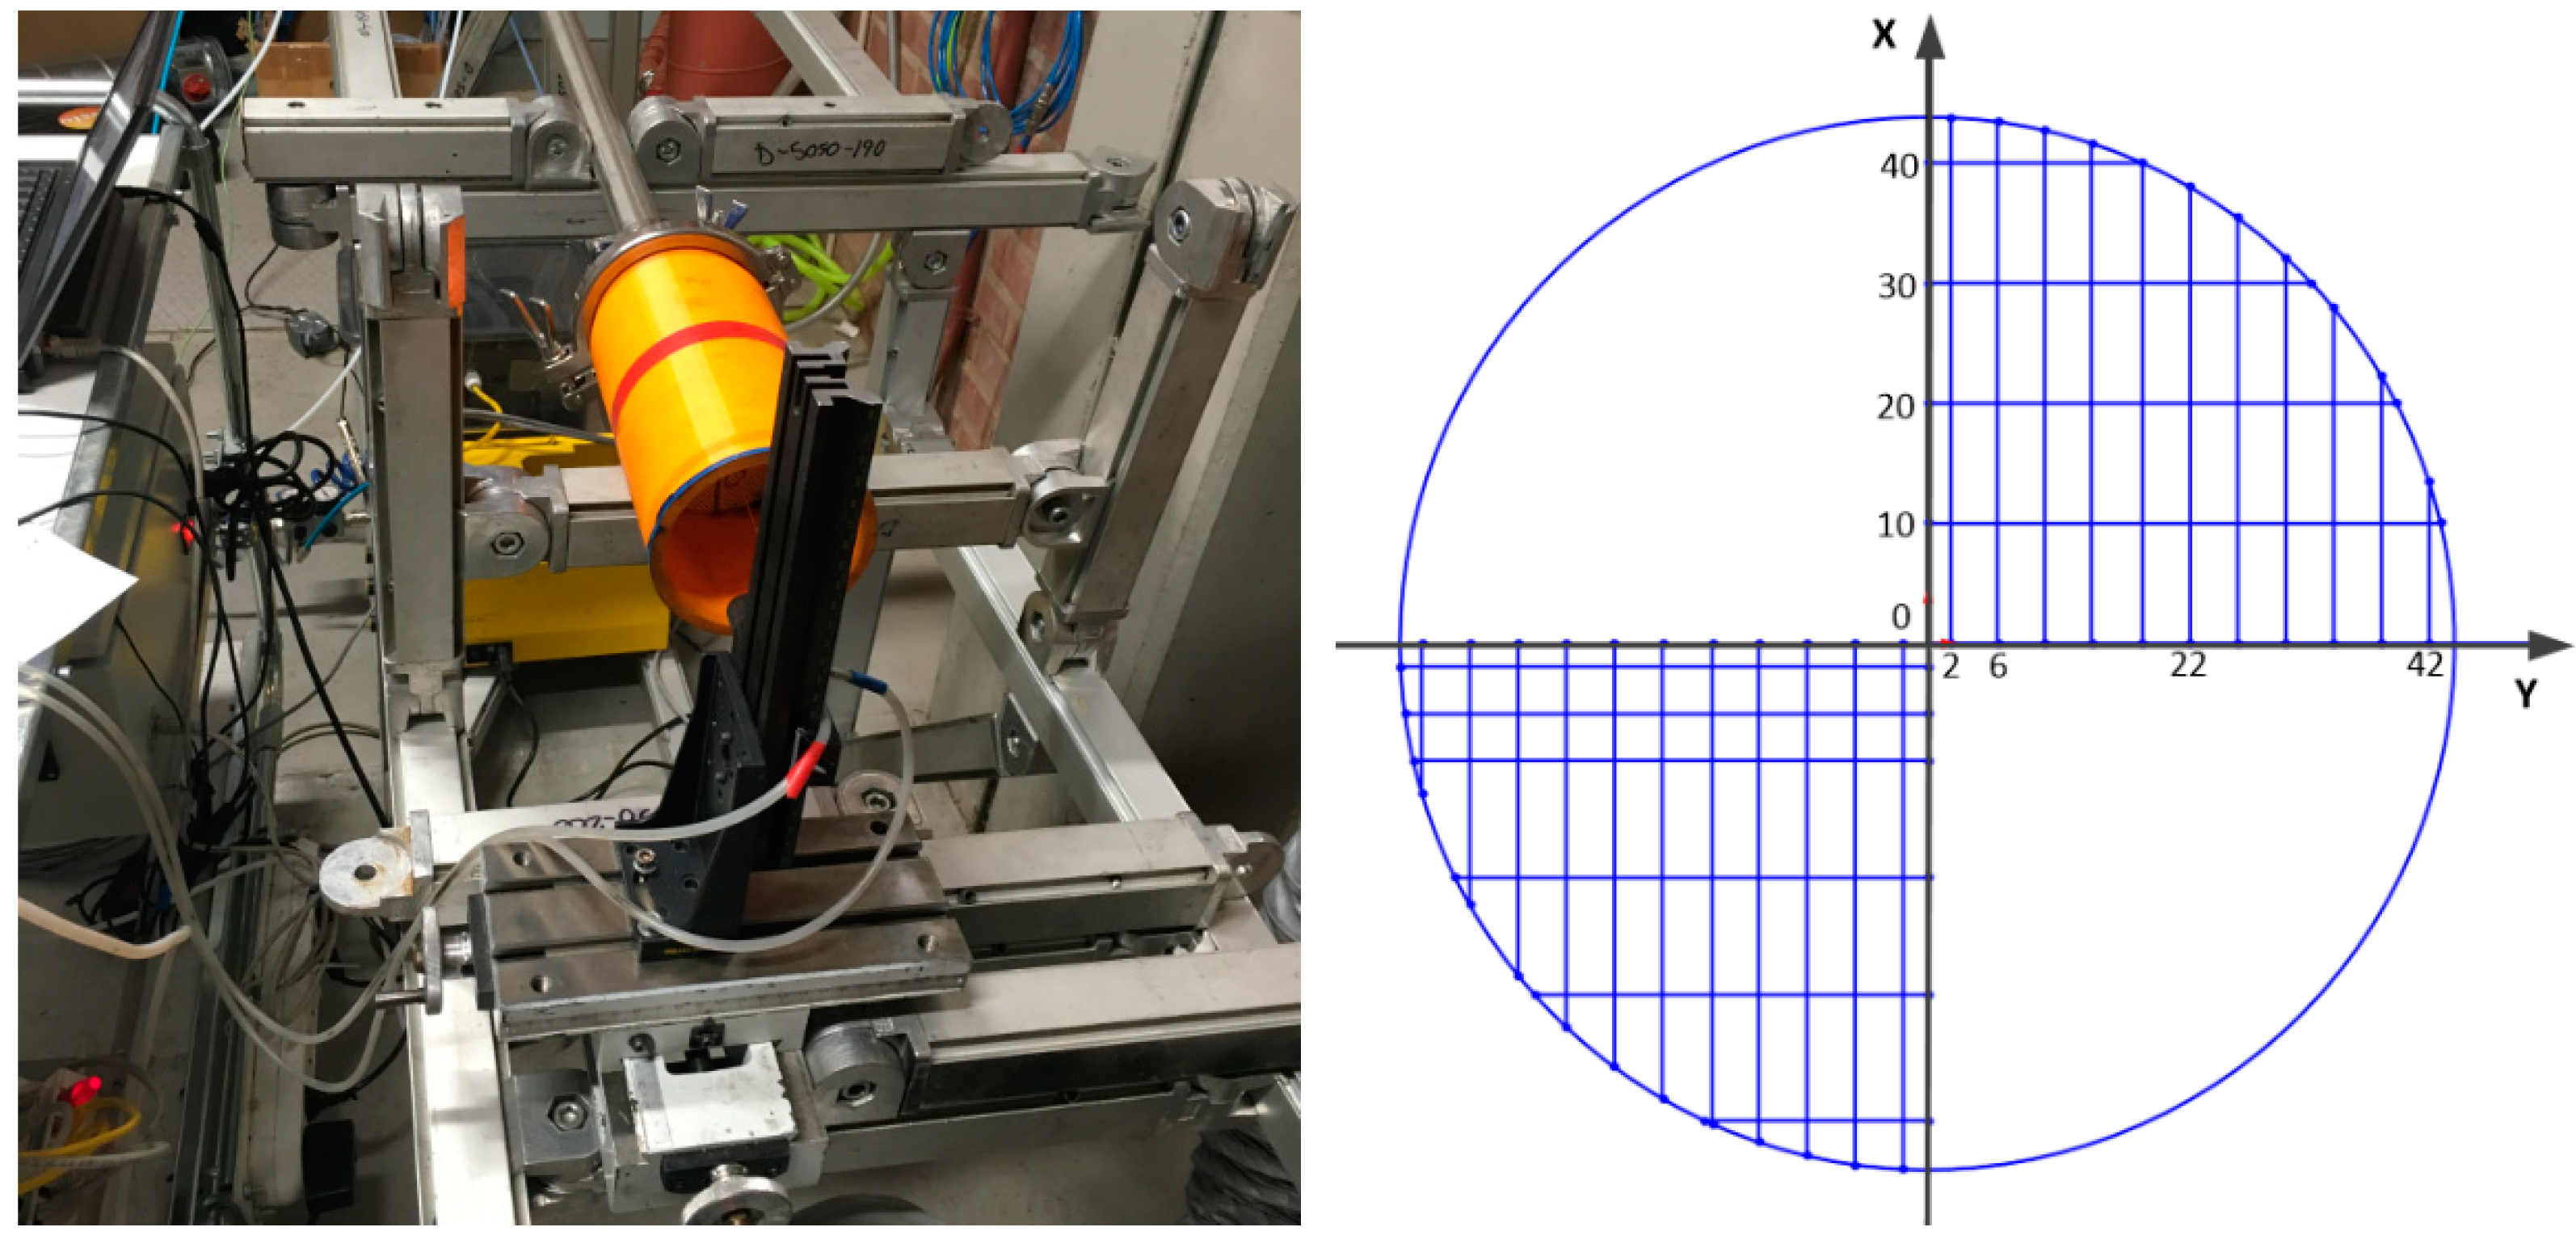
When the particle loading stopped, the contraction cone was dismounted. A Prandtl tube was used to measure the velocity at the outlet surface of the monolith, and it was connected to a micromanometer (Furness Controls, FC014) to collect data. The distance between the outlet surface and the position where the data was collected was 40 mm to avoid disturbances from the sampling channels. The data were recorded by LabView (National Instruments).
2.2. Experimental Method
The experiment included two parts: particle loading and velocity measurement.
During particle loading, the entire experimental system was sealed to ensure no particle leakage, and pressure drop change data were collected. After a certain length of time, the particle injection was stopped but the compressed air was kept on, the outlet cone was dismounted and the velocity measurement was started. The weight of the monolith was used to determine the amount of particles deposited inside the monolith.
The center on the cross section was chosen as origin of the coordinate system. When the particle injection was stopped, the Prandtl tube will follow the sampling positions in the first quadrant shown in
Figure 6. Certain measurement points in the third quadrant were repeated to ensure that the flow was symmetrical and that the data were reliable. The sampling position was set at 40 mm from the monolith outlet to avoid variations and noise [
38].
Three different velocities were studied to evaluate the effects of different flows, and 6 experimental cases were performed. The total weight of each case is shown in
Table 4. Due to the operation variability of the SAG 410, the total weights were different.
To measure the particle size distribution during the particle injection, a Cambustion DMS 500 MkII fast particle analyzer was used in this experimental investigation and connected to the same position as the Yokogawa differential pressure transmitter. The DMS 500 has a built-in dilution system with two diluters: a primary diluter and a secondary diluter. The temperature in the primary dilutor was maintained at the maximum (150 °C) during sampling, and the secondary dilutor was operated at a factor of 1 to maximize signal strength. To obtain a time averaged value of the capture efficiency, sampling was done repeatedly before and after the GPF.
The capture efficiency (CE) is defined as [
45]
where
and
are the time-averaged particle size distributions before and after the GPF.
The measure of uncertainty (of CE) was calculated as
where
X = (
–
) and
Y = 1/
.
3. Results and Discussion
3.1. Pressure Drop
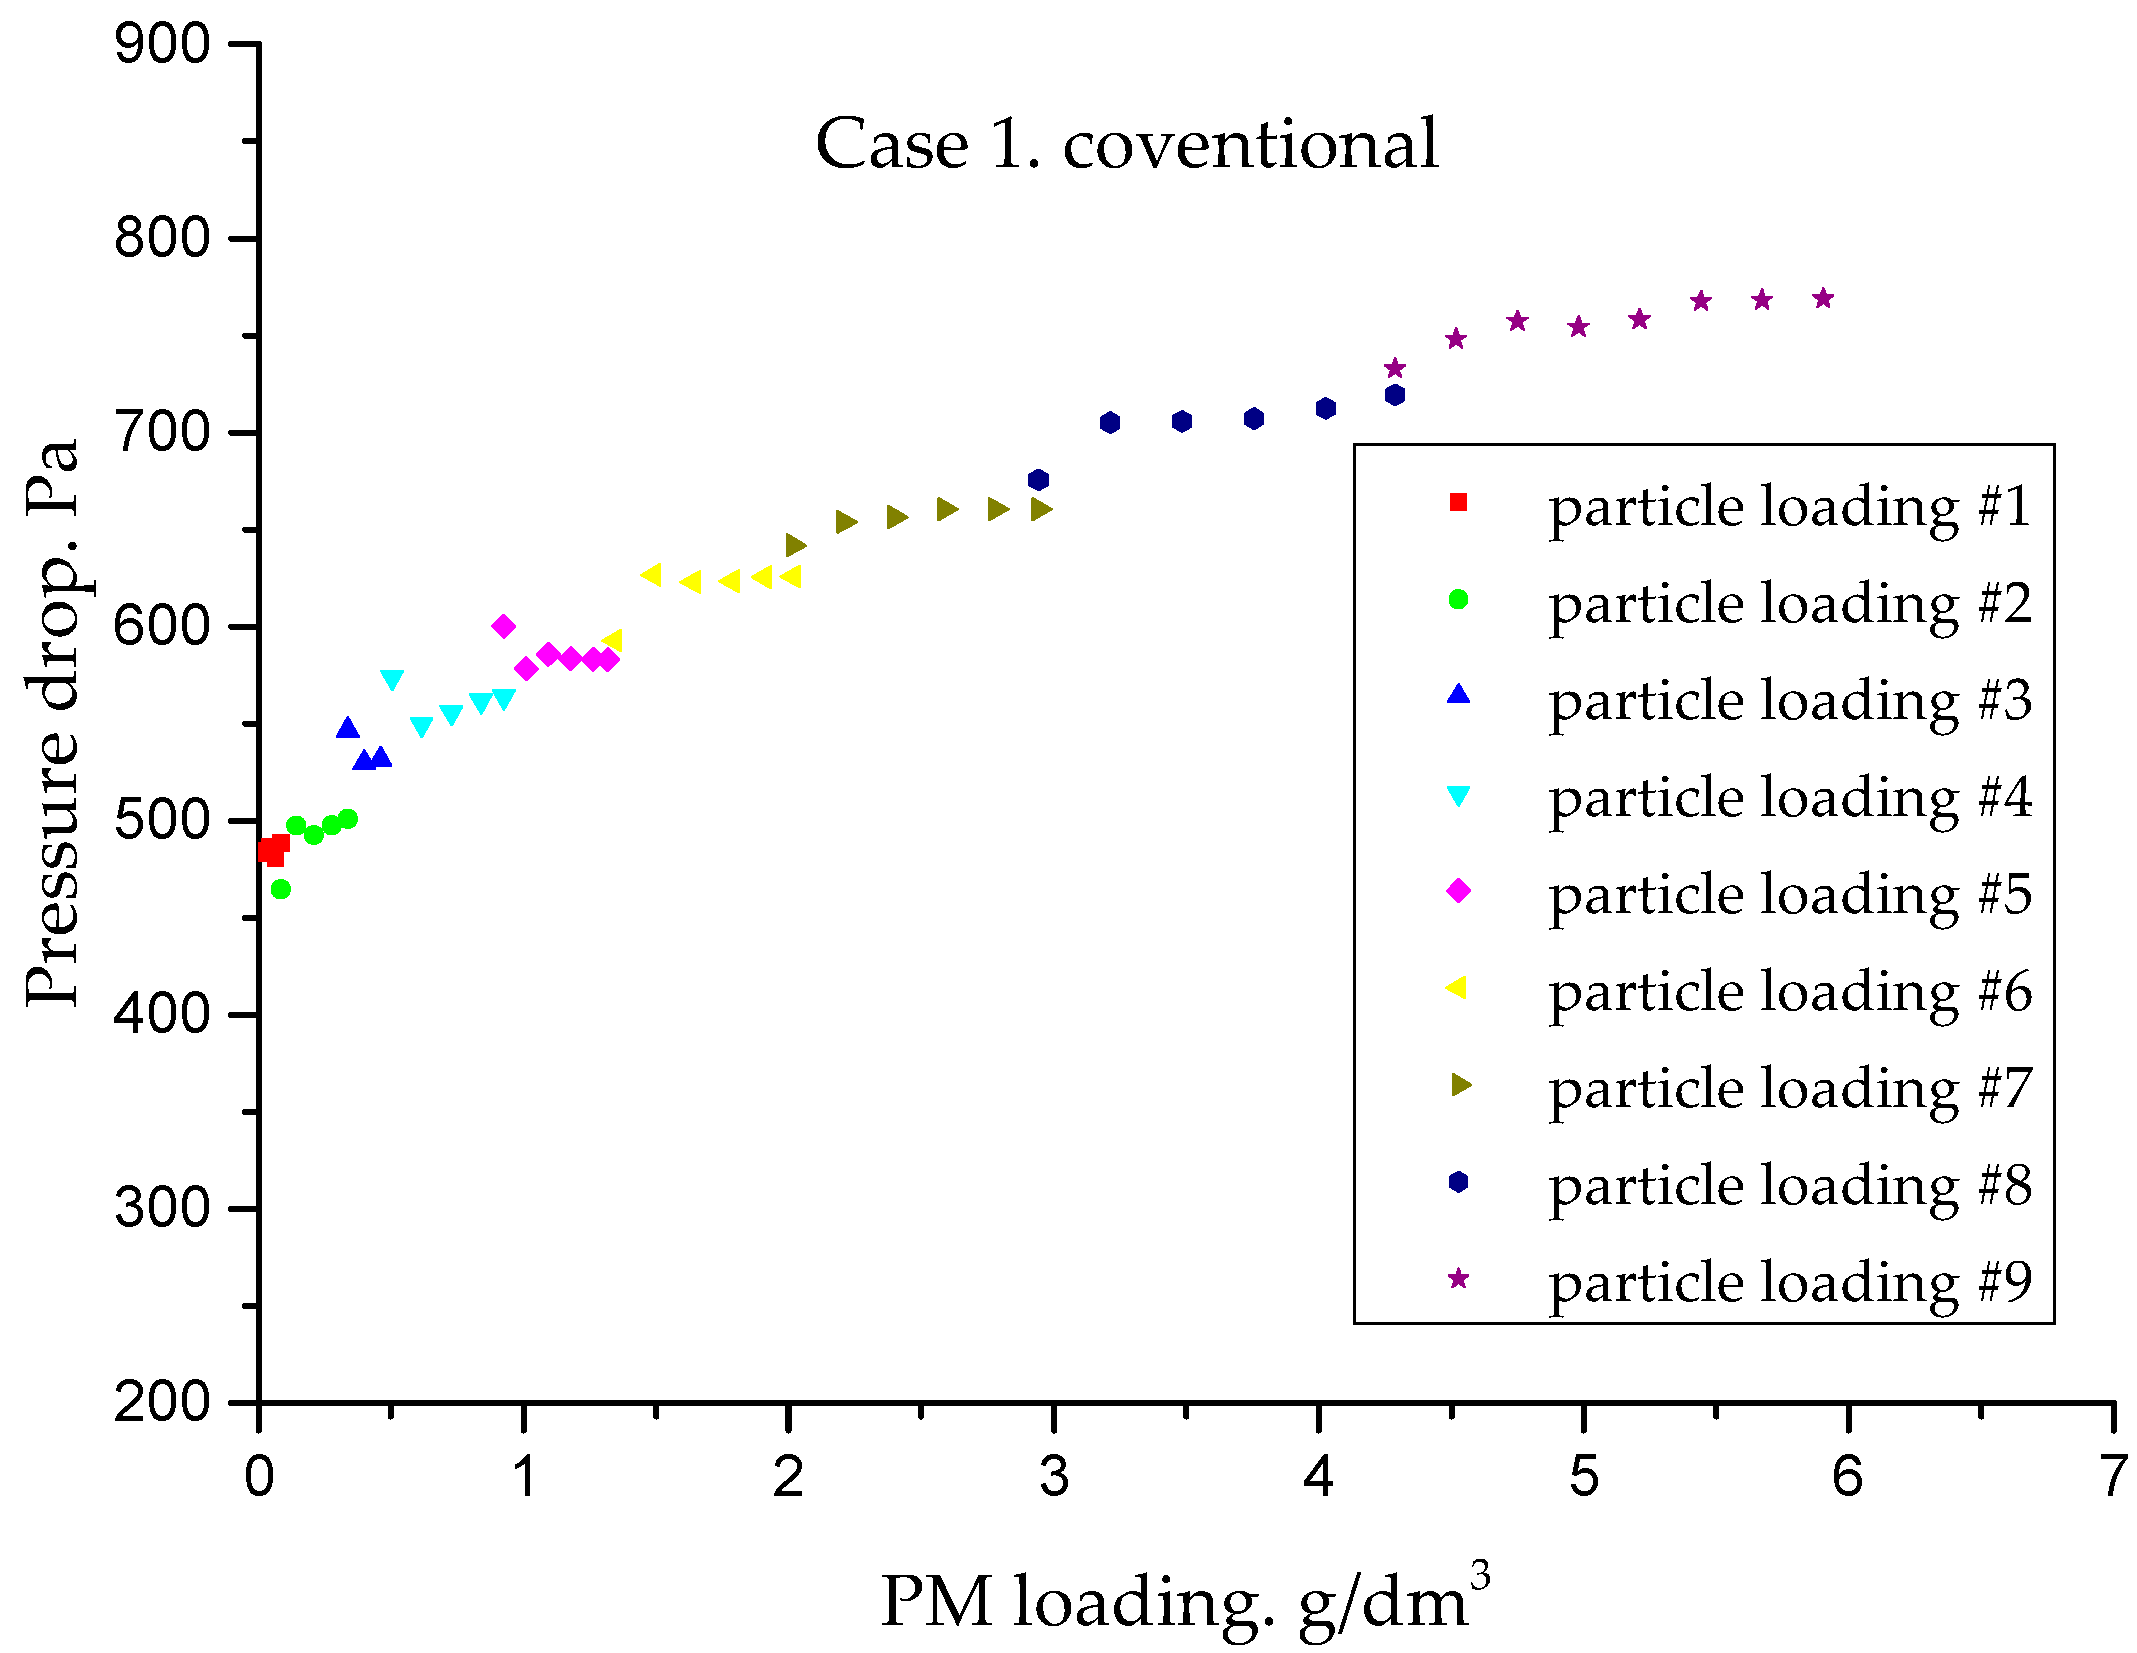
The pressure drop was measured by the differential pressure transmitter. Taking case 1 as an example, the particle injections were split into 9 segments, hundreds of data were recorded and the collected data are shown in
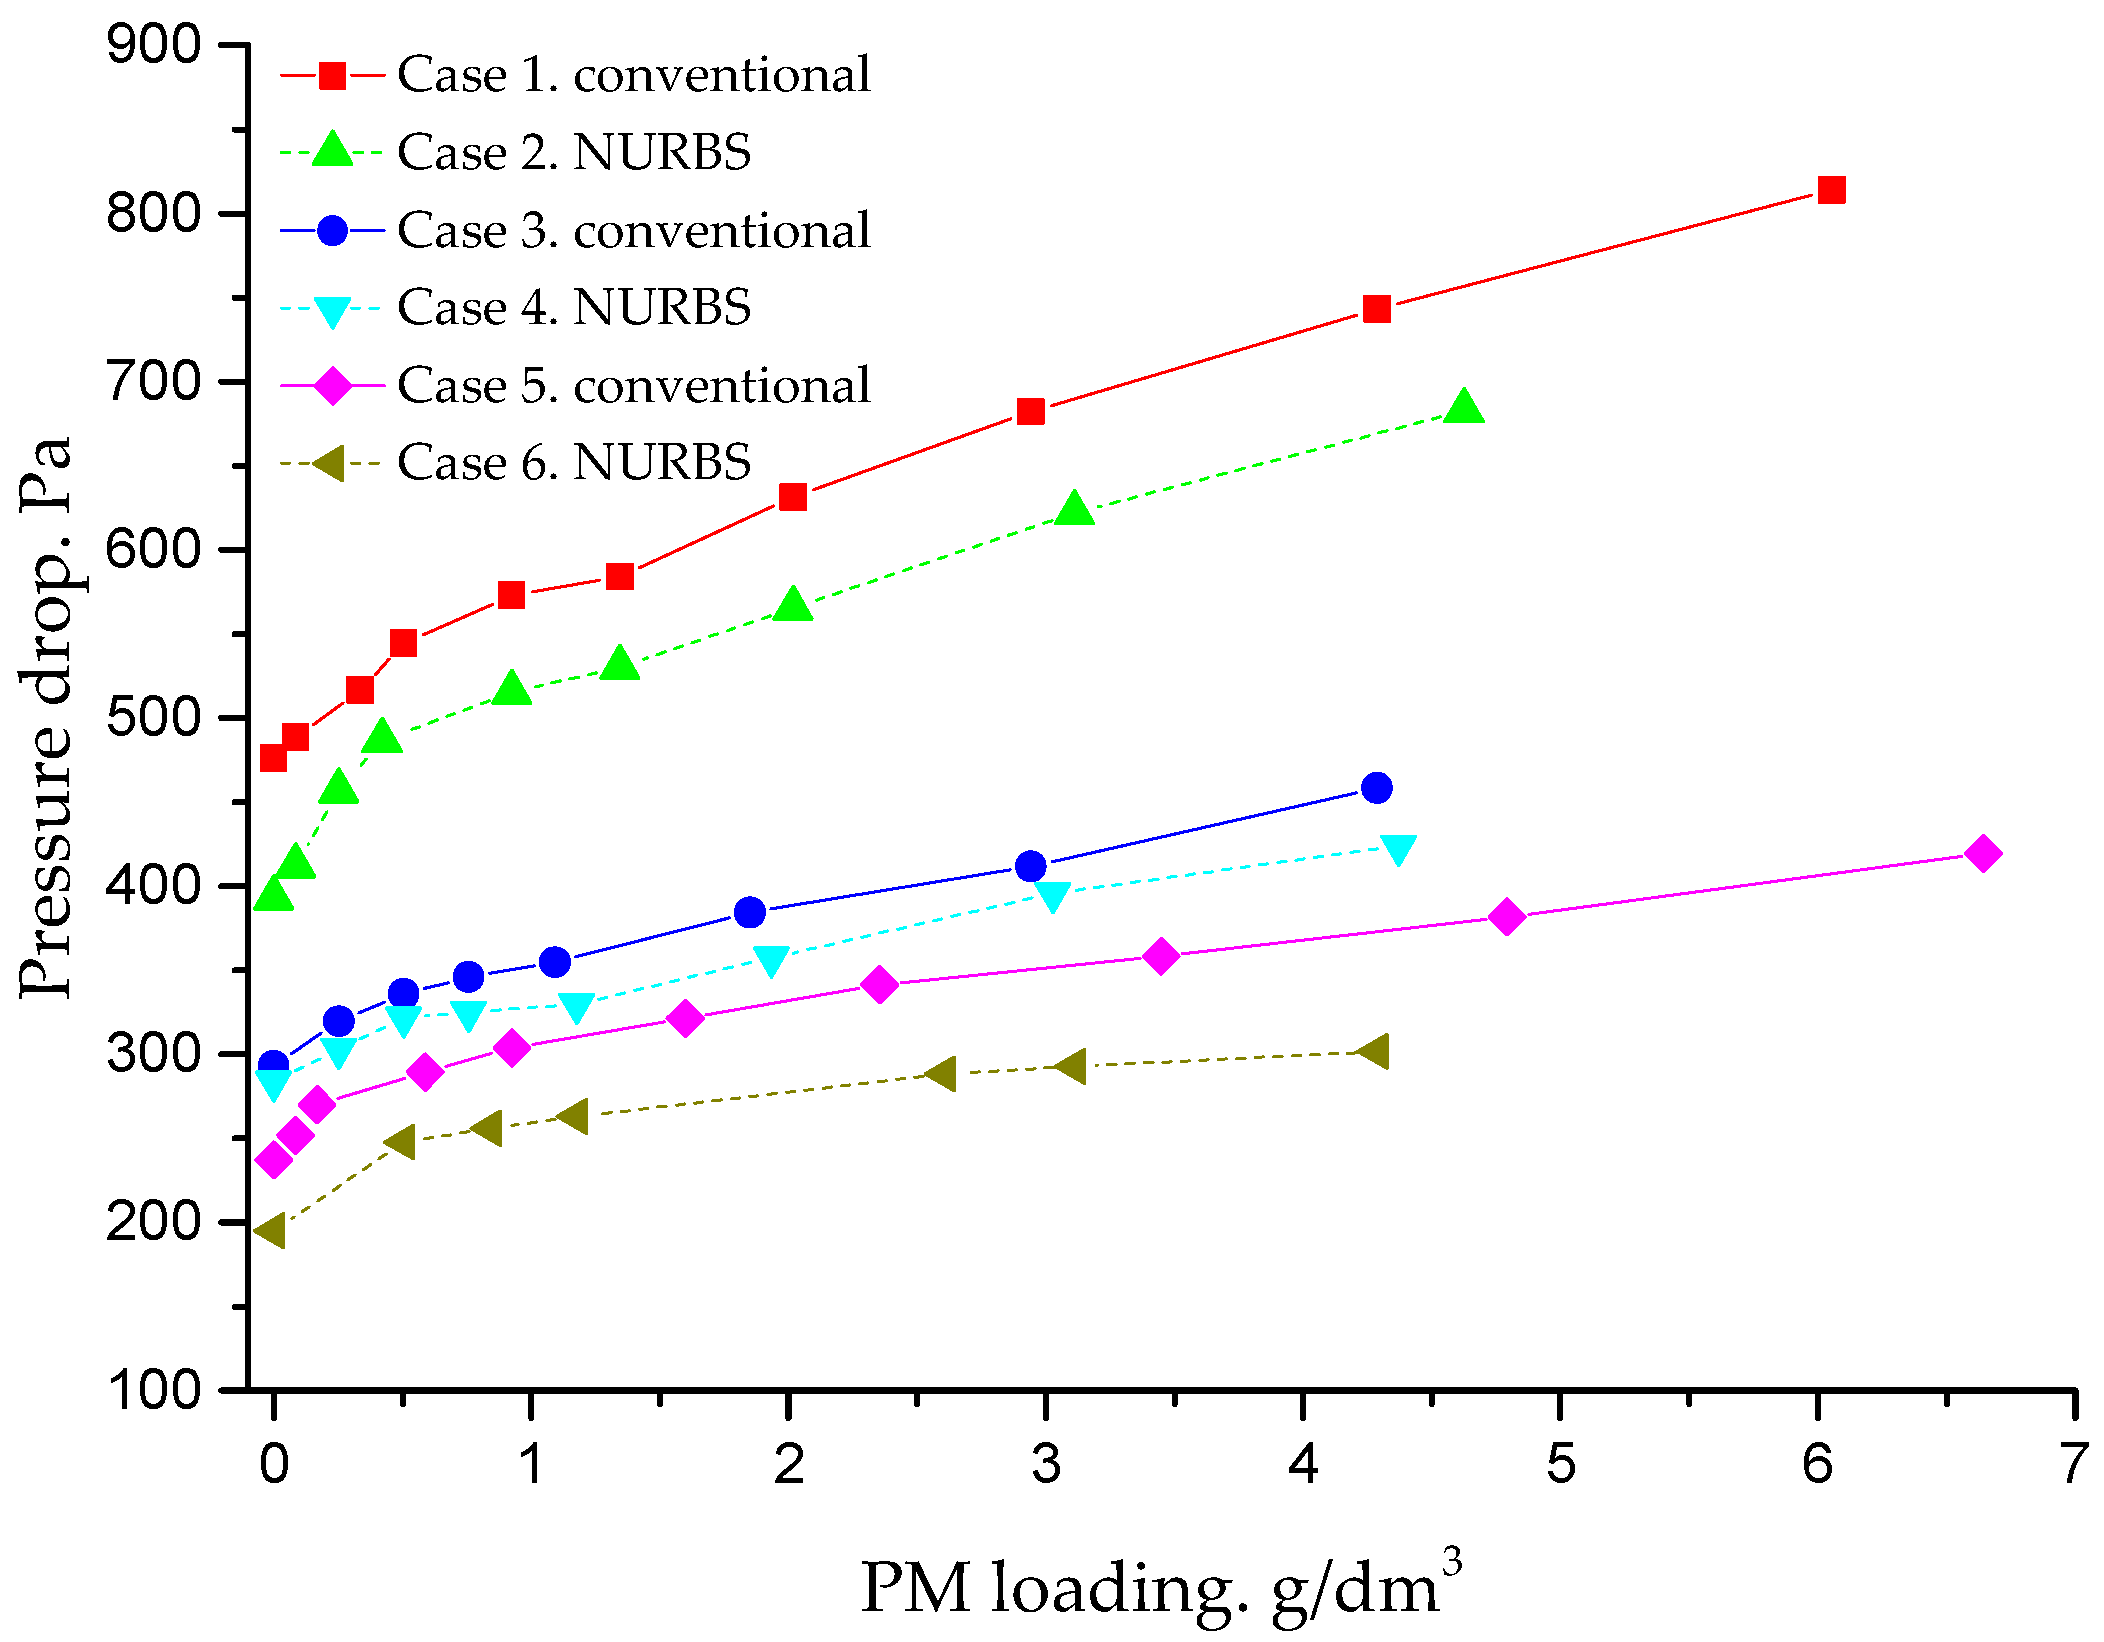
Figure 7 using of a moving average; PM loading is the total weight of deposited particles in the monolith, divided by the monolith volume. The average pressure drop after injection was measured each time to compare with all cases shown in
Figure 8. The slope change of pressure drop was obtained clearly after 1 g/dm
3 accumulated, which means the filtration phases changing from ‘deep bed’ to ‘soot cake’.
Table 5 shows the pressure drop per unit of volumetric flow when there was no particle injection. During measurements acquisition, the volumetric flow was obtained by the integrating the measured velocity over the cross section. Upon comparing case 1, case 2, case 3, and case 4, the NURBS cone can generate a smaller pressure drop per unit of volumetric flow. However, case 6 shows different results: the NRUBS cone has a large pressure drop. One reason is that the cone is designed at higher velocity [
38], and the other reason is the error when calculating the volumetric flow.
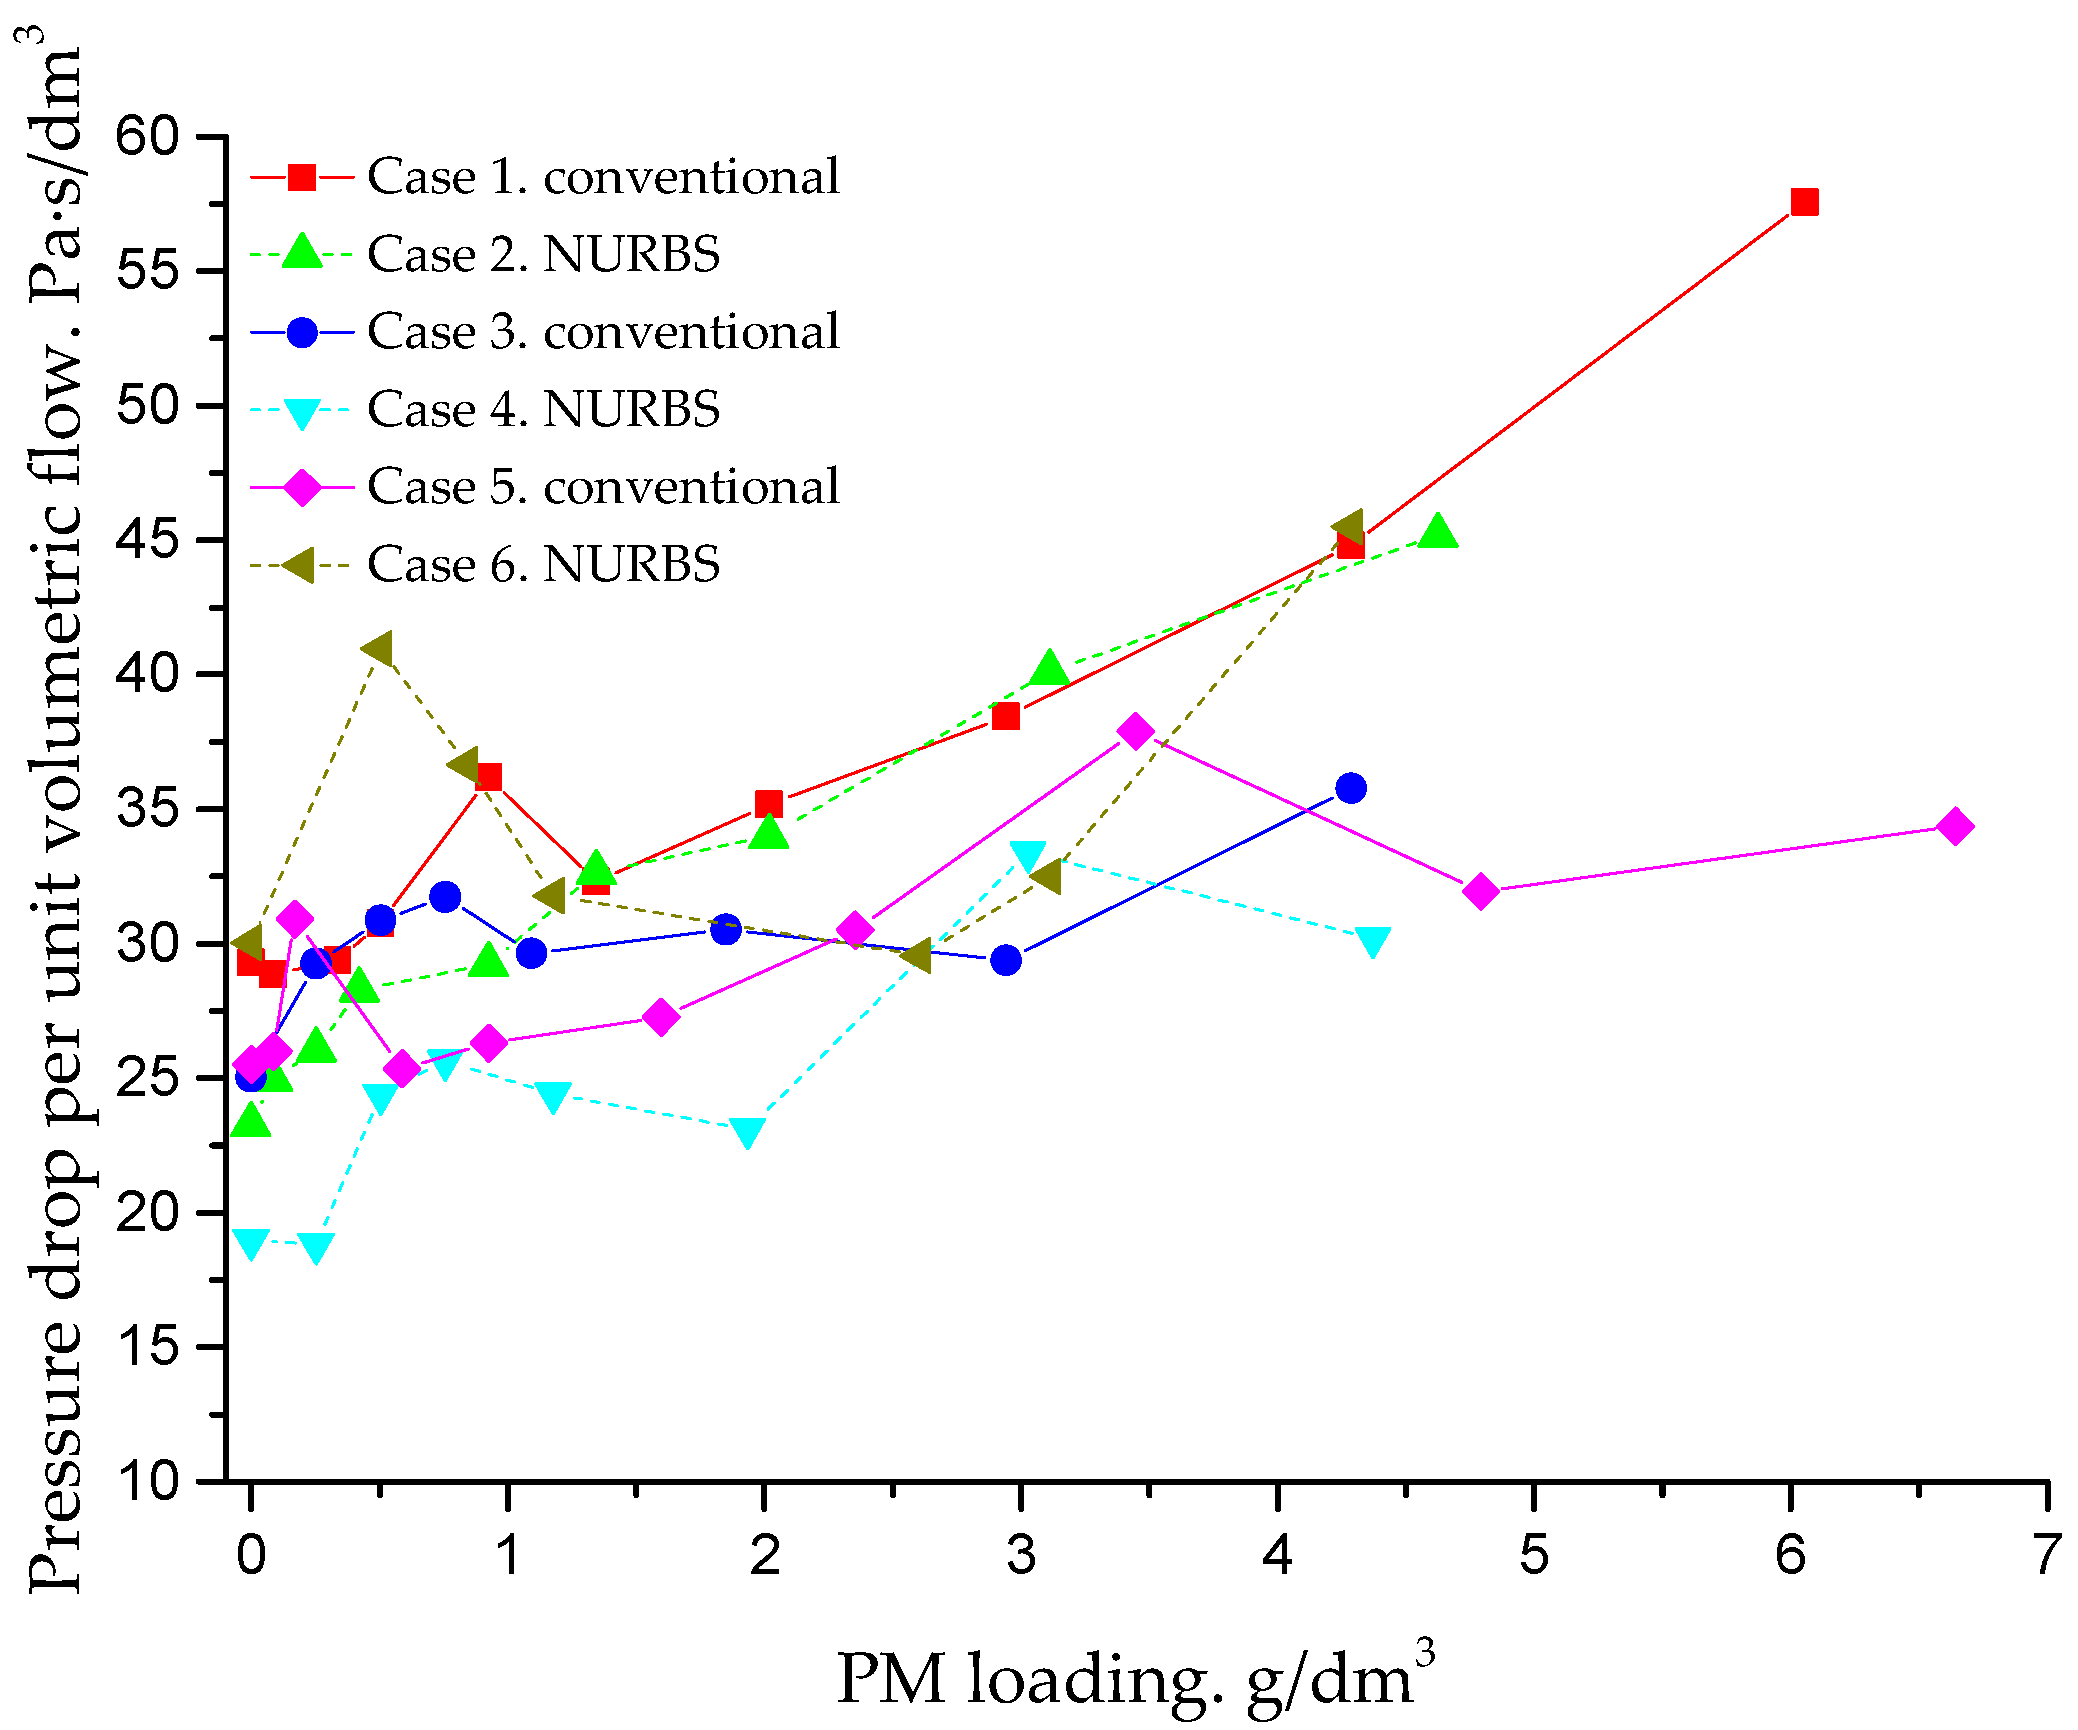
Figure 9 shows a comparison of the pressure drop per unit of volumetric flow during particle injection. Before 1.5 g/dm
3, the NURBS cone shows a small value except in case 6, and fluctuating values were observed during the whole injection, which is also attributed to the error introduced by the integration.
We can see that the NURBS cone has a lower pressure drop at low PM loadings, but the reduction is different for each case. For the comparison of case 1 and case 2, the reduction ratio at 0.92 g/dm3 is 10%, while the value is 17% with a clean monolith. Case 3 and case 4 show the smallest reduction ratio during the particle loading, between 3% and 8%. The pressure drop shows a trend of rapidly increasing and then slowly increasing, which depicts the flow changing from deep bed filtration to soot cake filtration. After 1.5 g/dm3 of particle injection, the differences between case 1 and case 2 start to disappear; after 3 g/dm3, case 3, case 4, case 5, and case 6 showed roughly the same pressure drop. After 4 g/dm3, the pressure drops of the two comparison cases were roughly the same, with a difference less than 10%.
3.2. Velocity Profile
Experimental velocities were measured after the surface of the monolith outlet after stop particle injection. The velocities were collected at intervals along the radial position on the outlet surfaces of the monolith. During the velocity measurement, the outlet cone was dismounted and the particle injection was stopped, but the compressed gas flow was maintained.
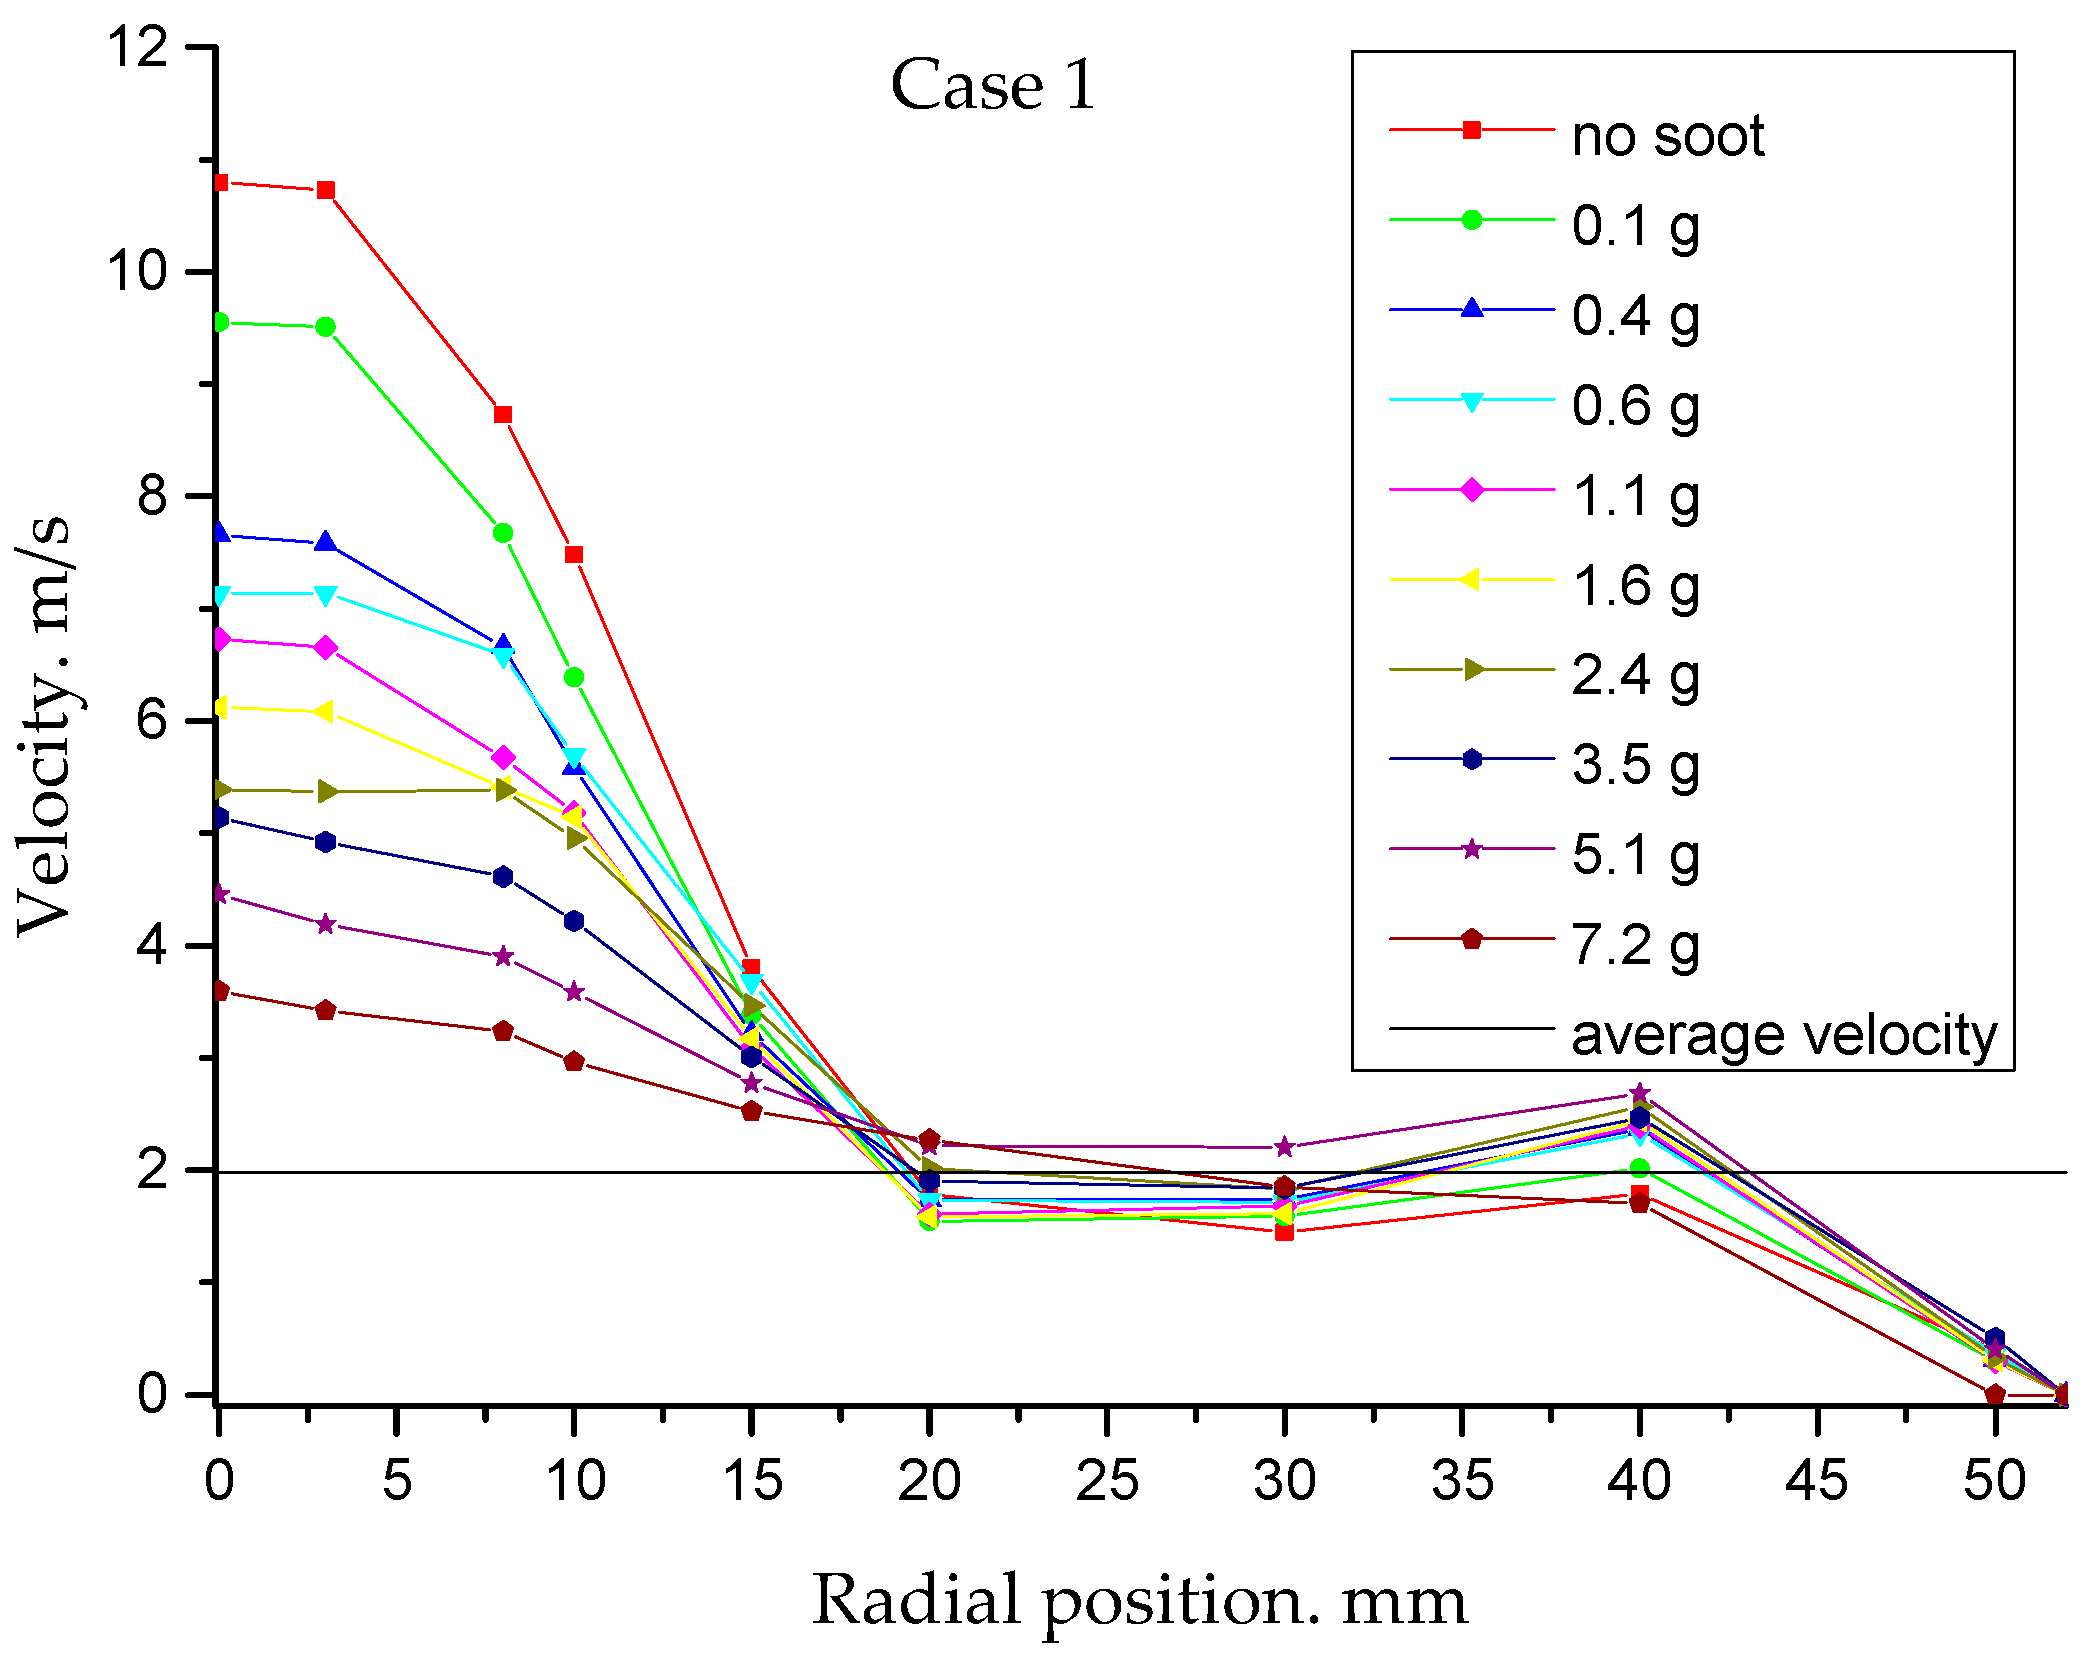
Figure 10 shows the velocity changing with different particle injections. The flow becomes more uniform when more particles are deposited in the channels, that is because most of the particles were deposited in the central channels, which blocked the channeled and push more flow passing through the border part and less flow passing through the center part. The average velocity means the average velocity on the outlet surface of the monolith calculated from the volumetric flow.
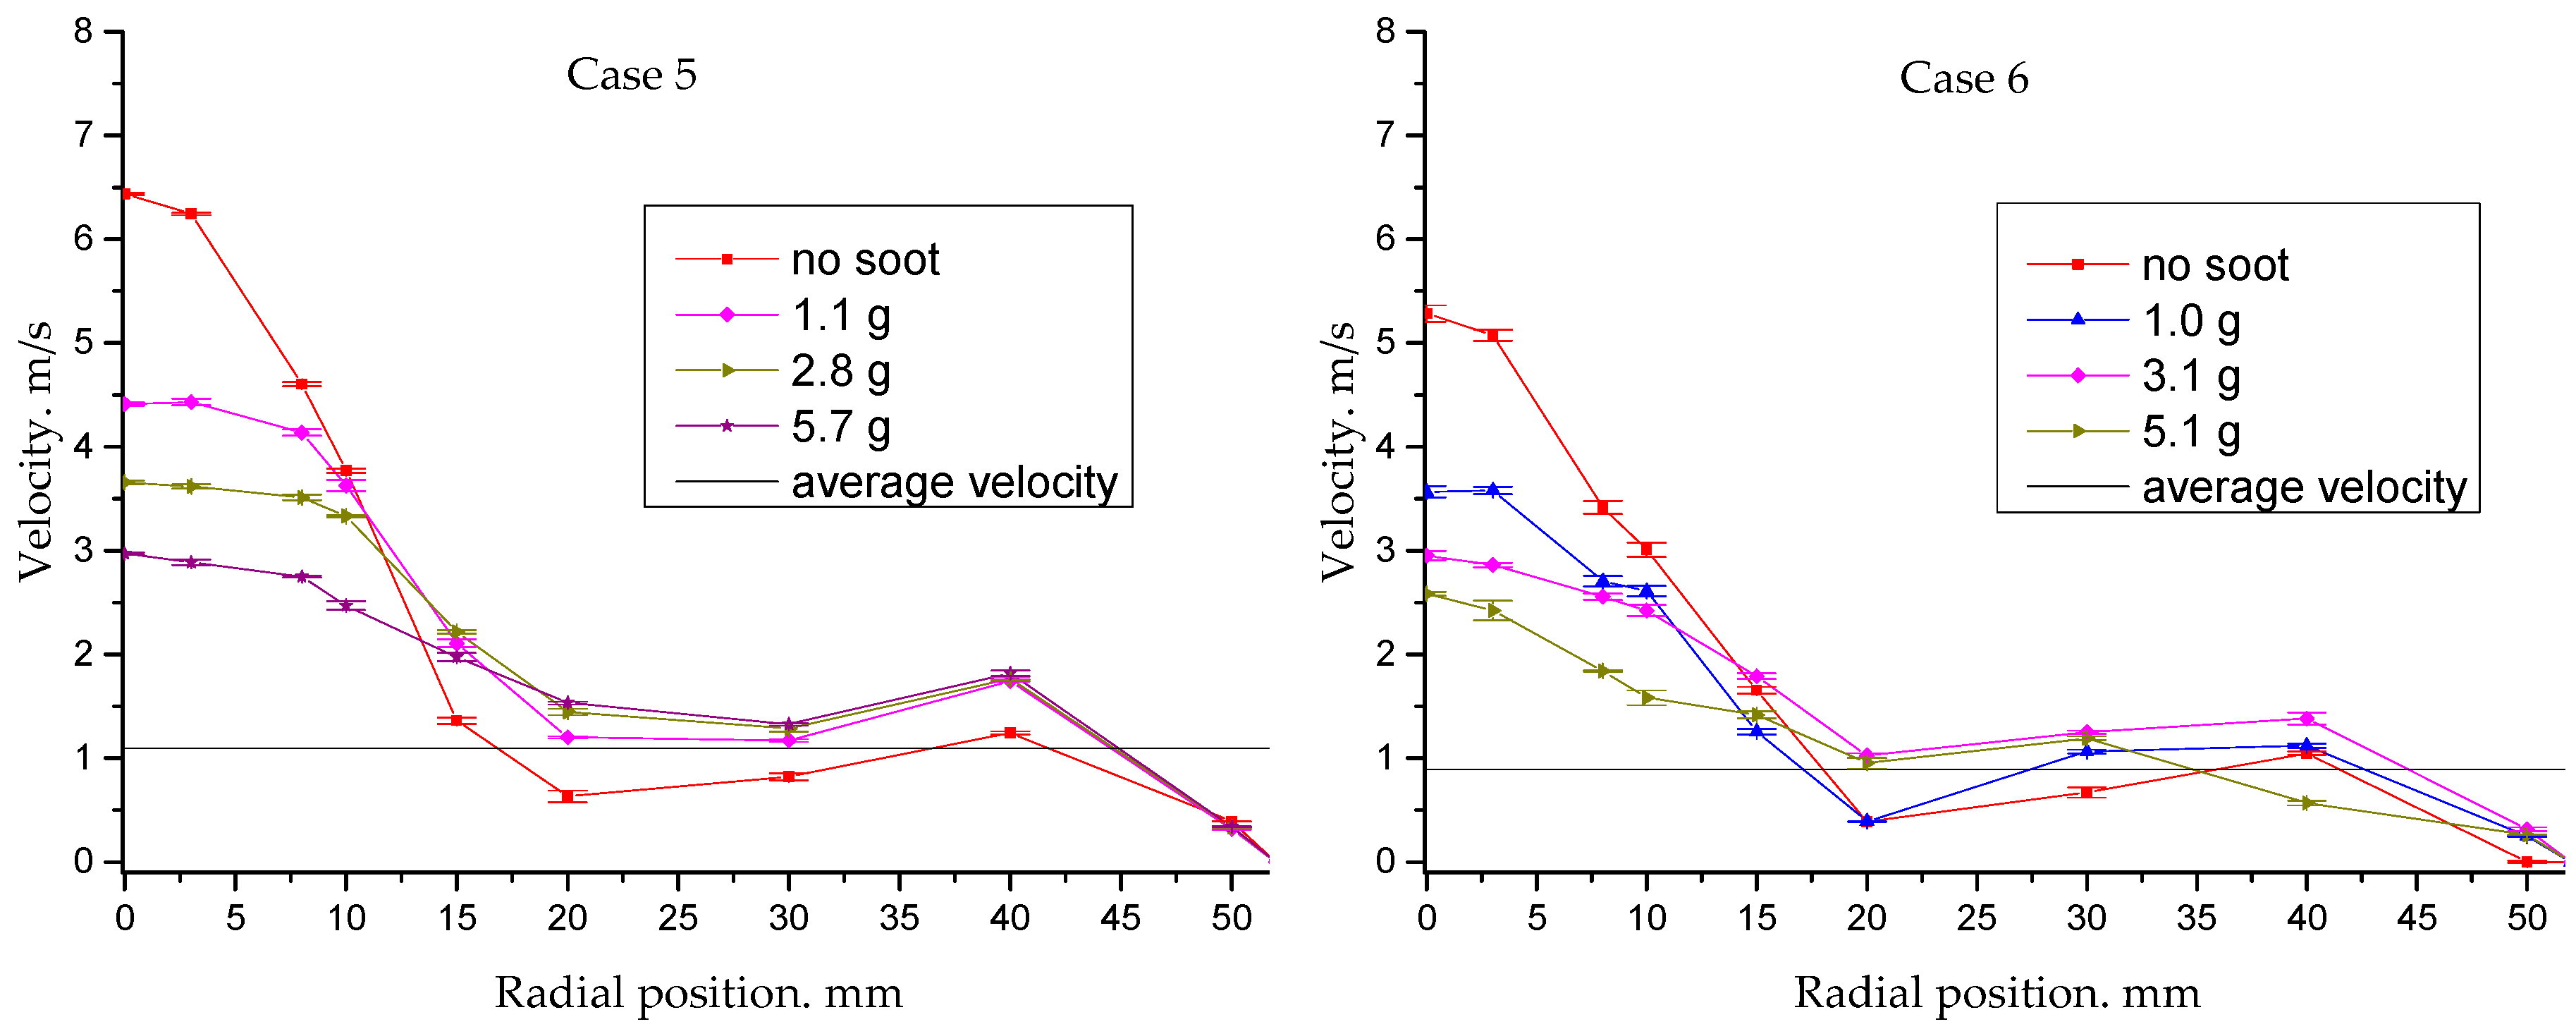
Figure 11,
Figure 12 and
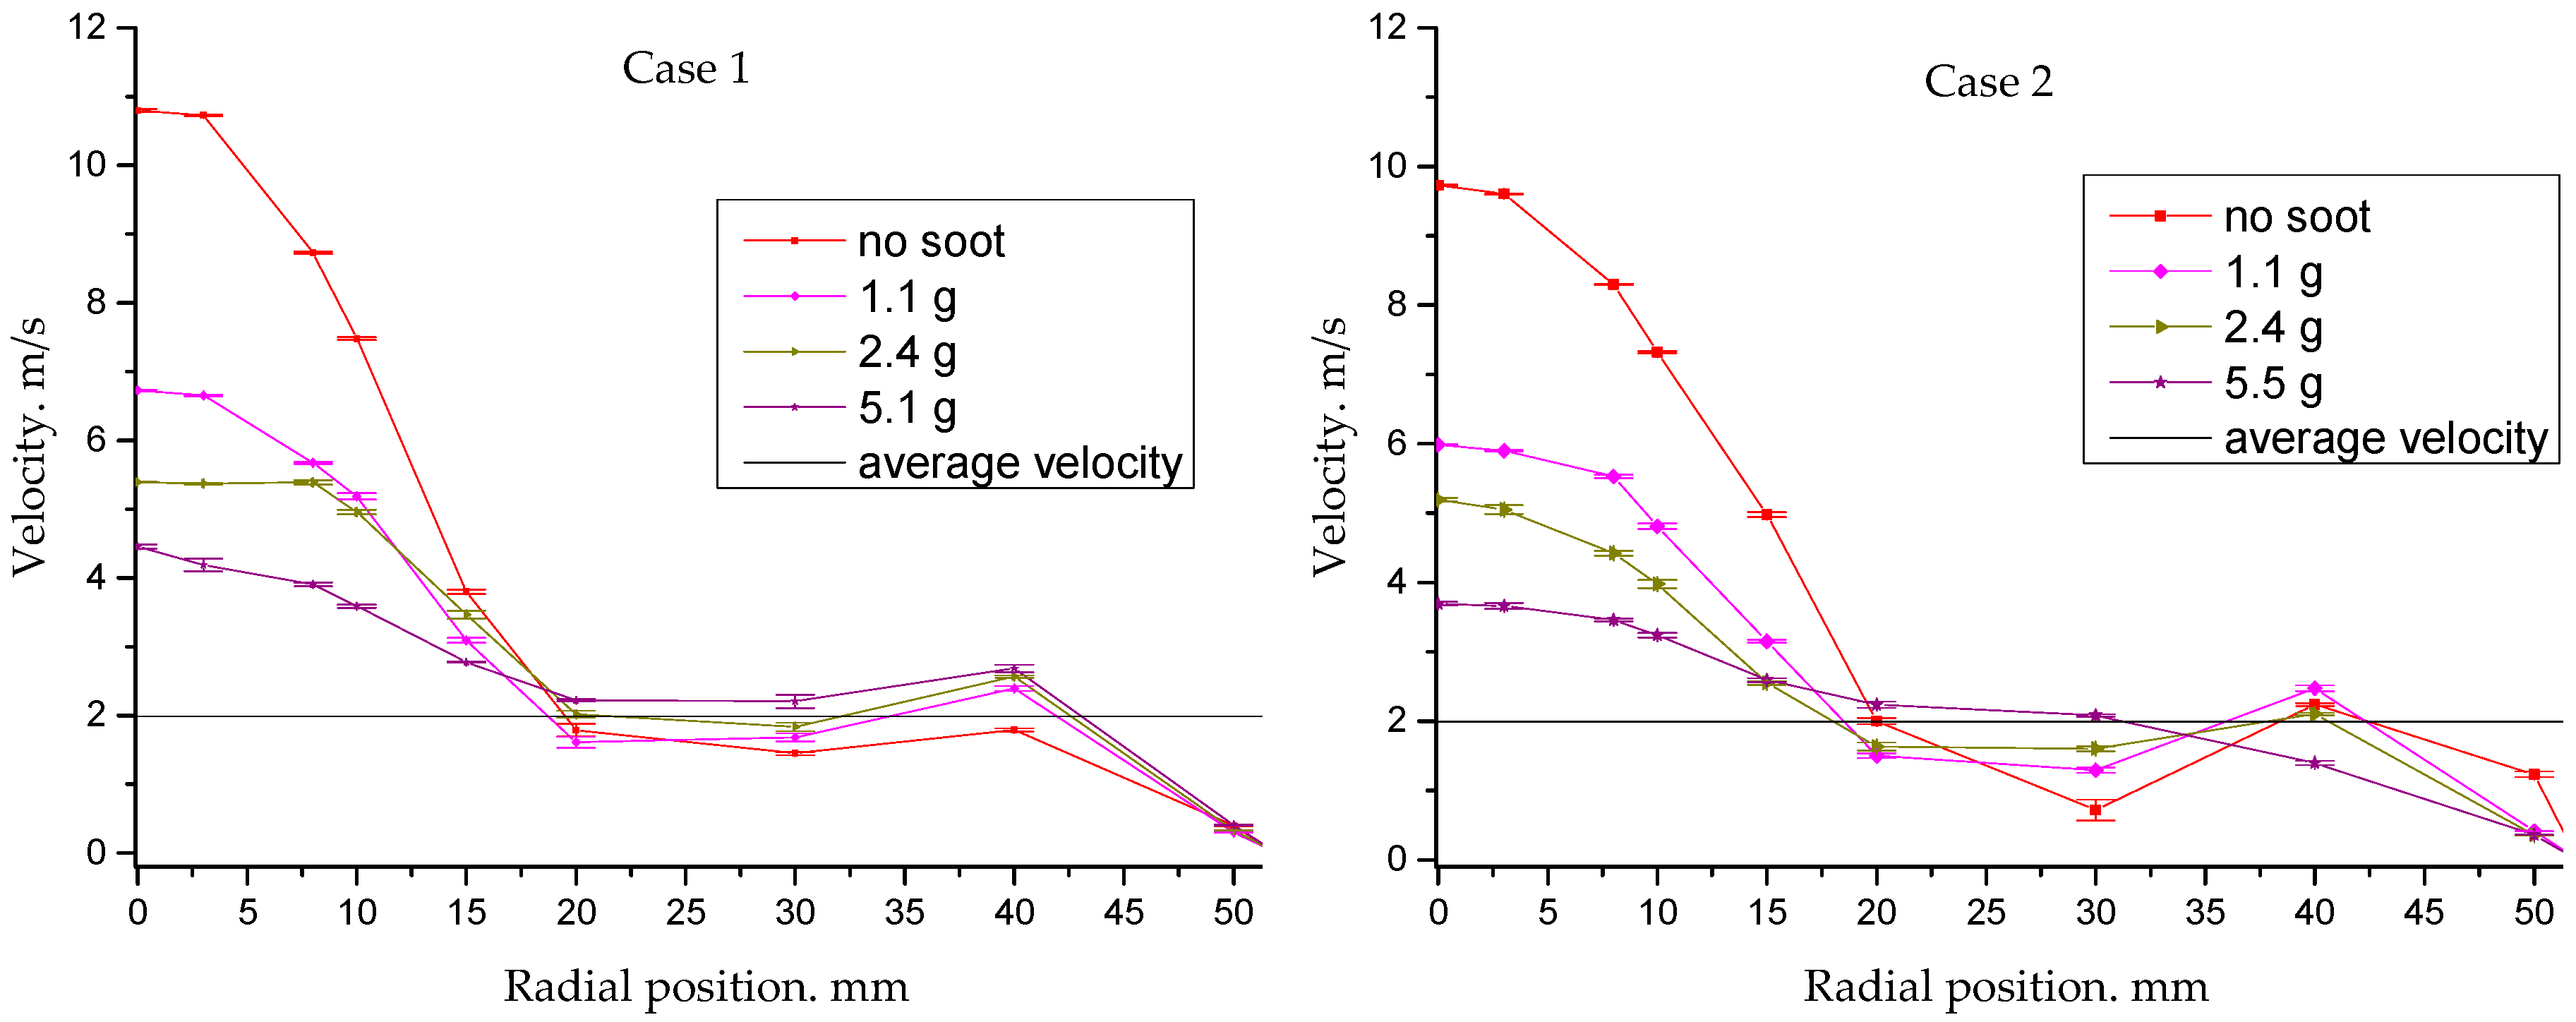
Figure 13 show the velocity comparisons between the two cones. Due to the nature of the operation of the SAG 410, it was not possible to acquire readings at identical particle mass loadings into the monolith. Samples at representative intervals were instead chosen to illustrate the performance of the different cases. But still one obvious conclusion can be obtained, the NURBS cone had smaller central velocity even with loaded particles, for example, the case 2 with 5.5 g comparing to case 1 with 5.1 g. Moreover, the error bar were all less than 5 %, the biggest ones happened at radial position around 30 mm, which means the NURBS improvement was reliable.
Table 6,
Table 7 and
Table 8 show the velocities in the outlet central part of each case with loaded particles, and the maximum velocities of the NURBS cones are all lower than the comparison cases. For the comparison of case 1 and case 2, shown in
Table 6, the reduction ratio of the velocity at the center at 1.1 g is 11%, while the percentage is 10% with a clean monolith, but the reduction ratio fluctuated; a reduction of 6% was obtained at 2.4 g and a reduction of more than 10% was obtained after 5 g. Additionally, for case 3 and case 4, shown in
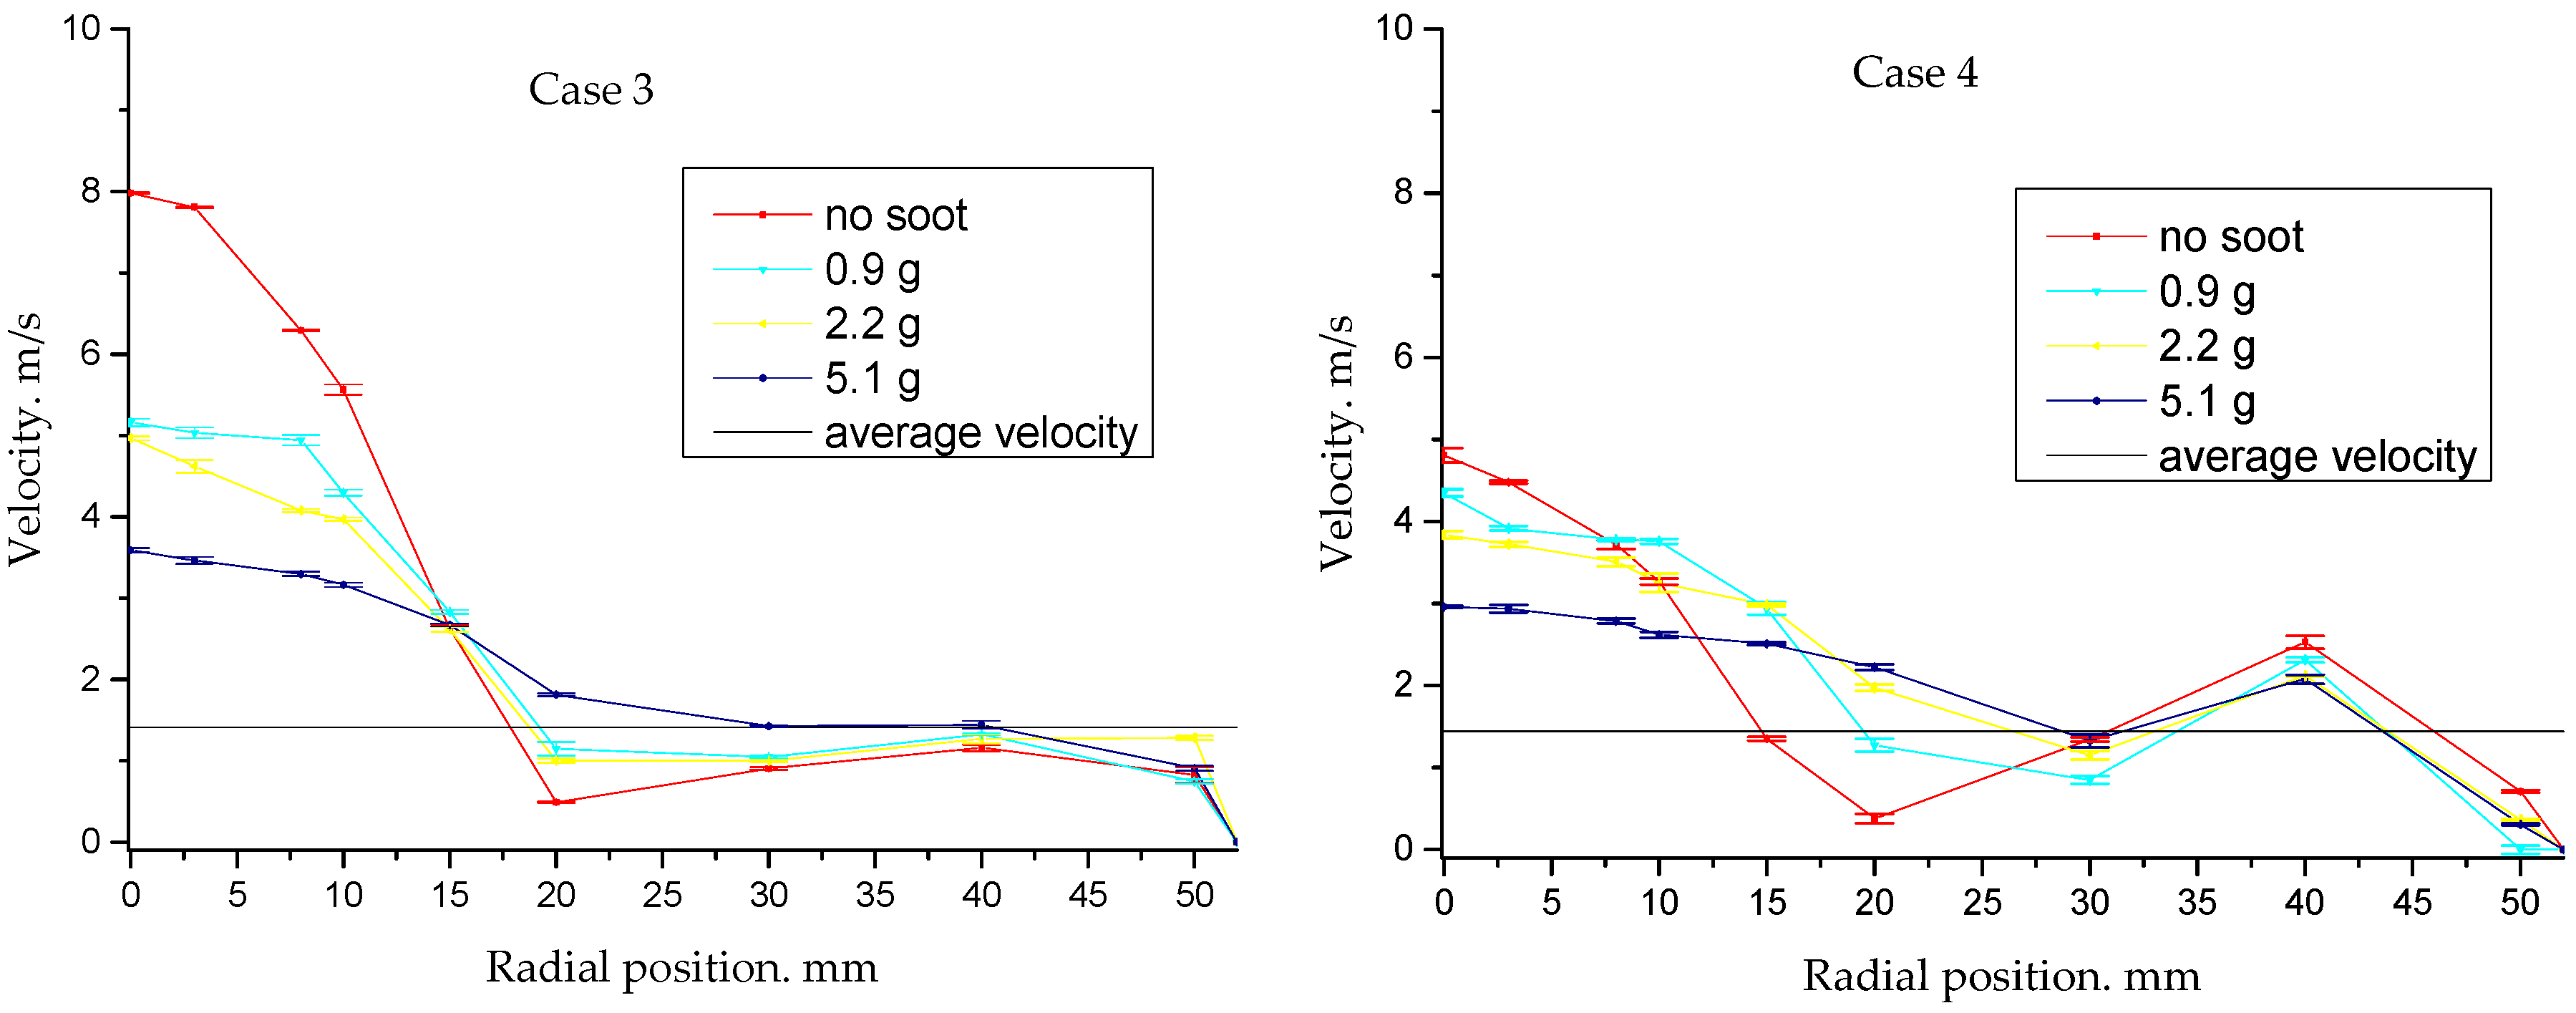
Table 7, the reduction ratio of the center velocity profile, also shown in
Figure 11, changed from 16% to 40%, but a vibration error was found during the measurement of case 4 without particles, which caused the value to be abnormally low. In case 5 and case 6, shown in
Table 8, the reduction ratio is 13% to 19%.
The reduction ratio varies with the amount of loaded particles, and there is no constant trend as the inlet velocity increases. One reason is that the NURBS cone is designed based on one certain inlet velocity; a different inlet velocity will generate a different flow reduction inside the same cone, which needs to be further studied. As with the pressure drop, the velocity difference between the two cones decreases as more particles are injected.
3.3. Flow Uniformity
The flow uniformity index is used to reveal the cone’s influence on the flow distributions after particle injection [
34].
Here,
is between 0 and 1,
vmean is the mean velocity, and
n is the total number of measured points.
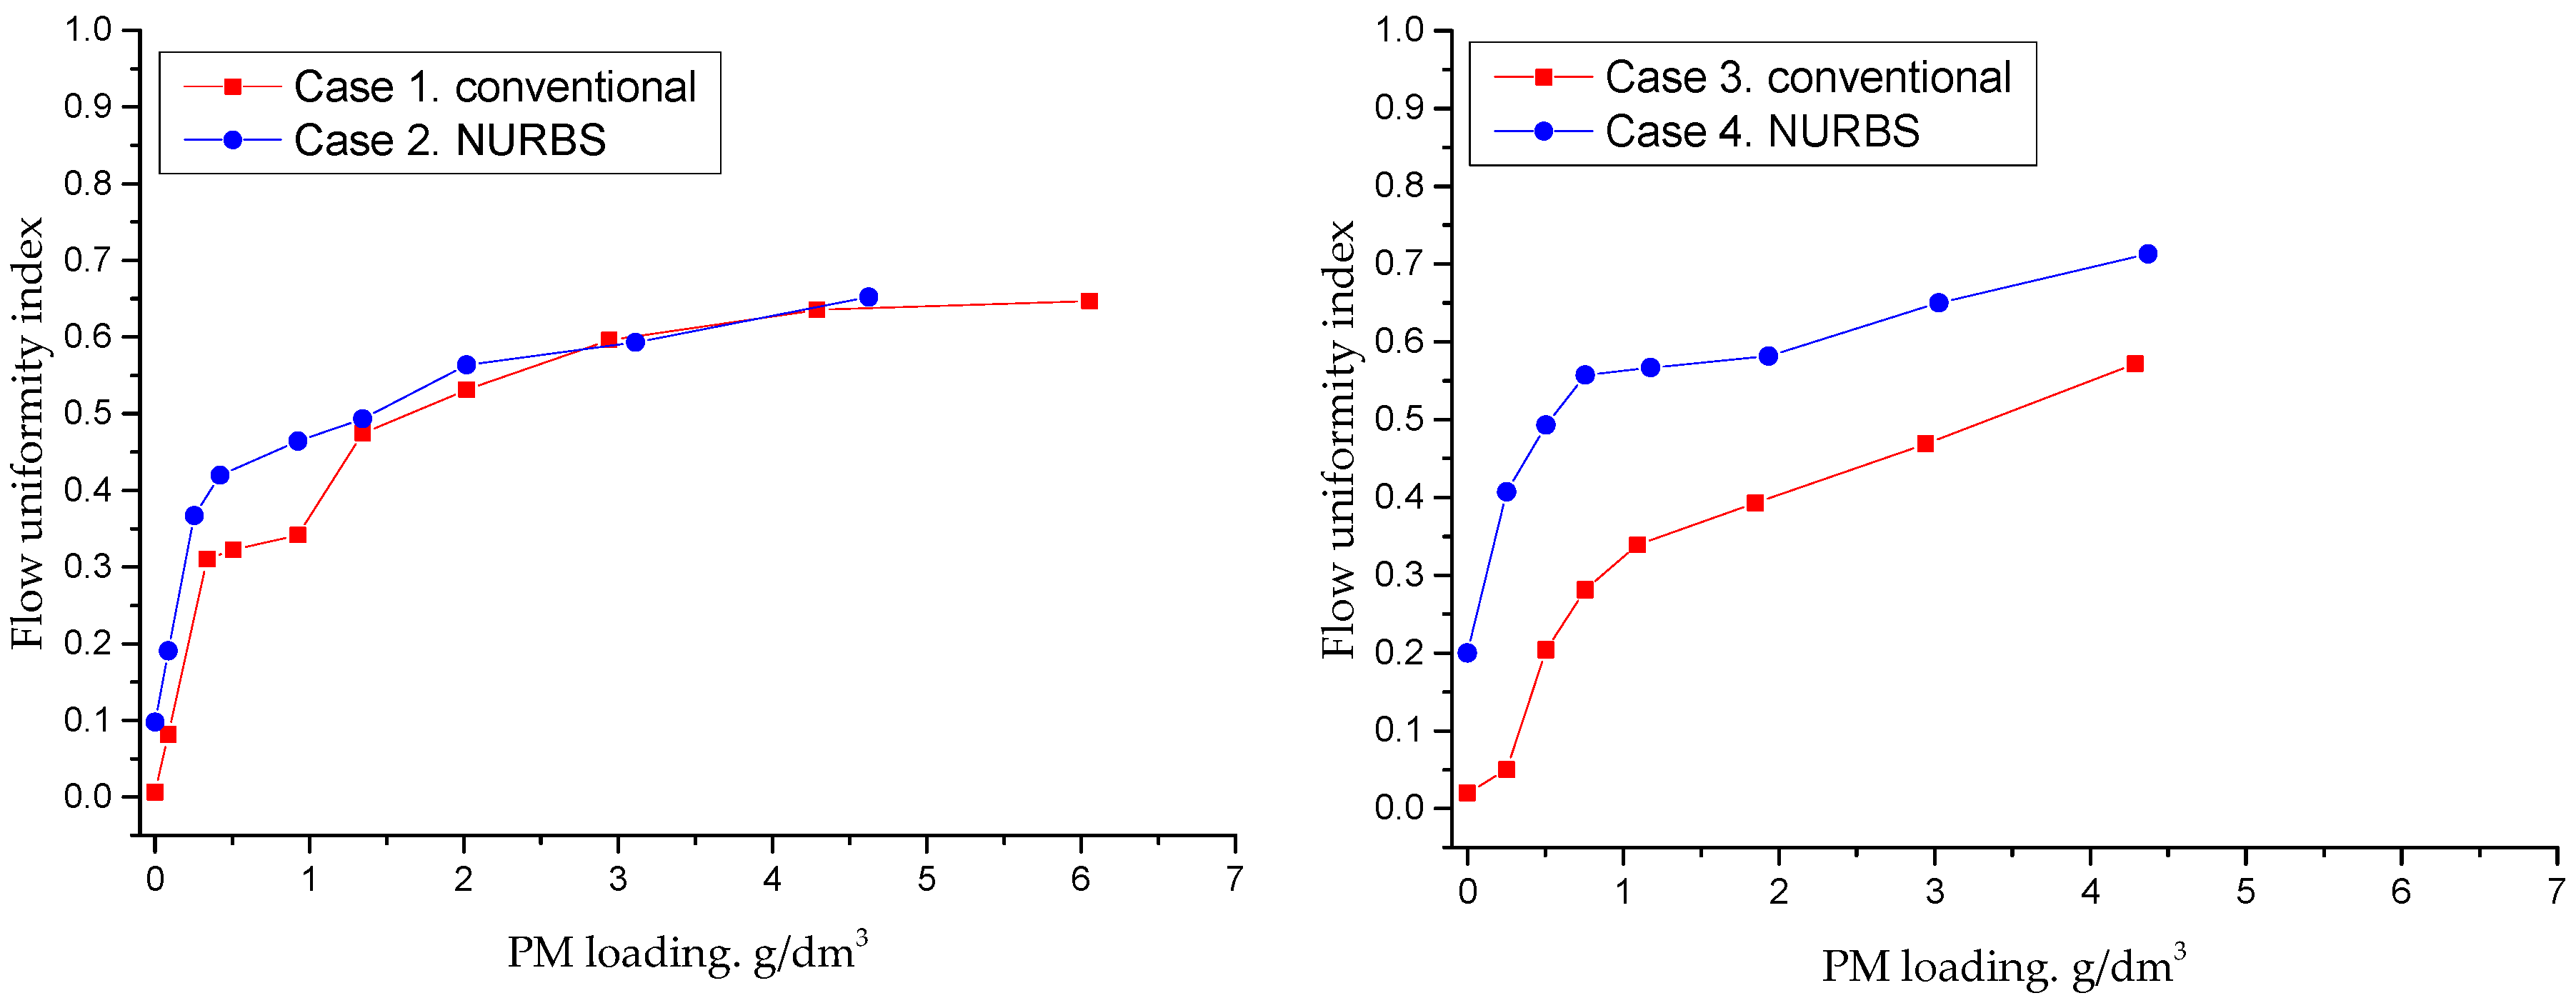
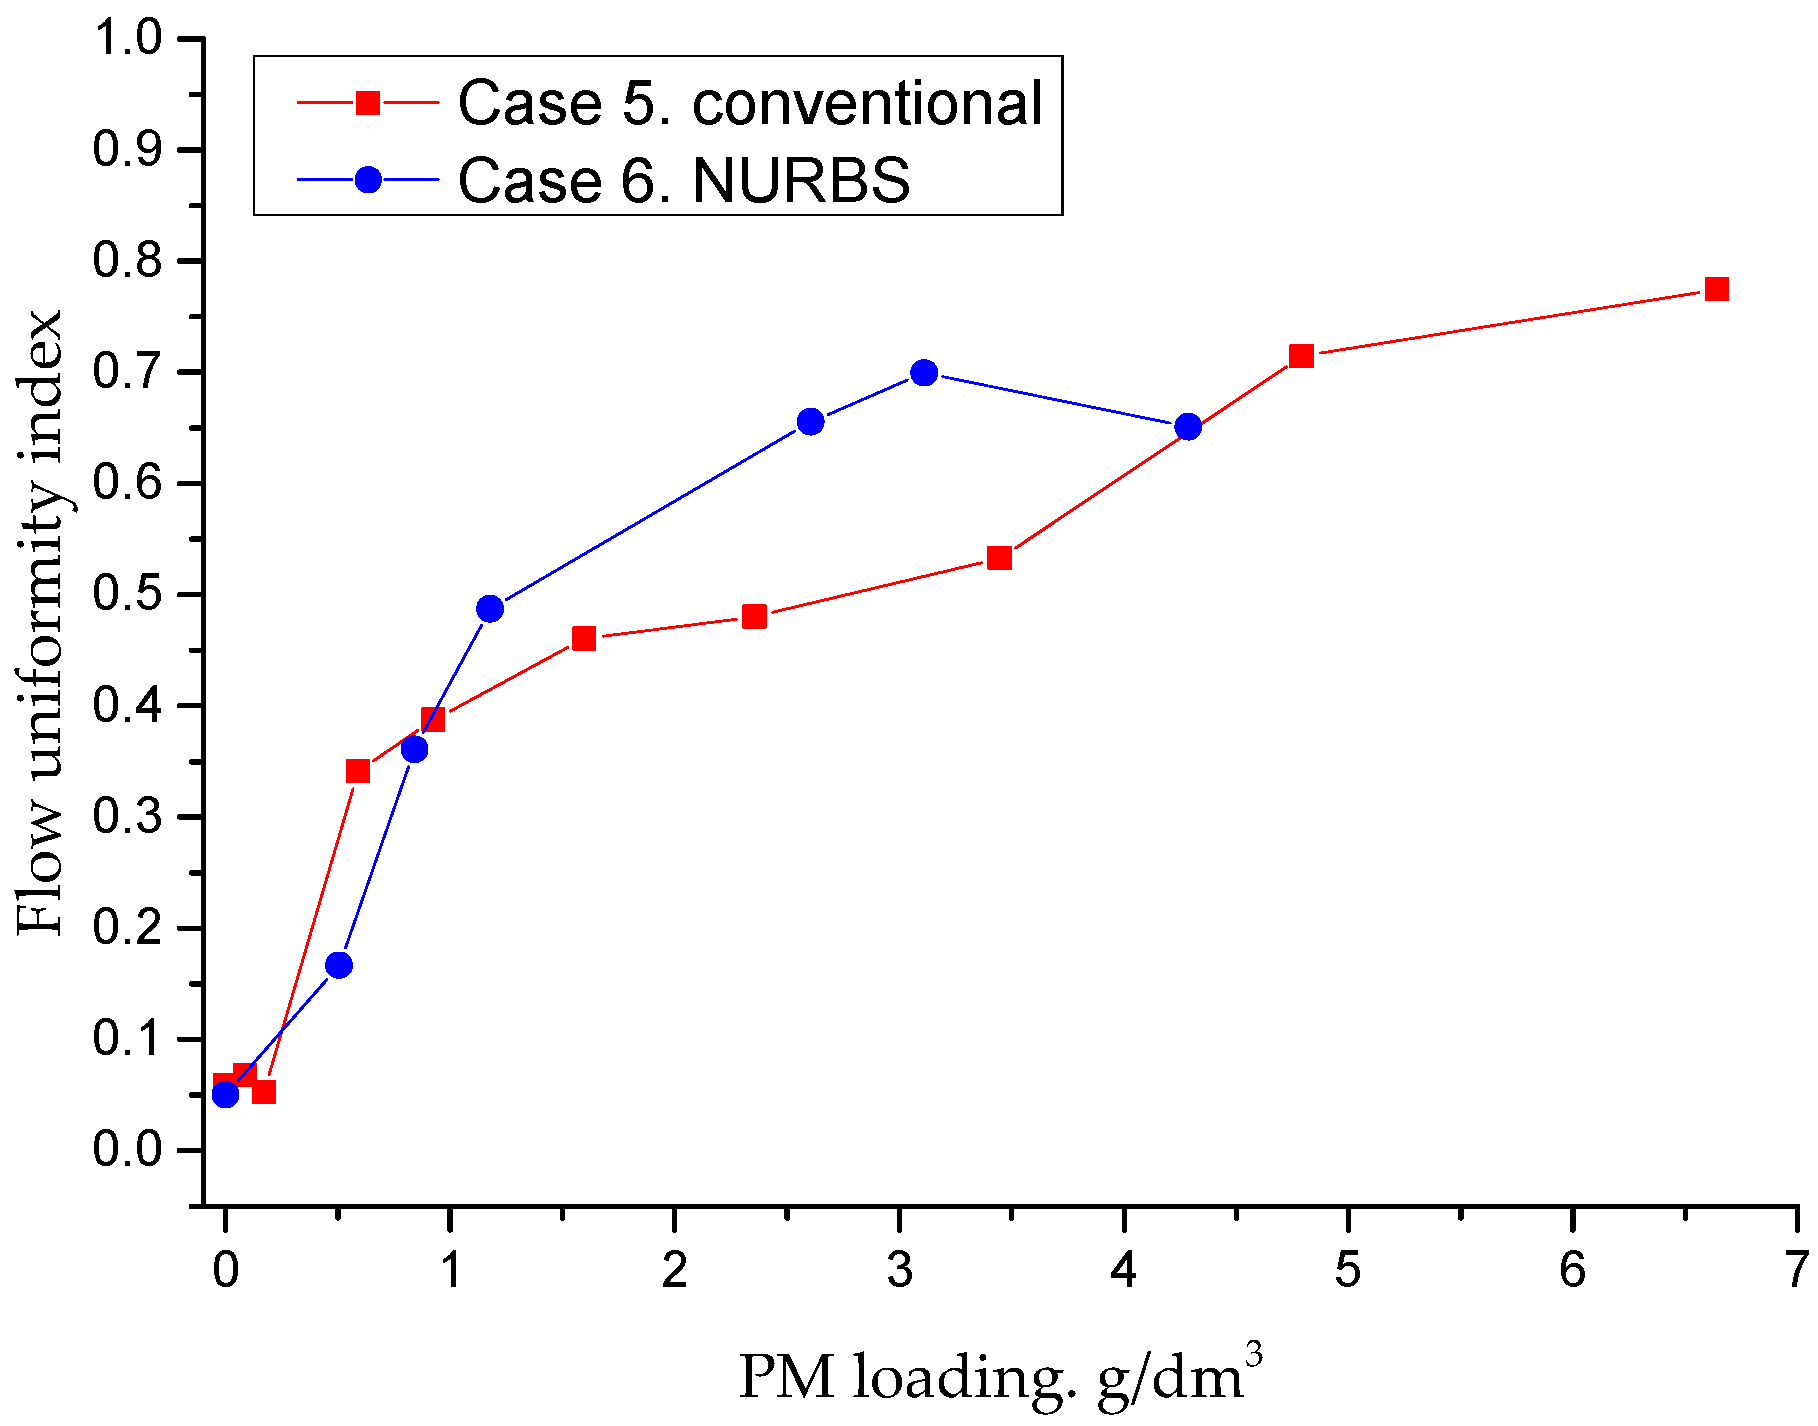
Figure 14 shows that the NURBS cone improves the flow distribution well for most samples. However, compared with case 5, the NURBS cone did not show better results before 1 g/dm
3 of particle deposition in case 6. The reason has been discussed in previous research: NURBS cones designed for a certain velocity do not always exhibit better performance if switched to another inlet velocity [
38]. In addition, we can see the trend that the uniformity index becomes similar as more particles are deposited inside the channel, but for case 3 and case 4, they need more particles deposited inside the monolith to have a similar value after 4.2 g/dm
3 of particle deposition. These are further proof that NURBS cone has the potential improvement even with particle deposition in the monolith.
3.4. Particle Number and Size Distribution
The particle number size distribution and capture efficiency were measured by the DMS 500.
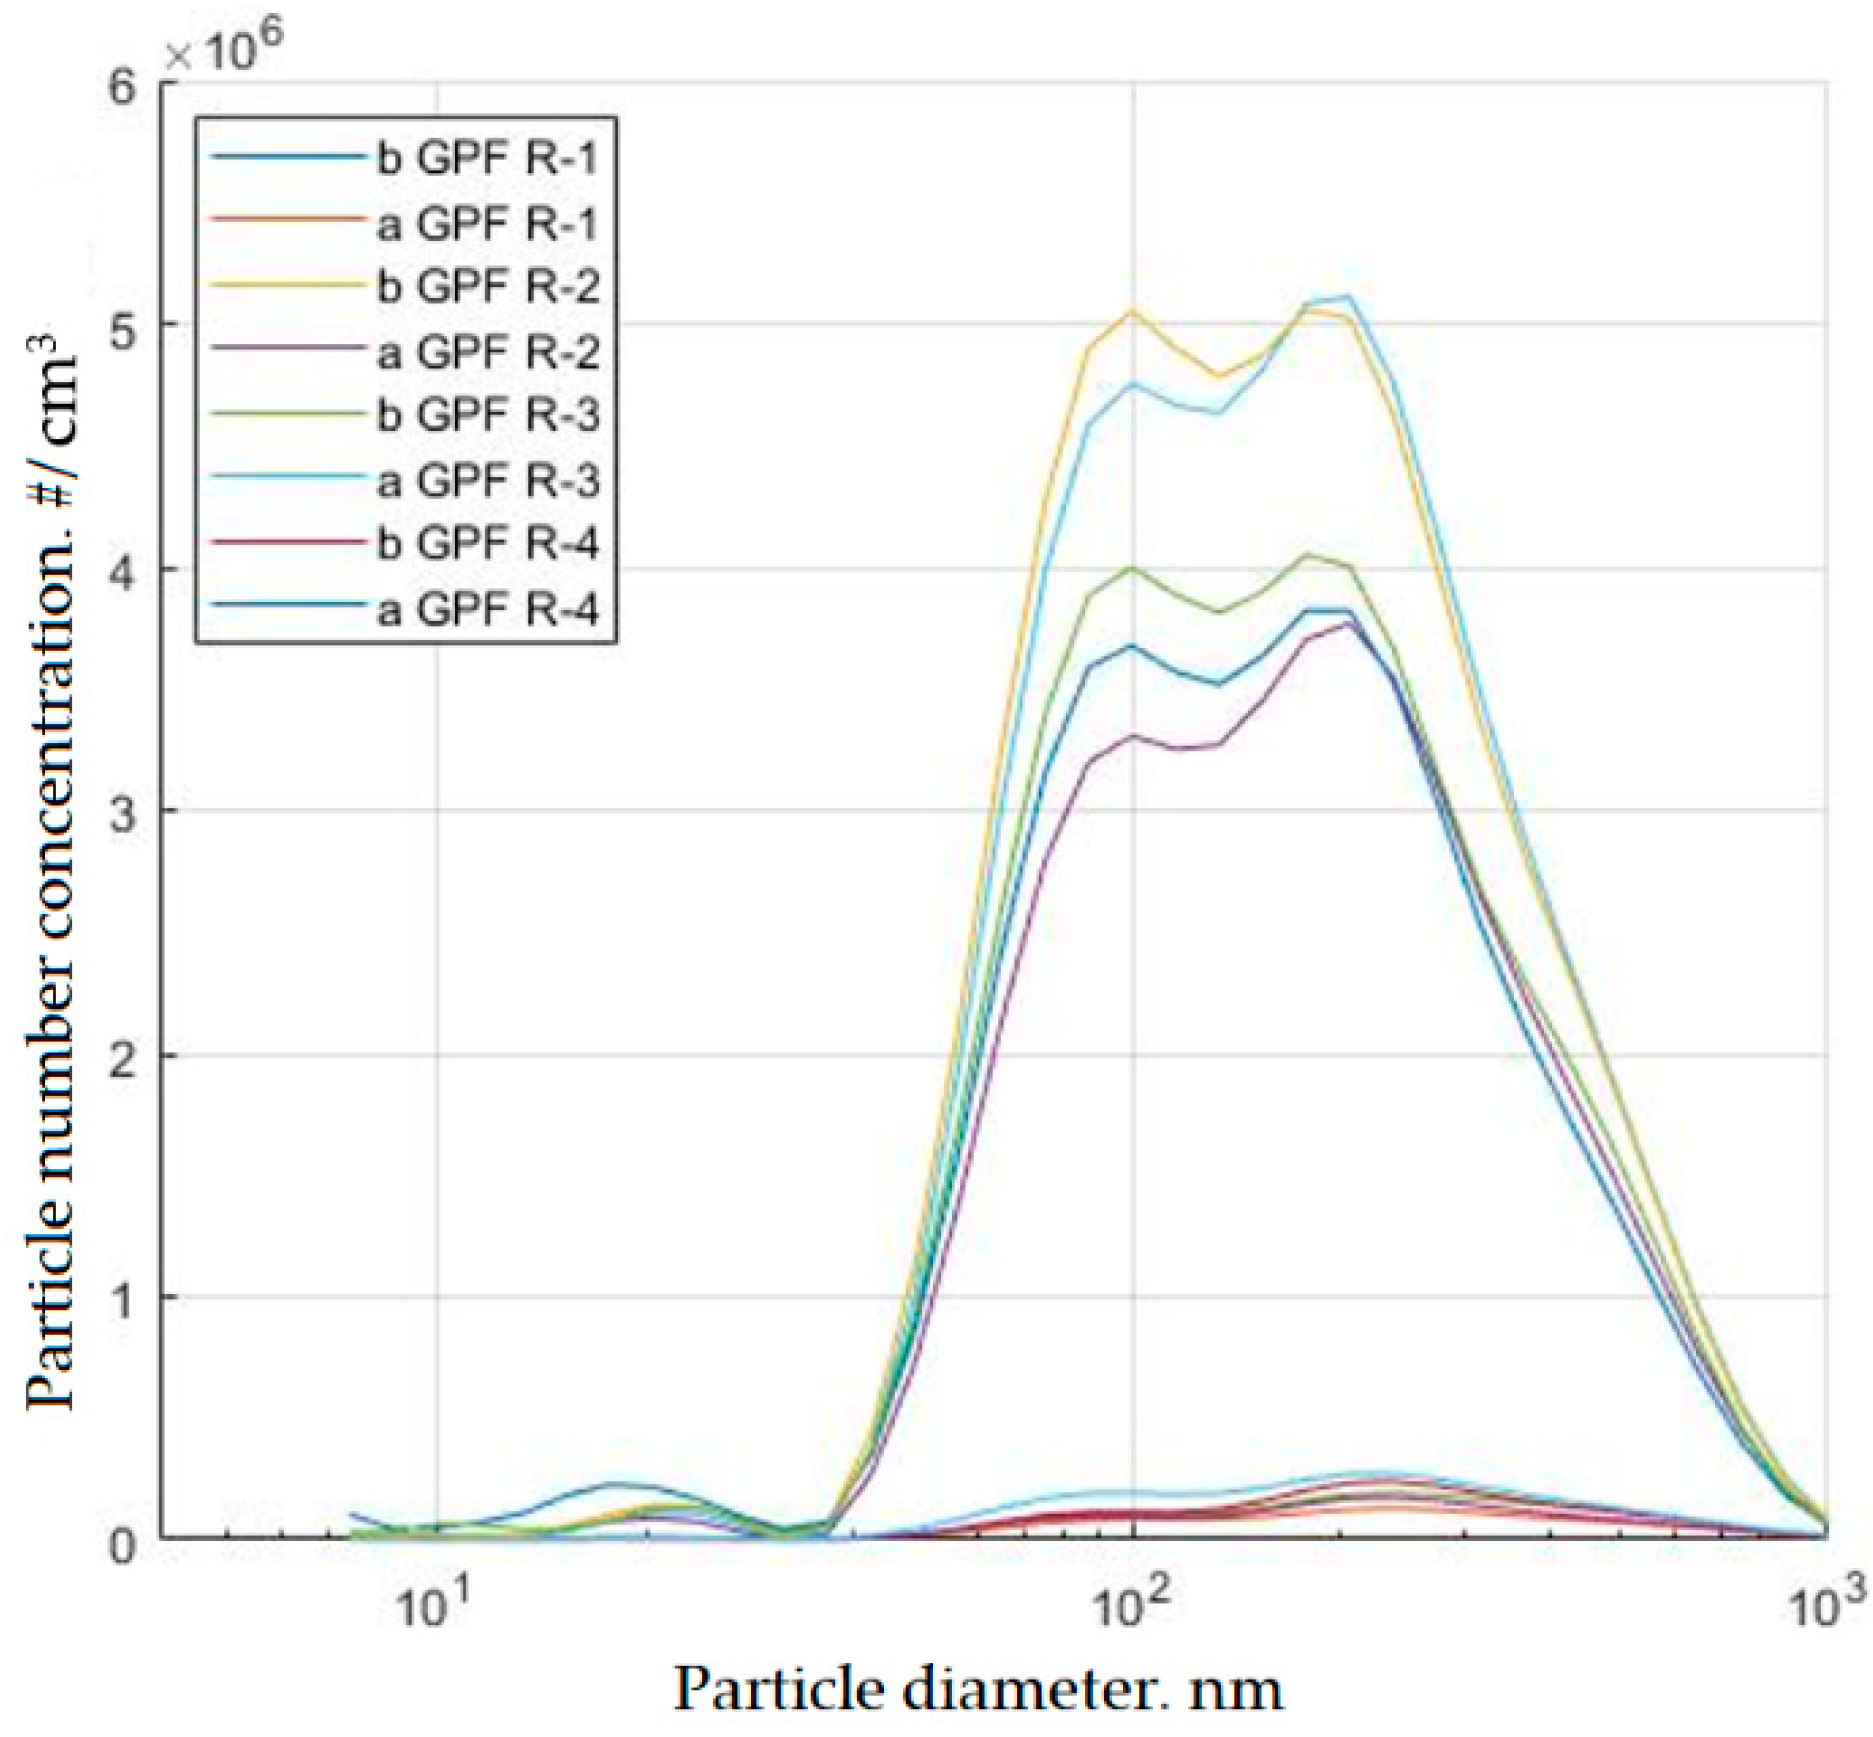
Figure 15 shows the particle number size distribution experimentally obtained for case 1, particle loading #4 before and after the GPF. This case was selected to study the particle number size distribution because it showed the maximum pressure drop among all the cases studied in investigation (
Figure 8). The particle number size distribution measurement was repeated four times. The large difference between the particle number size distribution before and after the filter shows a higher capturing efficiency (CE) for the filter.
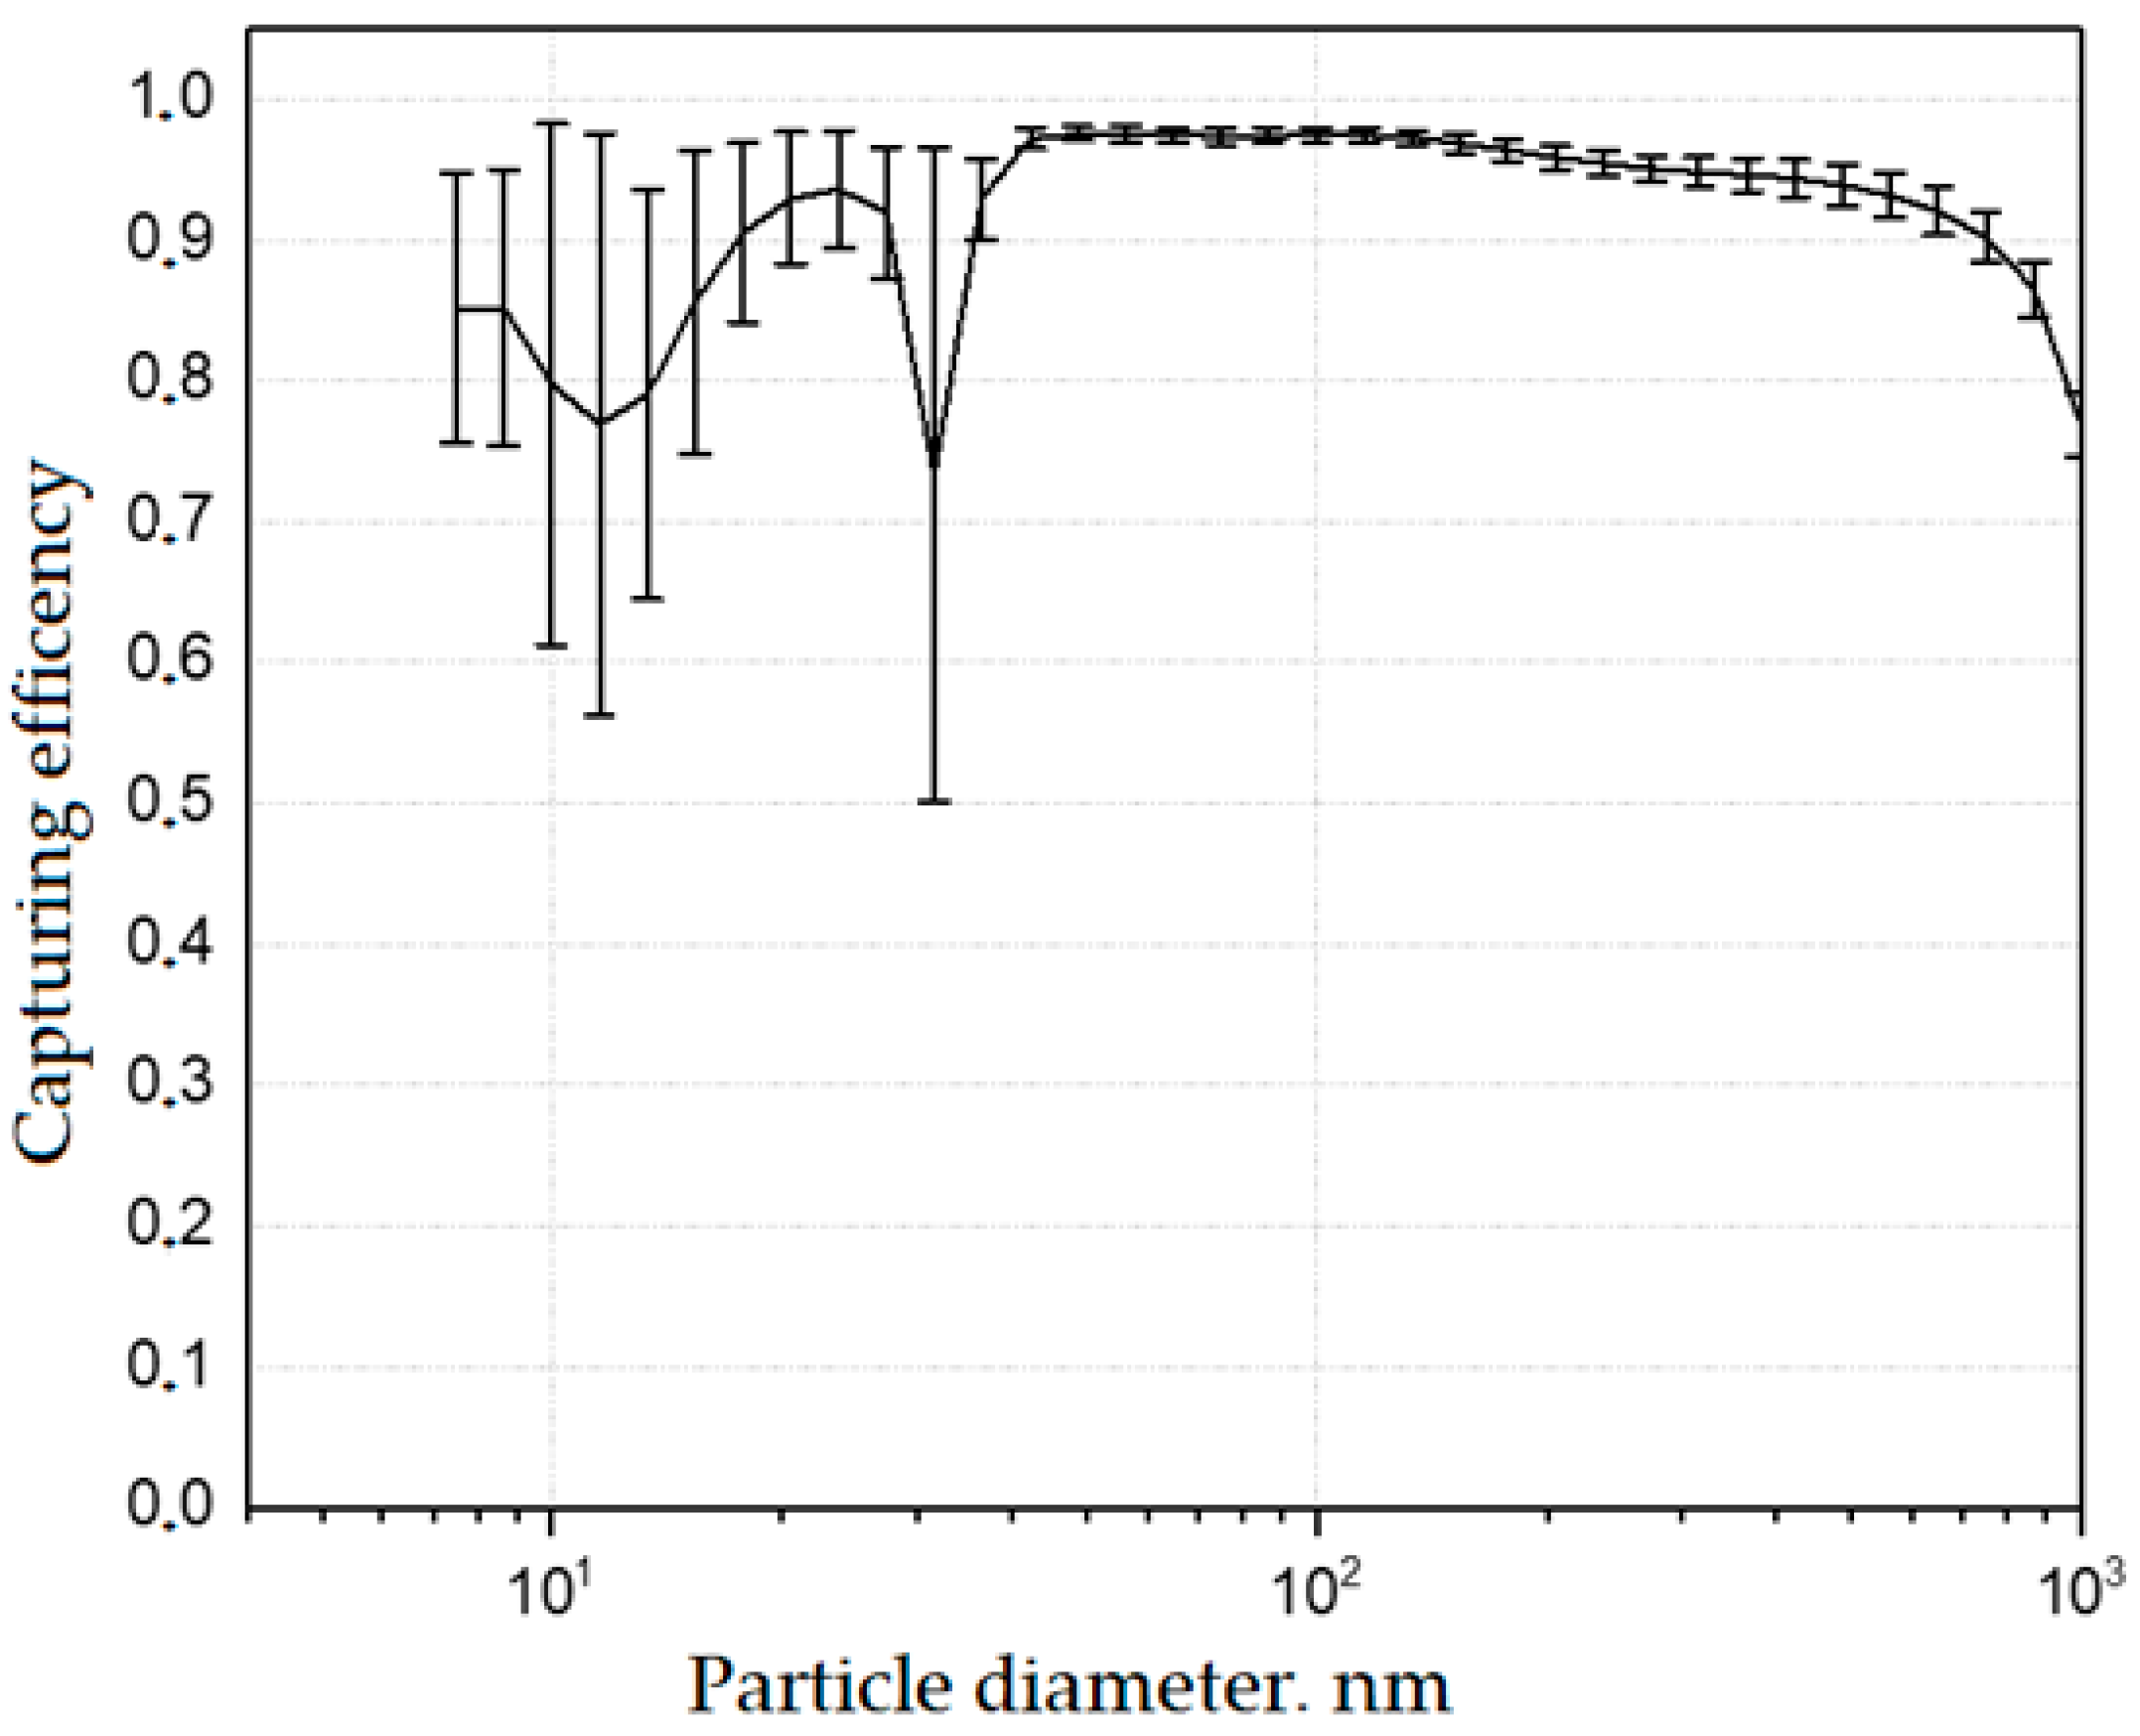
Figure 16 shows the size resolved CE for case 1, loading 4. CE first increased within the size range from 10 nm to 50 nm, was nearly constant from 50 to 110 nm, and then decreased from 110 to 1000 nm. The error bar for CE with a diameter less than 50 nm was found to be relatively high, and the error bar for CE with particles greater than 50 nm was very low.
3.5. Future Work
The experiments in this paper were performed at room temperature; because the cones were printed in plastic, the effect of the NURBS cone on the flow field under high temperature would need to be confirmed with more simulations in the future. During regeneration, heat dissipation, flow nonuniformity and pressure drop changes also need to be studied under the influence of the cone. A detailed understanding of the cone’s influence during particle injection can ensure the high performance of future powertrains.
4. Conclusions
In this paper, the influence of the cone on the flow and particle distribution was established via experiments. The NURBS cone exhibited good performance with loaded particles.
The cone’s influence was established for different inlet velocities and particle injections. The cone can influence the flow field, and further influence the particle distribution inside the monolith and pressure drop. The cone optimization results in improvements in unfavorable situations throughout all of the particle loading phases, and the NURBS cone shows good improvements in certain cases, but how much the cone can be developed depends on the shape design, which should consider the inlet velocity and injection quantity of particles.
The slope changes in the pressure drop during particle injection illustrate how the filtration phases change from deep bed to soot cake, the pressure drop reduction of NURBS cone comparing to conventional cone can be up to 10% with particle deposition. The maximum velocities in the central part of the monolith outlet in all cases decreased notably when using NURBS cone, most cases had the reduction between 6% to 23%; The highest reduction happened when no particles between the case 3 and case 4, which has the similar inlet velocity as the cone design velocity.
The influence of the cone on the flow field after the monolith decreases with the increased number of deposited particles, but the compared NURBS cone cases demonstrate better flow uniformity after the deep bed filtration phase. The significantly difference of flow uniformity was obtained between the case 3 and case 4, even after 4.2 g/dm3 deposition, the NURBS cone demonstrated more than 21% improvement. Therefore, the NURBS cone may exhibit superior flow uniformity performance long into the particle loading phase, implying that the effect remains even after several loading–regeneration cycles. But same as the results of velocity reduction, the best performance is not always happened as we want under different cases, the best optimization under different cases can only been obtained when complying with specific NURBS designed with different inlet velocities.
However, the particle distribution and deposition inside the monolith caused by the cone optimization should be further studied, which is important for the heat distribution during regeneration. The flow nonuniformity, coming with the feedback of particle loading, must be accounted for in subgrid scale models for CFD simulations of particle deposition in GPFs.
In summary, the connection cone has an important role in affecting the flow field. The NURBS cone can reduce the installation space and improve the flow distribution; thus, it is a suitable choice for cone design. The NURBS can also be applied to other aftertreatment systems.
Author Contributions
Conceptualization, M.M. and X.L.; methodology, M.M. and J.S.; validation, M.M. and J.S.; formal analysis, M.M.; investigation, M.M. and X.L.; resources, J.S.; writing—original draft preparation, M.M.; writing—review and editing, J.S., N.S., and H.S.; supervision, J.S. and H.S.; project administration, J.S.; funding acquisition, J.S.
Funding
This research was funded by Chalmers University of Technology, 2018. This work was supported in part by a scholarship from the China Scholarship Council (CSC) under Grant File No. 201706020106. This research was funded by The National Key Research and Development Program of China, grant number: 2017YFB0103402 and 2018YFB0104103.
Acknowledgments
All technical staff at the division of Combustion and Propulsion Systems is deeply acknowledged, including Patrik Wåhlin for printing the cones and Timothy Benham, Anders Mattsson, Robert Buadu and Alf-Hugo Magnusson for building the test bench.
Conflicts of Interest
The authors declare no conflict of interest.
References
- Spicher, U.; Reissing, J.; Kech, J.M.; Gindele, J. Gasoline Direct Injection (GDI) Engines - Development Potentialities. SAE Tech. Pap. Ser. 1999, 15. [Google Scholar] [CrossRef]
- Wang, C.; Xu, H.; Herreros, J.M.; Wang, J.; Cracknell, R. Impact of fuel and injection system on particle emissions from a GDI engine. Appl. Energy 2014, 132, 178–191. [Google Scholar] [CrossRef]
- Aakko, P.; Nylund, N.O. Particle Emissions at Moderate and Cold Temperatures Using Different Fuels. SAE Tech. Pap. Ser. 2003. [Google Scholar] [CrossRef]
- Wu, G.; Kuznetsov, A.V.; Jasper, W.J. Distribution characteristics of exhaust gases and soot particles in a wall-flow ceramics filter. J. Aerosol Sci. 2011, 42, 447–461. [Google Scholar] [CrossRef]
- Mohr, M.; Forss, A.M.; Steffen, D. Particulate Emissions of Gasoline Vehicles and Influence of the Sampling Procedure. SAE Tech. Pap. Ser. 2000. [Google Scholar] [CrossRef]
- Graskow, B.R.; Kittelson, D.B.; Ahmadi, M.R.; Morris, J.E. Exhaust Particulate Emissions from a Direct Injection Spark Ignition Engine. SAE Tech. Pap. Ser. 1999, 108, 602–609. [Google Scholar]
- Willeke, K.; Whitby, K.T. Atmospheric Aerosols: Size Distribution Interpretation. J. Air Pollut. Control. Assoc. 1975, 25, 529–534. [Google Scholar] [CrossRef]
- Kan, H.; Chen, B.; Hong, C. Health Impact of Outdoor Air Pollution in China: Current Knowledge and Future Research Needs. Environ. Heal. Perspect. 2009, 117, A187. [Google Scholar] [CrossRef]
- Gupta, T.; Kothari, A.; Srivastava, D.K.; Agarwal, A.K. Measurement of number and size distribution of particles emitted from a mid-sized transportation multipoint port fuel injection gasoline engine. Fuel 2010, 89, 2230–2233. [Google Scholar] [CrossRef]
- Anderson, J.O.; Thundiyil, J.G.; Stolbach, A. Clearing the Air: A Review of the Effects of Particulate Matter Air Pollution on Human Health. J. Med. Toxicol. 2012, 8, 166–175. [Google Scholar] [CrossRef]
- Fujita, E.; Watson, J.G.; Chow, J.C.; Robinson, N.F. Northern Front. Range Air Quality Study Final Report Volume C: Source Apportionment and Simulation Methods and Evaluation; Desert Research Institute: Reno, NV, USA, 1998. [Google Scholar]
- Gildemeister, A.E.; Hopke, P.K.; Kim, E. Sources of fine urban particulate matter in Detroit, MI. Chemosphere 2007, 69, 1064–1074. [Google Scholar] [CrossRef] [PubMed]
- Giechaskiel, B.; Mamakos, A.; Andersson, J.; Dilara, P.; Martini, G.; Schindler, W.; Bergmann, A. Measurement of Automotive Nonvolatile Particle Number Emissions within the European Legislative Framework: A Review. Aerosol Sci. Technol. 2012, 46, 719–749. [Google Scholar] [CrossRef]
- Vojtisek-Lom, M.; Beránek, V.; Stolcpartova, J.; Pechout, M.; Klír, V. Effects of n-Butanol and Isobutanol on Particulate Matter Emissions from a Euro 6 Direct-injection Spark Ignition Engine During Laboratory and on-Road Tests. SAE Int. J. Engines 2015, 8, 2338–2350. [Google Scholar] [CrossRef]
- Guan, B.; Zhan, R.; Lin, H.; Huang, Z. Review of the state-of-the-art of exhaust particulate filter technology in internal combustion engines. J. Environ. Manag. 2015, 154, 225–258. [Google Scholar] [CrossRef] [PubMed]
- Brijesh, P.; Sreedhara, S. Exhaust emissions and its control methods in compression ignition engines: A review. Int. J. Automot. Technol. 2013, 14, 195–206. [Google Scholar] [CrossRef]
- Joshi, A.; Johnson, T.V. Gasoline Particulate Filters—A Review. Emiss. Control. Sci. Technol. 2018, 4, 219–239. [Google Scholar] [CrossRef]
- Boger, T.; Rose, D.; Nicolin, P.; Gunasekaran, N.; Glasson, T. Oxidation of Soot (Printex® U) in Particulate Filters Operated on Gasoline Engines. Emiss. Control. Sci. Technol. 2015, 1, 49–63. [Google Scholar] [CrossRef]
- Merkel, G.A.; Cutler, W.A.; Warren, C.J. Thermal Durability of Wall-Flow Ceramic Diesel Particulate Filters. SAE Tech. Pap. Ser. 2001, 110, 168–182. [Google Scholar]
- Konstandopoulos, A.G.; Skaperdas, E.; Masoudi, M. Inertial Contributions to the Pressure Drop of Diesel Particulate Filters. SAE Tech. Pap. Ser. 2001, 12. [Google Scholar] [CrossRef]
- Haralampous, O.A.; Kandylas, I.P.; Koltsakis, G.C.; Samaras, Z.C.; Samaras, Z. Diesel particulate filter pressure drop Part 1: Modelling and experimental validation. Int. J. Engine Res. 2004, 5, 149–162. [Google Scholar] [CrossRef]
- Masoudi, M. Pressure Drop of Segmented Diesel Particulate Filters. SAE Tech. Pap. Ser. 2005, 114, 503–511. [Google Scholar]
- Torregrosa, A.J.; Serrano, J.R.; Arnau, F.; Piqueras, P. A fluid dynamic model for unsteady compressible flow in wall-flow diesel particulate filters. Energy 2011, 36, 671–684. [Google Scholar] [CrossRef]
- Myung, C.L.; Kim, J.; Jang, W.; Jin, D.; Park, S.; Lee, J. Nanoparticle Filtration Characteristics of Advanced Metal Foam Media for a Spark Ignition Direct Injection Engine in Steady Engine Operating Conditions and Vehicle Test Modes. Energies 2015, 8, 1865–1881. [Google Scholar] [CrossRef]
- Ma, L.; Paraschivoiu, M.; Yao, J.; Blackman, L. Improving Flow Uniformity in a Diesel Particulate Filter System. SAE Tech. Pap. Ser. 2001. [Google Scholar] [CrossRef]
- Karvounis, E.; Assanis, D.N. The effect of inlet flow distribution on catalytic conversion efficiency. Int. J. Heat Mass Transf. 1993, 36, 1495–1504. [Google Scholar] [CrossRef]
- Lai, M.C.; Kim, J.Y.; Cheng, C.Y.; Li, P.; Chui, G.; Pakko, J.D. Three-Dimensional Simulations of Automotive Catalytic Converter Internal Flow. SAE Tech. Pap. Ser. 1991, 100, 241–250. [Google Scholar]
- Chakravarthy, V.; Conklin, J.; Daw, C.; D’Azevedo, E. Multi-dimensional simulations of cold-start transients in a catalytic converter under steady inflow conditions. Appl. Catal. A: Gen. 2003, 241, 289–306. [Google Scholar] [CrossRef]
- Howitt, J.S.; Sekella, T.C. Flow Effects in Monolithic Honeycomb Automotive Catalytic Converters. SAE Tech. Pap. Ser. 1974, 83, 1067–1075. [Google Scholar]
- Bella, G.; Rocco, V.; Maggiore, M. A Study of Inlet Flow Distortion Effects on Automotive Catalytic Converters. J. Eng. Gas. Turbines Power 1991, 113, 419–426. [Google Scholar] [CrossRef]
- Wendland, D.W.; Matthes, W.R. Visualization of Automotive Catalytic Converter Internal Flows. SAE Tech. Pap. Ser. 1986, 95, 729–742. [Google Scholar]
- Kulkarni, G.S.; Singh, S.N.; Seshadri, V.; Mohan, R. Optimum diffuser geometry for the automotive catalytic converter. Indian J. Eng. Mater. Sci. 2003, 10, 5–13. [Google Scholar]
- Stratakis, G.A.; Stamatelos, A.M. Mow maldistribution measurements in wall-flow diesel filters. Proc. Inst. Mech. Eng. Part. D J. Automob. Eng. 2004, 218, 995–1009. [Google Scholar] [CrossRef]
- Weltens, H.; Bressler, H.; Terres, F.; Neumaier, H.; Rammoser, D. Optimisation of Catalytic Converter Gas Flow Distribution by CFD Prediction. SAE Tech. Pap. Ser. 1993. [Google Scholar] [CrossRef]
- Badami, M.; Millo, F.; Zuarini, A.; Gambarotto, M. CFD Analysis and Experimental Validation of the Inlet Flow Distribution in Close Coupled Catalytic Converters. SAE Tech. Pap. Ser. 2003. [Google Scholar] [CrossRef]
- Salasc, S.; Barrieu, E.; Leroy, V. Impact of Manifold Design on Flow Distribution of a Close-Coupled Catalytic Converter. SAE Tech. Pap. Ser. 2005. [Google Scholar] [CrossRef]
- Mu, M.; Li, X.; Aslam, J.; Qiu, Y.; Yang, H.; Kou, G.; Wang, Y. A Study of Shape Optimization Method on Connection Cones for Diesel Particulate Filter (DPF). In Proceedings of the ASME 2016 International Mechanical Engineering Congress and Exposition, Phoenix, AZ, USA, 11–17 November 2016. [Google Scholar]
- Mu, M.; Sjöblom, J.; Ström, H.; Li, X. Analysis of the Flow Field from Connection Cones to Monolith Reactors. Energies 2019, 12, 455. [Google Scholar] [CrossRef]
- Cornejo, I.; Nikrityuk, P.; Hayes, R.E. Multiscale RANS-based modeling of the turbulence decay inside of an automotive catalytic converter. Chem. Eng. Sci. 2018, 175, 377–386. [Google Scholar] [CrossRef]
- Jiaqiang, E.; Liu, M.; Deng, Y.; Zhu, H.; Gong, J. Influence analysis of monolith structure on regeneration temperature in the process of microwave regeneration in the diesel particulate filter. Can. J. Chem. Eng. 2016, 94, 168–174. [Google Scholar]
- Quan, Y.; Liu, Q.; Zhang, S.; Zhang, S. Comparison of the morphology, chemical composition and microstructure of cryptocrystalline graphite and carbon black. Appl. Surf. Sci. 2018, 445, 335–341. [Google Scholar] [CrossRef]
- Tighe, C.J.; Twigg, M.; Hayhurst, A.; Dennis, J. The kinetics of oxidation of Diesel soots and a carbon black (Printex U) by O 2 with reference to changes in both size and internal structure of the spherules during burnout. Carbon 2016, 107, 20–35. [Google Scholar] [CrossRef]
- Meng, Z.; Yang, D.; Yan, Y. Study of carbon black oxidation behavior under different heating rates. J. Therm. Anal. Calorim. 2014, 118, 551–559. [Google Scholar] [CrossRef]
- Sánchez, N.E.; Salafranca, J.; Callejas, A.; Millera, A.; Bilbao, R.; Alzueta, M.U. Quantification of polycyclic aromatic hydrocarbons (PAHs) found in gas and particle phases from pyrolytic processes using gas chromatography–mass spectrometry (GC–MS). Fuel 2013, 107, 246–253. [Google Scholar] [CrossRef]
- Ström, H.; Sjöblom, J. Capture of Automotive Particulate Matter in Open Substrates. Ind. Eng. Chem. Res. 2013, 52, 8373–8385. [Google Scholar]
Figure 1.
Schematic of the experimental setup.
Figure 1.
Schematic of the experimental setup.
Figure 2.
Schematic of the gasoline particulate filter (GPF).
Figure 2.
Schematic of the gasoline particulate filter (GPF).
Figure 3.
The shapes of the conventional cone and the nonuniform rational B-splines (NURBSs) cone.
Figure 3.
The shapes of the conventional cone and the nonuniform rational B-splines (NURBSs) cone.
Figure 4.
Printed cones (the right cone is the NURBS cone). The shapes are depicted in
Figure 3.
Figure 4.
Printed cones (the right cone is the NURBS cone). The shapes are depicted in
Figure 3.
Figure 5.
The cone and monolith.
Figure 5.
The cone and monolith.
Figure 6.
Prandtl sampling setup and sampling position schematic (right).
Figure 6.
Prandtl sampling setup and sampling position schematic (right).
Figure 7.
Pressure drop of case 1 during particle loading. PM: particulate matter.
Figure 7.
Pressure drop of case 1 during particle loading. PM: particulate matter.
Figure 8.
Pressure drop comparison of the 6 cases.
Figure 8.
Pressure drop comparison of the 6 cases.
Figure 9.
Comparison of the pressure drop per unit volumetric flow.
Figure 9.
Comparison of the pressure drop per unit volumetric flow.
Figure 10.
The velocity profile of case 1, conventional cone, the average velocity is 1.98 m/s.
Figure 10.
The velocity profile of case 1, conventional cone, the average velocity is 1.98 m/s.
Figure 11.
Velocity profiles of case 1 (conventional cone) and case 2 (NURBS cone); the average velocities are 1.98 m/s and 1.99 m/s, respectively.
Figure 11.
Velocity profiles of case 1 (conventional cone) and case 2 (NURBS cone); the average velocities are 1.98 m/s and 1.99 m/s, respectively.
Figure 12.
Velocity profiles of case 3 (conventional cone) and case 4 (NURBS cone); the average velocities are 1.41 m/s and 1.64 m/s, respectively.
Figure 12.
Velocity profiles of case 3 (conventional cone) and case 4 (NURBS cone); the average velocities are 1.41 m/s and 1.64 m/s, respectively.
Figure 13.
Velocity profiles of case 5 (conventional cone) and case 6 (NURBS cone); the average velocities are 1.09 m/s and 0.89 m/s, respectively.
Figure 13.
Velocity profiles of case 5 (conventional cone) and case 6 (NURBS cone); the average velocities are 1.09 m/s and 0.89 m/s, respectively.
Figure 14.
Comparison of flow uniformity index.
Figure 14.
Comparison of flow uniformity index.
Figure 15.
Particle number size distribution for case 1, loading #4. b—before; a—after; R—round.
Figure 15.
Particle number size distribution for case 1, loading #4. b—before; a—after; R—round.
Figure 16.
Capturing efficiency for case 1, loading #4.
Figure 16.
Capturing efficiency for case 1, loading #4.
Table 1.
Physical properties of the carbon black.
Table 1.
Physical properties of the carbon black.
| Primary Particle Diameter. nm | BET. m2/g | Volatility. % | Oil Absorption. mL/(100 g) | Ash Content. % |
|---|
| 25 | 92 | 5 | 115 | 0.02 |
Table 2.
Physical properties of the cones.
Table 2.
Physical properties of the cones.
| Criteria | Cone 1 | Cone 2 |
|---|
| Pipe diameter d (mm) | 27.3 | 27.3 |
| Monolith diameter D (mm) | 104 | 104 |
| Cone length L (mm) | 38.35 | 38.35 |
| Cone type | Conventional | NURBS |
| Monolith type | GPF | GPF |
Table 3.
Physical properties of the full-sized GPF monolith.
Table 3.
Physical properties of the full-sized GPF monolith.
| Diameter. mm | Length (mm) | Volume (dm3) | Channel Density (cpsi) | Channel Size (mm) | Filter Wall Thickness (mm) |
|---|
| 104 | 140 | 1.19 | 300 | 1.1 | 0.1 |
Table 4.
Experimental cases.
Table 4.
Experimental cases.
| Cone # | Case # | Pressure Regulator (lb/in2) | Total Weight of the Deposited Particles (g) |
|---|
Cone 1
(Conventional) | Case 1 | 60 | 7.2 |
| Case 3 | 40 | 5.1 |
| Case 5 | 30 | 7.9 |
Cone 2
(NURBS) | Case 2 | 60 | 5.5 |
| Case 4 | 40 | 5.1 |
| Case 6 | 30 | 5.1 |
Table 5.
Comparison of the pressure drop per unit volumetric flow.
Table 5.
Comparison of the pressure drop per unit volumetric flow.
| Case # | Volumetric Flow (dm3/s) | Space Velocity (×104 h−1) | Pressure Drop per Unit Volumetric Flow (Pa·s/dm3) |
|---|
| 1 conventional | 16.88 | 5.11 | 28.20 |
| 2 NURBS | 16.95 | 5.13 | 23.19 |
| 3 conventional | 11.97 | 3.63 | 24.48 |
| 4 NURBS | 13.97 | 4.23 | 20.32 |
| 5 conventional | 9.29 | 3.25 | 22.11 |
| 6 NURBS | 7.60 | 2.30 | 25.68 |
Table 6.
Central velocity comparison of case 1 (conventional cone) and case 2 (NURBS cone).
Table 6.
Central velocity comparison of case 1 (conventional cone) and case 2 (NURBS cone).
| Case 1 | Case 2 | Reduction Ratio. % |
|---|
| Weight of Loaded Particles. g | Central Velocity. m/s | Weight of Loaded Particles. g | Central Velocity. m/s |
|---|
| 0 | 10.80 | 0 | 9.73 | 10 |
| 1.1 | 6.73 | 1.1 | 5.99 | 11 |
| 2.4 | 5.39 | 2.4 | 5.05 | 6 |
| 5.1 | 4.45 | 5.5 | 3.70 | 17 |
Table 7.
Central velocity comparison of case 3 (conventional cone) and case 4 (NURBS cone).
Table 7.
Central velocity comparison of case 3 (conventional cone) and case 4 (NURBS cone).
| Case 3 | Case 4 | Reduction Ratio (%) |
|---|
| Weight of Loaded Particles (g) | Central Velocity (m/s) | Weight of Loaded Particles (g) | Central Velocity (m/s) |
|---|
| 0 | 7.98 | 0 | 4.81 | 40 |
| 0.9 | 5.16 | 0.9 | 4.35 | 16 |
| 2.2 | 4.97 | 2.3 | 3.84 | 23 |
| 5.1 | 3.59 | 5.2 | 2.96 | 18 |
Table 8.
Central velocity comparison of case 5 (conventional cone) and case 6 (NURBS cone).
Table 8.
Central velocity comparison of case 5 (conventional cone) and case 6 (NURBS cone).
| Case 5 | Case 6 | Reduction Ration (%) |
|---|
| Weight of Loaded Particles (g) | Central Velocity (m/s) | Weight of Loaded Particles (g) | Central Velocity (m/s) |
|---|
| 0 | 6.44 | 0 | 5.28 | 18 |
| 1.1 | 4.41 | 1 | 3.58 | 19 |
| 2.8 | 3.66 | 3.1 | 2.95 | 19 |
| 5.7 | 2.97 | 5.1 | 2.58 | 13 |
© 2019 by the authors. Licensee MDPI, Basel, Switzerland. This article is an open access article distributed under the terms and conditions of the Creative Commons Attribution (CC BY) license (http://creativecommons.org/licenses/by/4.0/).


