Article

Evaluation of a Scale-Resolving Methodology for the Multidimensional Simulation of GDI Sprays

by
Giovanni Di Ilio
1,*,
Vesselin K. Krastev
2 and
Giacomo Falcucci
2
1
Department of Engineering, University of Rome “Niccolò Cusano”, Via Don Carlo Gnocchi, 3, 00166 Rome, Italy
2
Department of Enterprise Engineering “Mario Lucertini”, University of Rome “Tor Vergata”, Via del Politecnico, 1, 00133 Rome, Italy
*
Author to whom correspondence should be addressed.
Energies 2019, 12(14), 2699; https://doi.org/10.3390/en12142699
Submission received: 22 June 2019 / Revised: 9 July 2019 / Accepted: 12 July 2019 / Published: 15 July 2019
(This article belongs to the Special Issue Experimental and Numerical Analysis of Fuel Spray in Engines)

Abstract

:
The introduction of new emissions tests in real driving conditions (Real Driving Emissions—RDE) as well as of improved harmonized laboratory tests (World Harmonised Light Vehicle Test Procedure—WLTP) is going to dramatically cut down NOx and particulate matter emissions for new car models that are intended to be fully Euro 6d compliant from 2020 onwards. Due to the technical challenges related to exhaust gases’ aftertreatment in small-size diesel engines, the current powertrain development trend for light passenger cars is shifted towards the application of different degrees of electrification to highly optimized gasoline direct injection (GDI) engines. As such, the importance of reliable multidimensional computational tools for GDI engine optimization is rapidly increasing. In the present paper, we assess a hybrid scale-resolving turbulence modeling technique for GDI fuel spray simulation, based on the Engine Combustion Network “Spray G” standard test case. Aspects such as the comparison with Reynolds-averaged methods and the sensitivity to the spray model parameters are discussed, and strengths and uncertainties of the analyzed hybrid approach are pointed out. The outcomes of this study serve as a basis for the evaluation of scale-resolving turbulence modeling options for the development of next-generation directly injected thermal engines.

1. Introduction

The efficient design of small-sized gasoline direct injection (GDI) engines for the EU market is a key factor for current car manufacturers, which are going to face the forthcoming regulations on polluting emissions [1]. In order to reduce turnaround times, an increasing amount of resources are being devoted to high-fidelity computational fluid dynamics (CFD) during the development and optimization of fuel injection systems [2,3,4,5]. The most widespread method for the multidimensional modeling of reactive and non-reactive fuel sprays is the Eulerian–Lagrangian (EL) approach, in which the gaseous phase treatment follows the classical Eulerian description while the liquid phase is tracked as a discrete set of Lagrangian particles (LPs). The LP tracking works well in the diluted spray region, while it usually requires some amount of parameter tuning for the near-nozzle region—especially concerning breakup processes.
Turbulence modeling has a great influence on LP tracking, as it is directly linked to the spray particle aerodynamics and dispersion and, consequently, to the spray pattern and fuel mixing in the engine cylinder volume. The EL approach was originally coupled to time-dependent forms of Reynolds-averaged turbulence treatments (i.e., to the so-called unsteady-RANS (URANS) turbulence models). The adoption of URANS commonly represents a good compromise between computational costs and overall accuracy, but may also introduce further model-specific dependence. In addition, the statistical nature of Reynolds averaging does not allow local perturbations generated by different sources of cycle-to-cycle variability to be captured. In that sense, a natural step forward is represented by large eddy simulation (LES), which applies an appropriate time and space filtering method to the full Navier–Stokes equations in order to predict large-scale unsteady flow structures. In the past two decades, LES has been extensively developed for engine modeling [6], making significant progress towards industry-grade maturity. Nonetheless, LES/LP coupling is still relatively new [7,8,9,10,11], thus leaving room for further research and development in that area. One of the main issues in LES/LP matching is the spatial grid resolution which for LES has to be sufficiently fine to resolve at least the main energy-containing flow structures. This requirement fits well with LP tracking in the diluted spray zone [9], where velocity gradients are relatively weak and the dimension of spray droplets is small compared to the computational cell size. Conversely, the near-nozzle high-speed spray region may require stricter mesh refinement levels for LES, which however is likely to violate some of the hypotheses that lie behind the Lagrangian tracking rationale (i.e., small particle size compared to the grid spacing).
In the present paper, we propose a hybrid scale-resolving turbulence modeling approach as a potential remedy for the numerical resolution mismatch in GDI spray computations. Broadly speaking, a hybrid URANS/LES method should be based on the ability to adapt its behavior by applying the best-fitting modeling option with respect to the available numerical resolution. In the past 10 years, the number of engine-related hybrid modeling applications has been constantly increasing [12,13,14,15,16,17,18,19,20,21,22,23,24,25,26], but hybrid/LP investigations are almost absent [27,28]. In our study, we evaluated two previously developed hybrid scale-resolving approaches [21,24,28,29] for a computational analysis of the “Spray G” reference GDI injector [30]. The rest of the paper is organized as follows: first, we introduce the standard Engine Combustion Network (ECN) “Spray G” injector and operating conditions; later, we provide details on the spray modeling adopted in this work, we describe the proposed hybrid turbulence strategies, and we define the numerical setup. We then present our computational results along with a discussion. Finally, a summary of our main findings is given in the concluding section.

2. Standard ECN “Spray G” Operating Conditions

The “Spray G” case, as defined by the Engine Combustion Network (ECN) group, corresponds to a non-reacting spray for gasoline injection. Its standard operating conditions, for which a wide literature dataset exists, are reported in Table 1.
The “Spray G” injector is characterized by an eight-hole geometry. In the present investigation, the actual geometry of the injector, which is represented in Figure 1, is not taken into account.
Rather, we define an injection model by specifying the main geometrical parameters of the injector. In particular, for the “Spray G” injector, the orifice drill angle relative to nozzle axis is 37 . However, it has been observed that the spray plumes deflect towards the injector axis during the injection. This leads to a difference between the drill angle and the actual plume direction, which reduces towards a lower value. To ensure consistency of the results, we set this angle equal to 33 according to the indications provided in previous studies [31]. Another fundamental parameter is the plume cone angle, which significantly affects the spray evolution [31,32]. Evidence from numerical works available in the literature highlight the absence of a consistent setup for the plume cone angle of the “Spray G” injector [31]. Typical values for such a parameter are between 5 and 40 . Thus, after performing a calibration analysis, we set the value of the plume cone angle in our injection model to 38 .
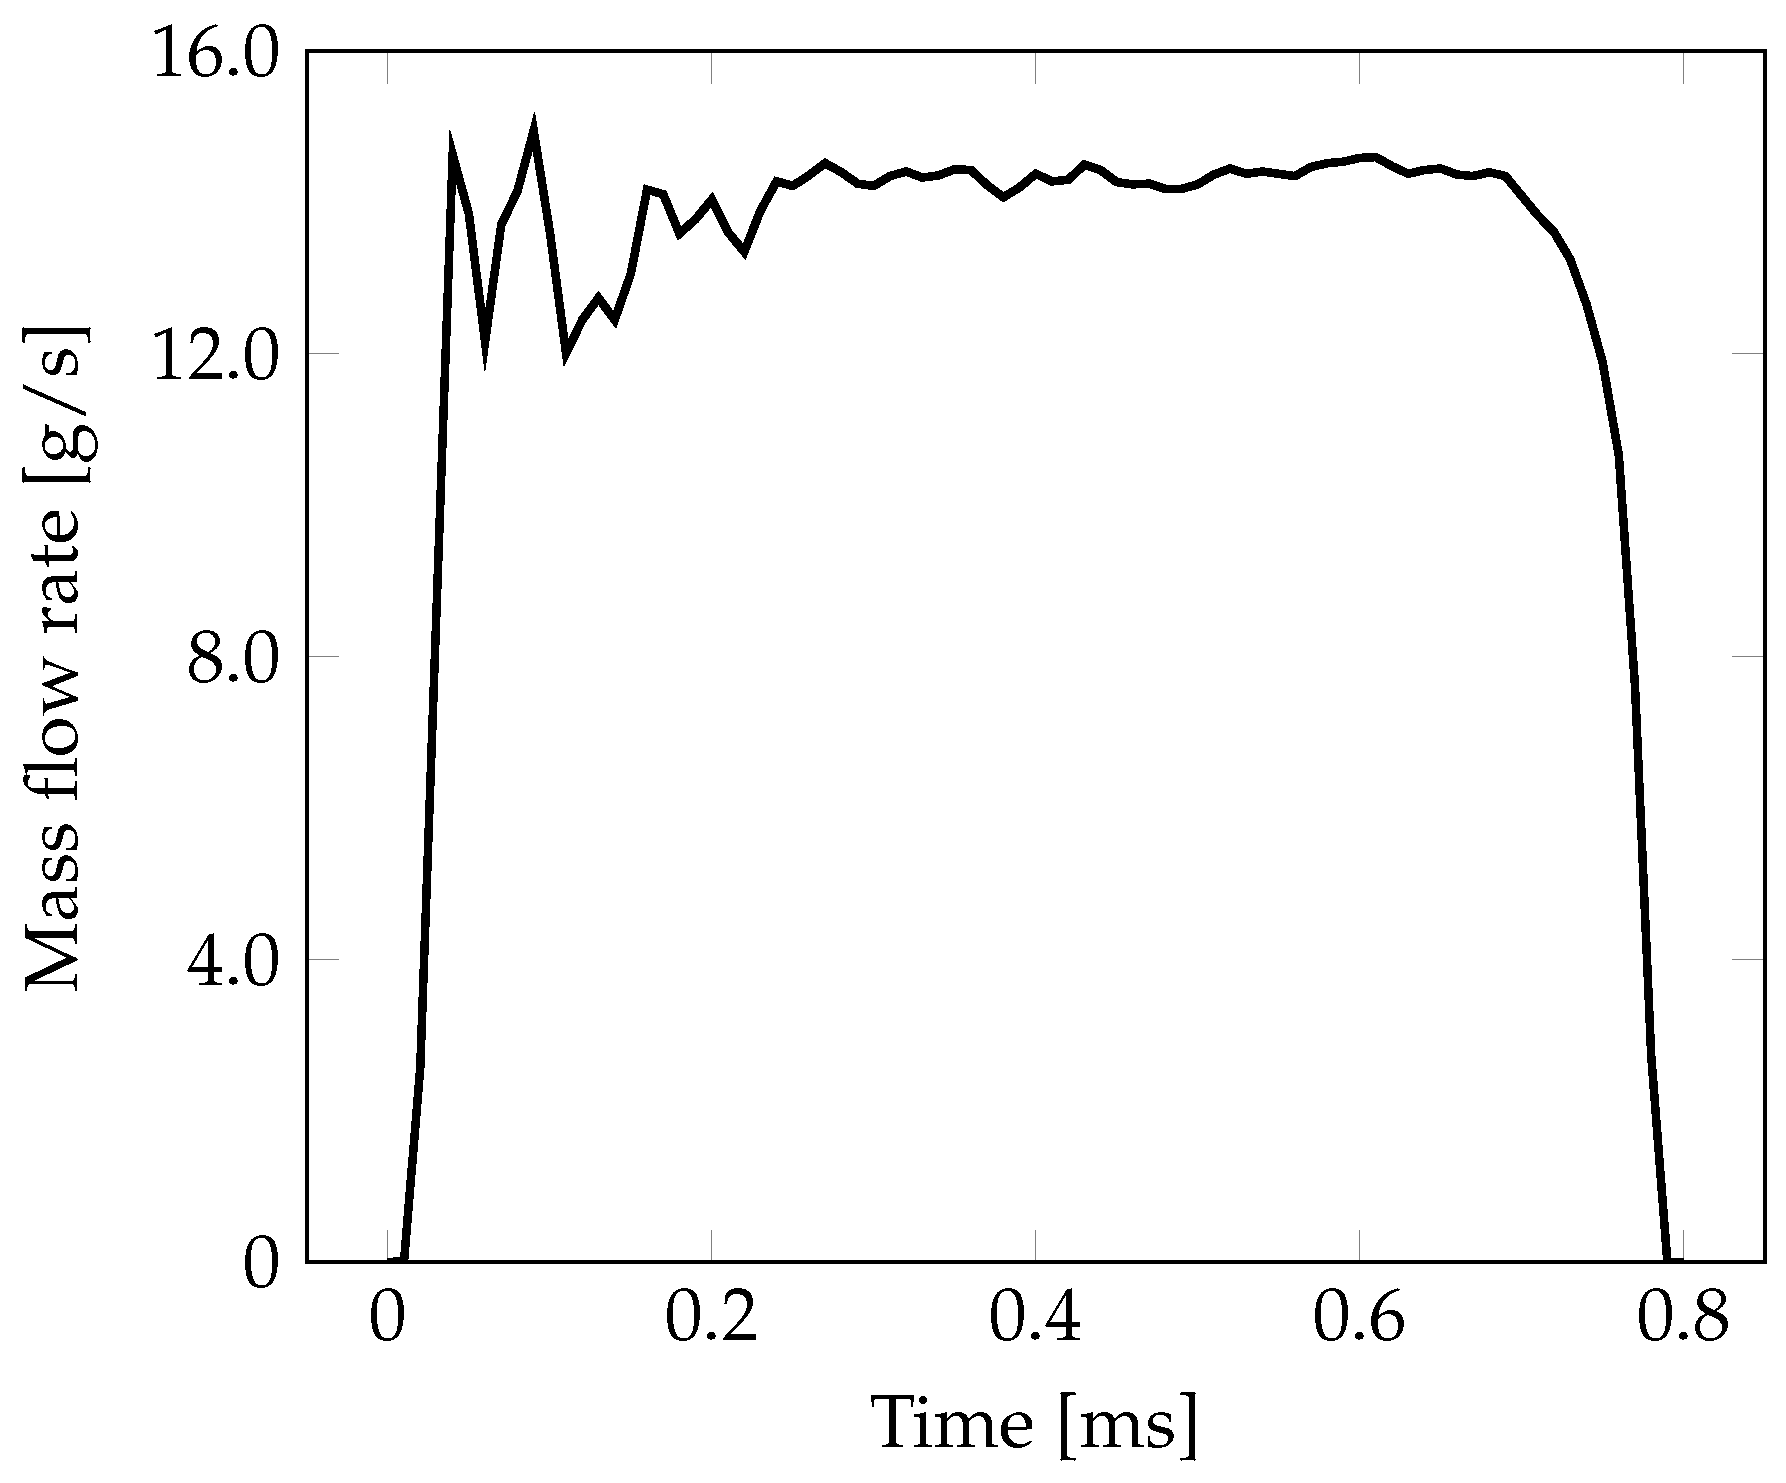
Finally, the reference rate of injection for the target conditions of “Spray G” considered in this study was provided by the ECN [30], and it is shown in Figure 2.

3. Materials and Methods

In this work, we modeled the spray by making use of a coupled Eulerian–Lagrangian approach. According to this methodology, the liquid phase is described by means of discrete parcels, which are groups of droplets having the same properties. The evolution of parcels is then tracked within a continuum framework and interaction with surrounding gas phase is taken into account.

3.1. Spray Models

To simulate the injection of the liquid phase, we adopted the blob model. This model consists of injecting Lagrangian spray parcels into the computational domain with the same diameter of the nozzle holes. The velocity of the injected parcels is related to the adopted mass flow rate (Figure 2). In particular, by following the experimental measurements of Payri et al. [33], we computed the parcels’ initial velocity profile by considering a value for the area coefficient—namely, the ratio between the effective area of injection and the nominal injector holes area—equal to 0.65.
Fuel vaporization and mixing with ambient gas are due to breakup, heat transfer, and evaporation phenomena occurring during the injection time. Here, we adopt the Ranz–Marshall model to evaluate the heat transfer between liquid and gas phases, the evaporation model of Spalding [34], while we do not consider any collision model.
We chose the Kelvin–Helmholtz Rayleigh–Taylor (KHRT) model to predict primary and secondary breakup of the liquid jet [35,36,37], coupled with the liquid breakup length concept [38]. According to this approach, the KH theory is applied to the droplets leaving the nozzle, while the RT model, which takes into account instabilities of the liquid–gas interfaces due to different fluid densities, is applied only beyond a certain distance from the injector (i.e., the liquid core). The KHRT approach requires several model constants to be specified. With reference to the nomenclature defined in [35] and commonly adopted in the literature [30], in Table 2 we report the whole set of breakup model constants used in the present study.
We emphasize that, while the parameters B 0 , C τ and C R T were fixed according to the values provided in the literature, the model constants B 1 and C b were obtained from a tuning procedure. In particular, we conducted a preliminary analysis by performing numerical simulations via URANS approach with kg closure model. The obtained optimal values for these model constants were then kept as fixed parameters for the whole set of numerical simulations performed in this work.

3.2. Turbulence Modeling

In our investigation we considered two different hybrid turbulence models for spray simulation, both originating from the detached eddy simulation (DES) technique [39,40,41]. The principle of DES modeling is to realize a local modification of the involved length scale, based on the comparison between the turbulence length scale of the background RANS model and a length scale associated with the local grid size. Thus, this strategy allows the model to behave as pure-RANS or pure-LES depending on the choice made for the value of the length scale in the numerical formulation.
The two DES approaches considered here were adopted along with the two-equation kg model [42], where k and g are the turbulent kinetic energy and the square root of a characteristic turbulent time scale, respectively. In particular, we made use of a limited time scale kg closure as in [28,43,44,45,46], which led to the following set of model transport equations:
ρ k t + · ρ U k = P S k + · μ t σ k + μ k ,
ρ g t + · ρ U g = ρ β g 2 β * τ α g 3 2 k τ P + · μ t σ g + μ g + μ t σ g + μ 3 g τ g · g ,
with the dynamic turbulent viscosity μ t given by:
μ t = ρ β * k τ = ρ β * l R A N S k 1 / 2
In Equations (1)–(3), ρ and U are the fluid density and velocity, respectively, P is the standard turbulence production term, β * = 0.09 , l R A N S = k 1 / 2 τ is the turbulence length scale of the URANS model, while α , β , σ g , and σ k are the closure constants as in the original kg model formulation. The turbulent time scale τ is defined as follows [44,45,46]:
τ = min g 2 , a τ τ l i m ,
where the bounding value is expressed as:
τ l i m = 2 3 β * 3 8 | E | 2 ,
with the term | E | 2 being the magnitude squared of the mean rate-of-strain tensor, while a τ 1 is a model constant. In this work, in accordance with findings from a previous publication [28], we set a τ = 0.8, which represents the suggested value for spray simulation.
The two considered hybrid implementation strategies differ from each other on the basis of the choice of terms in Equations (1)–(3), in which the turbulence length scale is modified. The first model formulation, which we shall refer to as DES in the remaining part of the paper, is the one of Travin et al. [40] and it is obtained by manipulating only the sink term of the turbulent kinetic energy transport equation, as follows:
S k , D E S = F D E S S k , R A N S ,
where
S k , R A N S = ρ k τ = ρ k 3 / 2 l R A N S ,
and
F D E S = max l R A N S C D E S Δ , 1 ,
where Δ is a spatial filter parameter related to the local grid spacing, while C D E S is a model constant that was set to 0.5. We emphasize that, for the present formulation, the turbulent viscosity was calculated as in the standard URANS model by relation (3), and the g transport equation remained unmodified throughout as well. The function F D E S therefore represents a seamless DES mode of operation, which leads the model to switch dynamically between URANS-type and LES-type modes of operation depending on the l R A N S / ( C D E S Δ ) ratio.
The second hybrid implementation strategy, which is referred to in this work as DESx, is instead derived from the so called X-LES model (extra-large eddy simulation) by Kok et al. [47]. In this case, the turbulent length scale is modified in either the destruction term of the k transport Equation (1) and in the turbulent viscosity expression (3). Therefore, similarly to the DES model described above, the sink term of the turbulent kinetic energy transport equation reads as follows:
S k , D E S x = F D E S x S k , R A N S ,
with the function F D E S x being given by:
F D E S x = max l R A N S C D E S x Δ , 1
where by following Yan et al. [48], we set the value for the model constant C D E S x equal to 0.6. In addition, the turbulent viscosity relation is modified as follows:
μ t , D E S x = ρ β * l R A N S F D E S x k 1 / 2 .
We note that for the present DESx model, when the LES-type mode of operation is activated, the turbulent viscosity reduces to μ t , D E S x = ρ β * C D E S x Δ k 1 / 2 and therefore it is independent of the value of the turbulent scalar quantity g. This leads to a consistent LES mode, with the turbulent kinetic energy behaving as a sub-grid scale (SGS) kinetic energy. We also emphasize that in the unresolved regions of the flow (i.e., URANS-type mode of operation), the two hybrid formulations are identical to each other.

3.3. Numerical Setup

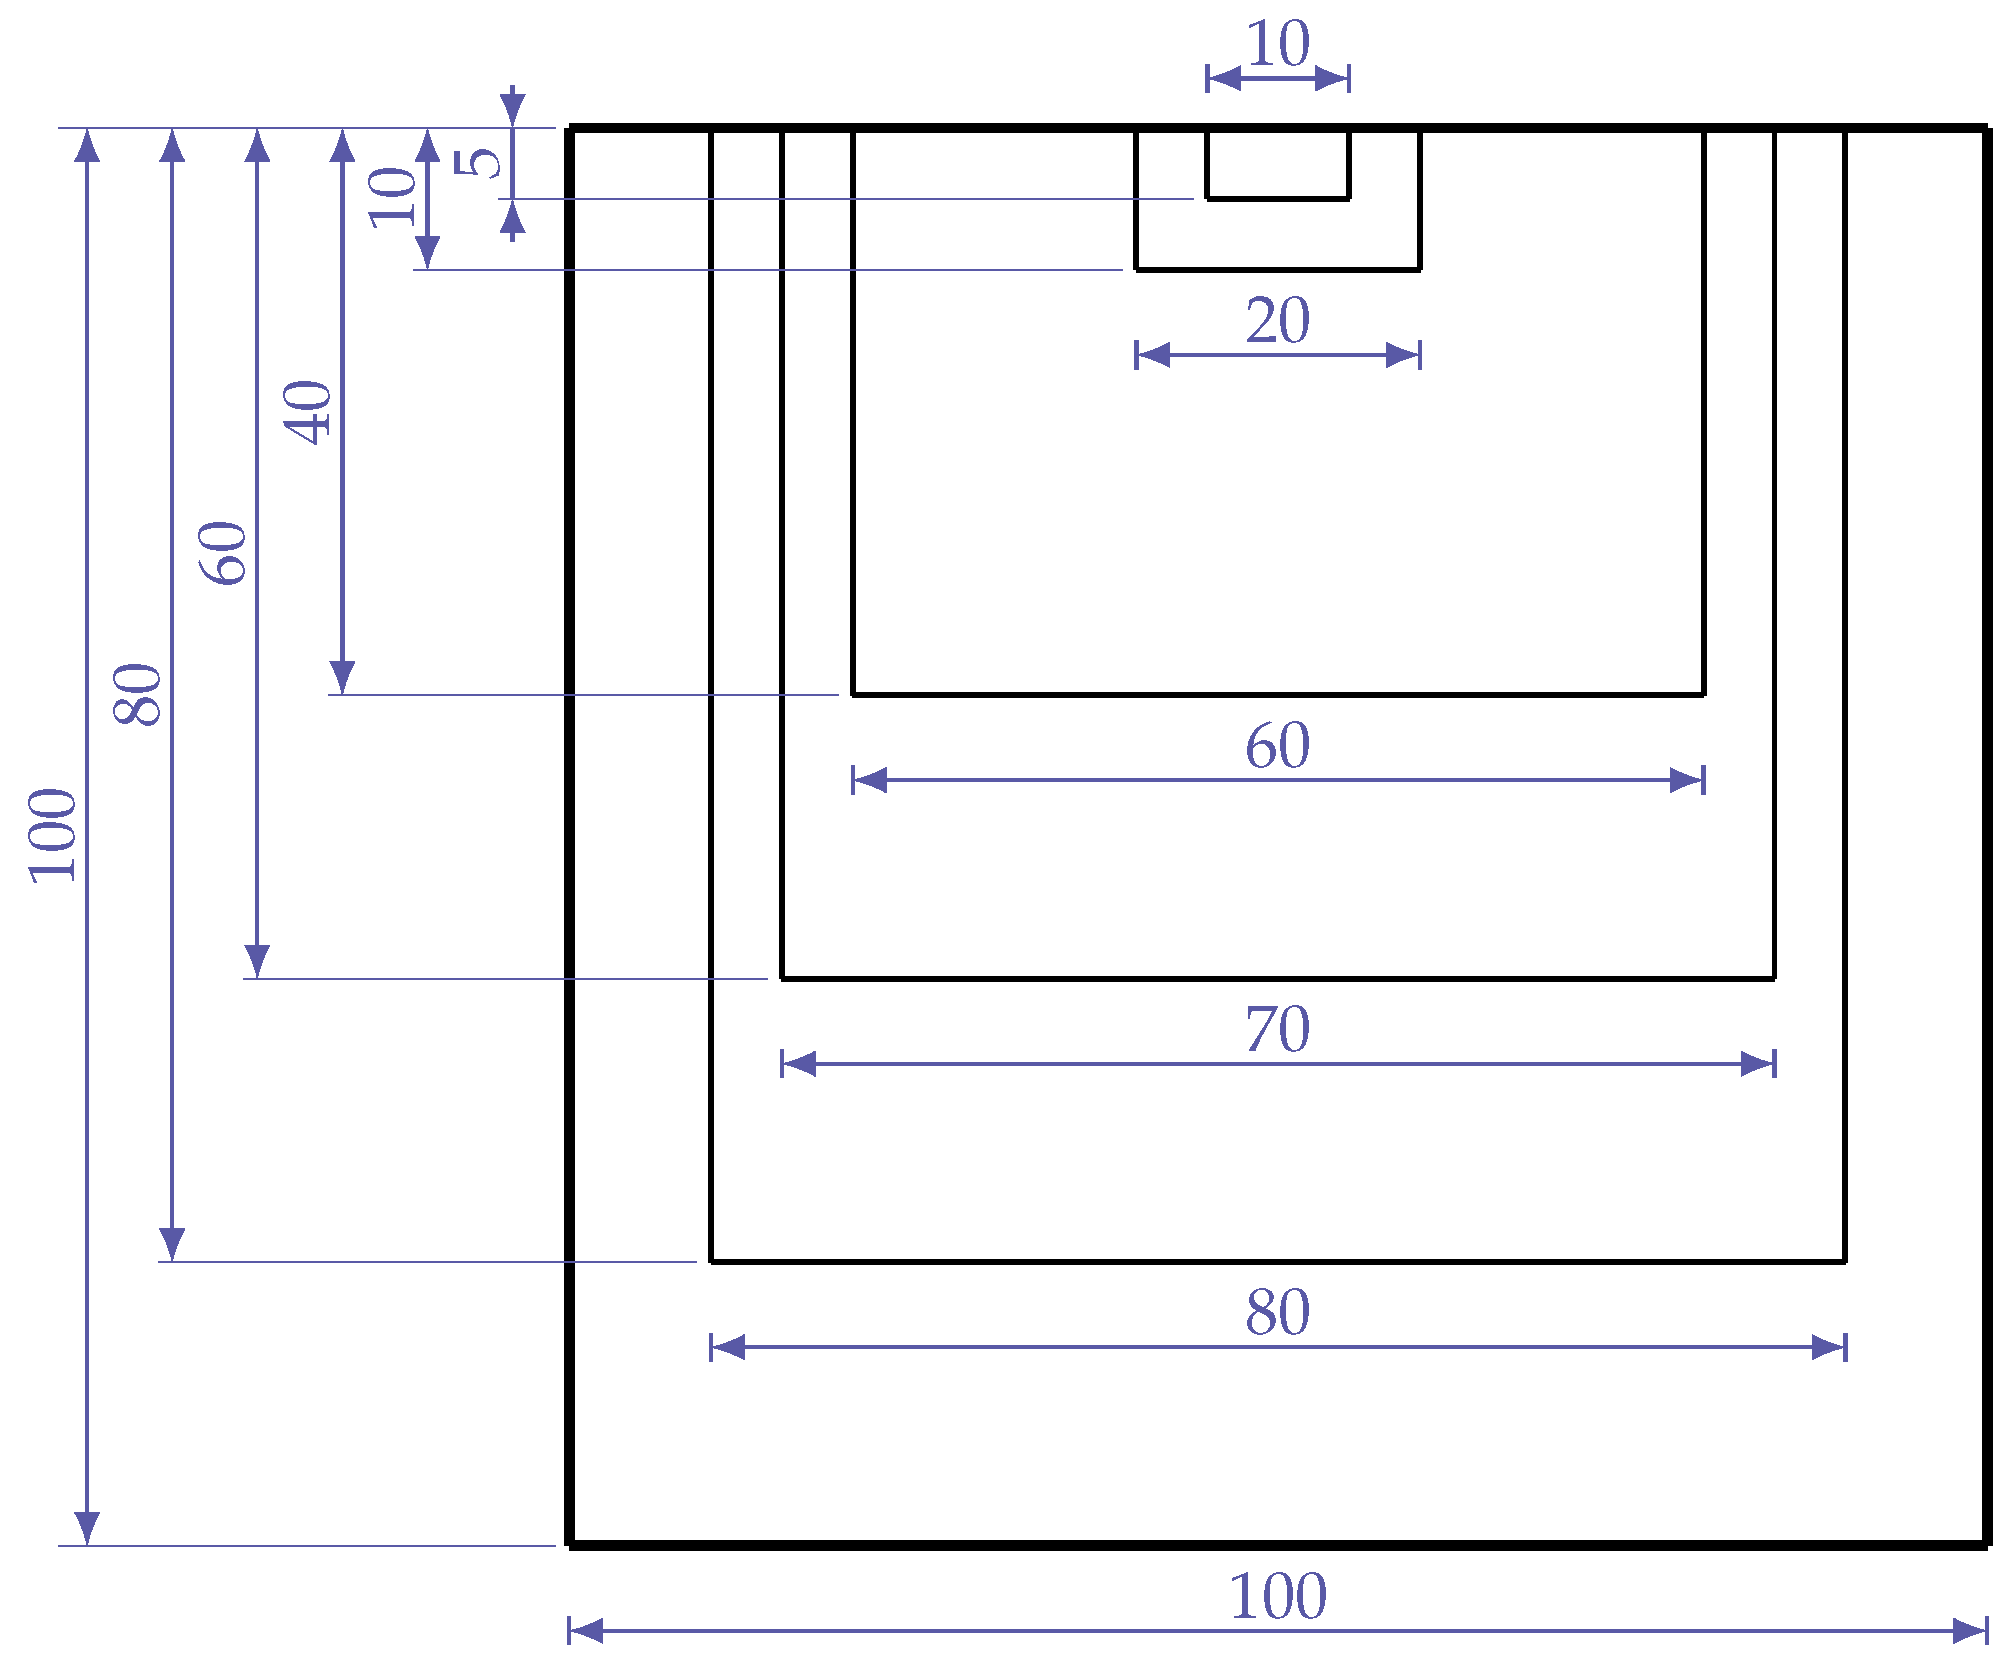
The computational domain geometry used in this work was a cube of 100 mm side, with the injector located at the center of the top surface. Our numerical study was conducted by using 3D Cartesian meshes, which were based on a fully hexahedral uniform structure and were then refined by a cell-splitting approach. Specifically, the local refinement was realized by employing a sequential cell-splitting strategy within coaxial cylindrical regions, whose axes were coincident with the injector axis. In particular, we constructed two different meshes: the coarsest was characterized by a grid resolution ranging from 0.25 mm in the near-injector region to 4 mm; the finest had the same structure as the other one, but it was characterized by one more level of refinement in the closest proximity of the injector, which set its minimum grid size to 0.125 mm. The two meshes accounted for roughly 1.2 and 1.4 million cubic cells, respectively. A schematic for the finest mesh is represented in Figure 3.
In all of the cases analyzed in this study, the computational domain was characterized by a zero velocity condition before the start of the injection. Moreover, the number of injected parcels per injector was 15,000.
Numerical simulations were performed with the open-source CFD code OpenFOAM-6 [49] coupled with a set of dynamic libraries, developed by the authors, to support hybrid turbulence modeling. A compressible flow solver which makes use of a pressure implicit with splitting operators (PISO) algorithm, was applied for all the simulations. The momentum convection was numerically solved by means of a linear upwind differencing scheme when the URANS model was employed, while for hybrid simulations we used a linear scheme to improve stability. In all cases, the time derivative discretization was realized via a second-order implicit Crank–Nicolson scheme, with off-centering coefficient equal to 0.5, and the selected value of the time-step was 4 × 10 7 .

4. Results and Discussion

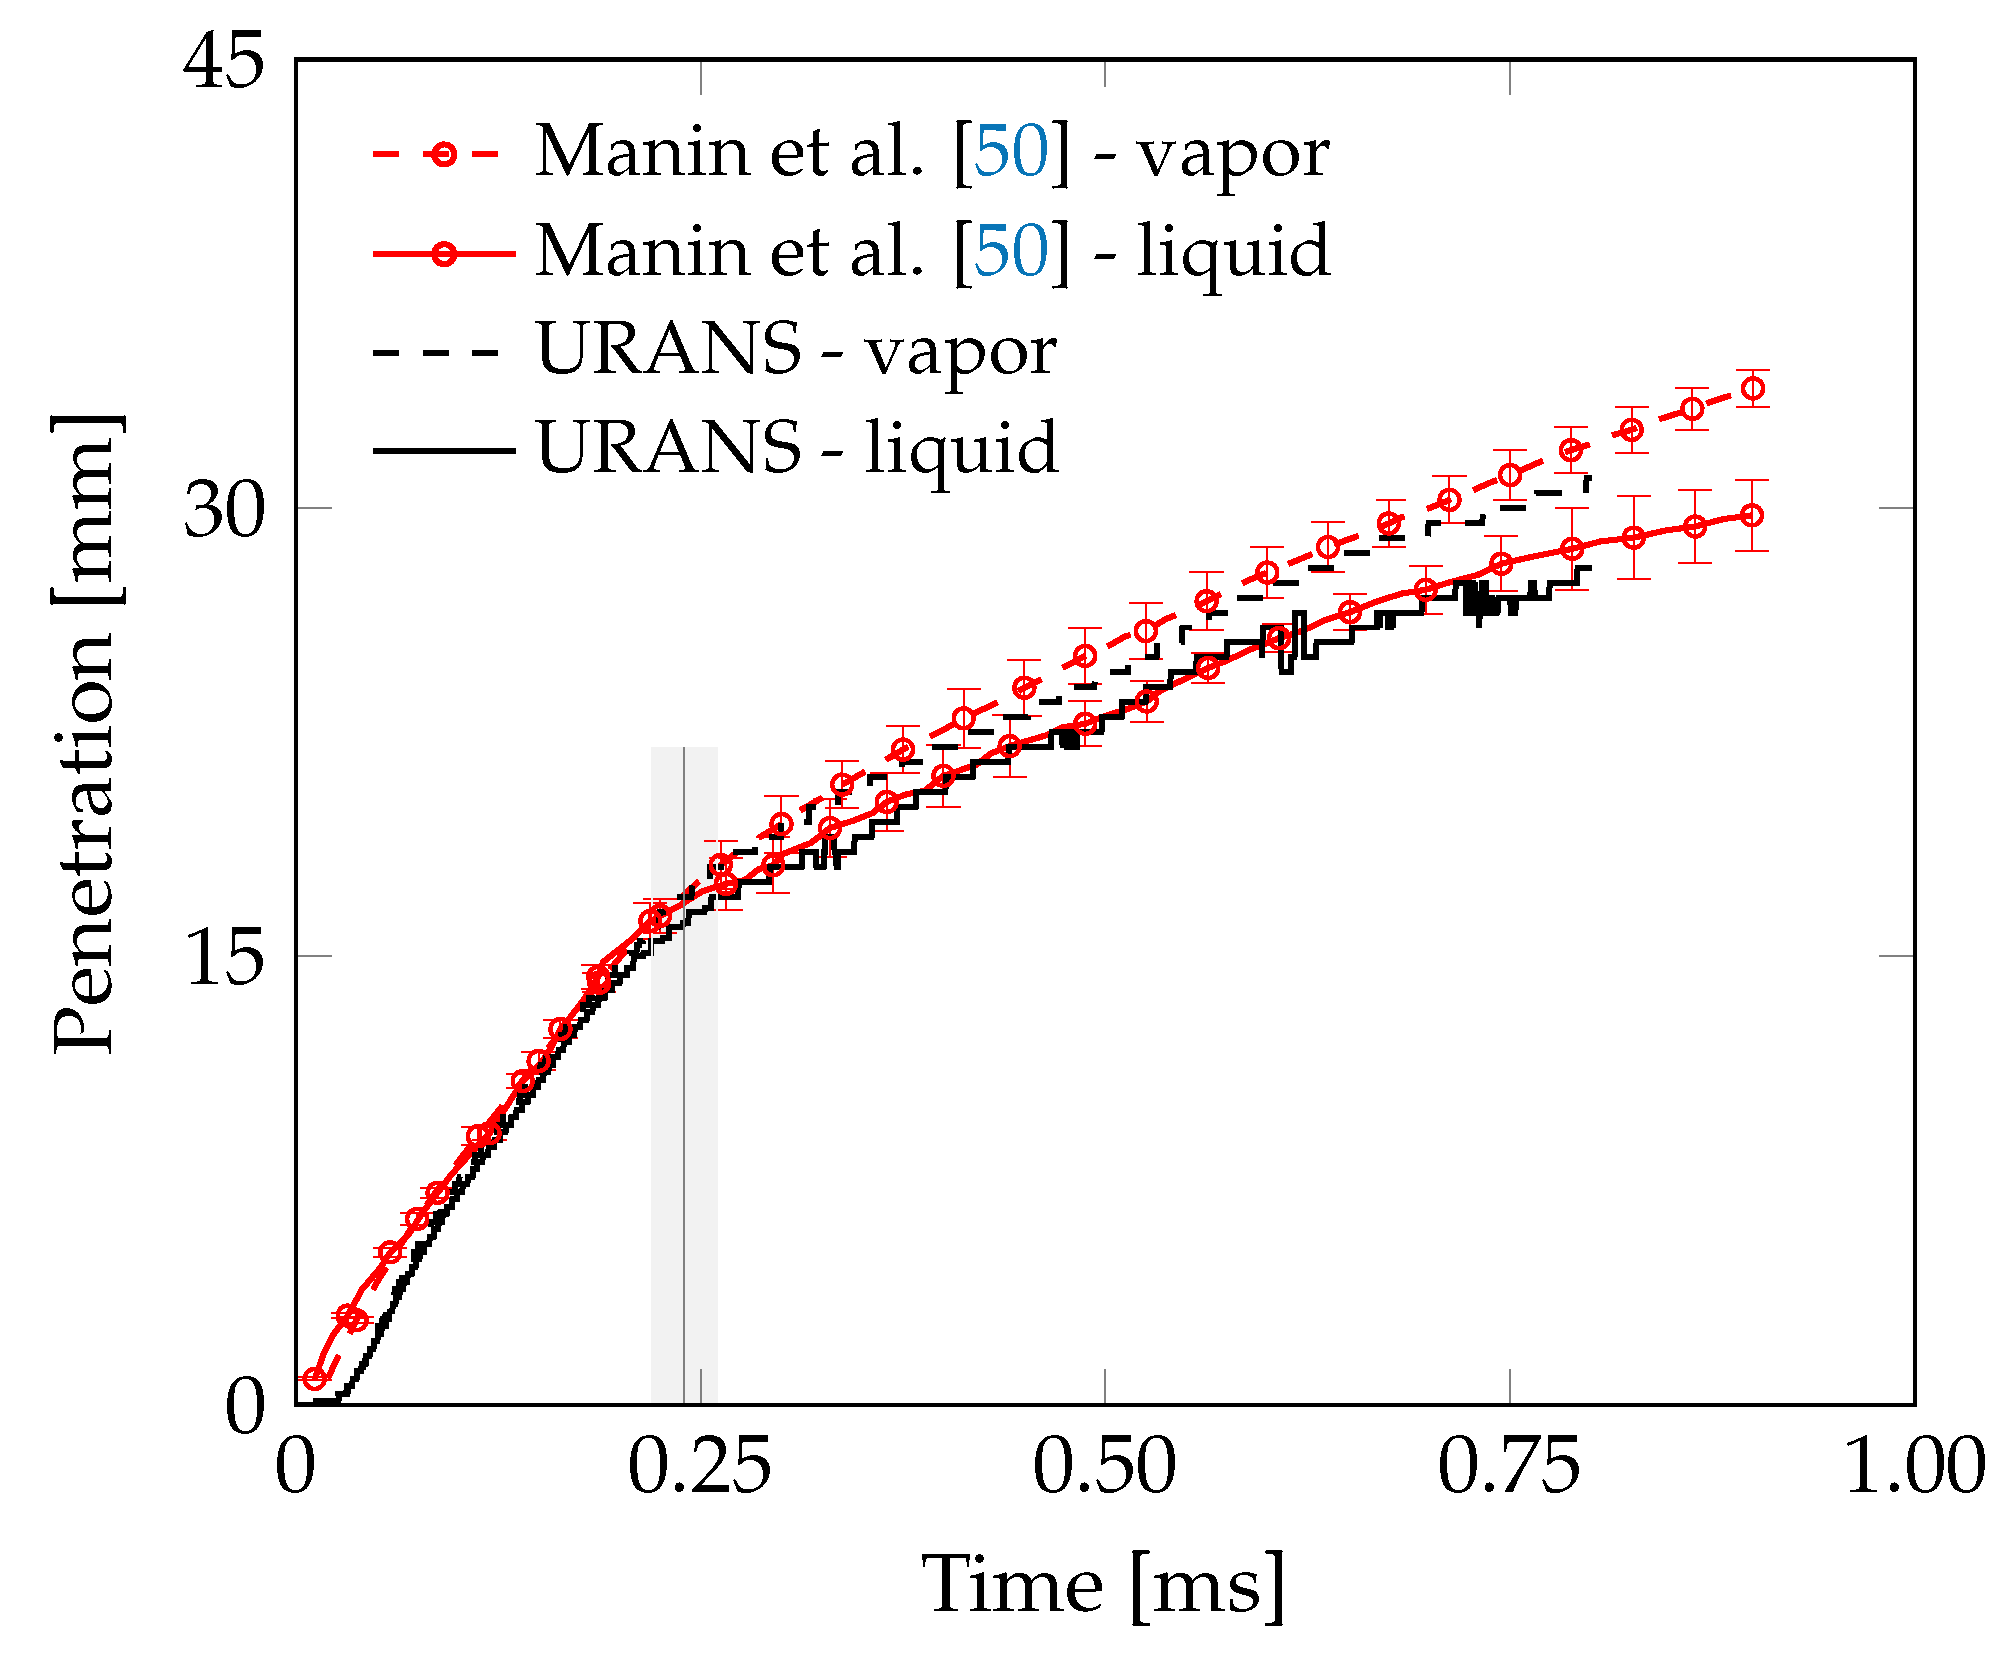
As a first step, we validated the numerical model by performing a URANS simulation and by comparing the results, in terms of both liquid and vapor penetration, with the available experimental data of Sandia National Laboratories (SNL) for the baseline “Spray G”. As recommended by ECN, we defined liquid and vapor penetration as the maximum distance from the injector to the farthest axial position for 0.1% liquid volume fraction and to where the fuel mass fraction was 0.1%, respectively. The URANS simulation was conducted on the coarse mesh and the obtained results are shown in Figure 4.
We observed a very good agreement between our results and those provided in [50]. Both liquid and vapor penetration trends matched the expected profiles. In particular, the separation point between vapor and liquid tips, occurring roughly at 0.25 ms after the start of injection (ASOI) seemed to be very well predicted. This finding confirms that a value of 0.8 for the model constant a τ is suitable to adequately capture the global behavior of the fuel spray.
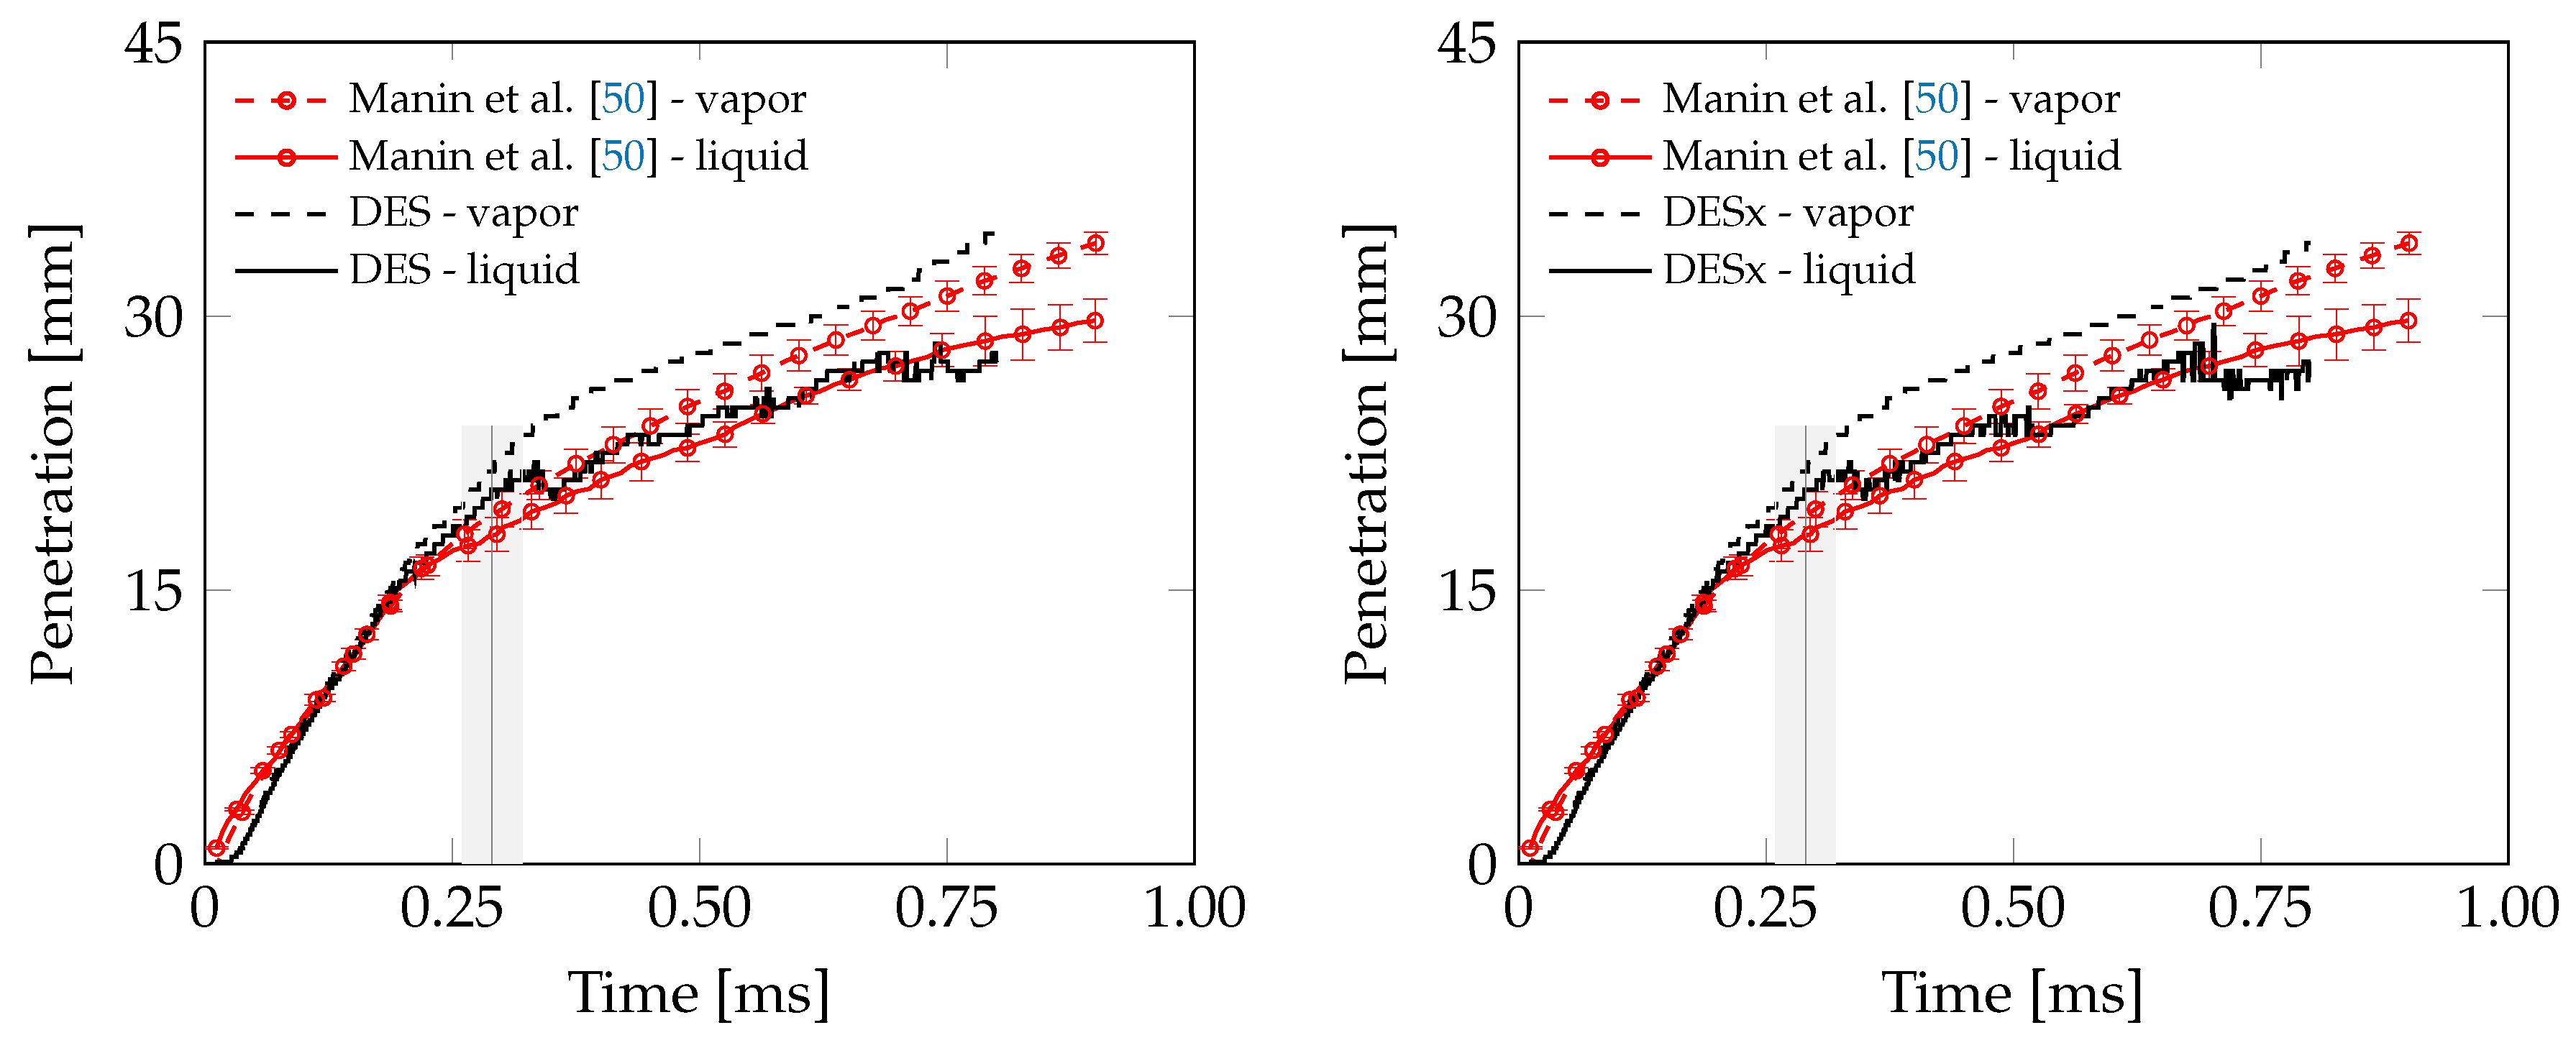
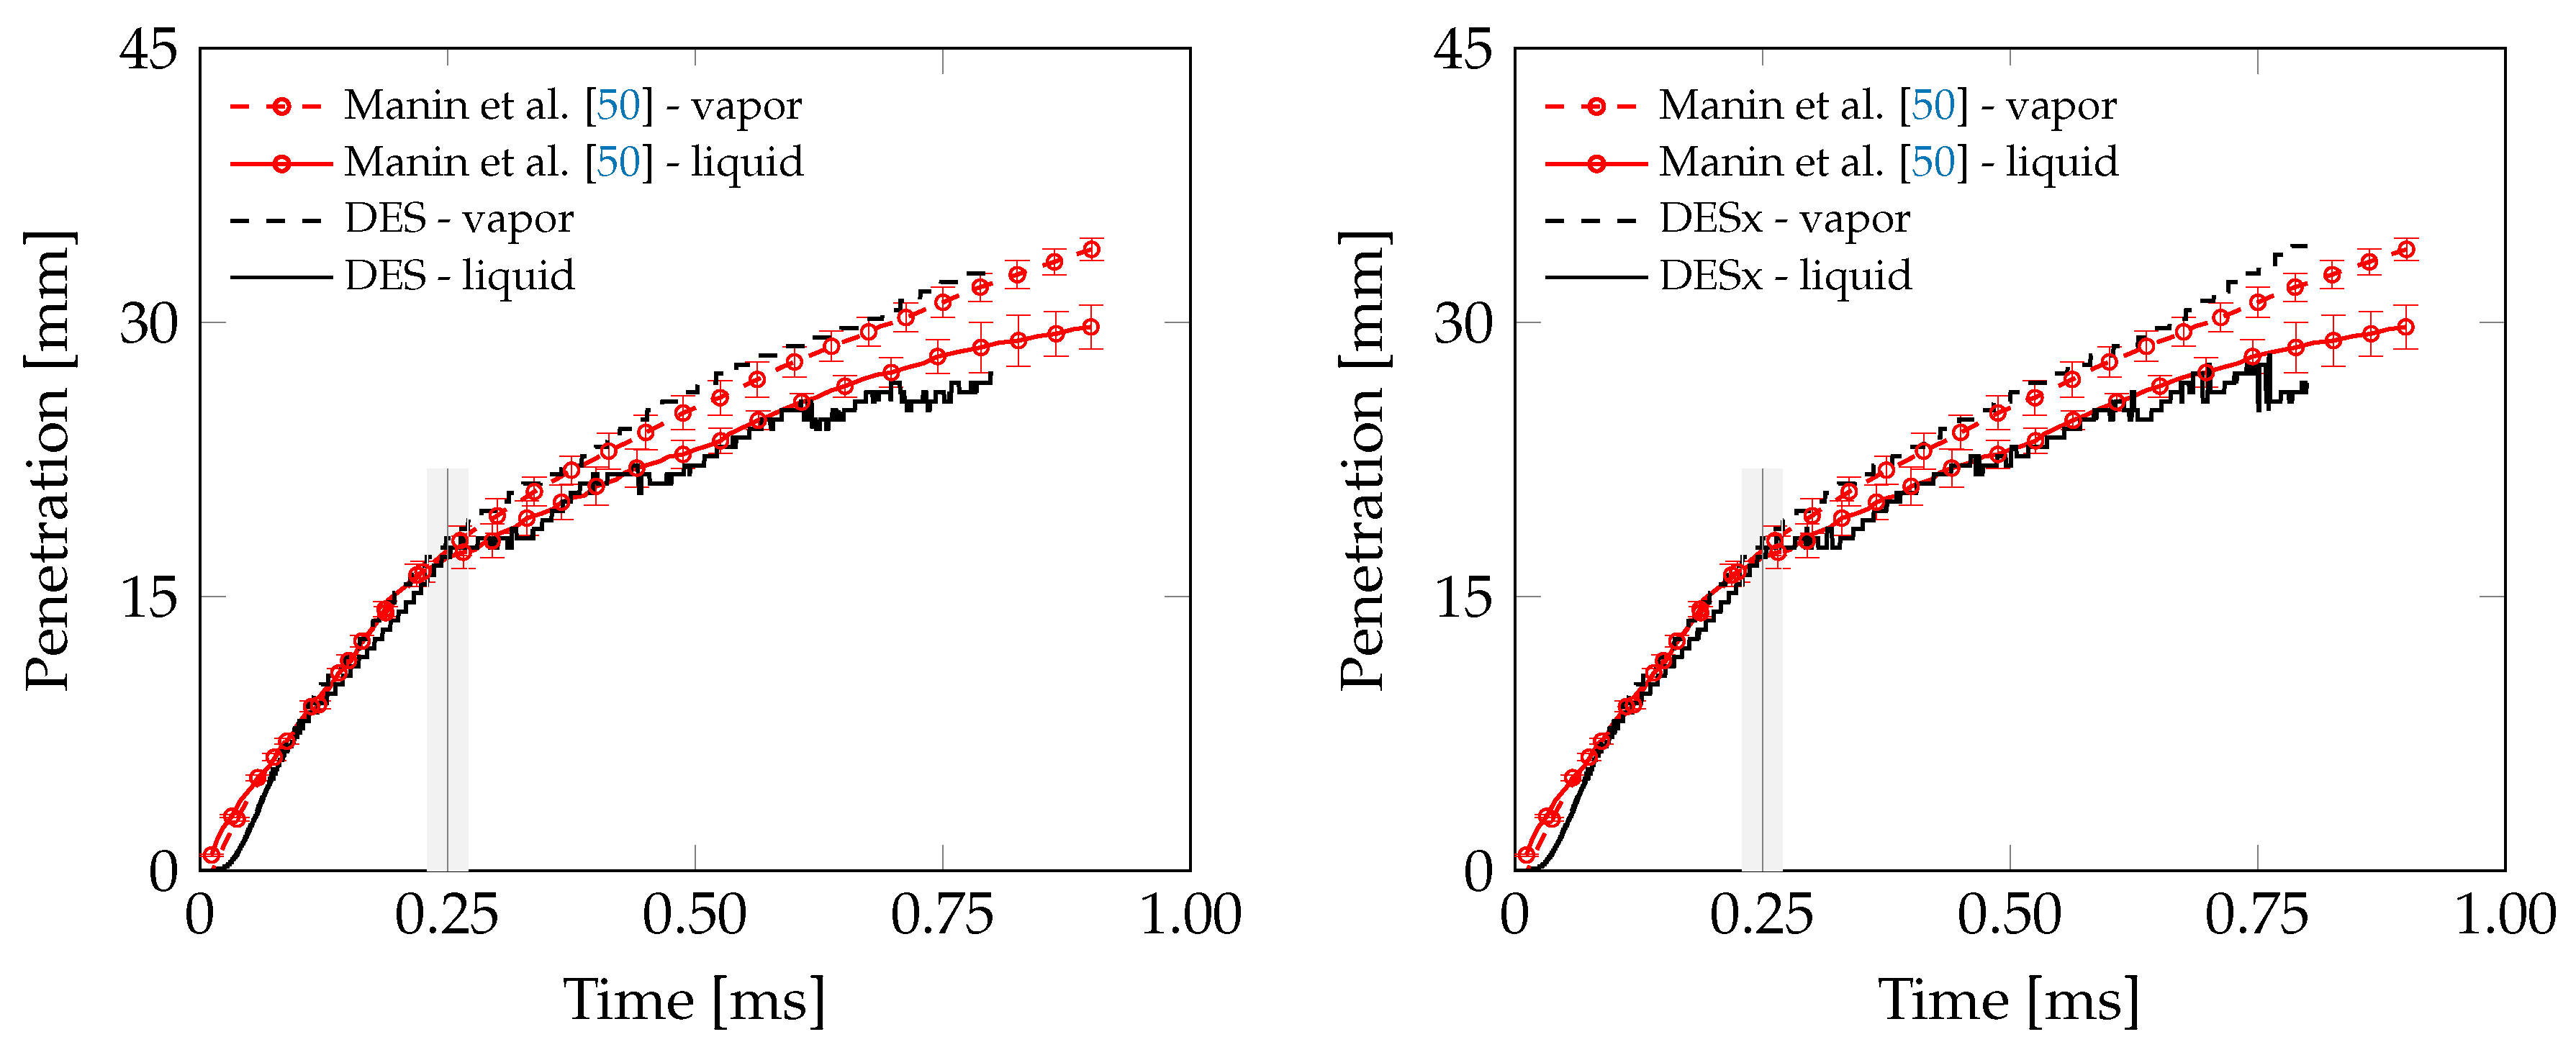
Next, we performed DES and DESx simulations on the same coarse mesh. The hybrid models allow a dynamical switching between pure-URANS and pure-LES modes of operation depending on the local modification of the length scale involved. In particular, only one single realization for each case was simulated, and the results were then compared to the experimental mean together with the provided experimental dispersion. In Figure 5 we show the obtained vapor and liquid penetrations for the two models considered.
Both DES and DESx models seemed to exhibit a very similar behavior. In both cases, however, the vapor penetration tip was overestimated when the time was beyond roughly 0.25 ms ASOI. In fact, the separation point between vapor and liquid tips seemed to be delayed, thus leading to an incorrect prediction of the evaporation phenomenon. This unavoidably affected the overall vapor penetration trend whose slope did not match the one reported by the experimental data.
In order to understand the impact of the mesh resolution on the hybrid strategy, we further performed DES and DESx simulations on the fine mesh. The numerical setup was kept the same as for simulations on the coarse mesh. The results are shown in Figure 6.
Again, we observed a very similar behavior between DES and DESx models, and in both cases the obtained results showed very good agreement with the experimental data. Simulations performed on the fine mesh indicated that a high mesh resolution in the closest proximity of the injector is instrumental to properly predict the global behavior of the present GDI spray via hybrid approach. The reported results show a correct trend for both vapor and liquid penetration. In particular, we notice that the separation point between vapor and liquid tips was correctly captured, thus indicating that the evaporation process was adequately modeled.
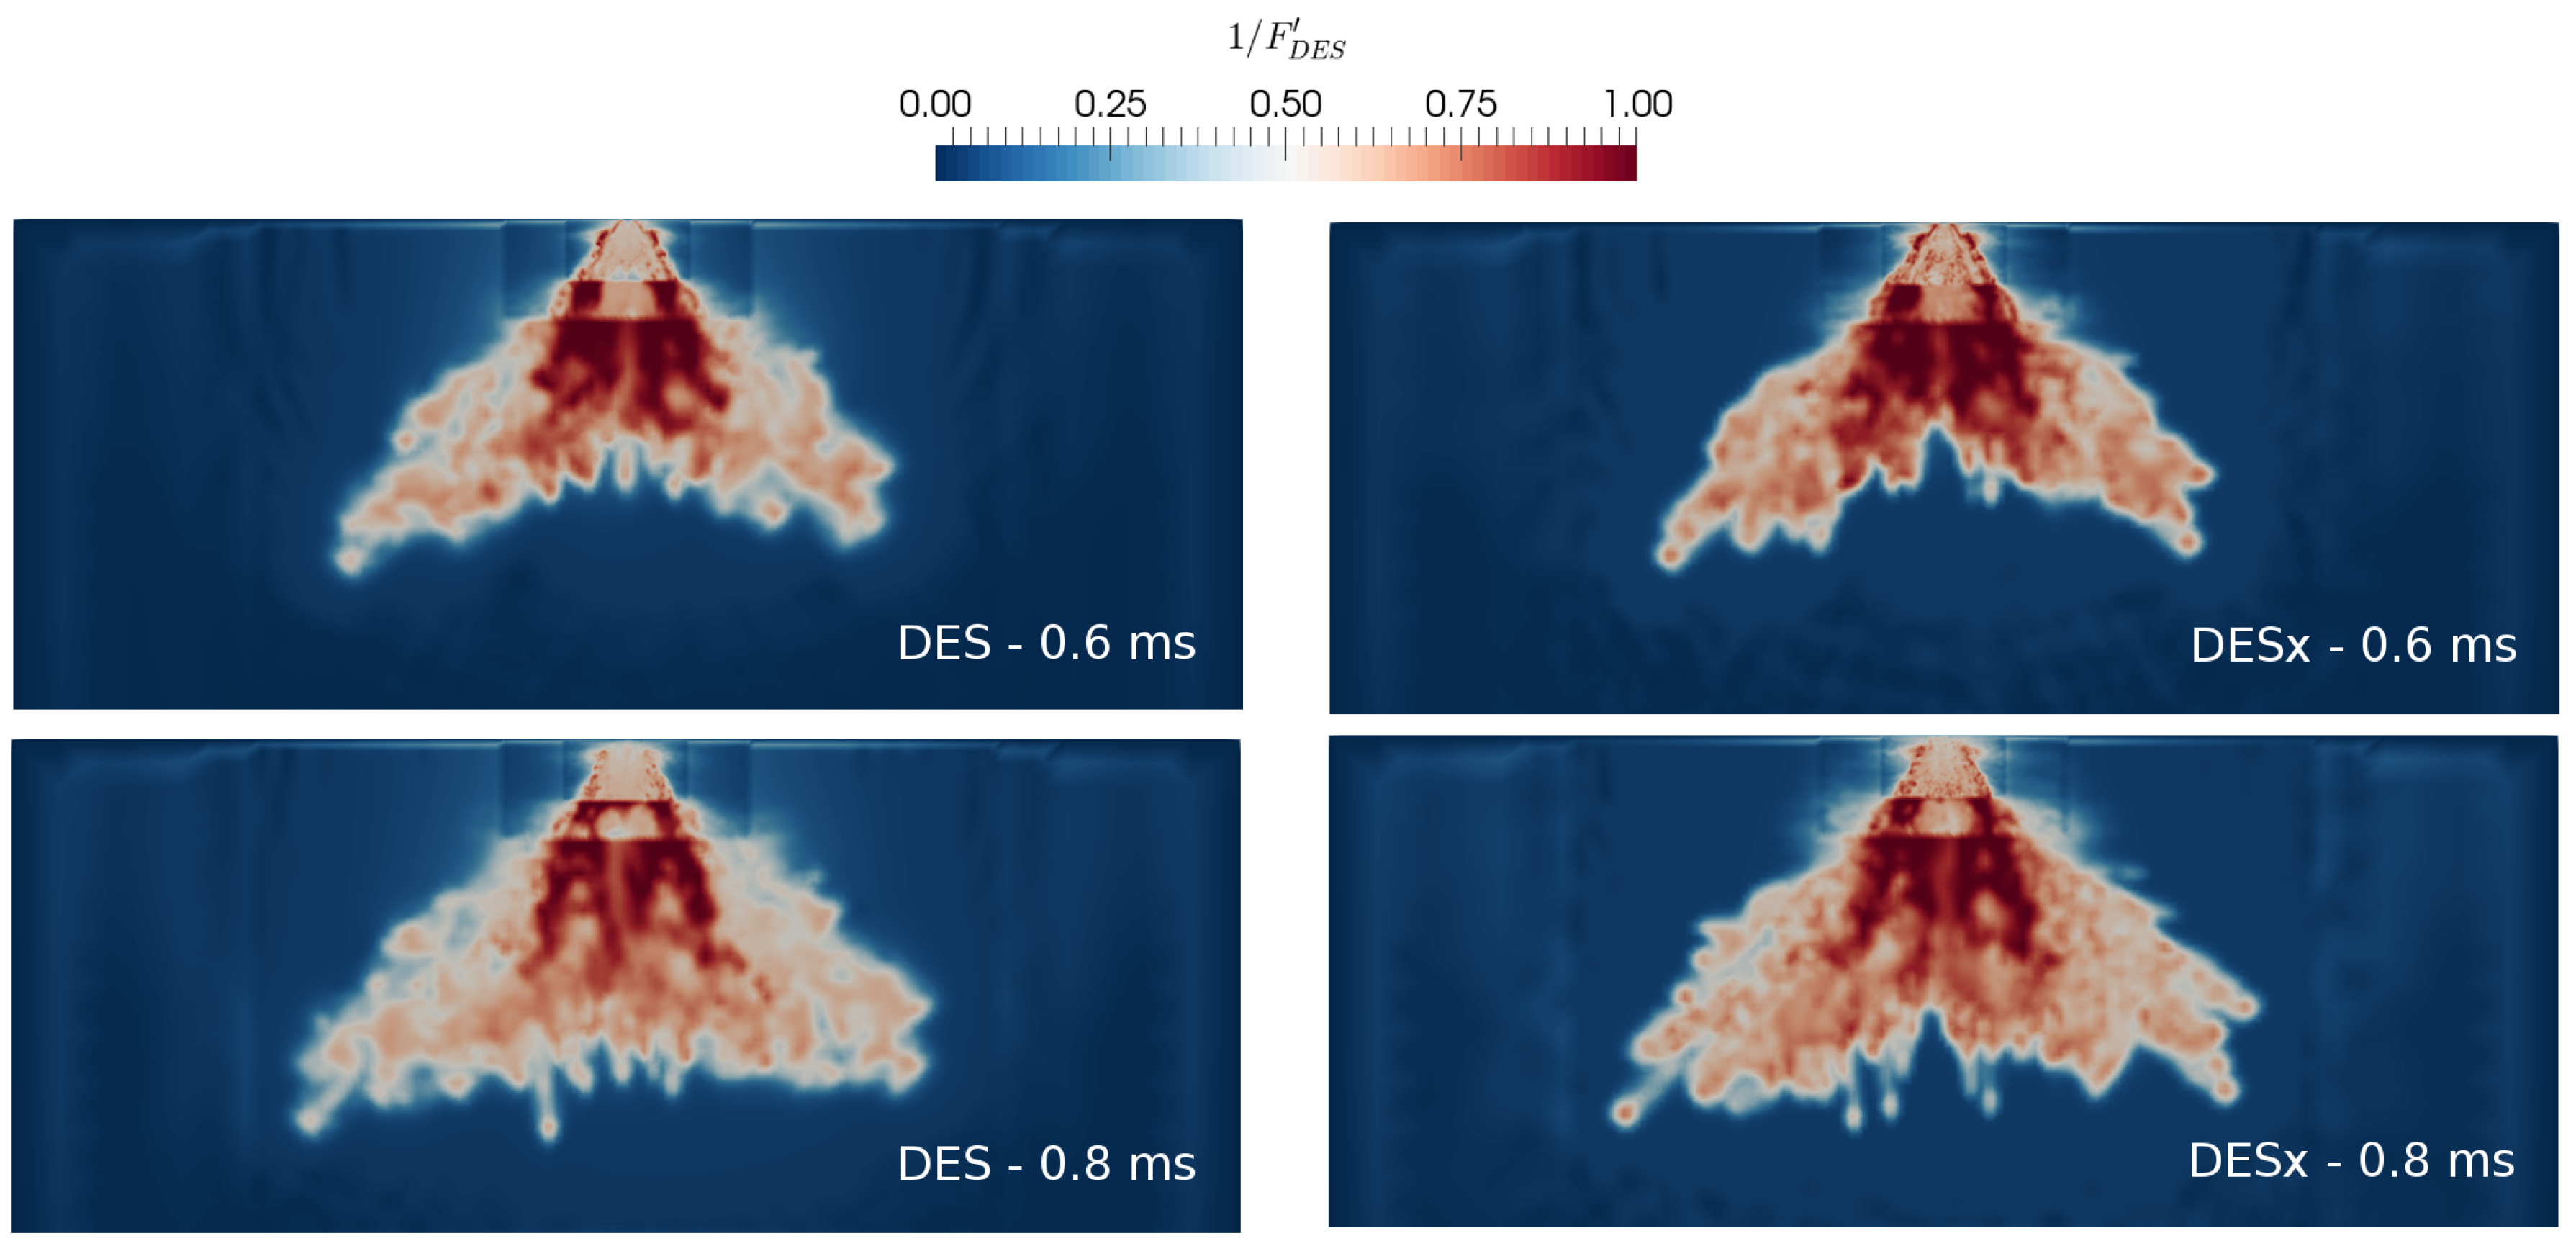
To better understand the behavior of the two hybrid models and to further investigate the effects due to different hybrid implementation strategies on the GDI spray evolution, we analyzed the instantaneous fields of the functions F D E S and F D E S x obtained by simulations on the fine mesh. However, for a more comprehensive understanding, in Figure 7 we present the inverse of these functions, which we refer to as F D E S depending on the particular model formulation under consideration. In fact, we recall that a value of such an inverse function equal to 1 indicates the URANS mode of operation, while values lower than 1 correspond to the LES mode of operation. In particular, in Figure 7 we show a visualization of 1 / F D E S at two different times ASOI—that is, 0.6 ms and 0.8 ms, with the latter corresponding to a time beyond the end of injection.
Figure 7 reveals interesting information about the considered hybrid strategies for the present GDI spray simulation. Both DES and DESx formulations apply a quite intense switching between URANS and LES modes of operation, over the whole spray development region. Specifically, we observed that an extended region along the injector axis tended toward the URANS mode, while the tips of the plumes were treated by the LES mode of operation. This outcome seems to suggest that the proposed hybrid approaches efficiently performed the local modification of the turbulent viscosity, thus allowing a proper reconstruction of the spray dynamics whenever the mesh resolution was not sufficient to capture the flow structures at unresolved scales. This behavior differs from what has been observed in diesel-like injection conditions, where a standard seamless DES dynamic approach was found to be unable to maintain an URANS mode of operation at moderate grid refinement levels, thus actually behaving in the same fashion as a pure-LES model [28].
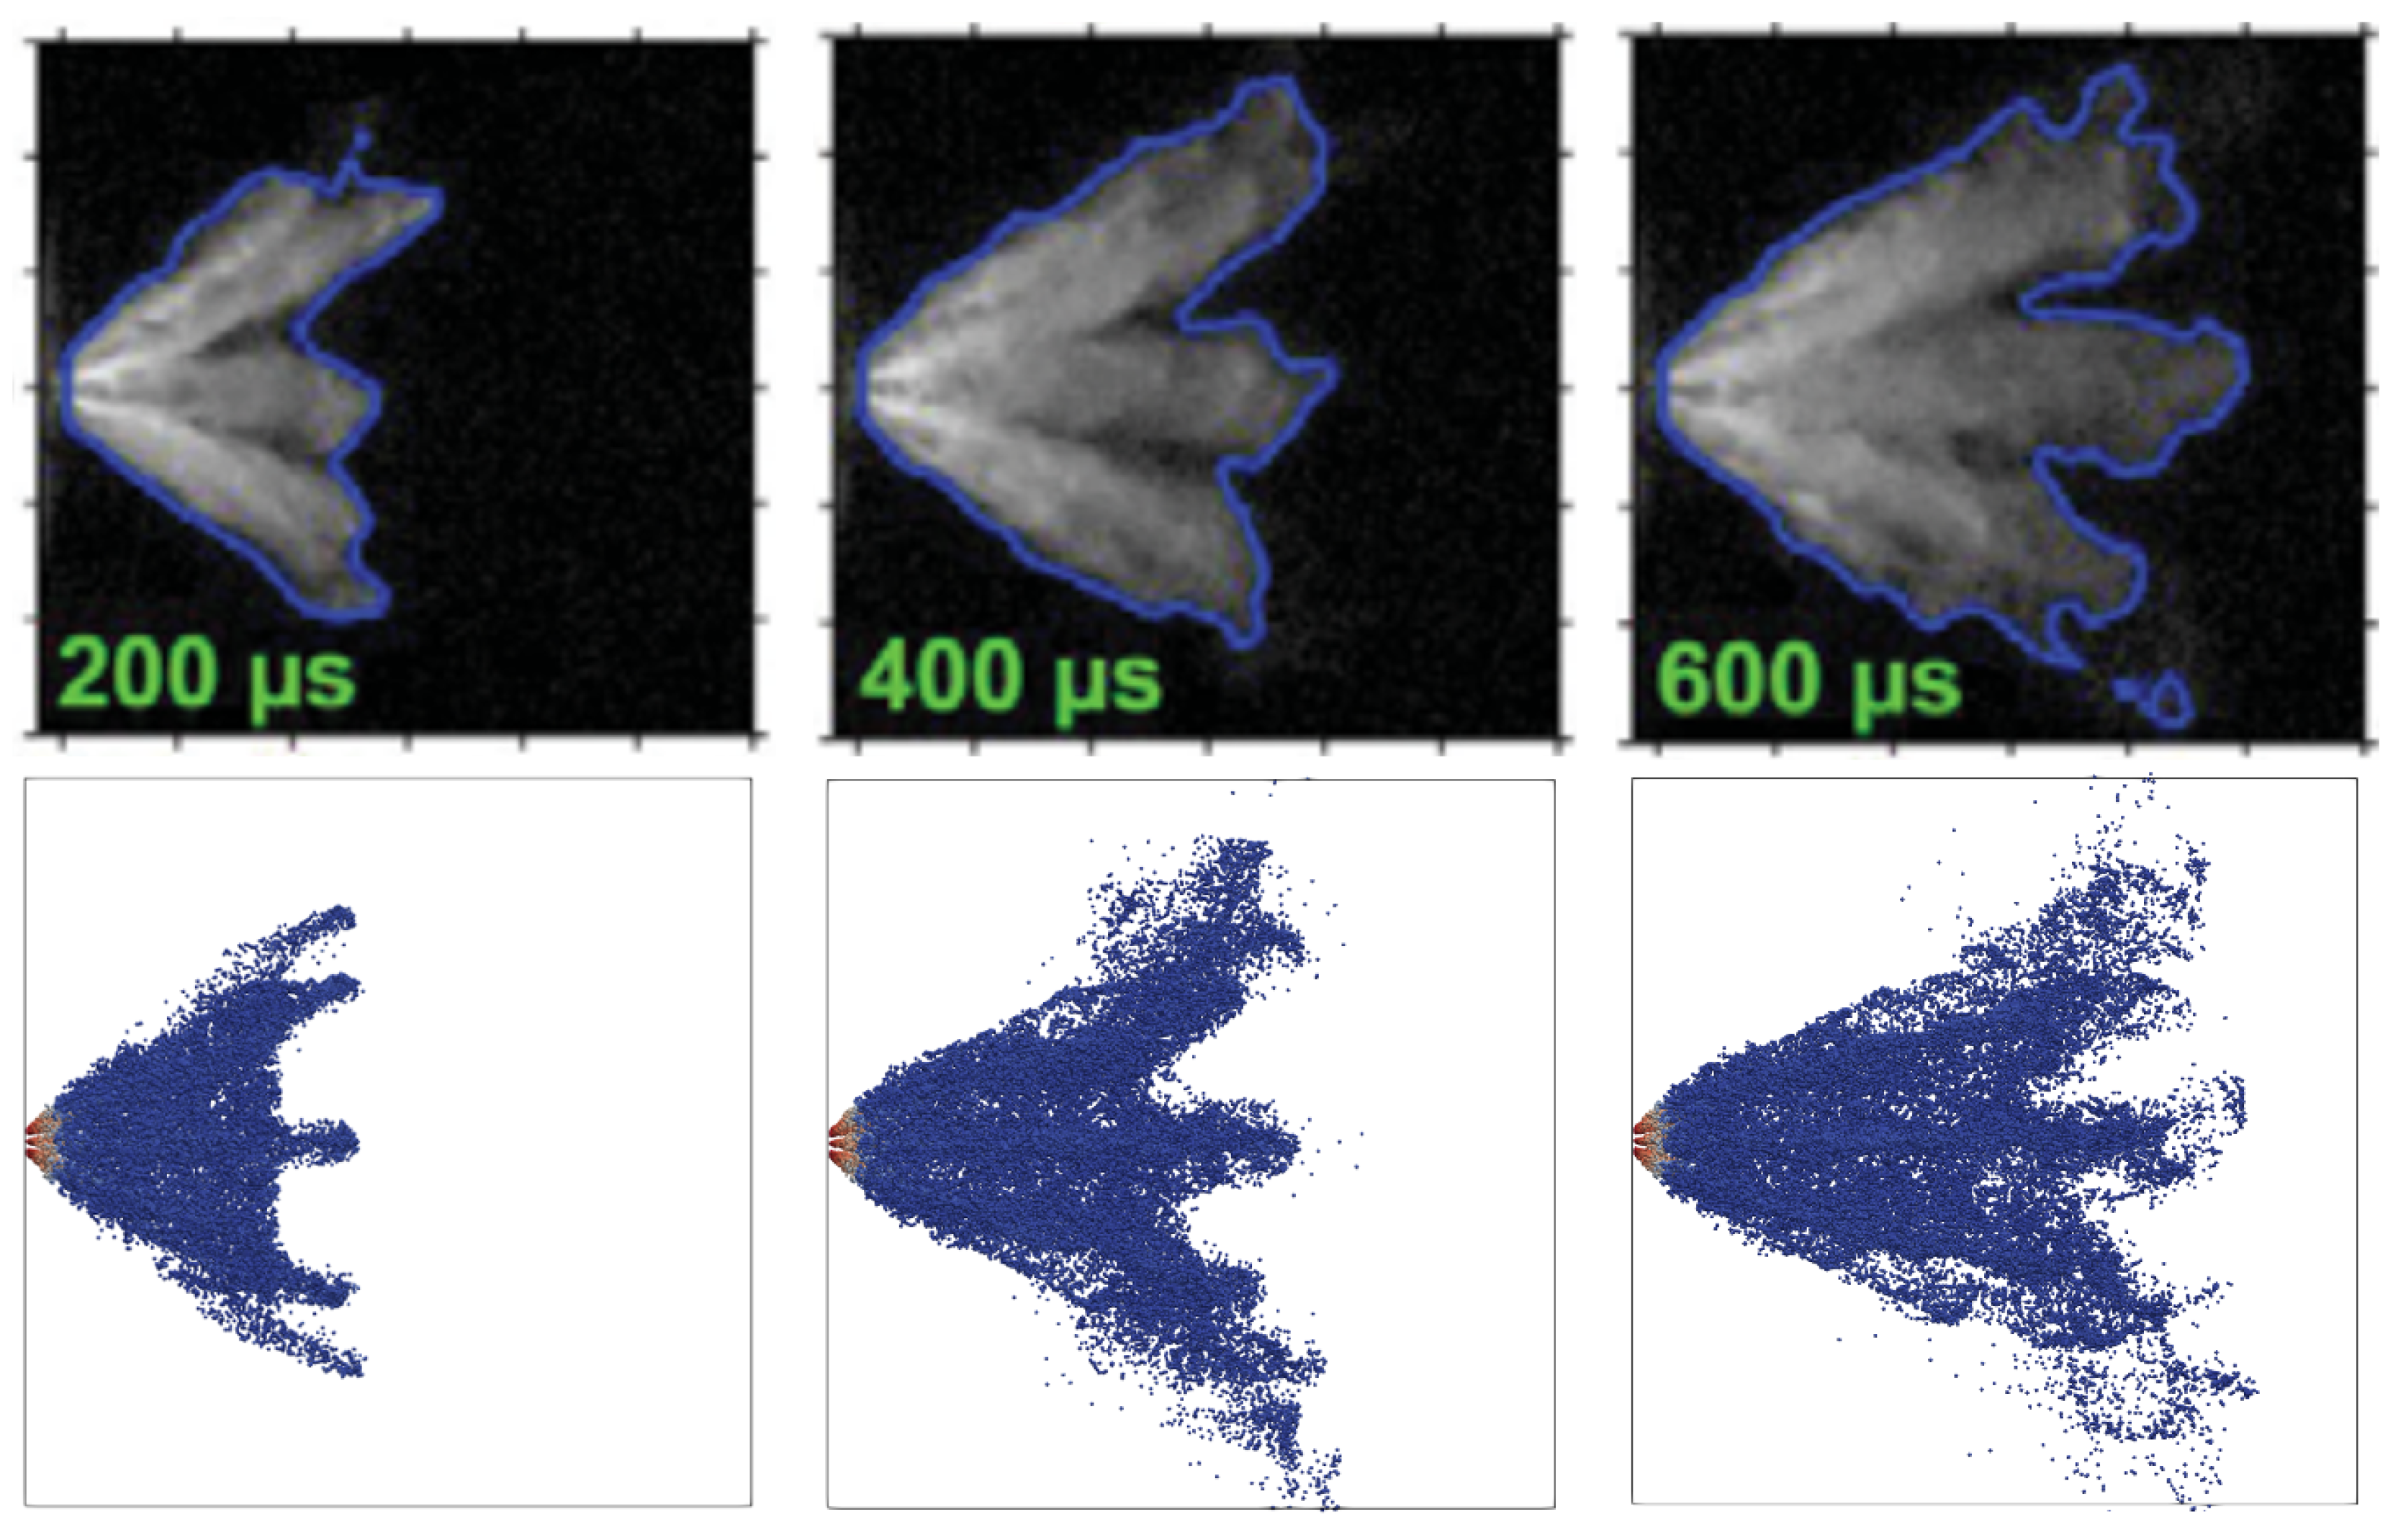
Finally, in Figure 8 we show the liquid phase evolution at three different times ASOI, as computed by the present DES model (on the fine mesh) in comparison with the experimental visualization reported in [50] for the same “Spray G” operating conditions. A similar result was found for the DESx model.
From Figure 8 we observe that, overall, the numerically predicted liquid phase evolution of the spray was consistent with the one obtained from experimental measurements. Moreover, to further analyze the macroscopic features of the spray development, we evaluated the full outer liquid spray angle which, according to [50], is measured as the angle formed by two lines fitted along both edges of the spray between 1 and 11 mm downstream from the nozzle origin. As a result, for the DES model we obtained a spreading angle value of around 80 at 0.2 ms ASOI. The computed angle decreased during the injection, by exhibiting an asymptotic behavior toward a value slightly below 70 at the end of injection. For the DESx model we obtained a fairly similar result, which indicates that the two hybrid models predicted the liquid phase evolution of the spray with no substantial differences. These findings further underline that both proposed hybrid approaches provided an accurate prediction of the present GDI spray.

5. Conclusions

In this numerical study, we investigated the applicability of two different variants of a hybrid turbulence modeling methodology for the simulation of GDI sprays. In particular, we constructed both approaches on top of the two-equation kg closure model. The standard ECN “Spray G” injector and operating conditions were considered, and a thoughtful comparison with available experimental data was conducted in order to validate the models and assess their accuracy.
The results proposed in this work show that either DES and DESx approaches are capable of reproducing the behavior and the main features of the considered multi-hole GDI spray with good accuracy. In fact, a considerably good agreement between the computational results and those from available experimental measurements was found in terms of global quantities such as liquid and vapor penetration, as well as liquid phase spray evolution.
The present analysis indicates that the two hybrid models exhibit a general tendency to operate as URANS mode or LES mode in different regions of the computational domain depending on the local flow features and mesh resolution. This behavior allows the use of a relatively coarse mesh, since the unresolved regions of the computational domain are efficiently treated by means of the background URANS model, while the LES mode is activated elsewhere, without affecting the overall accuracy of the simulation. This mechanism appears to be different from the one emerging in diesel spray simulation, where a hybrid methodology seems to behave basically as a pure-LES. However, hybrid modeling for fuel spray simulation is still at an early stage of research, and thus further consolidation and more in-depth analysis are required to asses its full validity and competitiveness.
Future works should also be aimed at better understanding the effects of changes in plume direction and plume cone angle, since these represent two key parameters in spray evolution prediction.

Author Contributions

Conceptualization, V.K.K.; Methodology, G.D.I. and V.K.K.; Investigation, G.D.I.; Supervision, G.F.

Conflicts of Interest

The authors declare no conflicts of interest.

Abbreviations

The following abbreviations are used in this manuscript:
RDEReal Driving Emissions
WLTPWorld Harmonised Light Vehicle Test Procedure
GDIGasoline Direct Injection
CFDComputational Fluid Dynamics
ELEulerian–Lagrangian
LPLagrangian Particles
URANSUnsteady Reynolds-Averaged Navier–Stokes
LESLarge Eddy Simulation
ECNEngine Combustion Network
SNLSandia National Laboratories
KHRTKelvin–Helmholtz–Rayleigh–Taylor
DESDetached Eddy Simulation
X-LES / DESxExtra Large Eddy Simulation
PISOPressure Implicit with Splitting Operators
ASOIAfter the Start Of Injection

References

  1. Emissions in the Automotive Sector. Available online: https://ec.europa.eu/growth/sectors/automotive/environment-protection/emissions_en (accessed on 15 July 2019).
  2. Chakraborty, N.; Mastorakos, E.; Cant, R. Effects of turbulence on spark ignition in inhomogeneous mixtures: A direct numerical simulation (DNS) study. Combust. Sci. Technol. 2007, 179, 293–317. [Google Scholar] [CrossRef]
  3. Vermorel, O.; Richard, S.; Colin, O.; Angelberger, C.; Benkenida, A.; Veynante, D. Towards the understanding of cyclic variability in a spark ignited engine using multi-cycle LES. Combust. Flame 2009, 156, 1525–1541. [Google Scholar] [CrossRef]
  4. Shao, J.; Rutland, C. Modeling investigation of different methods to suppress engine knock on a small spark ignition engine. J. Eng. Gas Turbines Power 2015, 137, 061506. [Google Scholar] [CrossRef]
  5. Pontoppidan, M.; Ausiello, F.; Bella, G.; De Maio, A. Study of the Impact of Variations in the Diesel-Nozzle Geometry Parameters on the Layout of Multiple Injection Strategy; SAE Technical Paper 2002-01-0217; SAE International: Warrendale, PA, USA, 2002. [Google Scholar]
  6. Rutland, C.J. Large-Eddy Simulations for internal combustion engines—A review. Int. J. Eng. Res. 2011, 12, 421–451. [Google Scholar] [CrossRef]
  7. Bharadwaj, N.; Rutland, C.J.; Chang, S. Large Eddy Simulation modelling of spray-induced turbulence effects. Int. J. Eng. Res. 2009, 10, 97–119. [Google Scholar] [CrossRef]
  8. Vuorinen, V.; Hillamo, H.; Kaario, O.; Nuutinen, M.; Larmi, M.; Fuchs, L. Effect of Droplet Size and Atomization on Spray Formation: A Priori Study Using Large-Eddy Simulation. Flow Turbul. Combust. 2011, 86, 533–561. [Google Scholar] [CrossRef]
  9. Wehrfritz, A.; Vuorinen, V.; Kaario, O.; Larmi, M. Large Eddy Simulation of High-Velocity Fuel Srays: Studying Mesh Resolution and Breakup Model Effects for Spray A. At. Sprays 2013, 23, 419–442. [Google Scholar] [CrossRef]
  10. Jangi, M.; Solsjo, R.; Johansson, B.; Bai, X.S. On large eddy simulation of diesel spray for internal combustion engines. Int. J. Heat Fluid Flow 2015, 53, 68–80. [Google Scholar] [CrossRef]
  11. Tsang, C.W.; Kuo, C.W.; Trujillo, M.; Rutland, C. Evaluation and validation of large-eddy simulation sub-grid spray dispersion models using high-fidelity volume-of-fluid simulation data and engine combustion network experimental data. Int. J. Eng. Res. 2018. [Google Scholar] [CrossRef]
  12. Hasse, C.; Sohm, V.; Durst, B. Detached Eddy Simulation of cyclic large scale fluctuations in a simplified engine setup. Int. J. Heat Fluid Flow 2009, 30, 32–43. [Google Scholar] [CrossRef]
  13. Hasse, C.; Sohm, V.; Durst, B. Numerical investigation of cyclic variations in gasoline engines using a hybrid URANS/LES modeling approach. Comput. Fluids 2010, 39, 25–48. [Google Scholar] [CrossRef]
  14. Hasse, C. Scale-resolving simulations in engine combustion process design based on a systematic approach for model development. Int. J. Eng. Res. 2016, 17, 44–62. [Google Scholar] [CrossRef]
  15. Buhl, S.; Hartmann, F.; Hasse, C. Identification of Large-Scale Structure Fluctuations in IC Engines using POD-Based Conditional Averaging. Oil & Gas Sci. Technol.-Rev. IFP 2016, 71. [Google Scholar] [CrossRef]
  16. Buhl, S.; Dietzsch, F.; Buhl, C.; Hasse, C. Comparative study of turbulence models for scale-resolving simulations of internal combustion engine flows. Comput. Fluids 2017, 156, 66–80. [Google Scholar] [CrossRef]
  17. Buhl, S.; Hain, D.; Hartmann, F.; Hasse, C. A comparative study of intake and exhaust port modeling strategies for scale-resolving engine simulations. Int. J. Eng. Res. 2018, 19, 282–292. [Google Scholar] [CrossRef]
  18. Piscaglia, F.; Montorfano, A.; Onorati, A. A Scale Adaptive Filtering Technique for Turbulence Modeling of Unsteady Flows in IC Engines. SAE Int. J. Engines 2015, 8, 426–436. [Google Scholar] [CrossRef]
  19. Wu, Y.; Montorfano, A.; Piscaglia, F.; Onorati, A. A Study of the Organized in-Cylinder Motion by a Dynamic Adaptive Scale-Resolving Turbulence Model. Flow Turbul. Combust. 2018, 100, 797–827. [Google Scholar] [CrossRef]
  20. Krastev, V.K.; Bella, G.; Campitelli, G. Some Developments in DES Modeling for Engine Flow Simulation; SAE Technical Paper 2015-24-2414; SAE International: Warrendale, PA, USA, 2015. [Google Scholar]
  21. Krastev, V.K.; Bella, G. A Zonal Turbulence Modeling Approach for ICE Flow Simulation. SAE Int. J. Engines 2016, 9, 1425–1436. [Google Scholar] [CrossRef]
  22. Krastev, V.K.; Silvestri, L.; Falcucci, G.; Bella, G. A Zonal-LES Study of Steady and Reciprocating Engine-Like Flows Using a Modified Two-Equation DES Turbulence Model; SAE Technical Paper 2017-24-0030; SAE International: Warrendale, PA, USA, 2017. [Google Scholar]
  23. Krastev, V.K.; Silvestri, L.; Falcucci, G. A Modified Version of the RNG k-ε Turbulence Model for the Scale-Resolving Simulation of Internal Combustion Engines. Energies 2017, 10, 2116. [Google Scholar] [CrossRef]
  24. Krastev, V.K.; Silvestri, L.; Bella, G. Effects of Turbulence Modeling and Grid Quality on the Zonal URANS/LES Simulation of Static and Reciprocating Engine-Like Geometries. SAE Int. J. Engines 2018, 11, 669–686. [Google Scholar] [CrossRef]
  25. Krastev, V.K.; Di Ilio, G.; Falcucci, G.; Bella, G. Notes on the hybrid URANS/LES turbulence modeling for Internal Combustion Engines simulation. Energy Procedia 2018, 148, 1098–1104. [Google Scholar] [CrossRef]
  26. Krastev, V.K.; d’Adamo, A.; Berni, F.; Fontanesi, S. Validation of a zonal hybrid URANS/LES turbulence modeling method for multi-cycle engine flow simulation. Int. J. Eng. Res. 2019. [Google Scholar] [CrossRef]
  27. Kaario, O.T.; Vuorinen, V.; Zhu, L.; Larmi, M.; Liu, R. Mixing and evaporation analysis of a high-pressure SCR system using a hybrid LES-RANS approach. Energy 2017, 120, 827–841. [Google Scholar] [CrossRef] [Green Version]
  28. Di Ilio, G.; Krastev, V.K.; Piscaglia, F.; Bella, G. Hybrid URANS/LES Turbulence Modeling for Spray Simulation: A Computational Study; SAE Technical Paper 2019-01-0270; SAE International: Warrendale, PA, USA, 2019. [Google Scholar]
  29. Di Ilio, G.; Krastev, V.K.; Bella, G. Effects of the LES-Mode SGS Viscosity Formulation on the Hybrid URANS/LES Modeling of Turbulent Fuel Sprays; SAE Technical Paper 2019-24-0127; SAE International: Warrendale, PA, USA, 2019. [Google Scholar]
  30. Engine Combustion Network. Available online: https://ecn.sandia.gov/ (accessed on 15 July 2019).
  31. ECN Workshop. Available online: https://ecn.sandia.gov/ecn-workshop/ (accessed on 15 July 2019).
  32. Paredi, D.; Lucchini, T.; D’Errico, G.; Onorati, A.; Montanaro, A.; Allocca, L.; Ianniello, R. Combined Experimental and Numerical Investigation of the ECN Spray G Under Different Engine-Like Conditions; SAE Technical Paper 2018-01-0281; SAE International: Warrendale, PA, USA, 2018. [Google Scholar]
  33. Payri, R.; Gimeno, J.; Marti-Aldaravi, P.; Vaquerizo, D. Momentum Flux Measurements on an ECN GDI Injector; SAE Technical Paper 2015-01-1893; SAE International: Warrendale, PA, USA, 2015. [Google Scholar]
  34. Spalding, D. The combustion of liquid fuels. Symp. (Int.) Combust. 1953, 4, 847–864. [Google Scholar] [CrossRef]
  35. Beale, J.; Reitz, R. Modeling spray atomization with the Kelvin-Helmhotz/Rayleigh-Taylor hybrid model. At. Sprays 1999, 9, 623–650. [Google Scholar] [CrossRef]
  36. Reitz, R. Modeling Atomization Processes in High-pressure Vaporizing Sprays. At. Spray Technol. 1987, 3, 309–337. [Google Scholar]
  37. Patterson, M.; Reitz, R. Modeling the Effects of Fuel Spray Characteristics on Diesel Engine Combustion and Emission; SAE Technical Paper 980131; SAE International: Warrendale, PA, USA, 1998. [Google Scholar]
  38. Xin, J.; Ricart, L.; Reitz, R. Computer Modeling of Diesel Spray Atomization and Combustion. Combust. Sci. Technol. 1998, 137, 171–176. [Google Scholar] [CrossRef]
  39. Spalart, P.R.; Jou, W.H.; Strelets, M.; Allmaras, S.R. Comments on the feasibility of LES for wings, and on a hybrid RANS/LES approach. In Advances in DNS/LES; Liu, C., Liu, Z., Eds.; Greyden Press: Columbus, OH, USA, 1997; pp. 137–147. [Google Scholar]
  40. Travin, A.; Shur, M.L.; Strelets, M.; Spalart, P.R. Physical and numerical upgrades in the Detached-Eddy Simulation of complex turbulent flows. In Advances in LES of Complex Flows, Fluid Mechanics and Its Applications; Friedrich, R., Rodi, W., Eds.; Springer: Dordrecht, The Nederland, 2002; Volume 65, pp. 239–254. [Google Scholar]
  41. Spalart, P.R. Detached-Eddy Simulation. Annu. Rev. Fluid Mech. 2009, 41, 181–202. [Google Scholar] [CrossRef]
  42. Kalitzin, G.; Gould, A.R.B.; Benton, J.J. Application of Two-Equation Turbulence Models in Aircraft Design; AIAA Paper 96-0327; SAE International: Warrendale, PA, USA, 1996. [Google Scholar]
  43. Bella, G.; Krastev, V.K. On the RANS Modeling of Turbulent Airflow Over a Simplified Car Model. In Proceedings of the ASME-JSME-KSME 2011 Joint Fluids Engineering Conference: Volume 1, Symposia—Parts A, B, C, and D, Hamamatsu, Japan1, 24–29 July 2011; pp. 871–883. [Google Scholar] [CrossRef]
  44. Krastev, V.K.; Bella, G. On the Steady and Unsteady Turbulence Modeling in Ground Vehicle Aerodynamic Design and Optimization; SAE Technical Paper 2011-24-0163; SAE International: Warrendale, PA, USA, 2011. [Google Scholar]
  45. Durbin, P.A. On the k-ε stagnation point anomaly. Int. J. Heat Fluid Flow 1996, 17, 89–90. [Google Scholar] [CrossRef]
  46. Durbin, P.A. Limiters and wall treatments in applied turbulence modeling. Fluid Dyn. Res. 2009, 41, 012203. [Google Scholar] [CrossRef]
  47. Kok, J.; Dol, H.; Oskam, H.; Van Der Ven, H. Extra-Large Eddy Simulation of massively separated flows. In Proceedings of the 42nd AIAA Aerospace Sciences Meeting and Exhibit, AIAA Paper 04-0264. Reno, NV, USA, 5–8 January 2004. [Google Scholar]
  48. Yan, J.; Mockett, C.; Thiele, F. Investigation of Alternative Length Scale Substitutions in Detached-Eddy Simulation. Flow Turbul. Combust. 2005, 74, 85–102. [Google Scholar] [CrossRef]
  49. CFD Direct. Available online: https://cfd.direct/openfoam/user-guide/ (accessed on 15 July 2019).
  50. Manin, J.; Jung, Y.; Skeen, S.; Pickett, L.; Parrish, S.; Markle, L. Experimental Characterization of DI Gasoline Injection Processes; SAE Technical Paper 2015-01-1894; SAE International: Warrendale, PA, USA, 2015. [Google Scholar]
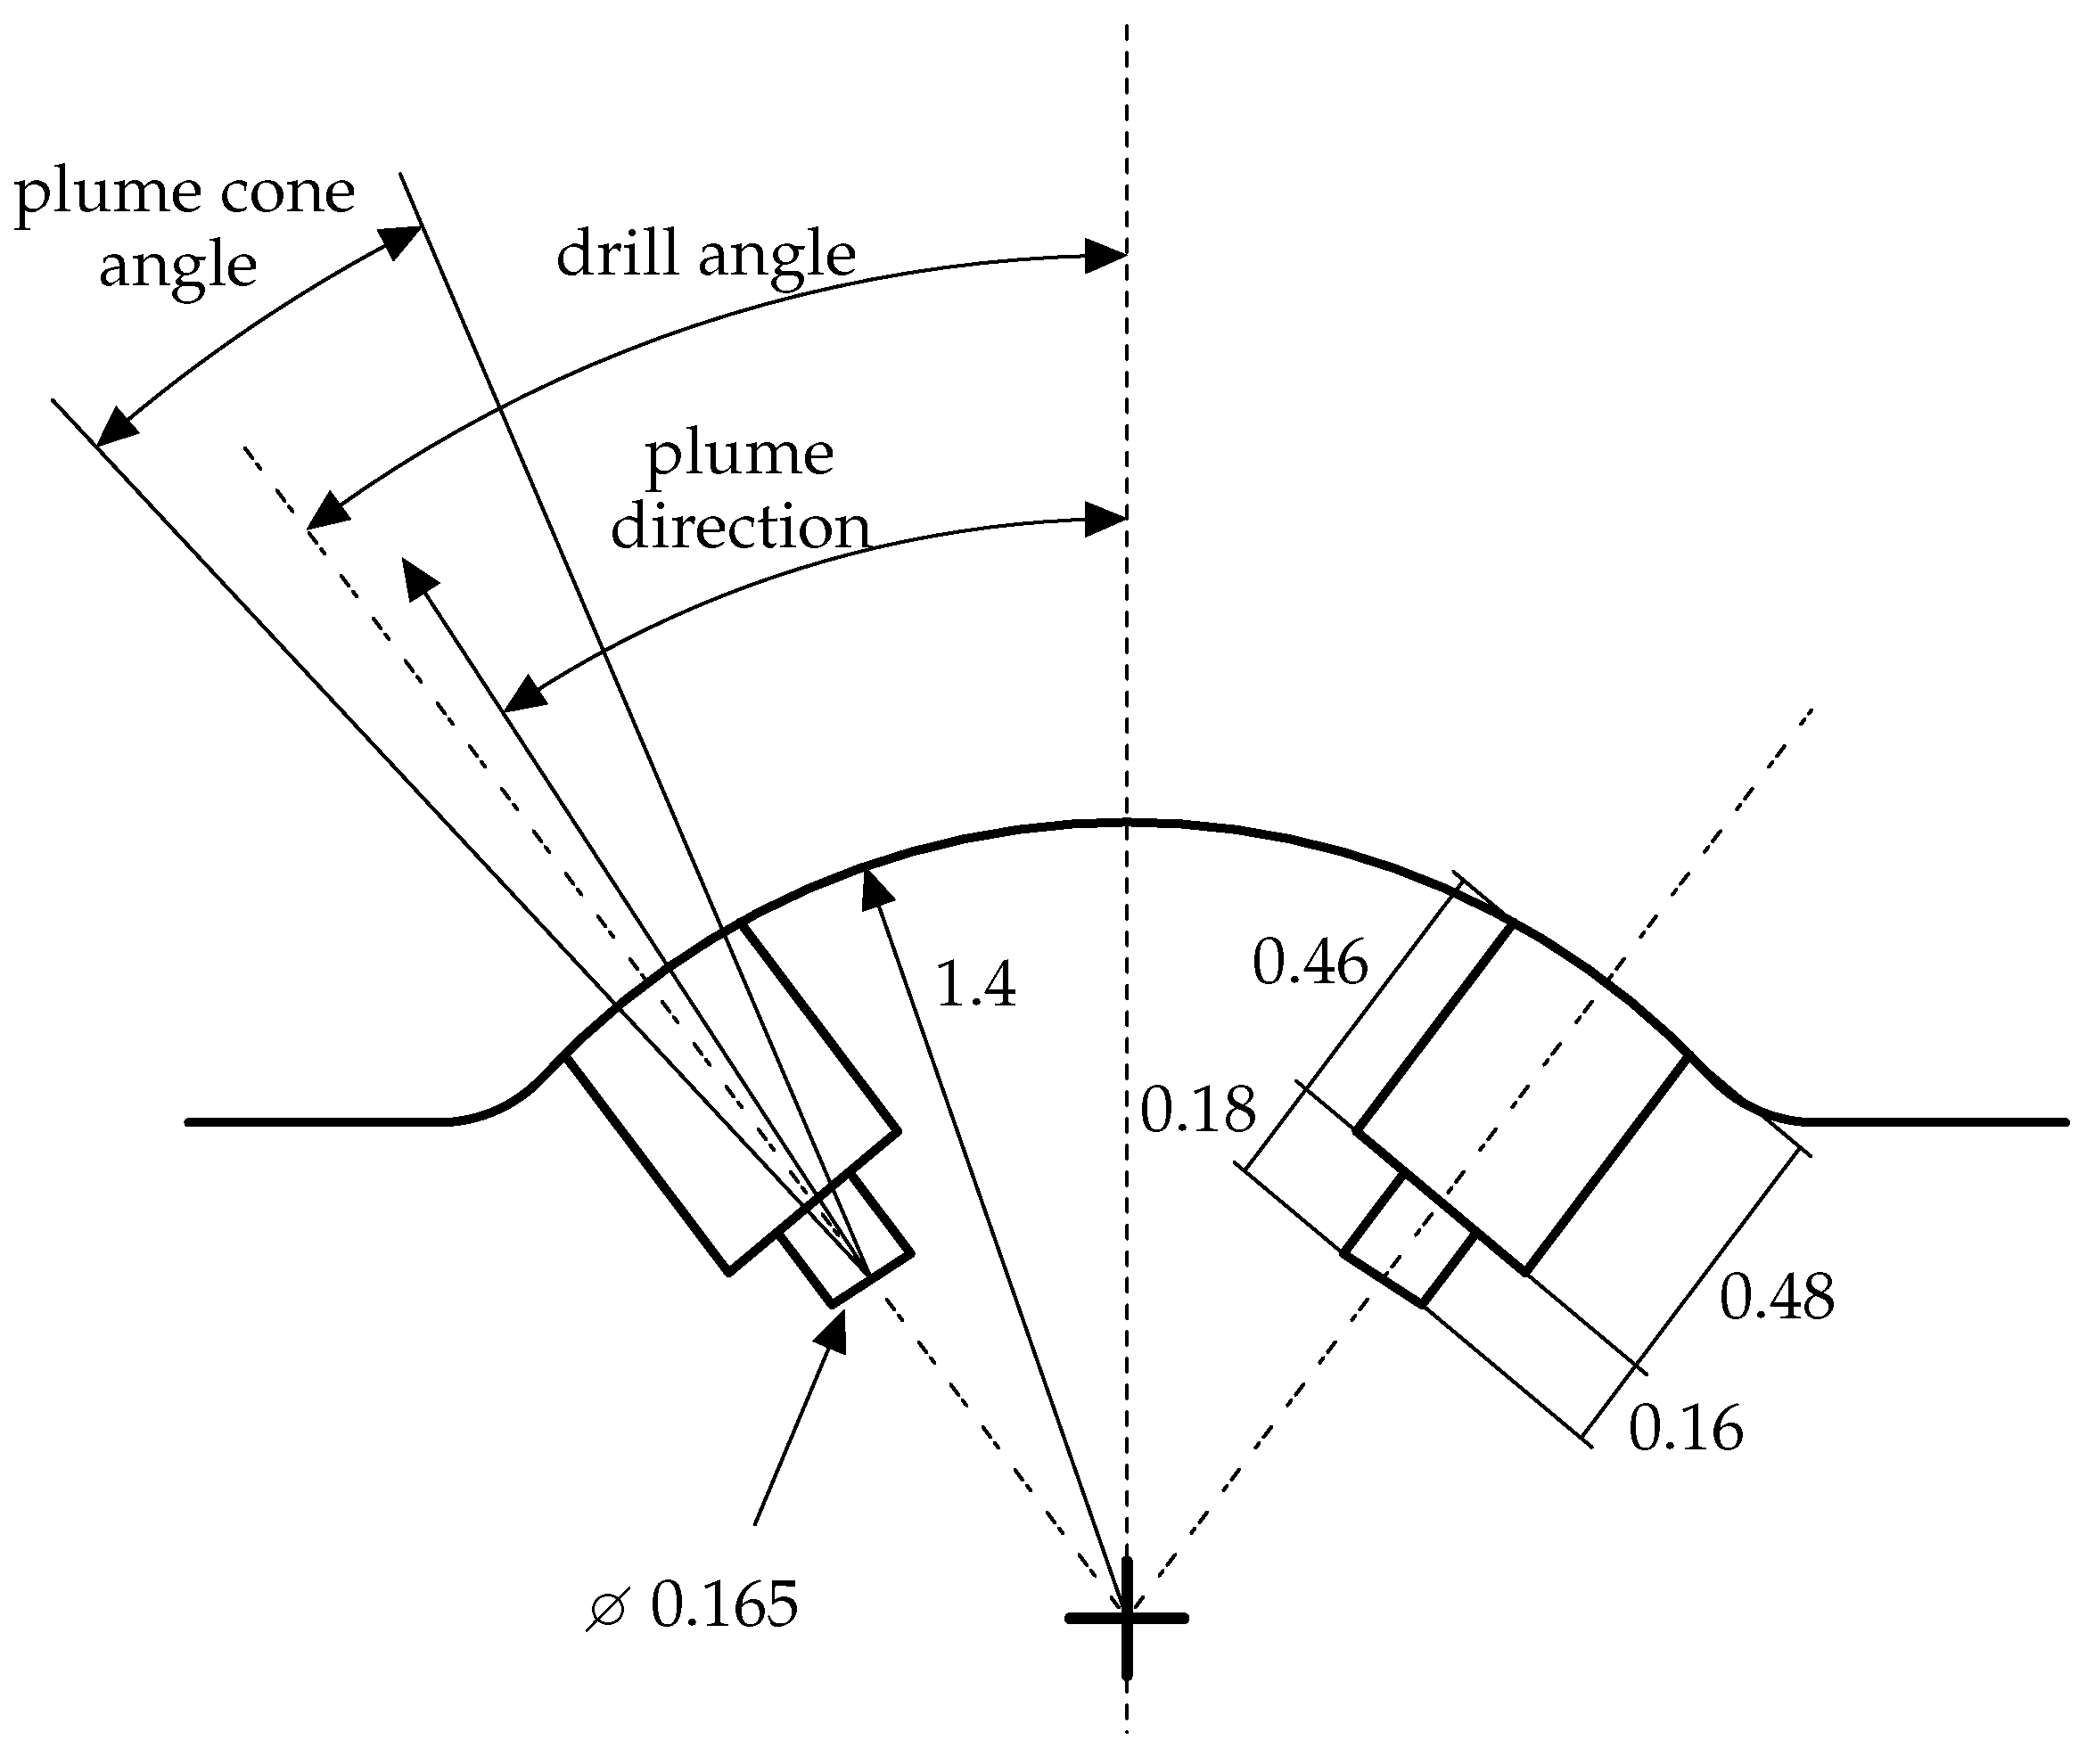
Figure 1. Specification of the “Spray G” nozzle geometry. The dimensions are expressed in millimeters.
Energies 12 02699 g001
Figure 2. Rate of injection used as inflow condition in all simulations.
Energies 12 02699 g002
Figure 3. 2D cut-plane of the fine mesh used in this work. Each box corresponds to a specific refinement region. The dimensions are expressed in millimeters.
Energies 12 02699 g003
Figure 4. Liquid and vapor penetrations as predicted by URANS simulation in comparison with experimental data of SNL reported in Manin et al. [50]. The gray band corresponds to the time interval in which the separation between vapor and liquid phases occurs, as predicted by the numerical simulation.
Energies 12 02699 g004
Figure 5. Liquid and vapor penetrations as predicted by DES (left) and DESx (right) simulations on the coarse mesh (minimum grid size equal to 0.25 mm) in comparison with experimental data of SNL reported in Manin et al. [50]. The gray band corresponds to the time interval in which the separation between vapor and liquid phases occurs, as predicted by the numerical simulation.
Energies 12 02699 g005
Figure 6. Liquid and vapor penetrations as predicted by DES (left) and DESx (right) simulation on the fine mesh (minimum grid size equal to 0.125 mm) in comparison with experimental data of SNL reported in Manin et al. [50]. The gray band corresponds to the time interval in which the separation between vapor and liquid phases occurs, as predicted by the numerical simulation.
Energies 12 02699 g006
Figure 7. Snapshots of function 1 / F D E S at t = 0.6 ms ASOI and t = 0.8 ms ASOI, for DES and DESx simulations, on a plane parallel to the injector axis.
Energies 12 02699 g007
Figure 8. Liquid phase visualization. Comparison between the spray evolution as obtained from the experiments of Manin et al. [50] and from the present numerical DES simulation. In the images from the experiments, the detected liquid boundary contours are overlaid in blue. The reference time is indicated at the bottom-left corner of each panel reporting the experimental images.
Energies 12 02699 g008
Table 1.Spray G” baseline characteristics and operating conditions.
Fuel Typeiso-Octane ( C 8 H 18 )
Ambient composition (by volume)0% O 2
6.52% C O 2
3.77% H 2 O
89.71% N 2
Ambient gas temperature573 K
Ambient gas pressure600 kPa
Ambient gas density3.5 kg/m 3
Injection duration0.78 ms
Injection mass10.4 mg
Injection pressure20 MPa
Injection temperature363 K
Nozzle8-hole
Injector hole diameter165 μ m
Table 2. Kelvin–Helmholtz Rayleigh–Taylor (KHRT) breakup model constants.
B 0 B 1 C τ C RT C b
0.61210.11