Article

A Two-Phase Method to Assess the Sustainability of Water Companies

by
Fátima Pérez
*,
Laura Delgado-Antequera
and
Trinidad Gómez
Departamento de Economía Aplicada, Universidad de Málaga, 29016 Málaga, Spain
*
Author to whom correspondence should be addressed.
Energies 2019, 12(13), 2638; https://doi.org/10.3390/en12132638
Submission received: 29 May 2019 / Revised: 3 July 2019 / Accepted: 5 July 2019 / Published: 9 July 2019

Abstract

:
Composite indicators are becoming more relevant for evaluating the performance of water companies from a holistic perspective. Some of them are related with economic aspects, and others focus on social and environmental features. Consequently, a multidimensional evaluation is necessary for handling the great amount of information provided by multiple single indicators of a different nature. This paper presents a two-phase approach to evaluate the sustainability of water companies. First, a partial composite indicator for each dimension (social, environmental, economic) is obtained using multi-criteria decision making (MCDM). Then, a global indicator is obtained, in terms of the values reached in the previous stage for every partial indicator, by means an optimization problem rooted in data envelopment analysis (DEA). Our proposal offers the possibility of analyzing the performance of each water company under each dimension that characterizes the concept of sustainability, as well as a joint assessment including all the dimensions, facilitating the decision-making process. We apply it to evaluate the sustainability of 163 Portuguese water companies. The results show the strengths and weaknesses of each unit and serve as a guideline to decision-makers on the aspects for improving the performance of water utilities.

1. Introduction

The evolution of water management is a key issue for the human development. An effective performance of such service is a challenge for the community. Designing a good management system requires considering different factors. In countries such as England and Wales, Portugal, Chile, or the Netherlands, the water industry exists as a monopoly, so that companies and administrations invest their efforts on comparing the different processes within the industry. In general, benchmarking is widely considered a good strategy to control and supervise the performance of this service. Ref. [1] provide a rigorous evaluation of the growing number of benchmarking studies dealing with performance scores based on production or cost estimates. At the same time, the literature reveals frequent use of performance indicators (PIs) when dealing with benchmarking, because of the multiple benefits it brings to the administrations, for instance, to contrast the regulatory conditions, compare, and/or evaluate the quality of the service and establish fair tariff policies. So, in order to control these values, water utilities-following industry regulations- provide systematic reports on different PIs to the government or administrators. The information delivered within this data includes management, environmental, financial and, more recently, social aspects related to water operations. However, different reasons make this set of indicators difficult to interpret because they do not offer a holistic view, as they do not reflect a measure of general performance.
To overcome this difficulty, a common approach is to aggregate the PIs into a unique indicator, named a composite indicator (CI). Although the literature offers a wide range of techniques to create a CI, most of them use methodologies from multi-criteria decision analysis (MCDA). They have been used to develop CIs applied to diverse sectors of services, activities, or processes [2,3,4]. In particular, methodologies based on goal programming (GP) are of great interest for the construction of CIs and they have been successfully applied to diverse fields as tourism [5,6], manufacturing [7], human sustainable development [8,9,10], or environmental sustainability [11,12]. The main advantages of using GP to develop CIs are: it is not necessary to normalize the initial set of PIs; the CI uses the complete information included in the initial set of PIs; and it does not require a large number of units in comparison with the number of initial indicators.
Usually, another technique used to create CIs is data envelopment analysis (DEA) [13]. DEA is a linear programming tool for evaluating the performance of a set of peer entities that use one or more inputs to produce one or more outputs. As pointed out by [14], the main advantages of using DEA to construct CIs are: it provides a measure of performance based on real data; DEA models do not require the normalization of the initial data; and DEA respects the individual characteristics of the units and their own particular value systems. Techniques based on DEA have been developed to create CIs in [6,15,16,17].
Since the 1990s, governments of many countries and organizations have emphasized the importance of the concept of sustainability [18]. There is no consensus on the definition of this concept, although it is widely agreed that it must incorporate social, environmental, and economic factors which are interconnected ([19,20]). The water industry has not ignored this trend and, currently, it has extensively recognized its important role in establishing and operating sustainable water supplies and wastewater treatment systems [2,21]. There is clearly a need for a paradigm shift in the water companies, considering social and environmental aspects in the decision making process, not just economic issues [22,23]. In the framework of evaluating the sustainability of water companies, most of the literature focuses on evaluating the sustainability of physical and engineering aspects [24,25,26], from an environmental perspective [27] or economic sustainability [28,29]. However, there is a lack interest on assessing the sustainability of water companies themselves. In particular, only a few papers apply different techniques from MCDA to assess the sustainability of water companies from a multidimensional perspective. For instance, Ref. [30] construct an index by aggregating the PIs as a linear combination of their normalized values. Also, the MACBETH (Measuring Attractiveness by a Categorical Based Evaluation Technique [31]) method is used to evaluate the sustainability of water supply systems [24]. Another example, Ref. [19], applies the ELECTRE TRI-Nc (Elimination and Choice Expressing Reality [32]) method as a tool to integrate the dimensions of a quality of service index. Additionally, Ref. [12] combines the PIs using an index based on distance-principal components and another based on GP.
In view of the above, in this work, a method to assess the sustainability of the water companies is conducted, using the traditional approach of sustainability, which considers three dimensions into this concept: social, environmental, and economic. Then, a two-phase method combining GP and DEA is proposed, in order to take advantage of both methodologies. A similar two-phase method is proposed in [6] to evaluate the sustainability of Cuban nature-based tourism destinations. Nevertheless, in that work, the distance-principal component (DPC) composite indicator developed by [33] is used to sum up the initial PIs into the dimensions established (social, economic and patrimonial (Although it is usual to use “environmental dimension”, in [6] it is replaced by “patrimonial dimension”.) instead of GP. Choosing a technique based on GP comes from their good properties, as previously mentioned.
Then, in the first phase, a technique based on GP [
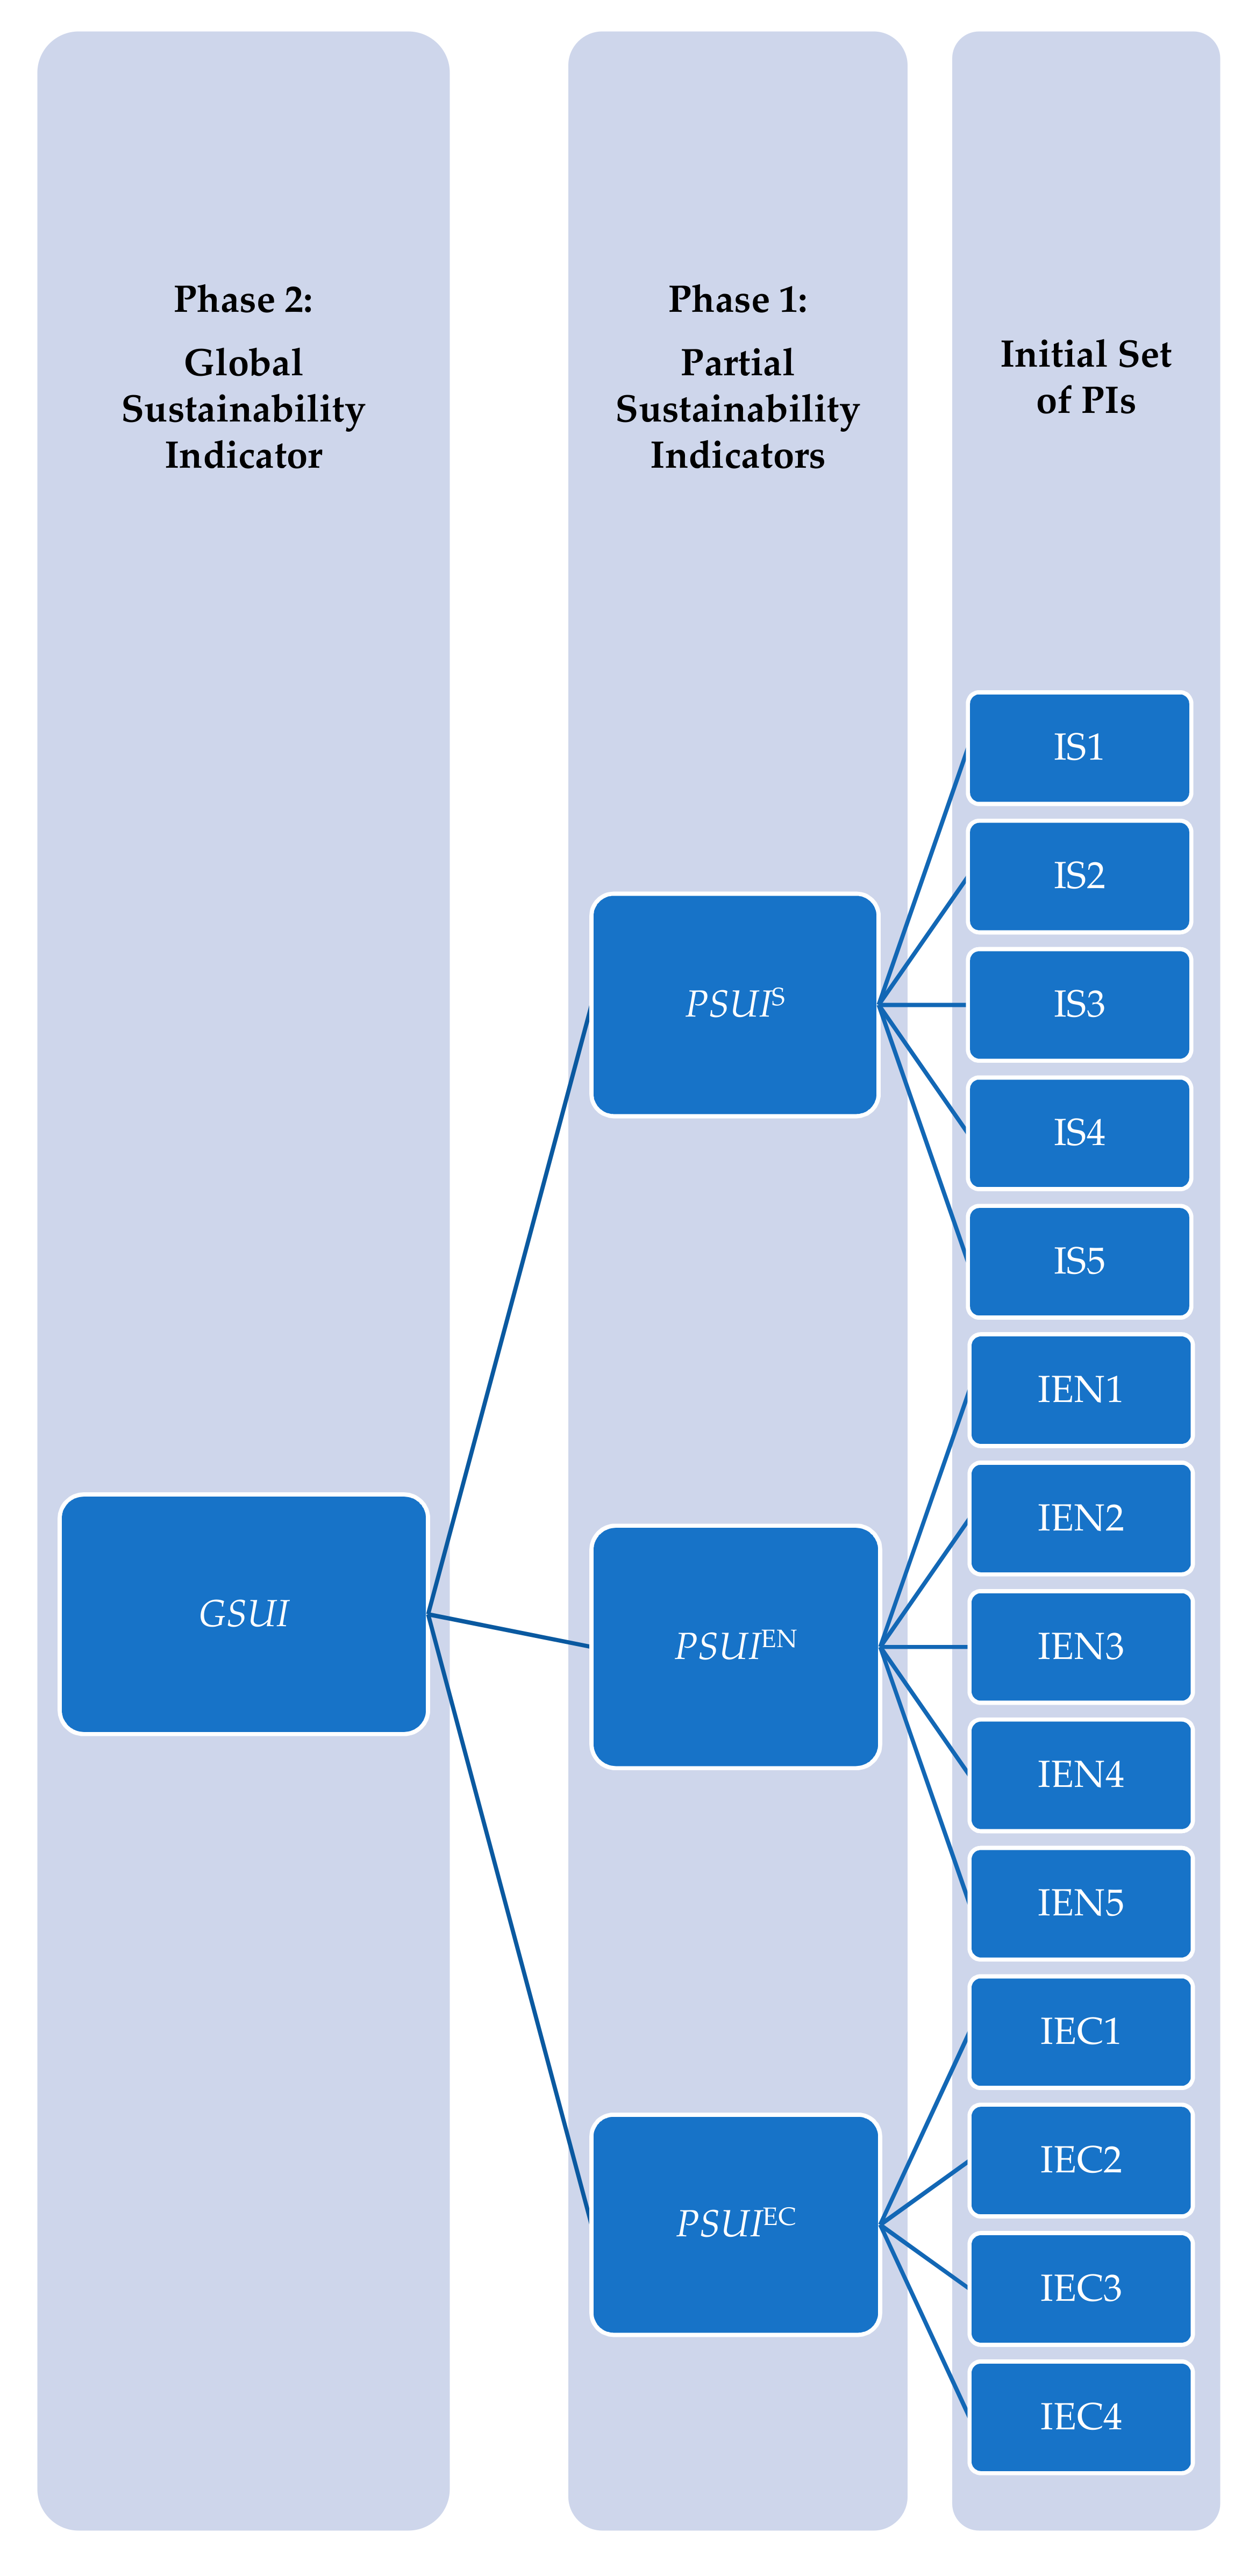
5] is used to obtain the dimensional or partial CIs. In the field of water treatments, there is a lack of consensus on the appropriate criteria to select, in order to determine which PIs are involved in evaluating the status of water sustainability. Then, to overcome this difficulty, as suggested by [34], our proposal groups the initial indicators into the dimensions that characterize the concept of sustainability: social, economic, and environmental dimensions. In this way, when the first phase is applied, three-dimensional composite indicators (social, environmental, and economic) are obtained for each water company. This allows for independently analyzing the performance of each water company among these three dimensions.
Later, in the second phase, the dimensional indicators have to be aggregated in order to design a global composite indicator for evaluating the water companies’ sustainability. At this point, a controversial question is the assignment of weights to each dimensional indicator. On the one hand, under some circumstances, it is not easy to obtain information from specialists to determine these weights. On the other hand, the assignation of the same weighting values for all the water companies could be complicated, as each of them might have their own particularities in terms of preferences. To overcome these issues, we have chosen, in the second phase, a DEA-based model known as “Benefit-of-the-Doubts” [32]. To do this, the values obtained in the previous stage are used as outputs of this “Benefit-of-the-Doubt” approach.
This two-phase approach offers the possibility of considering the strengths and weaknesses of each water company, as well as providing the decision-makers with useful information.
The hypothesis behind this study is that the water companies should manage their activity in a way as balanced as possible, from social, environmental, and economic point of view. In this sense, the approach proposed in this work allows evaluating and comparing the performance of water companies for each sustainability dimension and, later, identifying if such dimensions have or not a similar influence on the global score. This aspect is an advantage of the proposed approach in comparison to other procedures. In the first phase, an indicator is obtained for each sustainability dimension, and in the second phase the different sustainability dimension indicators are aggregated to build a global indicator. In this aggregation, the weights of the different dimensional indicators are endogenously determined using a DEA-based model, allowing each water company to be assessed in the most favorable way for it. This is another advantage of our proposal, since it does not demand excessive information for obtaining the global indicator.
This study, therefore, presents a pioneering and novel approach to assess the sustainability of water companies. To the best of our knowledge, there is neither any theoretical development nor empirical application that uses composite indicators to assess and/or compare the sustainability of water companies, for each dimension of sustainability and for all the dimensions, simultaneously. Thus, the dimensional composite indicators, in the first phase, allow evaluating the strengths and weaknesses of each water company in a particular dimension. The global indicator, in the second phase, provides a holistic performance perspective, and allows ranking the water companies. However, it provides information about the contribution of the different dimensions to the sustainability overall score.
In the next section, the methodology proposed is detailed. Section 3 introduces the case study, embracing 163 Portuguese water companies as well as the results obtained. Finally, the main conclusions derived from the research are presented in the last section.

2. A Two-Phase Evaluation Method

In this section, the methodology developed to construct the sustainability composite indicator is described, in order to evaluate the performance of water companies.
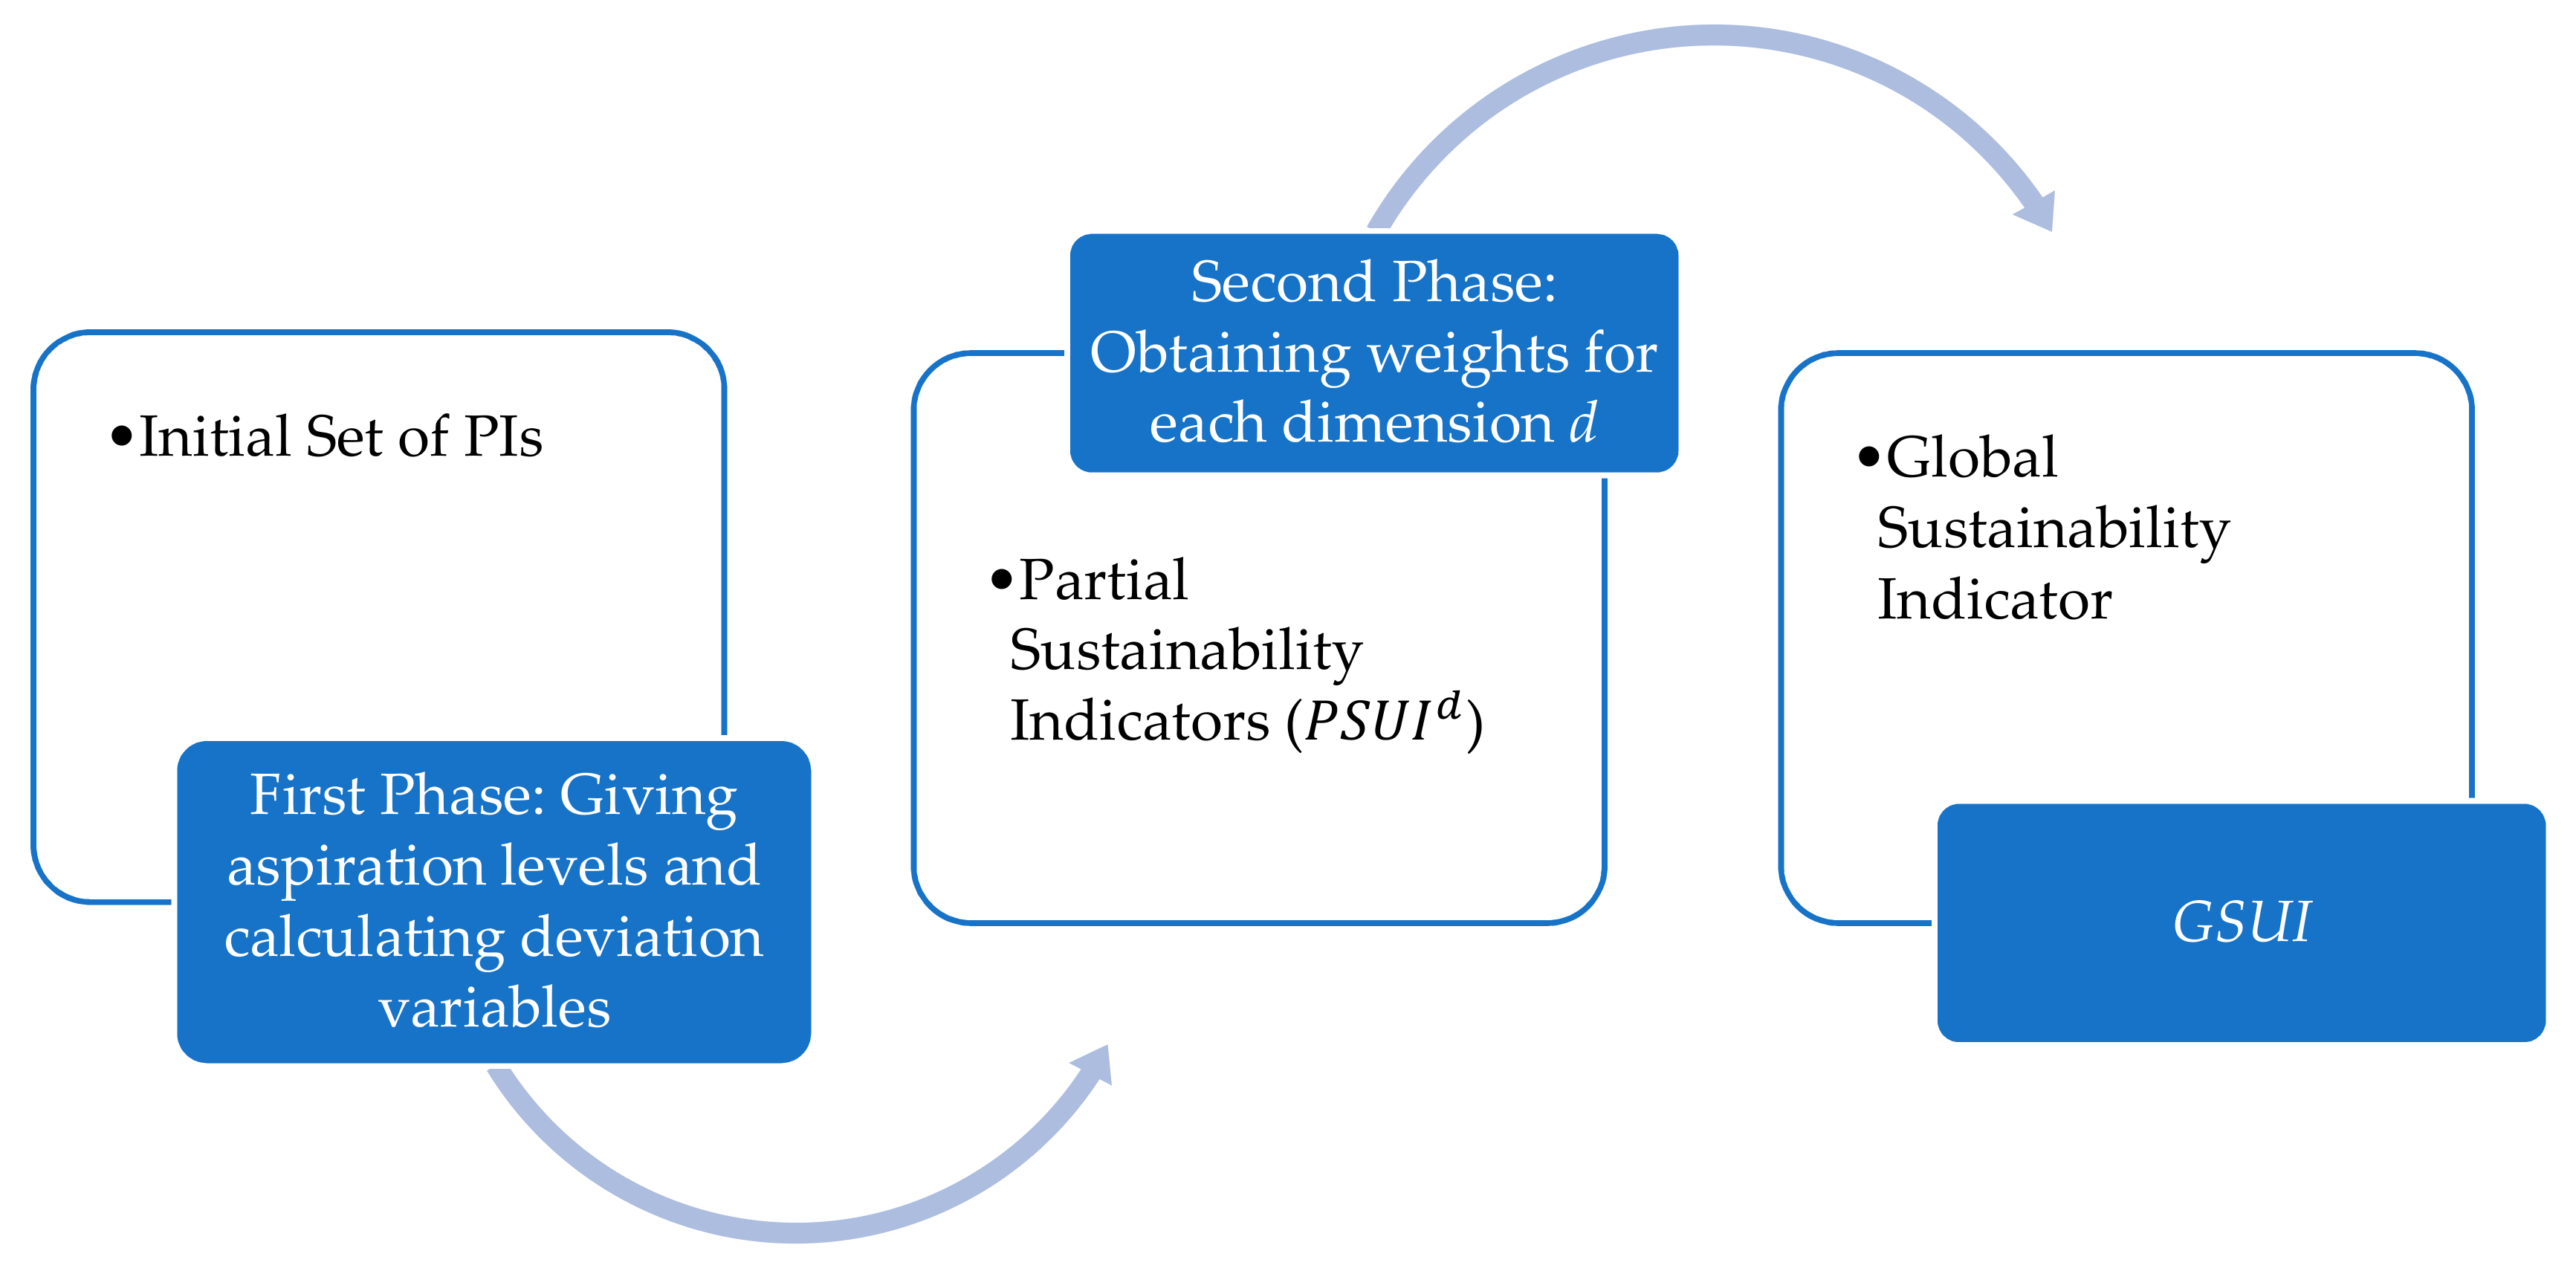
As previously mentioned, a two-phase procedure is proposed. In the first phase, following the proposal by [5], the composite indicator (sub-indicator) for each dimension of sustainability is calculated: P S U I d (Partial Sustainability Indicator of dimension d). In the second phase, these partial indicators form the basis from which the overall composite indicator is obtained, applying a variant of DEA named the “Benefit-of-the-Doubt” approach. Figure 1 shows the general scheme of the proposed approach.
Then, to calculate P S U I d ,   d   =   1 , 2 , , D , it is necessary to distinguish between positive PIs (a larger value involves an improvement in the sustainability) and negative PIs (a larger value involves a decline in the sustainability). Let us suppose that the initial set of PIs is divided into D dimensions and there are M units to evaluate. For each d D , let us denote by Jd and Kd the number of positive and negative PIs, respectively, assigned to dimension d, and I i , j d + and I i , k d the value of the i-th unit with respect to the jd-th positive and kd -th negative PI which belong to the dimension d (i = 1,2, … M; jd = 1,2, … Jd; kd = 1,2,… Kd; d = 1,2, … D).
Additionally, the performance of a unit is evaluated, regarding PIs, using the concept of “aspiration level”, that is, the achievement level desired for the corresponding PI. Thus, it is possible to obtain a set of goals in line with the basic ideas underlying in GP approach [35]. Accordingly, let us assume that, for each positive PI, it is possible to give an aspiration level (denoted by u j d + ). It corresponds to the minimum value from which it is considered that a unit shows a suitable performance, regarding the aspect of sustainability evaluated by the PI. Thus, for the i-th unit, the goal corresponding to the jd-th positive PI can be defined as follows:
I i j d + + n i j d + p i j d + = u j d +   with   n i j d + ,   p i j d + 0 ,     n i j d + · p i j d + = 0
where n i j d + , p i j d + represent the negative and positive deviation variables, respectively. Thus, if the goal is satisfied ( I i j d + > u j d + ), the negative deviation variable would be zero, and the positive deviation variable would measure the over-achievement of the goal (strength). Otherwise, if the goal is not satisfied ( I i j d + < u j d + ) , the positive deviation variable would be zero and the negative deviation variable would quantify the under-achievement of the goal (weakness). It should be noted that, at least, one of the two deviation variables has to be zero. Consequently, for positive PIs, the negative deviation variables will be considered unwanted variables because a better-positioned company will achieve the aspiration level or a higher value.
In a similar way, for each negative PI, we have the following goal:
I i k d + n i k d p i k d = u k d   with   n i k d ,   p i k d 0 ,     n i k d · p i k d = 0
Again, n i k d , p i k d represent the negative and positive deviation variables, respectively. However, now, if the goal is satisfied ( I i k d < u k d ), the positive deviation variable would be zero and the negative deviation variable would quantify the under-achievement of the goal (strength). Otherwise, if the goal is not satisfied ( I i k d > u k d ), the negative deviation variable would be zero, and the positive deviation variable would quantify the over-achievement of the goal (weakness). Consequently, for negative PIs, the positive deviation variables will be considered unwanted variables because a better-positioned company will achieve the aspiration level or a lower value.
From all the above, at each dimension d, the strengths of each unit can be calculated by aggregating positive deviation variables, in case of positive PIs, and negative deviation variables, for the negative PIs. These variables are normalized by their corresponding aspiration levels to avoid the inadequate effects due to the use of different measurement scales of the initial set of PIs. Similarly, the weaknesses of each water company can be obtained as the sum of the normalized unwanted deviation variables (negative deviation for positive PIs and positive deviation for negative PIs divided by its corresponding aspiration level). Finally, the partial indicator for the i-th (i = 1,2, … M) unit, in the dimension d ( d D ) is determined by the difference between the strengths and weaknesses of this unit as follows:
P S U I i ˜ d = j d = 1 J d p i j d + u j d + + k d = 1 K d n i k d u k d j d = 1 J d n i j d + u j d + + k d = 1 K d p i k d u k d
Additionally, two fictitious units are introduced in the sample, representing the best and worst situation within the data base. For each positive indicator in dimension d, jd, and negative PI, kd, the value of the “best” unit (b) will be:
I b j d + = M a x i M I i j d ,   I b k d = M i n i M I i k d
and the value of the worst unit (w):
I w j d + = M i n i M I i j d * ,   I w k d = M a x i M I i k d  
For these fictitious units, their corresponding partial sustainability indicators are calculated. Finally, we can obtain the difference between P S U I ˜ i d   with respect to the value reached by the worst unit and normalize this value by the difference between the partial sustainability indicator for the best and the worst unit, that is:
P S U I i d = P S U I ˜ i d P S U I ˜ w d P S U I ˜ b d P S U I ˜ w d ,         i =   1 ,   2 , ,   M ;   d D
The advantage of using P S U I i d instead P S U I i ˜ d is that it offers a relative value between 0 and 1. In fact, it represents how far a unit is from the worst situation regarding the distance between the best and the worst situation. Additionally, this normalization does not distort the previously obtained results, but allows a more homogeneous and simple analysis of the dimensional results obtained.
Once the partial sustainability indicators for each dimension are obtained, the second phase consists of calculating the global sustainability indicator (GSUI). To do so, the “Benefit-of the-Doubt” approach [36], which is rooted DEA, is applied.
Now, for each unit a, GSUIa (a =1,2, … M) represents the weighted average of the partial indicators P S U I a d ( d D ), which is obtained by solving the following optimization problem:
G S U I a = M a x d D w a d P S U I a d
Subject to:
d D w i d P S U I i d 1     ; i = 1 , 2 , , a , M L d w i d P S U I i d d D w i d P S U I i d U d   ; i = 1 , 2 , , a , M ; d D w i d 0   i = 1 , 2 , , a , M ; d D
where Ud and Ld are the upper and lower bounds allowed for the relative contribution of PSUId to the global indicator. The aim of Equation (7) is to obtain the weights (assigned to the partial indicators) that maximize the global score (GSUIa) for every unit a. Therefore, this model provides a relative objective performance value for each unit without requiring prior knowledge of the weights for the partial indicators [37]. These weights are endogenously determined solving Equation (7) and, by construction, GSUIa takes value between 0 (the worst situation) and 1 (the best situation).
In essence, Equation (7) is an output multiplier DEA model with multiple outputs (partial indicators) and a single “dummy input” with value equal to 1 for all the units [
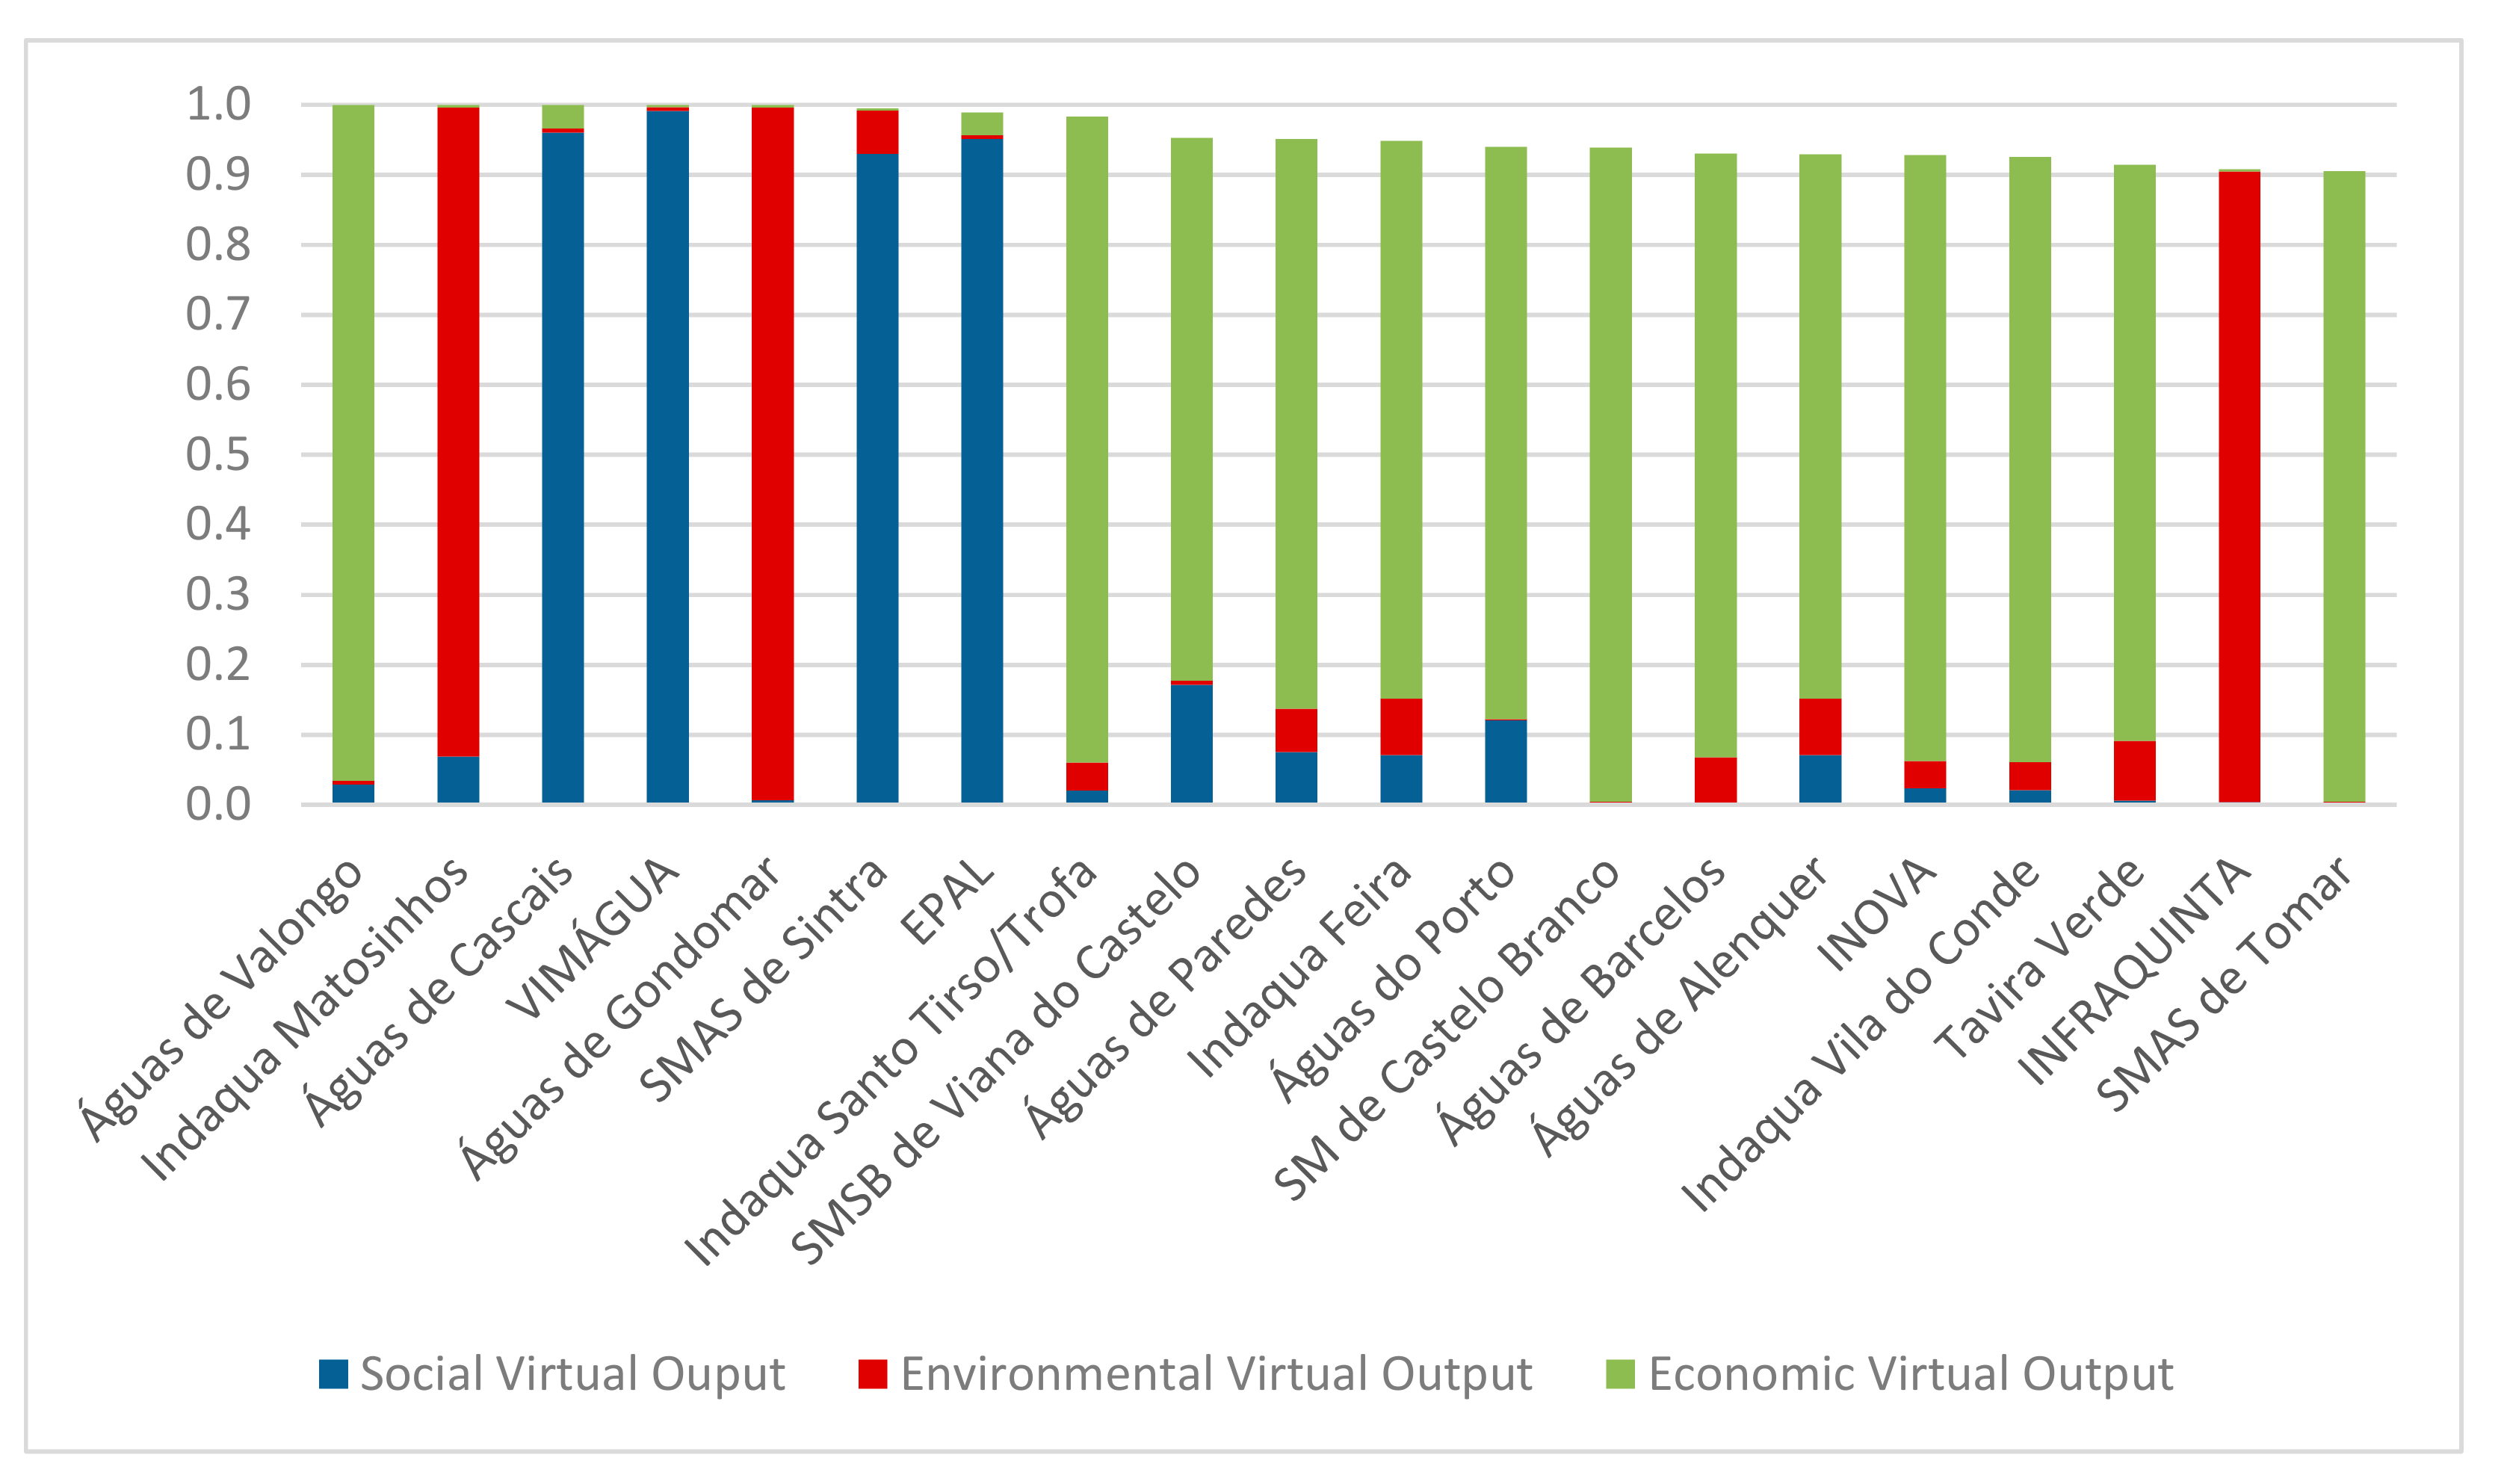
38]. In the DEA context, the contribution of each partial indicator to the value of the global indicator ( w i d P S U I i d ) is labelled as the “virtual output” of the corresponding dimension.
To avoid extreme situations, some constraints on the weights have been added to Equation (7). All partial indicators should have a relative contribution on the global indicator, that is, all the dimensions should be taken into account in the global score. For this reason, lower and upper bounds (Ud and Ld) have been established on the relative contribution of each partial indicator (PSUId).
Thus, the proposed approach offers a composite indicator which provides information about the contribution of each sustainability dimension to the global score. It allows to take into account the special characteristics of the units considered since the same importance does not need to be given to each dimension for the different units.

3. A Real Application

3.1. Data Description

Our aim is to use the concept of sustainability proposed by [20] to evaluate the performance of Portuguese water companies. In Portugal, we find two kinds of water companies: on the one hand, there are companies that provide services in all activities involved in the urban water cycle and, on the other hand, there are companies that focus on the distribution of drinking water and collection of wastewater. In any case, a national authority (ERSAR: Entidade Reguladora dos Serviços the Águas e Resíduos (www.ersar.pt)) regulates all companies. ERSAR states different regulatory functions over all the operators related to waste and water management. The statutes of ERSAR impose significant regulatory functions among the operators in charge of waste and water management in Portugal. Their concern is to respect customer rights and safeguard sustainability, as well as to provide economic visibility of the systems. In particular, this national authority applies the sunshine regulation model [39], which consists of sharing the information derived from a set of specific performance indicators that is provided by the operators. There are several factors that differentiate the Portuguese water companies, such as the management model or the regional location, among others. Portugal offers different management models for their water companies [19]: direct management (municipalities, municipalized services, and associations of municipalities); delegation (municipal-owned company or company established in partnership with the State (municipal or State-owned company), parishes, or user associations), and concession (municipal concessionaire or public–private partnership—municipality or municipalities and other private operators). In general, most of the municipalities receive the service directly from the municipal departments or municipal services with autonomy. This regulatory model has some strengths (the quality of service, the technical regulation and the access to information) but it also has some weaknesses (poor governance and failure to address identified problems). The evolution of the Portuguese water industry has been widely studied. However, some internal problems remain (water losses, poor staff productivity, …), in addition to the fact that the sector is excessively politicized. A more detailed description about this model of regulation and its characteristics can be found in [19].
To show the potential of the methodology proposed in the previous section, we consider an initial set of indicators applied to a set of Portuguese water companies. In the selection of these sustainability metrics, we take into account the availability of statistical data [37], as well as their relevance. The selection of these indicators is analogous to [12], whose data were obtained from the ERSAR list of Portuguese water companies in 2012. Nevertheless, on this occasion, data is updated to 2015 and, besides, the present work really makes use of the classification into three dimensions established in [12], in order to carry out the first phase of our approach. Then, 14 initial indicators are set, divided into three dimensions: social (5), environmental (5), and economic (4). In general, IS denote social indicators, whereas IEN are those related with environmental issues and IEC for the economic indicators.
Table 1 summarizes the main features of each initial PI, as well as the direction of improvement (negative or positive PIs), unit, average and standard deviation (for more details see Appendix A: Table A1). In particular, IS4, IS5, IEN4, and IEN5 are binary indicators, so they get a value of 1 if the water company has the certification, or 0 otherwise.
Regarding water companies, Table 2 provides information related to the localization of them. In this sense, following the classification from Eurostat, the NUTS classification (Nomenclature of Territorial Units for Statistics) is a hierarchical system for dividing up the economic territory of the European Union. In particular, NUTS II are basic regions for the application of regional policies. Then, Portugal (continental) is divided into five regions or NUTS II (North, Centre, Metropolitan Area of Lisbon (MA Lisbon), Alentejo, and Algarve). Most of the water companies are located in the North (48) and Centre (58) regions, a large group is equally located in the Alentejo (30) region, and just a few of them are located in Algarve (12) and MA Lisbon (15) regions.
Additionally, general information (obtained from Eurostat) about these NUTS II are shown in Table 2, in order to clarify the main characteristics of the regions in which the water companies are located. Thus, Centre and Alentejo regions are the largest areas, while MA Lisbon region is the smallest. Nevertheless, the last one presents the highest population per km2 (1007.09 population). Finally, MA Lisbon region gets the highest GDP per capita (24,700 €), representing 36.00% of the total Portugal GDP; while the Centre region gets the lowest GDP per capita (16,000 €), representing the 29.40% of the total Portugal GDP.

3.2. Results and Discussion

Taking into account the case study described above, Figure 2 displays a visual scheme of our methodological approach to evaluate the case of the Portuguese water companies. Let us assume that every initial indicator is already assigned to a dimension. Observe that Phase 1 entails designing partial sustainable indicators ( P S U I d ), in order to analyze the situation of water companies for each particular dimension, based on the information provided by the corresponding initial indicators. Afterwards, Phase 2 summarizes the information provided by these P S U I d into a global indicator ( G S U I ).

3.2.1. Phase 1: P S U I i d Calculation

The first phase addresses the calculation of P S U I i d . To do this, the aspiration levels for each indicator have to be established. Our proposal follows previous works [5,12,40,41], so that, for positive initial indicators, the aspiration levels were set to the 80% value of the mean for each initial indicator; whereas in the case of negative initial indicators, the reciprocal percentage of the mean was used.
Results obtained are shown in Figure 3 (Water companies are listed following the ranking obtained for the global indicator in the second phase. The numbers associated with the water companies are provided in Table 5). For each water company, a set of three values is represented in different colors which denote each dimension. Note that, following the formulation of the dimensional indicators, the maximum value that a water company can get for each dimension is 1. Therefore, for the social dimension, it can be seen that five water companies obtain remarkable results in comparison to others: Águas de Cascais, EPAL, SMAS de Sintra, Vimágua and SMSB de Viana do Castelo. According to its location, Águas de Cascais, EPAL, and SMAS de Sintra are located in MA Lisbon region, and Vimágua and SMSB de Viana do Castelo in North region. It can be seen that most of the water companies obtain poor results for this dimension and that just a few of them obtain values greater than 0.5.
Likewise, an analysis within the environmental dimension reveals the good performance of Águas de Gondomar, Indaqua Matosinhos, Infraquinta, and Tavira Verde. Similarly, based on its location, Águas de Gondomar and Indaqua Matosinhos are located in the North region; and Infraquinta and Tavira Verde in the Algarve region. Aguas de Gondomar reaches the best position, since it provides the largest production of energy (IEN2). Note that each of these four better-positioned water companies produces between 14% and 20% of the energy that it uses. In general, most of the water companies obtain poor results in this dimension, too.
Additionally, in both of these dimensions, the values which indicate the certifications obtained for each water company plays an important role in the construction of the dimensional indicators, as determined in [12].
Finally, the results obtained for the economic dimension are ranged between 0.18 and 0.8 for all companies, highlighting Águas de Valongo and Indaqua Santo Tirso/Trofa, which are located in the North region. In particular, these water companies reach values greater than the average for all the initial indicators. In the data obtained, approximately the 56% of the water companies present an operating cost coverage ratio (IEC3) larger than the average.
In general, note that the best dimensional performance of the water companies is located in MA Lisbon, Algarve and North regions, despite the fact that more than a half of the companies (approximately 54%) are located in the other two regions (Alentejo and Centre regions).
In the same way, Table 3 shows the top 20 water companies for each dimension considered. It should be noted that there are four companies that appear among the top 20 in the three dimensions: Águas de Cascais, Águas de Valongo, Águas de Paredes, and Indaqua Matosinhos. Furthermore, 13 other companies stand out for two dimensions.
Similarly, Table 4 shows the bottom 20 water companies for each dimension. In this case study, most of the companies (33) get bad results in just one of the three dimensions and only three water companies obtain poor results in the three dimensions: CM de Castelo de Paiva, CM de Arronches, and CM de Aljustrel.
In managerial terms, within the top-20 rankings, those companies that follow the municipal concessionaire management model obtain good results in the environmental (13) and economic dimensions (11). Additionally, in the social dimension, the ranking is leaded by a mixture of water companies following different management models: municipal or State-owned companies (VIMÁGUA and EPAL), municipal concessionaire (Águas de Cascais), or direct management (SMAS de Sintra and SMSB de Viana do Castelo).
The results obtained in this section are of great interest for water regulators. They enable the operators to learn from the best positioned water companies in each dimension and establish operative strategies in the correct direction with the aim of reducing the weaknesses in the mid-term. In general, social and environmental issues are still insufficiently integrated into management processes and there is room to improve these dimensions. Regulators should promote certification programs to encourage water companies to make necessary improvements in order to obtain these certifications.

3.2.2. Phase 2: G S U I a Calculation

Once the dimensional indicators ( P S U I i d ) are obtained for each water company, the optimization problem (Equation (7)) is applied in order to obtain the Global Sustainability Indicator proposed ( G S U I a ). These solutions will provide the weights for social (S), environmental (EN), and economic (EC) dimension, maximizing the global score for each water company. In this way, this problem provides the weights for social, environmental, and economic dimension, maximizing the global score for each water company. The lower and upper bounds of the constraints are set to 0.001 and + , respectively. This ensures that each dimension represents, at least, the 0.1% of the global score.
Figure 4 shows the values obtained for G S U I a . It can be observed that there are five water companies (Águas de Cascais, Águas de Gondomar, Águas de Valongo, Indaqua Matosinhos, and Vimágua) that reach a value equal to 1 for the global indicator. EPAL, Indaqua Santo Tirso/Trofa and SMAS de Sintra are, also, very close to achieving a score of 1. It should be noted that 42.95% of the set of water companies obtain a global value greater than 0.70; in particular, 25.15% of water companies obtain a global value greater than 0.80. Then, a large group of water companies obtains good results, as they reach a value close to 1. Additionally, there are no companies obtaining a global value lower than 0.20.
Table 5 lists all the water companies (163) according to the values obtained for the global indicator, G S U I a . On the one hand, regarding the best results, four companies that belong to the top-20 for every dimension also appear within the best global indicator values. Moreover, between the companies ranked better, based on GSUI, there are 11 water companies whose PSUI value leads them to the top-20 in two different dimensions. On the other hand, there are three companies that were part of the bottom ranking for all the dimensions and, also, for the global indicator value. In particular, between the 20 worst positioned water companies, based on the global indicator GSUI, there are four water companies that also appeared among the worst results for two dimensions. The other 13 water companies included in this bottom 20 ranking obtained poor results in the economic dimension.
An analysis about the correlation between all the rankings is shown in Table 6 using a Kendall tau test. Correlations are significant at 1% level and values obtained show a high correlation between the economic dimension ranking and the global ranking (0.925). The rest of the correlations are similar and positives, and they are ranged between 0.26 and 0.40.
The proportional contribution differences can be explained by the particular profile characterizing each company. A global analysis reveals some influence of the location of the water companies in these lists. On the one hand, note that 12 of the top-20 water companies are located in the North region, three water companies are located in MA Lisbon, three water companies are located in the Centre region, and two water companies are located in the Algarve region. No one of the top-20 water companies is located in Alentejo region. Additionally, the geographical distribution of these water companies with the best performance on GPSUI might be grouped into two main locations along the Portuguese coast: those companies that are placed close to Oporto (for example: Águas de Valongo, Indaqua Matosinhos, Águas de Gondomar, Indaqua Santo Tirso/Trofa, Águas de Paredes, Indaqua Feira, Águas do Porto), and the ones close to the capital (Águas de Cascais, SMAS de Sintra, EPAL). On the other hand, within the bottom-20 water companies, none of them is located in the MA Lisbon or in Algarve region. Nevertheless, most of them are located in the North region (11), five water companies are located in the Alentejo region, and four water companies are located in the Centre region.
In relation to the weights obtained by solving Equation (7), Table 7 summarizes the maximum and minimum values for the virtual outputs obtained, as well as their mean and standard deviation for each dimension. The economic dimension, in general, is the one with the largest virtual outputs in the global aggregation. As the reader may observe in Figure 3, almost all water companies obtain similar (good) values in this dimension. On the contrary, the social and the environmental dimensions lose importance in the global weighting. The results show how some companies obtained very good results in these dimensions but, at the same time, a larger proportion of the companies obtained relatively poor results.
Figure 5 shows the percentage contribution of each partial indicator to the value of the global composite indicator, for the top-20 water companies. Differences in percentage contribution can be explained by the particular profile characterizing each company. Despite the good performance of those 11 companies within the top-20 at each dimension, in the global score there is no company that displays a balanced contribution among the three dimensions. Then, if a balance between dimensions is searched, the best water companies of the global indicator are not a good reference for the others, in this context. In general, water companies should seek to improve their results in the dimension in which they obtained the worst results in the first phase, without neglecting the maintenance of good performance in those dimensions in which they obtained good results. Moreover, focusing on the companies that have a value equal to 1 in the global indicator, Águas de Cascais and VIMÁGUA exhibit a greater contribution of the social dimension, while Indaqua Matosinhos and Águas de Gondomar prioritize environmental dimension. However, Águas de Valongo stands out for the percentage contribution of the economic dimension, while a minor importance of the others. In the rest of companies, among those with a value of the global indicator close to 1, it is worth mentioning that Indaqua Feira and Águas de Alenquer present a similar performance with an analogous contribution of each dimension, around 8% for the social dimension, 9% for the environmental dimension, and 83% for the economic one. In general, a trade-off between the economic dimension and the others can be observed jointly.
In managerial terms, within the top-20 ranking, ten companies that follows municipal concessionaire management model obtain good results the global indicator. The other ten companies present a fair distribution between the other two management models. Additionally, note that all water companies belonging to the bottom-20, use the municipal direct management model.
Then, the proposed approach allows evaluating the strengths and weaknesses of each water company in a particular dimension and, at the same time, provides information about the contribution of the dimensions to the sustainability overall score. These are the main advantages in comparison to the previous methodology. In fact, if the initial indicators are directly aggregated using the methodology based on goal programming, the results obtained regarding the best and the worst global performance of the water companies are similar to those obtained with the proposed two-phase approach. In particular, the top-13 using the previous methodology is formed by water companies that appear in our global top-20. Nevertheless, using the previous methodology, the advantages named above disappear because dimensional results are not obtained and, therefore, the contribution of them to the global indicator is missing.
Consequently, in light of the results obtained, it is necessary to perform some transformations towards sustainability with a balanced percentage contribution of each dimension. Implementing appropriate programs that highlight social and environmental aspects is required to address global sustainability in an adequate manner. Nevertheless, the proposed approach allows a better observation of the differences among the water companies, dimensional and globally. It eases identifying strengths and weaknesses of the companies, helping the decision-maker to set strategies to improve the medium- and long-term sustainability of such companies.

4. Conclusions

Despite the multiple benefits brought by following an efficient performance, in water management only a few works provide alternatives. In this context, benchmarking plays an important role. Normally, to study the efficiency requires information collected by indicators. However, some difficulties arise when dealing with several indicators and their interpretation. In order to overcome these problems, CIs are introduced in this field, providing different strategies to aggregate the indicators into a unique score that summarizes the information.
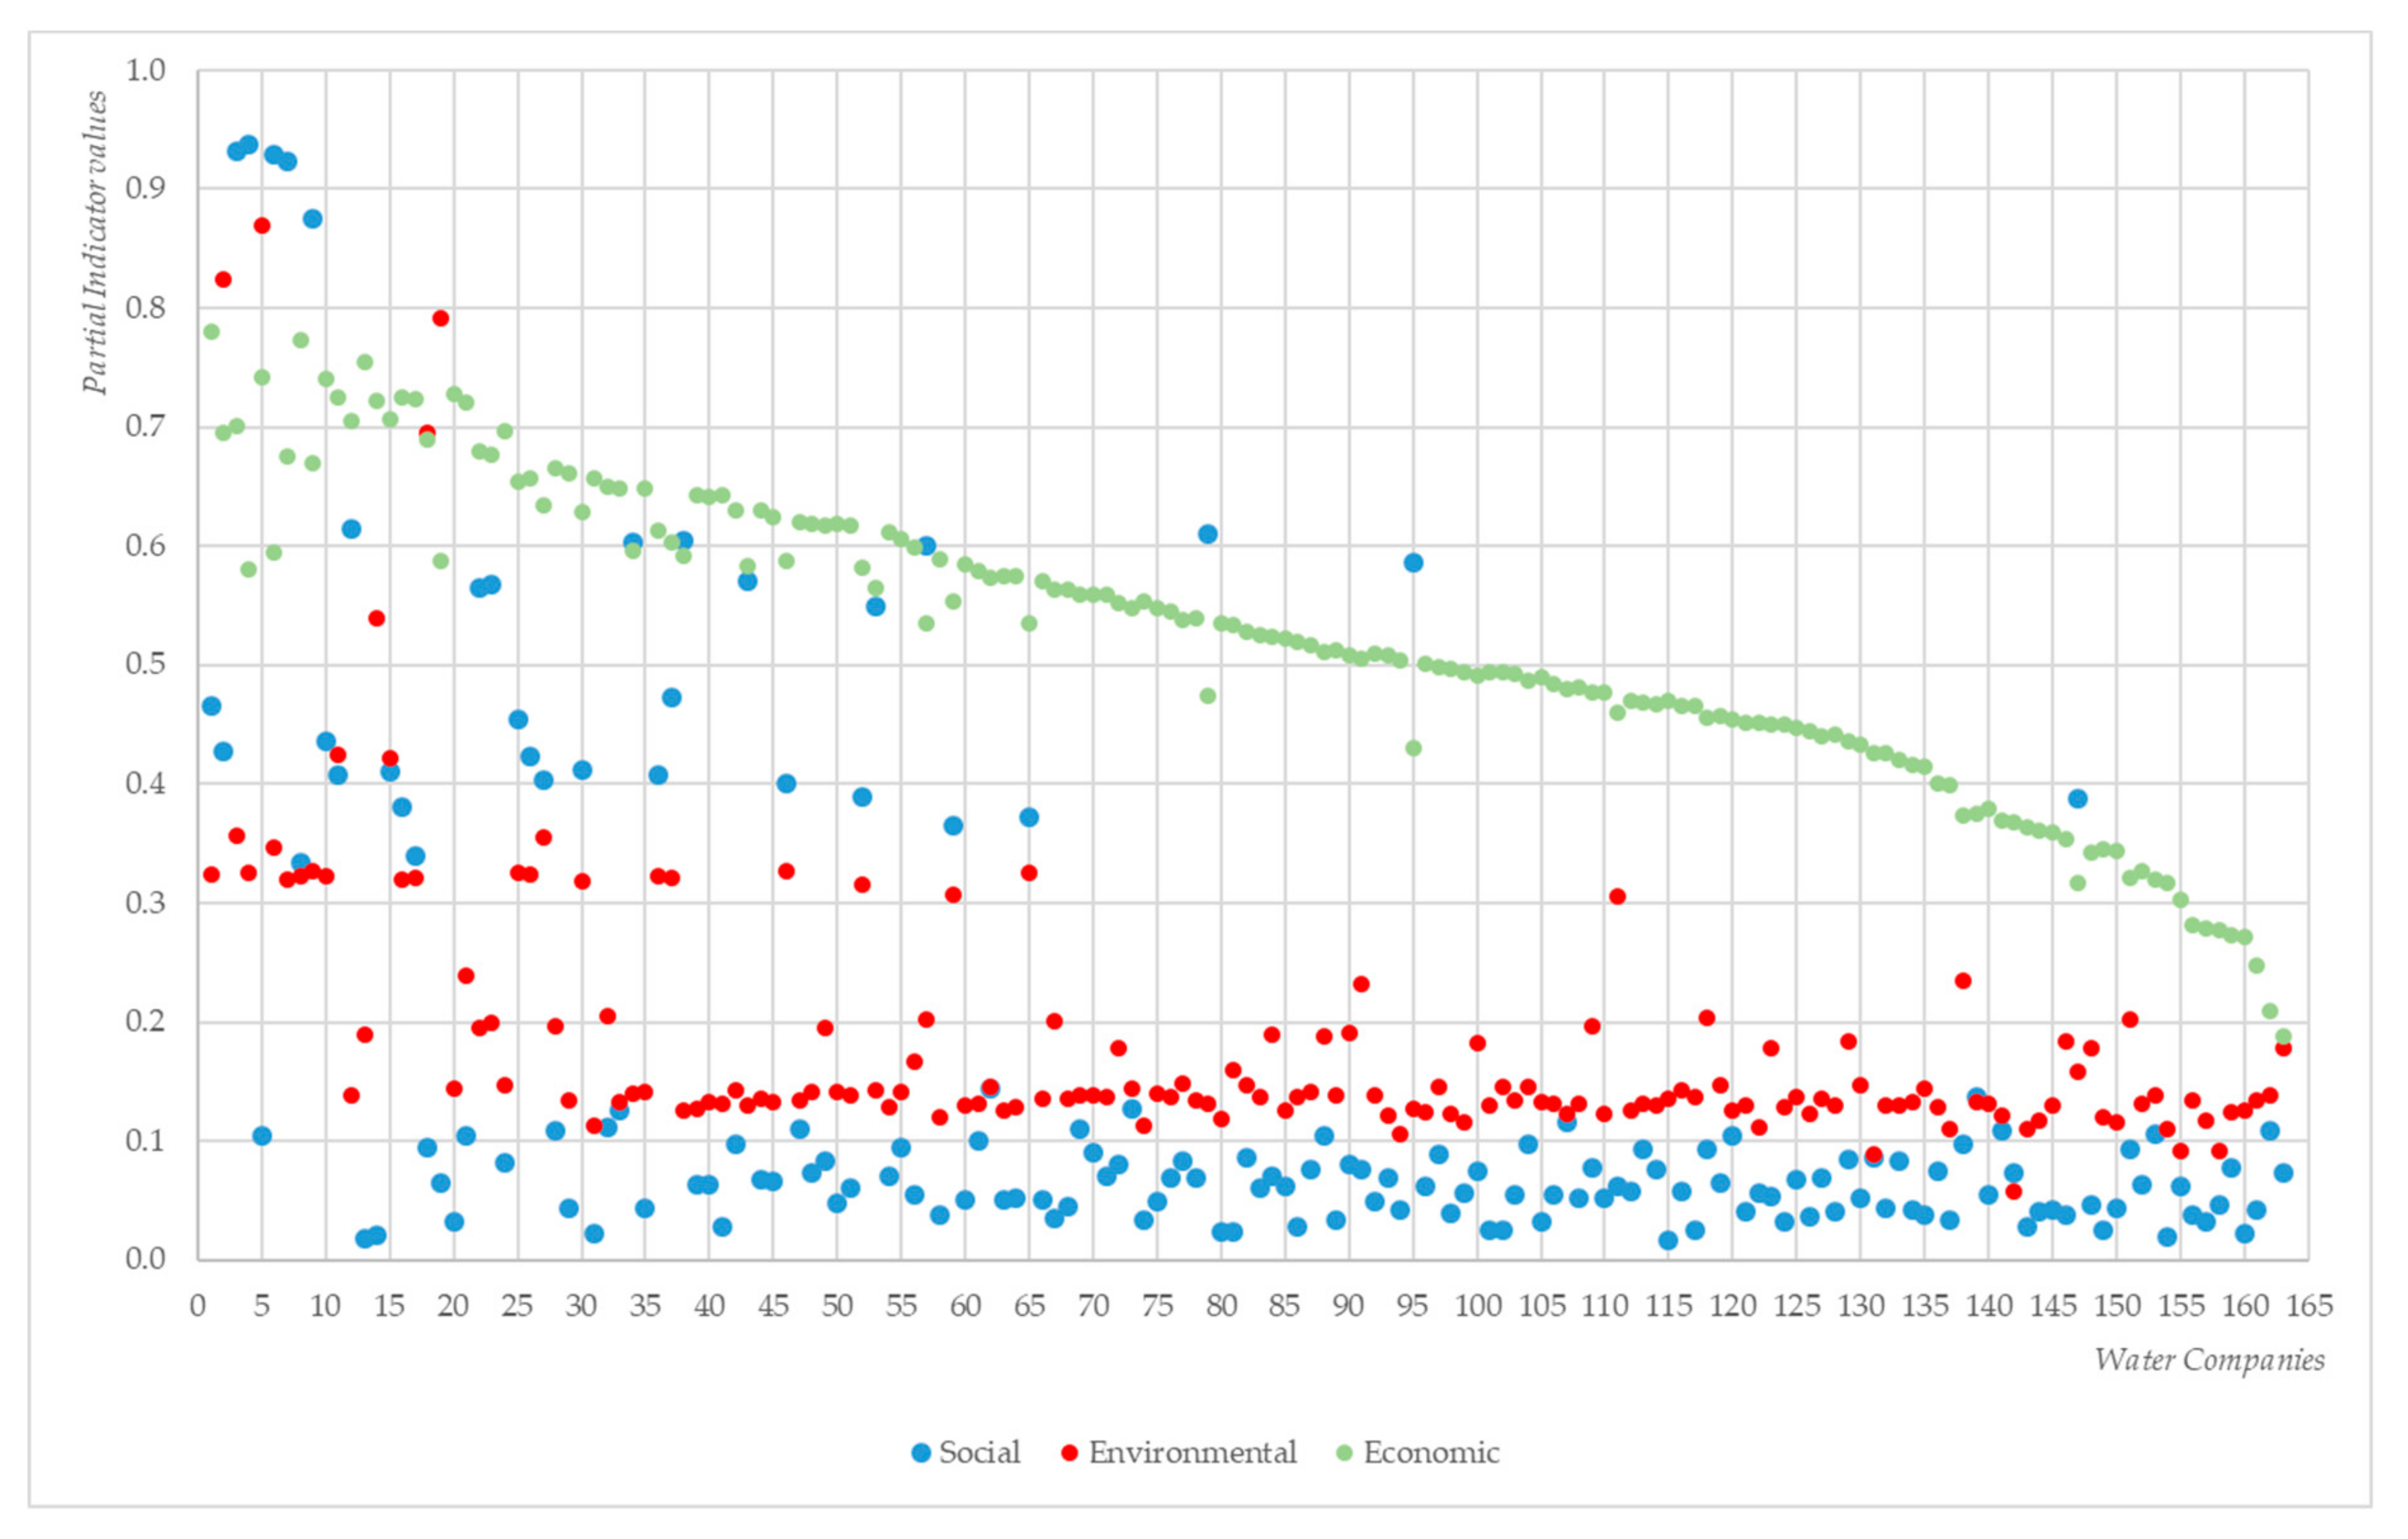
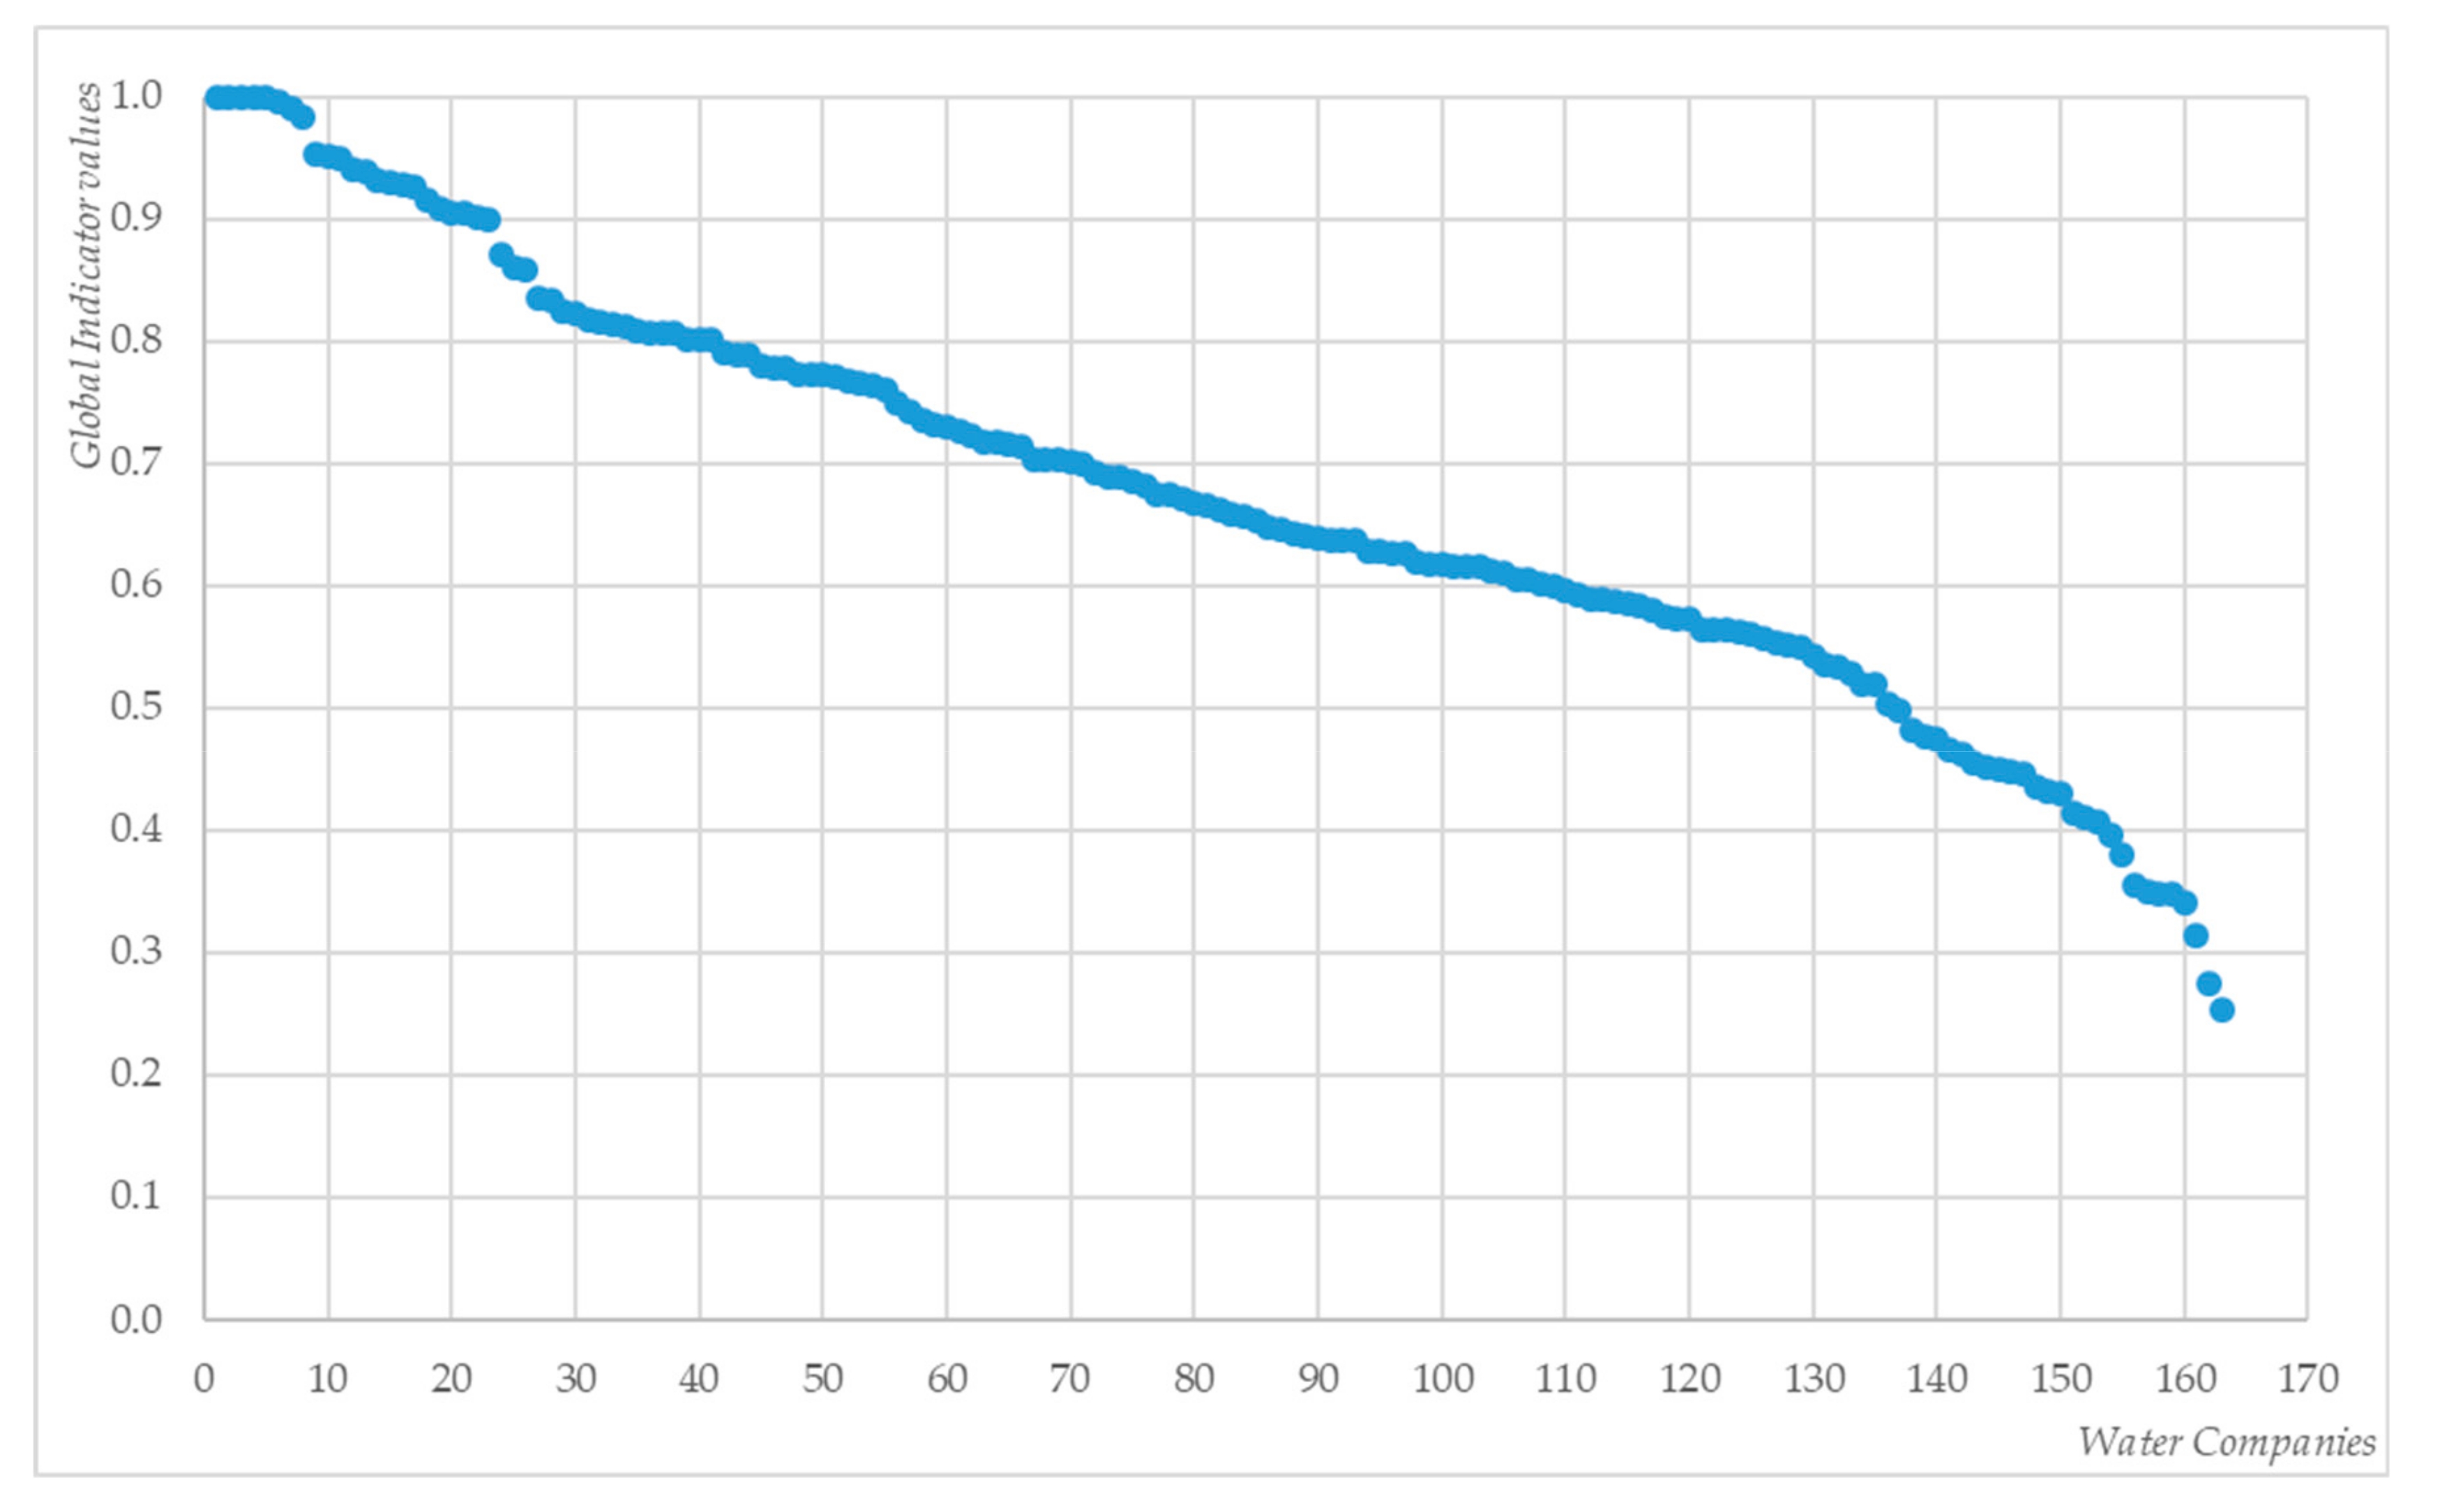
In particular, this work provides an alternative methodology to evaluate the performance of a set of Portuguese water companies following two steps. First, in order to analyse the economic, social and environmental dimensions, we divide the initial set of indicators into these three dimensions and construct a partial sustainable index for each of them, inspired by GP. In general, water companies present the largest value for the economic partial sustainability indicator (PSUIEC), whereas the partial sustainable index for the social and environmental dimensions present poor scores, the former being slightly lower. In particular, ranking these results, we find that just a few water companies stand out among the top 20 best scores in the three dimensions, simultaneously. This fact could be translated into policies to improve social and environmental aspects of the water companies. The second step uses a variant of DEA to provide a global performance index that uses the information provided by the partial indicators for each company. As a result, a large percentage of water companies obtain a global score over 0.7, whereas no companies show a value below 0.2. However, an individual analysis of the contribution of each dimension to the global score shows no equilibrium.
Furthermore, in this analysis one may observe two profiles: on the one hand, many water companies present a good global score due to the value they achieve in the economic partial sustainability indicator, whereas, on the other hand, the good global results of the other companies are due to their performance in the social and environmental dimensions, jointly. The results obtained show that the water companies, in the Portuguese context, do not manage their activity in a balanced way from the social, environmental, and economic point of view. Consequently, there are no water companies, in this context, that can be considered a “good benchmark” for the rest, so that they achieved good results in the three dimensions in a balanced way. In this case, each water company should seek to improve their results in the dimension(s) with lower contribution in the sustainability, taking into account the scores in the first phase, without neglecting the maintenance of good performance in those dimensions in which good results are obtained. In this context, as a future line of research, it would be interesting to define an ideal company that reaches a good percentage contribution of each dimension on the sustainability, and then compare the sample of water companies with this one ideal.
Nevertheless, this work introduces an alternative to assess the sustainability of water companies in two phases. It permits assessing and/or comparing the dimensional sustainability in the first phase, and to provide a holistic performance perspective in the second phase, generating a ranking of the water companies. The proposed approach could be very useful for water regulators: (a) to verify the effectiveness of existing policies; (b) to support decision making in concrete dimensions; and (c) to monitor global trends. In other words, measuring sustainability, holistically and for dimension, will allow water regulators to make critical decisions and, if needed, implement corrective measures to improve it and do it in the correct direction.

Author Contributions

All authors contributed to the paper as follows. Conceptualization, F.P., L.D.-A. and T.G.; Methodology, F.P., L.D.-A. and T.G.; Software, F.P.; Validation, F.P., L.D.-A. and T.G.; Formal Analysis, F.P., L.D.-A. and T.G.; Investigation, L.D.-A.; Resources, F.P., L.D.-A. and T.G.; Data Curation T.G.; Writing—Original Draft Preparation, F.P., L.D.-A. and T.G.; Writing—Review and Editing, F.P., L.D.-A. and T.G.; Visualization, F.P., L.D.-A. and T.G.; Supervision, F.P., L.D.-A. and T.G.

Funding

This research was funded by Ministerio de Ciencia, Innovación y Universidades from Spain, grant number ECO2016-76567-C4-4-R; by the Consejería de Conocimiento, Investigación y Universidad from Junta de Andalucia [SEJ417] and by Universidad de Málaga, grant number PPIT.UMA.B1.2017.21.

Conflicts of Interest

The authors declare no conflict of interest.

Appendix A

Table A1. Initial set of PIs.
DimensionAcronymPerformance Indicator
SocialIS1Service coverage (% of the households for which the water company provides effective connected service)
IS2Drinking water quality safety (% of water supplied that meets the legal quality requirements)
IS3Reserve capacity for treated water (capacity to supply water of the water company if new water resources are not available)
IS4Certification of management systems for occupational risk and health issues at work
IS5Other certifications (corporate social responsibility, consumer protection mechanisms, …)
EnvironmentalIEN1Water losses in the network (volume of drinking water lost/km/day)
IEN2Internal power generation (% of energy used own-generated by the water company)
IEN3Energy efficiency in pumping water (average consumption of energy for water pumping)
IEN4Certification of management systems (environmental responsibility, environmental impact assessment mechanisms…)
IEN5Certification of management systems for water quality issues
EconomicIEC1Non-revenue water (% of water that is supplied but not invoiced)
IEC2Adequacy of staffing (number of full time equivalent employed / 1000 water supply connections)
IEC3Operating cost coverage ratio (total annual operational revenues / total annual operational costs)
IEC4Index of knowledge about infrastructure and asset management

References

  1. Carvalho, P.; Marques, R.C.; Berg, S. A meta-regression analysis of benchmarking studies on water utilities market structure. Util. Policy 2012, 21, 40–49. [Google Scholar] [CrossRef] [Green Version]
  2. Molinos-Senante, M.; Gómez, T.; Garrido-Baserba, M.; Caballero, R.; Sala-Garrido, R. Assessing the sustainability of small wastewater treatment systems: A composite indicator approach. Sci. Total Environ. 2014, 54, 607–617. [Google Scholar] [CrossRef] [PubMed]
  3. Giannetti, B.F.; Bonilla, S.H.; Silva, C.C.; Almeida, C.M.V.B. The reliability of experts’ opinions in constructing a composite environmental index: The case of ESI 2005. J. Environ. Manag. 2009, 90, 2248–2459. [Google Scholar] [CrossRef] [PubMed]
  4. Voces, R.; Díaz-Balteiro, L.; Romero, C. Characterization and explaination of the sustainability of the European wood manufacturing industries: A quantitative approach. Expert Syst. Appl. 2012, 39, 6618–6627. [Google Scholar] [CrossRef]
  5. Blancas, F.J.; Caballero, R.; González, M.; Lozano-Oyola, M.; Pérez, F. Goal programming synthetic indicators: An application for sustainable tourism in Andalusian coastal countries. Ecol. Econ. 2010, 69, 2158–2172. [Google Scholar] [CrossRef]
  6. Pérez, V.; Guerrero, F.; González, M.; Pérez, F.; Caballero, R. Composite indicator for the assessment of sustainability: The case of Cuban nature-based tourism destinations. Ecol. Indic. 2013, 29, 316–324. [Google Scholar] [CrossRef]
  7. Diaz-Balteiro, L.; Voces, R.; Romero, C. Making sustainability rankings using compromise programming. An application to European paper industry. Silv. Fenn. 2011, 45, 761–773. [Google Scholar] [CrossRef]
  8. Sayed, H.; Hamed, R.; Hosny, S.H.; Abdelhamid, A.H. Avoiding Ranking Contradictions in Human Development Index Using Goal Programming. Soc. Indic. Res. 2018, 138, 405–442. [Google Scholar] [CrossRef]
  9. Guijarro, F.; Poyatos, J.A. Designing a Sustainable Development Goal Index through a Goal Programming Model: The Case of EU-28 Countries. Sustainability 2018, 10, 3167. [Google Scholar] [CrossRef]
  10. Valcárcel-Aguiar, B.; Murias, P. Evaluation and Management of Urban Liveability: A Goal Programming Based Composite Indicator. Soc. Indic. Res. 2019, 142, 689–712. [Google Scholar] [CrossRef]
  11. Xavier, A.; Costa Freitas, M.B.; Fragoso, R.; Rosário, M.S. A regional composite indicator for analysing agricultural sustainability in Portugal: A goal programming approach. Ecol. Indic. 2018, 89, 84–100. [Google Scholar] [CrossRef]
  12. Molinos-Senante, M.; Marques, R.C.; Pérez, F.; Gómez, T.; Sala-Garrido, R.; Caballero, R. Assessing the Sustainability of water companies: A synthetic indicator approach. Ecol. Indic. 2016, 61, 577–587. [Google Scholar] [CrossRef]
  13. Cherchye, L.; Moesen, W.; Rogge, N.; Van Puyenbroeck, T. Creating Composite Indicators with DEA Analysis: The Case of the Technology Achievement Index; Joint Research Centre, European Commission: Ispra, Italy, 2006. [Google Scholar]
  14. Murias, P.; de Miguel, J.C.; Rodríguez, D. A composite indicator for university quality assessment: The case of Spanish higher education system. Soc. Indic. Res. 2008, 89, 129–146. [Google Scholar] [CrossRef]
  15. Castellet, L.; Molinos-Senante, M. Efficiency assessment of wastewater treatment plants: A data envelopment analysis approach integrating technical, economic, and environmental issues. J. Environ. Manag. 2016, 167, 160–166. [Google Scholar] [CrossRef]
  16. Hernández-Sancho, F.; Sala-Garrido, R. Technical efficiency and cost analysis in wastewater treatment processes: A DEA approach. Desalination 2009, 249, 230–234. [Google Scholar] [CrossRef]
  17. Dong, X.; Zhang, X.; Zeng, S. Measuring and explaining eco-efficiencies of wastewater treatment plants in China: An uncertainty analysis perspective. Water Res. 2017, 112, 195–207. [Google Scholar] [CrossRef] [PubMed]
  18. Holden, E.; Linnerud, K.; Banister, D. Sustainable development: Our Common Future revisited. Glob. Environ. Chang. 2014, 26, 130–139. [Google Scholar] [CrossRef] [Green Version]
  19. Pinto, F.S.; Costa, A.S.; Figueira, J.R.; Marques, R.C. The quality of service: An overall performance assessment for water utilities. Omega 2017, 69, 115–125. [Google Scholar] [CrossRef]
  20. WECD, Our Common Future; Oxford University Press: Oxford, UK, 1987.
  21. Lo Storto, C. Efficiency, conflicting goals and trade-offs: A nonparametric analysis of the water and wastewater service industry in Italy. Sustainability 2018, 10, 919. [Google Scholar] [CrossRef]
  22. Arnold, M. The lack of strategic sustainability orientation in German water companies. Ecol. Econ. 2015, 117, 39–52. [Google Scholar] [CrossRef]
  23. Moller, K.A.; Fryd, O.; De Neergaard, A.; Magid, G. Economic, environmental and socio-cultural sustainability of three constructed wetlands in Thailand. Environ. Urban. 2012, 24, 305–323. [Google Scholar] [CrossRef] [Green Version]
  24. Marques, R.C.; da Cruz, N.F.; Pires, J.S. Measuring the sustainability of urban water services. Environ. Sci. Policy 2015, 54, 142–151. [Google Scholar] [CrossRef]
  25. Aydin, N.Y.; Mays, L.; Schmitt, T. Sustainability assessment of urban water distribution systems. Water Res. Manag. 2014, 28, 4373–4384. [Google Scholar] [CrossRef]
  26. Hamouda, M.A.; Nour El-Din, M.M.; Moursy, F.I. Vulnerability assessment of water resoiurces systems in the Eastern Nile basin. Water Res. Manag. 2009, 23, 2697–2725. [Google Scholar] [CrossRef]
  27. Lundie, S.; Peters, G.; Ashbolt, N.; Lai, E.; Livingston, D. A sustainability framework for the Australian water industry. Water 2010, 33, 83–88. [Google Scholar]
  28. Schulz, M.; Short, M.D.; Peters, G.M. A streamlined sustainability assessment tool for improved decision making in the urban water industry. Integr. Environ. Assess. Manag. 2012, 8, 183–193. [Google Scholar] [CrossRef] [PubMed]
  29. Ahn, J.; Kang, D. Optimal planning of water supply system for long-term sustainability. J. Hydro Environ. Res. 2014, 8, 410–420. [Google Scholar] [CrossRef]
  30. Duarte, A.A.L.S.; Rodrigues, G.M.C.; Ramos, R.A.R. A global service quality index to evaluate the performance and sustainability in water supply utilities. WSEAS Trans. Environ. Dev. 2009, 5, 759–769. [Google Scholar]
  31. Bana-e-Costa, C.A.; Vansnick, J.C. MACBETH-An interactive path towards the construction of cardinal value functions. Int. Trans. Oper. Res. 1994, 1, 489–500. [Google Scholar] [CrossRef]
  32. Almeida-Dias, J.; Figueira, J.R.; Roy, B. ELECTRE TRI-C: A multiple-criteria sorting method based on characteristic reference actions. Eur. J. Oper. Res. 2010, 240, 565–580. [Google Scholar] [CrossRef]
  33. Blancas, F.J.; Caballero, R.; Lozano-Oyola, M.; Pérez, F. The assessment of sustainable tourism: Application to Spanish coastal destinations. Ecol. Indic. 2010, 10, 484–492. [Google Scholar] [CrossRef]
  34. Environmental Protection Agency. Planning for Sustainability. A Handbook for Water and Wastewater Utilities; EPA: Seattle, DC, USA, 2012.
  35. Diaz-Balteiro, L.; González-Pachón, J.; Romero, C. Measuring systems sustainability with multi-criteria methods: A critical review. Eur. J. Oper. Res. 2017, 258, 607–616. [Google Scholar] [CrossRef]
  36. Cherchye, L.; Moesen, W.; Rogge, N.; van Puyenbroeck, T. An introduction to "benefit of the Doubt" Composite Indicators. Soc. Indic. Res. 2006, 82, 111–145. [Google Scholar] [CrossRef]
  37. Zhou, P.; Ang, B.W.; Poh, K.L. A mathematical programming approach to constructing. Ecol. Econ. 2007, 62, 291–297. [Google Scholar] [CrossRef]
  38. Despotis, D.K. Measuring human development via data envelopment analysis: The case of Asia and the Pacific. Omega 2005, 33, 385–390. [Google Scholar] [CrossRef]
  39. Marques, R.C.; Simões, P. Does the sunshine regulatory approach work? Governance and regulation model of the urban waste services in Portugal. Resour. Conserv. Recycl. 2008, 52, 1040–1049. [Google Scholar] [CrossRef]
  40. Lozano-Oyola, M.; Blancas, F.J.; González, M.; Caballero, R. Sustainable tourism indicators as planning tools in cultural destinations. Ecol. Indic. 2012, 18, 659–675. [Google Scholar] [CrossRef]
  41. Pérez, F.; Molinos-Senante, M.; Gómez, T.; Caballero, R.; Sala-Garrido, R. Dynamic goal programming synthetic indicator: An application for water companies sustainability assessment. Urb. Water J. 2018, 15, 592–600. [Google Scholar] [CrossRef]
Figure 1. General scheme of the proposed approach.
Energies 12 02638 g001
Figure 2. The two-phase approach applied to the case study.
Energies 12 02638 g002
Figure 3. Dimensional results obtained for each of the 163 water companies.
Energies 12 02638 g003
Figure 4. Global results obtained for each of the 163 water companies.
Energies 12 02638 g004
Figure 5. Contribution of each dimension partial indicator to the value of global composite indicator.
Energies 12 02638 g005
Table 1. Direction of improvement and statistical information from the initial set of PIs.
AcronymDirectionUnitAverageStandard Deviation
IS1Positive%86.628.93
IS2Positive%99.151.01
IS3PositiveDays1.460.9
IS4Positive-0.150.36
IS5Positive-0.090.29
IEN1Negativem3/km/day127.63104.62
IEN2Positive%0.562.69
IEN3NegativekWh (m3/100 m)0.880.65
IEN4Positive-0.150.36
IEN5Positive-0.310.47
IEC1Negative%37.1114.94
IEC2NegativeNumber/103 connections2.151.05
IEC3Positive%92.9933.34
IEC4Positive-49.1626.31
Table 2. Localization of the water companies and characteristics of the regions.
Region (NUTS II)Water CompaniesArea (Km2)Population (2011)Pop/km2Share in National GDP % (2017)GDP per Capita (€) (2017)
North4821,2853,689,682173.3529.40%16,000
Centre5828,2172,327,75582.4918.90%16,400
MA Lisbon1528022,821,8761007.0936.00%24,700
Alentejo3027,292757,30227.756.50%17,800
Algarve124960451,00690.934.60%20,500
Table 3. Top 20 water companies for each dimension.
P S U I i S P S U I i E N P S U I i E C
4 VIMÁGUA0.9375 Águas de Gondomar0.8701 Águas de Valongo0.779
3 Águas de Cascais0.9312 Indaqua Matosinhos0.8248 Indaqua Santo Tirso/Trofa0.772
6 SMAS de Sintra0.92819 INFRAQUINTA0.79213 SM de Castelo Branco0.754
7 EPAL0.92318 Tavira Verde0.6955 Águas de Gondomar0.742
9 SMSB de Viana do Castelo0.87614 Águas de Barcelos0.53910 Águas de Paredes0.740
12 Águas do Porto0.61511 Indaqua Feira0.42420 SMAS de Tomar0.727
79 SMAS de Almada0.61015 Águas de Alenquer0.42211 Indaqua Feira0.725
38 SMAS de Oeiras e Amadora0.6043 Águas de Cascais0.35616 INOVA0.724
34 SMAS de Leiria0.60327 FAGAR - Faro0.35517 Indaqua Vila do Conde0.724
163 CM de Miranda do Corvo0.6006 SMAS de Sintra0.34614 Águas de Barcelos0.722
95 SM de Loures0.5869 SMSB de Viana do Castelo0.32721 Águas da Figueira0.721
43 EMAS de Beja0.57046 Cartágua0.32615 Águas de Alenquer0.707
23 Águas da Região de Aveiro0.56825 Águas de Mafra0.32612 Águas do Porto0.705
22 Águas de Coimbra0.5644 VIMÁGUA0.3253 Águas de Cascais0.700
53 CM de Santiago do Cacém0.54965 Aquamaior0.32524 Águas do Planalto0.697
37 Aquaelvas0.47226 AGERE0.3242 Indaqua Matosinhos0.695
1 Águas de Valongo0.4661 Águas de Valongo0.32318 Tavira Verde0.689
25 Águas de Mafra0.45410 Águas de Paredes0.32322 Águas de Coimbra0.679
10 Águas de Paredes0.43536 Águas de Ourém0.32323 Águas da Região de Aveiro0.677
2 Indaqua Matosinhos0.4288 Indaqua Santo Tirso/Trofa0.3227 EPAL0.676
Table 4. Bottom 20 water companies for each dimension.
P S U I i S P S U I i E N P S U I i E C
137 CM de Avis0.033141 CM de Alijó0.121144 CM de Ferreira do Alentejo0.361
124 CM de Mértola0.03293 CM de Armamar0.121145 CM de Marvão0.359
157 CM de Castelo de Paiva0.032149 CM de Arronches0.120146 CM de Lousã0.353
105 CM de Almodôvar0.03258 CM de Redondo0.120149 CM de Arronches0.345
20 SMAS de Tomar0.03280 CM de Castro Verde0.119150 CM de Cabeceiras de Basto0.344
41 INFRALOBO0.028144 CM de Ferreira do Alentejo0.118148 CM de Alfândega da Fé0.343
143 CM de Pinhel0.028157 CM de Castelo de Paiva0.116152 CM de Murça0.326
86 CM de Odemira0.028150 CM de Cabeceiras de Basto0.116151 CM de Sátão0.321
149 CM de Arronches0.02599 CM de São Brás de Alportel0.115153 CM de Penalva do Castelo0.320
117 CM de Caminha0.02531 CM de Póvoa de Varzim0.113154 CM de Aljustrel0.317
102 CM de Évora0.02574 CM de Oliveira do Hospital0.112147 CM de Santa Marta de Penaguião0.317
101 CM de Figueiró dos Vinhos0.025122 CM de Estremoz0.112155 CM de São João da Pesqueira0.303
80 CM de Castro Verde0.024143 CM de Pinhel0.110156 CM de Castanheira de Pera0.281
81 SMAS de Guarda0.024137 CM de Avis0.110157 CM de Castelo de Paiva0.279
160 CM de Ourique0.023154 CM de Aljustrel0.110158 CM de Moimenta da Beira0.277
31 CM de Póvoa de Varzim0.02294 CM de Vila Nova de Famalicão0.105159 CM de Sabrosa0.274
14 Águas de Barcelos0.020155 CM de São João da Pesqueira0.092160 CM de Ourique0.271
154 CM de Aljustrel0.020158 CM de Moimenta da Beira0.091161 CM de Tabuaço0.247
13 SM de Castelo Branco0.018131 CM de Proença-a-Nova0.088162 CM de Penedono0.209
115 CM de Grândola0.016142 INFRATROIA0.057163 CM de Miranda do Douro0.187
Table 5. Results for 163 water companies for global indicator.
Water Company G S U I a Water Company G S U I a
1 Águas de Valongo1.00083 CM de Nisa0.657
2 Indaqua Matosinhos1.00084 CM de Arganil0.657
3 Águas de Cascais1.00085 CM de Porto de Mós0.652
4 VIMÁGUA1.00086 CM de Odemira0.648
5 Águas de Gondomar1.00087 Águas de Carrazeda0.647
6 SMAS de Sintra0.99588 CM de Vale de Cambra0.643
7 EPAL0.98989 CM de Arraiolos0.640
8 Indaqua Santo Tirso/Trofa0.98390 CM de Espinho0.638
9 SMSB de Viana do Castelo0.95391 SMAS de Vila Franca de Xira0.636
10 Águas de Paredes0.95192 CM de Vila Viçosa0.636
11 Indaqua Feira0.94993 CM de Armamar0.636
12 Águas do Porto0.94094 CM de Vila Nova de Famalicão0.629
13 SM de Castelo Branco0.93995 SM de Loures0.627
14 Águas de Barcelos0.93196 CM de Ponte de Sor0.627
15 Águas de Alenquer0.93097 CM de Ponte da Barca0.626
16 INOVA0.92898 CM de Seia0.620
17 Indaqua Vila do Conde0.92699 CM de São Brás de Alportel0.617
18 Tavira Verde0.915100 CM de Se1bra0.617
19 INFRAQUINTA0.908101 CM de Figueiró dos Vinhos0.616
20 SMAS de Tomar0.905102 CM de Évora0.615
21 Águas da Figueira0.904103 CM de Alandroal0.615
22 Águas de Coimbra0.901104 CM de Aljezur0.612
23 Águas da Região de Aveiro0.899105 CM de Almodôvar0.610
24 Águas do Planalto0.871106 CM de Monção0.605
25 Águas de Mafra0.861107 CM de Óbidos0.604
26 AGERE0.858108 CM de Vila Nova de Foz Coa0.601
27 FAGAR—Faro0.836109 CM de Arcos de Valdevez0.599
28 CM de Albufeira0.834110 AMBIOLHÃO0.596
29 CM de Moita0.824111 INFRAMOURA0.592
30 Águas de S. João0.823112 CM de Montemor-o-Velho0.588
31 CM de Póvoa de Varzim0.816113 CM de Cadaval0.588
32 Luságua Alcanena—Gestão de Águas0.815114 CM de Terras de Bouro0.586
33 EMAR de Portimão0.813115 CM de Grândola0.585
34 SMAS de Leiria0.811116 CM de Alvaiázere0.583
35 SMAS de Viseu0.809117 CM de Caminha0.580
36 Águas de Ourém0.807118 CM de Bombarral0.575
37 Aquaelvas0.807119 CM de Mora0.573
38 SMAS de Oeiras e Amadora0.806120 CM de Alcoutim0.572
39 Águas do Sado0.801121 CM de Nelas0.565
40 Águas do Ribatejo0.801122 CM de Estremoz0.564
41 INFRALOBO0.801123 CM de Mira0.564
42 Águas da Azambuja0.790124 CM de Mértola0.561
43 EMAS de Beja0.789125 SMAS de Peniche0.560
44 SM de Alcobaça0.788126 CM de Lamego0.556
45 CM de Marinha Grande0.779127 CM de Castro Daire0.553
46 Cartágua0.778128 CM de Mourão0.551
47 CM de Sines0.777129 CM de Penela0.549
48 Águas do Lena0.773130 CM de Ponte de Lima0.542
49 CM de Vila Verde0.773131 CM de Proença-a-Nova0.535
50 CM de Seixal0.772132 CM de Soure0.533
51 Penafiel Verde0.770133 CM de Chaves0.529
52 Águas de Santarém0.768134 CM de Pedrógão Grande0.520
53 CM de Santiago do Cacém0.765135 CM de Ferreira do Zêzere0.519
54 SM de Nazaré0.764136 SMAS de Caldas da Rainha0.503
55 Águas do Marco0.759137 CM de Avis0.498
56 EMAR de Vila Real0.748138 CM de Vimioso0.482
57 CM de Miranda do Corvo0.742139 CM de Vila de Rei0.476
58 CM de Redondo0.734140 CM de Vila Nova de Poiares0.475
59 Aquafundalia0.731141 CM de Alijó0.466
60 CM de Reguengos de Monsaraz0.730142 INFRATROIA0.461
61 CM de Sousel0.726143 CM de Pinhel0.455
62 CM de Mogadouro0.722144 CM de Ferreira do Alentejo0.451
63 CM de Mealhada0.718145 CM de Marvão0.450
64 CM de Almeida0.718146 CM de Lousã0.447
65 Aquamaior0.715147 CM de Santa Marta de Penaguião0.446
66 CM de Mangualde0.713148 CM de Alfândega da Fé0.435
67 SMAS de Montijo0.703149 CM de Arronches0.432
68 CM de Barreiro0.703150 CM de Cabeceiras de Basto0.431
69 CM de Pombal0.703151 CM de Sátão0.415
70 SMAS de Torres Vedras0.701152 CM de Murça0.410
71 CM de Penacova0.699153 CM de Penalva do Castelo0.406
72 CM de Lagos0.692154 CM de Aljustrel0.396
73 CM de Góis0.689155 CM de São João da Pesqueira0.381
74 CM de Oliveira do Hospital0.689156 CM de Castanheira de Pera0.355
75 CM de Montemor-o-Novo0.684157 CM de Castelo de Paiva0.350
76 CM de Palmela0.682158 CM de Moimenta da Beira0.347
77 CM de Ansião0.675159 CM de Sabrosa0.347
78 SM de Abrantes0.674160 CM de Ourique0.341
79 SMAS de Almada0.671161CM de Tabuaço0.314
80 CM de Castro Verde0.666162 CM de Penedono0.275
81 SMAS de Guarda0.665163 CM de Miranda do Douro0.253
82 CM de Melgaço0.662
Table 6. Kendall tau test.
Rank Correlation CoefficientGlobal RankingSocial RankingEnvironmental RankingEconomic Ranking
Global Ranking1.000
Social Ranking0.324 **1.000
Environmental Ranking0.395 **0.369 **1.000
Economic Ranking0.925 **0.261 **0.361 **1.000
**: significance level at 1%.
Table 7. Statistical information for weights calculated.
Descriptive StatisticsSocialEnvironmentalEconomic
Minimum0.0010.0010.003
Maximum0.9910.9900.966
Mean0.0450.0290.598
Standard Deviation0.1560.1270.197

