Article

Beneficial Reuse of Industrial CO2 Emissions Using a Microalgae Photobioreactor: Waste Heat Utilization Assessment

1
Center for Applied Energy Research, University of Kentucky, Lexington, KY 40511, USA
2
Department of Chemistry, University of Kentucky, Lexington, KY 40506, USA
*
Author to whom correspondence should be addressed.
Energies 2019, 12(13), 2634; https://doi.org/10.3390/en12132634
Submission received: 28 May 2019 / Revised: 26 June 2019 / Accepted: 28 June 2019 / Published: 9 July 2019
(This article belongs to the Section B: Energy and Environment)

Abstract

:
Microalgae are a potential means of recycling CO2 from industrial point sources. With this in mind, a novel photobioreactor (PBR) was designed and deployed at a coal-fired power plant. To ascertain the feasibility of using waste heat from the power plant to heat algae cultures during cold periods, two heat transfer models were constructed to quantify PBR cooling times. The first, which was based on tabulated data, material properties and the physical orientation of the PBR tubes, yielded a range of heat transfer coefficients of 19–64 W m−2 K−1 for the PBR at wind speeds of 1–10 m s−1. The second model was based on data collected from the PBR and gave an overall heat transfer coefficient of 24.8 W m−2 K−1. Energy penalties associated with waste heat utilization were found to incur an 18%–103% increase in energy consumption, resulting in a 22%–70% reduction in CO2 capture for the scenarios considered. A techno-economic analysis showed that the cost of heat integration equipment increased capital expenditures (CAPEX) by a factor of nine and increased biomass production costs by a factor of three. Although the scenario is thermodynamically feasible, the increase in CAPEX incurs an increase in biomass production cost that is economically untenable.

Graphical Abstract

1. Introduction

Microalgae are a viable feedstock for the production of a variety of valuable commodities, as well as a medium for the capture of carbon dioxide emissions from industrial point sources such as combustion-based power plants. The idea of reducing CO2 emissions using microalgae was first demonstrated in the 1990s [1,2,3,4], indeed, studies have shown the ability of microalgae to adequately uptake carbon dioxide from industrial flue gas despite possible exposure to SOx and NOx [5,6] and high CO2 concentrations [7,8,9,10]. Moreover, it has been demonstrated that microalgae fed on flue gas can thrive while actually reducing NOx emissions by utilizing flue gas NOx as a nitrogen source [11].
Along with an obvious interest in reducing carbon dioxide emissions, economic interest in microalgae continues to expand into a variety of markets due to the diverse group of products that different strains produce. These include biofuels, bioplastics, animal feed, and high-value biochemicals such as β-carotene, astaxanthin, and omega-3 fatty acids [12,13,14,15,16,17].
Although published proof-of-concept studies concerning algae-based CO2 capture are limited in number [4,18,19,20,21], the use of industrial flue gas as a carbon source for microalgae is becoming more common, with several demonstrations taking place at power plants around the world [4]. We previously reported the operation of pilot-scale photobioreactors (PBRs) at Duke Energy’s East Bend Station located in Boone County, KY since late 2012 [11,22]. Compared to open raceway ponds, photobioreactors offer advantages for algae biomass production, including a greater areal productivity [23], minimal water loss from evaporation, and greater carbon capture efficiencies [24]. However, PBRs typically display high energy penalties which are associated with the continuous circulation of large volumes of algae culture, while biofilm formation has also been a major technical hurdle to the deployment and scale up of photobioreactors. Fully developed flow, as a result of continuous liquid flow in a pipe, results in a “no slip” condition at the pipe wall. This provides convenient conditions for algae cells to accumulate on the wall of the tube [11].
To avoid these issues, the “cyclic flow” PBR deployed at the East Bend Station does not flow continuously. Rather, the PBR is drained, mixed, and filled on a six hour schedule in order to homogenize the culture and to activate buoyant pipe pigs (one in each tube) that are equipped with flexible silicone gaskets at each end (Figure 1). Each time the reactor is drained and filled, the pipe pigs travel the length of the polyethylene terephthalate (PET) tubes, such that biofilm is removed from the inside tube walls by the scouring action of the silicone gaskets. Biofilm mitigation is additionally controlled by the introduction of gas bubbles in the vertical PET tubes to create multidimensional fluid mixing. This is accomplished by pressurizing flue gas (to 10–15 psig) and introducing it at the bottom of each tube. Energy savings are also realized by duty cycling the sparging of gas based on the needs of the algae culture for mixing, suspension, and the provision of an adequate amount of CO2.
In past contributions, we examined PBR performance based on algae growth rates, system CO2 capture efficiency and the PBR’s role as a secondary scrubber for NOx and SOx gases. In this study, a possible scenario was evaluated where the growing season was extended by utilizing waste heat from the power plant to raise the temperature of algae cultures. Whereas temperatures at East Bend Station are conducive to an annual 240 day algae growing season, in this study the growing season was assumed to extend from 240 days to 300 days. More generally, the determination of the PBR’s heat transfer properties and its potential to utilize power plant waste heat as a method of maintaining algae culture temperatures could allow for PBR installations in extreme latitudes, such as those where sunlight is abundant, but where temperatures may not facilitate culture growth. In principle, this could expand the potential geographic placement of this particular PBR technology. To the best of our knowledge, such studies are lacking in the literature.
Previous experiments with Scenedesmus acutus algae cultures indicate that the onset of photosynthesis occurs when the culture temperature reaches 12 °C, i.e., temperatures below 12 °C cannot sustain culture growth. Several heat sources at the East Bend Station were evaluated as possible sources for integration with the cyclic flow PBR, the most abundant and accessible being the circulating water stream that flows from the boiler structure to the cooling towers. This stream contains waste heat as water at a temperature range of 45–32 °C and flow rate of 910,000 L min−1. One study has examined multiple feasible uses for this circulating water, including using an open algae pond as a heat sink [25]. The main advantages of this approach were found to be rejection of waste heat, consumption of CO2 by feeding flue gas, and the production of valuable biomass.
In order to determine how often the cyclic flow PBR at the East Bend Station would necessitate heat injection via cycling, in the present study, heat transfer models were constructed based on the cooling time from 25 °C to 12 °C within the cyclic flow PBR (25 °C being a favorable temperature for algae growth). Flue gas that feeds CO2 to the PBR was also considered as a heat source. On the basis of the results, the feasibility of using waste heat at the power plant to extend the algae growing season was assessed.

2. Materials and Methods

Scenedesmus acutus was cultured in a PBR at the East Bend Station using methods previously described in the literature [11,22]. Culture growth at the East Bend Station was monitored by means of dry mass measurements (g·L−1), optical microscopy, and UV spectrophotometry as previously described [11].
Ambient temperature and reactor temperature were recorded for the 2015 growing season using J thermocouples. Photosynthetically active radiation (PAR) was measured using an Apogee SQ-215 quantum sensor. Data were logged using a National Instruments cRIO NI-9205 CPU. The mass and heat capacity of the liquid within the reactor were estimated based on the PBR’s known volume and the density and heat capacity of water [26]. At any time, the algae culture amounted to less than 0.1% of the total mass within reactor and its contributions to density and heat capacity were considered negligible. The East Bend Station, located on the southern shore of the Ohio River, has an average ground wind speed of 1.7 m s−1 [27].

3. Results and Discussion

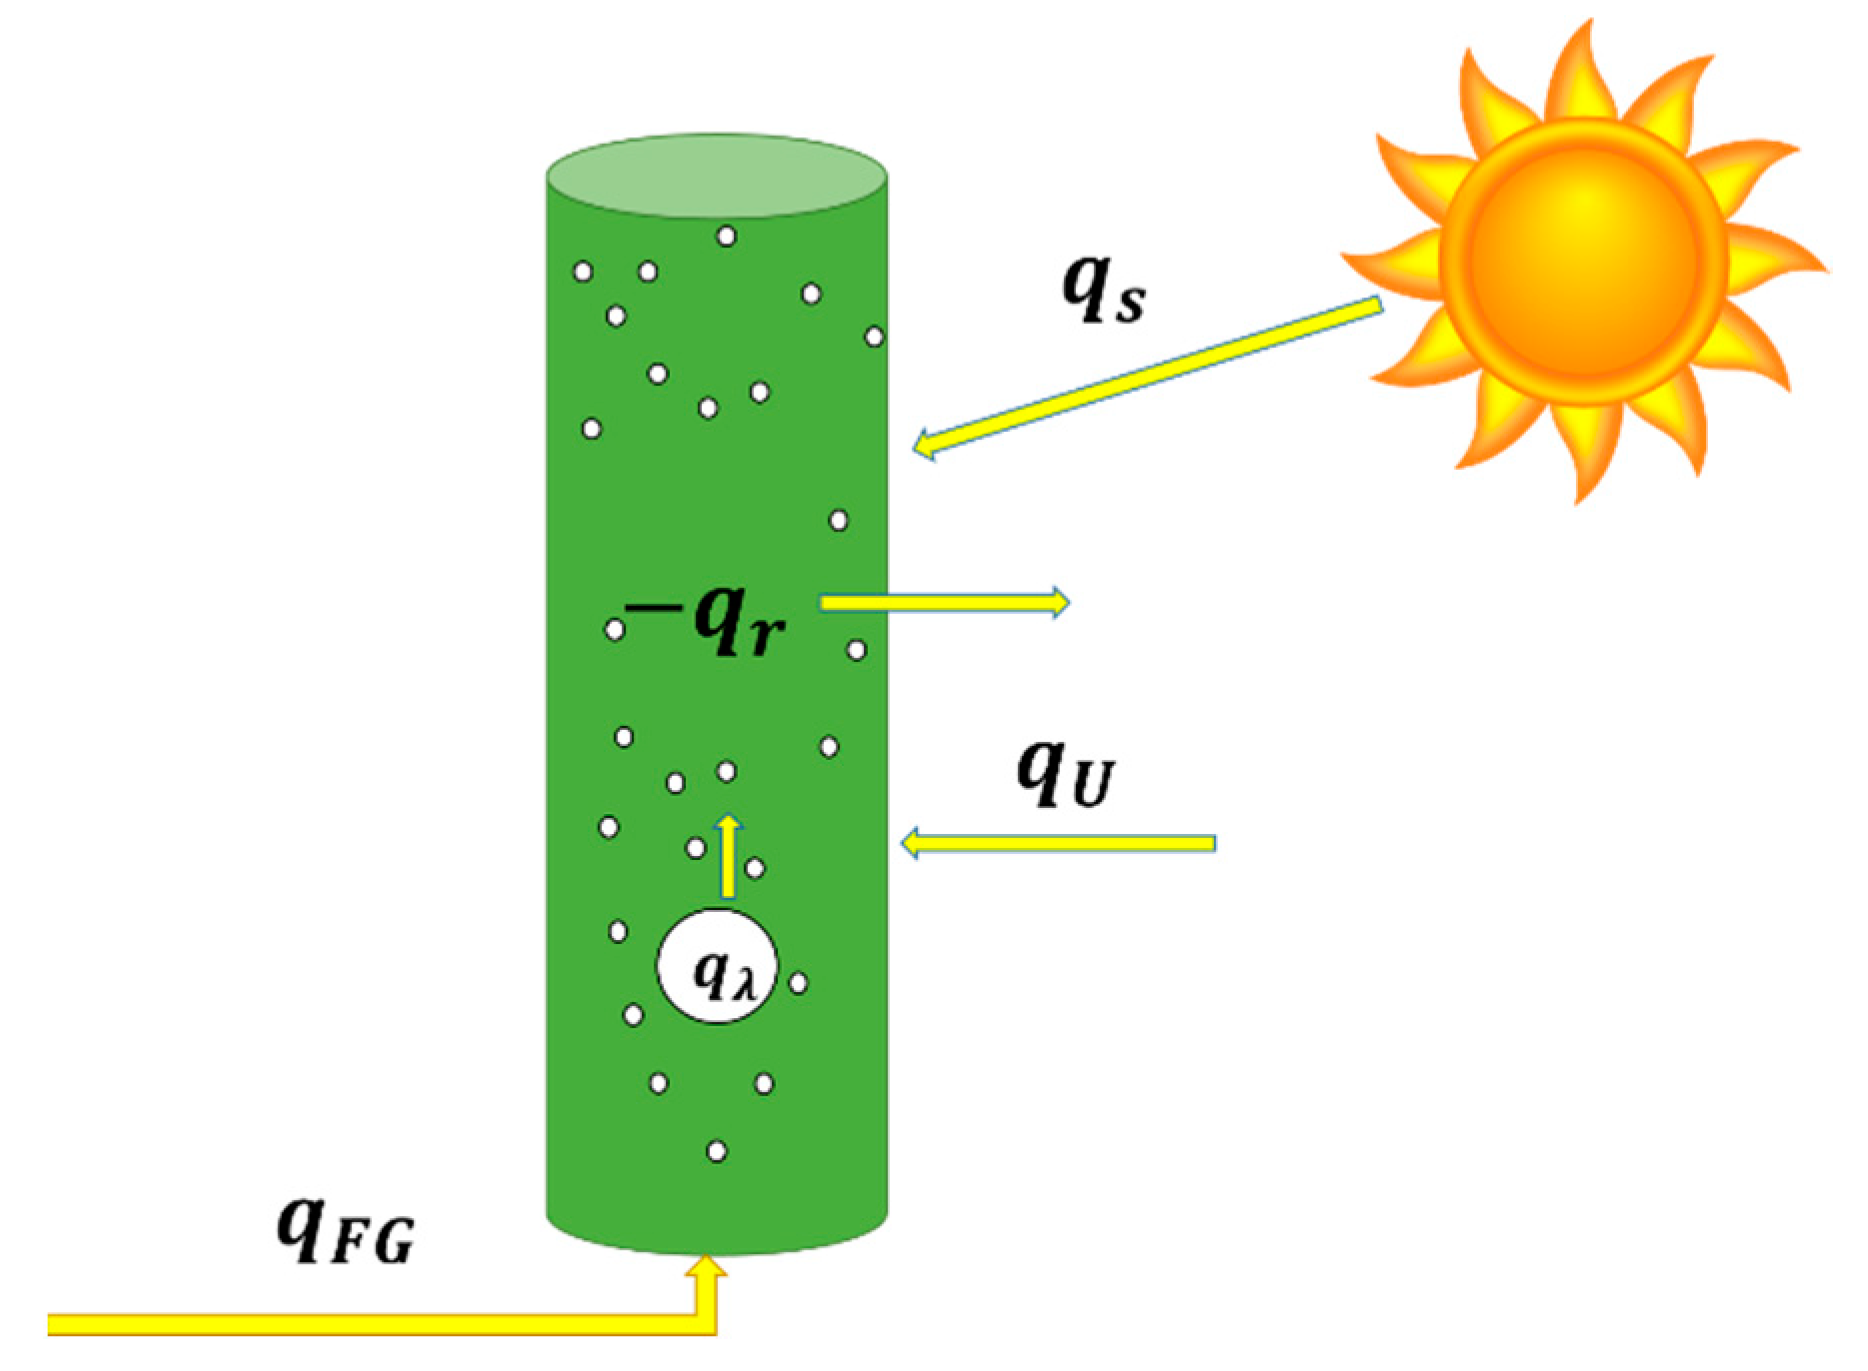
3.1. Flue Gas Injection as a Heat Transfer Mechanism

Initial calculations showed that heating the PBR via the flue gas feed was not practical. This would have allowed for normal operation of the reactor with no increase in cycling frequency, only incurring the energy penalty associated with heating the injected gas. However, given its low heat capacity, around 1000 J kg−1 K−1, calculations showed flue gas to be an inadequate carrier of heat to the reactor, as shown in Figure 2 [26].
The term V ˙   V R 1 in Figure 2 refers to the volumetric flow rate of gas into the PBR (L s−1) divided by the volume of the reactor (1136 L). The solid blue line represents V ˙   V R 1   associated with the typical volumetric gas flow rate into the cyclic flow PBR of 0.41 standard L s−1 (reactor volume = 1136 L) based on typical operating conditions at the East Bend Station. Both y axes represent the associated change in flue gas temperature required to supply sufficient heat to maintain a constant reactor temperature of 25 °C at the given ambient temperature range. At current volumetric flow rates, the Δ T needed to keep the reactor at a constant 25 °C is in the order of 4000–90,000 °C, a ludicrous range. The dotted line and right y-axis represent a volumetric flow rate of flue gas of 1136 L s−1, or a V ˙   V R 1   of 1 s−1, which has a reasonable range of Δ T but an impossible volumetric flow rate. This gas injection rate would displace all of the liquid within the reactor.

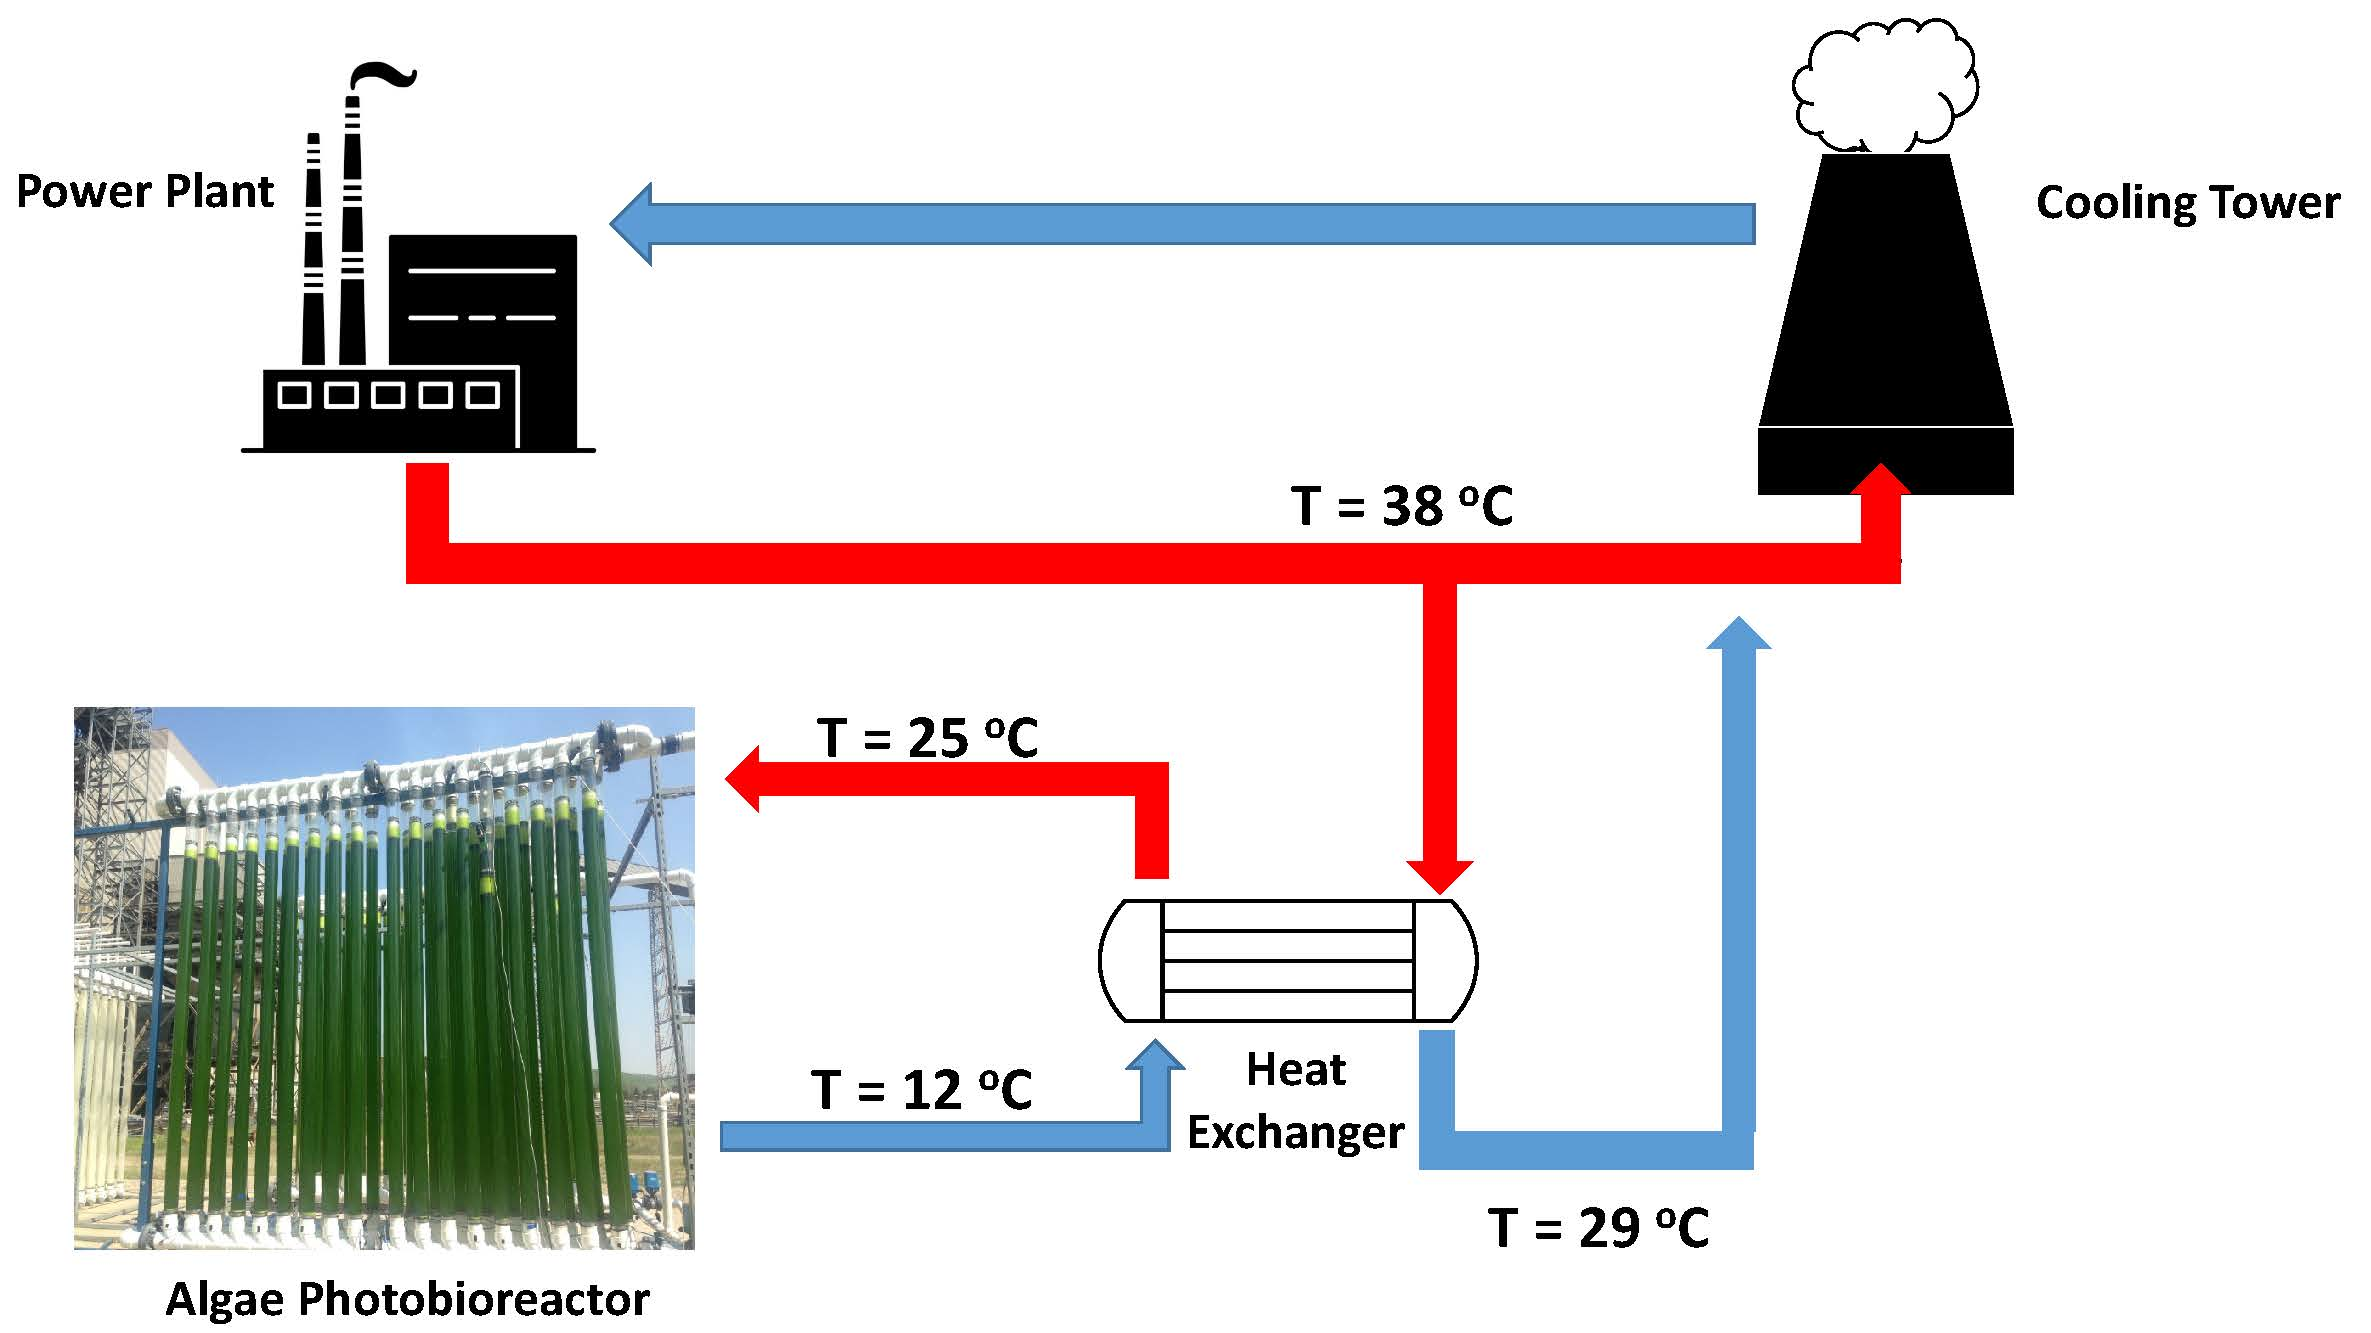
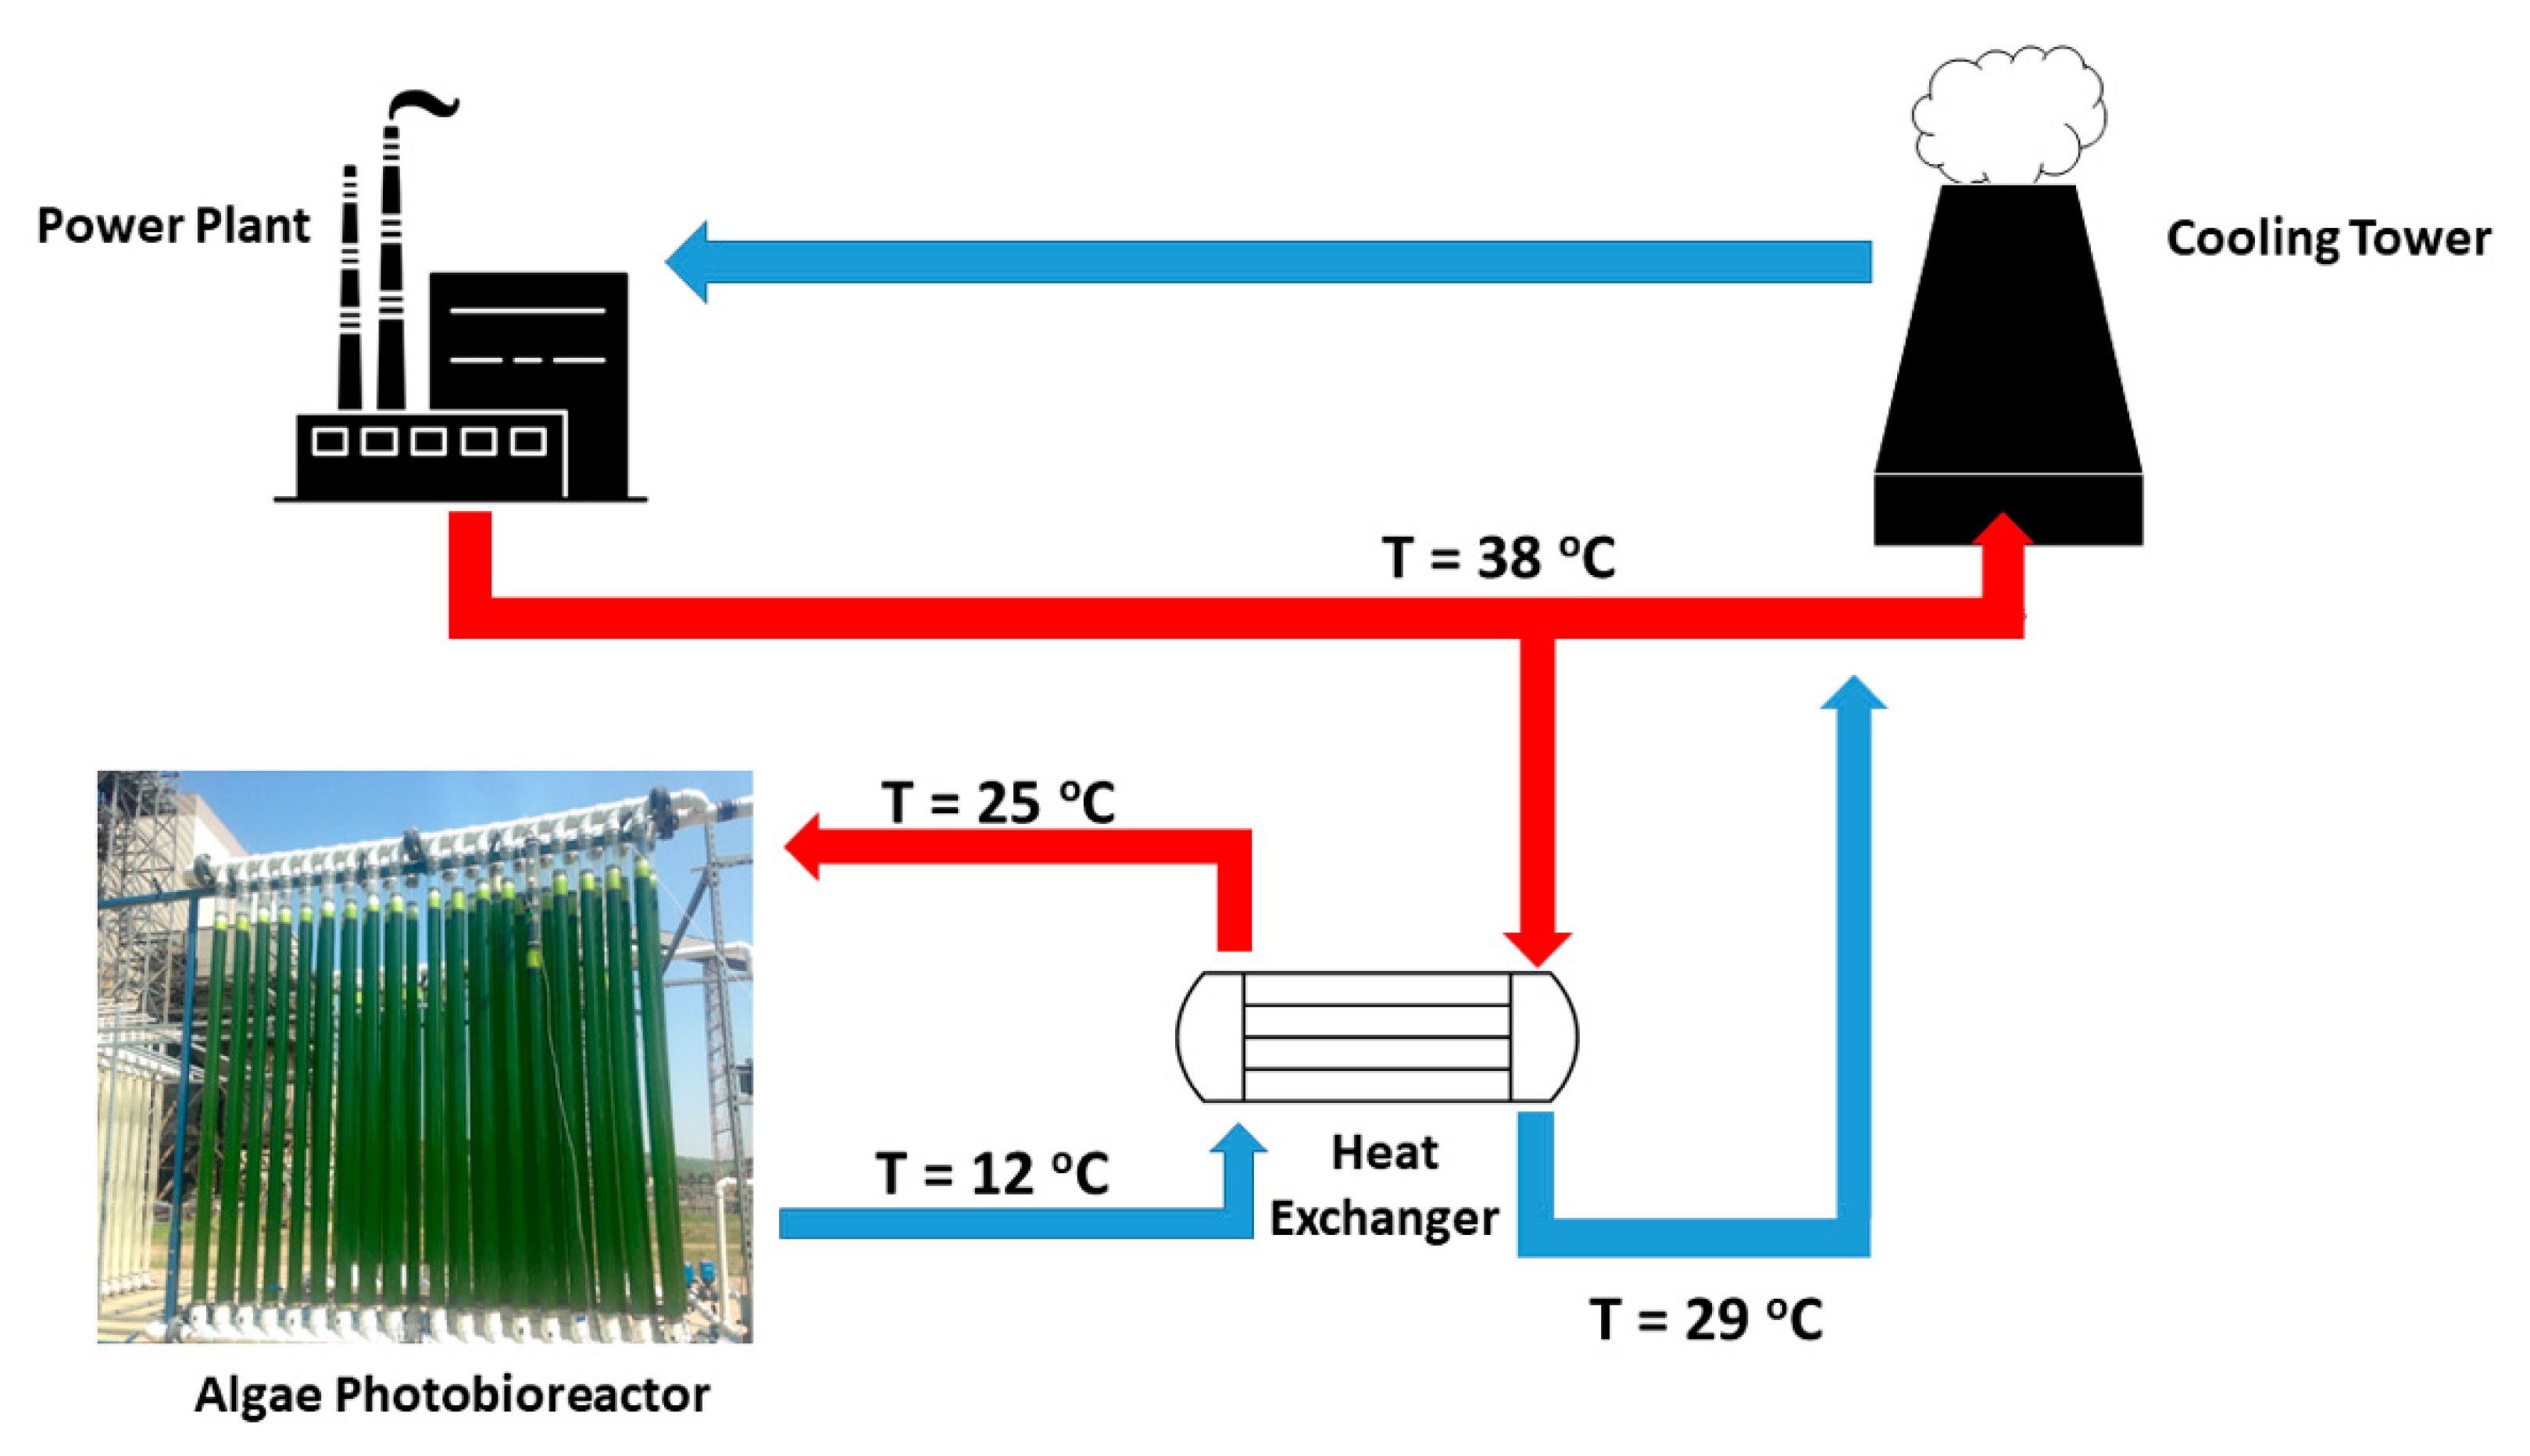
3.2. Water that Circulates to Cooling Towers as a Heat Source

A more feasible design was considered, where algae culture temperatures are elevated through the use of a countercurrent heat exchanger during the liquid cycling process in the PBR (Figure 3). Waste heat traveling from the power plant to the cooling towers in the form of water serves as the heat source. In this design, a slipstream is diverted from the circulating water stream and is pumped to the location of the PBR. Heat transfer is accomplished by flowing the PBR liquid and the circulating water stream to the tube and shell side of the heat exchanger, respectively.
The cyclic flow PBR typically cycles every six hours in normal operation, using a pump to drain and fill the tube banks. In order to determine how often the cyclic flow PBR would require heat injection in cold weather via cycling, a heat transfer model was constructed based on the cooling time from 25 °C to 12 °C within the cyclic flow PBR. The overall heat transfer coefficients were derived and calculated using two different models.
Within the cyclic flow reactor, each tube acts as an individual bubble column reactor. Flue gas is injected via compression-induced pressure-driven flow and bubbled through vertical columns (tubes). A basic equation for heat transfer within a column is derived as follows:
q r = q U + q F G + q λ + q s  
where   q r   is the heat inside the column, q U is the heat transfer at the reactor wall, q F G is the heat supplied to the reactor by the injected flue gas, q λ is the heat contribution from the latent heat of water as the gas phase composition changes before entering and after leaving the reactor, and qs is solar gain as illustrated in Figure 4.
For estimative calculations, a steady-state equation was applied in the form of
m R C p R ( d T R d t ) = U A   ( T R T ) + m ˙ F G C p F G ( T i n T o u t ) + m ˙ F G λ H 2 O ( y H 2 O I N y H 2 O O U T ) + 12 A σ ( T w a l l 4 T s u n 4   )
where, U A   ( T R T ) represents the heat through and around the tube wall, m ˙ F G C p F G ( T i n T o u t ) represents the heat transfer as contributed by flue gas entering and exiting the tube column, m ˙ F G λ H 2 O ( y H 2 O I N y H 2 O O U T ) represents heat transfer as contributed by the latent heat of vaporization of water as water vapor enters and leaves the tube column, and 12 A σ ( T w a l l 4 T s u n 4   ) represents solar gain which includes a unitless constant 12 that factors in the emissivity of the PBR as well as its geometric orientation. Time-temperature charts (tabulated model) and summary techniques based on data-derived coefficients (data-based model) were used to determine the reactor cooling times, from which the required frequency of cycling was calculated (required to maintain the reactor at a temperature of at least 12 °C). The energy cost associated with the increase in required cycling time was calculated for a hypothetical algae installation (sized for a 1 MW power plant), the energy requirement being calculated according to a previously performed lifecycle assessment.

3.3. Tabulated Heat Transfer Model

The first model uses tabulated data as well as physical and material properties of the cyclic flow reactor. The model was constructed based on the cyclic flow PBR’s material composition, geometry, and position at the East Bend Station, as well as tabulated data for water, polyethylene terephthalate (PET), and air using correlations found in the literature [26,28]. The surface area of the tubes functioned as the site of heat transfer.
The reactor was assumed to be filled with standing water, neglecting the effects of flue gas injection. Therefore, the tabulated model attempted to provide an estimate of   q U . The foregoing flue gas calculations ( q F G   a n d   q λ )   allowed for an initial estimation of heating and cooling times for liquid in the reactor. Data confirmed that the heat contributions of q F G and q λ (those contributed by flue gas injection and latent heat resulting from the change of the mass fraction of water in the gas phase) were negligible. Conduction, as represented by q U , which is dominated by sunlight (solar gain) and wind speed, was the main heat transfer driving force as confirmed by data collected at East Bend. As shown in Figure 5, reactor conduction, qU, follows a pattern consistent with the presence or absence of sunlight and is shown to be an order of magnitude larger than those contributions from gas injection.
In order to estimate U (the overall heat transfer coefficient for the reactor), a model for a single tube was necessary. The steady-state heat transfer coefficient for a single tube in the cyclic flow PBR is defined as the inverse of the sum of convective and conductive resistances, derived and modeled for a long cylinder using correlations from Green and Perry [29]:
U = [ A o [ ( 1 h H 2 O A i ) + ( ln ( r o r i ) 2 π K P E T L ) + ( 1 h a i r A o ) ]   ] 1
This heat transfer coefficient is comprised of inverse resistances based on the natural convection of water within the reactor (assumed to be standing for estimative calculations), the conductive resistance of the PET wall material at its given thickness, and the forced convection of air against the tubes in crossflow.
The forced convective heat transfer coefficient of air in crossflow with a single cylinder was also calculated using correlations from Churchill and Bernstein [30]:
N u D 1 ¯ = 0.3 + { 0.62 R e D 1 2 P r 1 3 [ 1 + ( 0.4 / P r ) 2 3 ] 1 4 }   [ 1 + ( R e D 282 , 000 ) 5 8 ] 4 5
The Nusselt number calculated for a single tube ( N u D 1 ¯ ) served as a precursor to a more accurate Nusselt number based on the PBR’s tube bank positioning. As they are positioned, the tubes act as a staggered tube bank heat exchanger with N   =   2   ( number   of   rows ) (see Figure 6).
Taking into account the staggered arrangement of the tubes provided for a final Nusselt number and forced convection heat transfer coefficient using the equation shown below and those in the Appendix A and Appendix B. Correlations used for the staggered tube bank Nusselt number were taken from Mills [31]:
N u D ¯ = 1 + ( N 1 )   Φ   N u D 1 ¯ N
Figure 7 demonstrates the dominance of the forced convection coefficient of air in a range of overall heat transfer coefficients. The range of U dictated by wind speed at a given temperature is large, corresponding to values of ~19–64 W m−2 K−1. At a wind speed of 1.36 m s−1, the average wind speed at the East Bend Station for the year 2015 [27], the value of the overall heat transfer coefficient for the cyclic flow PBR was calculated to be 22.2 W m−2 K−1.

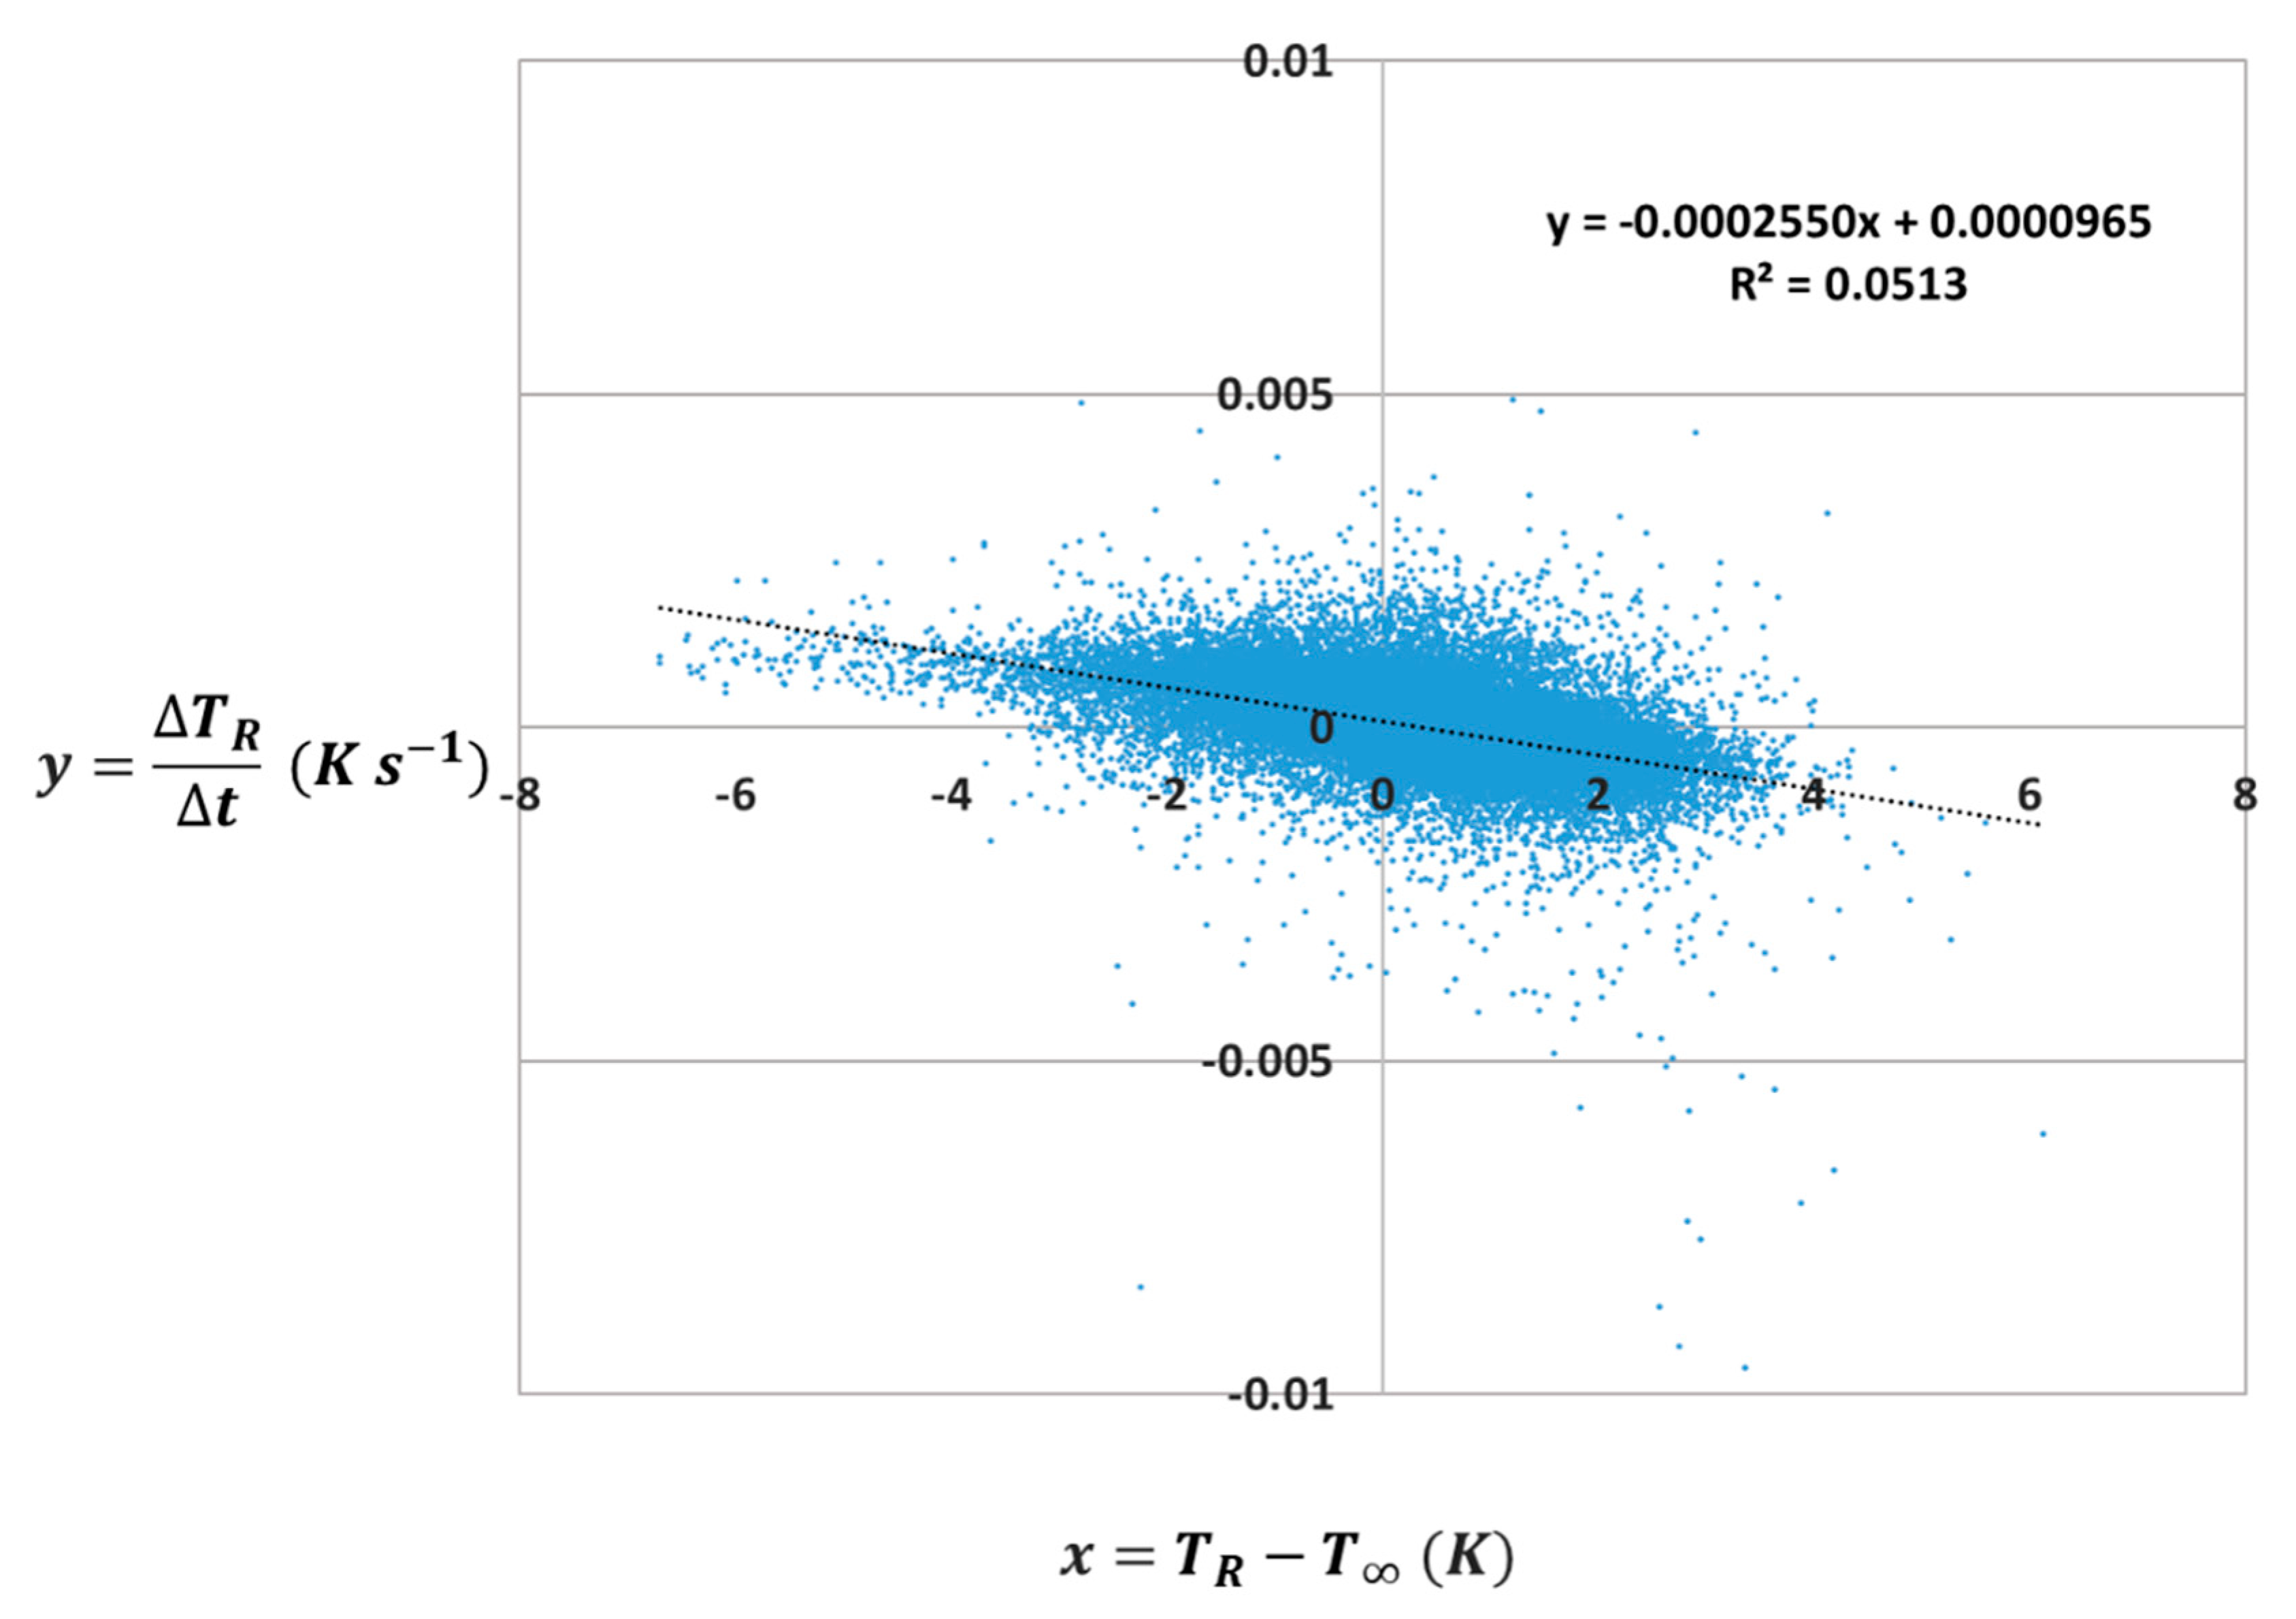
3.4. Data-Based Heat Transfer Model

The data-based model, based on empirical real-time data collected at the East Bend Station during the 2015 growing season, was constructed using a linearization of the overall heat transfer equation. Equation (6) is a steady state “snapshot” estimation of Equation (2). With minimal algebraic rearrangement, Equation (2) becomes:
( Δ T R Δ t ) = U A ( T R T ) m R C p R + [ m F G ˙ C p F G ( T i n T o u t ) m R C p R + m ˙ F G λ H 2 O ( y H 2 O I N y H 2 O O U T )   m R C p R + 12 A σ ( T w a l l 4 T s u n 4 ) m R C p R ]
and is linearized by equations given in the Appendix A and Appendix B. Figure 8 depicts the resulting plot of Δ T R / Δ t against T R T .
A simplified equation for the change in reactor temperature over time versus the instantaneous difference in reactor and ambient temperatures yields:
( Δ T R Δ t ) = 0.000255 ( T R T ) + 0.000995
On the basis of the slope in Figure 8, Equation (7) was used to extrapolate an overall heat transfer coefficient of 24.8 W m−2 K−1 using a reactor surface area of 48.9 m2, an assumed internal reactor mass of 1136 kg, and a heat capacity of 4180 J kg−1 K−1. This value for U (W m−2 K−1) provided by the data-based model is well within the range of 19–64 W m−2 K−1 supplied by the tabulated model and is extremely close to the overall heat transfer coefficient provided by the tabulated model of 22.2 W m−2 K−1 at a wind speed of 1.36 m s−1.

3.5. Cooling Times

In order to determine the cooling time based on the data-based model, summary methods were used employing the data-based linear correlation summation:
Δ t c o o l i n g = i = ( T R = 25 0 C , T R 1 ) ( T R = 12 0 C ) Δ t i = i = ( T R = 25 0 C , T R 1 )   ( T R = 12 0 C ) T R i T R i 1 m ( T R i T ) + b  
Time-temperature tables [32] were used to interpolate cooling times for the tabulated model at a range of wind speeds as shown in Figure 9. Cooling times associated with the data-based model were calculated using ambient temperatures ( T ) and wind speeds at ranges of respectively 0–12 °C and 2–8 m s−1. From this follows that all of the calculated cooling times are less than that of the standard PBR cycle time of 6 h.

3.6. Energy Penalties

In order to quantify the energy penalty associated with the increase in cycling frequency required for heating the algae culture, the feed pump work duty was first calculated for the base case, i.e., cycling every six hours without heating. This was found to be 0.22 MWh day−1, based on a techno-economic analysis conducted for a 1 MW coal-fired power plant as reported previously [33]. The feed pump duty associated with increased cycling was then calculated assuming that additional pump requirements would be fulfilled by the installation of multiple, identical pumps. The pump duty associated with the transportation of circulating water from the heated water stream to the PBR was quantified assuming a stainless-steel pipe with a pipe diameter of 0.15 m, traveling a distance of 100 m. The latter is a rough estimation of the current distance between the circulating water pipeline and the cyclic flow PBR at the East Bend Station.
As shown in Figure 10, the percent increase in system energy consumption ranges from 18%–103% at the given wind speed and temperature. One important factor to note is that solar gain is not accounted for in the tabulated model, hence it is not accounted for in the corresponding plots shown in Figure 10. However, actual solar gain is implicit in the data collected at the East Bend Station used in creating the second model. Despite these stark differences in method, both models produced strikingly similar sets of heat transfer coefficients. This implies that one could use the lines in Figure 9, contributed by the tabulated model, as a metric for increased energy use for any PBR in colder climates. If need be, a short dataset of PBR and ambient temperatures could be collected at potential site locations to provide the data needed to make a data-based model for verification.
As shown in Figure 11, CO2 capture is decreased as a result of the energy consumption associated with increased liquid pumping both for the algae culture and circulating water. Instantaneous CO2 capture penalties associated with heat integration operation are significant. During cold temperatures, keeping the algae culture at or above 12 °C has the potential to require six times the amount of liquid pumping as compared with the normal operation of the PBR without any heat integration. At ambient temperatures of 0–4 °C, the reduction in CO2 capture ranges from 55%–70%. However, as temperatures approach freezing levels, reductions in CO2 capture do not reach 100%, allowing for the overall process to remain carbon negative.

3.7. Techno-Economic Analysis

A techno-economic analysis was performed to ascertain the financial penalties associated with the installation and operation of heat integration equipment. Calculations did not factor in labor or the cost of capital. We considered the capital expense of equipment purchases and the operating expense associated with heat integration equipment operation. Heat exchangers were assumed to be in close proximity to the photobioreactor system. The pump duty associated with taking a slipstream of circulating water to the heat exchanger was calculated, as per Section 3.6. Assumptions for capital cost per square meter and biomass production cost (including OPEX) were taken from Crocker et al. [33] and were reported as $70 m−2 and $875 tonne−1, respectively. These numbers were used as a baseline for comparison of systems with and without heat integration equipment.
As shown in Figure 12, there are dramatic increases in capital expenditures (CAPEX) associated with the purchase of the heat integration equipment, which includes extra polypropylene for feed tanks, additional pumps and shell tube heat exchangers. The majority of the increase in total CAPEX lies in the purchase of heat exchangers, which alone increases the CAPEX by a factor of six. Given the modular nature of the PBR system, heat integration would require purchasing and installing six times the number of liquid pumps normally required. The majority of these pumps, however, five out of six, would sit idle for most of the year (240 days). Overall, the purchase of heat integration equipment alone increases total CAPEX by a factor of nine.
The production cost for one ton of biomass is reduced with a longer growing season, as displayed in Figure 13, where the production cost for a system in Florida (assumed growing season of 300 days) is compared with the same system in Kentucky (240 day growing season) under the same carbon capture and growth assumptions. In Kentucky and similar geographic locations, extending the growing season by 60 days using heat integration would almost triple the cost of biomass production, with the majority of this increase in production cost being expenditures associated with the purchase of heat integration equipment. All of the OPEX increases associated with heat integration correspond to increases in energy costs due to extra liquid pumping and were found to be negligible in comparison to the increases in CAPEX. Assumptions for growing season lengths were made based on publicly available solar data [27,34].
It is important to note that numbers for heat integration in Figure 13 reflect an assumed productivity of 0.17 g L−1 day−1, based on field data [11], during the 60 day extension to the growing season. In reality, the productivity would most likely be lower than that during colder months. That is to say, the numbers seen for heat integration in Figure 13 represent a best-case scenario, given that light limitations during the 60 day extension would likely limit the algae productivity to values less than 0.17 g L−1 day−1.

4. Conclusions

In order to ascertain the feasibility of using waste heat from a combustion power plant to heat algae cultures in colder climates, two heat transfer models were constructed to quantify PBR cooling times in colder climates. The tabulated model, which is based on tabulated data material properties and the physical orientation of the PBR tubes, gave an overall range of heat transfer coefficients of 19–64 W m−2 K−1 at a wind speed range of 1–10 m s−1 and a value of 22.2 W m−2 K−1 at a wind speed of 1.36 m s−1 (the average wind speed at the East Bend Station for the year 2015). The data-based model, which was based on data collected from the PBR at the East Bend Station from April to September 2015, yielded an overall heat transfer coefficient of 24.8 W m−2 K−1. Energy penalties associated with waste heat utilization were found to incur an 18%–103% increase in energy consumption at given temperature and wind speeds with a CO2 capture reduction range of 22%–70%. Although the energy penalties involved with heat integration are significant, the overall process retains a net-positive CO2 capture rate. Overall, heating algae cultures as described are thermodynamically and technologically feasible. However, a techno-economic analysis shows that the purchase of the heat integration equipment increased capital expenditures by a factor of nine and increased the cost of annual biomass production by a factor of three. For this particular scenario, the increase in CAPEX associated with the purchase of heat integration equipment incurs an increase in biomass production cost that is untenable. Moreover, without dramatic decreases in the cost of heat integration equipment, it is unlikely that this process would be economically viable at any scale. In an industrial setting, extending the growing season for 60 days does not justify the purchase and installation of heat integration equipment.

Author Contributions

Individual contributions are as follows: conceptualization, D.T.M.; methodology, D.T.M. and Z.F.; validation, D.T.M., M.H.W., and J.G.G.; formal analysis, D.T.M.; investigation, D.T.M.; resources, M.C.; data curation, D.T.M.; writing—original draft preparation, D.T.M.; writing—review and editing, D.T.M. and M.C.; visualization, D.T.M. and M.C.; supervision, M.C.; project administration, M.C.; funding acquisition, M.C.

Funding

This work was supported by the United States Department of Energy (award no. DE-FE0026396), the Kentucky Department of Energy Development and Independence, Duke Energy, and the University of Kentucky. This report was prepared as an account of work sponsored by an agency of the United States government. Neither the United States government nor any agency thereof, nor any of their employees, makes any warranty, express or implied, or assumes any legal liability or responsibility for the accuracy, completeness, or usefulness of any information, apparatus, product, or process disclosed or represents that its use would not infringe privately owned rights. Reference herein to any specific commercial product, process, or service by trade name, trademark, manufacturer, or otherwise does not necessarily constitute or imply its endorsement, recommendation, or favoring by the United States government or any agency thereof. The views and opinions of authors expressed herein do not necessarily state or reflect those of the United States government or any agency thereof.

Acknowledgments

The authors would like to thank E. Molly Frazar and Landon Caudill for their assistance with photobioreactor construction and algae harvesting. We would also like to acknowledge the considerable assistance of Doug Durst and Joe Clark (Duke Energy) with the activities at the East Bend Station.

Conflicts of Interest

The authors declare no conflict of interest.

Appendix A. Supplementary Data

Appendix A.1. Linearization Equations

y = ( Δ T R Δ t )  
x = ( T R T )  
m = U A   m R C p R  
b = [ m F G ˙ C p F G ( T i n T o u t )   m R C p R + m ˙ F G λ H 2 O ( y H 2 O I N y H 2 O O U T )     m R C p R + 12 A σ ( T w a l l 4 T s u n 4   ) m R C p R ]

Appendix A.2. Correlating Equations for Nusselt Number for Staggered Tube Bank Heat Exchanger

v = v ¯ [ S T ( π D 4 ) ] S T  
Φ = 1 + 2 3 P L  
P L = S L D  
Table A1. Inputs and assumptions used when calculating increases in CAPEX and OPEX associated with heat integration.
Input ValueUnits Source
PBR liquid flow rate 500L min−1Crocker et al. [33]
Required flow rate of circulating water900L min−1Calculated
Capital cost of installed PBR 70$ m−2Crocker et al. [33]
Baseline biomass production cost875$ tonne−1Crocker et al. [33]
Algae growth rate 0.17g L−1 d−1Crocker et al. [33]
Electricity price 0.02$ (Kw-hr)−10.5 ×KY industrial rate. www.eia.gov
Polypropylene cost1100$ tonne−1www.icis.com (Nov. 2018)
Pump cost2500$ unit−1Grainger, Inc.
Heat exchanger cost 33,000$ unit−1SHECO Inc.
Heat exchanger transfer rate734W m−2 K−1SHECO Inc.
PBR pump duty37.6W unit−1Crocker et al. [33]
Circulating water temperature38CDuke Energy
Power plant CO2 emission rate0.948tonne CO2 MWh−1Crocker et al. [33]

Appendix B. Nomenclature

A combined surface area of PBR tubes (m−2)
A i inner tube wall area (m−2)
A o outer tube wall area (m−2)
C p F G heat capacity of flue gas (J kg−1 K−1)
C p R heat capacity of algae culture in the PBR (J k−1 K−1)
D diameter of tube (m)
g acceleration of gravity (m s−2)
G r Grassoff number (dimensionless)
h a i r convection heat transfer coefficient for air (W m−2 K−1)
h w a t e r convection heat transfer coefficient for water (W m−2 K−1)
L length of tube (m)
m ˙ F G mass flow rate of flue gas (kg s−1)
m R mass of algae culture in the PBR (kg)
N u Nusselt number (dimensionless)
N u ¯ D Nusselt number for cylinder (dimensionless)
N u ¯ D 1 Nusselt number for tube in staggered tube bank (dimensionless)
P r Prandolt number (dimensionless)
P L defined as S L D (dimensionless)
P T defined as S T D (dimensionless)
q r heat inside tube (W)
q U heat transferred through tube wall (W)
q F G heat contributed by flue gas injection (W)
q λ heat as phase change of water in bubble column gas (W)
q s heat as solar gain (W)
r i inner tube radius (m)
r o outer tube radius (m)
R H i n relative humidity of gas into PBR (dimensionless)
R H o u t relative humidity of gas out of PBR (dimensionless)
Δ t time (s) (hr)
T R temperature inside the PBR (K)
T ambient air temperature (K)
R a Rayleigh number (dimensionless)
R e Reynolds number (dimensionless)
R e D Reynolds number for air in crossflow over cylinder (dimensionless)
S t staggered tube bank line center distance (m)
S L staggered tube bank row center distance (m)
β coefficient of thermal expansion (K−1)
12 dimensionless constant
λ H 2 O latent heat of vaporization of water (J kg−1)
μ viscosity of water (Pa×s)
Φ defined as 1 + 2 3 P L (dimensionless)
σ Stefan–Boltzmann constant (W m−2 K−4)

References

  1. Laws, E.; Berning, J. A study of the energetics and economics of microalgal mass culture with the marine chlorophyte Tetraselmis suecica: Implications for use of power plant stack gases. Biotechnol. Bioeng. 1991, 37, 936–947. [Google Scholar] [CrossRef] [PubMed]
  2. Matsumoto, H.; Shioji, N.; Hamasaki, A.; Ikuta, Y.; Fukuda, Y.; Sato, M.; Endo, N.; Tsukamoto, T. Carbon dioxide fixation by microalgae photosynthesis using actual flue gas discharged from a boiler. Appl. Biochem. Biotechnol. 1991, 51, 681. [Google Scholar] [CrossRef]
  3. Kadam, K. Power plant flue gas as a source of CO2 for microalgae cultivation: Economic impact of different process options. Energy Convers. Manag. 1997, 38, S505–S510. [Google Scholar] [CrossRef]
  4. Zhang, X. Microalgae removal of CO2 from flue gas. IEA Clean Coal Cent. Rep. 2015. [Google Scholar] [CrossRef]
  5. Negoro, M.; Shioji, N.; Miyamoto, K.; Micira, Y. Growth of Microalgae in High CO2 Gas and Effects of SOx and NOx. Appl. Biochem. Biotechnol. 1991, 28, 877. [Google Scholar] [CrossRef] [PubMed]
  6. Lee, E.; Pruvost, J.; He, X.; Munipalli, R.; Pilon, L. Effects of SO2 and NO on growth of Chlorella sp. KR-1. Bioresour. Technol. 2002, 82, 1–4. [Google Scholar] [CrossRef]
  7. Hanagata, N.; Takeuchi, T.; Fukuju, Y.; Barnes, D.; Karube, I. Tolerance of microalgae to high CO2 and high temperature. Phytochemistry 1992, 31, 3345–3348. [Google Scholar] [CrossRef]
  8. Sakai, N.; Sakamoto, Y.; Kishimoto, N.; Chihara, M.; Karube, I. Chlorella strains from hot springs tolerant to high temperature and high CO2. Energy Convers. Manag. 1995, 36, 693–696. [Google Scholar] [CrossRef]
  9. De Morais, M.; Costa, J. Isolation and selection of microalgae from coal fired thermoelectric power plant for biofixation of carbon dioxide. Energy Convers. Manag. 2007, 48, 2169–2173. [Google Scholar] [CrossRef]
  10. Westerhoff, P.; Hu, Q.; Esparza-Soto, M.; Vermaas, W. Growth parameters of microalgae tolerant to high levels of carbon dioxide in batch and continuous-flow photobioreactors. Environ. Technol. 2010, 31, 523–532. [Google Scholar] [CrossRef]
  11. Wilson, M.; Mohler, D.; Groppo, J.; Grubbs, T.; Kesner, S.; Frazar, M.; Shea, A.; Crofcheck, C.; Crocker, M. Capture and recycle of industrial CO2 emissions using microalgae. Appl. Petrochem. Res. 2016, 6, 279–293. [Google Scholar] [CrossRef]
  12. Borowitzka, M. High-value products from microalgae—Their development and commercialisation. J. Appl. Phycol. 2013, 25, 743–756. [Google Scholar] [CrossRef]
  13. Beal, C.; Gerber, L.; Sills, D.; Huntley, M.; Machesky, S.; Walsh, M.; Tester, J.; Archibald, I.; Granados, J.; Greene, C. Algal biofuel production for fuels and feed in a 100-ha facility: A comprehensive techno-economic analysis and life cycle assessment. Algal Res. 2015, 10, 266–279. [Google Scholar] [CrossRef] [Green Version]
  14. Zeller, M.; Hunt, R.; Jones, A.; Sharma, S. Bioplastics and their thermoplastic blends from Spirulina and Chlorella microalgae. J. Appl. Polym. Sci. 2013, 130, 3263–3275. [Google Scholar] [CrossRef]
  15. Ji, X.; Re, L.; Huang, H. Omega-3 Biotechnology: A Green and Sustainable Process for Omega-3 Fatty Acids Production. Front. Bioeng. Biotechnol. 2015, 3, 158. [Google Scholar] [CrossRef] [Green Version]
  16. Kobayashi, M.; Kakizono, T.; Nagai, S. Astaxanthin production by a green alga, Haematococcus pluvialis accompanied with morphological changes in acetate media. J. Ferment. Bioeng. 1991, 71, 335–339. [Google Scholar] [CrossRef]
  17. Becker, E. Micro-algae as a source of protein. Biotechnol. Adv. 2007, 25, 207–210. [Google Scholar] [CrossRef] [PubMed]
  18. Doucha, J.; Straka, F.; Lívanský, K. Utilization of flue gas for cultivation of microalgae Chlorella sp. in an outdoor open thin-layer photobioreactor. J. Appl. Phycol. 2005, 17, 403–412. [Google Scholar] [CrossRef]
  19. Wang, B.; Li, Y.; Wu, N.; Lan, C. CO2 bio-mitigation using microalgae. Appl. Microbiol. Biotechnol. 2008, 79, 707–718. [Google Scholar] [CrossRef]
  20. Douskova, I.; Doucha, J.; Livansky, K.; Machat, J.; Novak, P.; Umysova, D.; Zachleder, V.; Vitova, M. Simultaneous flue gas bioremediation and reduction of microalgal biomass production costs. Appl. Microbiol. Biotechnol. 2009, 82, 179–185. [Google Scholar] [CrossRef]
  21. Cheng, J.; Yang, Z.; Huang, Y.; Huang, L.; Hu, L.; Xu, D.; Zhou, J.; Cen, K. Improving growth rate of microalgae in a 1191 m2 raceway pond to fix CO2 from flue gas in a coal-fired power plant. Bioresour. Technol. 2015, 190, 235–241. [Google Scholar] [CrossRef] [PubMed]
  22. Wilson, M.; Groppo, J.; Placido, A.; Graham, S.; Morton, S.; Santillan-Jimenez, E.; Shea, A.; Crocker, M.; Crofcheck, C.; Andrews, R. CO2 recycling using microalgae for the production of fuels. Appl. Petrochem. Res. 2014, 4, 41–53. [Google Scholar] [CrossRef]
  23. Williams, P.; Lauren, L. Microalgae as biodiesel & biomass feedstocks: Review & analysis of the biochemistry, energetics & economics. Energy Environ. Sci. 2010, 3, 554–590. [Google Scholar]
  24. Ugwu, C.; Aoyagi, H.; Uchiyama, H. Photobioreactors for mass cultivation of algae. Bioresour. Technol. 2008, 99, 4021–4028. [Google Scholar] [CrossRef] [PubMed]
  25. Leffler, R.; Bradshaw, C.; Groll, E.; Garimella, S. Alternative heat rejection methods for power plants. Appl. Energy 2012, 92, 17–25. [Google Scholar] [CrossRef] [Green Version]
  26. CRC Handbook of Chemistry and Physics, 2009−2010, 90th ed.; Haynes, W.M. (Ed.) American Chemical Society: Washington, DC, USA, 2009; Volume 131. [Google Scholar]
  27. United States Department of Energy. National Renewable Energy Laboratory (NREL). National Solar Radiation Database (NSRDB); Coordinates 948280_948238.948293_-948284.948282_tmy. Available online: https://nsrdb.nrel.gov/ (accessed on 1 July 2017).
  28. Van der Vegt, A.K.; Govaert, L.E. Polymeren van Keten tot Kunststof (Polymers from Chain to Plastic); VSSD: Amsterdam, The Netherlands, 2009; ISBN 9789071301483 9071301486. [Google Scholar]
  29. Green, D.; Perry, R. Perry’s Chemical Engineers’ Handbook; McGraw-Hill Education: New York, NY, USA, 2007; pp. 5-8–5-11. ISSN 97780071593137. [Google Scholar]
  30. Churchill, S.; Bernstein, M. Correlating Equation for Forced Convection From Gases and Liquids to a Circular Cylinder in Crossflow. J. Heat Transf. 1977, 99, 300–306. [Google Scholar] [CrossRef]
  31. Mills, A. Heat Transfer, 2nd ed.; Prentice Hall: Upper Saddle River, NJ, USA, 1999. [Google Scholar]
  32. Welty, J. Fundamentals of Momentum, Heat and Mass Transfer; John Wiley and Sons, Inc.: Hoboken, NJ, USA, 2013. [Google Scholar]
  33. Crocker, M.; Groppo, J.; Kesner, S.; Mohler, D.; Pace, R.; Santillan-Jimenez, E.; Wilson, M.; Schambach, J.; Stewart, J.; Zeller, A. A Microalgae-Based Platform for the Beneficial Re-use of Carbon Dioxide Emissions from Power Plants. 2018; Final Technical Report, DOE-KENTUCKY-FE0026396. Available online: https://www.osti.gov/biblio/1419316/ (accessed on 1 July 2018).
  34. United States Department of Energy. National Renewable Energy Laboratory (NREL). In Physical Solar Model. Available online: https://nsrdb.nrel.gov/ (accessed on 1 July 2017).
Figure 1. Cyclic flow photobioreactor (PBR) deployed at East Bend Station power plant.
Energies 12 02634 g001
Figure 2. Δ T for flue gas injection at different flow rates vs. ambient temperature. The blue line represents the current   V ˙   V R 1   for the cyclic flow reactor (3.56 × 10⁻⁴) and is correlated with the left y-axis. The black line represents a theoretical V ˙   V R 1 of 1 for the cyclic flow reactor and is correlated with the right y-axis. Calculations were based on the tabulated heat transfer model presented in Section 3.3 with an average wind speed of 5 m s−1 and an overall heat transfer coefficient range of 28.1–30.8 W m−2 K−1. Units of V ˙   V R 1 are s−1.
Energies 12 02634 g002
Figure 3. Process flow diagram for heat exchanger used to heat algae cultures from 12 °C to 25 °C. A slipstream of water that circulates from the power plant to the cooling towers is simultaneously cooled from 38 °C to 29 °C.
Energies 12 02634 g003
Figure 4. Visual representation of Equation (1), where,   q r   is the heat inside the column, q U is the heat transfer at the reactor wall, q F G is the heat supplied to the reactor by the injected flue gas, q λ is the heat contribution from the latent heat of water as the gas phase composition changes before entering and after leaving the reactor, and qs is solar gain.
Energies 12 02634 g004
Figure 5. Heat contributions to the cyclic flow PBR and photosynthetically active radiation (PAR) vs. time. All q values are reported as thermal energy in watts (W). PAR is a measurement of solar radiation and is reported as a photon flux in µmol m−2 s−1.
Energies 12 02634 g005
Figure 6. Top down view of the manifold of the cyclic flow PBR tube bank. ST and SL are measured factors used in determining the forced convection heat transfer coefficient of a staggered tube bank heat exchanger.
Energies 12 02634 g006
Figure 7. U (W m−2 K−1) vs. ambient temperature at a range of wind speeds.
Energies 12 02634 g007
Figure 8. Linear correlation of change in temperature inside the PBR over time vs. temperature inside the PBR minus ambient temperature. Data were acquired during the 2015 East Bend growing season. Graph represents over 42,000 data points averaged every five minutes over a 5 month period.
Energies 12 02634 g008
Figure 9. Reactor cooling times from both the tabulated and data-based heat transfer models. “U from Data” denotes cooling times based on the data-based model. All other cooling times are calculated from the tabulated model at different wind speeds.
Energies 12 02634 g009
Figure 10. Energy increase requirement for operation with increased cycling for all pumps (additional feed pumps plus pumps used for transport of heated circulating water). Power requirements shown are based on cooling times calculated using various wind speeds from the tabulated model and from the heat transfer coefficient derived in the data-based model.
Energies 12 02634 g010
Figure 11. Reduction in overall CO2 capture vs. ambient temperature for a photobioreactor with operating heat integration equipment. Reduction in CO2 capture values are instantaneous energy penalties associated with the operation of heat integration equipment and calculated using the overall heat transfer coefficient derived from the data-based model.
Energies 12 02634 g011
Figure 12. Capital expenditures (CAPEX) for a PBR system with and without installed heat integration equipment. Both PBR systems were sized for a 1 MW power plant. Capital costs ($ m−2) were calculated assuming a baseline production cost of $70 m−2, which includes the cost of equipment.
Energies 12 02634 g012
Figure 13. Cost of biomass production in $ ton−1 for three separate PBRs, each at a 1 MW power plant. The first case corresponds to Kentucky, the second to Florida, and the third to the same PBR in Kentucky with heat integration. Numbers include capital and operating cost over a 30 year amortization period assuming a baseline biomass production cost of $875 tonne−1. The cost of capital is not included.
Energies 12 02634 g013

