Study on the Suitability of Passive Energy in Public Institutions in China

Abstract
:1. Background
2. Content
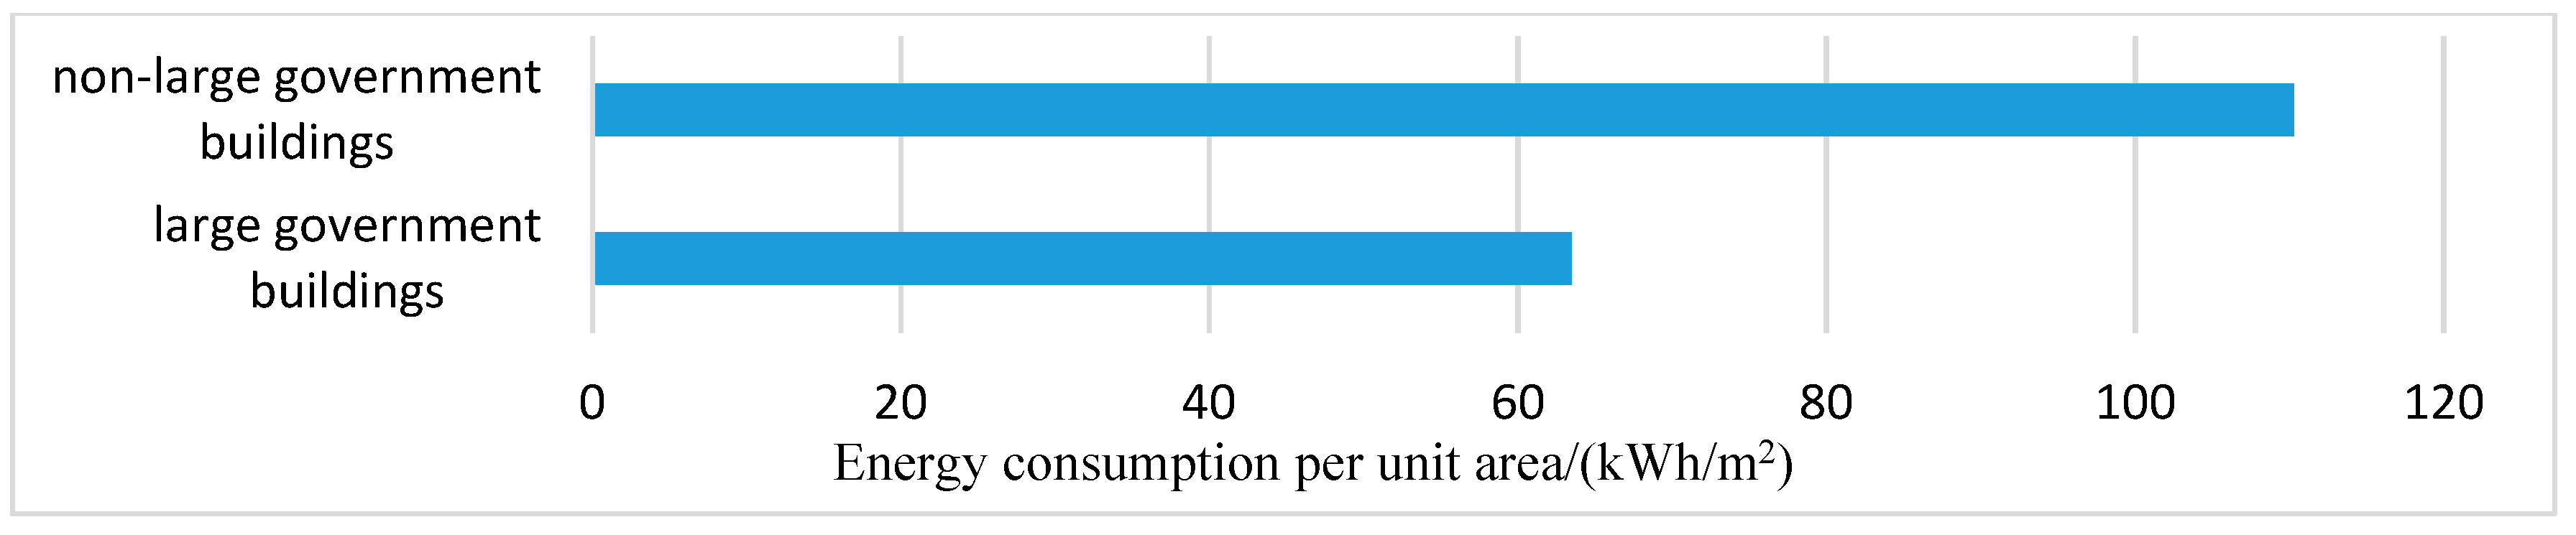
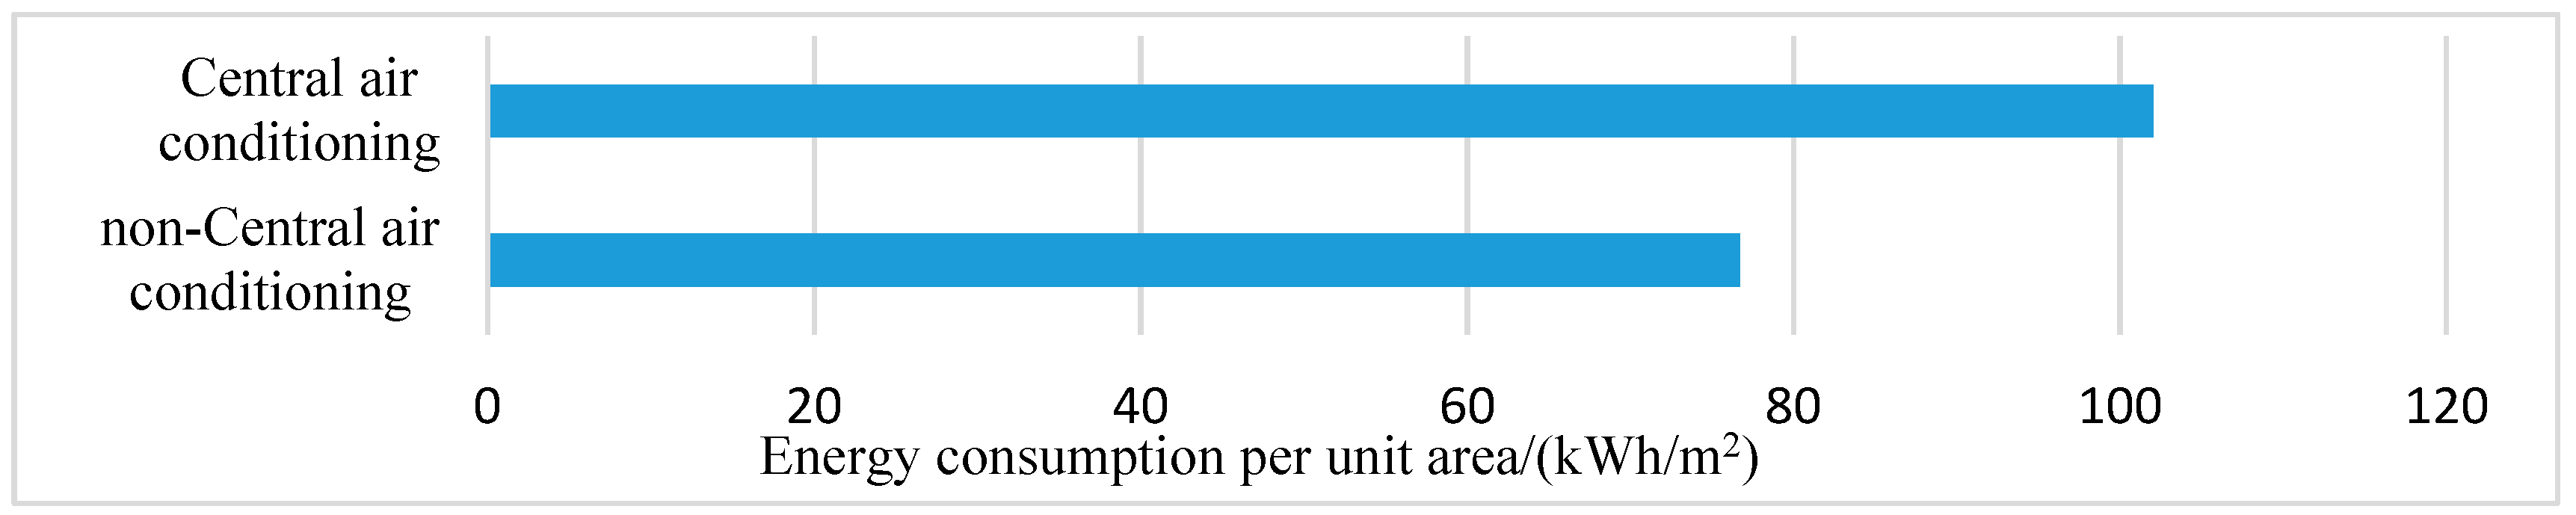
2.1. Government Buildings
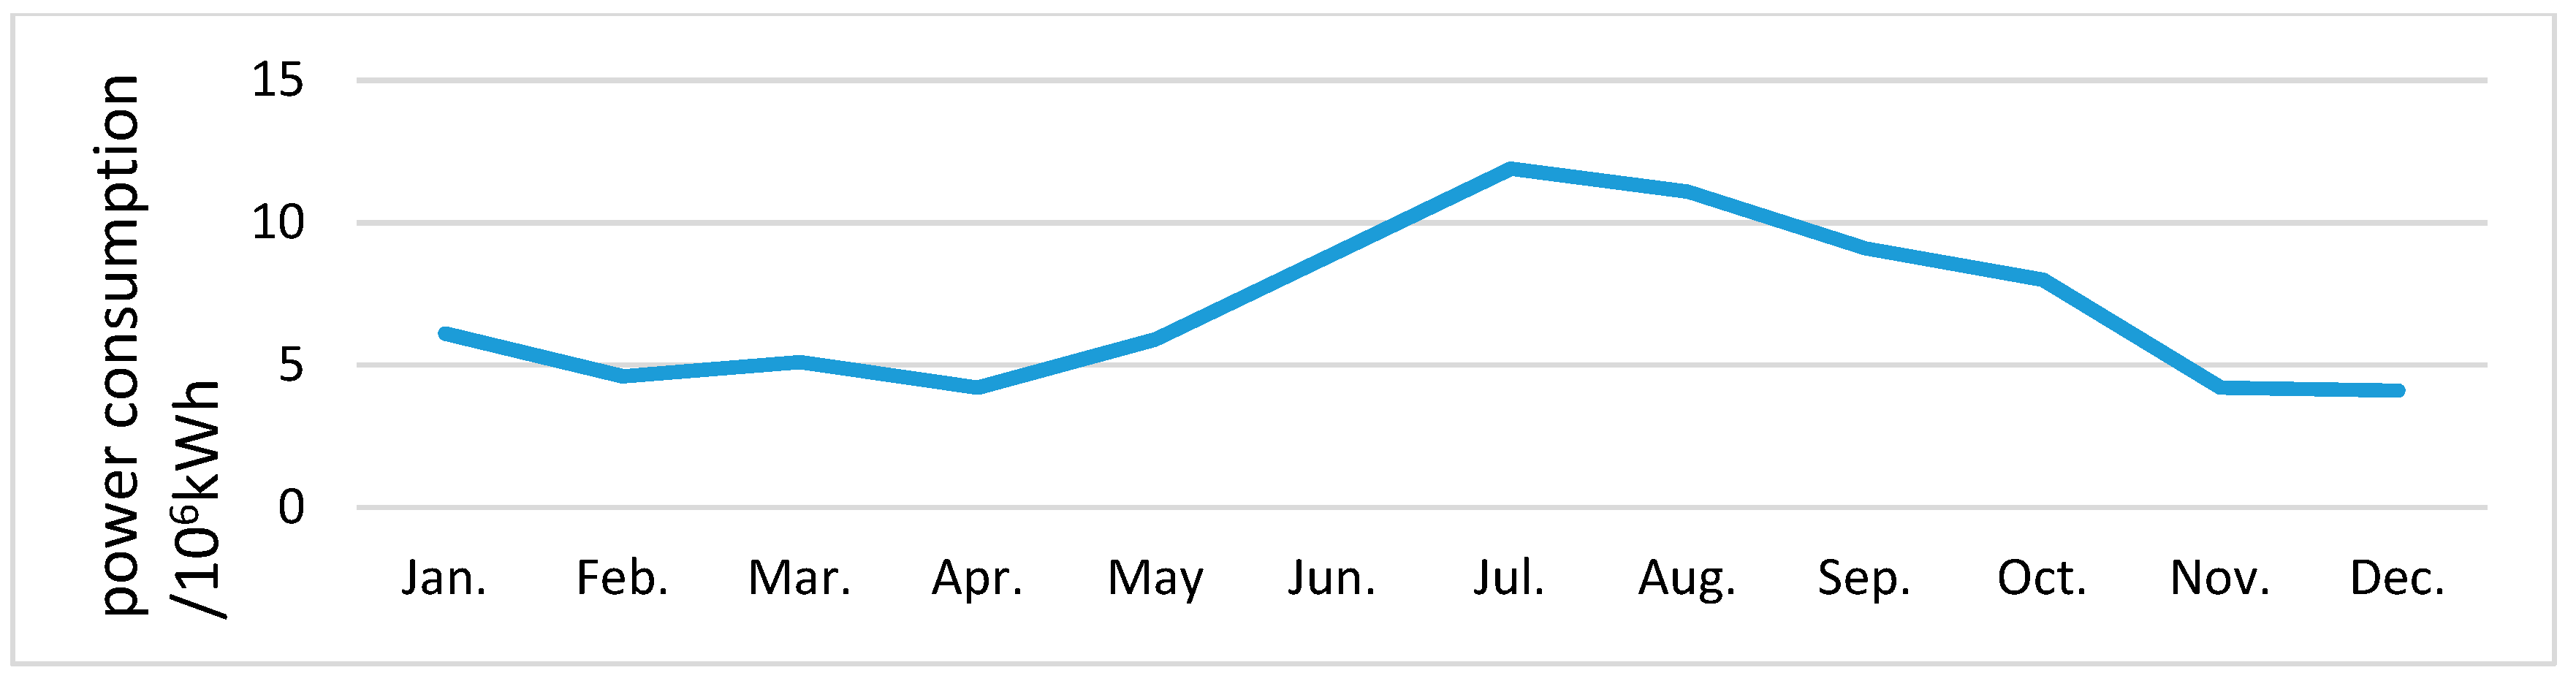
2.2. University Building
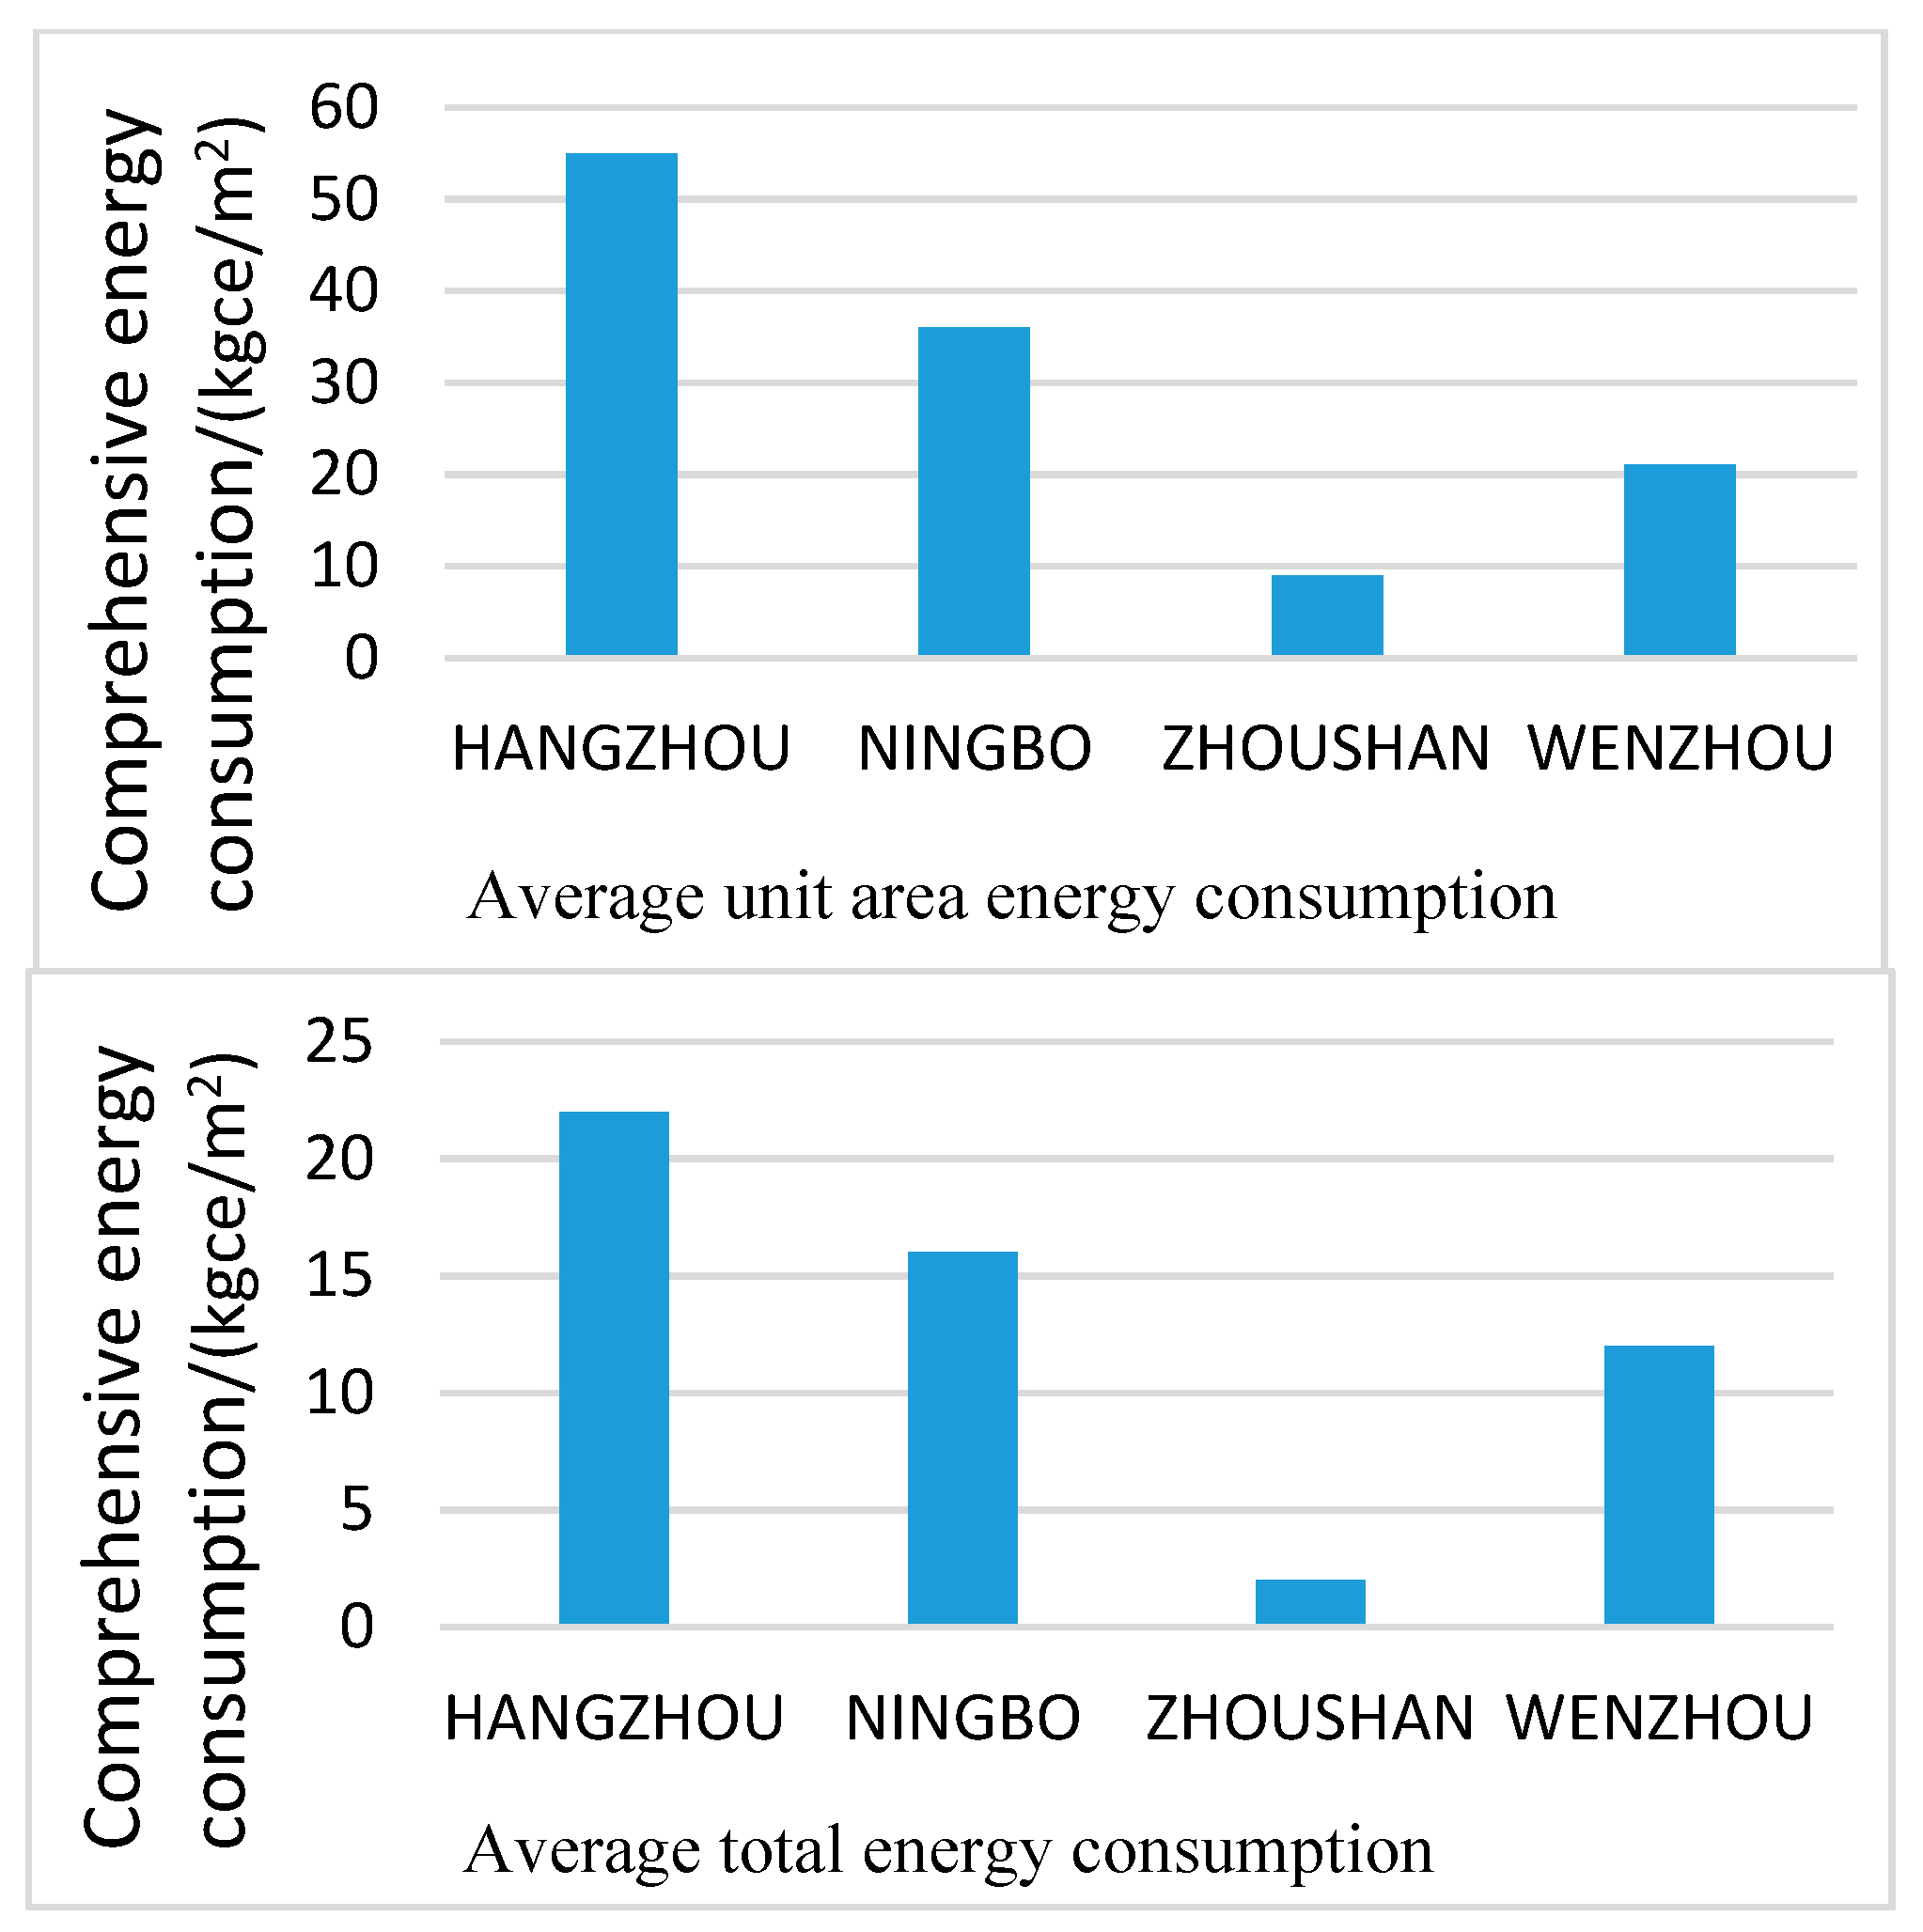
2.3. Hospital Building
3. Methods
3.1. Method Selection
3.2. Selection of Indicators
4. Research Process
- The smallest difference within the class, the largest difference between classes
- A map grading algorithm that considers that the data itself has a breakpoint and can be graded using the characteristics of the data.
- The algorithm principle is a small cluster. The clustering end condition is that the variance between groups is the largest and the variance within the group is the smallest.
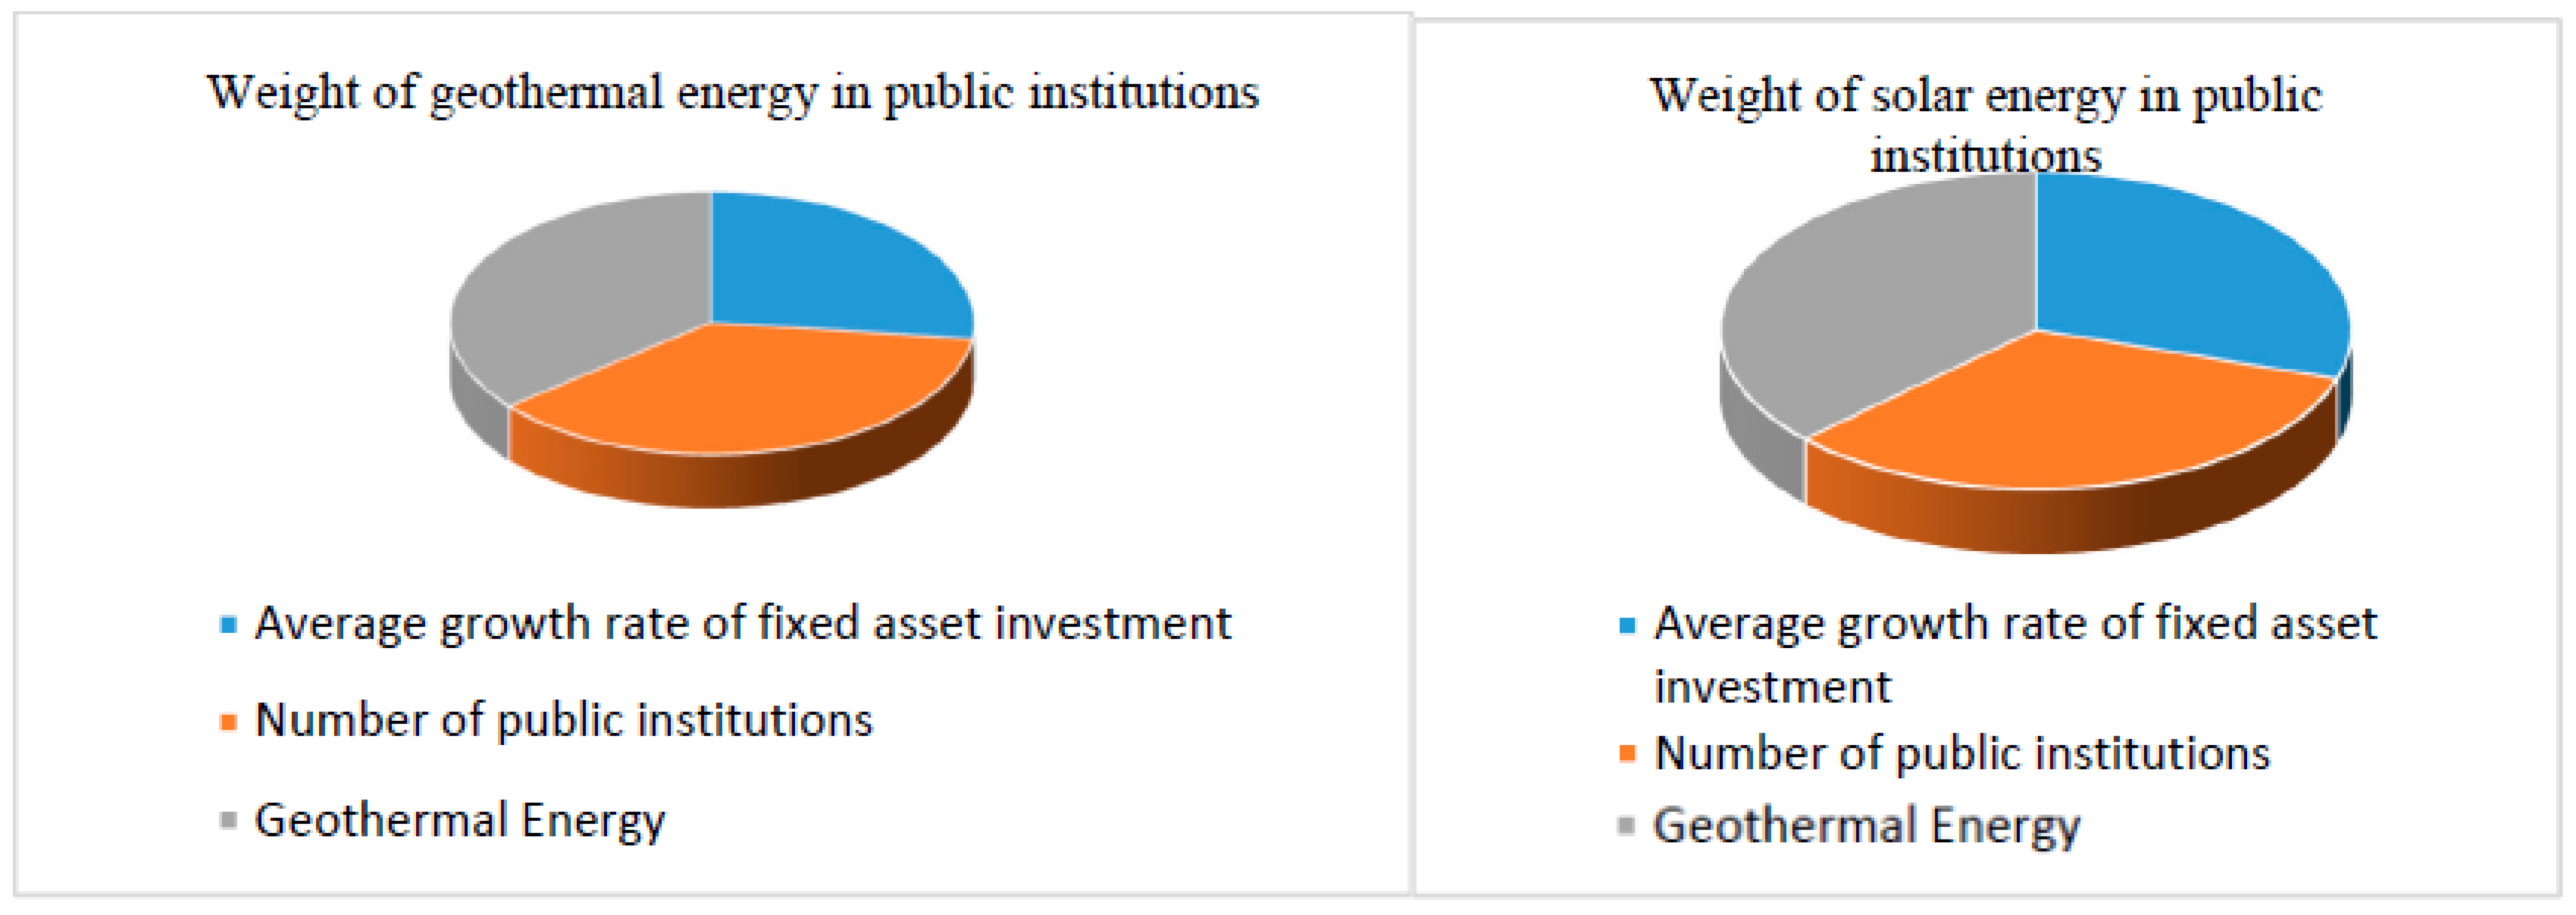
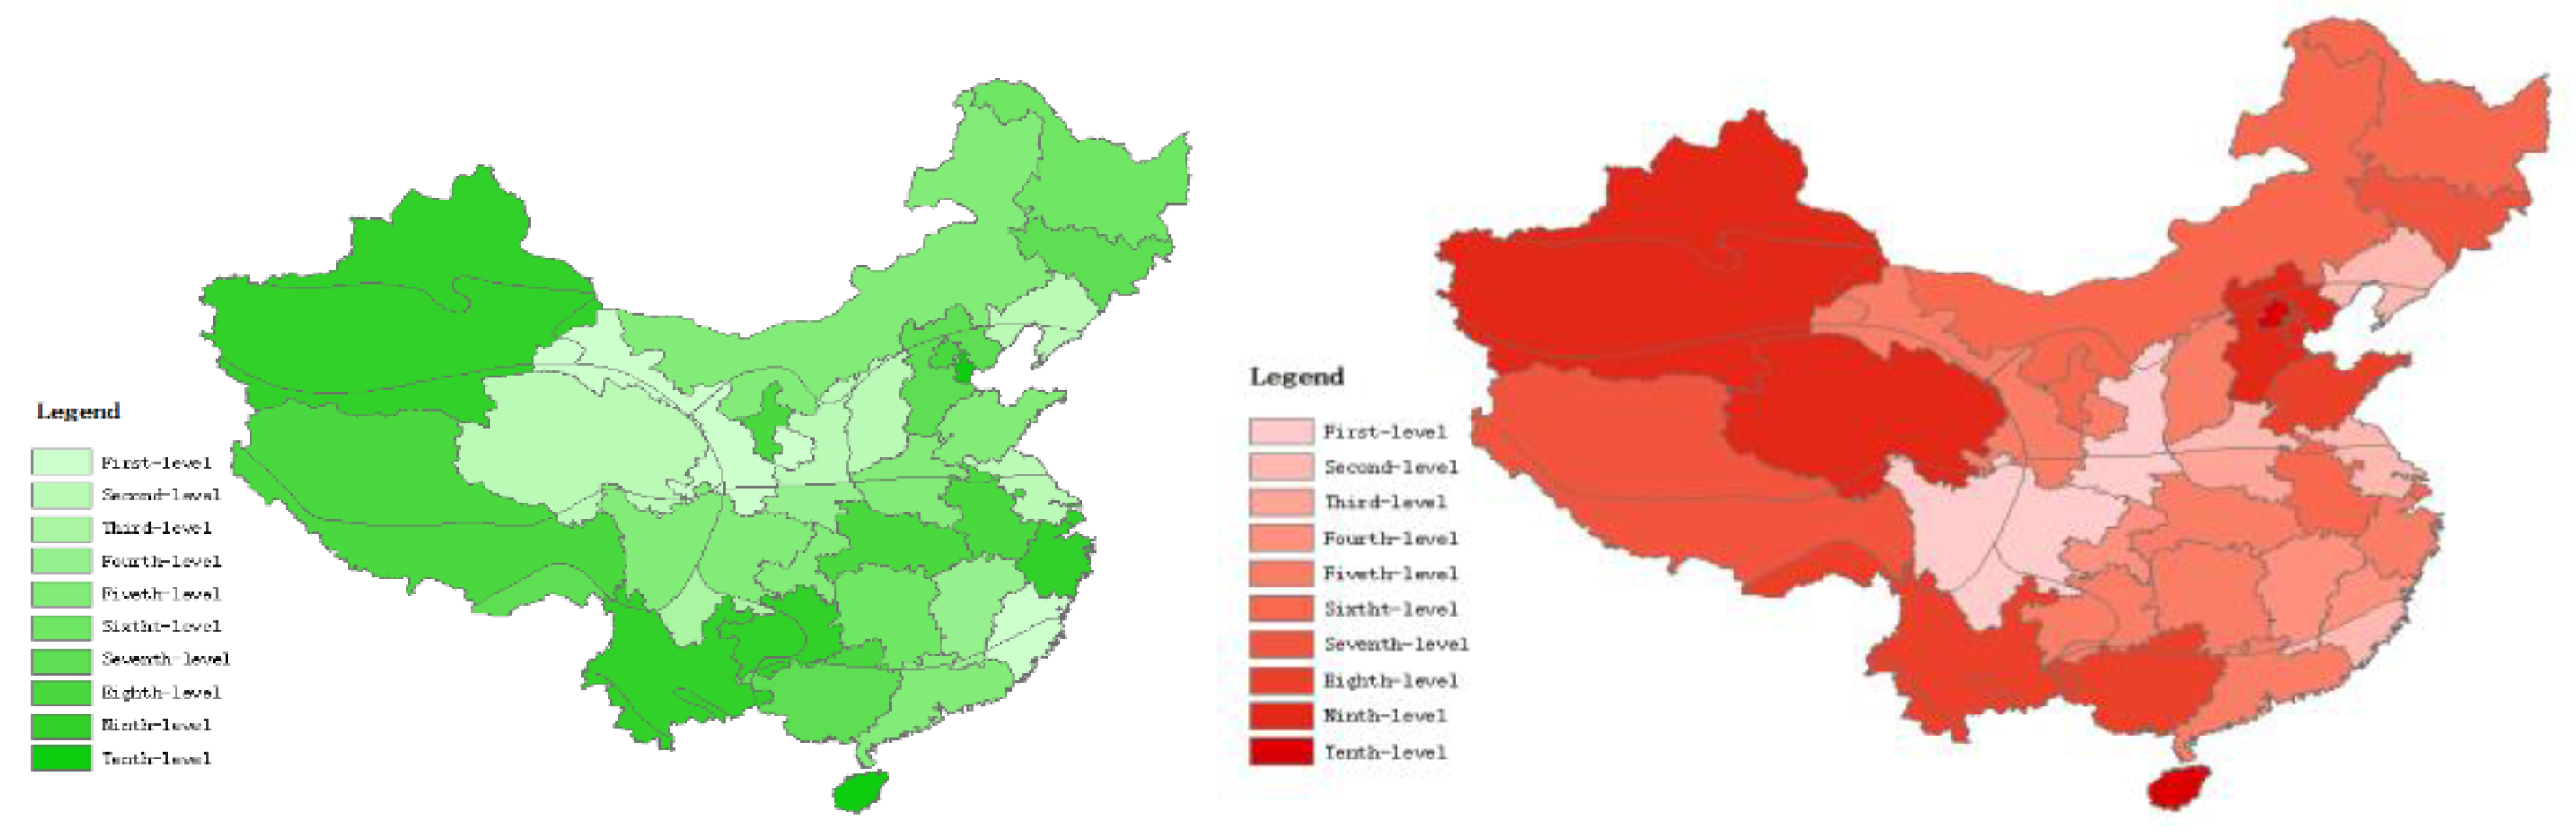
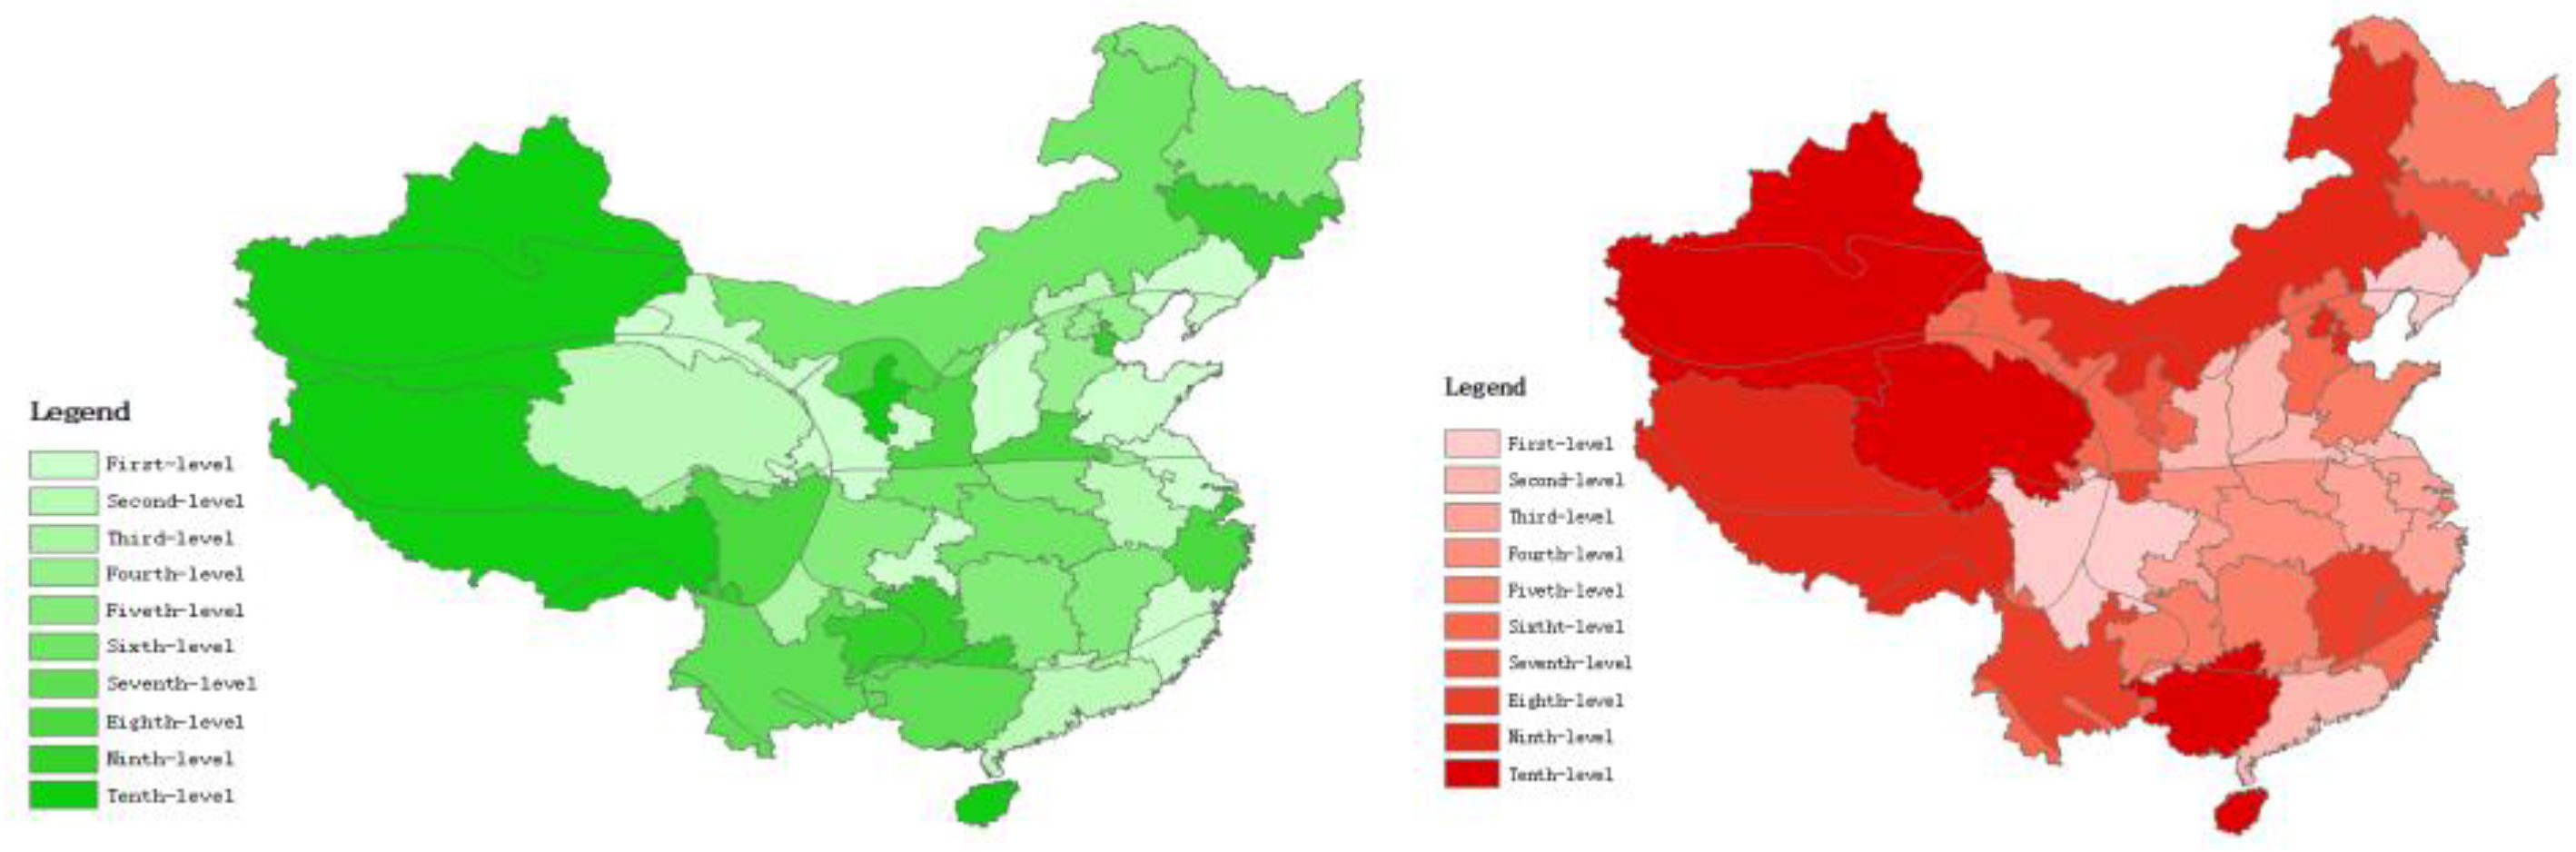
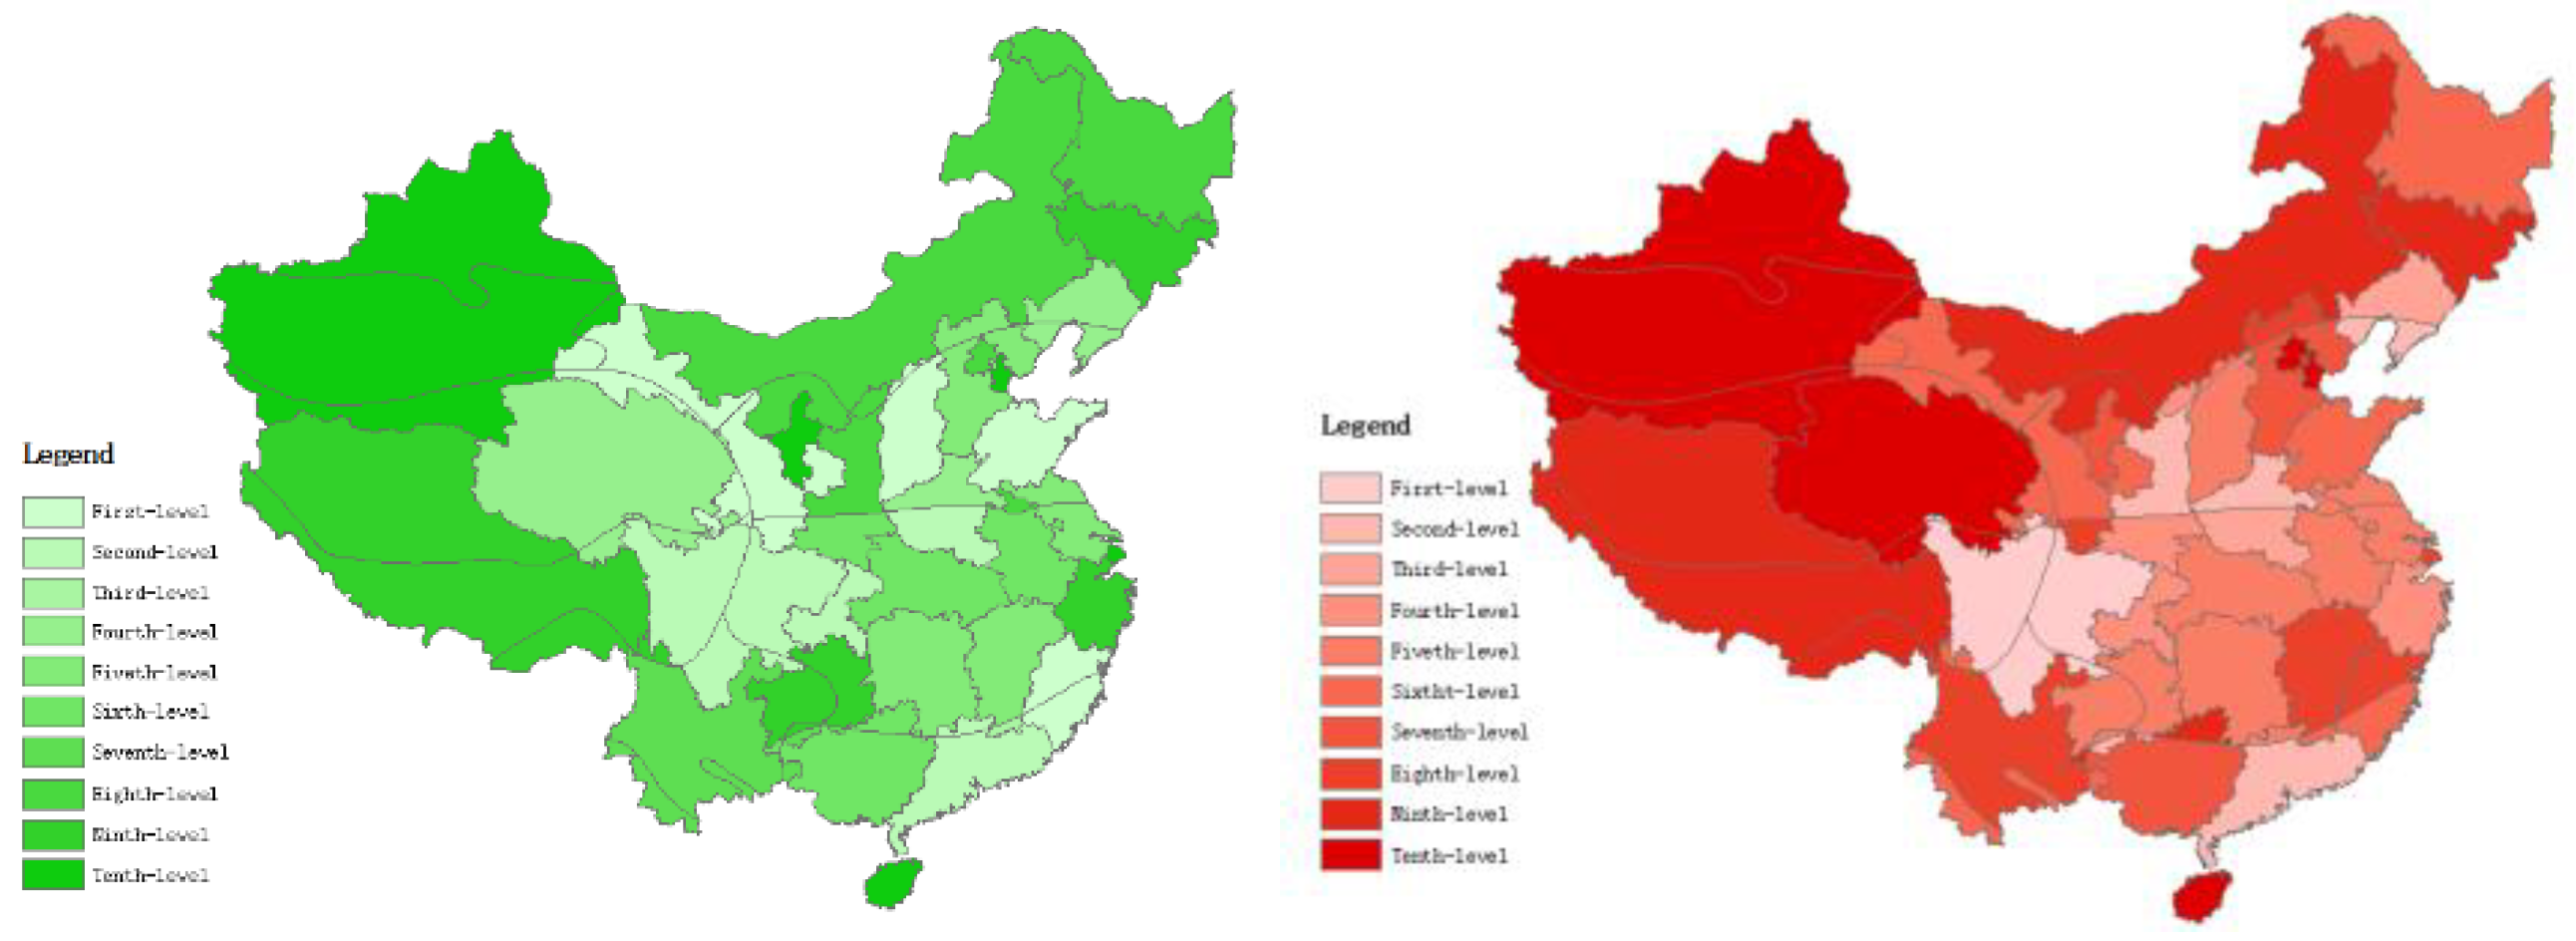
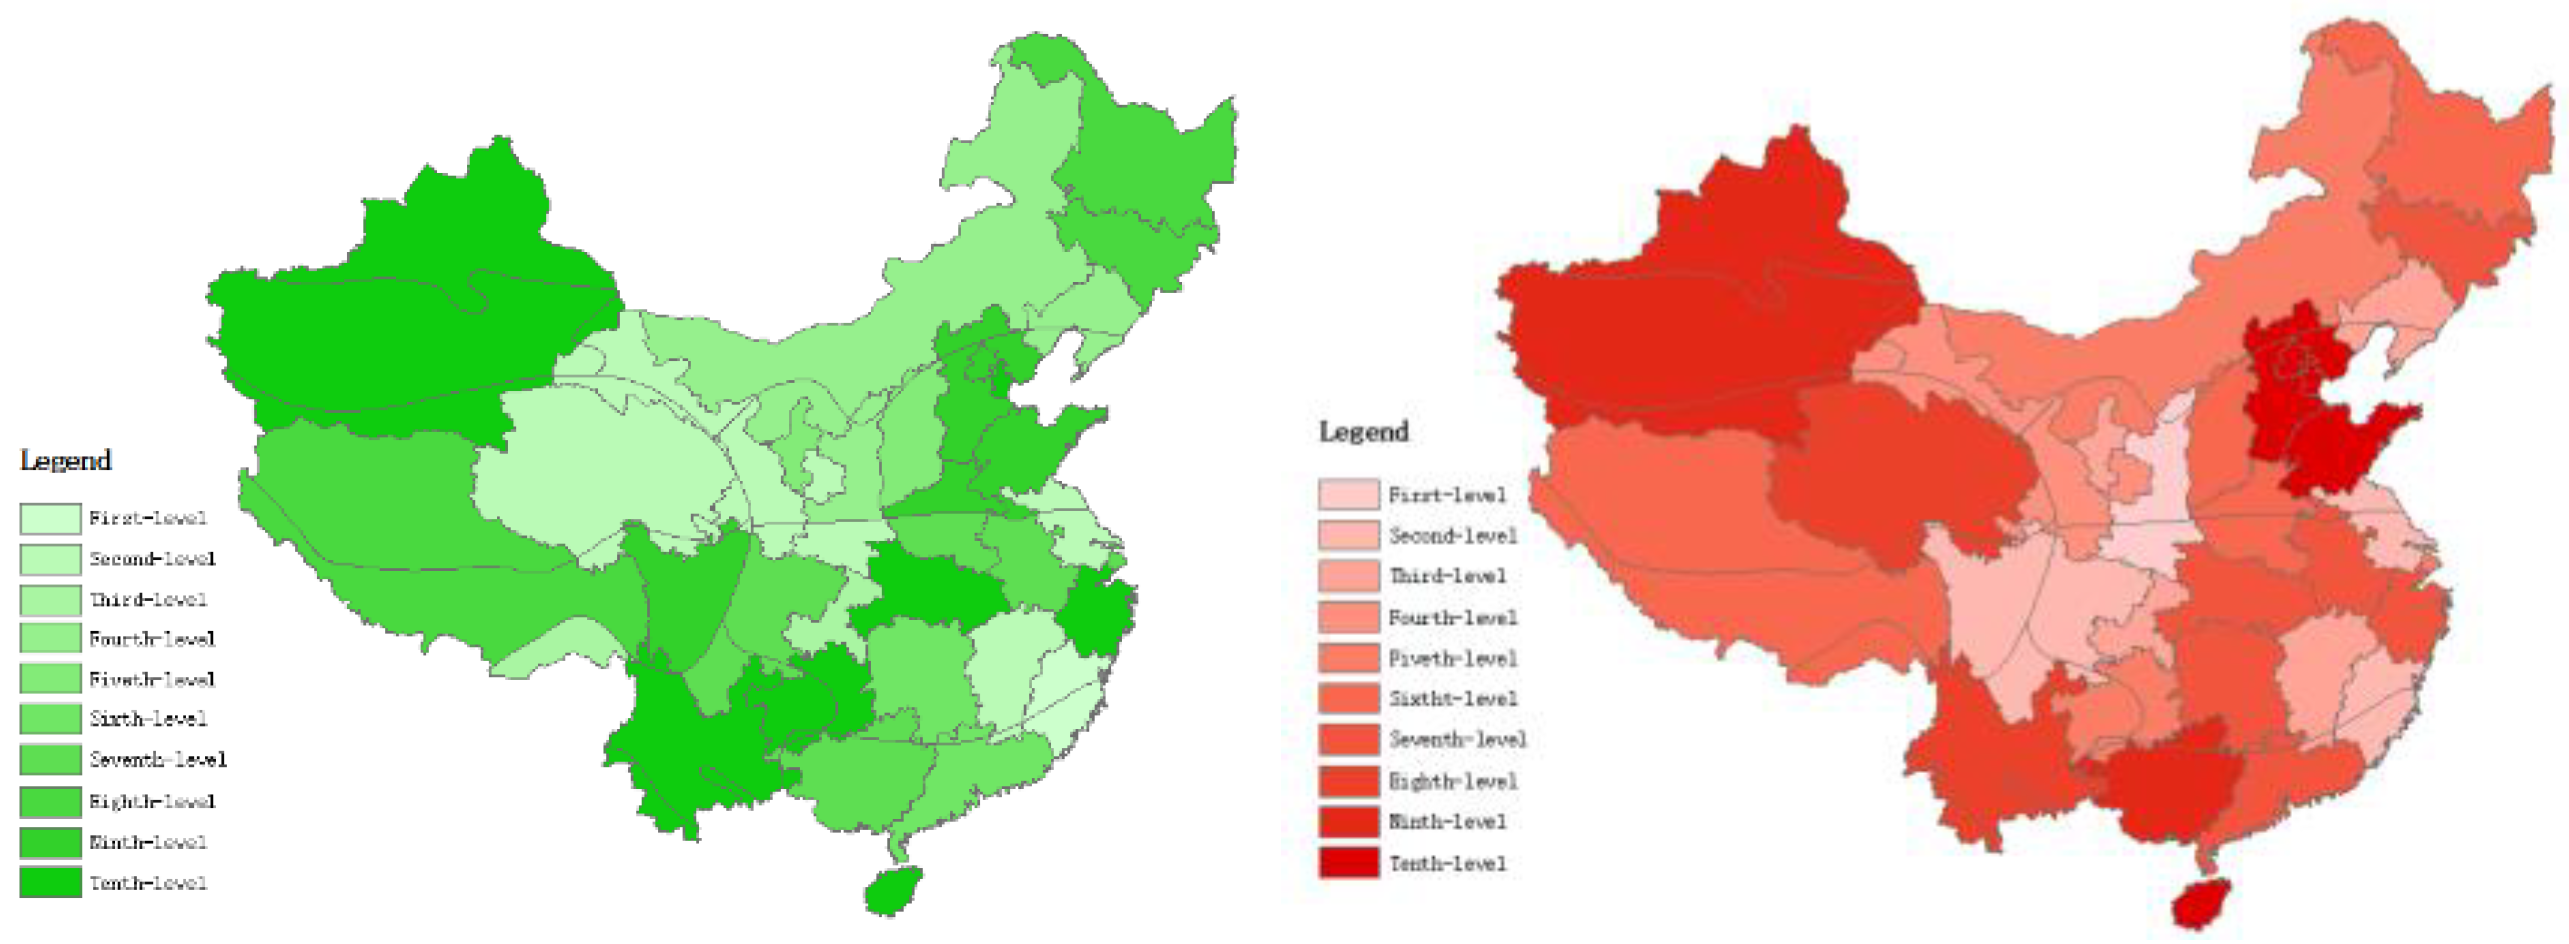
5. Research Results and Analysis
Author Contributions
Funding
Conflicts of Interest
References
- Xu, Q. Research Status and Thinking of Energy Consumption Quota for Public Buildings. Build. Technol. 2010, 8, 35–37. [Google Scholar]
- Xue, S.; Li, Y.; Ma, Y.; Yu, Y. Research on energy consumption quotas in universities in Hubei Province. Build. Sci. 2013, 29, 93–97. [Google Scholar]
- Zhang, W. Energy-saving design and operation strategy of air-conditioning cold and heat source in Shanghai Fengxian Central Hospital. HVAC 2013, 43, 52–54. [Google Scholar]
- Tang, P.; Ling, S.; Yang, Y.; Cui, Q.; Gong, Y. Measurement and Analysis of Buried Tube Heat Exchangers in Nanjing Area. Sol. Energy 2017, 38, 378–385. [Google Scholar]
- Li, J.; Du, S.; Lai, Z. Application Test Analysis of Soil Source Heat Pump Air Conditioning System in Guiyang Area. Sichuan Build. Sci. Res. 2015, 41, 204–207. [Google Scholar]
- Sun, W.; Zhou, N.; Huang, J.; Cai, W.; Wang, Y. Analysis of the variation characteristics of the geothermal field in the heat transfer zone of the ground source heat pump system. Acta Energ. Sin. 2017, 38, 2804–2810. [Google Scholar]
- Hu, W.; Yan, D.; Liu, W. Study on the Guide to Energy Consumption Limits of Wuhan Civil Buildings. Build. Sci. 2015, 31, 42–47. [Google Scholar]
- Lai, M. GB/T5116-2016, Energy Consumption Standard for Civil Buildings; Ministry of Housing and Urban-Rural Development of the People’s Republic of China, China Building Industry Press: Beijing, China, 2016.
- 2018 BP World Energy Statistical Yearbook. Available online: http://www.bp.com/en_US/china/ (accessed on 23 May 2019).
- Hou, E. Release of the annual development research report on building energy conservation in China 2018. Build. Energy Conserv. 2008, 46, 133. [Google Scholar]
- Zhang, D.; Ding, Y.; Xie, L.; Kuang, Y. Investigation and analysis of energy consumption in government office buildings in chongqing. Civ. Eng. 2012, 34, 271–274. [Google Scholar]
- Liu, Y.; Wu, D.; Li, H.; Lin, J.; Tang, L.; Cui, Y. Preliminary Analysis of Energy Consumption Statistics of Civil Buildings in Yunnan Province. HVAC 2016, 46, 6–11. [Google Scholar]
- Long, W. Reflections on Building Energy Efficiency 2.0. HVAC 2016, 46, 1–12. [Google Scholar]
- Yuan, X.; Gu, X.; Wang, J. Research Progress in Solar Energy Resource Assessment in China. J. Guizhou Meteorol. 2011, 35, 1–4. [Google Scholar]
- Regulations on Energy Conservation in Public Institutions. Order of the State Council of the People’s Republic of China. Available online: http://www.nea.gov.cn/2017-11/03/c_136725251.htm (accessed on 1 March 2019).
- Chen, Y.; Wang, J.; Lin, W.; Fei, R.; Zhao, D. Study on the Suitability of Renewable Energy in Office Buildings in Zhejiang Province. Zhejiang Archit. 2016, 33, 50–54. [Google Scholar]
- Libz, D. Part load operation coefficient of air-conditioning system of public building. Energy Build. 2010, 42, 1902–1907. [Google Scholar]
- Liu, M. Research on Energy Consumption Prediction Model and Energy Conservation Management System of Public Buildings in Universities in Xi’an. Master’s Thesis, Xi’an University of Architecture and Technology, Xi’an, China, 2017. [Google Scholar]
- Guo, C. Research on Energy Saving Potential and Energy Saving Measures for Hospital Buildings. Master’s Thesis, Hebei University of Engineering, Handan, China, 2018. [Google Scholar]
- Lu, W.; Chang, Y.-X. Study on the Energy Consumption Survey of Hospitals in Zhejiang Province and Its Influencing Factors. Build. Sci. 2010, 26, 48–51, 107. [Google Scholar]
- Baake, P.; Boom, A. Vertical Product Differentiation, Network Externalities, and Compatibility Decisions. Int. J. Ind. Organ. 2001, 19, 267–284. [Google Scholar] [CrossRef]
- Zhang, S.; Zhang, M.; Chi, G. Science and Technology Evaluation Model and Empirical Study Based on Entropy Weight Method. Chin. J. Manag. 2010, 7, 34–42. [Google Scholar]
- Wang, K.; Song, H. A Comparative Analysis of Three Objective Weighting Methods. J. Technol. Econ. Manag. 2003, 6, 48–49. [Google Scholar]
- Wu, L.; Tan, Q.; Zhang, Y. Network connectivity entropy and its application on network connectivity reliability. Physics A 2013, 392, 5536–5541. [Google Scholar] [CrossRef]
- Zou, Z.; Yun, Y.; Sun, J. Entropy method for determination of weight of evaluating indicators in fuzzy synthetic evaluation for water quality assessment. J. Environ. Sci. 2006, 18, 1020–1023. [Google Scholar] [CrossRef]
- Liu, L.; Zhou, J.; An, X.; Zhang, Y.; Yang, L. Using fuzzy theory and information entropy for water quality assessment in Three Gorges region, China. Expert Syst. Appl. 2010, 37, 2517–2521. [Google Scholar] [CrossRef]
- Diakoulaki, D.; Mavrolas, G.; Papayannakis, L. Determining objective weights in multiple criteria problems: The critic method. Comput. Oper. Res 1995, 22, 763–770. [Google Scholar] [CrossRef]
- Long, W. Demand Side Energy Planning Adapts to Supply Side Structure Reform-Written in Front of “Urban Demand Side Energy Planning and Energy Microgrid Technology”. HVAC 2016, 46, 135–138. [Google Scholar]
- Wang, C. Evaluation of the Main Stream Resources in the Middle and Lower Reaches of the Yangtze River. Ph.D. Thesis, Graduate School of the Chinese Academy of Sciences (Nanjing Institute of Geography and Limnology), Nanjing, China, 2000. [Google Scholar]
- Wang, G.; Zhang, W.; Liang, J.; Pei, W.; Liu, Z.; Wang, Y. Evaluation of geothermal resource potential in China. Chin. J. Earth 2017, 38, 449–450, 451–459, 584. [Google Scholar]
- Xu, G. Demonstration Research on Shallow Geothermal Energy Resources Evaluation in Beijing. Ph.D. Thesis, China University of Geosciences (Beijing), Beijing, China, 2007. [Google Scholar]


| Province | Geothermal Energy [MJ/(°C × m2)] | Standardization (Unchecked Dirty Data) | Standardization (Checked Dirty Data) |
|---|---|---|---|
| Fujian | 157.73 | 0.01 | 0.19 |
| Gansu | 160.09 | 0.01 | 0.19 |
| Guangxi | 506.46 | 0.02 | 0.88 |
| Hainan | 565.13 | 0.03 | 1.00 |
| Jiangsu | 413.38 | 0.02 | 0.70 |
| Qinghai | 63.62 | 0.00 | 0.00 |
| Sichuan | 454.55 | 0.02 | 0.78 |
| Tianjin | 496.89 | 0.02 | 0.86 |
| Xinjiang | 18,764.20 | 1.00 | 1.00 |
| Zhejiang | 532.76 | 0.03 | 0.94 |
| Province | Average Growth Rate of Fixed Asset Investment | Number of Public Institutions | Solar Energy Multi-Year Average (0.01 MJ/m2) |
|---|---|---|---|
| Fujian | 0.10 | 117,063 | 1.47 |
| Gansu | −0.20 | 69,259 | 1.46 |
| Guangxi | −0.40 | 86,813 | 1.68 |
| Hainan | 0.03 | 26,451 | 1.66 |
| Jiangsu | 0.11 | 127,608 | 1.38 |
| Qinghai | 0.14 | 41,668 | 1.61 |
| Sichuan | 0.16 | 103,631 | 1.03 |
| Tianjin | 0.19 | 15,678 | 1.57 |
| Xinjiang | −0.02 | 54,331 | 1.64 |
| Zhejiang | 0.11 | 44,668 | 1.22 |
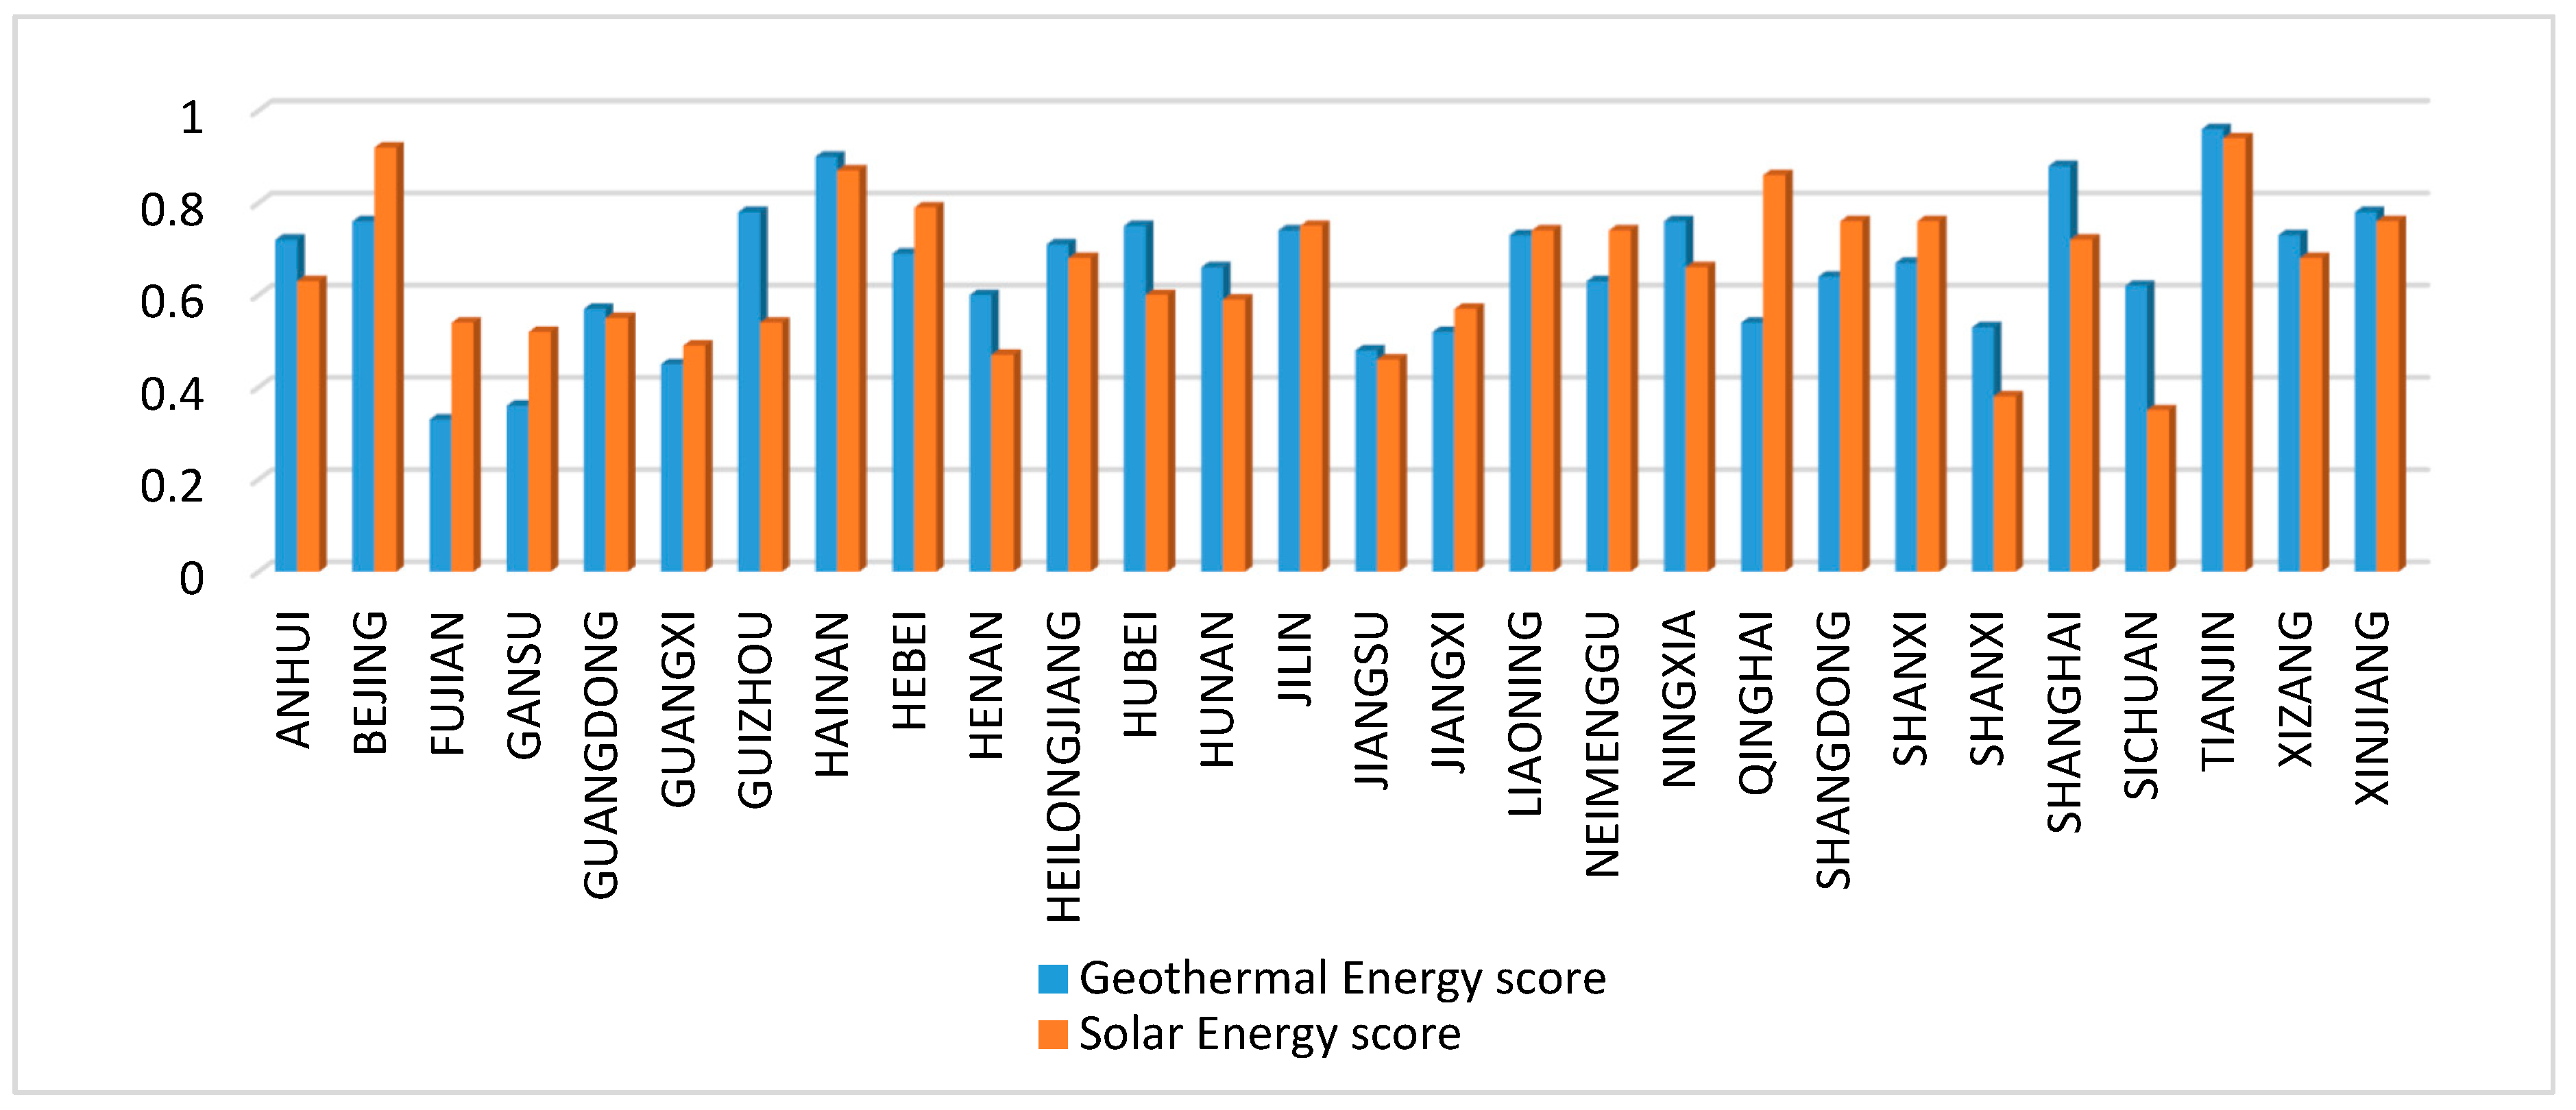
| Province | Average Growth Rate of Fixed Asset Investment | Number of Public Institutions | Geothermal Energy | Solar Energy |
|---|---|---|---|---|
| Fujian | 0.85 | 0.09 | 0.19 | 0.68 |
| Gansu | 0.34 | 0.52 | 0.19 | 0.66 |
| Guangxi | 0.00 | 0.36 | 0.88 | 1.00 |
| Hainan | 0.72 | 0.9 | 1.00 | 0.97 |
| Jiangsu | 0.86 | 0 | 0.70 | 0.54 |
| Qinghai | 0.91 | 0.77 | 0.00 | 0.89 |
| Sichuan | 0.95 | 0.21 | 0.78 | 0.00 |
| Tianjin | 1.00 | 1 | 0.86 | 0.83 |
| Xinjiang | 0.64 | 0.65 | 1.00 | 0.95 |
| Zhejiang | 0.85 | 0.74 | 0.94 | 0.30 |
© 2019 by the authors. Licensee MDPI, Basel, Switzerland. This article is an open access article distributed under the terms and conditions of the Creative Commons Attribution (CC BY) license (http://creativecommons.org/licenses/by/4.0/).
Share and Cite
Yu, S.; Liu, H.; Bai, L.; Han, F. Study on the Suitability of Passive Energy in Public Institutions in China. Energies 2019, 12, 2446. https://doi.org/10.3390/en12122446
Yu S, Liu H, Bai L, Han F. Study on the Suitability of Passive Energy in Public Institutions in China. Energies. 2019; 12(12):2446. https://doi.org/10.3390/en12122446
Chicago/Turabian StyleYu, Shui, He Liu, Lu Bai, and Fuhong Han. 2019. "Study on the Suitability of Passive Energy in Public Institutions in China" Energies 12, no. 12: 2446. https://doi.org/10.3390/en12122446
APA StyleYu, S., Liu, H., Bai, L., & Han, F. (2019). Study on the Suitability of Passive Energy in Public Institutions in China. Energies, 12(12), 2446. https://doi.org/10.3390/en12122446