De-Capacity Policy Effect on China’s Coal Industry

Abstract
:1. Introduction
2. Literature Review
2.1. Excess Capacity and Its Causes
2.2. De-Capacity Policy and Policy Effect
2.3. Comments in the Literature and Possible Academic Contributions
3. Policy Background and De-Capacity Progress
3.1. Policy Background
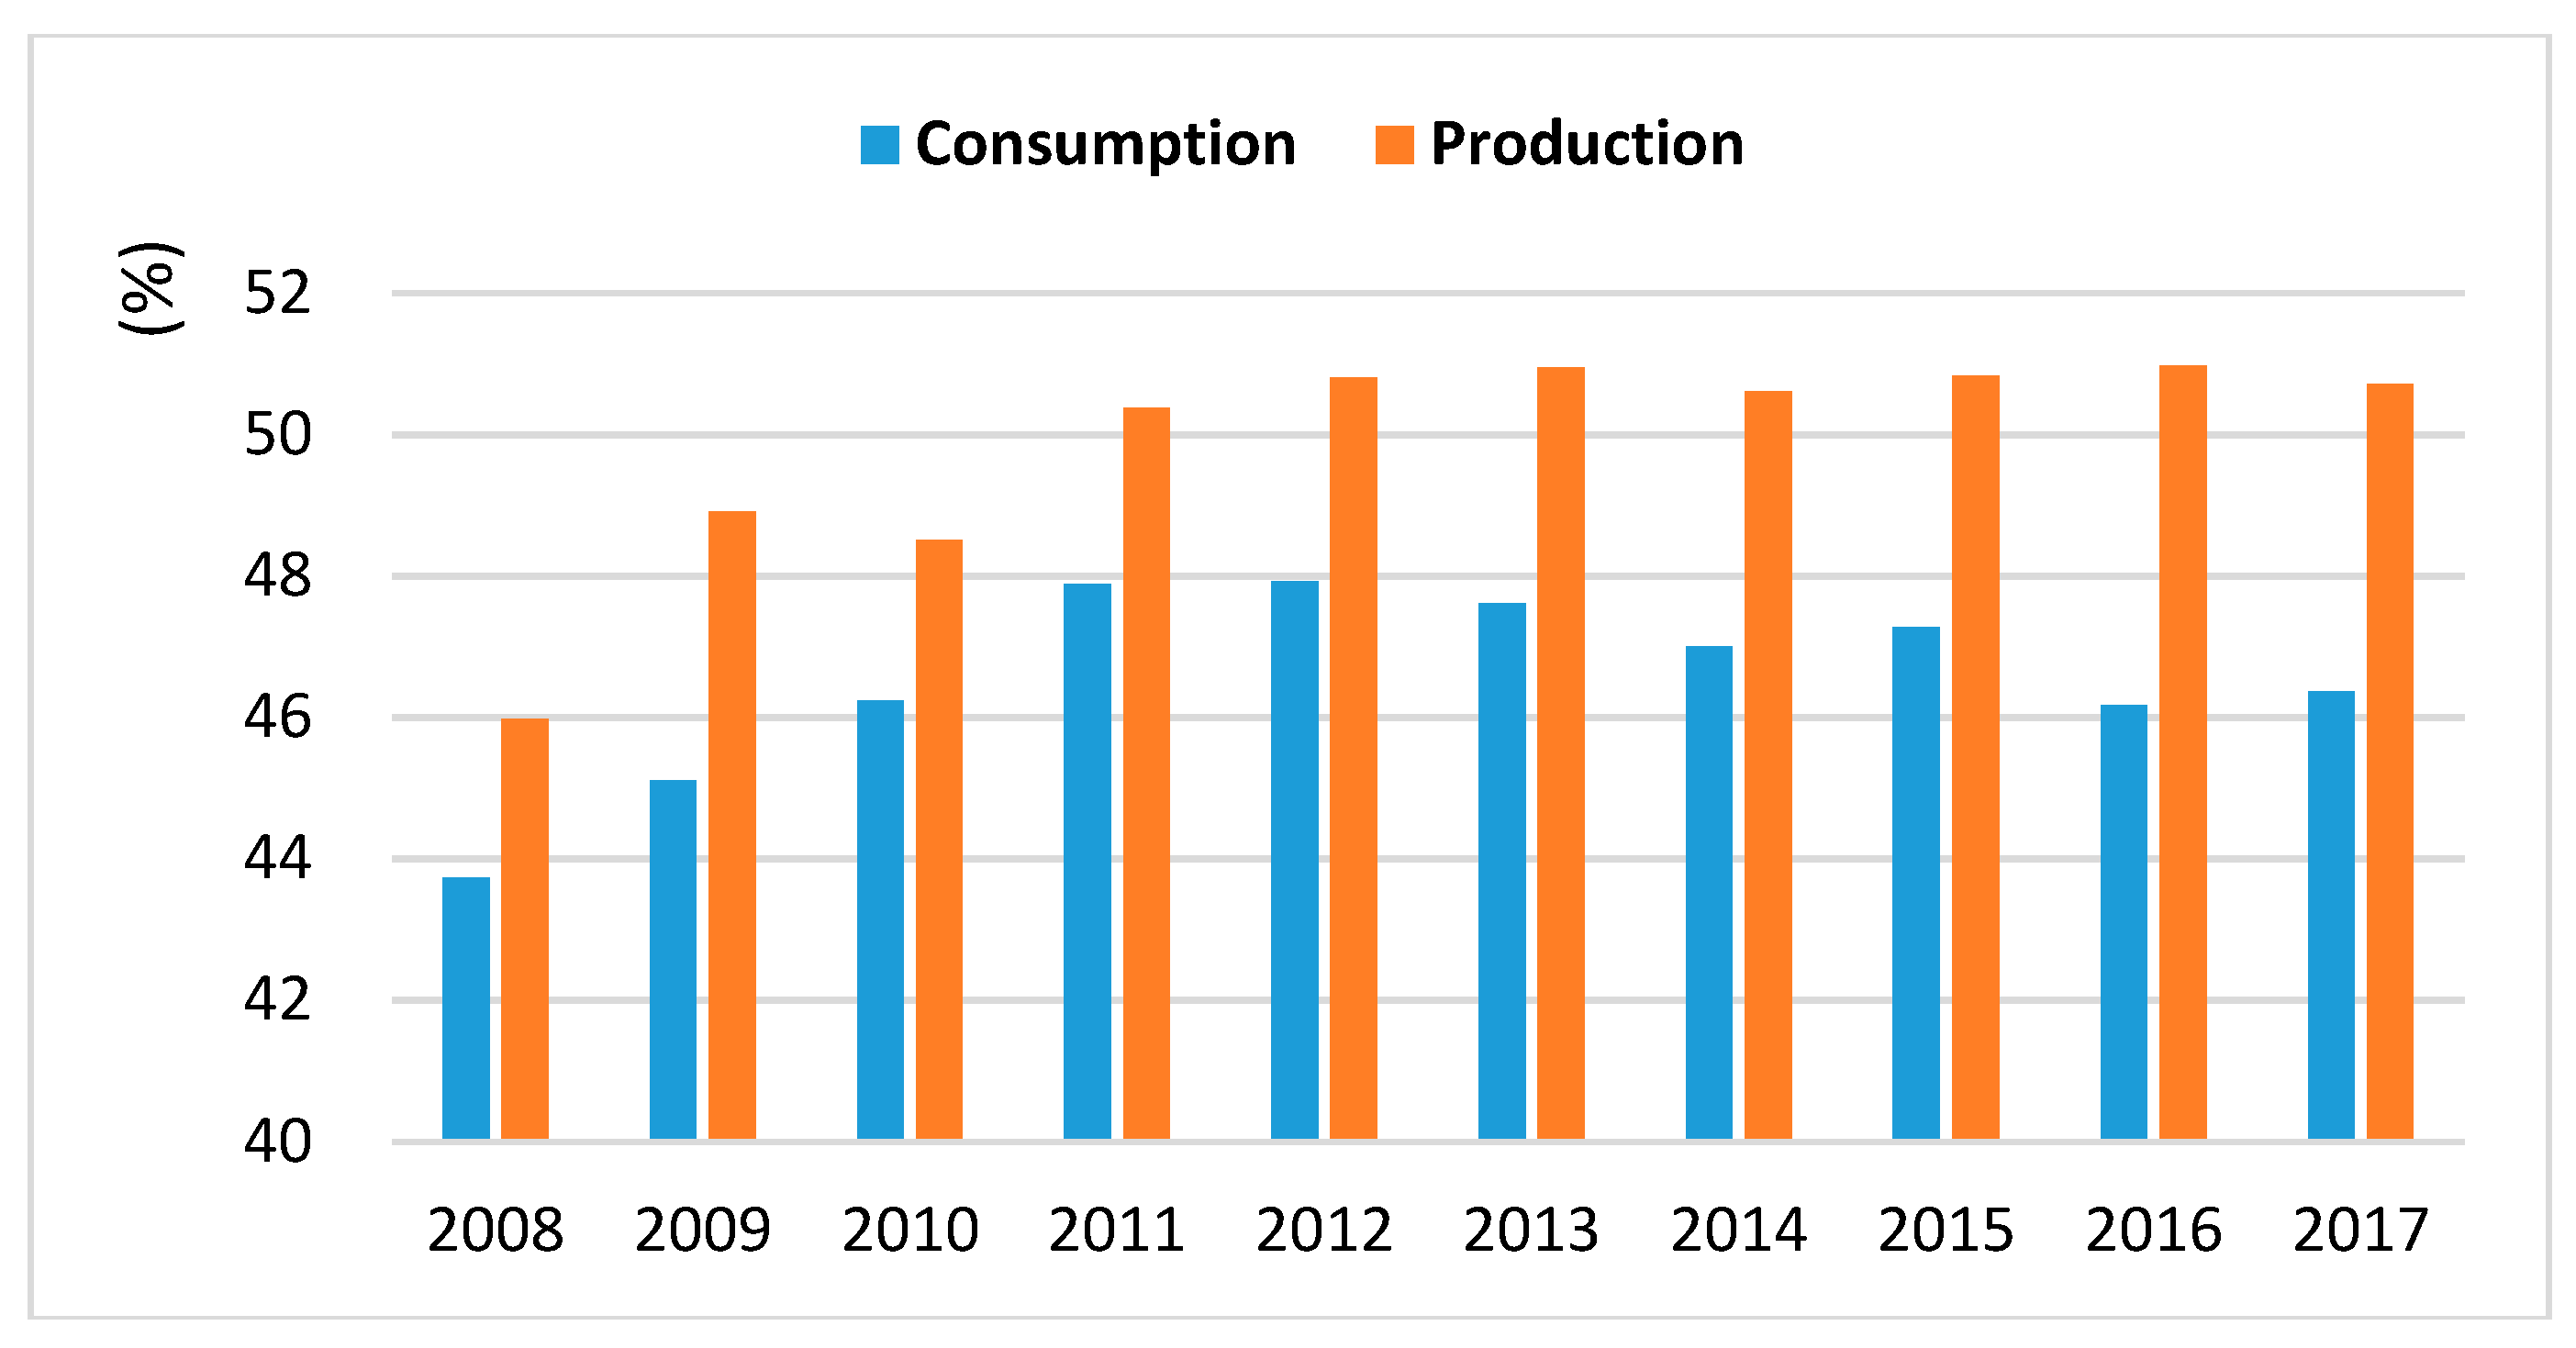
3.1.1. Severe Overcapacity
3.1.2. Low Market Demand
3.1.3. More Coal Enterprises Suffered Financial Losses
3.2. De-Capacity Progress
3.2.1. Overall Goal Completion
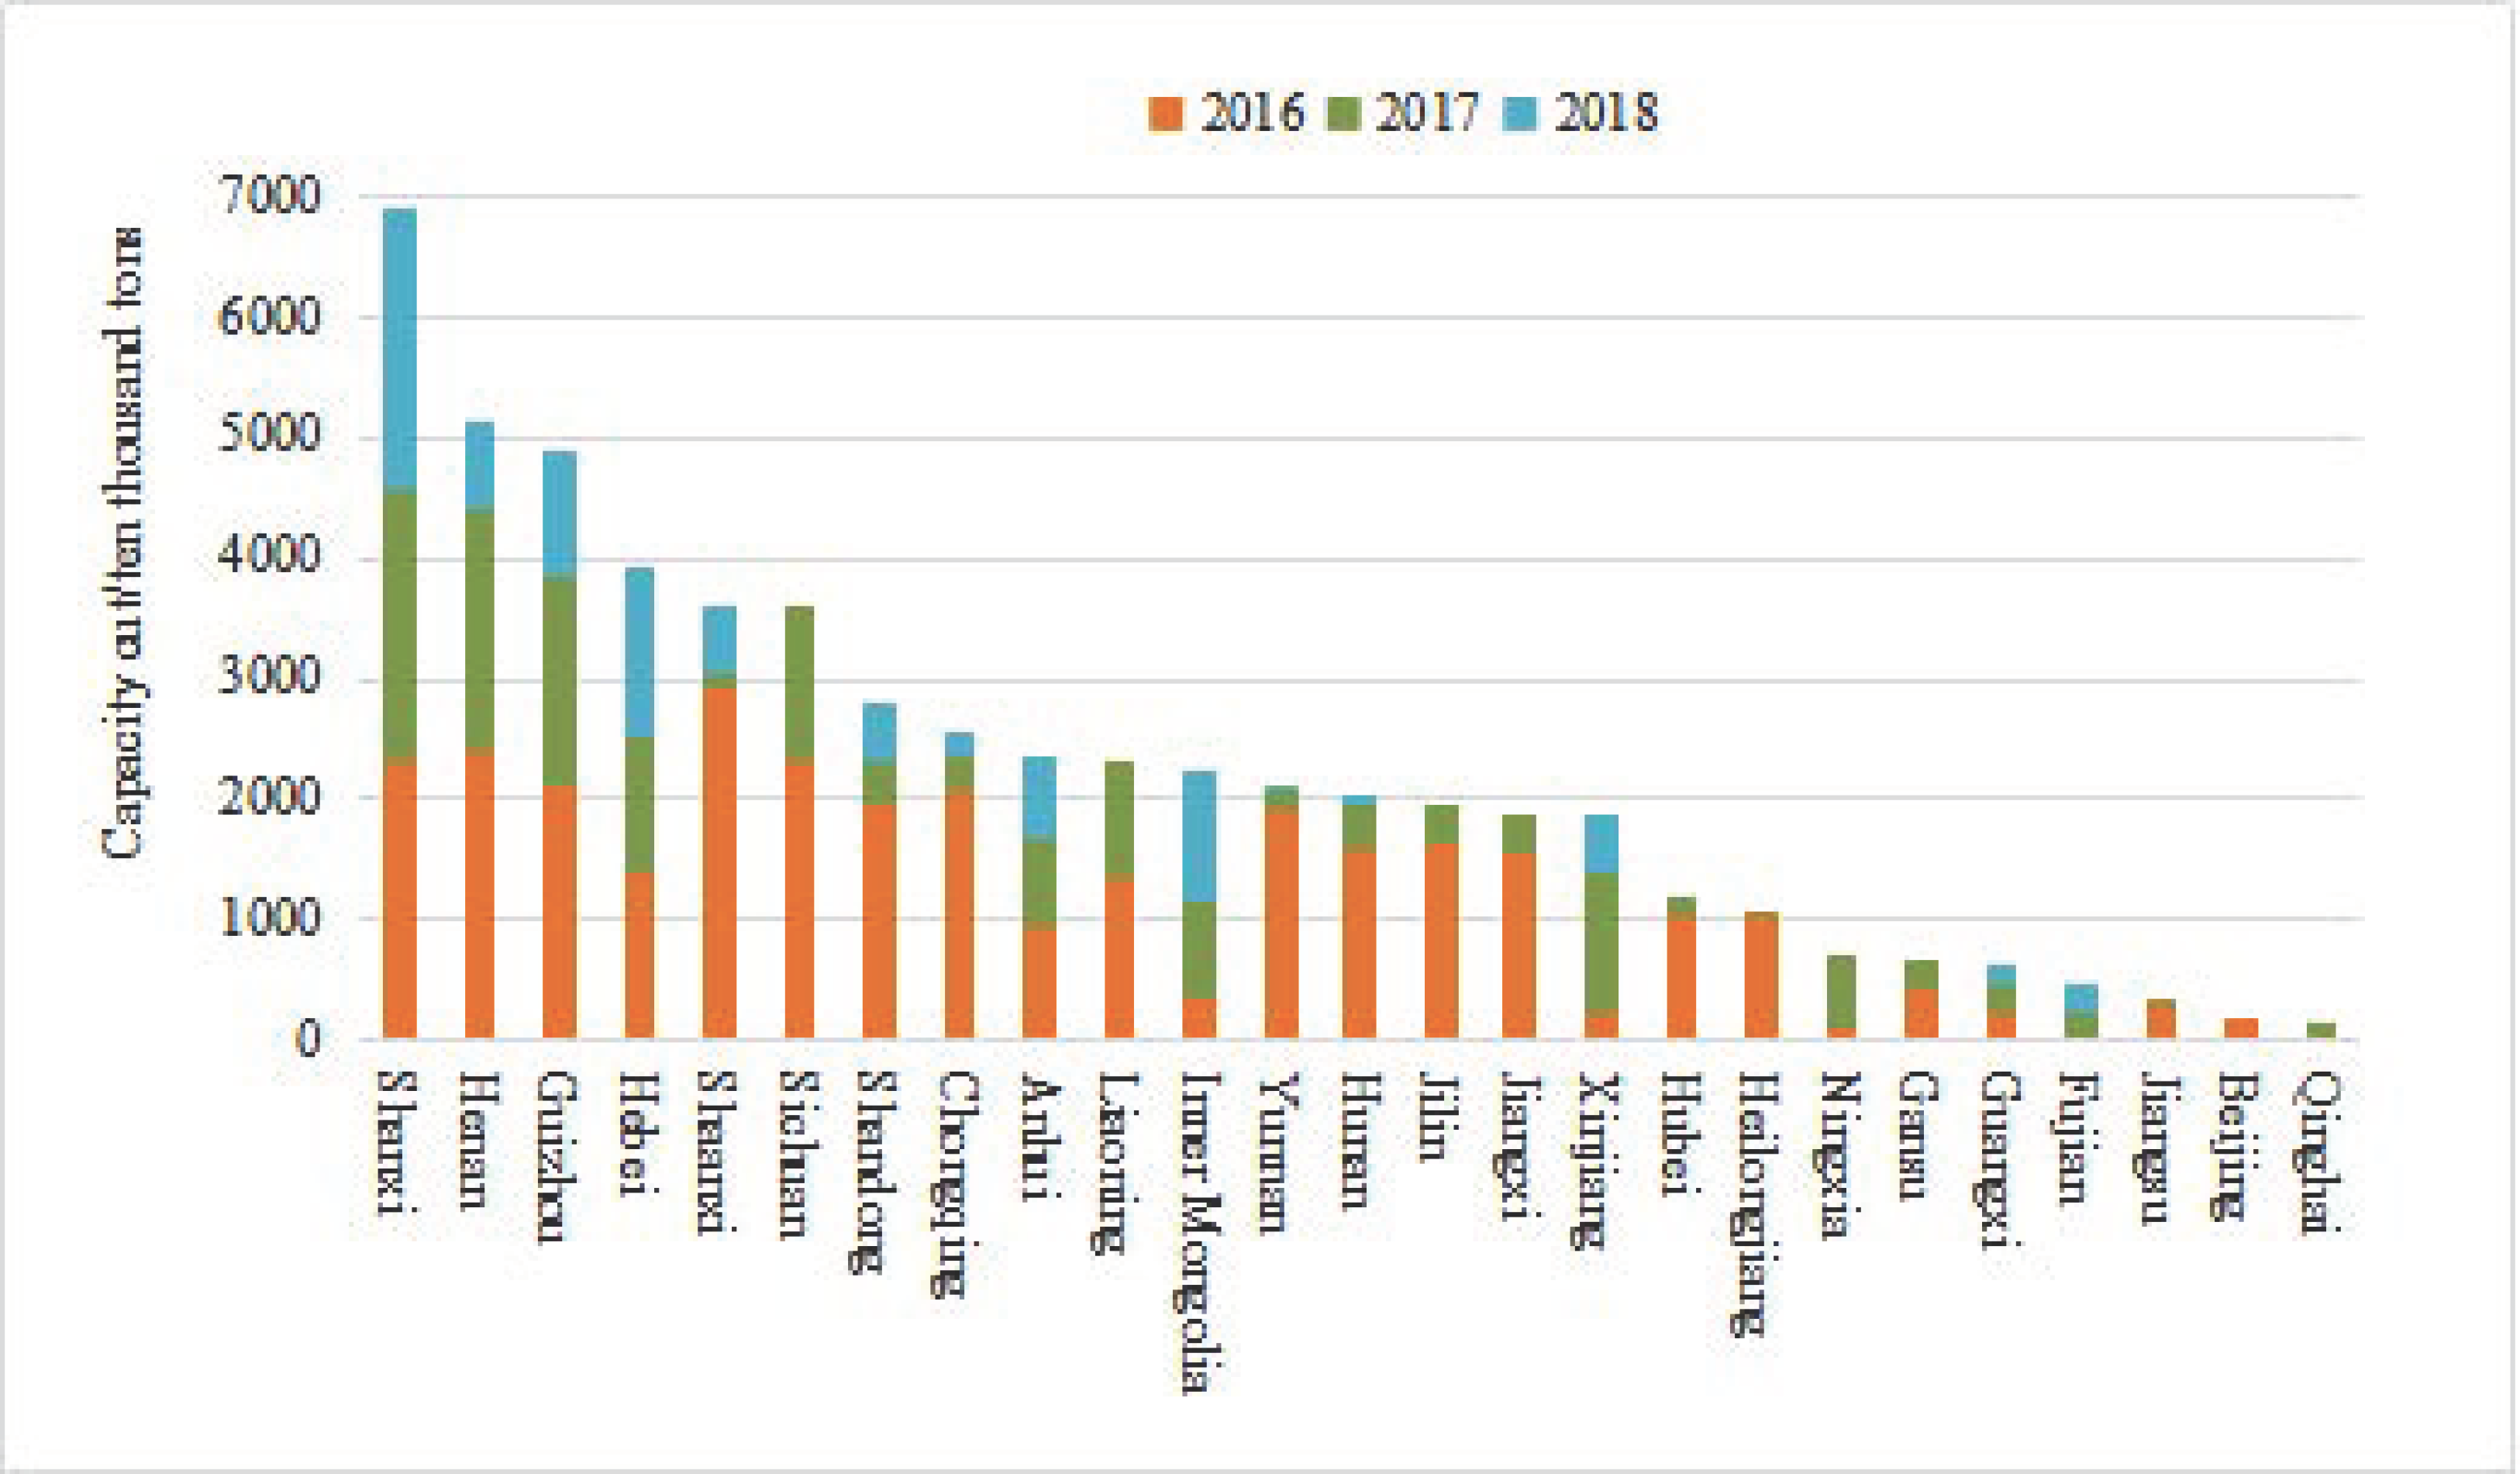
3.2.2. Spatial Distribution of De-Capacity
3.2.3. Classification of Closed Mines
4. Policy Effect
4.1. Effect on Coal Market
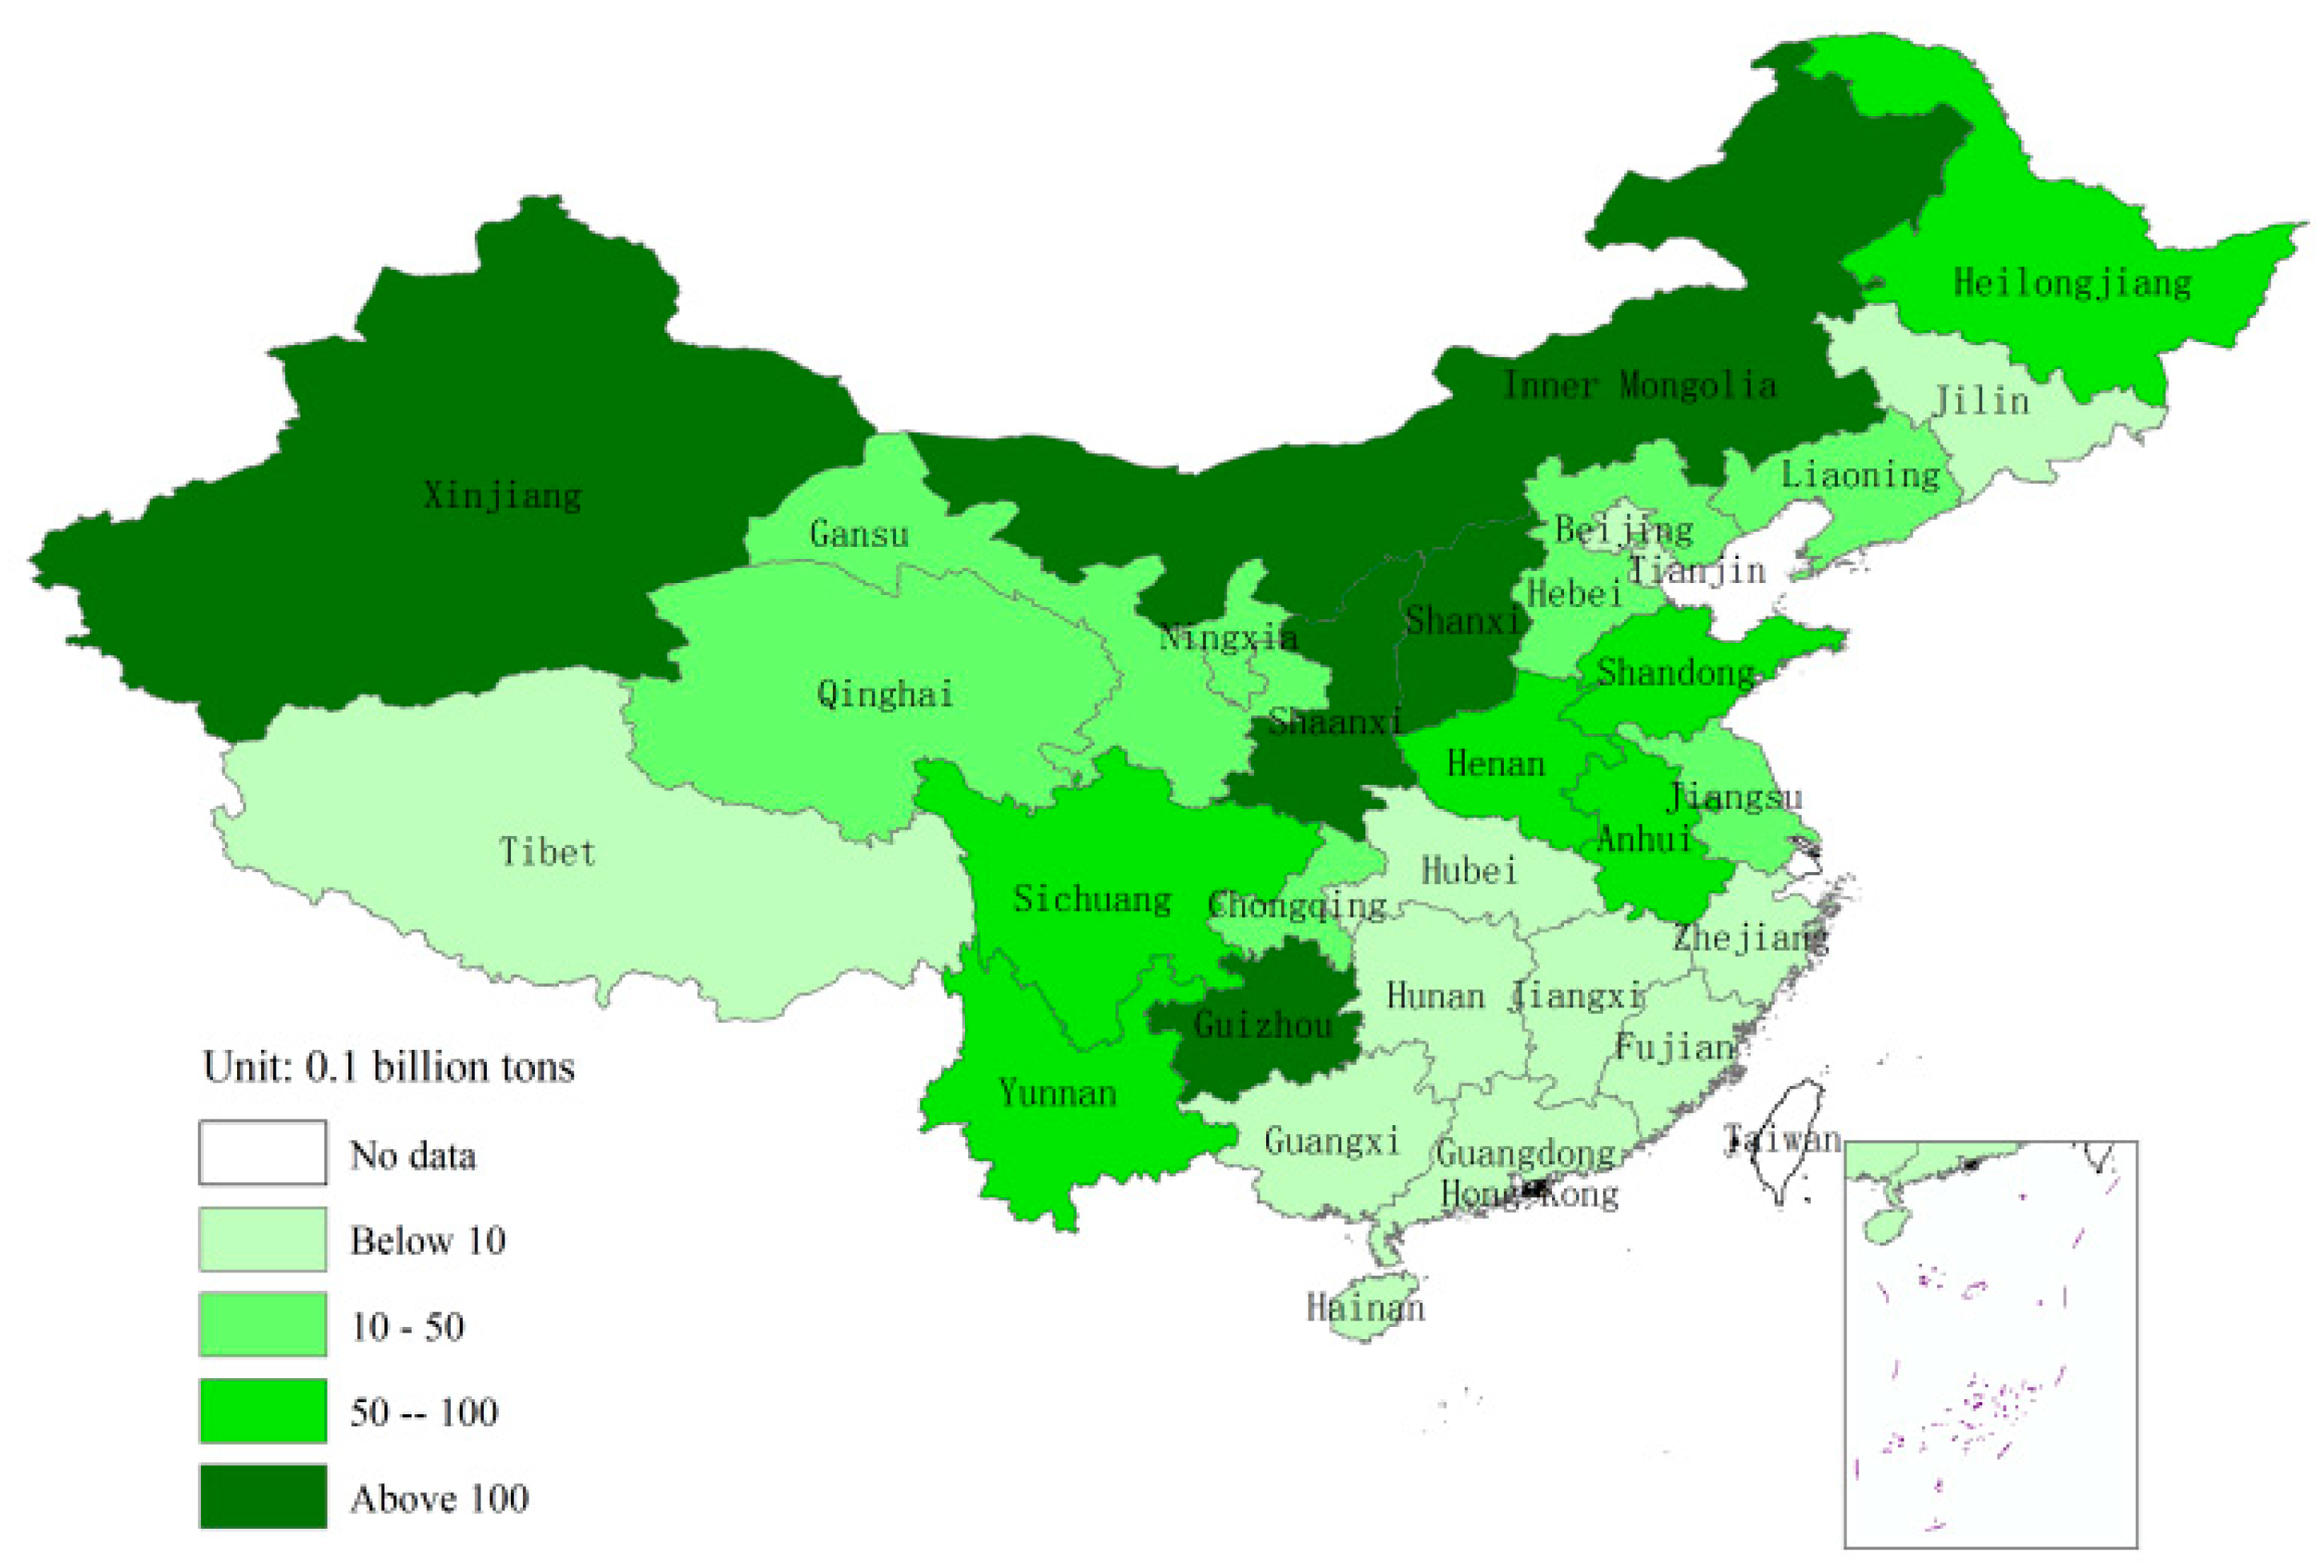
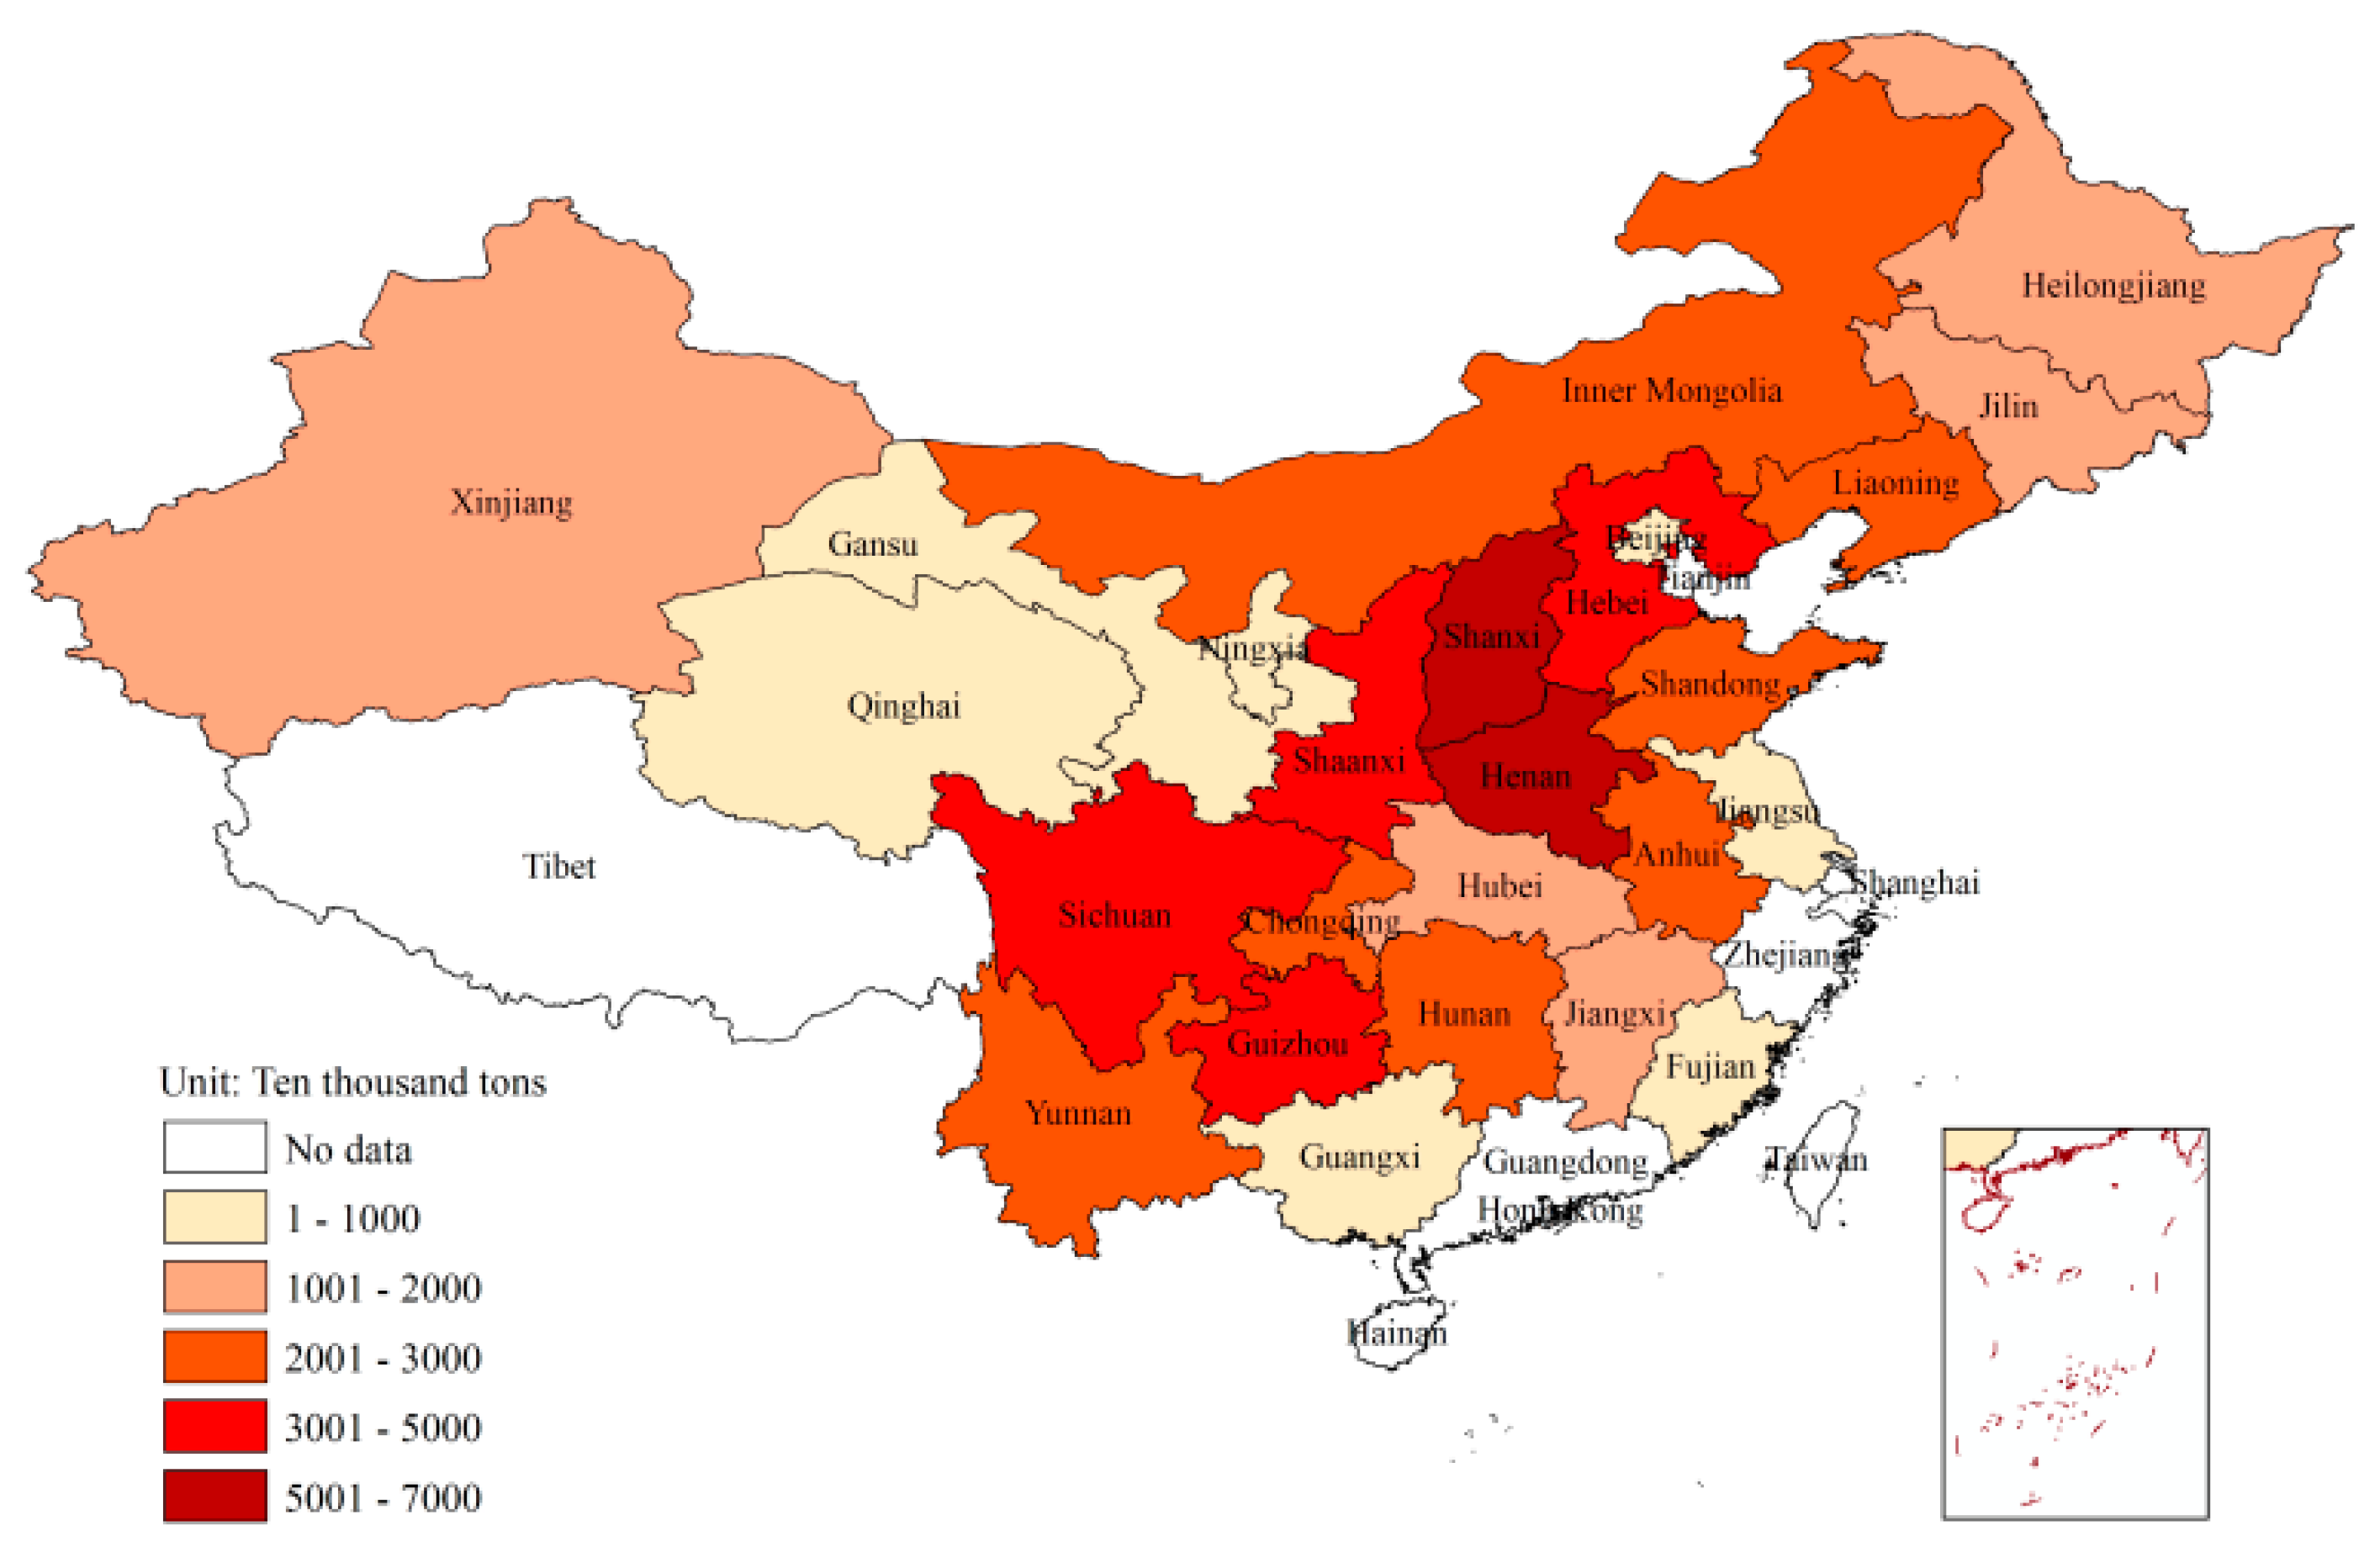
4.2. Effect on Spatial Distribution of Coal Production
4.3. Effect on Coal Enterprises
4.4. Regional Differences of Policy Effect
5. Conclusions and Policy Implications
5.1. Conclusions
- (1)
- The target of the Opinions to eliminate 500 million tons in three to five years had been achieved as of the end of 2017, with Shanxi as the province with the largest coal de-capacity during the period of 2016 to 2018. Overall, the capacity withdrawn was concentrated in the central and southwest regions, most of which belonged to state-owned coal mines and the resettlement of workers was a prominent problem. The intensity of de-capacity in most coal-producing provinces had been weakened from 2016 to 2018. At the same time, advanced production capacity was gradually released, indicating that the focus of China’s coal industry de-capacity work had gradually shifted from simple capacity cut to systematic and structural capacity optimisation.
- (2)
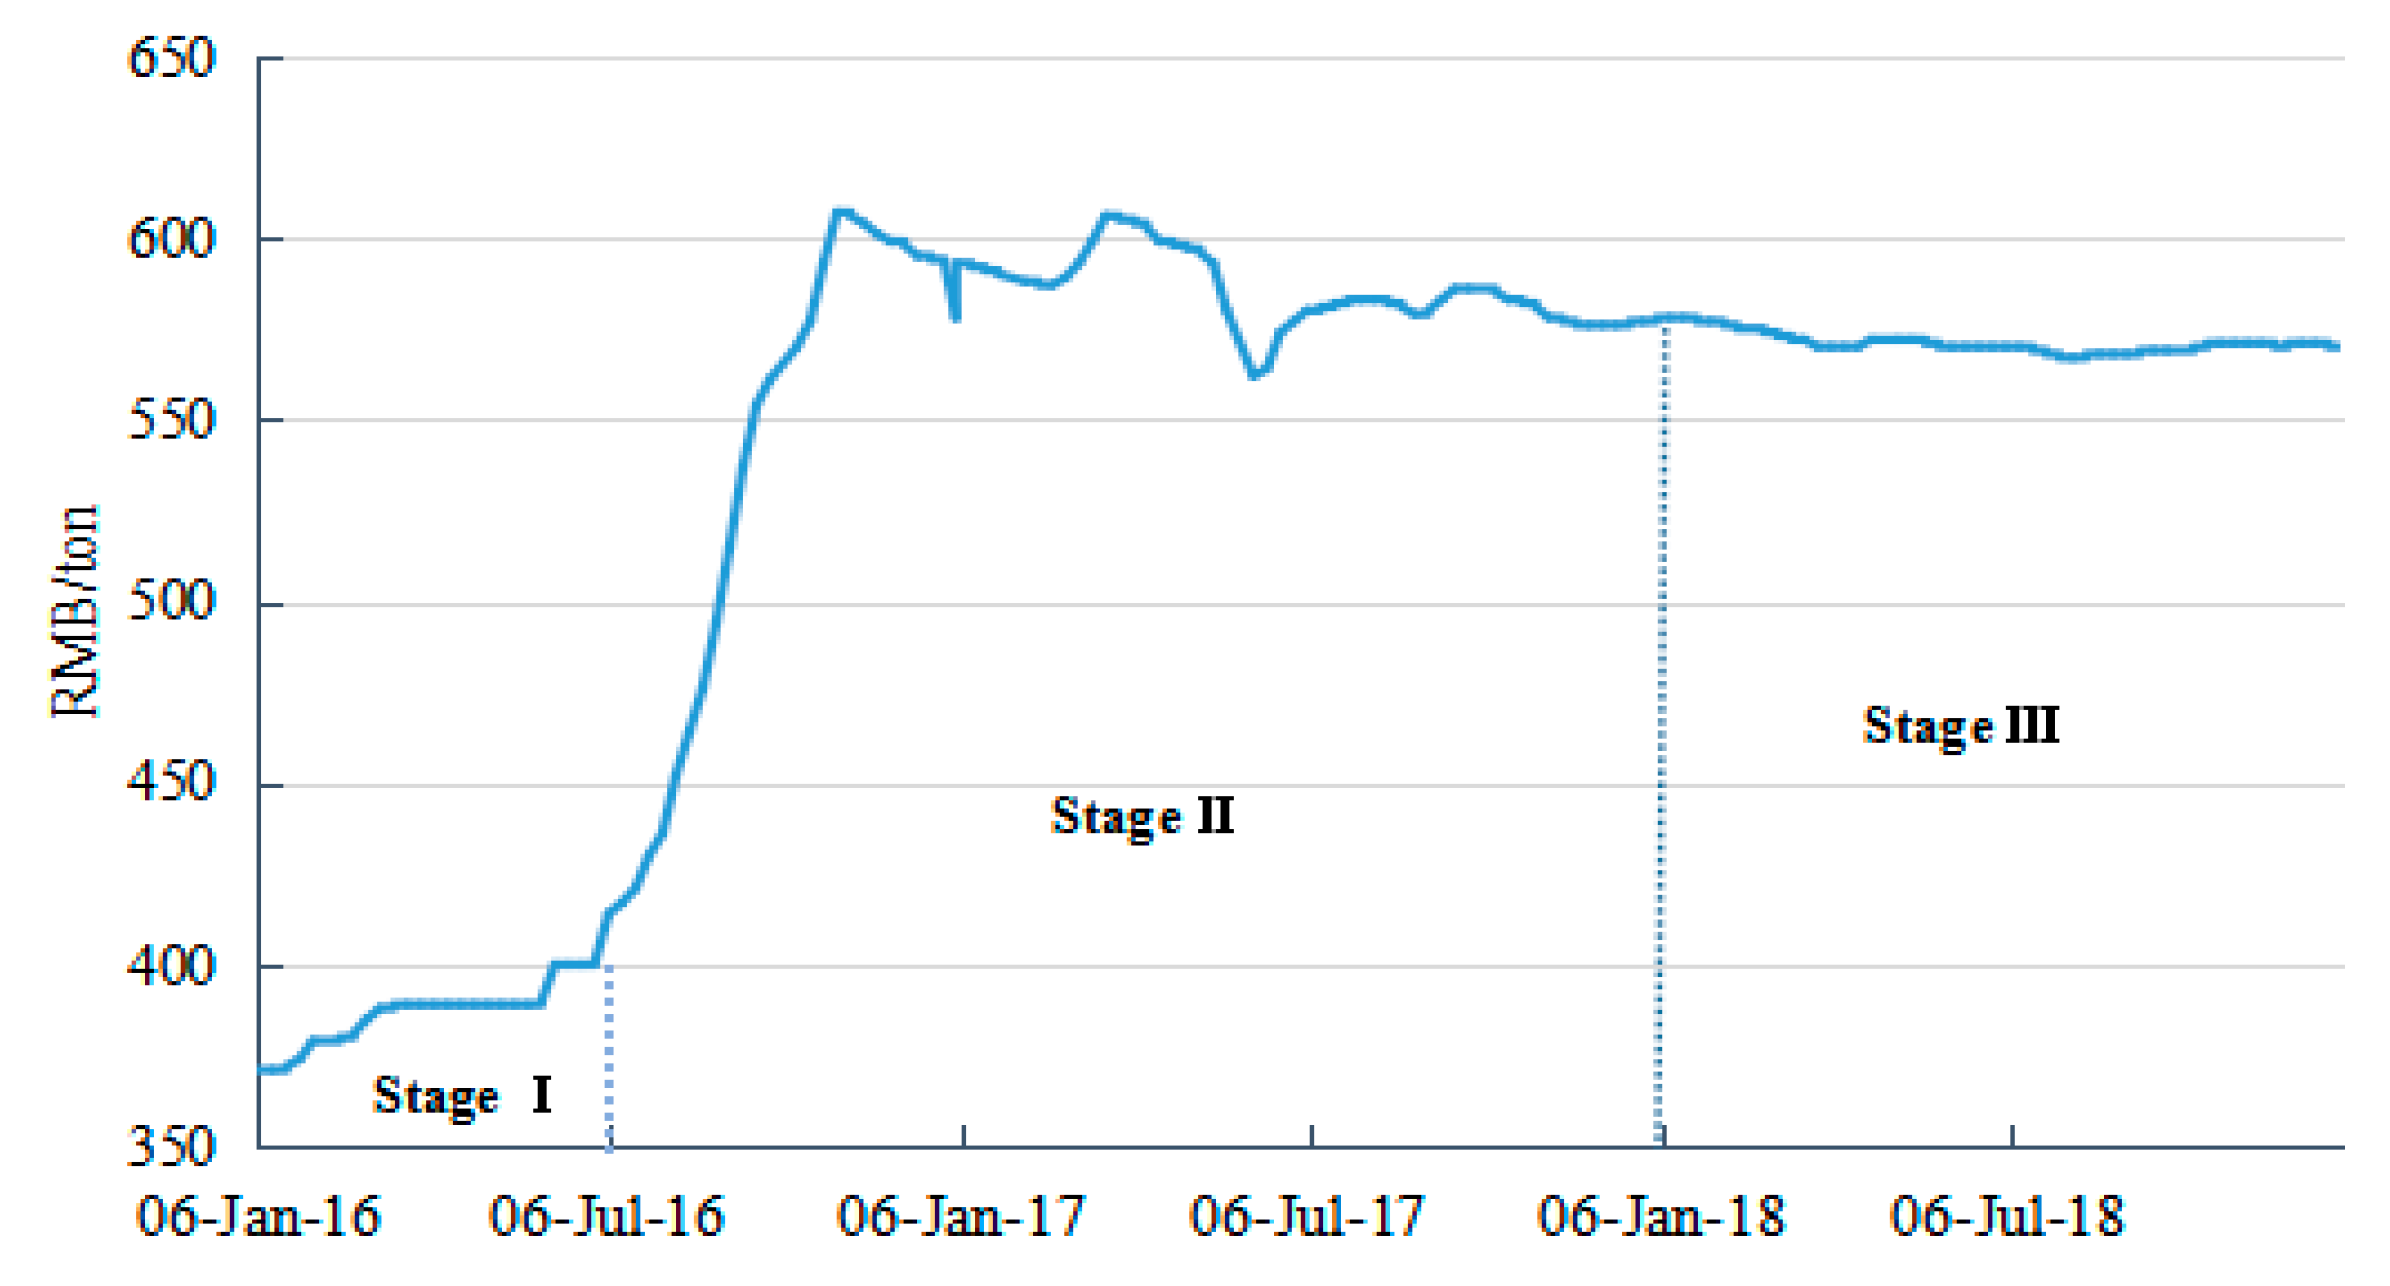
- According to the relationship between the coal de-capacity policy and coal market, the policy effect on the market can be divided into three stages. In the policy effect-taking stage, with the implementation of the de-capacity policy, coal supply started to decline, and coal price increased as expected; In the market rebound stage, affected by the de-capacity policy, coal supply continued to decline and coal price rose across the board. Later, with the release of high-quality production capacity to a certain extent, coal prices fell then stabilised. In the market adjustment stage, the de-capacity work was transformed into systematic and structural de-capacity, which promoted the stability of the coal market and the fluctuation of coal prices within the normal range.
- (3)
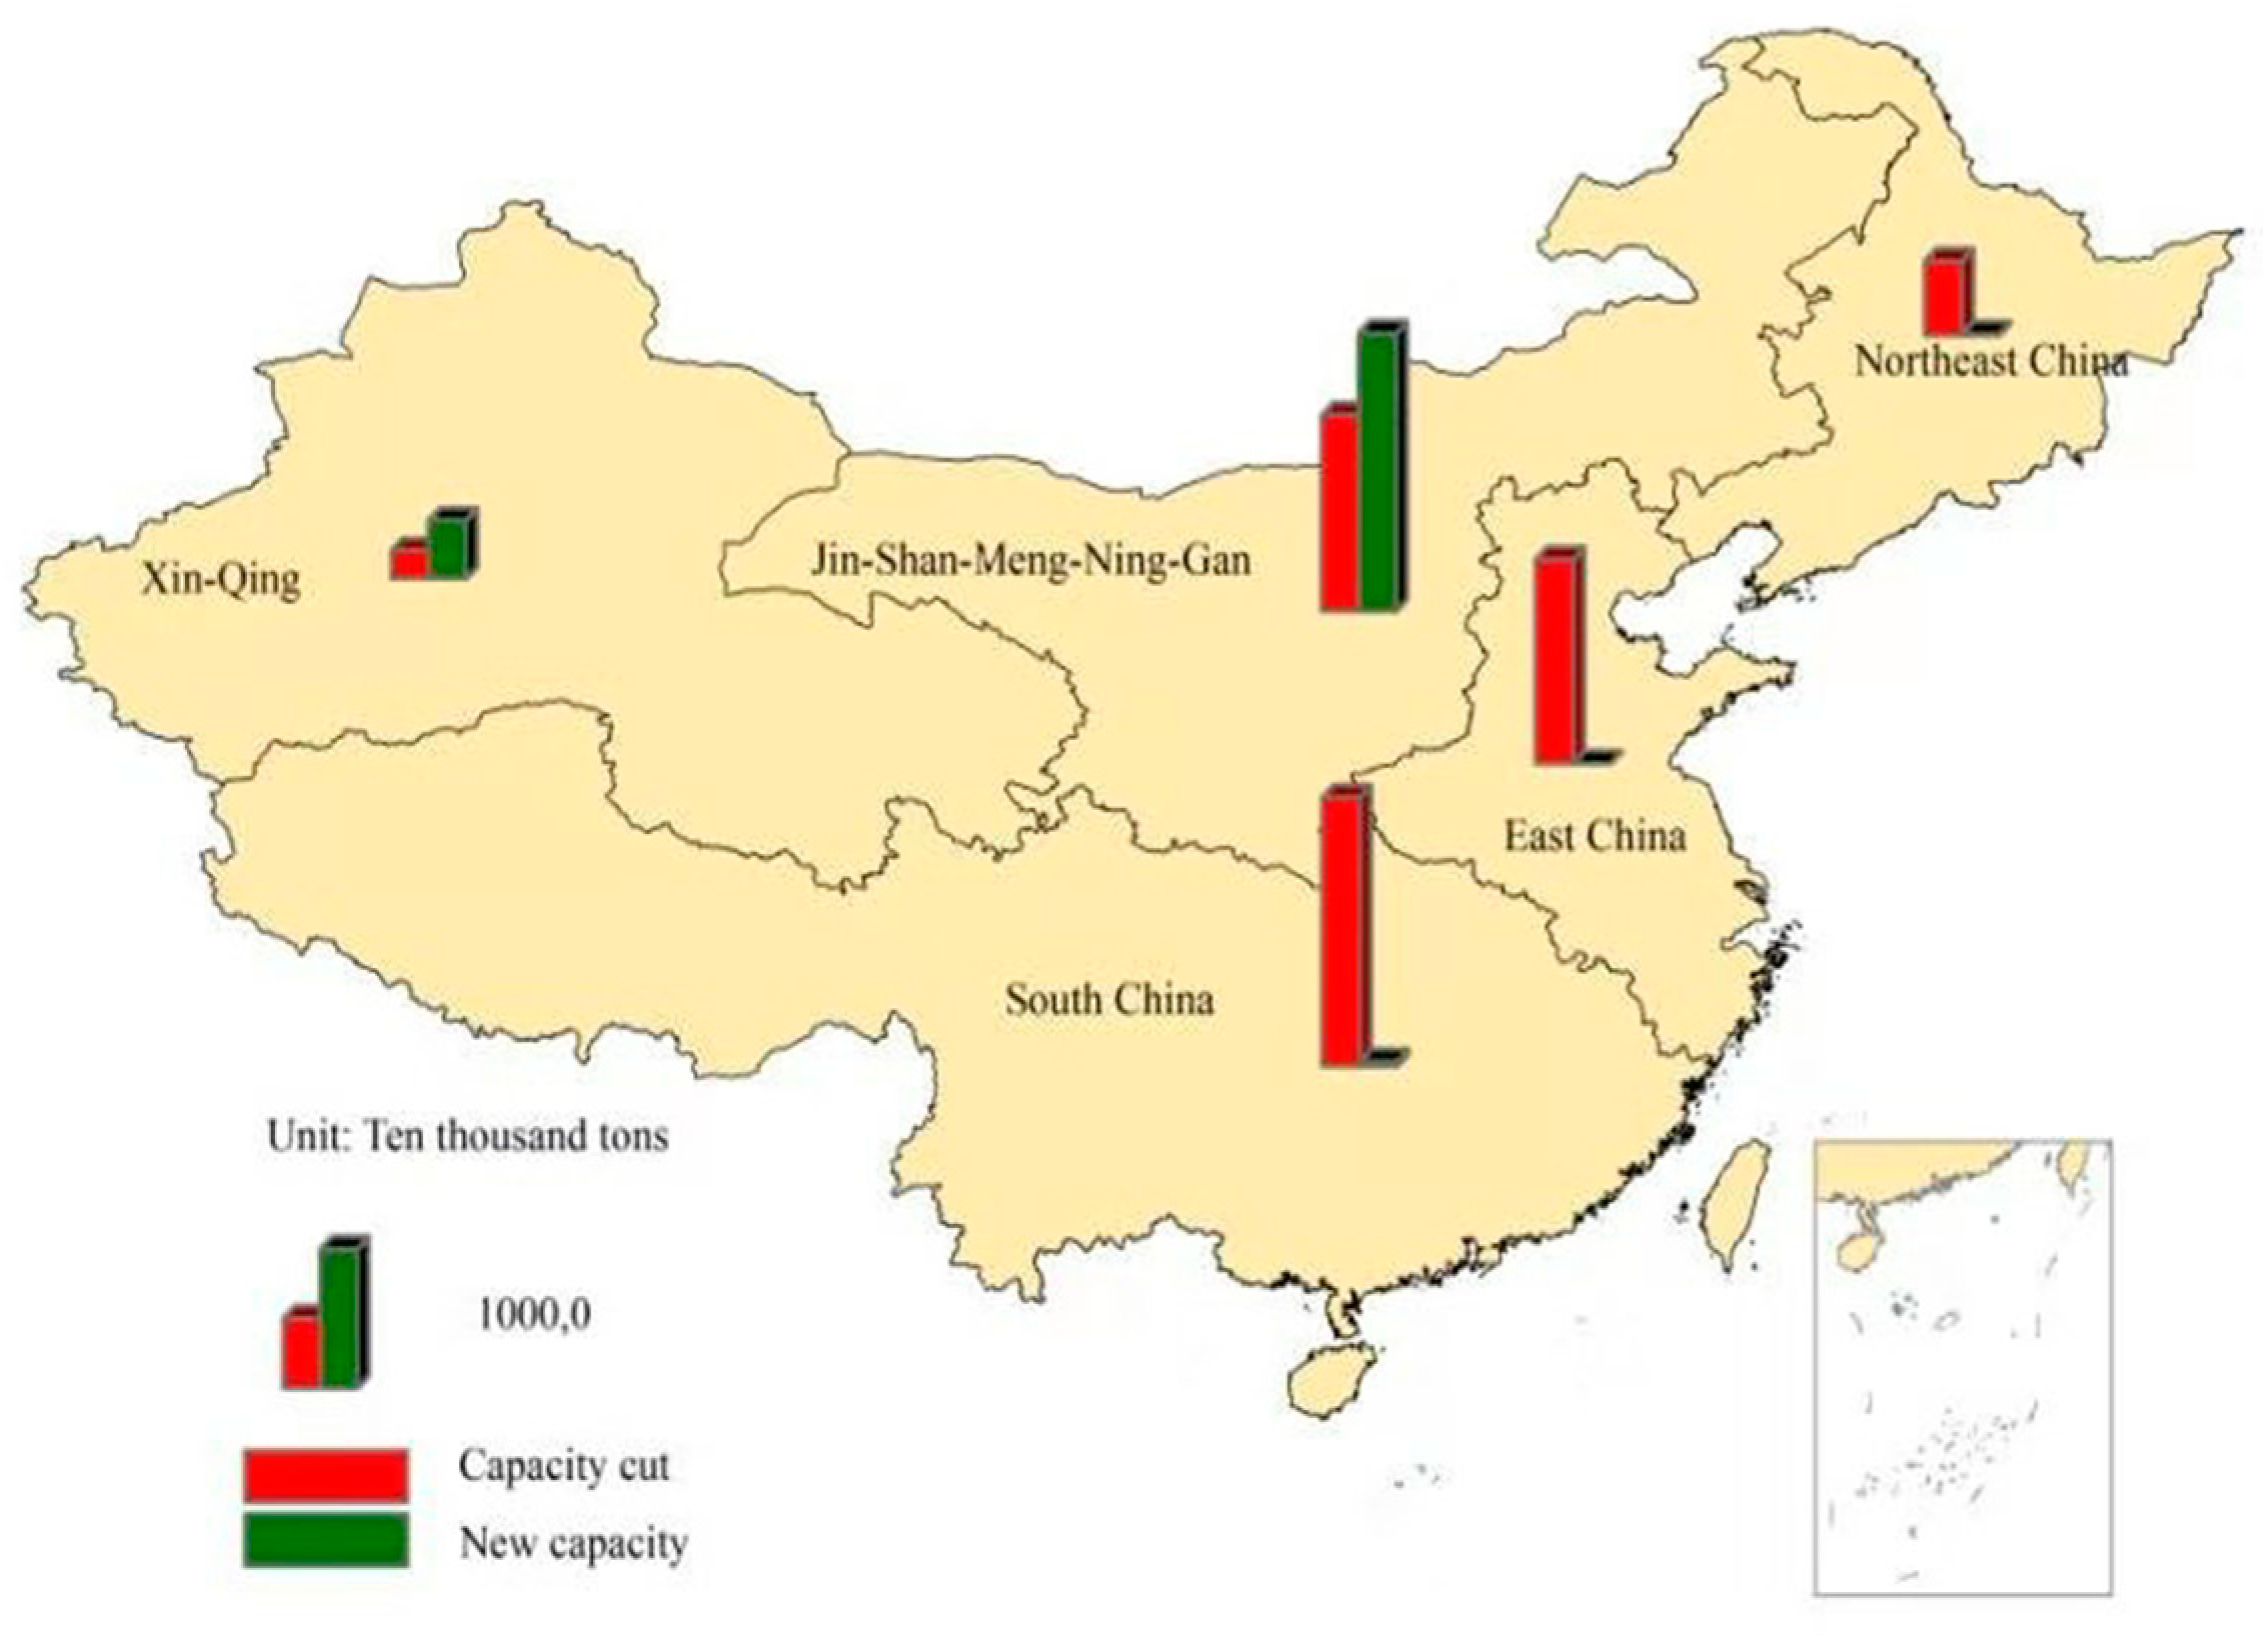
- There is ‘less production capacity reduction and more increase’ in western China and ‘more capacity reduction and less increase’ in central and eastern China. The centre of China’s coal production has shifted from the central and eastern regions to the west, the high-quality industrial development pattern of ‘structural de-capacity and systemic capacity optimisation’ was initially formed.
- (4)
- With the development of de-capacity work and the rational return of coal prices, the profitability of coal enterprises has been enhanced significantly, while the pace of mergers and acquisitions has improved the industrial concentration. At the same time, the international competitiveness of China’s coal enterprises has been significantly enhanced, and the level of safety production has continued to improve.
- (5)
- Due to regional heterogeneity, including resource reserves, the contribution of the coal industry to local GDP and policy compliance, there were obvious differences in various regions. Regional heterogeneity was likely to cause local governments and coal enterprises to respond differently to the de-capacity policy issued by the Central Government of China, resulting in varied regional coal production capacity and employee reductions.
5.2. Policy Implications
Author Contributions
Funding
Acknowledgments
Conflicts of Interest
References
- National Bureau of Statistics of China. China Statistical Yearbook 2017. Available online: http://www.stats.gov.cn/tjsj/ndsj/2017/indexeh.htm (accessed on 22 May 2019).
- Lin, J.; Fridley, D.; Lu, H.Y.; Price, L.; Zhou, N. Has coal use peaked in China: Near-term trends in China’s coal consumption. Energy Policy 2018, 123, 208–214. [Google Scholar] [CrossRef]
- BP. Statistical Review of World Energy 2018. Available online: https://www.bp.com/content/dam/bp/business-sites/en/global/corporate/pdfs/energy-economics/statistical-review/bp-stats-review-2018-full-report.pdf (accessed on 21 May 2019).
- National Development and Reform Commission (NDRC). The 13th Five-Year Development Plan for the Coal Industry. Available online: http://www.ndrc.gov.cn/fzgggz/fzgh/ghwb/gjjgh/201706/t20170605_850004.html (accessed on 17 November 2018).
- Development Research Center of the State Council (DRC). Eight Major Issues Relating to China’s Economic Development in 2016. Available online: http://www.chinadaily.com.cn/m/drc/2016-04/06/content_24325077.htm (accessed on 18 November 2018).
- State Council. The Opinions on Resolving the Overcapacity Problem of the Coal Industry to Realize Development by Extricating the Coal Industry from Difficulties. Available online: http://www.gov.cn/zhengce/content/2016-02/05/content_5039686.htm (accessed on 20 November 2018).
- Cong, W.; Chen, H.L.; Zhao, L.X. The Mode Selection of China’s Regulation Policy of Coal Industry Productivity, 1st ed.; China Economic Press House: Beijing, China, 2016; pp. 114–125. [Google Scholar]
- Han, G.G.; Gao, T.M.; Wang, L.G.; Qi, Y.F.; Wang, X.S. Research on measurement, volatility and causes of excess production capacity of Chinese manufacturing industries. Econ. Res. J. 2011, 46, 18–31. (In Chinese) [Google Scholar]
- Yang, Q.; Hou, X.C.; Zhang, L. Measurement of natural and cyclical excess capacity in China’s coal industry. Energy Policy 2018, 118, 270–278. [Google Scholar] [CrossRef]
- Lu, F. Fighting against excess capacity: 1999–2009. In Proceedings of the 19th Conference of CCER China Economic Observer, Beijing, China, 23 October 2009. (In Chinese). [Google Scholar]
- Yang, Q.; Hou, X.C.; Han, J.S.; Zhang, L. The drivers of coal overcapacity in China: An empirical study based on the quantitative decomposition. Resour. Conserv. Recycl. 2019, 141, 123–132. [Google Scholar] [CrossRef]
- Yang, Z. The formation mechanism of overcapacity and its governance research in the perspective of incentive distortion. Economist 2013, 10, 48–54. (In Chinese) [Google Scholar]
- Shi, X.P.; Rioux, B.; Galkin, P. Unintended consequences of China’s coal capacity cut policy. Energy Policy 2018, 113, 478–486. [Google Scholar] [CrossRef]
- Zhang, Y.F.; Zhang, M.; Liu, Y.; Nie, R. Enterprise investment, local government intervention and coal overcapacity: The case of China. Energy Policy 2017, 101, 162–169. [Google Scholar] [CrossRef]
- Hao, Y.; Zhang, Z.Y.; Liao, H.; Wei, Y.M. China’s farewell to coal: A forecast of coal consumption through 2020. Energy Policy 2015, 86, 444–455. [Google Scholar] [CrossRef]
- Kirkley, J.; Catherine, J.; Morrison, P.; Dale, S. Capacity and capacity utilization in common-pool resource industries. Environ. Resour. Econ. 2002, 22, 71–97. [Google Scholar] [CrossRef]
- Lin, Y.F. Wave phenomenon and the reconstruction of macroeconomic theories for developing countries. Econ. Res. J. 2007, 1, 126–131. (In Chinese) [Google Scholar]
- Lin, Y.F.; Wu, H.M.; Xing, Y.Q. “Wave phenomena” and formation of excess capacity. Econ. Res. J. 2010, 10, 4–19. (In Chinese) [Google Scholar]
- Barzel, Y. Excess capacity in monopolistic competition. J. Polit. Econ. 1970, 78, 1142–1149. [Google Scholar] [CrossRef]
- Boyle, G.W.; Guthrie, G.A. Investment, uncertainty, and liquidity. J. Financ. 2003, 58, 2143–2166. [Google Scholar] [CrossRef]
- Mason, R.; Weeds, H. Investment, uncertainty and preemption. Int. J. Ind. Organ. 2010, 28, 278–287. [Google Scholar] [CrossRef]
- Shi, X.P. China’s small coal mine policy in the 2000s: A case study of trusteeship and consolidation. Resour. Policy 2013, 38, 598–604. [Google Scholar] [CrossRef]
- Sun, W.; He, B.; Wu, Z. The hoarding effects of existing excessive industrial production capacity: Mathematical analysis and empirical evidence. Jilin Univ. J. Soc. Sci. Ed. 2008, 1, 68–75. (In Chinese) [Google Scholar]
- He, B. Research on the Forming Mechanism and Volatile Features of Excess Capacity Based on Hoarding Behavior. Ph.D. Thesis, Jilin University, Changchun, Jilin, China, 2008. (In Chinese). [Google Scholar]
- Wang, W.F.; Ming, J.; Yue, C.Y. Enterprise scale, local government intervention and overcapacity. Manag. World 2014, 10, 17–36. (In Chinese) [Google Scholar]
- Zhou, L.A. The incentive and cooperation of government officials in the political tournaments: An interpretation of the prolonged local protectionism and duplicative investments in China. Econ. Res. J. 2004, 6, 33–40. (In Chinese) [Google Scholar]
- Wang, L.G.; Ju, L. Local government intervention, enterprise overinvestment and over capacity: 26 industry samples. Reform 2012, 12, 52–62. (In Chinese) [Google Scholar]
- Zhou, J.; Fu, B.Z. Suggestions on the formation mechanism and countermeasures of overcapacity in industries. Macroecon. Manag. 2011, 6, 33–35. (In Chinese) [Google Scholar]
- Liu, H.; Sun, Z. A research review on the occurrence mechanism of the underutilization of production capacity. Comp. Econ. Soc. Syst. 2016, 3, 186–195. (In Chinese) [Google Scholar]
- Zhou, J.; Fu, B.Z. The connotation, evaluation system and performance characteristics of overcapacity in China’s industrial field. Econ. Perspect. 2011, 10, 58–64. (In Chinese) [Google Scholar]
- Zhang, X.H.; Wang, N. The cognitive bias of enterprises and production capacity excess. Sci. Res. Manag. 2009, 30, 33–39. (In Chinese) [Google Scholar]
- Eissa, M.M. Demand side management program evaluation based on industrial and commercial field data. Energy Policy 2011, 39, 5961–5969. [Google Scholar] [CrossRef]
- Giuffrida, A.; Romano, M.C.; Lozza, G.G. Thermodynamic assessment of IGCC power plants with hot fuel gas desulfurization. Appl. Energy 2010, 87, 3374–3383. [Google Scholar] [CrossRef]
- Siefert, N.S.; Narburgh, S.; Chen, Y. Comprehensive exergy analysis of three IGCC power plant configurations with CO2 capture. Energies 2019, 9, 669. [Google Scholar] [CrossRef]
- Xu, G.Q.; Dong, X.Q. The control of scattered coal combustion in Beijing-Tianjin-Hebei region based on a cooperative game model. Econ. Probl. 2017, 2, 45–64. (In Chinese) [Google Scholar]
- Hou, F.F.; Hou, Z.B. The influences and consequences of “coal to gas” in Taiyuan City. Manag. Adm. 2018, 9, 55–65. (In Chinese) [Google Scholar]
- Wu, H.M.; Guo, H.D.; Li, B.T. Quantitative research on Chinese existing building energy-saving policy from the perspective of policy instruments. Constr. Econ. 2019, 40, 110–116. (In Chinese) [Google Scholar]
- Xu, X.Y.; Ren, M.; Gao, J.L. Technology path of energy conservation and CO2 emissions reduction of iron and steel industry in Jing-Jin-Ji. Ecol. Econ. 2017, 33, 38–43. (In Chinese) [Google Scholar]
- Xu, Q.Y. Development and impact of overcapacity reduction policies. Int. Econ. Rev. 2018, 2, 68–81. (In Chinese) [Google Scholar]
- Deng, Z.Q.; Liu, M.L.; Pang, R.Z. Estimation of capacity utilization and policy evaluation of China’s iron and steel industries. J. China Univ. Geosci. 2018, 18, 131–142. (In Chinese) [Google Scholar]
- Yang, T.; Fan, J.L. Mid-term analysis of the effect of supply side reform policies in the coal industry. Coal Econ. Res. 2018, 38, 11–15. (In Chinese) [Google Scholar]
- Zhang, Y.F.; Nie, R.; Shi, R.Y.; Zhang, M. Measuring the capacity utilization of the coal sector and its decoupling with economic growth in China’s supply-side reform. Resour. Conserv. Recycl. 2018, 129, 314–325. [Google Scholar] [CrossRef]
- Wang, D.L.; Wan, K.D.; Song, X.F.; Liu, Y. Provincial allocation of coal de-capacity targets in China in terms of cost, efficiency, and fairness. Energy Econ. 2019, 78, 109–128. [Google Scholar] [CrossRef]
- Tencent Network. Coal industry: The Total Capacity Reduction Program Was Introduced, and the Policy Effect Is to Be Observed. Available online: https://new.qq.com/cmsn/20160218/20160218011050 (accessed on 18 November 2018).
- Bai, M. Supply side reform of the coal industry: Core tasks and reform outlook. Price Theory Pract. 2016, 8, 33–37. (In Chinese) [Google Scholar]
- China Economic Herald. Capacity Cut in 2018: From the Total Capacity Reduction to the Capacity Structure Optimisation in Coal and Steel Industries. Available online: http://www.ceh.com.cn/epaper/uniflows/html/2018/12/20/02-03/02-03_62.htm (accessed on 22 November 2018).
- Central People’s Government. Government Work Reports (2017–2019). Available online: http://www.gov.cn/guowuyuan/baogao.htm (accessed on 16 March 2019).
- Qin, R.J.; Ren, S.H.; Chen, Q. Study on development and utilization path of closed (abandoned) coal mines in China. Coal Econ. Res. 2017, 37, 31–35. (In Chinese) [Google Scholar]
- China Coal News. How Does the Coal De-Capacity Policy Affect the Market in Stages? Available online: http://www.ccoalnews.com/201808/27/c85862.html (accessed on 25 November 2018).
- China Coal Market Net. Bohai-Rim Steam-Coal Price Index (BSPI). Available online: https://www.cctd.com.cn/index.php?m=content&c=index&a=lists&catid=470&htmlname=HBHCKJ (accessed on 16 March 2019).
- Xie, H.P.; Wang, J.H.; Shen, B.H.; Liu, J.; Jiang, P.F.; Zhou, H.W.; Liu, H.; Wu, G. New idea of coal mining: Scientific mining and sustainable mining capacity. J. China Coal Soc. 2012, 37, 1069–1079. (In Chinese) [Google Scholar]
- China Industry Information Net. Analysis of China’s Coal Output and Market Demand in 2018. Available online: http://www.chyxx.com/industry/201805/641745.html (accessed on 22 November 2018).
- Economic Information Daily. State-Owned Coal Enterprise Reform is Fermenting, and the Asset Securitization is Accelerating. Available online: http://dz.jjckb.cn/www/pages/webpage2009/html/2017-02/16/content_28564.htm (accessed on 24 November 2018).
- NetEase Finance. Total Profit of Coal Enterprises above Designated Size was 255.9 Billion in 2017. Available online: http://money.163.com/18/0327/19/DDU95QP200258105.html (accessed on 24 November 2018).
- Hexun Net. Financial Statements of China’s Coal Industry Continued to Be Repaired, but the Internal Distribution Was Different. Available online: http://news.hexun.com/2018-12-28/195695029.html (accessed on 25 November 2018).
- China Coal Market Net. The Energy Enterprise Global Competitiveness Report 2017. Available online: https://www.cctd.com.cn/show-22-177680-1.html,%202018-01-31/2018-03-12 (accessed on 28 November 2018).
- West Coal Net. Read the 2016 Coal Mine Safety Production Transcript. Available online: https://www.westcoal.com.cn/mod/view.php?aid=2722 (accessed on 30 November 2018).
- Xinhua Net. In 2017, There Were 219 Coal Mine Accidents with 375 Deaths in China. Available online: http://www.xinhuanet.com/2018-01/29/c_1122336631.htm (accessed on 31 November 2018).
- SXcoal Net. China’s Death Rate per Million Tons Coal in 2018 was 0.093, and Fell below 0.1 for the First Time. Available online: http://www.sxcoal.com/news/4585979/info (accessed on 10 June 2019).
- China Daily. Revisiting Deng and the Socialist Market Economy. Available online: http://www.chinadaily.com.cn/opinion/2014-08/20/content_18455806.htm (accessed on 10 June 2019).


| Year | Total Enterprises | Loss-Making Enterprises | Loss Rate (%) | Total Profit (hundred million yuan) |
|---|---|---|---|---|
| 2011 | 7611 | 845 | 11.10 | 4342 |
| 2012 | 7790 | 1290 | 16.56 | 3555 |
| 2013 | 7975 | 1788 | 22.12 | 2370 |
| 2014 | 7098 | 1929 | 27.18 | 1268 |
| 2015 | 6430 | 2027 | 31.52 | 441 |
| Year | 2016 | 2017 | 2018 | Total |
|---|---|---|---|---|
| Plan target | 2.5 | 1.5 | 1.5 | 5.5 |
| Actual completion | 2.9 | 2.5 | 0.8 * | 6.2 |
| Mine Property | Mine Scale | Quantity Proportion (%) | Capacity Proportion (%) |
|---|---|---|---|
| State-owned | Large and medium | 13 | 36 |
| Small-scale (< 300 kt) | 60 | 45 | |
| others | — | 27 | 19 |
| Rank | 2016 | 2017 | 2018 | |||
|---|---|---|---|---|---|---|
| Group | Output | Group | Output | Group | Output | |
| 1 | Shenhua Group | 43,149 | Shenhua Group | 44,072 | China Energy Group | 51,200 |
| 2 | China Coal Group | 13,323 | China Coal Group | 16,368 | China Coal Group | 19,000 |
| 3 | Shandong Energy Group | 13,050 | Shandong Energy Group | 14,139 | YANKUANG Group | 16,100 |
| 4 | Shaanxi Coal Chemical Industry Group | 12,593 | Shaanxi Coal Chemical Industry Group | 14,010 | Shaanxi Coal Chemical Industry Group | 16,000 |
| 5 | Datong Coal Mine Group | 11,786 | YANKUANG Group | 13,511 | Shandong Energy Group | 14,500 |
| 6 | YANKUANG Group | 11,415 | Datong Coal Mine Group | 12,700 | Datong Coal Mine Group | 13,700 |
| 7 | Shanxi Coking Coal Group | 9151 | Shanxi Coking Coal Group | 9609 | Shanxi Coking Coal Group | 10,000 |
| 8 | Jizhong Energy Group | 8009 | Yangquan Coal Industry Group | 8200 | Shanxi Jinneng Group | 8081 |
| China’s coal output | 336,398 | China’s coal output | 344,500 | China’s coal output | 354,610 | |
| CR8 | 36.41% | 38.50% | 41.90% | |||
| Region | Contribution to Local GDP (%) | Production Reduction (1000 tons) | Production Reduction Rate (%) | Employees Reduction (1000 persons) | Employees Reduction Rate (%) |
|---|---|---|---|---|---|
| Shanxi | 32.02 | 13636.23 | 14.10 | 3.00 | 3.13 |
| Inner Mongolia | 18.37 | 6398.17 | 7.03 | 1.39 | 6.37 |
| Ningxia | 14.87 | 906.48 | 11.37 | 0.83 | 12.83 |
| Guizhou | 13.36 | 354.35 | 2.06 | 2.48 | 9.92 |
| Shaanxi | 11.78 | 1010.10 | 1.92 | 2.13 | 9.94 |
| Gansu | 3.47 | 145.34 | 3.30 | 0.53 | 7.43 |
| Henan | 3.14 | 1649.18 | 12.13 | 3.45 | 7.54 |
| Hebei | 2.75 | 952.73 | 12.81 | 0.35 | 1.85 |
| Anhui | 2.69 | 1168.56 | 8.72 | 3.57 | 13.00 |
| Sichuan | 2.53 | 241.64 | 3.77 | 2.52 | 12.44 |
| Shandong | 2.43 | 1402.53 | 9.86 | 8.95 | 18.98 |
| Yunnan | 2.26 | 597.57 | 11.53 | 1.03 | 11.46 |
| Xinjiang | 2.24 | -851.62 | -5.59 | 1.03 | 18.33 |
| Heilongjiang | 1.66 | 660.65 | 10.08 | 0.69 | 3.52 |
| Jilin | 1.44 | 950.38 | 36.08 | 0.94 | 12.11 |
| Chongqing | 1.41 | 1124.82 | 31.58 | 3.44 | 27.09 |
| Hunan | 1.22 | 771.42 | 21.68 | 3.42 | 27.74 |
| Liaoning | 0.91 | 582.65 | 12.26 | 0.66 | 4.43 |
| Qinghai | 0.90 | 29.16 | 3.57 | 0.18 | 23.08 |
| Jiangxi | 0.67 | 713.94 | 31.44 | 1.77 | 25.73 |
| Fujian | 0.38 | 207.04 | 13.01 | 0.72 | 19.00 |
| Guangxi | 0.31 | -7.05 | -1.66 | -0.32 | -36.78 |
| Jiangsu | 0.25 | 550.99 | 28.71 | 1.15 | 16.04 |
| Hubei | 0.19 | 266.01 | 30.94 | 0.89 | 38.20 |
| Beijing | 0.08 | 132.48 | 29.43 | 0.30 | 28.57 |
© 2019 by the authors. Licensee MDPI, Basel, Switzerland. This article is an open access article distributed under the terms and conditions of the Creative Commons Attribution (CC BY) license (http://creativecommons.org/licenses/by/4.0/).
Share and Cite
Hao, X.; Song, M.; Feng, Y.; Zhang, W. De-Capacity Policy Effect on China’s Coal Industry. Energies 2019, 12, 2331. https://doi.org/10.3390/en12122331
Hao X, Song M, Feng Y, Zhang W. De-Capacity Policy Effect on China’s Coal Industry. Energies. 2019; 12(12):2331. https://doi.org/10.3390/en12122331
Chicago/Turabian StyleHao, Xuguang, Mei Song, Yunan Feng, and Wen Zhang. 2019. "De-Capacity Policy Effect on China’s Coal Industry" Energies 12, no. 12: 2331. https://doi.org/10.3390/en12122331
APA StyleHao, X., Song, M., Feng, Y., & Zhang, W. (2019). De-Capacity Policy Effect on China’s Coal Industry. Energies, 12(12), 2331. https://doi.org/10.3390/en12122331