Article

Study on the Movement and Deposition of Particles in Supercritical Water Natural Circulation Based on Grey Correlation Theory

1
School of Nuclear Science and Engineering, North China Electric Power University, Beijing 102206, China
2
Institute of Nuclear Thermal-hydraulic Safety and Standardization, North China Electric Power University, Beijing 102206, China
3
Beijing Key Laboratory of Passive Safety Technology for Nuclear Energy, North China Electric Power University, Beijing, 102206, China
*
Author to whom correspondence should be addressed.
Energies 2019, 12(12), 2315; https://doi.org/10.3390/en12122315
Submission received: 6 May 2019 / Revised: 13 June 2019 / Accepted: 13 June 2019 / Published: 17 June 2019
(This article belongs to the Section I: Energy Fundamentals and Conversion)

Abstract

:
The movement and deposition of particles that occur during their natural circulation in supercritical water exercise an important impact on the safe and stable operation of a supercritical water reactor (SCWR). When supercritical water flows in pipelines, a large number of corrosive particles may be generated due to pipeline corrosion or the purity of the fluid itself. The presence of particulate matter affects the heat transfer efficiency of the pipeline, increasing flow resistance and easily promoting heat transfer deterioration. ANSYS-CFX numerical analysis software was used to simulate the natural circulation loop of supercritical water, and micron particles were added in the initial flow field. The effects of heating power, particle concentration and particle diameter on particle deposition were obtained. Through this analysis, it can be concluded that the heating of the pipeline has a certain inhibitory effect on the deposition of particles. The rise in both initial particle concentration and particle diameter serve to reinforce the deposition of particles in the heating section. Depending on the degree of influence, the contributory parameters to particle deposition include particle diameter, particle concentration and heating power in turn.

1. Introduction

Supercritical Water Reactor (SCWR) is the only water reactor among the six types of fourth generation reactors selected in the world, which has high power generation efficiency, thermal efficiency, economy and safety. Meanwhile, natural circulation is an important part of the passive safety system in SCWR, which relies on the density difference between hot and cold sections to drive fluid flow and discharge waste heat. However, when supercritical water flows in pipelines, a large number of corrosive particles may be generated due to pipeline corrosion or the purity of the fluid itself. The presence of particulate matter affects the heat transfer efficiency of the pipeline, increasing flow resistance and easily causing heat transfer deterioration. When corrosive particles accumulate to a certain extent in the wall, there is a difference in thermal expansion between the inner wall surface and the outer oxide layer, resulting in the fact that the inner wall of the pipeline will begin to peel off, seriously affecting the safe and stable operation for the reactor. This paper mainly studies and analyzes the natural circulation in supercritical water reactors. Keigo Karakama et al. [1] used a direct current flow device to study the deposition and migration of magnetite particles in supercritical water. Particle deposition characteristics were obtained by measuring wall temperature. Dongliang Ma, Tao Zhou et al. [2] analyzed the effects of heating power, inlet temperature, inlet velocity and other parameters on fine particles in supercritical water using numerical simulation. Zhao Xiao et al. [3] simulated the diffusion of hydrogen in water from ambient temperature to supercritical temperature by molecular dynamics method. The results demonstrated that the diffusion coefficient under supercritical condition is very consistent with the Arrhenius equation, and the calculated activation energy is 19.41 kJ/mol. Jialun Liu et al. [4] established a time-domain model suitable for a parallel multi-channel system with supercritical water (the number of channels is more than 2). The present model split the flow domain along each channel into a series of collocated grids, and adopted an iterative solution to solve the coupling among multiple channels. Through simulation research, the effects of adding the perturbation in different ways, system pressure and inlet-fluid temperature in a parallel multi-channel system under supercritical pressure were investigated. Xiaozhuang Liu et al. [5] used grey theory and multiple regression method to establish GM (1.1), GM (1.3) and multiple regression models of supercritical water heat transfer coefficient by using MATLAB code, considering the effects of coolant temperature and enthalpy, heat flux density and system pressure. Jiaming Liu et al. [6] performed a study on the turbulent flow heat transfer of supercritical water in buoyant and non-buoyant risers by using direct numerical simulation method. The results demonstrated that the large performance change near the wall seriously affected the heat transfer in supercritical water, especially forced convection. As the rapid development of thermal boundary layer, the acceleration of flow caused by thermal expansion has an obvious inhibitory effect on turbulence, but has little effect on heat transfer, considering the effects of mass flow rate, pipe diameter and pressure. Xiangfei Kong et al. [7] established an experimental database for heat transfer in supercritical water and a new standard for heat transfer deterioration in supercritical water. Wenyu Wang et al. [8,9] performed a study on the instability of steam-water two-phase flow in a smooth pipe with a horizontal inclination of 20 degrees. They conducted preliminarily analysis of the influences exerted by pressure, mass flow, inlet and outlet throttling, inlet subcooling and compressible volume by suggesting the boundary conditions of pressure drop oscillation and density wave oscillation. X. Cheng et al. [10] performed research to derive the formulas purposed for the prediction of the heat transfer of supercritical water under the conditions of given heat flux and given wall flour temperature respectively. It was discovered that the case of the given wall temperature has better prediction accuracy than the case of given heat flow. AttilaKiss et al. [11] designed and manufactured a small-sized closed natural circulation loop. Further with the results obtained from the measurement series, it was discovered that the criteria of heat transfer deterioration elaborated for forced convection is not only ineffective for the natural circulation of supercritical water, but fails to offer clear guidance on the heat transfer regime occurring in natural circulation. Liao et al. [12,13] performed a 3D CFD simulation on the flash flow phenomenon in a converging-diverging nozzle and attempted to trace the evolution of the bubble size distribution using poly-disperse simulations. Zhimin Ha et al. [14] performed a study on the deposition of fly ash particles in the three-dimensional rectangular heat transfer channel using numerical simulation. Through the analysis of the calculation results, the effects of inlet velocity and particle diameter on the deposition efficiency of each wall of the rectangular channel were obtained. Yu Li et al. [15] proposed a method combining direct numerical simulation with Lagrangian particle tracking for the transport and deposition of polydisperse micron-sized particles in low Reynolds number horizontal turbulence. The results demonstrated that for large particles, gravity played a major role in the deposition of particles with low Reynolds number turbulence. For small particles, the deposition is mainly determined by turbulence and Brownian motion. Hao Lu et al. [16] performed a study on movement and deposition of particles in gas flow in expansion and contraction pipelines. Peng Li et al. [17] performed a study on dissociation processes of gas hydrate-bearing sediment particles in water flow condition. Fei Zhang et al. [18] performed a study on the effect of mainstream velocity and mainstream temperature on the behavior of deposition on a flat plate surface experimentally. Kiao Inthavong, Yen-Cheng Chang, and C Tao et al. [19,20,21] studied the deposition movement of particulate matter in different pipelines. It was discovered that the deposition efficiency of particulate matter in different pipelines was not the same, affected by the geometric shape, bending degree and inclination degree of the pipelines. Frederix E M A, Lixing Jia, Lintermann A et al. [22,23,24] simulated the deposition of particulate matter in human bronchial passages, which showed the effects of particle diameter, shape, mixing and other parameters on deposition efficiency. Currently, the research work mainly focuses on the heat transfer characteristics of supercritical water natural circulation and the movement of particles in supercritical water, while the research on deposition movement of particles in natural circulation of supercritical water is insufficient. Considering the fact of that, in the present work a numerical simulation method was used to analyze the law of particle deposition and movement in natural circulation of supercritical water, which was verified by experimental data of Keigo Karakama [1]. Based on the calculation results, the effects of heating power, particle diameter and particle concentration on the deposition were analyzed by using the grey correlation degree to provide the correlation between each factor and sedimentation. It is of great significance to the safe and normal operation of a supercritical water reactor (SCWR).

2. Research Object

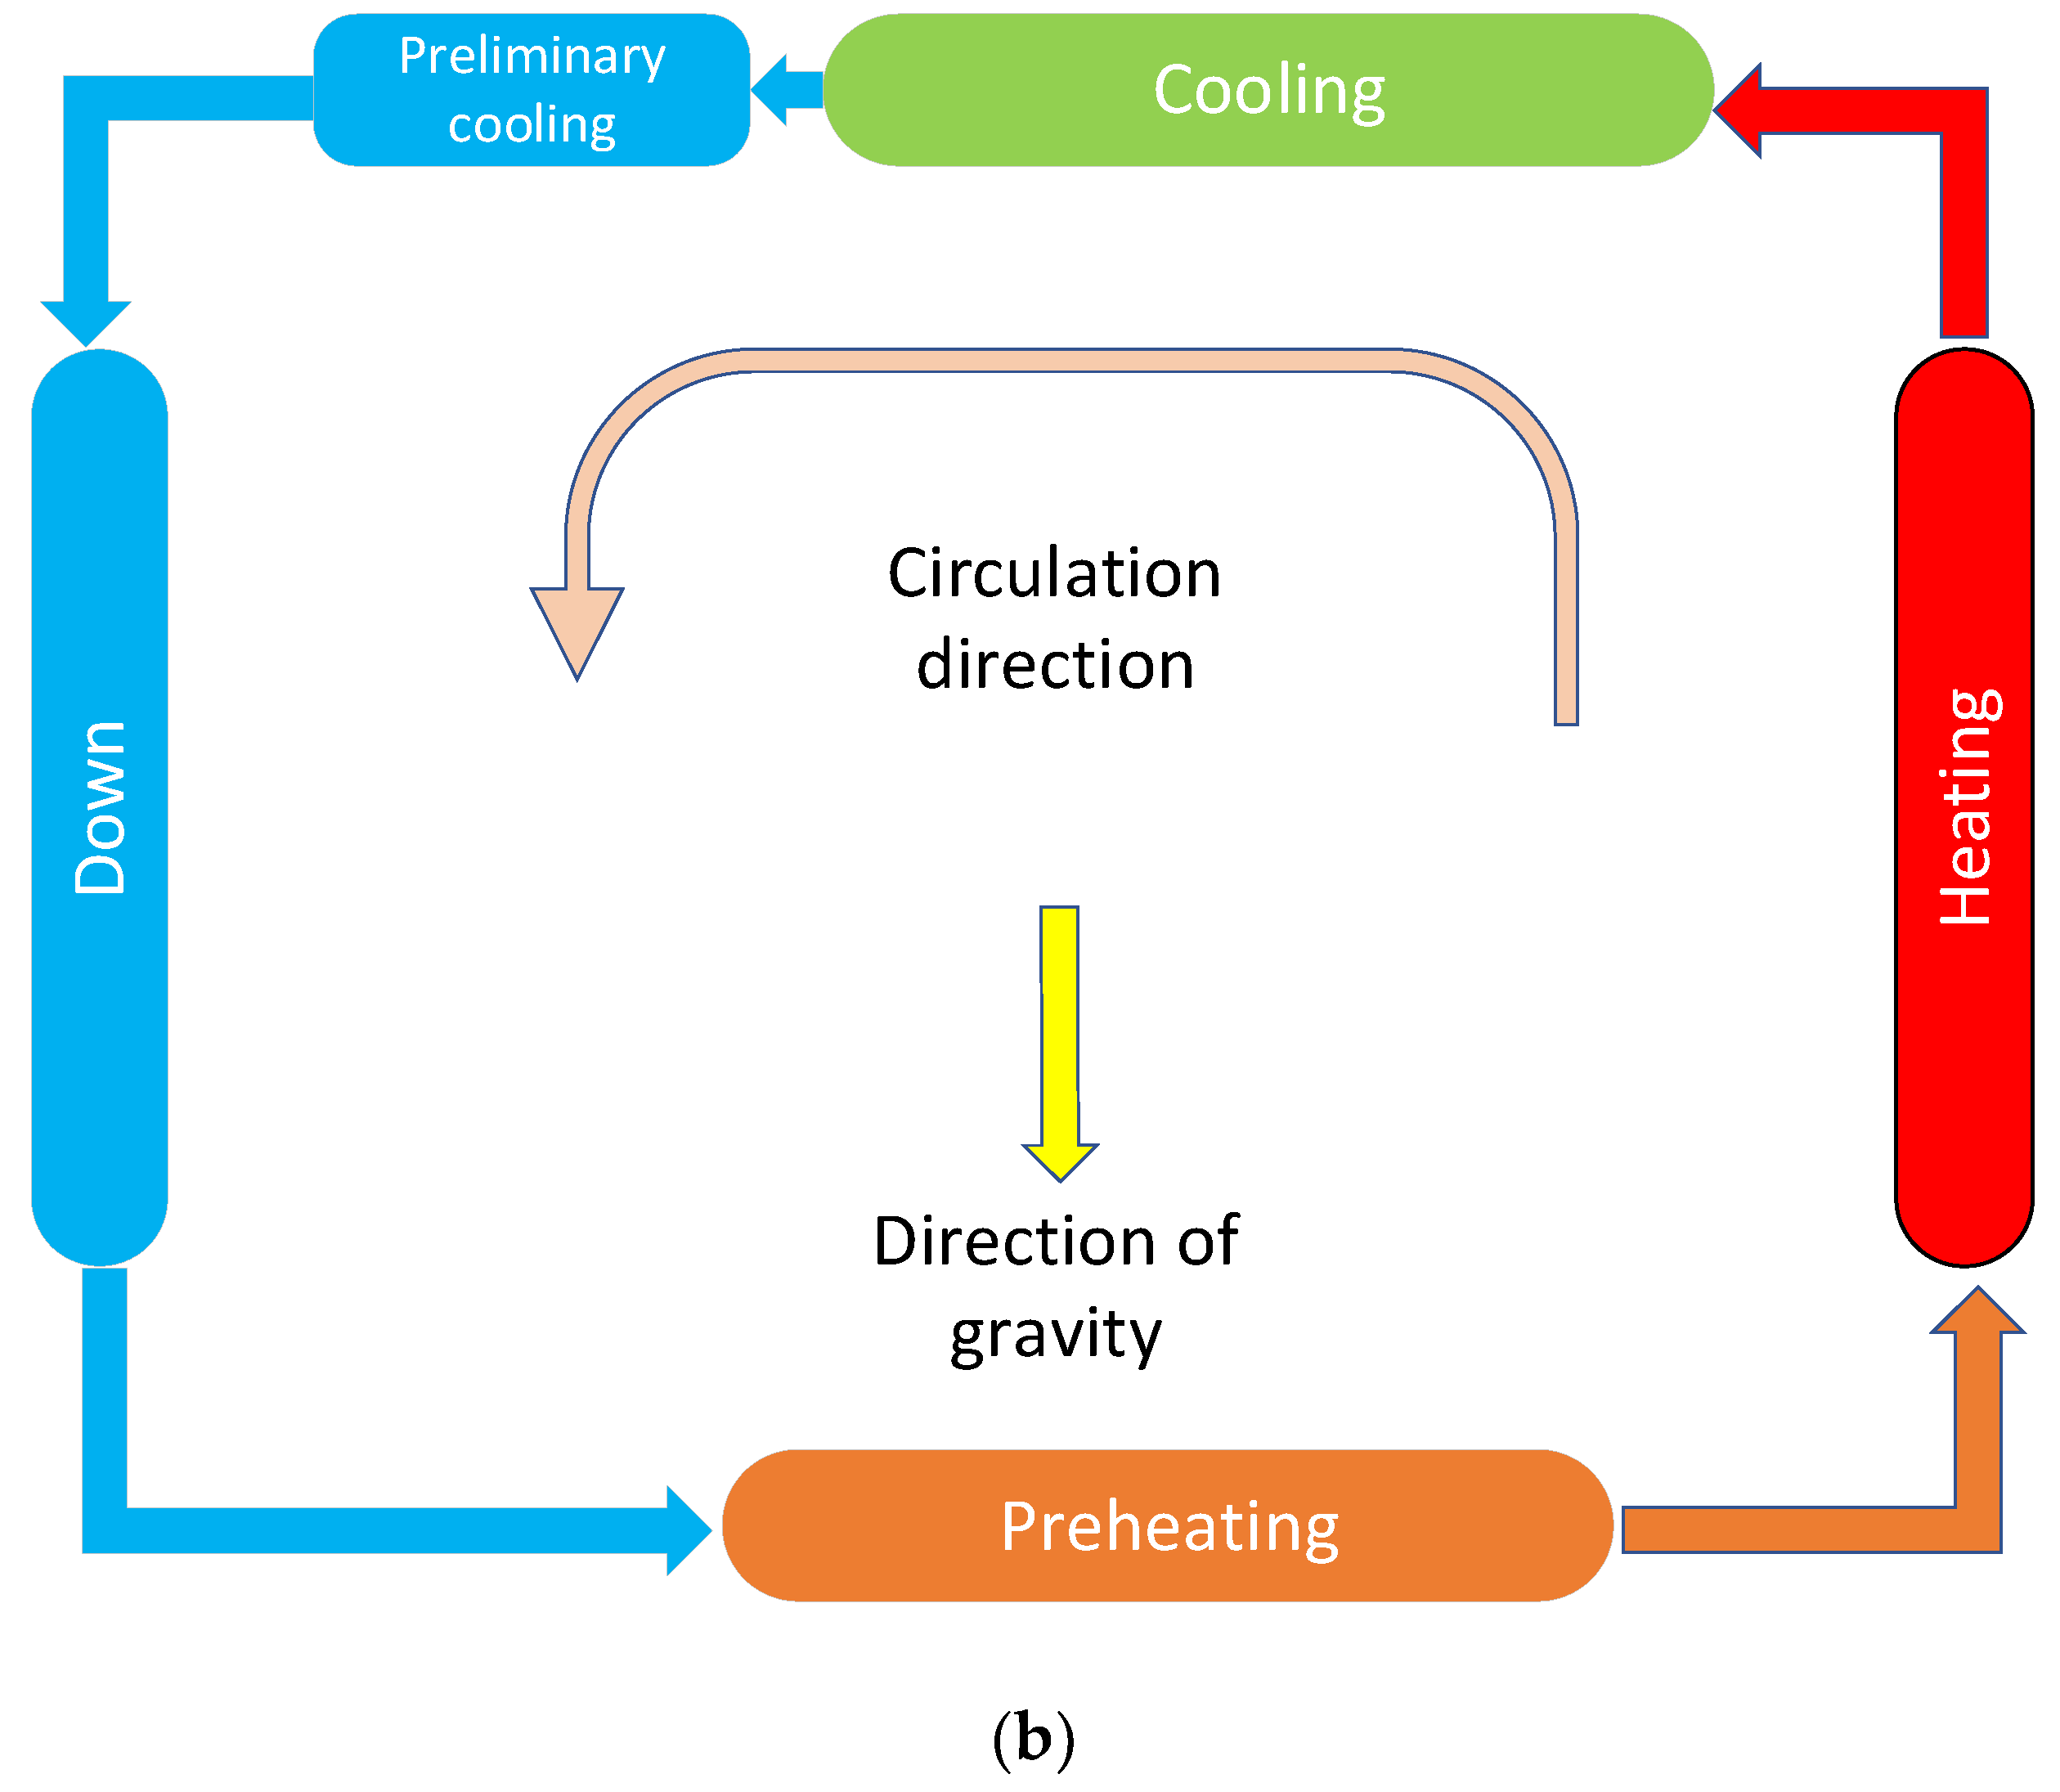
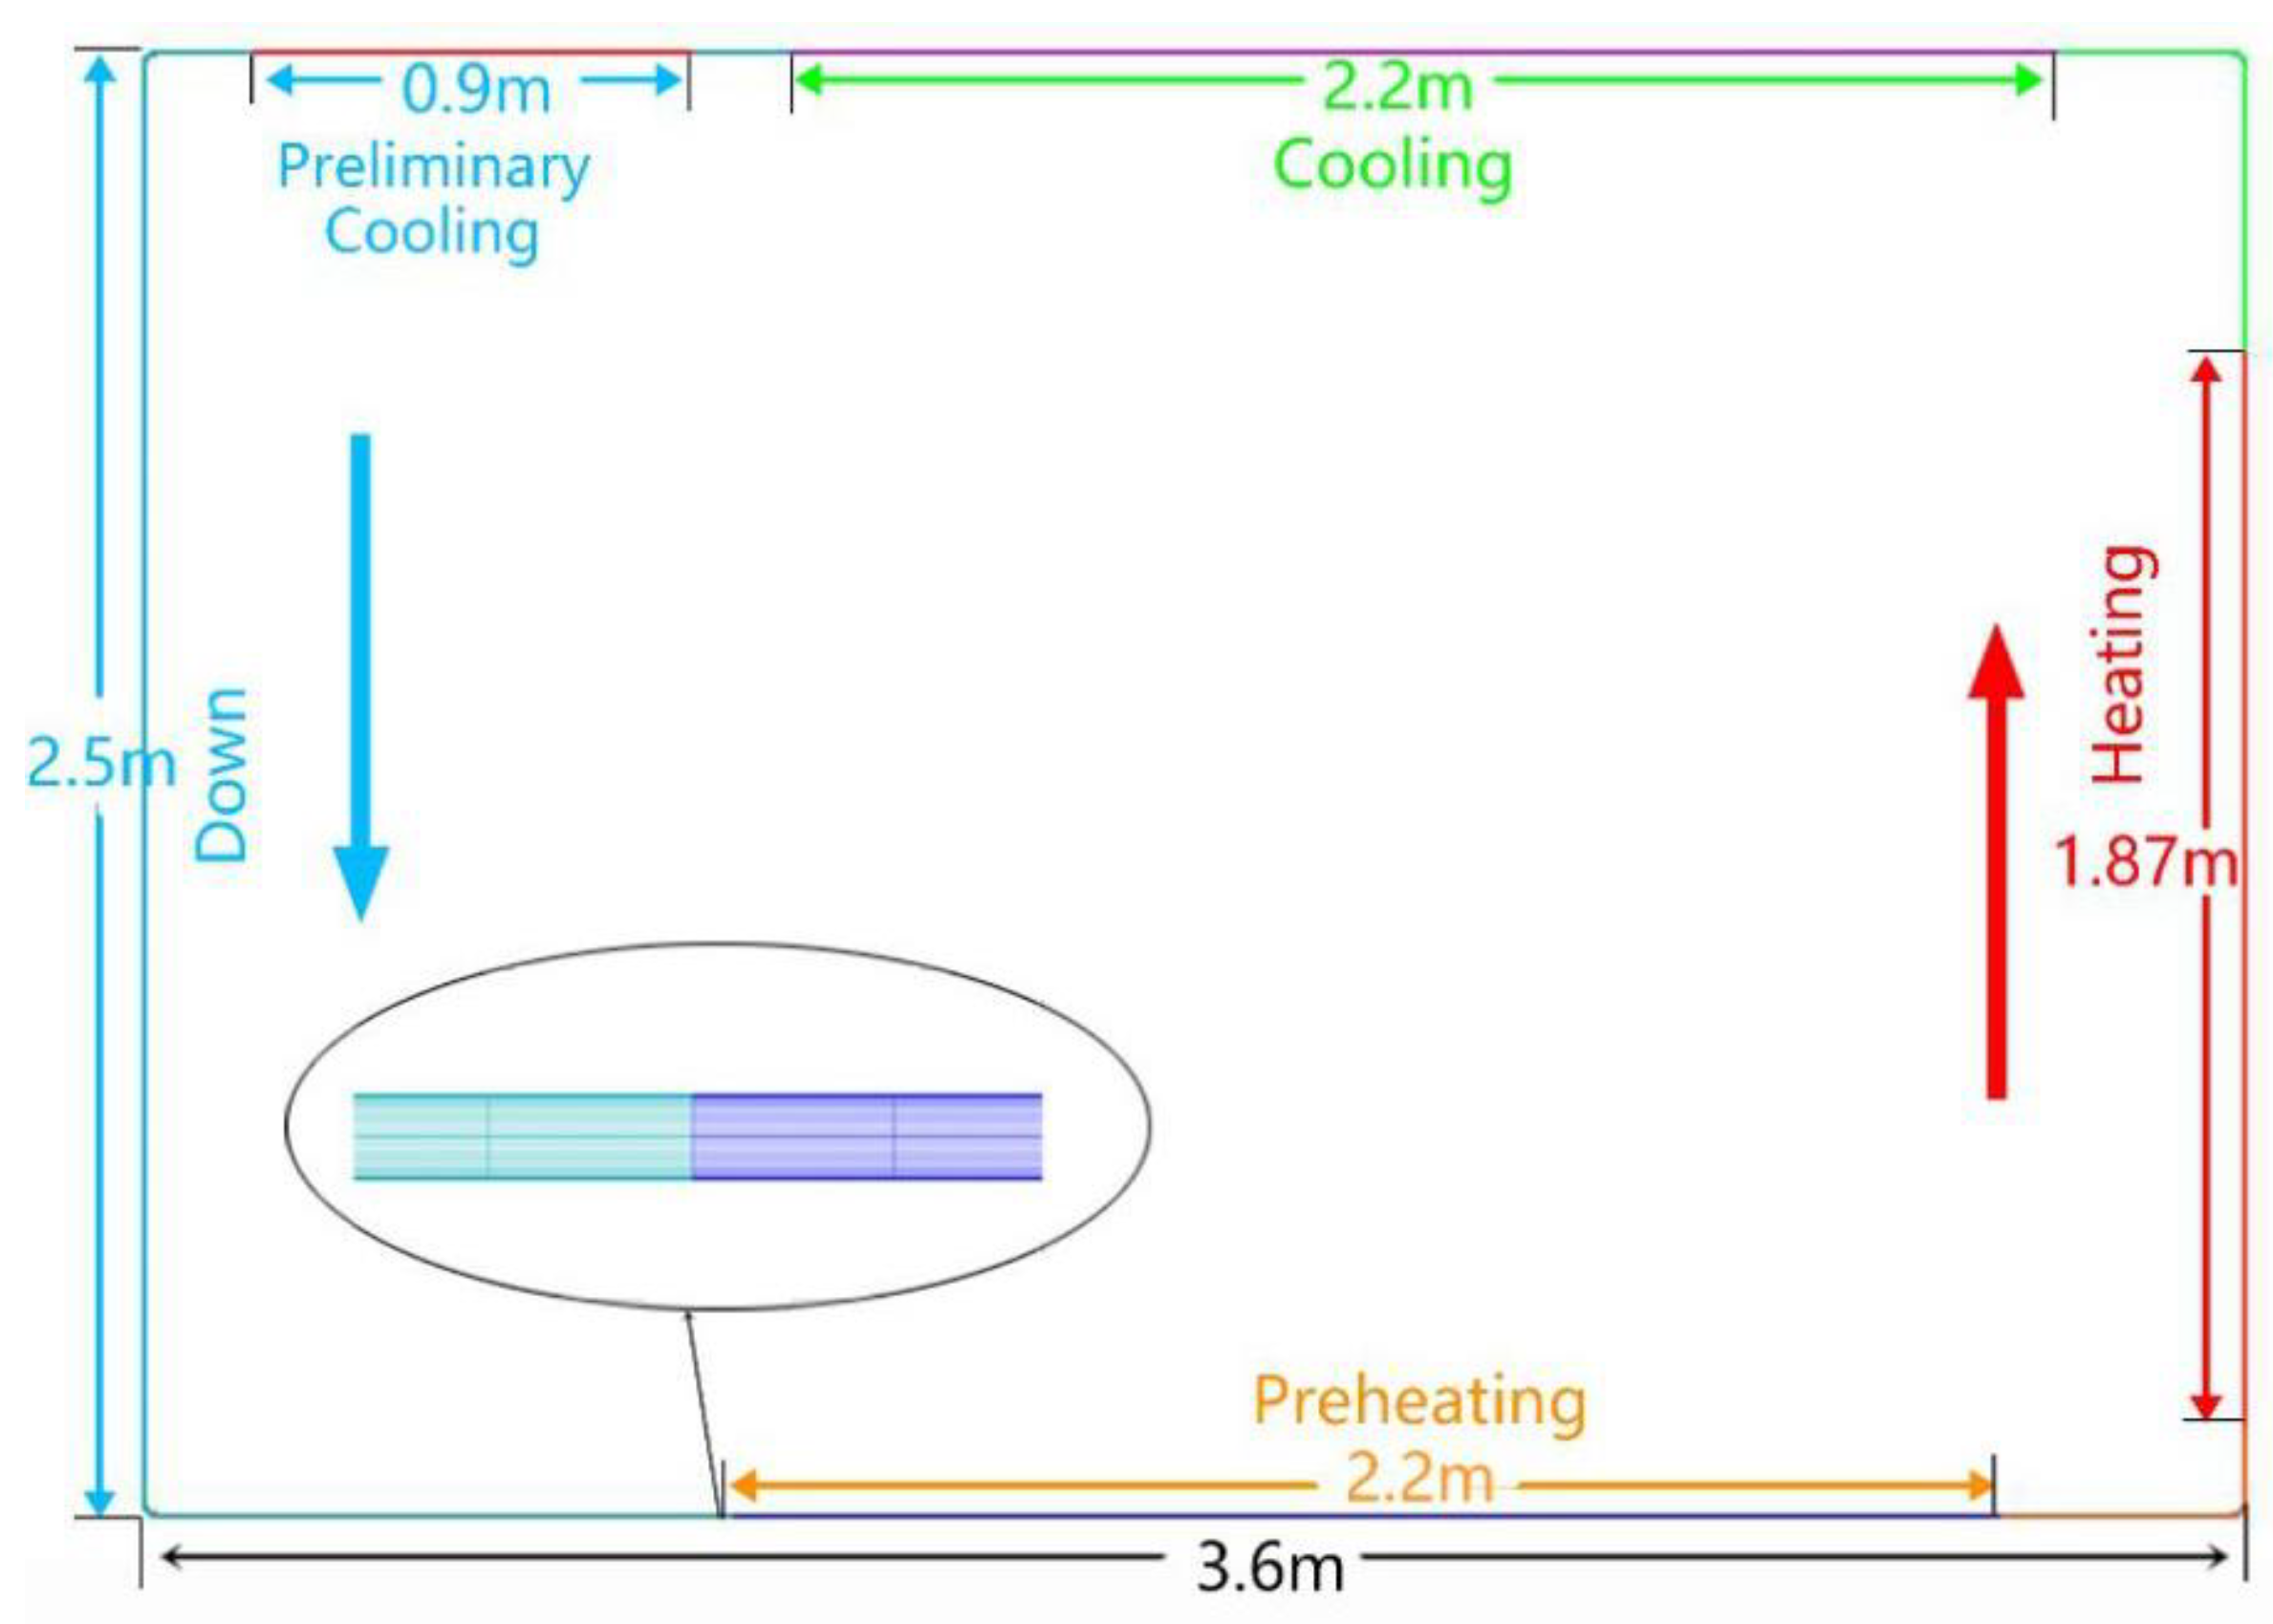
2.1. Experimental Equipment

The natural circulation loop mainly consists of a preheating section, a heating section and a cooling section, which relies on the density difference between hot and cold sections to drive supercritical water containing particles to circulate in the pipeline. According to the supercritical water natural circulation experimental equipment, set up by Zhou Tao research team [25] in North China Electric Power University, relevant models are designed. The natural circulation loop and model established are shown in Figure 1a,b.
As shown in Figure 1, the density difference between the fluids in the heating section (ascending segment) and the cooling section (descending segment) drives the entire fluid circulation flow. It should be noted that a preliminary cooling section is added to the original equipment, activated when the cooling section cannot reduce the fluid to the specified temperature (300K).

2.2. Parameter Information

In the supercritical water natural circulation loop, the particle material is stainless steel, and the other parameters are set, as shown in Table 1.
As shown in Table 1, the heating section is heated with constant heat flux density. The cooling section and preheating section are heated at a constant wall temperature. The rest of the pipelines are uniformly set as an adiabatic wall, and the particle concentration is expressed as volume proportion.

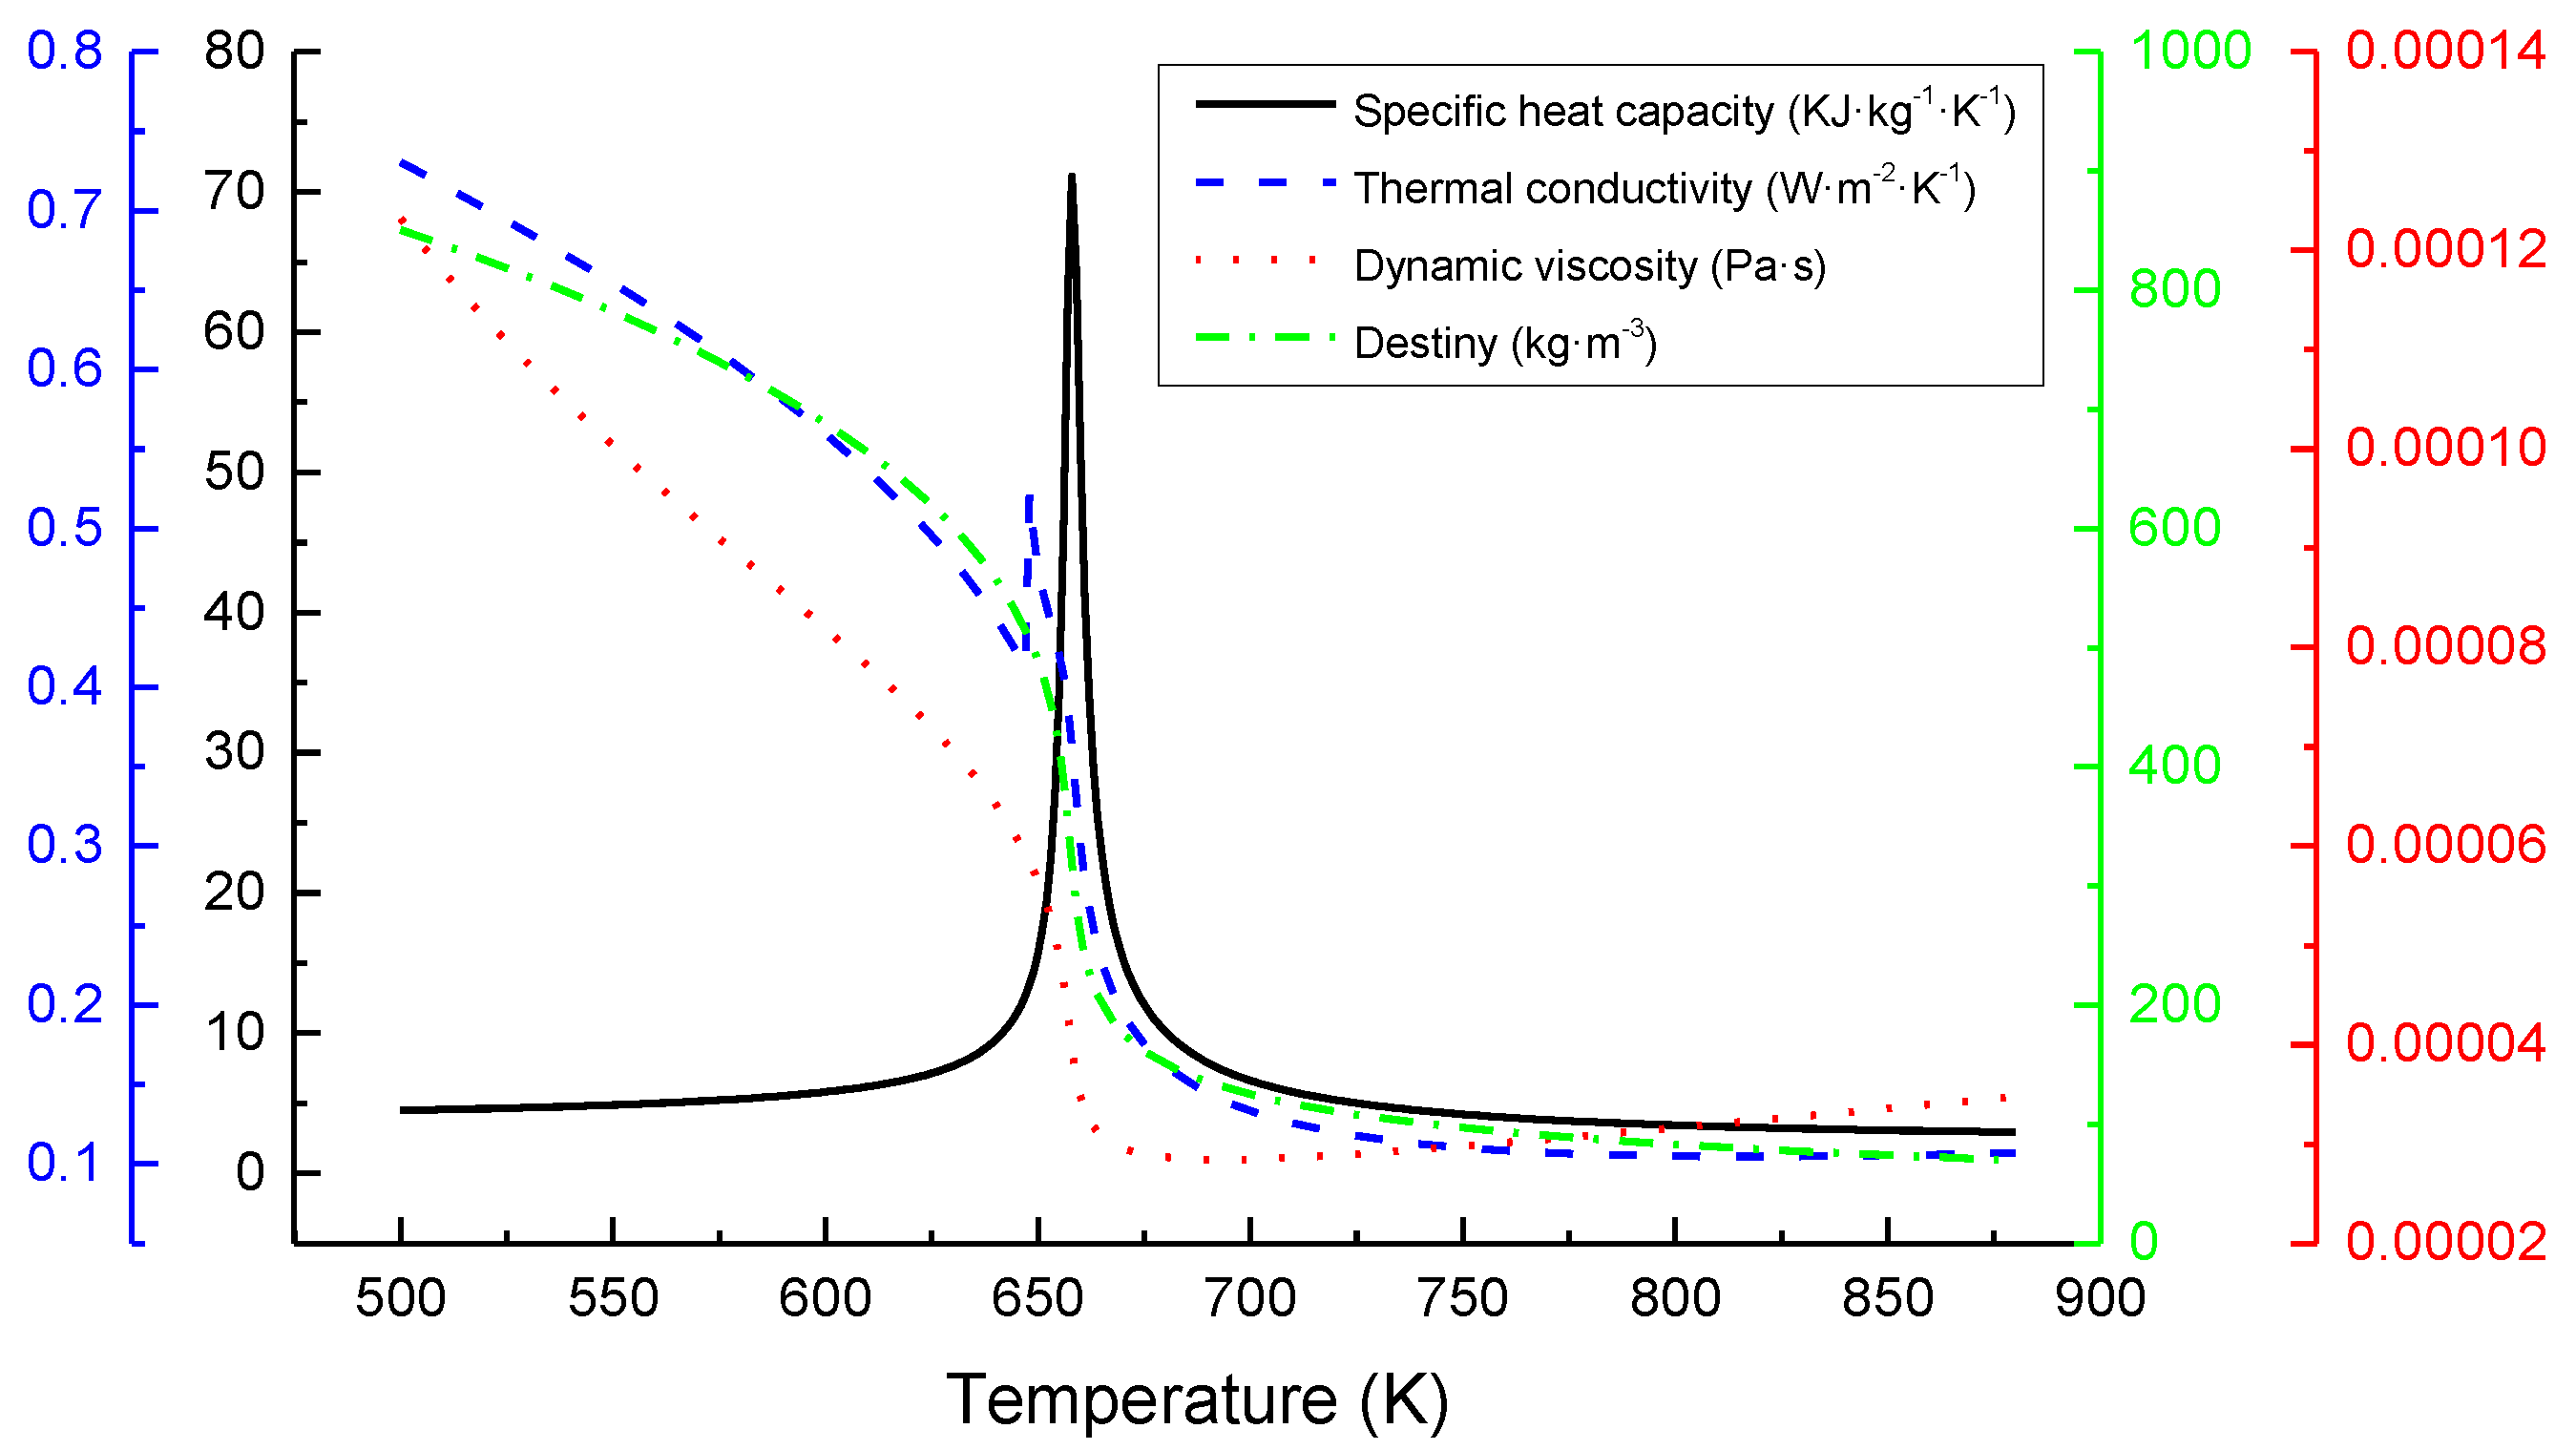
2.3. The Physical Properties of Supercritical Water

According to the water physical property parameter of IAPWS-IF97 included in CFX software [26], when the pressure is 25 Mpa, the relevant physical properties of supercritical water is shown in Figure 2.
As can be seen from Figure 2, when the temperature reaches the pseudo-critical temperature of about 660 K, the physical properties of supercritical water change drastically, especially the density of water decreases sharply.

2.4. Grid Division

According to the supercritical water natural circulation experimental device of Figure 1, a model is established, and grids are divided. The results and dimensions are shown in Figure 3.
As shown in Figure 3, the equivalent diameter of the pipeline is 8mm, and the wall thickness is assumed to be 0 mm. Other specific dimensions have been marked in the figure. During grid division, four kinds of grids with a number of 0.66 million, 1.1 million, 1.7 million, and 2.27 million were generated. The influence of the number of grids on the results can be judged by calculating the models with different grid numbers. In addition, the appropriate grid number is selected under the comprehensive consideration of accuracy and calculation efficiency. Through the sensitivity calculation analysis of the grid, a grid with a number of 1.1 million was selected. As the number of grids continues to increase from 1.1 million, the parameters, such as fluid temperature, flow rate, and particle concentration in the loop by the calculation, remain essentially unchanged, which is different compared with 0.66 million. Considering the complicated flow under the action of thermal swimming force, turbulent flow force, gravity, viscous force and other forces near the wall, the grid was encrypted near the wall to ensure the accuracy of the results. In the mesh densification area near wall surface, the grid size is gradually enlarged according to a certain ratio set to 1.1 and the original size of the mesh near the wall region is selected to be a minimum size of 0.001 mm.

3. Calculation Method

3.1. Numerical Simulation Method

CFX numerical simulation method was applied to the simulation and calculation of the flow of supercritical water containing particles in natural circulation loop, as well as the analysis of the movement and deposition of particles in varying conditions.
(1) Turbulence equation
If using the standard k-εpsilon model, the turbulent kinetic energy equation [26] can be expressed as:
( ρ k ) t + · ( ρ U k ) = · [ ( μ + μ t σ k ) k ] + P k ρ ε
( ρ ε ) t + · ( ρ U ε ) = · [ ( μ + μ t σ ε ) ε ] + ε k ( C ε 1 P k C ε 2 ρ ε ) ,
where ρ is density, kg/m3; k is turbulent kinetic energy, m2/s2; ε is turbulent kinetic energy dissipation, m2/s3; U is the velocity vector in x, y and z directions, m/s; Cε1, Cε2, σk, σε are constants; Pk is viscous force and turbulence kinetic energy produced by buoyancy, kg·J/(m3·s); μt is turbulent viscosity, Pa·s; μ is dynamic viscosity, kg/(m·s).
(2) Movement of particle equation
The discrete solid setting method was adopted to add particles. The Schiller Naumann calculation model was used for the drag force model for momentum transfer between particles and fluids. The turbulence model of particles adopted the discrete zero equation model.
Dispersed phase zero equation [2] can be expressed as:
V td = V tc σ = > μ td = ρ d ρ c μ tc σ ,
where Vtd is discrete kinematic turbulent viscosity, Pa·s; Vtc is continuous motion turbulent viscosity, Pa·s; σ is Prandtl Number related to Vtd and Vtc.
The momentum transfer between particles and fluid adopted Schiller Naumann’s drag force calculation model. The formula [26] can be expressed as:
C D = 24 R e ( 1   +   0 . 15 R e 0 . 687 ) ,
where Re is reynolds number.
CFX modifies this to ensure the correct limiting behavior in the inertial regime. The modified equation [26] can be expressed as:
C D = max ( 24 R e ( 1 + 0 . 15 R e 0 . 687 ) , 0 . 44 ) ,
where Re is reynolds number.
The Ranz Marshall model was selected as the heat transfer model between the fluid and the particle. The equation [2] can be expressed as:
h l = λ l d s ( 2 + 0 . 6 R e s 0 . 5 P r l 0 . 3 )           ( 0 R e s 200 ) ,
where ds is the average diameter of solid particles, μm.
(3) Deposition equation
For particle deposition in pipelines, the deposition rate is an important parameter to describe particle deposition. Its equation of definition can be expressed as:
η D = η D 1 η D 1 + η D 2 ,
where η D 1 is the particles deposited in the pipeline; η D 2 is the particles flowing from the pipeline.

3.2. Grey Correlation Degree method

Grey correlation analysis is a method to judge the degree of correlation between different factors, which is judged according to the similarity of geometric shapes of sequence curves. If the curve shapes are closer, the correlation degree between sequences is greater. If the shapes of curves are different, the correlation between sequences is smaller. Further with the results obtained from CFX simulation, the importance of each parameter to deposition of particles was analyzed by using grey correlation degree.
Set a parameter X0 as the target parameter, and the value on its sequence k is called the reference sequence, denoted by {Xj(k)}. It is assumed that there are a total of m influence parameters, where the value of influence factor j on the same sequence k is called comparison sequence, denoted by {Xj(k)}(k=1,…,N)(j=1,…,m). The calculation steps are as follows:
(1) Dimensionless initialization of each sequence
Xj(t) = Xj(k) / Xj(1) k =1,2,…,N, j =1,2,…,M,
where Xj(t) denotes the result obtained from dimensionless initialization of the sequence.
(2) Difference sequence
Δ0j(k) =∣X0(k) − Xj(k)∣,
where Δ0j(k) refers to the result obtained from dimensionless initialization of the sequence.
(3) The maximum difference and minimum difference between the two poles
M = maxmax j             k   |   X 0 ( k )     X j ( k ) | , m = minmin j             k   |   X 0 ( k )     X j ( k ) .
In the case M signifies the determined maximum value among the N absolute differences of class j influencing factors, then ascertain the maximum value of all absolute differences corresponding to the M influencing factors, based on j = 1, ..., N. Whereas, if m signifies the determined maximum value among the N absolute differences of class i influencing factors, then ascertain the maximum value of all absolute differences corresponding to the N influencing factors based on i = 1, ..., N.
(4) Calculating the correlation coefficient
ζ 0 j ( k ) = m + ρ M Δ 0 j ( k ) + ρ M               k = 1 ,   2 , ,   N ,   j =   1 ,   2 , ,   m
where ρ is the resolution coefficient, and its value is between intervals (0,1); ζ 0 j ( k ) is the correlation coefficient.
(5) Calculating the correlation degree
γ 0 j = 1 N k = 1 N ζ 0 j ( k )     j =   1 ,   2 , ,   m
where γ 0 j represents the degree of correlation between the target parameter and the influence parameter j.

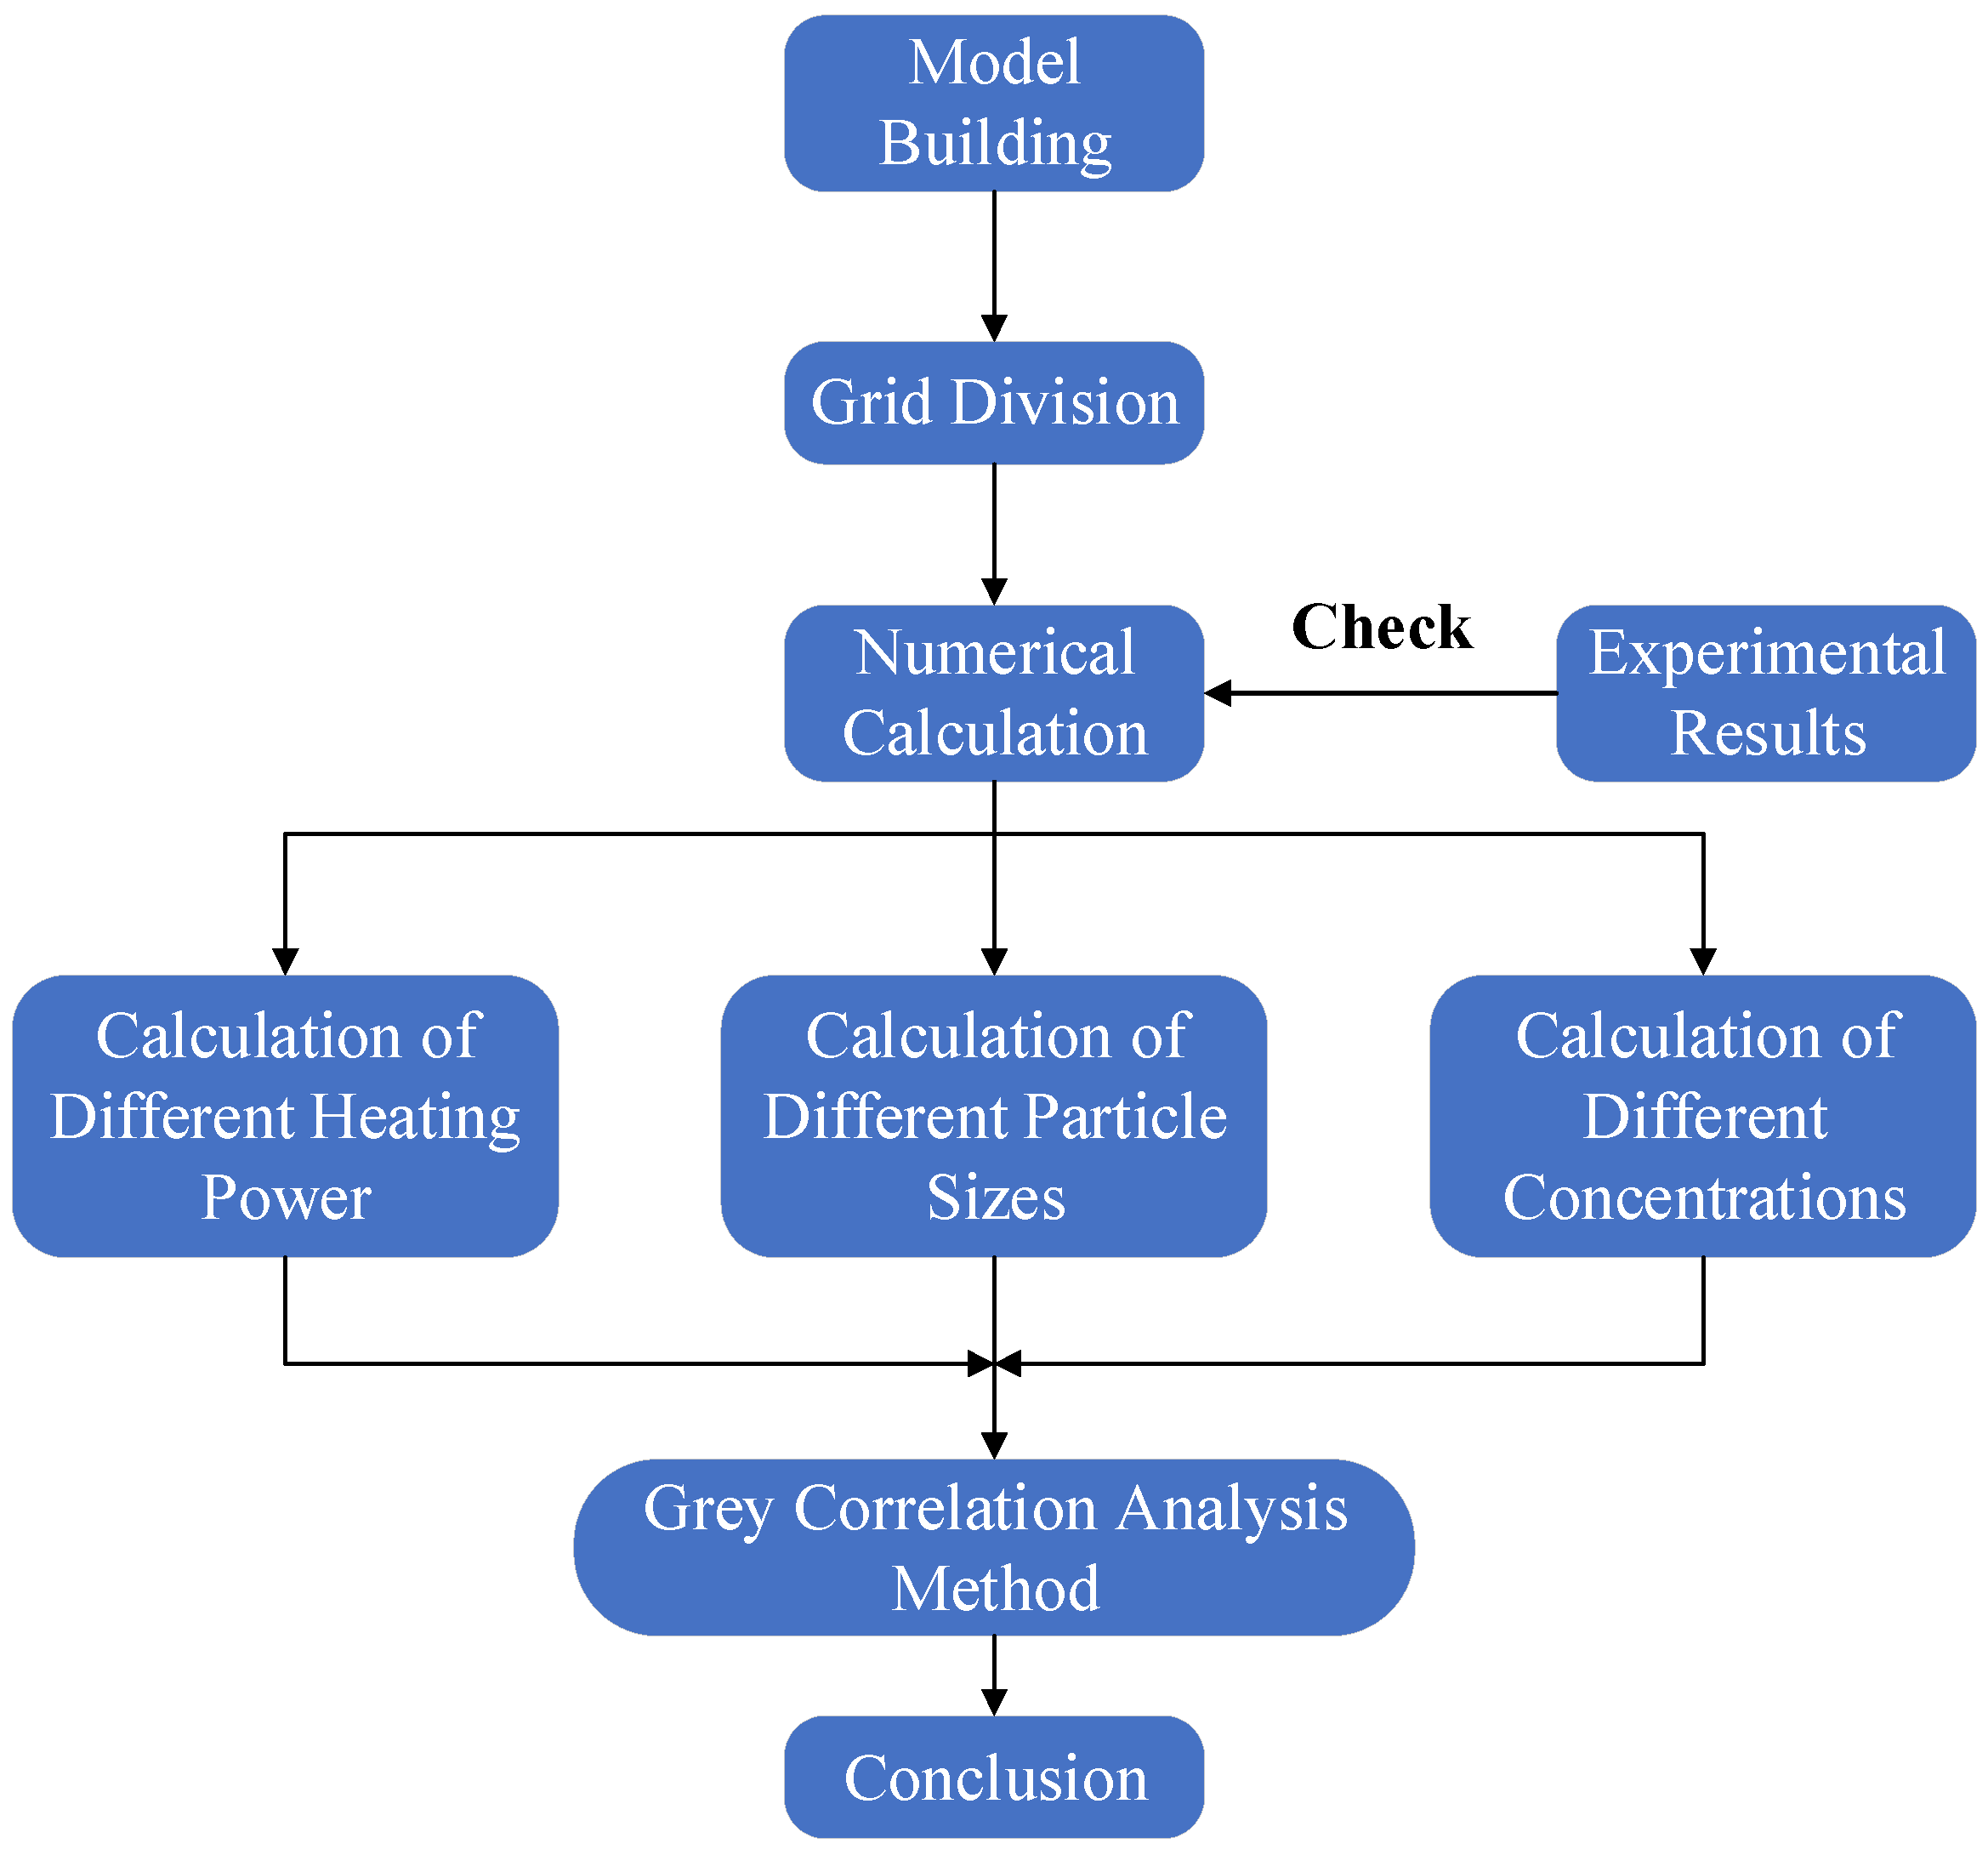
3.3. Calculation Process

The CFX software was used to calculate the particle concentration and velocity distribution of the whole loop, and then the particle concentration distribution of the heating section under different parameters was calculated respectively. Furthermore, according to the results obtained from the calculation, a grey relational analysis was applied to obtain the influence degree of different parameters on particle deposition. The calculation process is shown in Figure 4.
As revealed by Figure 4, the entire analysis is comprised of six parts: Model establishment, grid division, numerical calculation, calculation of different parameters, grey correlation analysis, and conclusion. As for numerical calculation, it is crucial to apply the existing experimental results to the validation of how reliable the numerical simulation could be.

4. Analysis of Calculation Results

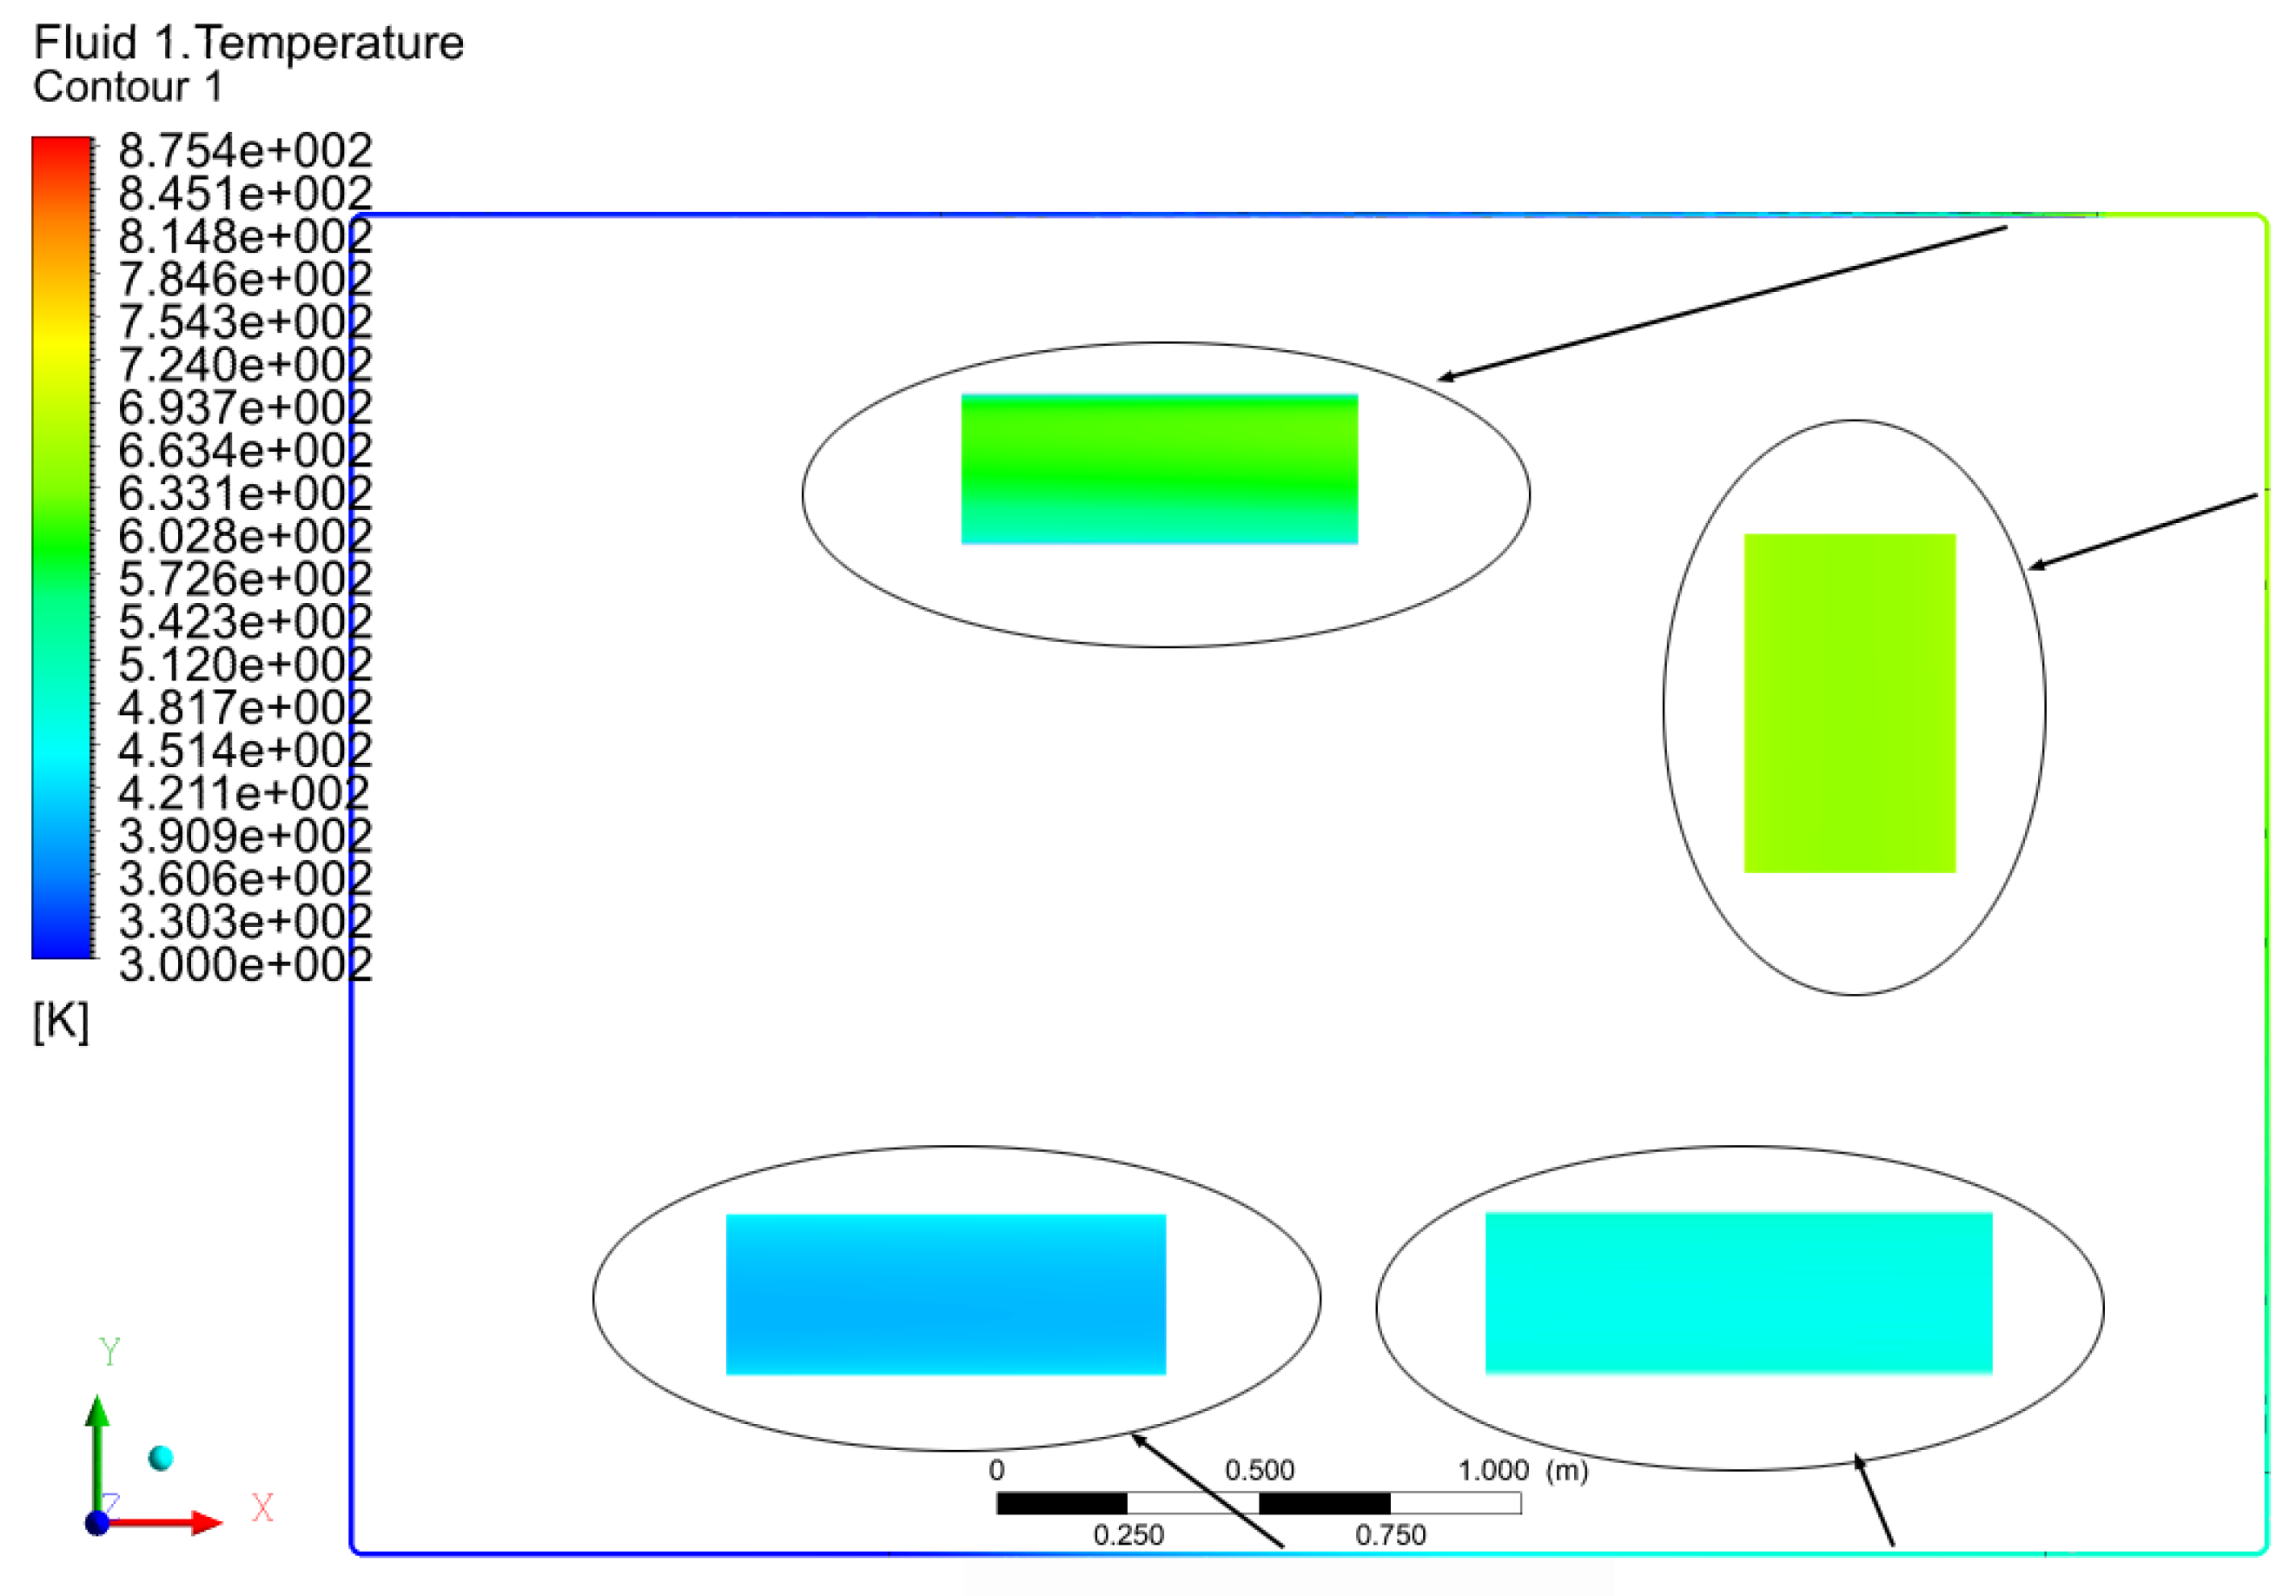
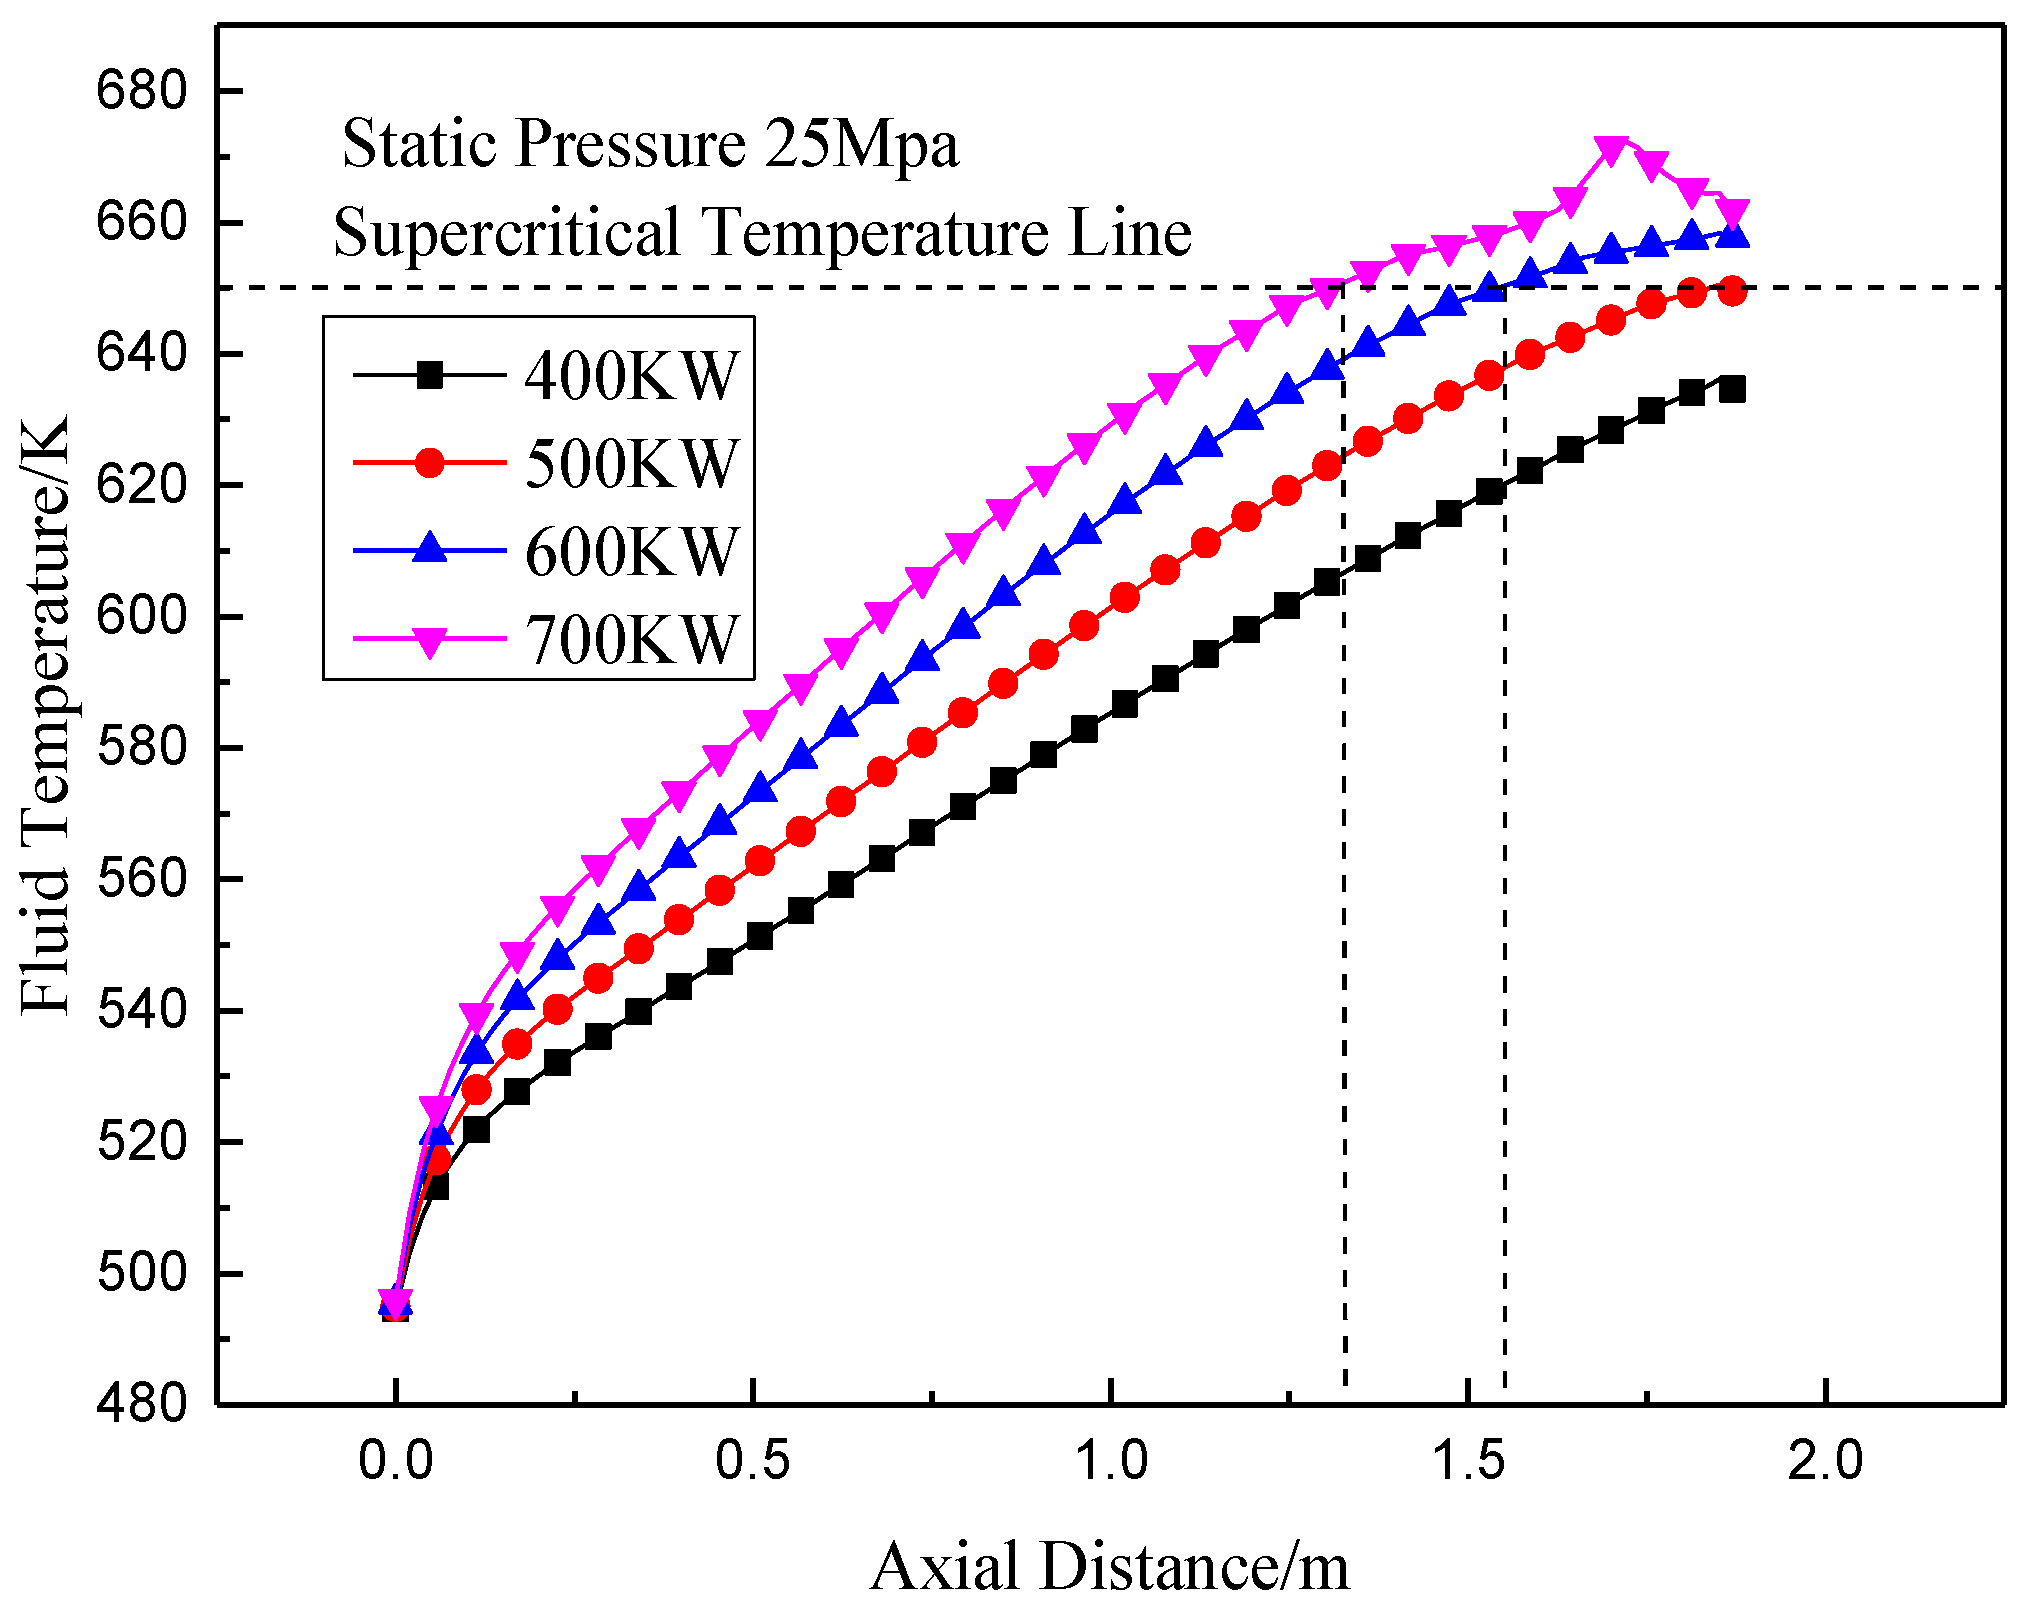
4.1. Temperature Distribution of Supercritical Water

When the initial particle volume fraction reaches 0.5%, the micron-sized particle diameter is found to be 1 μm, and the heating power of the heating section measures 700 kW. The simulation calculation of supercritical water natural circulation is carried out. Figure 5 presents the calculation results of flow temperature distribution in the whole loop.
As shown in Figure 5, in the process of fluid flowing in the loop, the temperature of fluid increases when the fluid flows through the preheating section and the heating section, and reaches its maximum at the outlet. It decreases when the fluid flows through the cooling section, and finally reaches the same temperature as the pipe wall (300 K). The fluid is heated by the pipe wall in the heating section and the preheating section, causing the temperature to rise. In the cooling section, its temperature decreases under the cooling effect of the low-temperature wall. The whole circuit relies on the density difference between the hot and cold sections as the driving force to circulate the fluid.

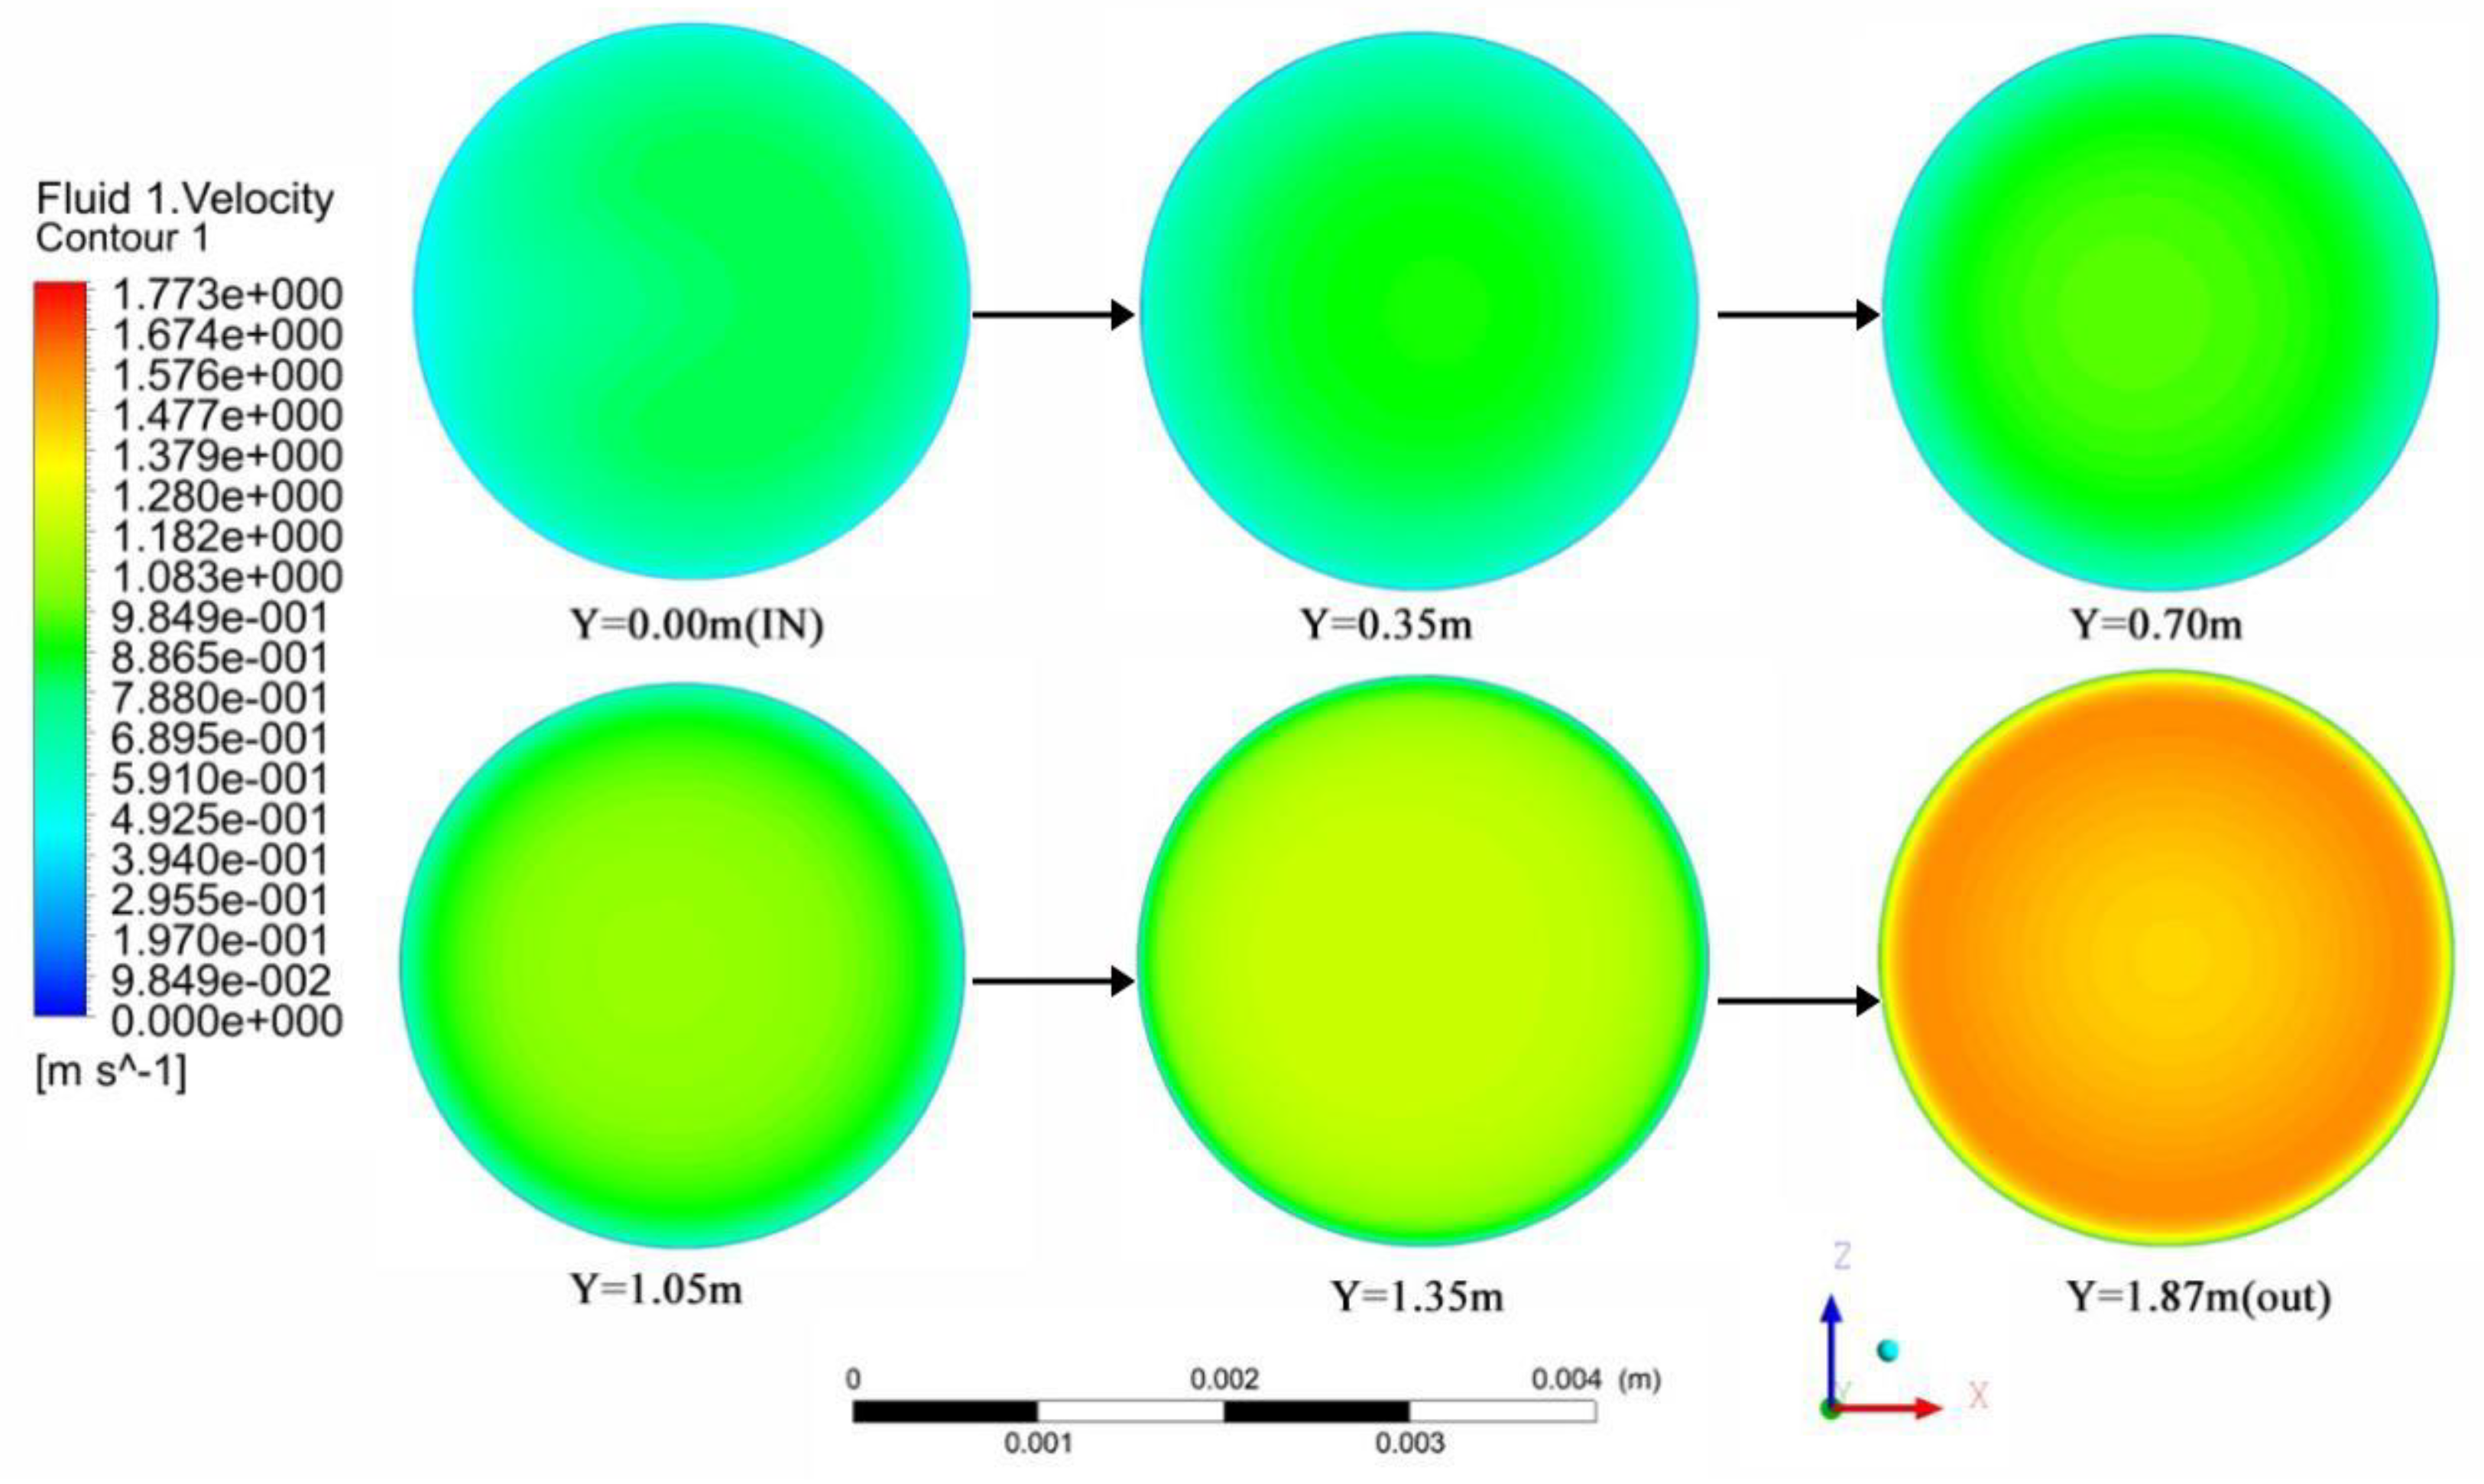
4.2. Velocity Distribution of Supercritical Water

When the initial particle volume fraction reaches 0.5%, the micron-sized particle diameter is found to be 1μm, and the heating power of the heating section measures 700 kW. The simulation calculation of supercritical water natural circulation is carried out.
(1) Velocity distribution in the whole loop
Figure 6 presents the calculation results of flow velocity distribution in the whole loop.
As shown in Figure 6, the fluid flow rate near the wall in the horizontal preheating section is relatively low, reaching a minimum of about 0.31 m/s, while the fluid flow rate in the middle section is relatively high, reaching about 1.09 m/s. At elbow 1, the fluid flow velocity near the inner wall exhibited abrupt declines and the low-speed region expands, whereas the fluid flow velocity near the outer wall increases. The velocity at elbow 1 is much higher than that of other pipeline fluids, reaching a maximum of 1.77 m/s. The velocity variation trend at elbow 1 is the same as that at elbow 2. The reason for the above phenomenon lies in that the fluid is affected by the viscous force and friction resistance in the process of flowing in the pipeline. Meanwhile, the existence of gravity increases the comprehensive effect of the force, resulting in a low velocity near the wall and a velocity gradient. After the fluid is heated by the heating section to reach the supercritical state, its density decreases significantly, and its volume increases, leading to a rise in the flow rate.
(2) Velocity distribution in the heating section
Figure 7 presents the calculation results of flow velocity distribution in the heating section.
As shown in Figure 7, in the process of fluid flowing through the heating section, a low flow velocity area appears near the wall, while the overall flow velocity increases continuously and a sharp rise occurs at the outlet. During the flow of the fluid in the heating section, the temperature of the fluid near the wall is locally reduced to be lower than that of the main fluid, due to the friction resistance and the action of viscous force near the wall. This, in turn, leads to the decrease of density and the increase of flow velocity under certain mass flow rate. For the same reason, when the fluid reaches a supercritical state near the outlet, the density decreases sharply, resulting in a sharp rise in the flow rate.

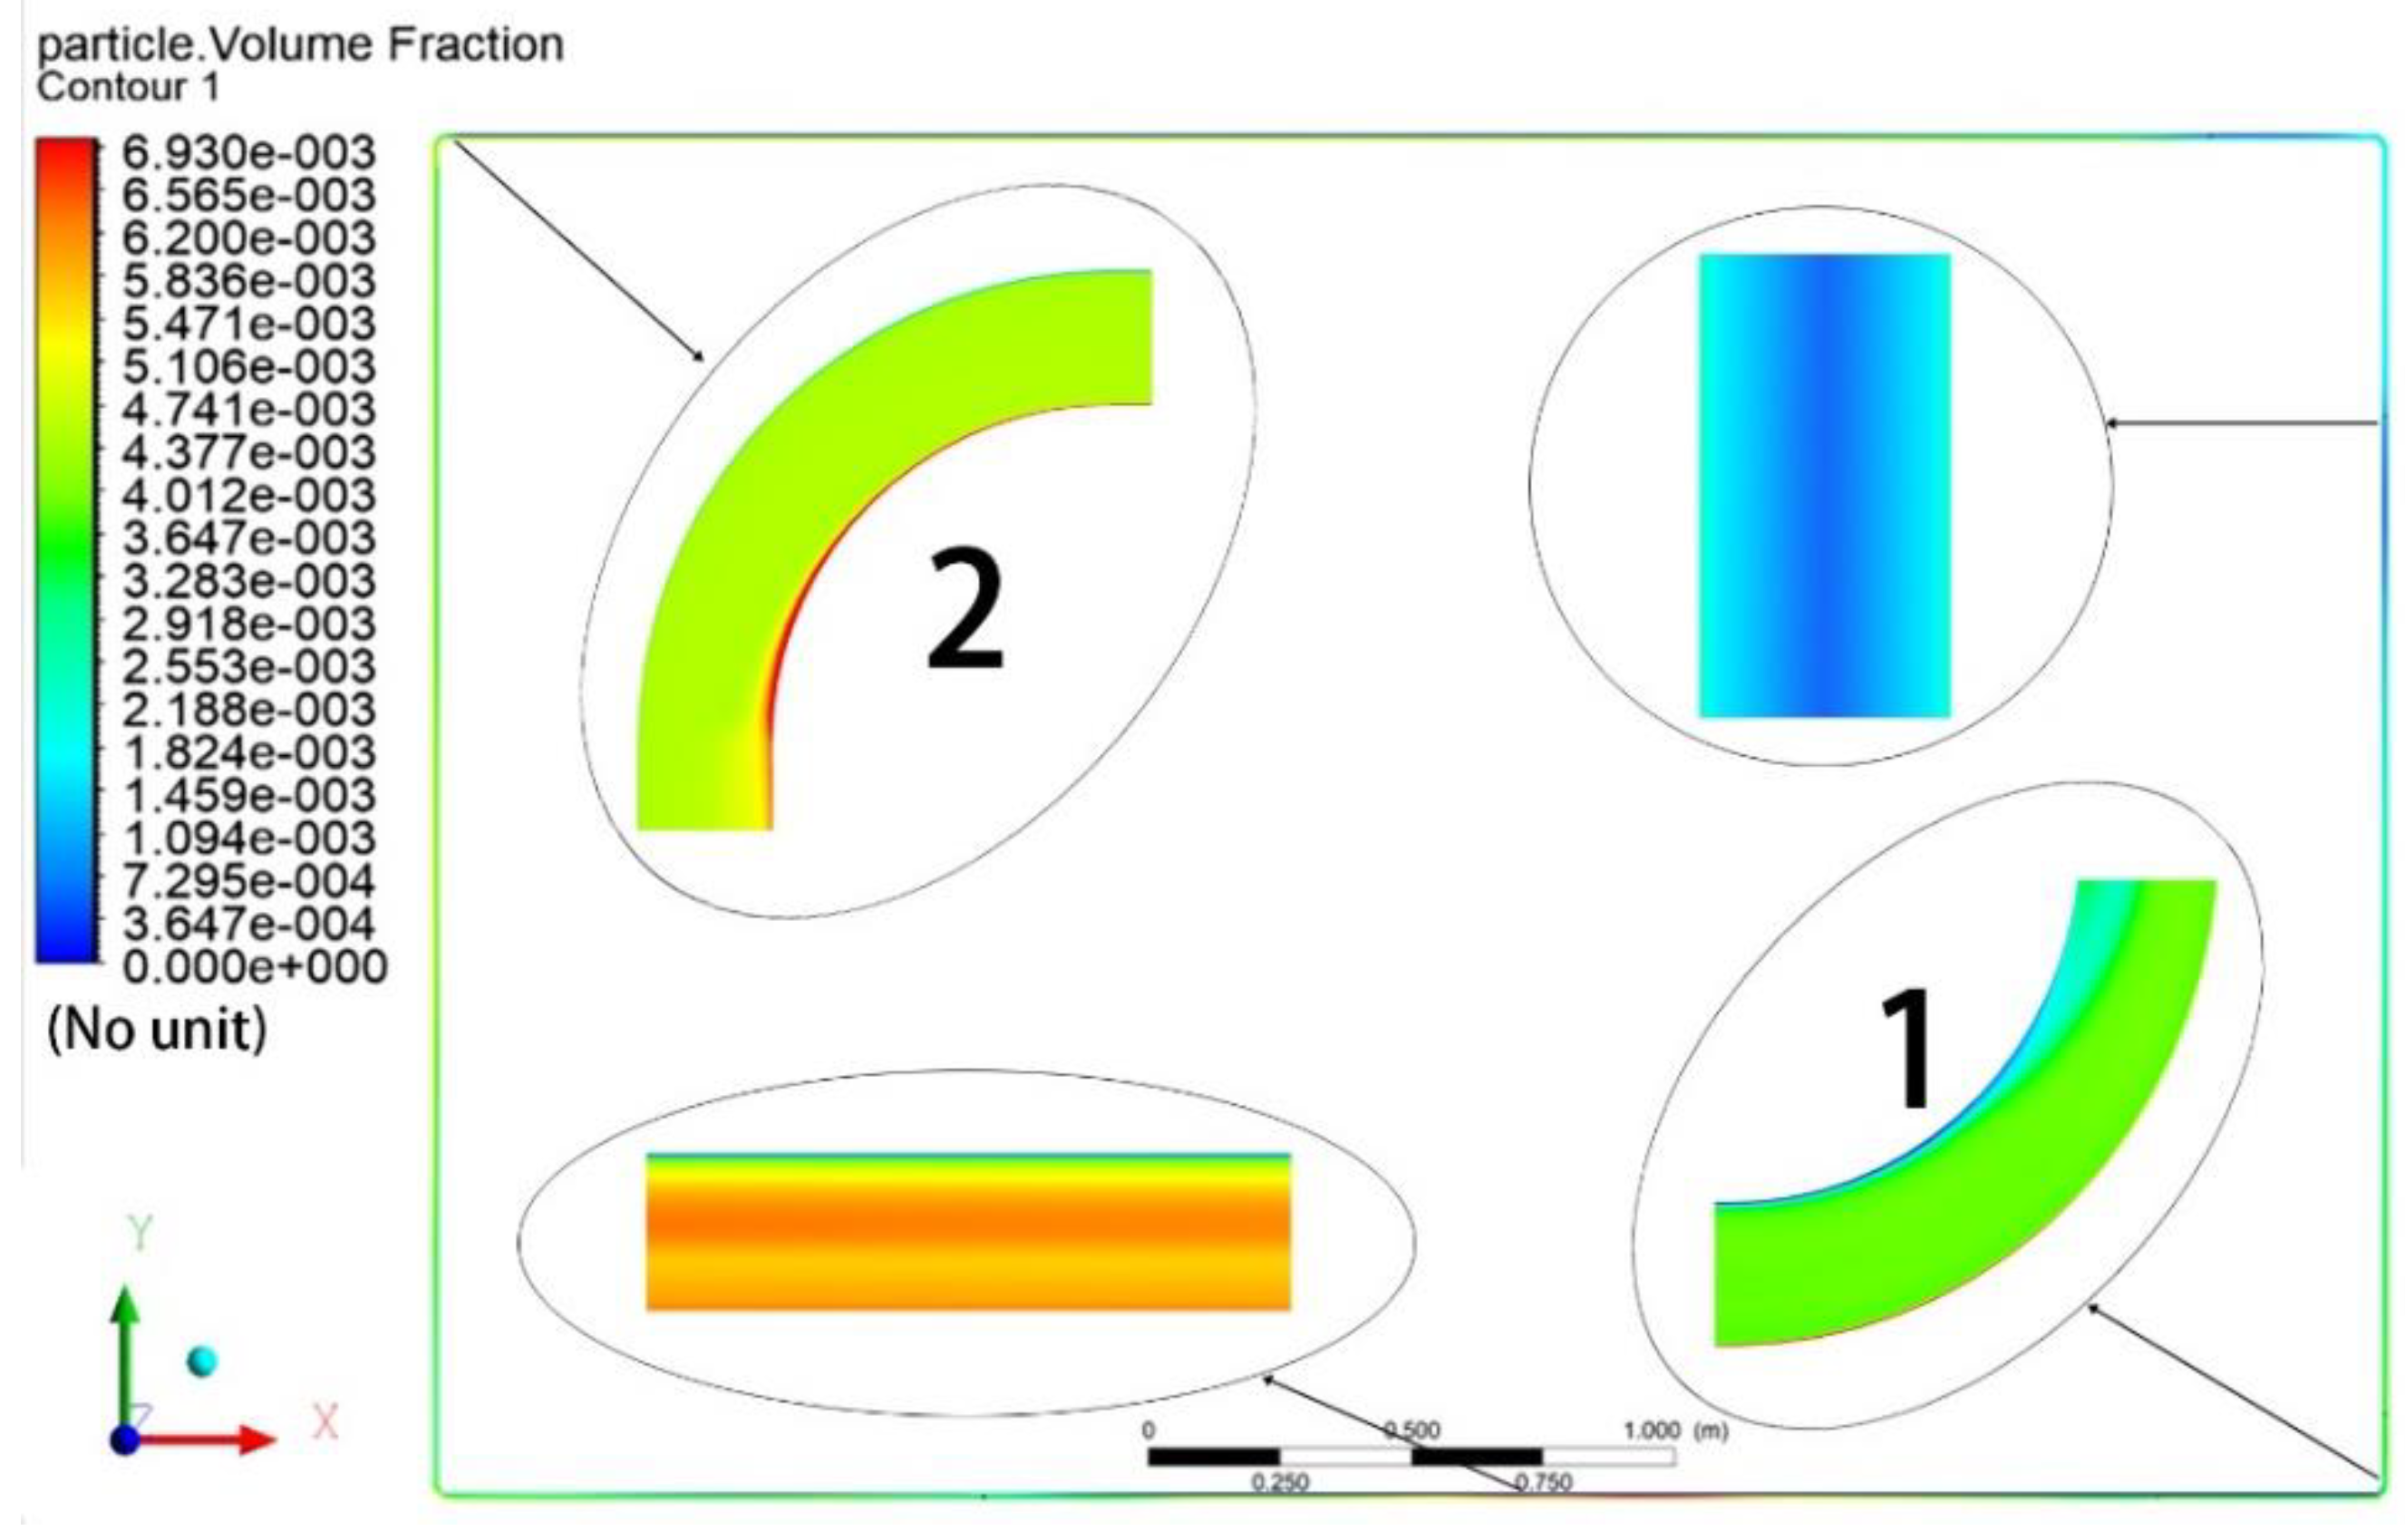
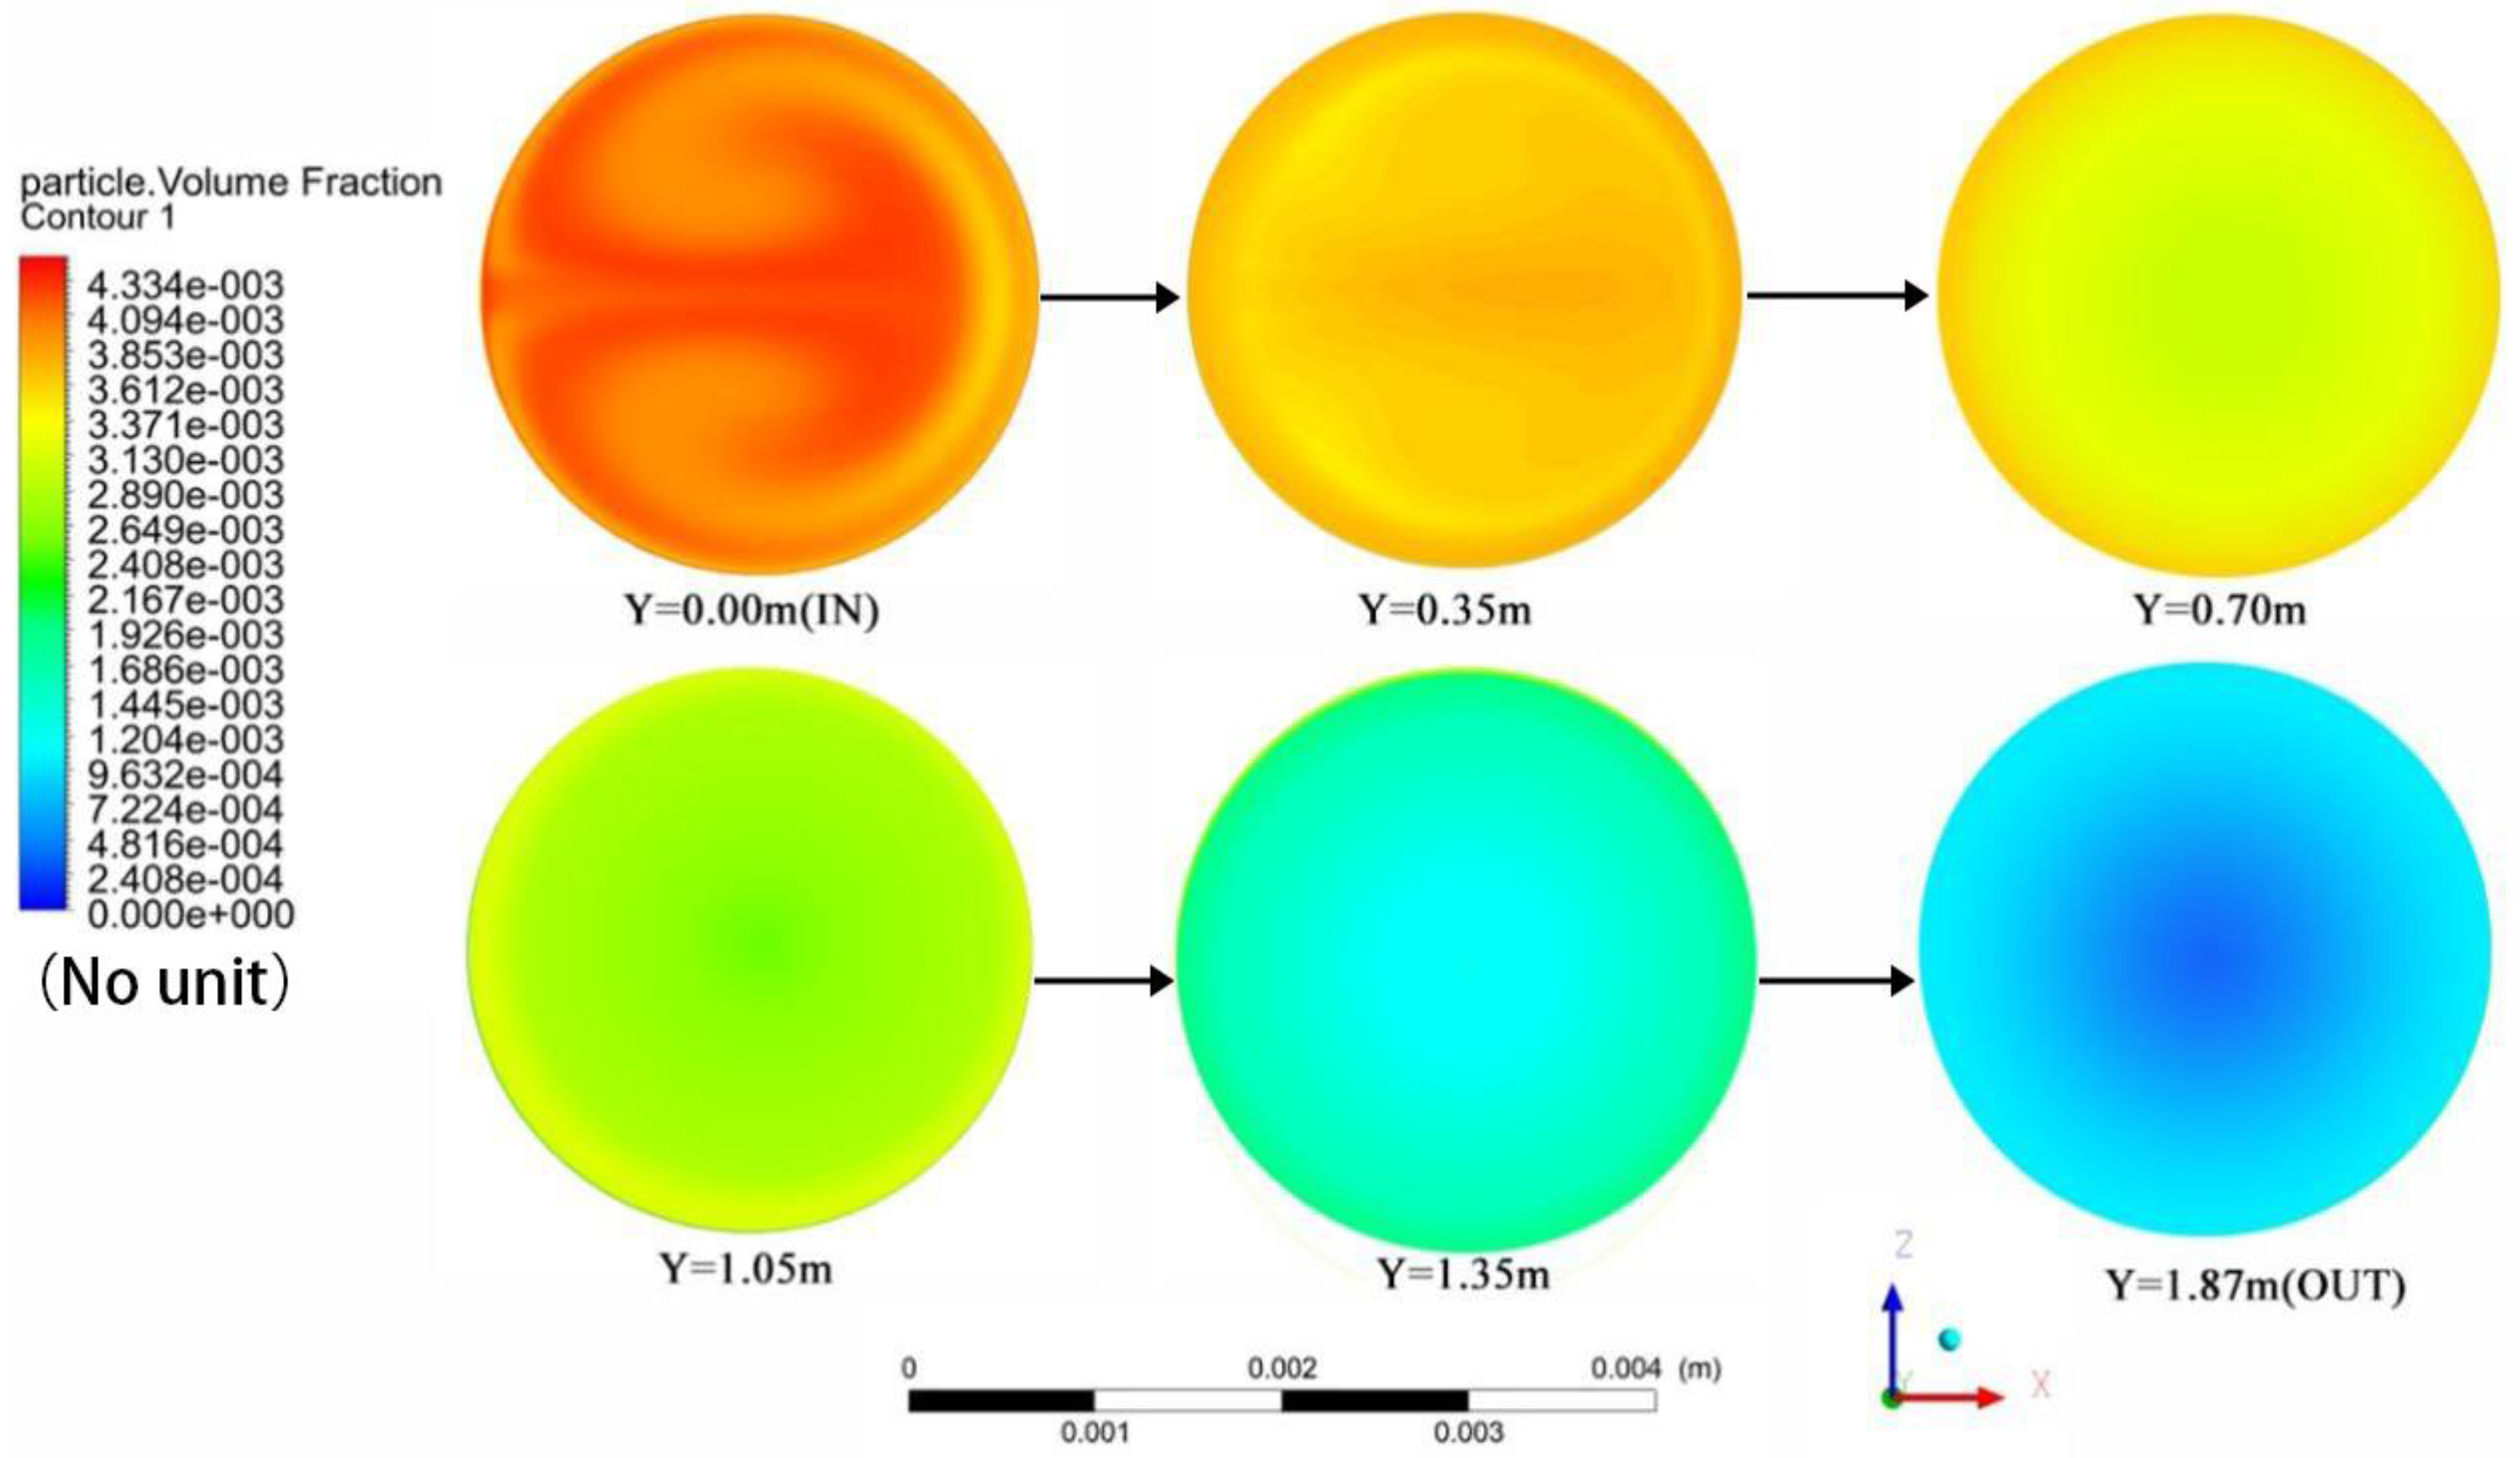
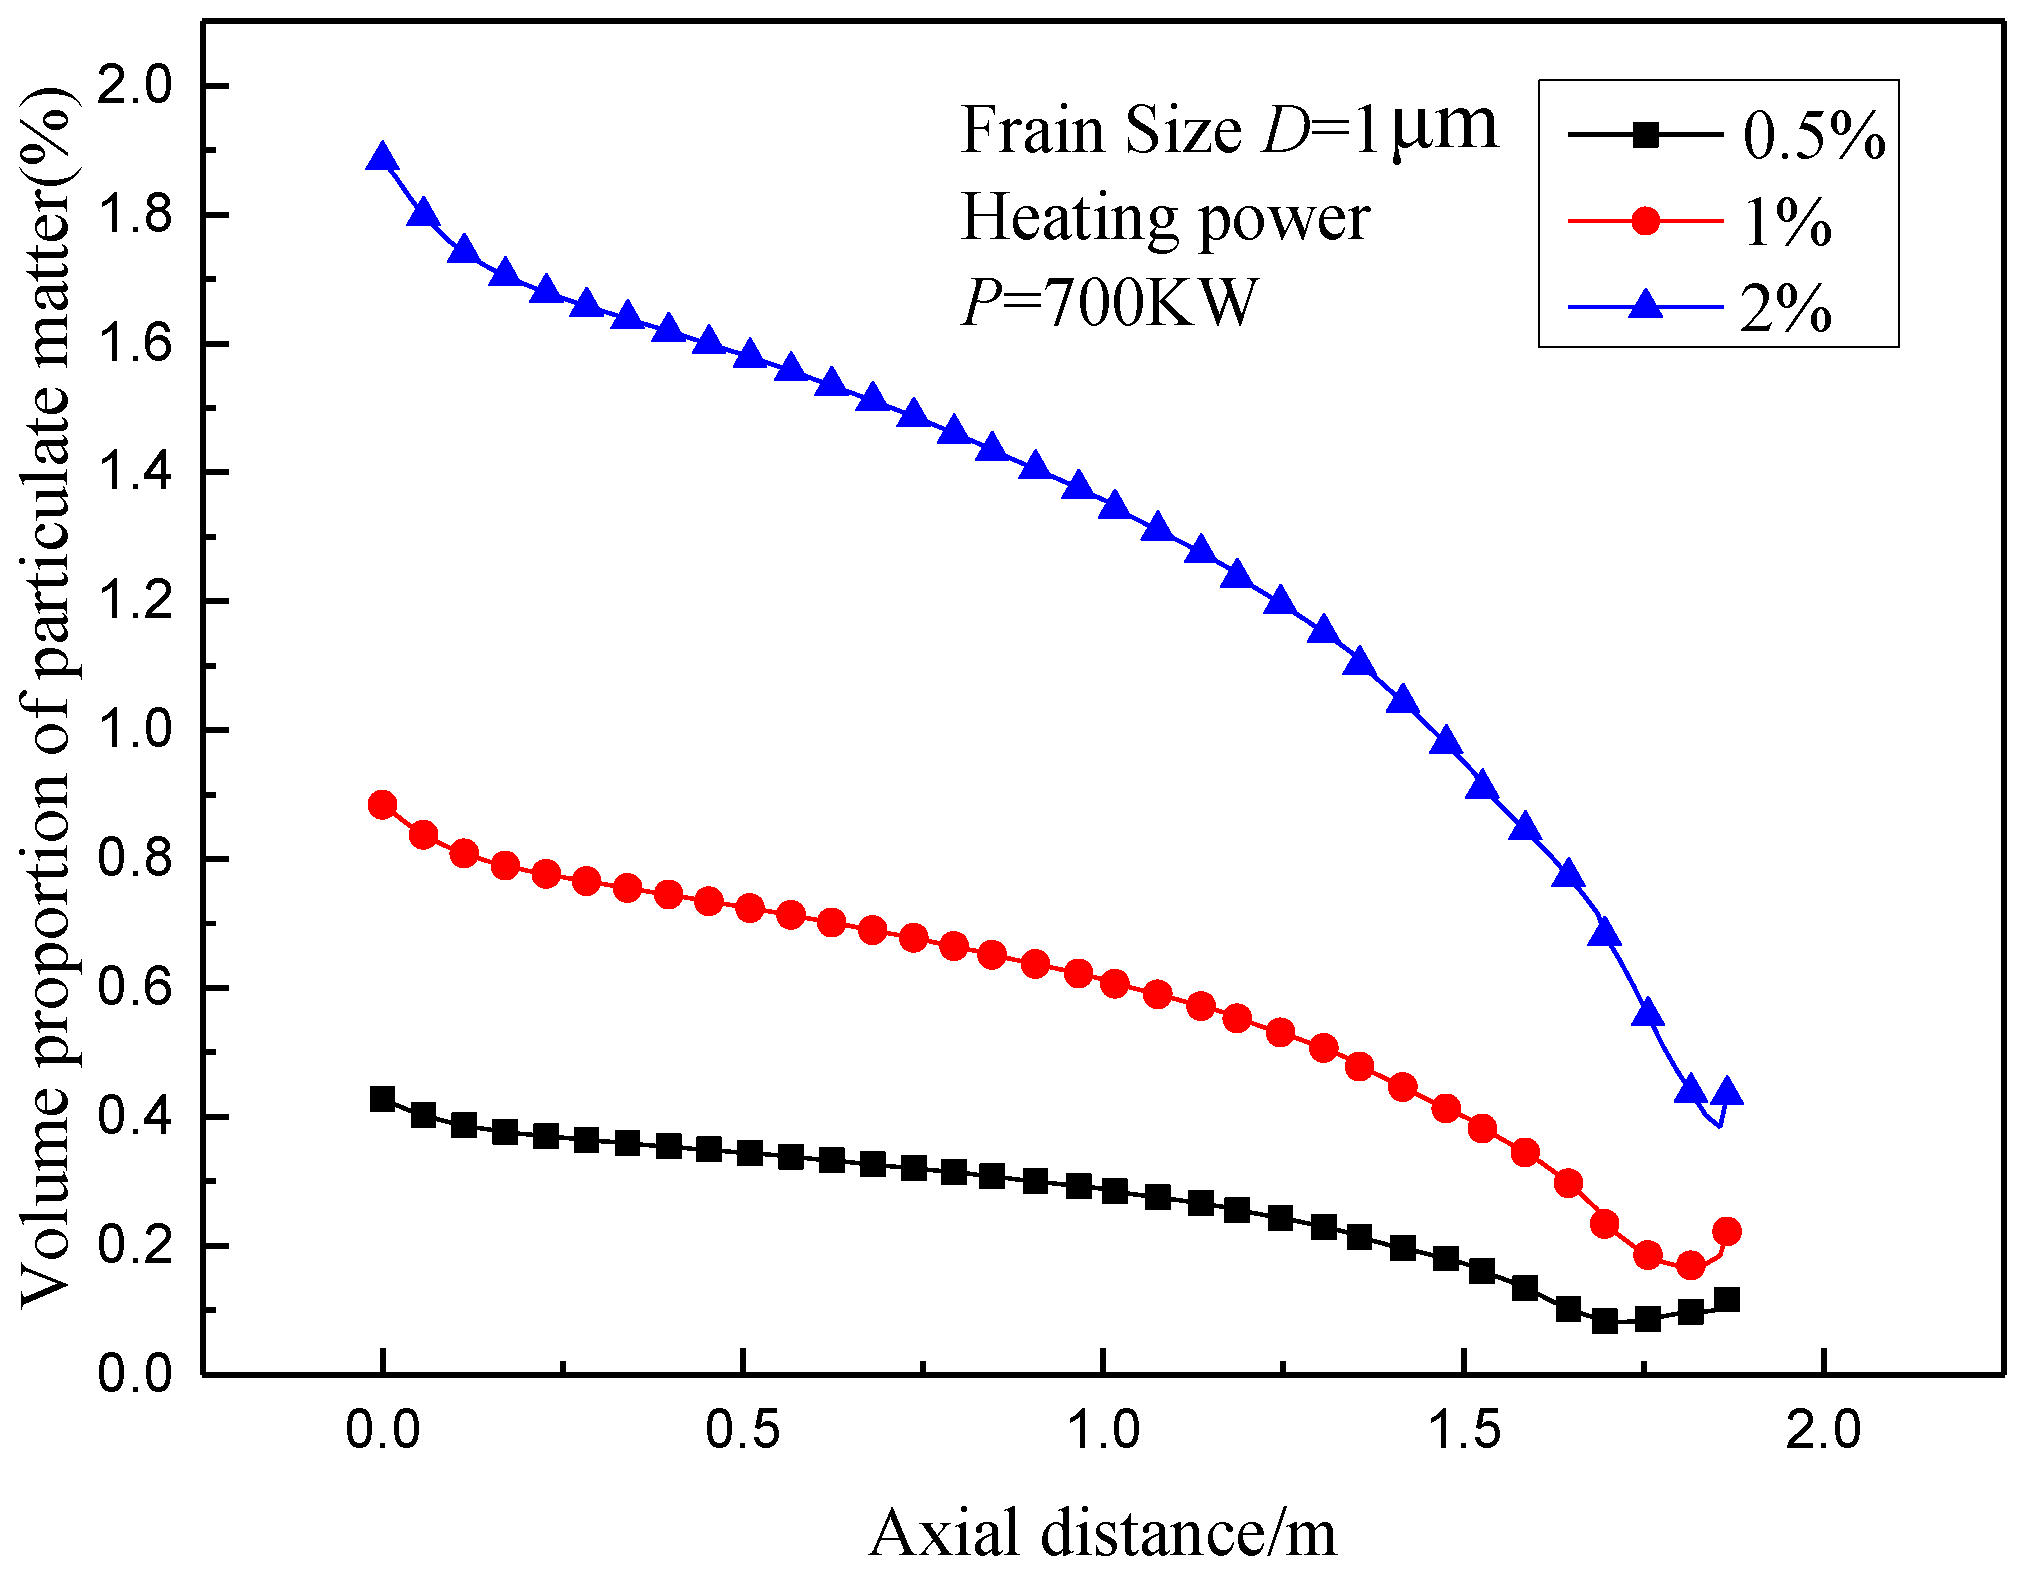
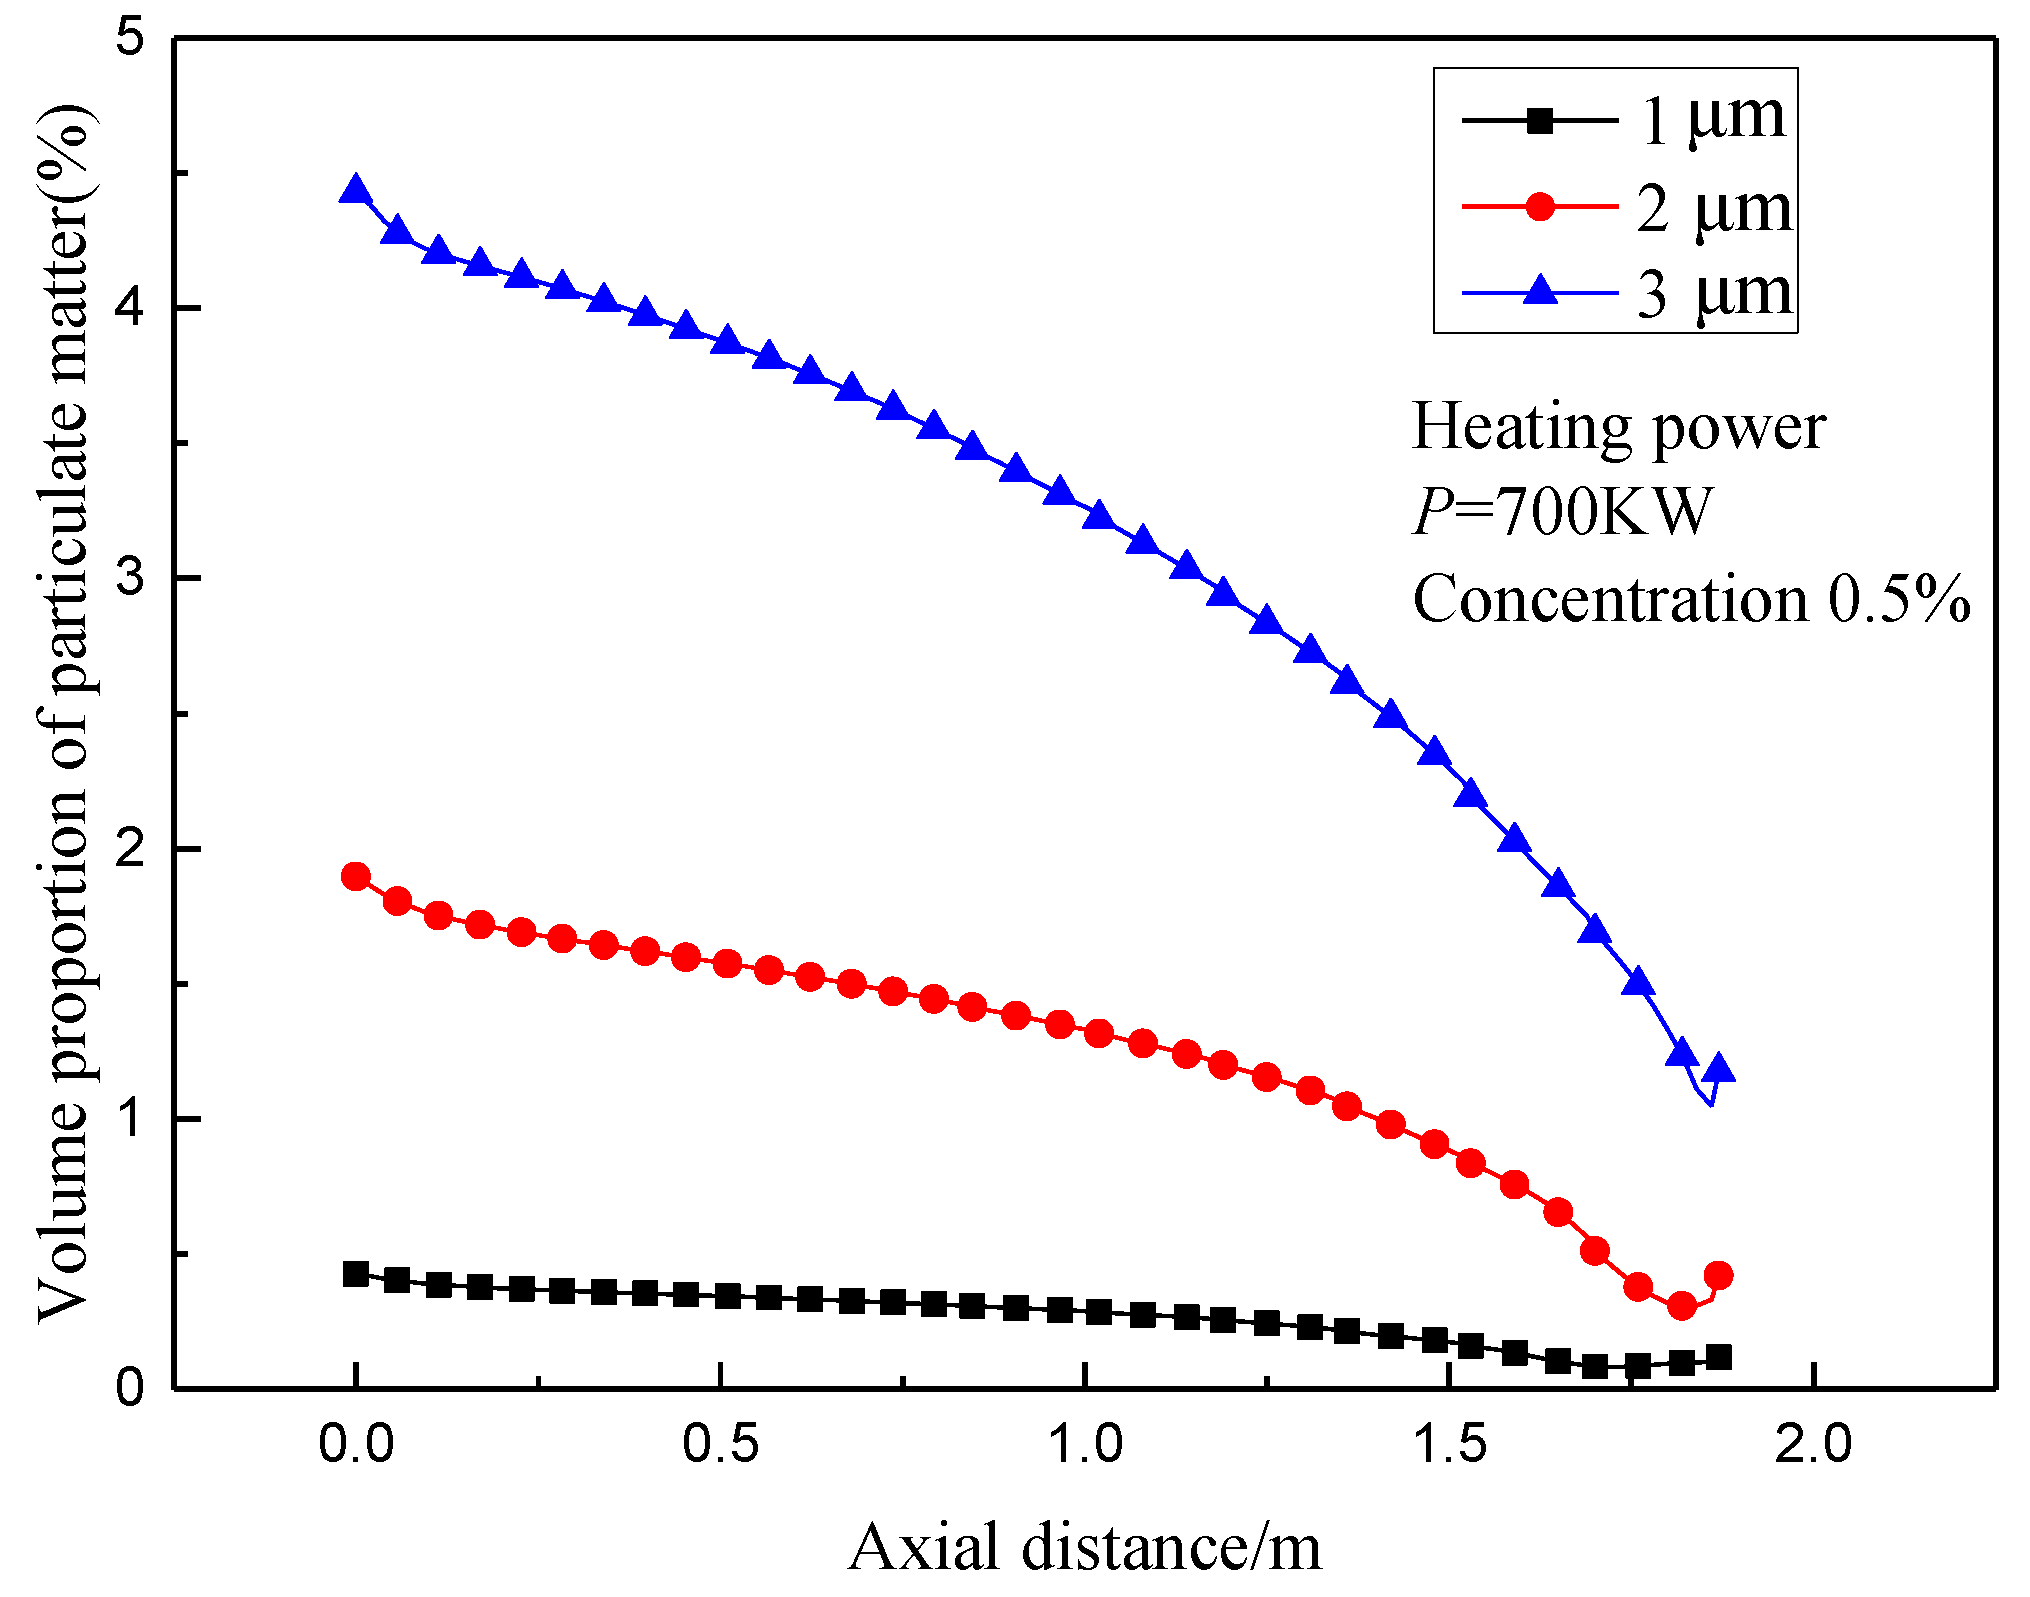
4.3. Particle Concentration Distribution in Supercritical Water

When the initial particle volume fraction reaches 0.5%, the micron-sized particle diameter is found to be 1μm, and the heating power of the heating section measures 700 kW. The simulation calculation of supercritical water natural circulation is carried out.
(1) Particle concentration distribution in the whole loop
Figure 8 presents the calculation results of particle concentration distribution in the whole loop.
As shown in Figure 8, the concentration of particulate matter in the horizontal preheating section gradually decreases from top to bottom in the vertical direction. The concentration of particulate matter near the upper wall being almost zero, while the maximum concentration of particulate matter near the lower wall reaching about 0.69%. During the process of flowing through the elbow after the preheating section, the concentration of particulate matter near the outer wall decreases relative to the horizontal section, and the low concentration area near the inner wall expands. This is because particles in the pipeline sink with gravity, and then particles near the lower wall are deposited and gather at the bottom of the pipe wall under the combined action of thermophoresis force, friction resistance, turbulence force and other forces. During the process of fluid flowing through the elbow, particles follow the fluid to flow close to the outer wall, due to inertia and deposit. In the vertical heating section, particles continue to flow upward following the fluid. However, the density of particles is much higher than that of water, resulting in the fact that the ability of particles to flow with fluid is poor under the action of gravity. Therefore, the concentration of particles in the vertical section is relatively low.
(2) Particle concentration distribution in the heating section
Figure 9 presents the calculation results of particle concentration distribution in the heating section.
As shown in Figure 9, in the inlet section of the heating section, particle concentration presents a swirling vortex state. With the axial flow of fluid, the overall particle concentration decreases, and there is always a high particle concentration area near the wall. The fluid flows through the bent pipe prior to entry into the heating section. After entry into the bent pipe, the inertial force of the fluid applies pressure to the outer wall, and the particles also rush to the outer wall. The pressure difference is formed in the radial direction of the pipe, resulting in swirling vortex. During the axial flow of the fluid in the vertical section, particles are continuously deposited equidistantly around the pipe wall under the combined action of forces, such as viscous force, friction force, and thermophoresis force.

4.4. Correlation Analysis of Heat Flux and Temperature

When the initial particle volume fraction reaches 0.5%, the micron-sized particle diameter is found to be 1 μm, and the heating power of the heating section measures 400 kW to 700 kW. The simulation calculation of supercritical water natural circulation is carried out. Figure 10 presents the calculation results of the fluid temperature distribution in the heating section under different heating powers.
As shown in Figure 10, the fluid in the heating section area is selected, and the detection point is 0.1 mm away from the wall. During the process of fluid from inlet to outlet, the temperature of the fluid rises continuously after being heated. It is indicated that the changing trend is the same under different powers, but the rate of temperature rise increases with the increase of heating power. Under the condition of 400 KW heating power, the fluid has not reached the supercritical temperature. Under the condition of 700 KW heating power, the fluid has reached the supercritical temperature at the axial distance of about 1.3 m and reached the highest temperature at the position of about 1.7m, which has good analysis and research value.

4.5. Correlation Analysis of Heat Flux and Particle Deposition

When the initial particle volume fraction reaches 0.5%, the micron-sized particle diameter is found to be 1μm, and the heating power of the heating section measures 400 kW to 700 kW. The simulation calculation of supercritical water natural circulation is carried out. Figure 11 presents the calculation results of particle concentration distribution in the heating section under different heating powers.
As shown in Figure 11, the fluid in the heating section area is selected, and the detection point is 0.1 mm away from the wall. It is indicated that the concentration of particulate matter in the pipeline declines at a fast pace in the inlet phase, previous to dropping relatively slowly at the middle of the pipeline and decreasing quickly again in the outlet phase. The changing trend of particle concentration tends to be consistent under different heating power conditions, and the higher the heating power, the lower the particle concentration. Under the condition of 700 kW heat flux, particle concentration reached the lowest point at the axial distance of about 1.7 m, and then recovered. This indicates that the heating of the pipeline has a certain inhibitory effect on the deposition of particles. The cause is that the intensified heating of the pipeline contributes to the rise of the flow rate in the heating section, which further leads to an increase in the shear stress applied to the particles. Finally, the particles deposited on the wall under the original low-speed condition are separated from the pipe wall, and the concentration of the particles near the wall is reduced. At the original position of 1.7 m in the pipeline, the fluid temperature reaches the maximum level. Meanwhile, the particle is subjected to the minimum thermophoresis force resulting from temperature difference, for which particle concentration reaches the minimum level. The accumulation of particles easily leads to heat accumulation and heat transfer deterioration. The above results demonstrate that high heat flux density is more conducive to the normal and safe operation for the natural circulation loop.

4.6. Correlation Analysis Between Initial Particle Concentration and Particle Deposition

When the initial particle volume fraction is 0.5% to 2%, the micron-sized particle diameter is found to be 1 μm, and the heating power of the heating section measures 700 kW. The simulation calculation of supercritical water natural circulation is carried out. Figure 12 presents the calculation results of particle concentration distribution in the heating section under different initial particle concentrations.
As shown in Figure 12, the fluid in the heating section area is selected, and the detection point is 0.1 mm away from the wall. Under the condition of different initial particle volume fractions, the variation trend of particle concentration along the axial direction is consistent. The high initial particle volume fraction not only increases the particle concentration in the wall region, but also makes the particle concentration change more obviously in the axial direction and decreases faster. The reason is that the density of a particle is much higher than that of water, therefore, the follow-up of particles to fluid is relatively poor in the vertical section, resulting in particle concentrating decreasing with increasing axial distance. This phenomenon becomes more obvious with the increase of initial particle concentration. The above results demonstrate that low initial particle concentrating is more conducive to the normal and safe operation for the natural circulation loop.

4.7. Correlation Analysis between Particle Diameter and Particle Deposition

When the initial particle volume fraction reaches 0.5%, the micron-sized particle diameter is found to be 1 μm to 5 μm, and the heating power of the heating section measures 700 kW. The simulation calculation of supercritical water natural circulation is carried out. Figure 13 presents the calculation results of particle concentration distribution in the heating section under different particle diameters.
As shown in Figure 13, the fluid in the heating section area is selected, and the detection point is 0.1 mm away from the wall. Under the condition of different particle diameters, the variation trend of particle concentration along the axis is consistent. The increase of particle diameter leads to the increase of particle concentration near the wall, but also makes the change of particle concentration more obvious in the axial direction, and decreases faster. The reason is that the increase of particle diameter leads to the increase of single particle mass, which is not conducive to the particle following the fluid flow. Meanwhile, the particle is affected by gravity as the heating section is vertically placed. The increase of particle size leads to the increase of gravity, which is not conducive to the circulation of particles and aggravates the deposition phenomenon of particles. The above results demonstrate that small particle diameter is more conducive to the normal and safe operation for the natural circulation loop.

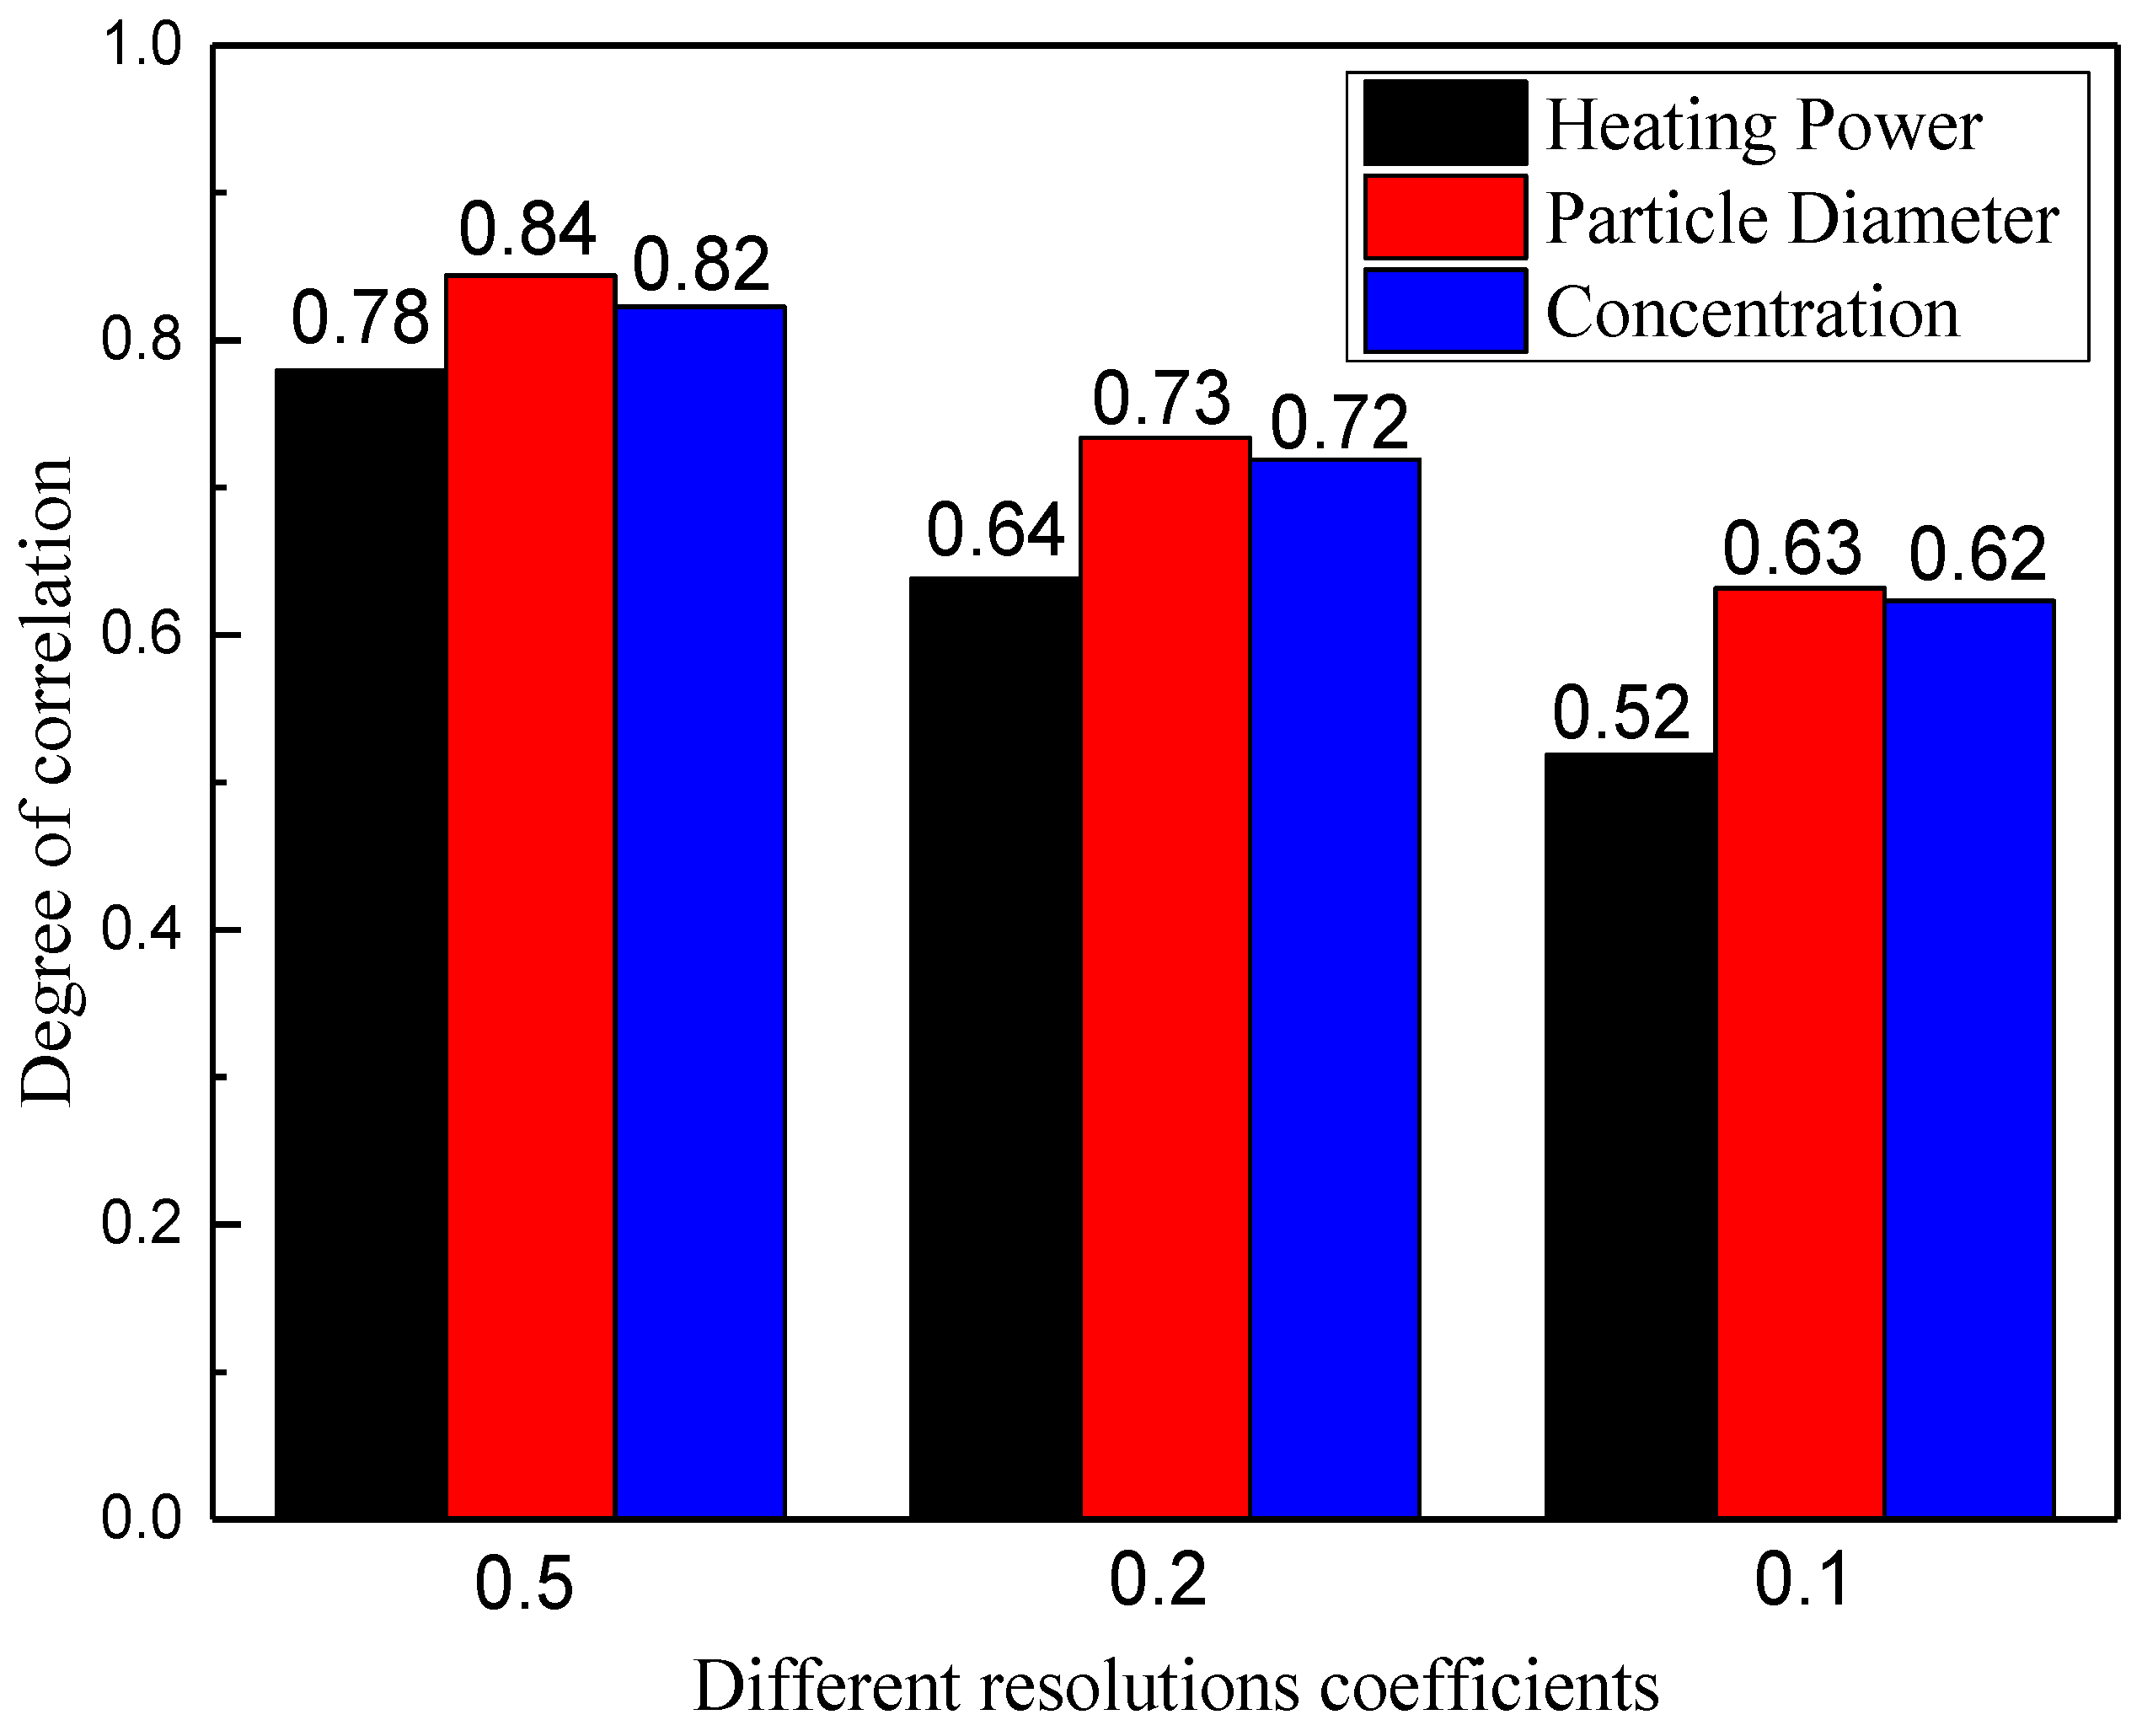
4.8. Grey Correlation Analysis of Parameters and Particle Deposition

The influence degree of heating power, particle concentration and particle diameter on particle deposition are all analyzed by grey correlation degree. The deposition rate is the ratio of particle deposited in the pipeline to all particle, taken as the target parameter, while the heating power, particle concentration and particle diameter are taken as the influencing parameters. The correlation resolution coefficient is calculated by selecting 0.5, 0.2 and 0.1. Figure 14 presents the calculation results.
As shown in Figure 14, the calculation results of the three resolution coefficients of 0.5, 0.2 and 0.1 have the same trend. Depending on the degree of influence, the contributory parameters to particle deposition include particle diameter, particle concentration and heating power in turn. Among these parameters, particle diameter and initial concentration have a great influence on particle deposition, while the power has relatively little influence. The correlation between particle diameter and initial concentration on particle deposition is similar at different resolutions, indicating that the impact on particle deposition is similar.

4.9. Model Verification

In order to validate how accurate the model is, a comparison is drawn between the experimental data of Keigo Karakama [1] and the numerical simulation results, when the heating power is 700 kW, the particle volume fraction is 0.5%, and particle diameter is 1 μm, as shown in Figure 15.
As shown in Figure 15, 0% of the horizontal axis denotes the heating section inlet and the pipe inlet, while 100% of the horizontal axis indicates the heating section outlet and the pipe outlet. During the process of axial flow, the experimental data reveals that the deposition of particulate matter firstly increases and then decreases. In contrast, it has been decreasing in the simulation results. This is because, in the process of the experiment, the particles at the entrance are difficult to deposit as a result of the large shearing force, and the particles are incrementally brought to the middle of the pipeline prior to gradual deposition. In the process of the continual deposition, as the concentration declines, particle deposition phenomenon also gradually diminishes. In the simulation calculation, there is no shear force caused by the inlet, due to its closed loop. Therefore, particle concentration fails to increase first before decrease. Throughout the continual deposition, with the decline in the concentration of particulate matter, particle deposition is observed to diminish gradually. In the axial distance of 0%~40%, the maximum error between experiment and calculation reaches 300%, due to the entrance factor. In the axial distance of 40%~100%, as the influence of entrance factors fades away, the maximum error between experiment and calculation stands at 23.07%, while the average is 19.25%.
In order to ensure the accuracy of the simulation, the heating section is calculated separately to introduce the inlet effect, which compared with the experimental results to verify the accuracy of the model, as shown in Figure 16.
As shown in Figure 16, in this case, the changing trend of experiment and calculation is consistent. This result verifies the accuracy of the analysis on the influence of entrance factors in the paper. Therefore, the simulation results are reasonable.

5. Conclusions

ANSYS software was used to simulate the movement and deposition of particles in supercritical water natural circulation loop. The influences of different heating power, initial particle concentration and particle diameter on particle deposition were calculated and analyzed. Furthermore, according to the results obtained from the calculation, the grey correlation analysis method was used to analyze and compare the influence degree of each parameter on particle deposition.
(1) The heating of the pipeline has a certain inhibitory effect on the deposition of particles. When the heating power increases, the flow rate of the fluid increase, and the deposition weaken, resulting in particle concentration gradually decrease during the axial flow of the heating section. It signifies that high heating power is conducive to the normal and safe operation for the loop.
(2) The increase of initial particle volume fraction enhances the deposition of particles, which increases the overall concentration of particles in the pipeline wall, and makes the particles easier to deposit. It signifies that low volume fraction particles were conducive to the normal and safe operation for the loop.
(3) The increase of particle diameter strengthens the deposition of particles, which leads to the increase of particle concentration near the wall, but also makes the change of particle concentration more obvious in the axial direction, and decreases faster. It signifies that small particle diameter is conducive to the normal and safe operation for the loop.
(4) Depending on the degree of influence, the contributory parameters to particle deposition include particle diameter, particle concentration, and heating power in turn. The correlation between particle diameter and initial concentration on particle deposition is similar at different resolutions, indicating that the impact on particle deposition is similar.
(5) Compared with the experimental results, the simulation results show the same trend without considering the entrance factor. When taken the entrance factor into account, the simulation results and the experimental results still keep the same changing trend, which shows that the simulation results are reasonable.

Author Contributions

Conceptualization, L.Z. and T.Z.; methodology, L.Z.; software, L.Z.; validation, L.Z., X.D. and X.Q.; formal analysis, L.Z.; investigation, J.Z.; resources, L.Z.; data curation, L.Z.; writing—original draft preparation, L.Z.; writing—review and editing, L.Z.; visualization, L.Z.; supervision, L.Z.; project administration, T.Z.; funding acquisition, T.Z.

Funding

This research was funded by Natural Science Foundation of Beijing Municipality, grant number 3172032; This research was funded by Key Laboratory of Thermal and Hydraulic Technology of Nuclear Reactor, grant number 20130901. The APC was funded by Natural Science Foundation of Beijing Municipality.

Acknowledgments

Many people have offered me valuable help in my thesis writing, including my tutor, my classmates, and my parents. Thanks very much.

Conflicts of Interest

The authors declare no conflict of interest.

References

  1. Karakama, K.; Rogak, S.N.; Alfantazi, A. Characterization of the deposition and transport of magnetite particles in supercritical water. Supercrit. Fluids 2012, 71, 11–18. [Google Scholar] [CrossRef]
  2. Ma, D.; Zhou, T.; Li, B.; Feng, X.; Zhang, H. Study on the movement and deposition of particles in supercritical water. Int. J. Heat Mass Transf. 2019, 136, 55–69. [Google Scholar] [CrossRef]
  3. Zhao, X.; Jin, H. Investigation of hydrogen diffusion in supercritical water: A molecular dynamics simulation study. Int. J. Heat Mass Transf. 2019, 133, 718–728. [Google Scholar] [CrossRef]
  4. Liu, J.; Li, H.; Zhang, Q.; Kong, X.; Lei, X. Numerical study on the density wave oscillation of supercritical water in parallel multichannel system. Nucl. Eng. Des. 2019, 342, 10–19. [Google Scholar] [CrossRef]
  5. Liu, X.; Zhou, T.; Li, Z.; Wang, H. Study on Methods of Calculating Heat Transfer Coefficient of Supercritical Water with Grey Theory. In Proceedings of the 18th International Conference on Nuclear Engineering, Xi’an, China, 17–21 May 2010. [Google Scholar]
  6. Liu, J.; Jin, Y.; Zhao, P.; Ge, Z.; Li, Y.; Wan, Y. Analysis of heat transfer of supercritical water by direct numerical simulation of heated upward pipe flows. Int. J. Therm. Sci. 2019, 138, 206–218. [Google Scholar] [CrossRef]
  7. Kong, X.; Li, H.; Zhang, Q.; Guo, K.; Luo, Q.; Lei, X. A new criterion for the onset of heat transfer deterioration to supercritical water in vertically-upward smooth tubes. Appl. Therm. Eng. 2019, 151, 66–76. [Google Scholar] [CrossRef]
  8. Wang, W.; Yang, D.; Liu, W.; Nie, X.; Wang, S.; Bi, Q. Experimental investigation on two-phase flow instabilities of ultra supercritical pressure boiler with spirally water wall tubes. Exp. Therm. Fluid Sci. 2017, 81, 304–313. [Google Scholar] [CrossRef]
  9. Wang, W.; Yang, D.; Liang, Z.; Qu, M.; Ouyang, S. Experimental investigation on flow instabilities of ultra-supercritical water in parallel channels. Appl. Therm. Eng. 2019, 147, 819–828. [Google Scholar] [CrossRef]
  10. Cheng, X.; Zhao, M.; Feuerstein, F.; Liu, X.J. Prediction of heat transfer to supercritical water at different boundary conditions. Int. J. Heat Mass Transf. 2019, 131, 527–536. [Google Scholar] [CrossRef]
  11. Kiss, A.; Balaskó, M.; Horváth, L.; Kis, Z.; Aszódi, A. Experimental investigation of the thermal hydraulics of supercritical water under natural circulation in a closed loop. Ann. Nucl. Energy 2017, 100, 178–203. [Google Scholar] [CrossRef]
  12. Liao, Y.; Lucas, D. 3D CFD simulation of flashing flows in a converging-diverging nozzle. Nucl. Eng. Des. 2015, 292, 149–163. [Google Scholar] [CrossRef]
  13. Liao, Y.; Lucas, D. Possibilities and Limitations of CFD Simulation for Flashing Flow Scenarios in Nuclear Applications. Energies 2017, 10, 139. [Google Scholar] [CrossRef]
  14. Han, Z.; Xu, Z.; Yu, X.; Sun, A.; Li, Y. Numerical simulation of ash particles deposition in rectangular heat exchange channel. Int. J. Heat Mass Transf. 2019, 136, 767–776. [Google Scholar] [CrossRef]
  15. Li, Y.; Gu, W.; Wang, D.; He, J. Direct numerical simulation of polydisperse aerosol particles deposition in low Reynolds number turbulent flow. Ann. Nucl. Energy 2018, 121, 223–231. [Google Scholar] [CrossRef]
  16. Lu, H.; Lu, L.; Jiang, Y. Numerical simulation of particle deposition in duct air flows with uniform, expanding or contracting cross-section. Energy Build. 2016, 128, 867–875. [Google Scholar] [CrossRef]
  17. Li, P.; Zhang, X.; Lu, X. Dissociation Behaviors of CO2 Hydrate-Bearing Sediment Particle during Settling in Water. Energies 2018, 11, 2896. [Google Scholar] [CrossRef]
  18. Zhang, F.; Liu, Z.; Liu, Z.; Liu, Y. Experimental Study of Particle Deposition on Surface at Different Mainstream Velocity and Temperature. Energies 2019, 12, 747. [Google Scholar] [CrossRef]
  19. Inthavong, K. A unifying correlation for laminar particle deposition in 90-degree pipe bends. Powder Technol. 2019, 345, 99–110. [Google Scholar] [CrossRef]
  20. Chang, Y.-C.; Chiu, T.-Y.; Hung, C.-Y.; Chou, Y.-J. Three-dimensional Eulerian-Lagrangian simulation of particle settling in inclined water columns. Powder Technol. 2019, 348, 80–92. [Google Scholar] [CrossRef]
  21. Tao, C.; Zhao, G.; Yu, S.; Peng, W.; Wang, J. Experimental study of thermophoretic deposition of HTGR graphite particles in a straight pipe. Prog. Nucl. Energy 2018, 107, 136–147. [Google Scholar] [CrossRef]
  22. Frederix, E.M.A.; Kuczaj, A.K.; Nordlund, M.; Bělka, M.; Lizal, F.; Jedelský, J.; Geurts, B.J. Simulation of size-dependent aerosol deposition in a realistic model of the upper human airways. J. Aerosol Sci. 2017, 115, 29–45. [Google Scholar] [CrossRef]
  23. Jia, L.; Zhang, L.; Yu, S. Deposition of non-spherical microparticles in the human upper respiratory tract. Particuology 2018, 36, 185–189. [Google Scholar] [CrossRef]
  24. Lintermann, A.; Schröder, W. Simulation of aerosol particle deposition in the upper human tracheobronchial tract. Eur. J. Mech. B/Fluids 2017, 63, 73–89. [Google Scholar] [CrossRef]
  25. Song, M. Study on Transcritical Natural Circulation Flow Instabilities; North China Electric Power University: Beijing, China, 2016. [Google Scholar]
  26. ANSYS, Inc. ANSYS CFX Solver Theory Guide; ANSYS, Inc.: Canonsburg, PA, USA, 2015. [Google Scholar]
Figure 1. (a) Experimental equipment for supercritical water natural circulation; (b) Model for supercritical water natural circulation.
Energies 12 02315 g001aEnergies 12 02315 g001b
Figure 2. Properties of supercritical water (25 Mpa).
Energies 12 02315 g002
Figure 3. Grid division of supercritical water natural circulation loop.
Energies 12 02315 g003
Figure 4. Calculation process.
Energies 12 02315 g004
Figure 5. Temperature distribution of supercritical water natural circulation loop.
Energies 12 02315 g005
Figure 6. Velocity distribution of supercritical water natural circulation loop.
Energies 12 02315 g006
Figure 7. Velocity distribution in the heating section.
Energies 12 02315 g007
Figure 8. Particle concentration distribution of supercritical water natural circulation loop.
Energies 12 02315 g008
Figure 9. Particle concentration distribution in the heating section.
Energies 12 02315 g009
Figure 10. Fluid temperature distribution in the heating section under different heating powers.
Energies 12 02315 g010
Figure 11. Particle concentration distribution in the heating section under different heating powers.
Energies 12 02315 g011
Figure 12. Particle concentration distribution in the heating section under different initial particle concentrations.
Energies 12 02315 g012
Figure 13. Particle concentration distribution in the heating section under different particle diameters.
Energies 12 02315 g013
Figure 14. Correlation degree of particle deposition parameters.
Energies 12 02315 g014
Figure 15. Comparison of simulated calculation data with experimental data.
Energies 12 02315 g015
Figure 16. Comparison of simulated calculation data with experimental data (heating section separately).
Energies 12 02315 g016
Table 1. Boundary Condition Parameter Setting.
Serial NumberNameUnitValue
1Static system pressureMpa25
2Wall temperature of preheating section K500
3Heat flux density of heating sectionkW/m2400–700
4Wall temperature of cooling section K300
5Roughness of pipe wallm1.0 × 10−5
6Turbulent Prandtl number0.9
7Initial temperature of fluidK300
8Particle concentration (volume proportion)%0.5–2
9Particle diameterμm1–3

