1. Introduction
The power distribution based on copper busbar systems are used on large scale and have been accepted more and more due to their flexibility, safety and ability to reduce overall design and integration costs in industrial systems. Moreover, the globalization has prompted industrial control engineers to choose design techniques, electrical components, and industrial integration methods worldwide, based on increasingly complex busbar systems [
1].
Power distribution systems which are using copper busbars have an innovative quality that traditional distribution methods based on cables can not offer. Thus, the new techniques with copper busbars provide the most efficient placements and the simplification of the bill of materials for the control panels. Actually, a busbar system replaces two important elements placed into a typical control panel: power distribution block and the connection cables. With the removal of the power distribution block and the connection wires, the designers can decrease the overall dimensions of the control panel [
1,
2]. In addition to design cost savings, a lower overall industrial control panel implies a lower price for the entire electrical system.
Using traditional techniques, the power distribution is achieved through the connection of the main circuit breaker to a power distribution block with large dimensions parallel cables. In turn, the power distribution block individually feeds each component on the industrial panel. Thus, not only does it occupy a significant space on the panel, but it takes a long time to work when considering all measurements, cutting, labeling, pickling and routing the cables. As mentioned before, a copper busbar system replaces the power distribution block and the connection cables which greatly reduces the time it takes to fully integrate the control panel [
2]. When there is a power distribution to large components mounted on the industrial panel, as drive systems or power circuit breakers, a busbar system can be used in order to replace the large overall sizes parallel cables which connect the main distribution block to devices in adjacent enclosures.
The power distribution systems based on copper busbars offer a number of significant advantages for designers, integrators and industrial control panel users. The busbar systems provide an economical and highly organized power distribution way, which can lead to the decreasing of total costs due to the design and integration of control panels. These systems are widely used around the world and are manufactured in accordance with international standards and norms, which simplifies the implementation process in different international markets.
On the other hand, the busbars allow saving materials thanks that there are necessary fewer connections on current path. The copper of which they are manufactured busbars allow to obtain electrical contacts through simple stamping so, no connection elements are required. This one allows for a time saving during installation.
Connections of the busbars in switchgears are studied from the point of view of the electrical contact resistance and of the temperature (tests and thermal simulations), with some parameters such as: contact pressure, overlap length, and the arrangement of the connections [
3]. Measuring the temperature is important because the permanent monitoring can increase the energy transmission efficiency in medium and high voltage and high current switchgear, as described in [
4]. Online monitoring of the temperature is important for the reliability and stable operation of the power system [
5]. For the buses operating at high voltage it is difficult to measure directly their temperature. For online monitoring, a method to measure temperature of the busbar is presented in [
6], with hardware and software description.
In [
7] a fault analysis for a substation of 420kV with double busbar has been considered. It has been paid attention to the protection and how it works. There are quite seldom faults, usually due to failure in the protection system functionality. Temperature measurement on a 10kV fully insulated busbar is studied in [
8], also for the joint conductor, for which the temperature rise is lower because of the heat dissipation. The temperature can be decreased by using slots in the contact area, as presented in [
9]. In some special cases the busbar is water-cooled, as for a thermonuclear reactor [
10]. The temperature is estimated in busbar, for the cooling water and air, a very important aspect being to calculate the force convection heat transfer inside the busbar cooling water-channel.
The harmonic currents given by the single-phase electronic loads into the network generate heat with negative effects over the busbar system. These currents have to be considered when a busbar is designed and selected, resulting a better solution than a neutral conductor with special design [
11]. Current harmonics in busbars and their influence over the busbar are also studied as in [
12] considering the currents from a 3-pulse rectifier in order to estimate their effects over the forces which may affect the busbar deformation, supplementary vibrations or insulation break. Current phase comparison is presented [
13] as a new method to achieve reliable busbar protection with minimum current transformer performance requirements, with increased the stability of the protection.
Different software can be used for modeling the busbars. In [
14] Quich Field software is used for modeling an encapsulated busbar for high voltage, by considering coupling the magnetic field aspects with heat aspects both in stationary and in transient regimes. Opera 2D software can be also used to estimate the distribution of the temperature in three-phase busbar system, as in [
15]. PSCAD and MATLAB software are also used for the simulation of different fault situations in busbar protection [
16]. Vertical and horizontal arrangement of the busbar is considered in order to study the short-circuit effects [
17]. Vertical busbar has over 2 times higher electromagnetic force comparing to the horizontal busbar.
Some protections use busbar protection and advanced zone selection for multiple busbar arrangements with minimum performances requirements for the current transformer [
18]. Epoxy coated busbar system is investigated in [
19]. For a current of 2000A thermal aspects are studied along the length of the busbar considering the heat distribution by conduction, radiation and convection. For busbars the optimization of the shape and topology are important in order to assure an equal power distribution among the components, as presented in [
20]. Busbar geometry without supporting epoxy resin insulators are considered in [
21] with testing and FEM analysis, for a medium voltage switchgear geometry.
Multi-layer laminated busbar is designed in [
22] for power electronic block, with improved interconnection between the capacitor bank and the semiconductor devices and with low-stray inductance, and so with low voltage stress operation. For the laminated busbar topology optimization also enables balancing the materials consumption (especially copper) with the maximum temperature and stray inductance of the busbar [
23,
24]. Different plating contact surfaces have impact over the temperature distribution at busbar connection, silver plating having the lower contact resistance and lower temperature, as demonstrated in [
25]. The temperature variation in the three phase gas insulated switchgear busbar (in the conductor and shield tank) is determined in [
26]. A scaling method is used in [
27], also for the temperature rise estimation in gas insulated busbar for steady state and transient regime.
Therefore, in the previous works, the authors focused on the current harmonic influences on busbar behaviour, temperature measuring methods (on-line) of busbars, protection and analysis of busbars from power electronics block. Also, it has been presented some thermal simulations of the busbars during fault situations using some common commercial software packages without specifying any mathematical model.
Hence, the purpose of this work is to analyze the temperature distribution along a busbar connection from a power assembly used to supply a test bench for low voltage circuit breakers. The analysis will be performed during steady-state operating conditions. First, it will obtain a mathematical model of the temperature distribution. Then, the theoretical results will be compared with simulated values of a three dimensional thermal model of the same busbar. Finally, some experimental tests will be performed in order to validate the proposed model of the busbar. In fact, the novelty of this work is the mathematical model which includes the temperature variation of the electrical resistivity of the busbar material and the contact resistances at the end terminals of the busbar. This thermal model can be used to investigate simply and quicly the thermal behaviour of the busbar during steady-state conditions.
2. Mathematical Model
There are many practical situations when it is necessary to investigate the thermal behaviour of different types of busbars in a simple and fast way without using expensive dedicated software package. More, the nowadays modelling and simulation softwares require a large amount of hard disk space, RAM memory and a very high speed processor. Knowing the thermal load, the geometry and material parameters of the busbar, the proposed mathematical model can be used to calculate the temperature distribution along the busbar during steady-state conditions. The mathematical model takes into consideration the temperature variation of the electric resistivity of the busbar material and also the end terminal contact resistances of the busbar.
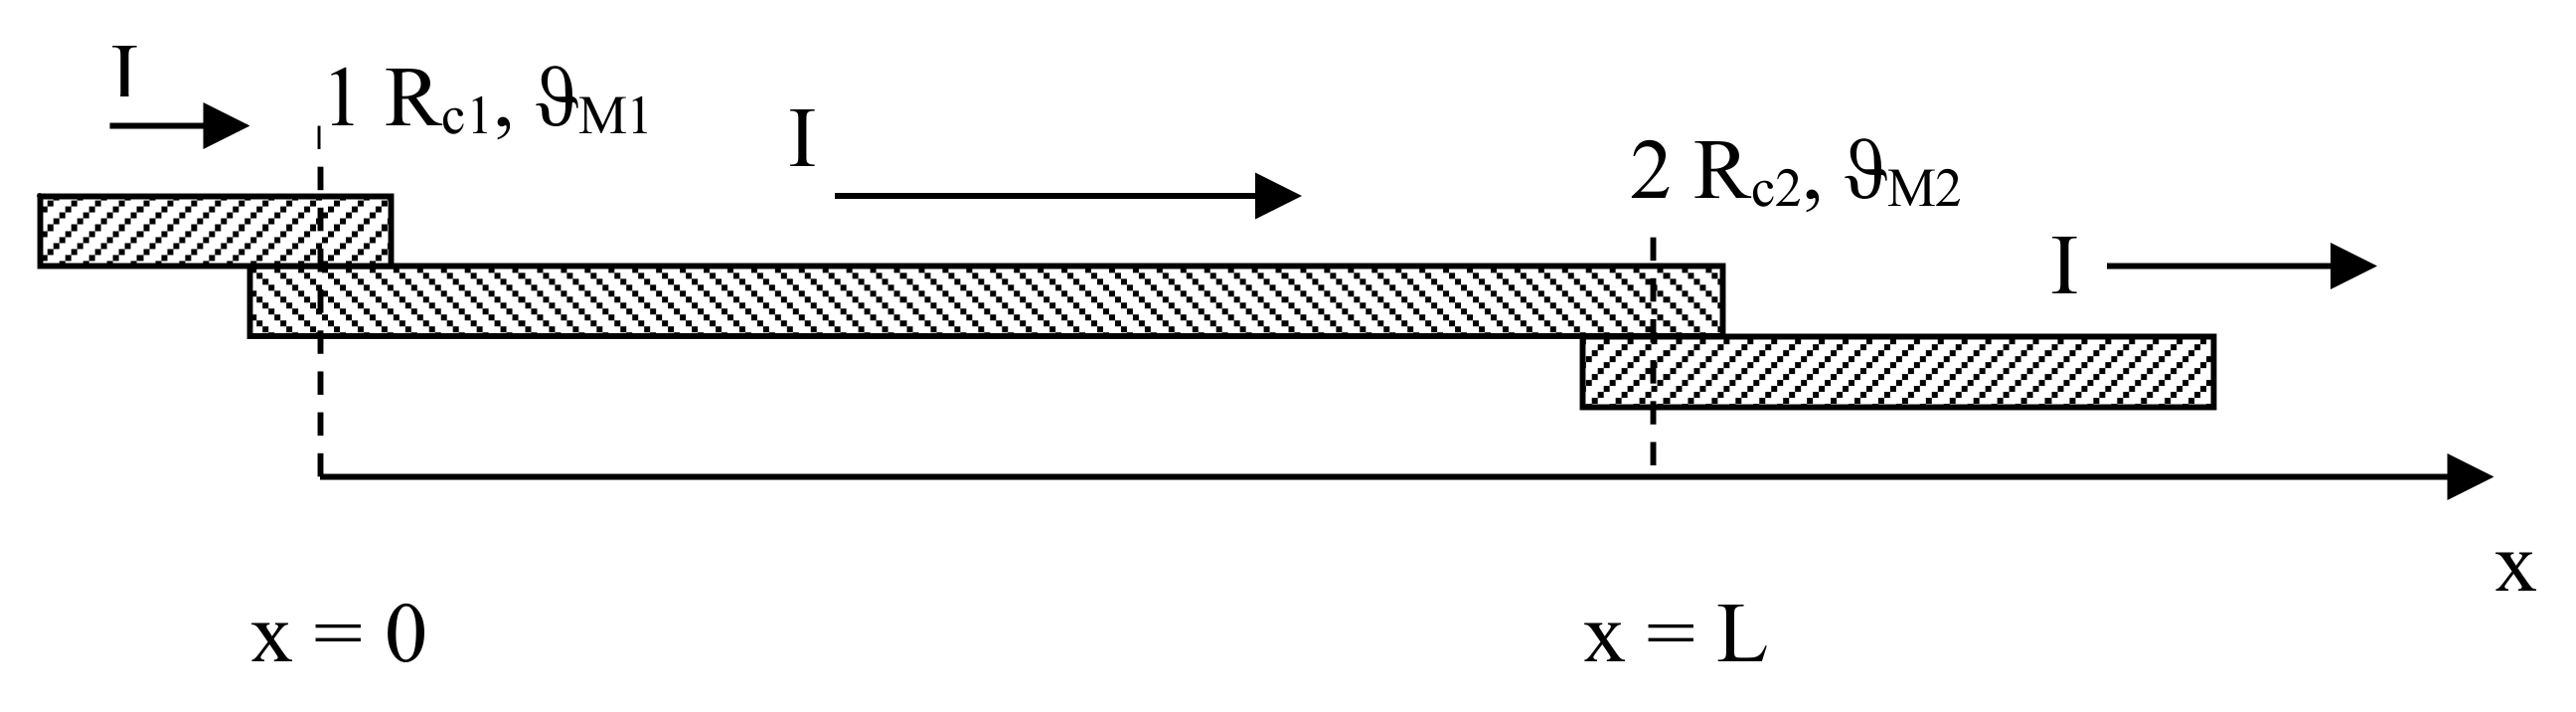
The thermal power balance, for one-direction, x,
Figure 1, of the general differential equation of busbars heating with variable cross-section has the following expression [
2,
28]:
The left term of equation denotes the heating power from the current flow. It is in balance with the heat stored by temporal change of temperature, the power removed from the element by thermal conduction and the thermal flux dissipated through the lateral surface of the conductor.
In the above heating equation, the temperature variation of electric resistivity is important and could be considered like a parabolic or linear variation. The difference between these two types of variation is small, and because of calculus simplification, the linear form has been chosen:
where,
It knows that the value of global heating transmission coefficient, k, depends on the temperature. In order to obtain a useful temperature rise calculation formula, it supposed an average value for the heating transmission coefficient which not depends on length x of the busbars.
Using the equations (2) and (3) into the thermal power balance expression (1), it gets the following temperature rise equation in the steady-state conditions:
This is a 2nd order differential equation with constant coefficients and non-zero free term. The general solution of this type of differential equation is:
where
A1 and
A2 mean integration constants which can be established from limit conditions and a, is the root of characteristic differential equation, with the expression:
The limit conditions can be written as:
where the contact thermal powers
P1 and
P2 are:
Within the contact points 1 and 2, it has been considered for the both electric contacts that a half of the thermal power spreads to the left of the contact point and the other half goes to the right of the contact,
Figure 1. The assumption is that the busbar is a homogenous type. Thus, results the expressions for the integration constants
A1 and
A2,
Thus, after computing the integration constants,
A1 and
A2, the equation (5) becomes,
which means the temperature rise evolution along the busbar length when the values of the contact resistance at the terminals of the busbar are known.
The temperature rise values of the end terminals of the busbar, have the following relations:
and,
3. Three-Dimensional Thermal Model
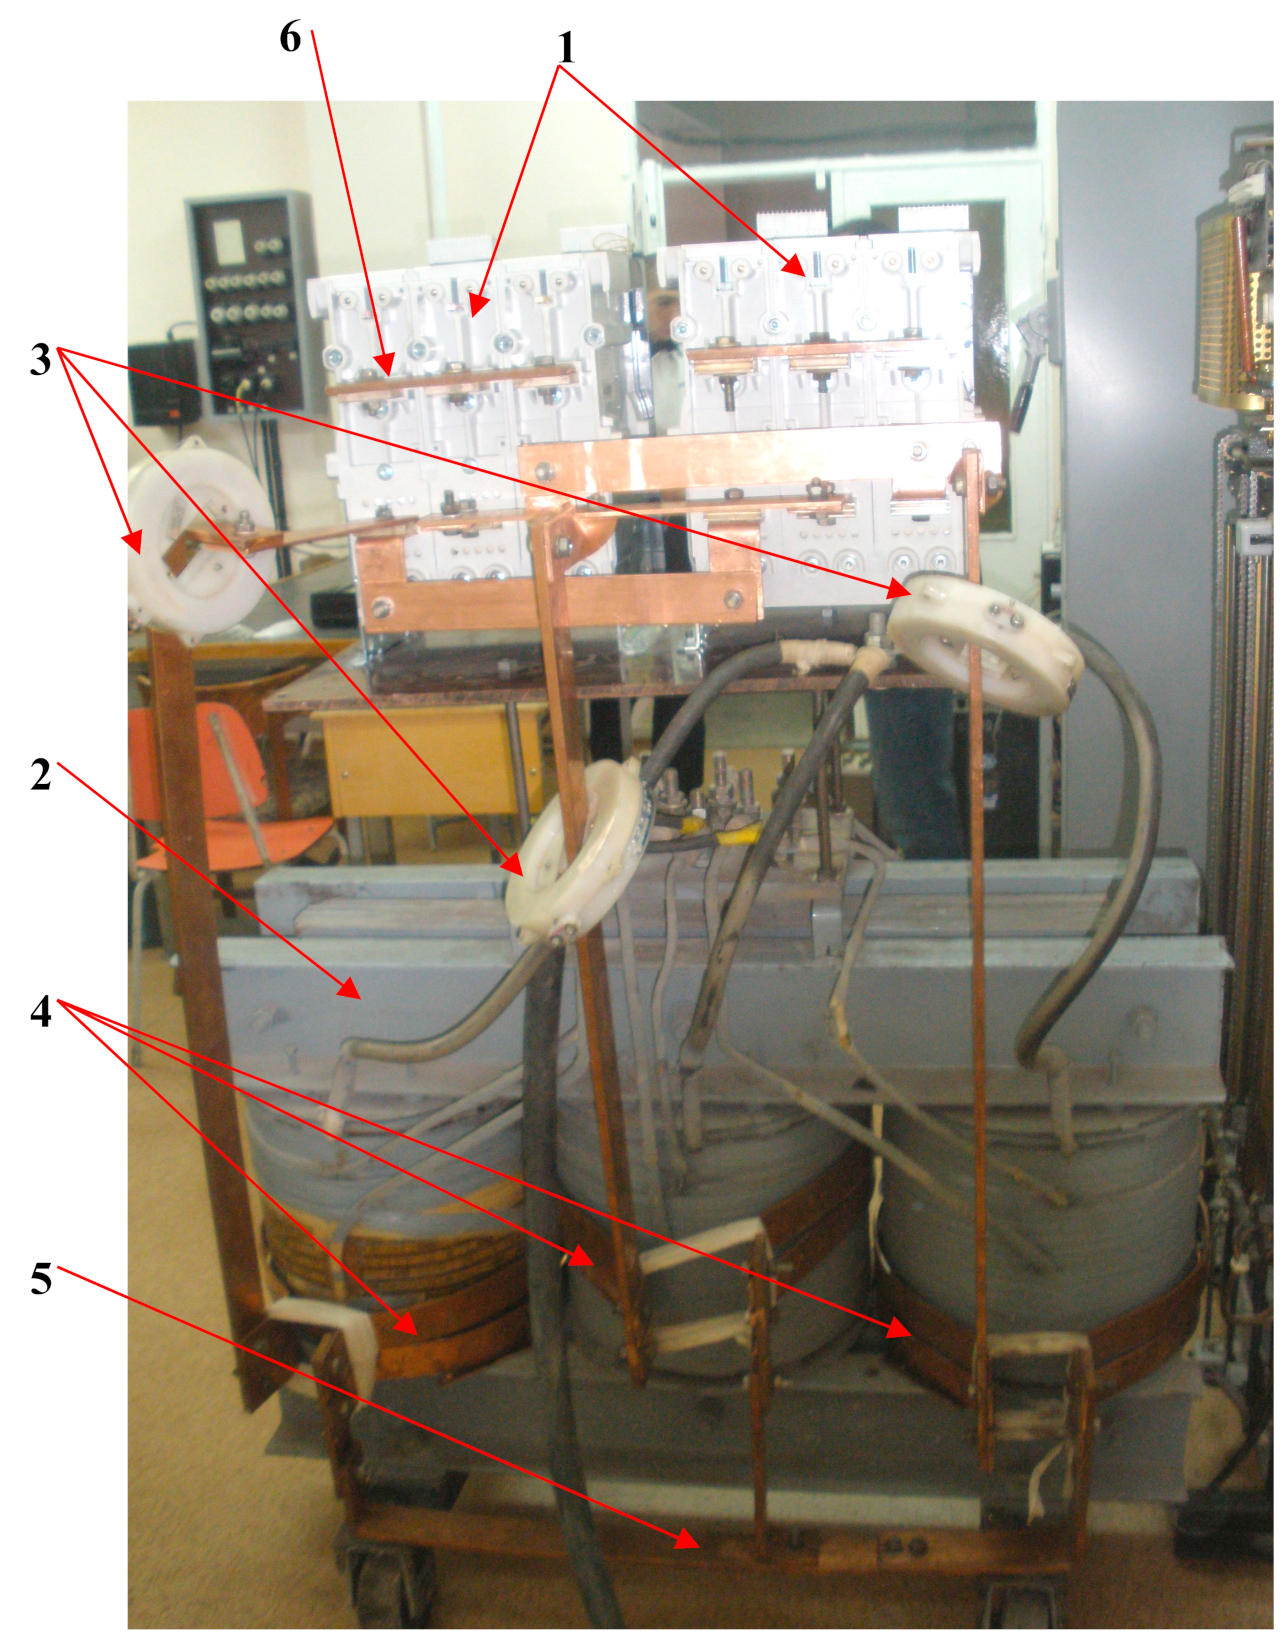
It has been studied a busbar power assembly which feeds two low voltage power circuit breakers connected in short-circuit. In this way, the power electrical equipment can be tested at high current values. The power supply system has been built as a three-phase high current source. In
Figure 2 the main components of the power installation, have been outlined. The main grid feeds a three-phase autotransformer which supplies the high current source. In fact, this current source means a power three-phase transformer which has on the primary side voltage values up to 440 V and on the secondary side the electric current can reach values up to 12 kA. Because of these important output current values, all the electrical connections between the secondary side of the current source and the power circuit breakers, have been done with copper busbars.
A three-dimensional busbar power assembly which makes the electrical connections between the high current power source and the circuit breakers, has been achieved with the dedicated software package, the Pro-ENGINEER. This software module allow to achieve the 3D geometry of the busbar structure. The three dimensional model of the busbar took into consideration all the components of the power assembly,
Figure 3: two turns on each phase of the high current source, busbar links between terminals of the secondary side of the current source to the current path of the circuit breakers, electrical star connection on secondary side and short-circuit busbar on the output terminal of the circuit breaker, [
28].
Because, the rated current of the tested circuit breakers is 1000 A, it has been assumed the tested current about 1300 A on each phase. The measurements led to a value of 0.288 mΩ for the electric resistance of the busbar power assembly. Therefore, the power losses will be,
The thermal simulations have been performed using the Pro-MECHANICA software module which is based on the finite element method. Actually, this software module gets the 3D geometry from the previous module and it will perform all the necessary thermal simulations. In the
Table 1, there is specified the values of the physical parameters that characterize the busbar power assembly in accordance with
Figure 3, [
28]. As input for the Pro-MECHANICA module, the thermal load was considered as uniform volume heat source into busbar power assembly.
The mesh of this 3D busbar thermal model has been done using tetrahedron solids element types having the next allowable angle limits (measurement unit: degrees): maximum edge: 175; minimum edge: 5; maximum face: 175; minimum face: 5. The maximum aspect ratio was 30 and the maximum edge turn (measurement unit: degrees): 95. The geometry tolerance had the next values: minimum edge length: 0.0001; minimum surface dimension: 0.0001; minimum cusp angle: 0.86; merge tolerance: 0.0001. The single pass adaptive convergence method to solve the thermal steady-state simulation has been used.
After some experimental tests, it has been calculated the convection coefficient with a value of 14.3 W/m2 °C. As boundary condition it has been considered the thermal convection from the busbar assembly to the environement. As input for the Pro-MECHANICA module, the convection value was applied on the outer surfaces of the busbar components. It has been considered a uniform spatial variation. The bulk temperature was about 25 °C. The busbars are made from copper with the cross-section of 50 mm × 10 mm.
Forwards, some thermal simulations have been performed during steady-state conditions. The thermal spectrum of the busbar power assembly is presented in
Figure 4, as a result of Pro-MECHANICA software simulations. The maximum temperature rise value, 63.3 °C is observed on the busbars which make the star connection, and the minimum temperature rise value of 27.6 °C is noted on the upper busbars. The output terminals of the power circuit breaker have been short-circuited. These values are due to the proximity of the star connection busbars with the thermal source from the secondaries of the high current supply. So, its temperature rise is higher than the upper busbar connection that makes the short-circuit condition for the tested power circuit breaker. On the other hand, the length of the busbar connection from the secondary terminal to the upper short-circuit busbar, has an important value. So, the external busbar surfaces lead to lower temperatures because of convection and radiation thermal transfer to the environment. For the middle busbar, there is a temperature rise variation from ϑ
M1 = 51.2 °C, on the connection with the two turns on the secondary of high current supply, to ϑ
M2 = 30.3 °C on the terminal of the upper side of the busbar.
4. Discussion of the Results
Considering the solution for the equation of temperature rise (10), it can be analyzed the influence of electrical and geometrical parameters on the busbar heating. Further on, the thermal analysis refers to the middle busbar of the high current power supply assembly, which makes the connection between the two turnes of the secondary side and the middle upper terminal of short-circuit connection in order to test power circuit breakers. The busbar is made from copper with the following physical parameters: ρa = 1.72 × 10⁻⁸ Ωm, λ = 385 W/m°C, α0 = 4·× 10–3 1/°C. It has been measured the following contact resistances: Rc1 = 10 μΩ, on the junction with secondary turns, and Rc2 = 5 μΩ, on the upper terminal of the busbar.
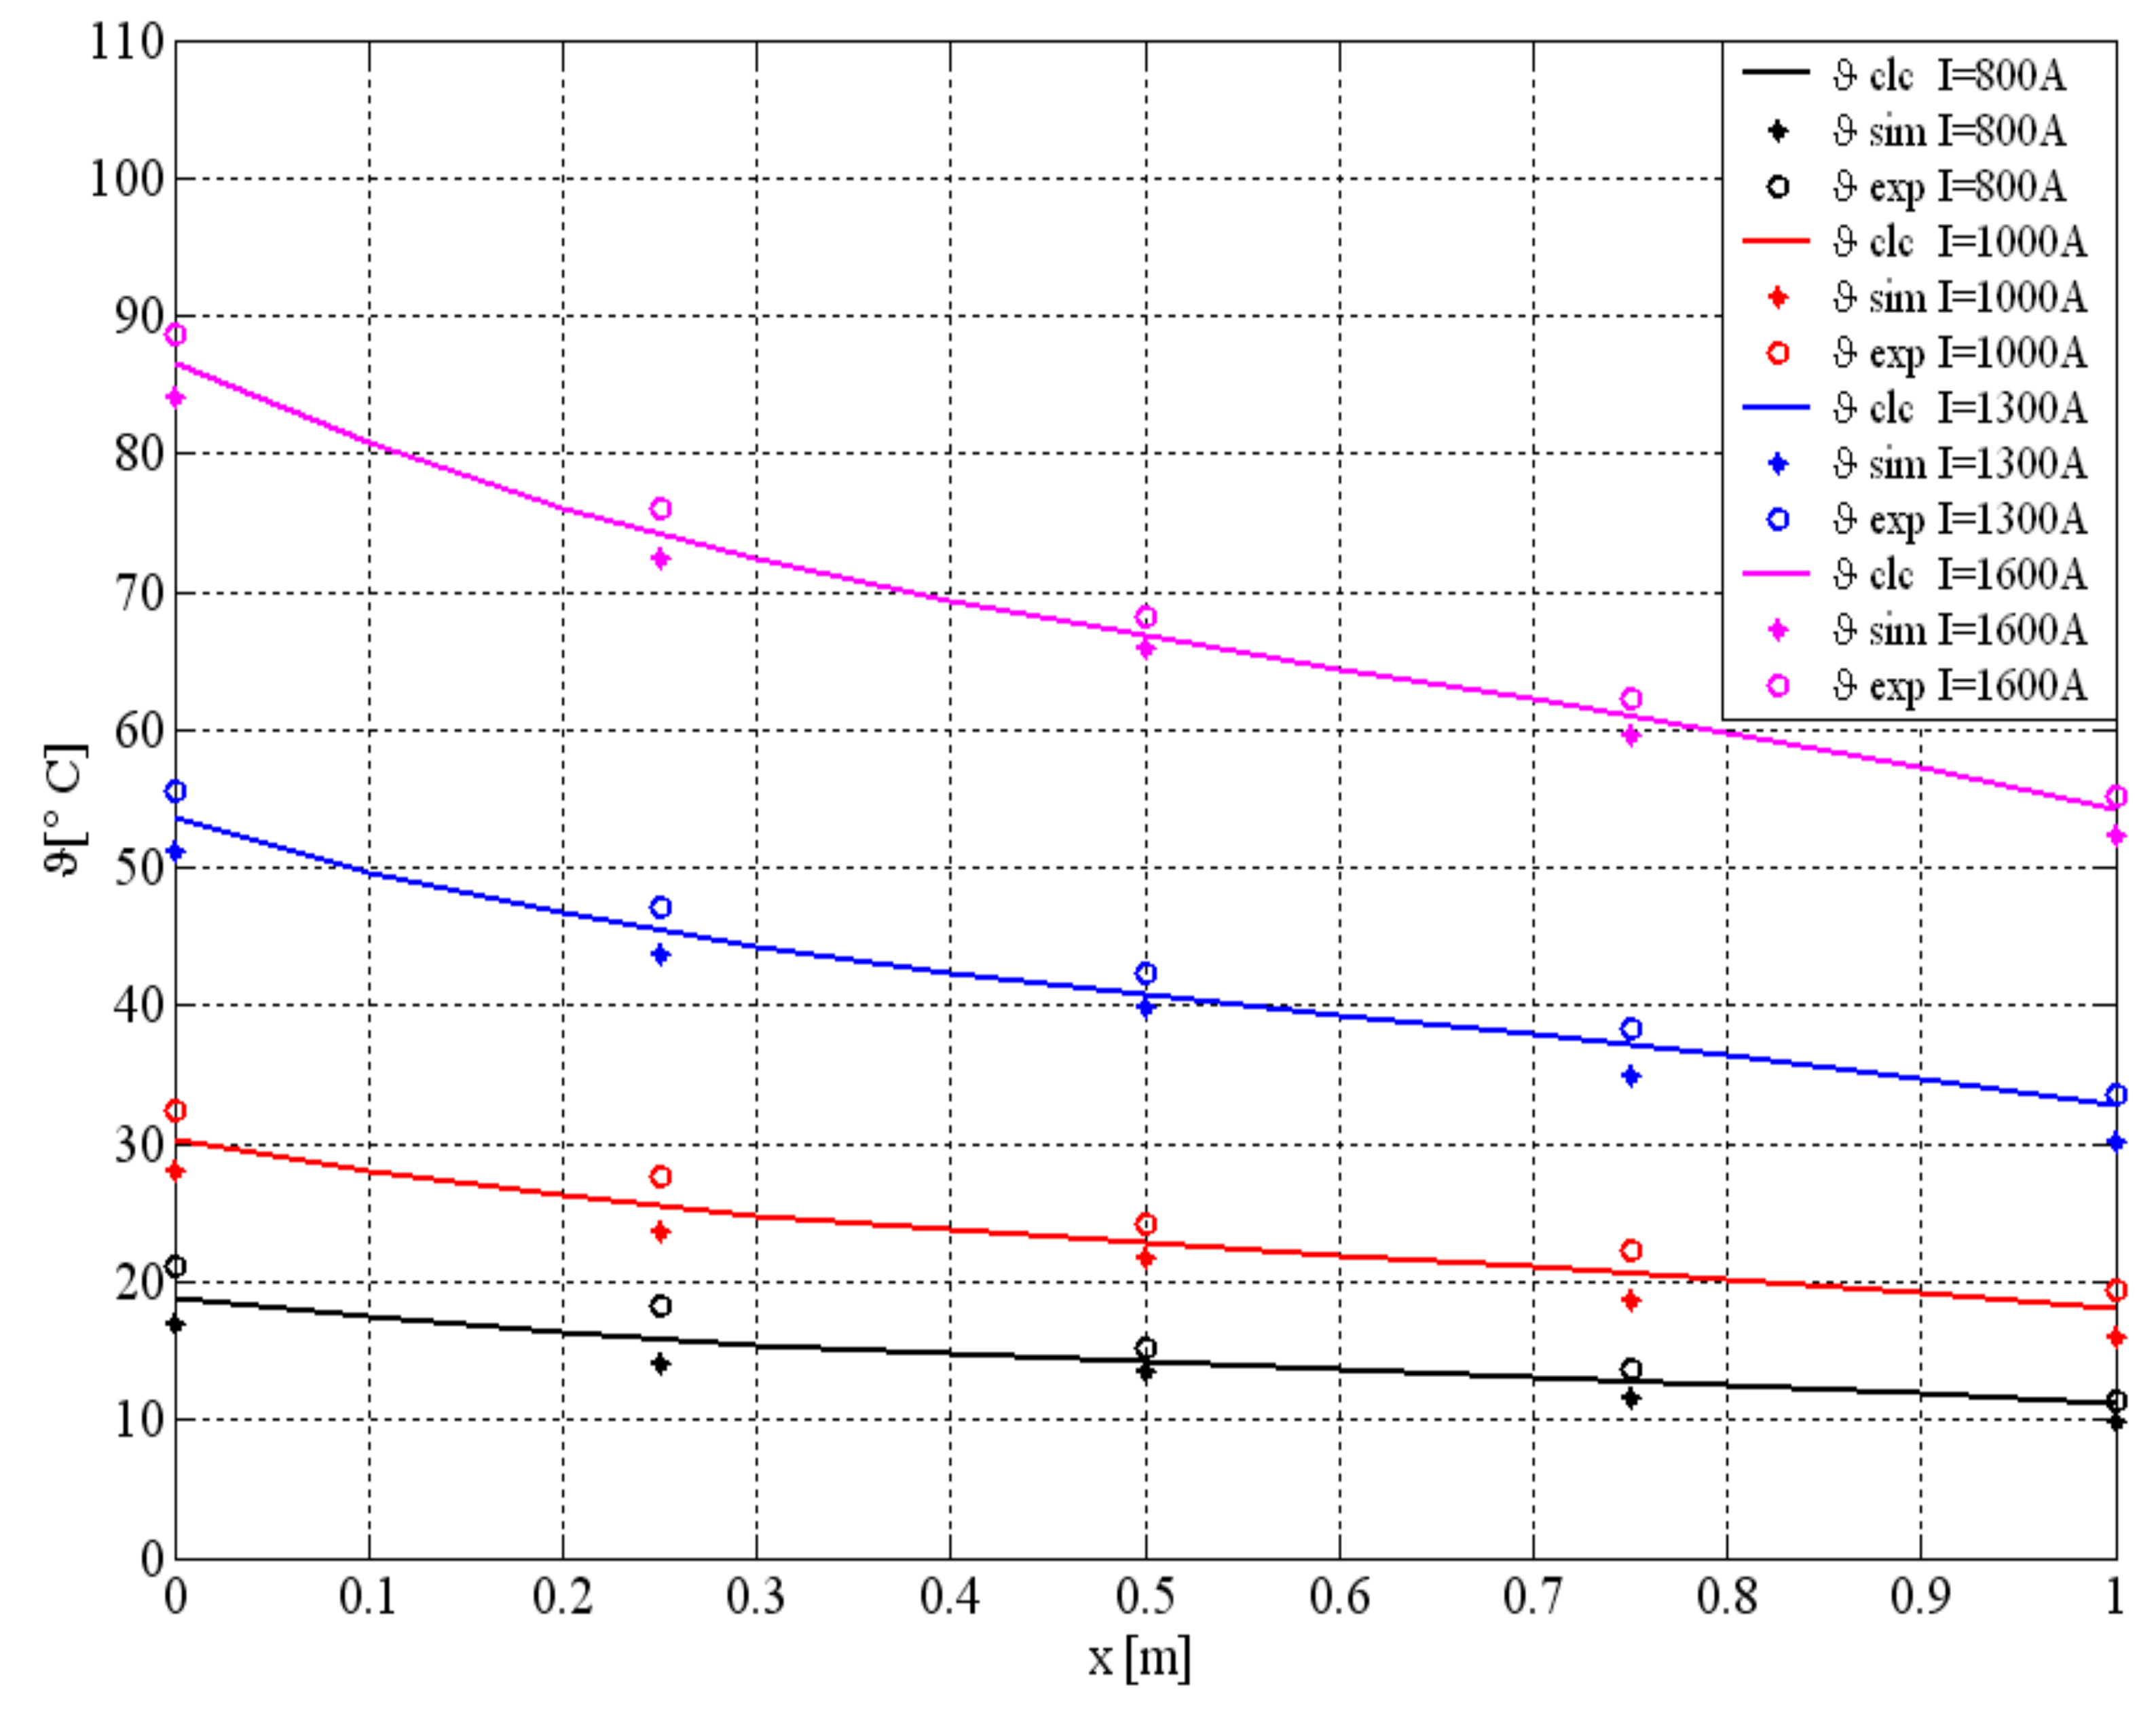
The first analysis took into consideration the variation of the electric current through the busbar, from 800 to 1600 A,
Figure 5.
As expected, the temperature of the conductor increases as the current increases. For 800 A, the difference between the terminals of the busbar (x = 0 m and x = 1 m) is about 7.7°C. (ϑM1 = 18.9 °C and ϑM2 = 11.2 °C). When the electric current has the value of 1600 A, the difference between the terminals’ temperature rise is increased at 32.4°C (ϑM1 = 86.6 °C and ϑM2 = 54.2 °C). This is because the temperature rise and the temperature along the busbar are directly proportional with the square current through the conductor. It can be observed that the simulation values are lower than the calculated ones, especially at the terminals of the busbar. For instance, at 800 A, the temperature rise values at terminals are ϑM1 = 16.9 °C and ϑM2 = 9.8 °C, respect to ϑM1 = 18.9 °C and ϑM2 = 11.2 °C, the calculated values. Also, in the case of 1600 A, the simulated values of busbar terminals are ϑM1 = 84.1°C and ϑM2 = 52.4 °C, respect to ϑM1 = 86.6 °C and ϑM2 = 54.2 °C, the calculated values. This is explained because the terminals of the busbar are connected with other busbar conductors, therefore, in the contact points (1 and 2) the link conductors act as a real hetasink for the main busbar.
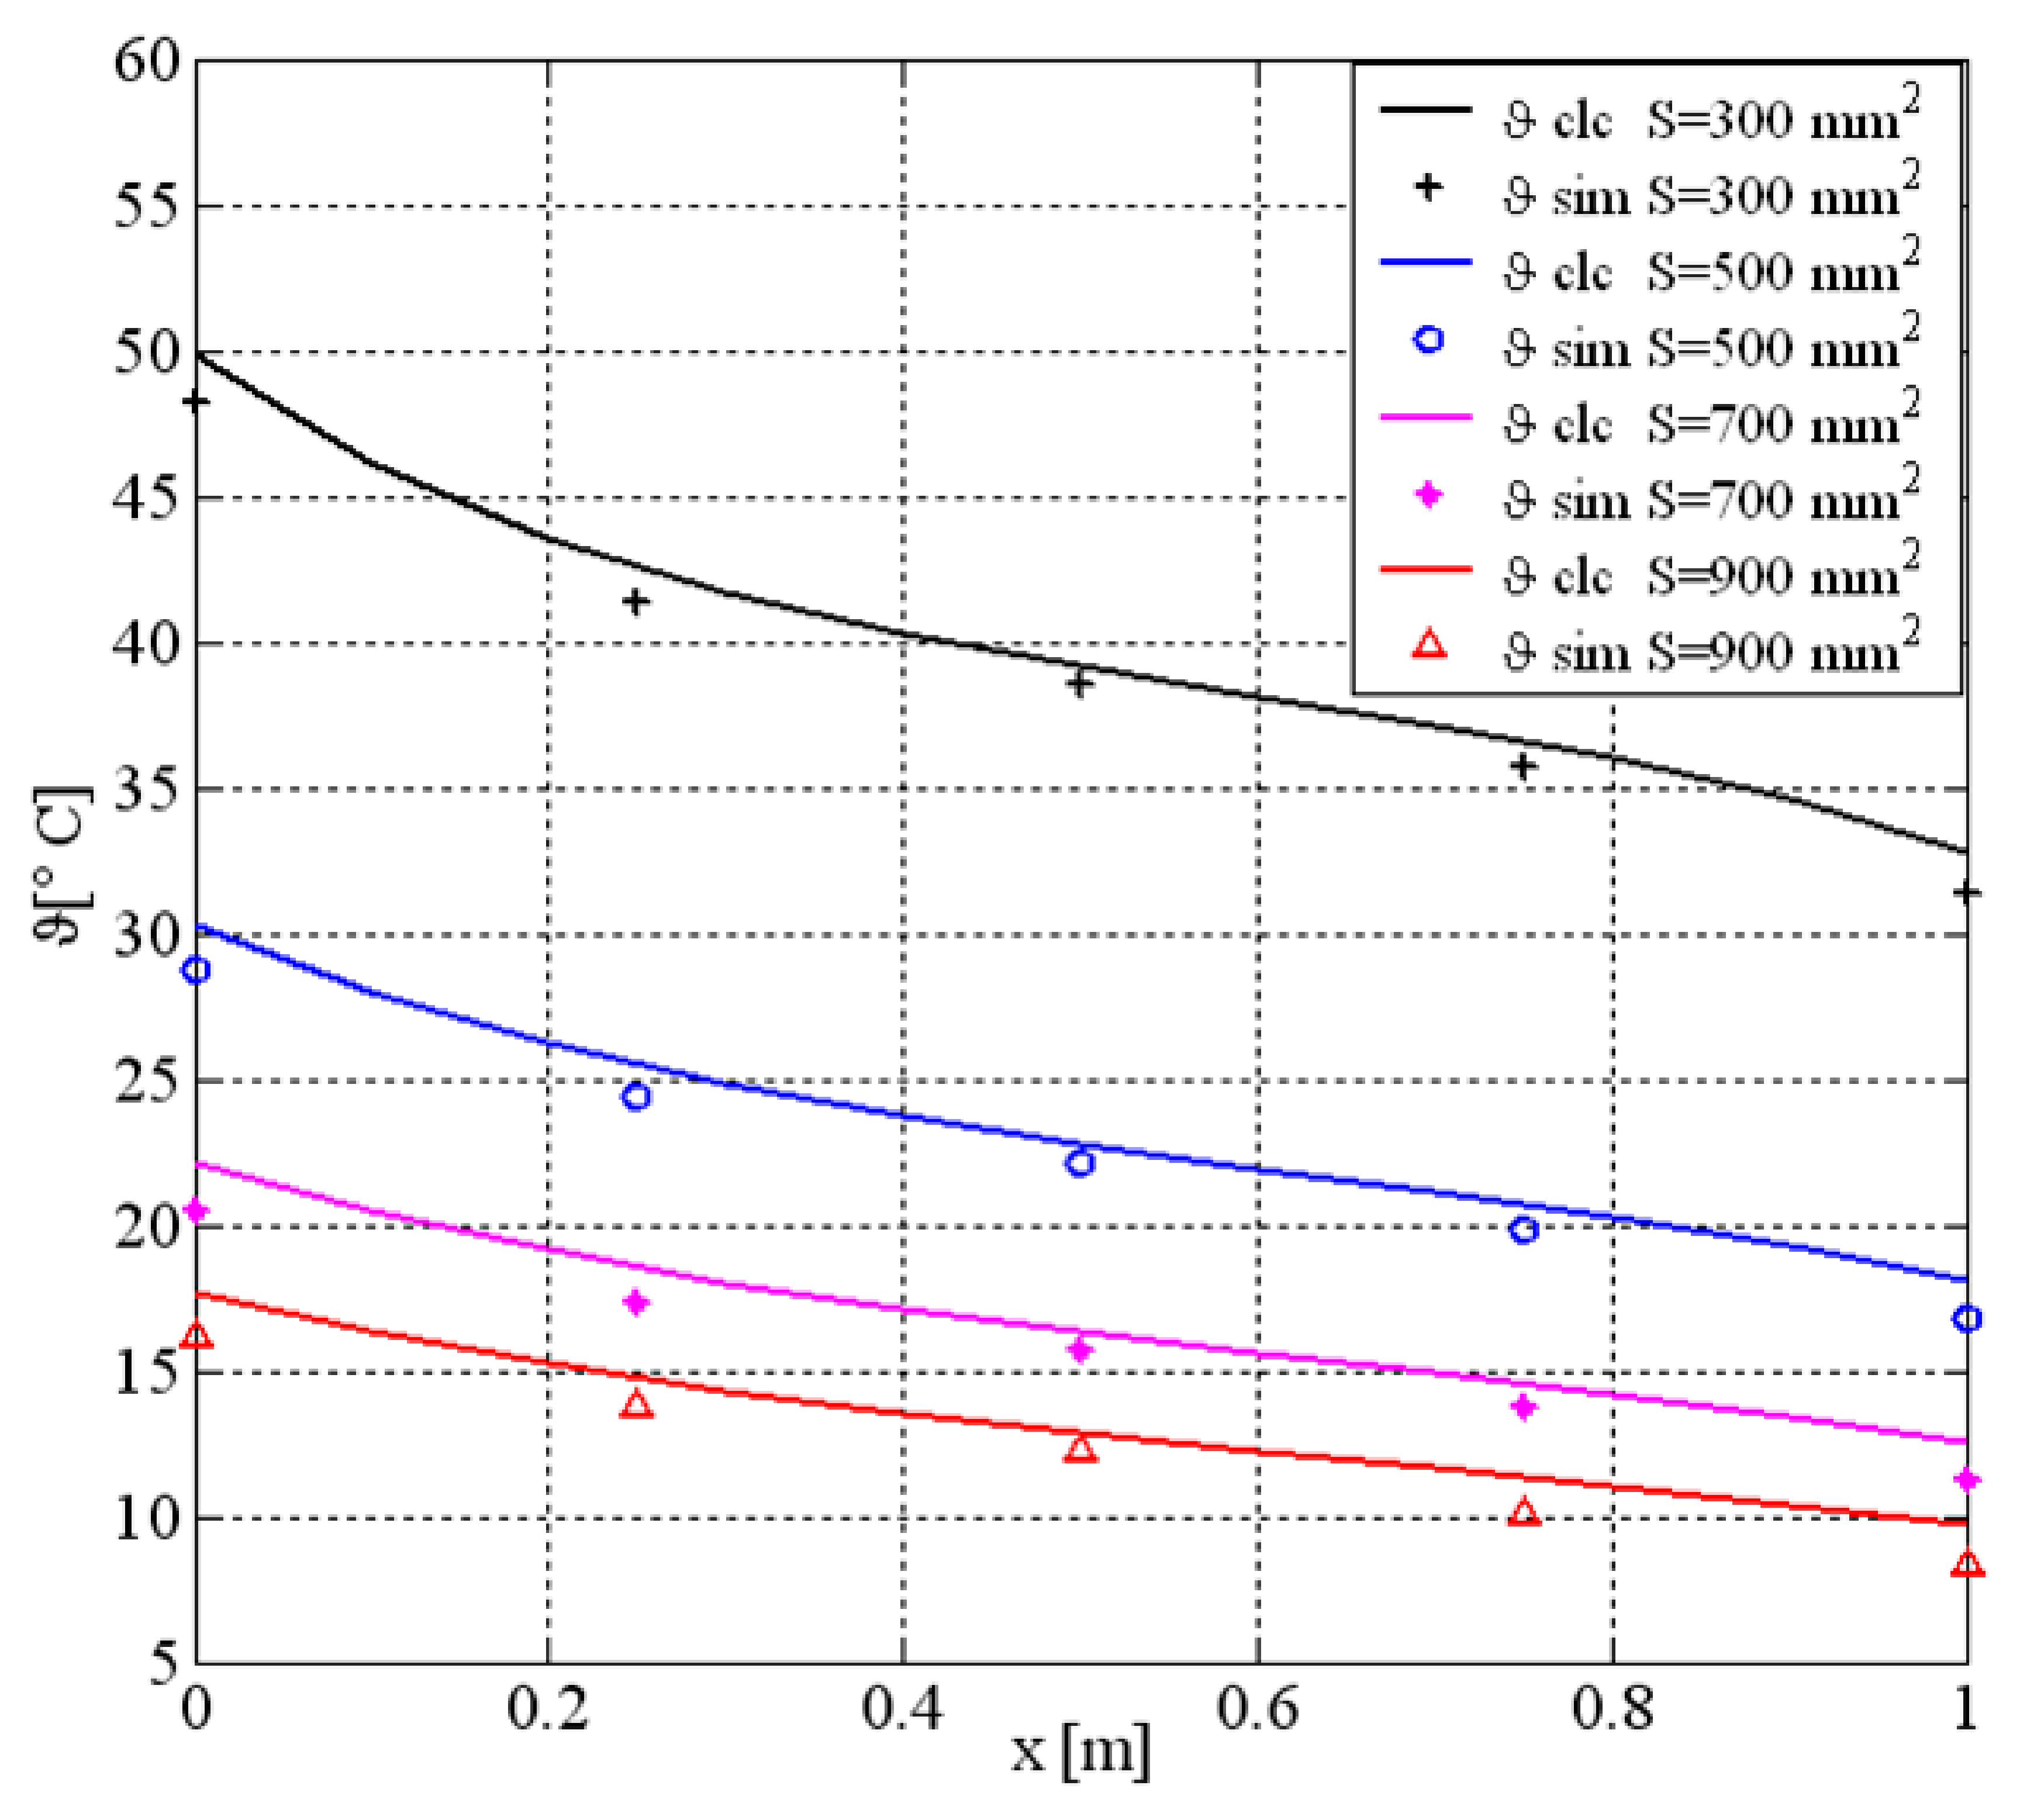
The second thermal analysis has been performed for the variation of the cross-section of the busbar. The next values of the cross-section: 300 mm
2, 500 mm
2, 700 mm
2 and 900 mm
2, have been considered. As the cross-section increases, the temperature rise decreases,
Figure 6.
The explanation of this observation is that the temperature rise is inverse proportional to the cross-section of the busbar. For instance, at the cross-section value of 300 mm2, the terminal values of the temperature rise are ϑM1 = 49.8 °C (x = 0) and ϑM2 = 32.7 °C (x = 1 m). In the case of the cross-section value of 900 mm2, the difference between the terminal values of the temperature rise is only about 7.9 °C (ϑM1 = 17.6 °C and ϑM2 = 9.7 °C). As in previous analyzed case, the simulation values are lower than the calculated ones. So, when the cross-section of the busbar has the value of 300 mm2, the temperature rise at the terminals’busbar are ϑM1 = 48.2°C and ϑM2 = 31.4 °C, and if the cross-section of the busbar is about 900 mm2, than the temperature rise values at terminals are ϑM1 = 16.1 °C and ϑM2 = 8.3 °C.
The next thermal analysis has been carried out for the variation of length of the busbar. When the busbar length increases from 0.6 to 1.4 m, the temperature rise of the lower terminal (x = 0) has no significantly increasing, from ϑ
M1 = 17.3 °C at busbar length of 0.6 m to ϑ
M1 = 17.9 °C when the busbar length is about 1.4 m, as it can be seen from the graphics shown in
Figure 7. On the other hand, the temperature rise of the upper terminal (x = L) has a small decreasing, from ϑ
M2 = 11.6 °C at busbar length of 0.6 m to ϑ
M2 = 8.9 °C when the busbar length is 1.4 m. Similar to previous cases, the simulation results are lower than the computed ones. Thus, when the length of the busbar has the value of 0.6 m, the temperature rise at the terminals’busbar are ϑ
M1 = 15.8 °C and ϑ
M2 = 10.2 °C, and for the busbur length of 1.4 m, the temperature rise values at terminals are ϑ
M1 = 16.5 °C and ϑ
M2 = 7.4 °C.
An important parameter that influences the temperature distribution along the busbar is the contact resistance. Its value depends on the contact force with which the bolts between the busbar terminals have been fastened. In the
Figure 8 is shown the variation of the temperature rise against busbar length at different contact resistance values, from 7 μΩ to 20 μΩ.
It can be noticed an increasing of the temperature rise values when the contact resistance is also increasing. This is because the temperature rise depends on the power loss which is directly proportional with the contact resistance value. Thus, there is a variation of the terminals temperature rise values from ϑM1 = 15.6 °C to ϑM2 = 9.2 °C when the contact resistance is 7 μΩ and from ϑM1 = 24.4 °C to ϑM2 = 11.2 °C when the contact resistance has the value of 20 μΩ. As in previous thermal analysis, the simulation values are lower than the calculated results. Therefore, when the contact resistance has the value of 7 μΩ, the temperature rise at the terminals’busbar are ϑM1 = 14.4 °C and ϑM2 = 8.2 °C, and for the contact resistance of 20 μΩ, the temperature rise values at terminals are ϑM1 = 23 °C and ϑM2 = 10 °C.
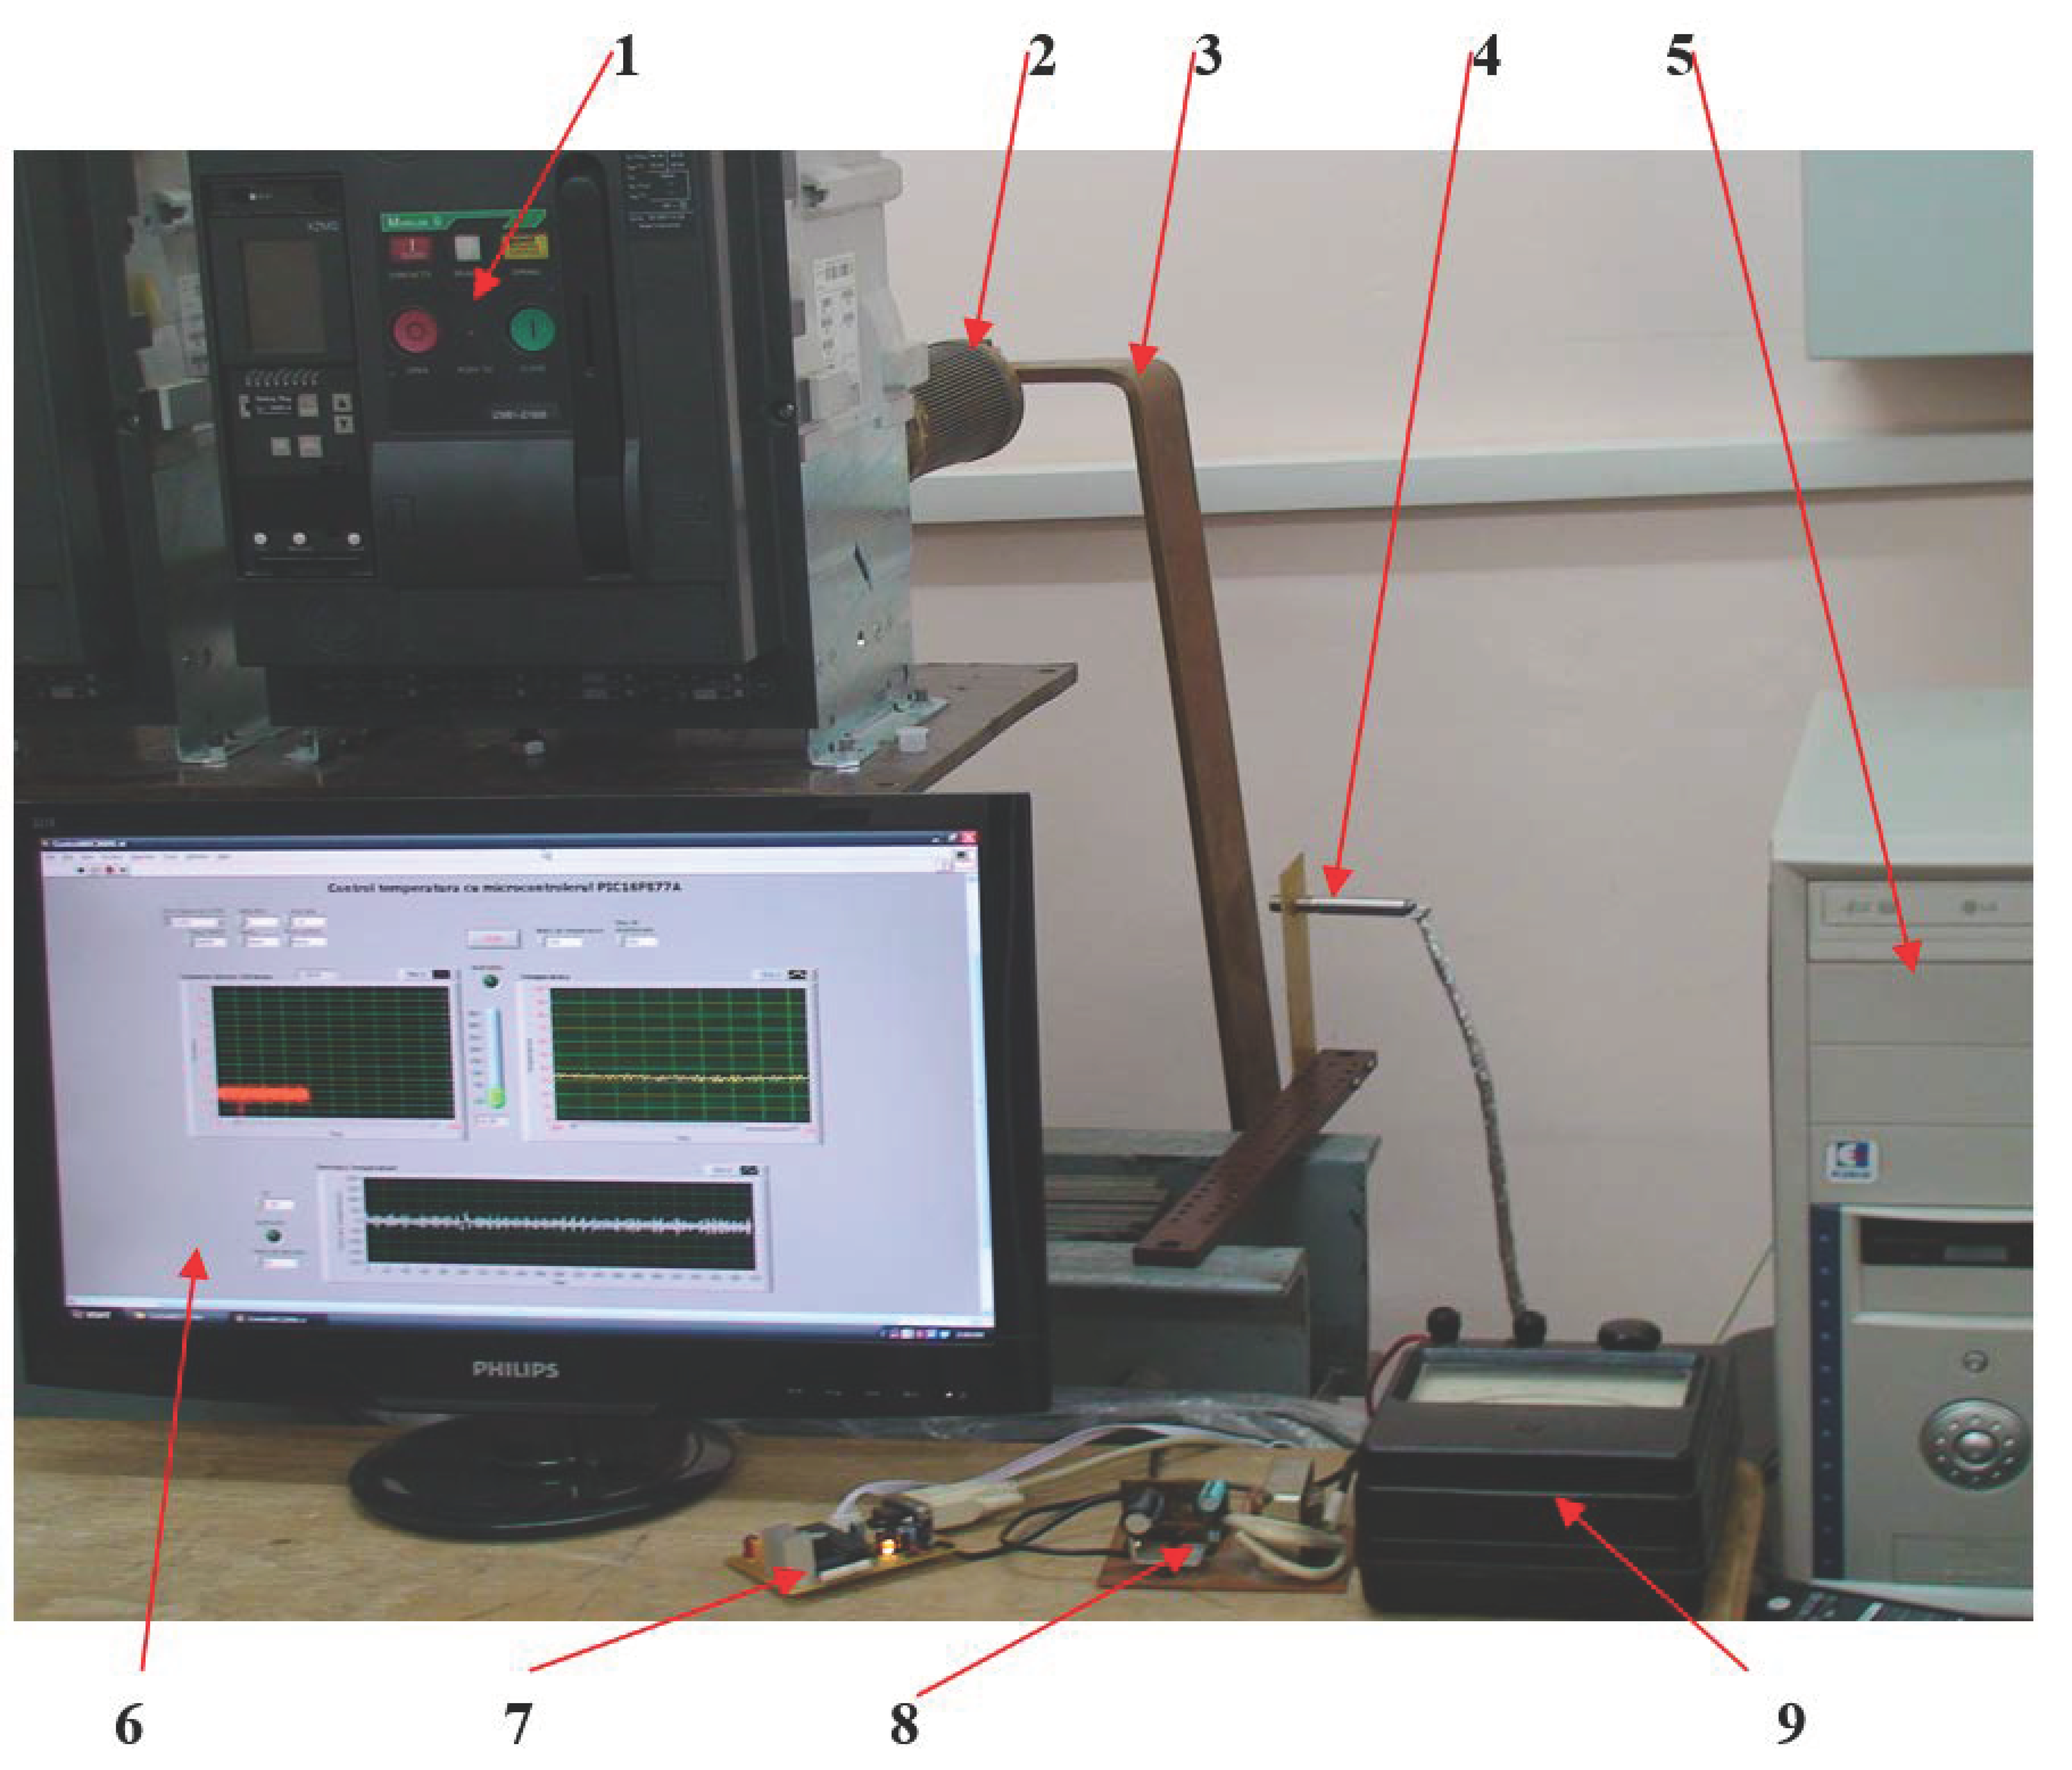
To validate the proposed mathematical model and the simulation results, some experimental tests have been performed. The temperature acquisition system is made with a microcontroller type PIC 16F871P. The temperature data is obtained from an infrared transducer which converts the temperature information into a dc voltage signal. The clock frequency is provided by an auxiliary quartz of 20 MHz. The acquisition system is supplied with 5Vdc through a transformer and a stabilized electronic circuit type LM7805.
The microcontroller type PIC 16F871P has been programmed to acquire the analogue voltage signal from the infrared transducer and to convert it into a digital signal. Then, the digital signal is processed by a LabVIEW application. The experimental set-up is presented in
Figure 9.
Because of technological reasons, the experimental tests have been performed only in the case of variation of the electric current and contact resistance. In the case of current variation,
Figure 5, at 1600 A, the experimental values of busbar terminals are ϑ
M1 = 88.7 °C and ϑ
M2 = 55.1 °C, respect to ϑ
M1 = 86.6 °C and ϑ
M2 = 54.2 °C, the calculated values. It can be observed higher experimental values respect to calculated ones. The same observation is valid in the case of contact resisatnce variation,
Figure 8: when the contact resisatnce has the value of 7 μΩ, the temperature rise at the terminals’busbar are ϑ
M1 = 17.3 °C and ϑ
M2 = 10.1 °C respect to ϑ
M1 = 15.6 °C and ϑ
M2 = 9.2 °C, the calculated ones, and for the contact resistance of 20 μΩ, the temperature rise values at terminals are ϑ
M1 = 26.2 °C and ϑ
M2 = 12.2 °C respect to ϑ
M1 = 24.4 °C to ϑ
M2 = 11.2 °C, the calculated ones.
It can be observed that there are differencies between experimental tests values and calculations from mathematical model. This is due to mathematical model assumptions, thermal simulations errors, measurement accuracy, manufacturing of the experimental test-bench, etc. It can be noticed that the difference between calculation results and experimental values is under 2 °C.


