Article

Energy Renovation versus Demolition and Construction of a New Building—A Comparative Analysis of a Swedish Multi-Family Building

1
Division of Energy Systems, Department of Management and Engineering, Linköping University, 581 83 Linköping, Sweden
2
Division of Building, Energy and Environment Technology, Department of Technology and Environment, University of Gävle, 801 76 Gävle, Sweden
*
Author to whom correspondence should be addressed.
Energies 2019, 12(11), 2218; https://doi.org/10.3390/en12112218
Submission received: 3 May 2019 / Revised: 5 June 2019 / Accepted: 6 June 2019 / Published: 11 June 2019
(This article belongs to the Special Issue Energy Efficiency in Buildings: Both New and Rehabilitated)

Abstract

:
This study addresses the life cycle costs (LCC) of energy renovation, and the demolition and construction of a new building. A comparison is made between LCC optimal energy renovations of four different building types with thermal performance, representing Swedish constructions from the 1940s, 1950s, 1960s, and 1970s, as well as the demolition of the building and construction of a new building that complies with the Swedish building code. A Swedish multi-family building from the 1960s is used as a reference building. LCC optimal energy renovations are identified with energy saving targets ranging between 10% and 70%, in addition to the lowest possible life cycle cost. The analyses show that an ambitious energy renovation is not cost-optimal in any of the studied buildings, if achieving the lowest LCC is the objective function. The cost of the demolition and construction of a new building is higher compared to energy renovation to the same energy performance. The higher rent in new buildings does not compensate for the higher cost of new construction. A more ambitious renovation is required in buildings that have a shape factor with a high internal volume to heated floor area ratio.

1. Introduction

More than one quarter of the energy use in the European Union takes place in residential buildings [1]. In cold climates, more than 60% of the total energy demand in residential buildings is needed for space heating [2]. Of the existing European buildings, 75% are considered energy inefficient compared to modern energy performance requirements [3]. By implementing energy efficiency measures (EEMs), the energy performance of buildings can be significantly improved.
Around 35% of the European building stock is more than 50 years old, and many buildings are in need of renovation [3]. Building renovations that include EEMs are sometimes referred to as energy renovations. The Energy Performance of Buildings Directive [4] recognized that there is an opportunity to reduce the cost of implementing EEMs when buildings are in need of renovation. Several studies have shown significant reductions in space heating demand by implementing EEMs during the renovation of buildings [5,6,7]. Renovation can also increase the value of the building [8], increase pride [9], and improve the indoor environment [10,11,12], which are all important additional benefits from a renovation.
Common approaches for reducing energy use in existing building include thermal improvement of the building envelope by adding insulation [10,12,13,14,15]. The potential for a reduction in energy use from insulation is revealed to be enormous. A significant reduction in heat demand has also been achieved by installing a balanced mechanical ventilation system with heat recovery as part of buildings renovation [12,13,16]. Several studies have shown that the implementation of EEMs in energy renovation of buildings have the potential to reduce the energy demand to a low energy building, passive house, or nearly-zero energy building standard [6,9,17,18].
The importance of the cost-effectiveness of energy renovation is highlighted in the Energy Performance of Buildings Directive, which also states that a cost-optimal level should be sought, where the cost of investing in EEMs should be balanced against the total costs during the life cycle of the building [4]. A life cycle cost (LCC) approach is common in a building context, because of the long life cycle of buildings. The LCC is the present value of the current and future costs of the construction, installation, maintenance, and operation of a building during its life cycle [19]. Several studies have used an LCC perspective when studying the cost-effectiveness of implementing EEMs in building renovation [20,21,22,23]. The cost-effectiveness of EEMs will vary between building types, thermal performance before implementing EEMs, and the costs of EEMs and supplied energy. As the cost-effectiveness is dependent on the building and context, several studies have used optimization approaches to find the cost-optimal level of improved energy efficiency as part of building renovations [20,21,24,25,26,27,28]. For example, Niemelä et al. [25] found that it was not cost-optimal to implement EEMs in Finish multifamily buildings from the 1960 that had a primary energy use of 165 kWh/m2, before implementing any EEMs. However, Kuusk et al. [29] found that façade insulation significantly reduced the global cost in the Estonian multi-family building stock with a heat demand of up to 280 kWh/m2. Other studies have also identified improvement of the building envelope as being cost-effective in buildings with a poor thermal performance [20,21].
Instead of implementing EEMs in existing buildings, an alternative approach to reducing energy use in the building stock would be to demolish old buildings with a poor energy performance, and construct new modern buildings with a better energy performance. Although there are many studies addressing renovation and the demolition and construction of a new building from a life cycle analysis perspective or based on environmental impacts [30,31,32,33,34,35], there are few studies addressing the life cycle costs of renovation and the demolition and construction of a new building, especially when considering buildings that are not damaged. Morelli et al. [36] studied a Danish apartment building constructed between the years 1850–1930, and found that renovation was more cost-effective than the demolition and construction of a new building. Previous studies of the choice between the rehabilitation of damaged buildings and demolition and new construction [37], and studies of buildings in need of structural reinforcement as part of the renovation [35] have shown that the demolition and the construction of a new building should be considered. Alba-Rodríguez et al. studied a building in an urgent condition after a construction failure, and concluded that the cost of rehabilitating the building was 21% lower than demolition and new construction [37]. Ferreria et al. [35] found, by comparing the costs for the renovation of a building and new construction in the same area, that it was more economical to construct new buildings than to improve the seismic strength of the building as part of a structural renovation. The reasons for demolishing a building could be other than those related to costs, such as comfort of living or indoor environment [36]. Sadick and Issa [38] showed that there was a statistically significant difference between the perceived indoor environmental quality in new or renovated school buildings compared to non-renovated buildings. They found no statistical difference between the new and renovated school buildings. Bullen and Love [39,40] found other drivers that can be important in the choice between renovation and demolition and reconstruction. If a building is perceived as being no longer viable for its intended use, demolition is often considered instead of renovation or restoration. For rental buildings, another factor in the choice between renovation and the demolition and construction of a new building is the rent. When buildings are renovated in a Swedish context, the rent is increased in accordance with the improvement in living standards [41]. The rent after a major renovation is usually around 70%–80% of the rent for newly constructed buildings [42]. Although this could be a driver for demolition and new construction, Power [32] argues that the demolition and construction of a new building instead of renovation can disadvantage economically weak families. Buildings with formally protected cultural heritage value have limitations in the possibilities of changing the aesthetics of the building, thus making both extensive energy renovation measures and demolition unsuitable [20,21,26].
The aim of this study is to compare and analyze the LCC of energy renovation of a multi-family building with the demolition and construction of a new building. The analysis is based on four building types with different thermal performances, and an optimization approach is used to identify the lowest LCC based on proposing different combinations of EEMs for reducing space heating demand so as to achieve different energy saving targets in the studied buildings. The LCC and energy use after energy renovation are compared to the demolition of the building and the construction of a new building that fulfils the design requirements in the Swedish building code.

2. Renovation and Building Costs in a Swedish Context

2.1. Renovation

An analysis of five different Swedish renovation projects with a focus on energy showed that there were significant differences between the costs for EEMs in the different projects [43]. The reduction in energy use varied between 45% and 70%, and all of the renovations included thermal improvement of the building envelope and installation of a heat recovery unit in the ventilation system (see Table 1). Other EEMs were replacement of the existing windows with windows with a better thermal performance rating, improvement of airtightness, individual metering and charging for heat and domestic hot water, adjustment to the heating system, control systems, and solar collector panels. One of the renovations (Brogården) involved extensive demolition, and only the load bearing structure and roof were kept [44]. The renovations were performed between 2000 and 2011, and the costs for renovation that are presented in Table 1 have been adjusted for the increase in building construction up until 2017, based on the figures from Statistics Sweden [45].

2.2. New Construction

The cost of newly constructed buildings has increased drastically in Sweden, and between 2000 and 2017, the cost of new construction increased by 107% in central Sweden, and by 138% in Stockholm (the capital of Sweden) [45], adjusted for inflation. In 2017, the total cost of a newly constructed building was 36.7 kSEK per square meter of apartment area in central Sweden, and 62.1 kSEK/m2 in Stockholm (exchange rate: 1 Euro = 10.6 SEK).
The Swedish National Board of Housing, Building, and Planning studied the cost of a newly constructed building in Linköping, Sweden. The total cost was 17.2 kSEK/m2 when the building was finalized in 2005, after 18 months of construction [48]. Adjusted for the increase in costs for new construction and the cost of land in central Sweden between 2004 and 2017, the cost would be 35.7 kSEK/m2 in total, and 32 kSEK/m2 excluding the cost of land. The division of cost is shown in Figure 1. Around 66% of the total cost relates to the building construction contract. The cost of the building body and interior is 15.0 kSEK/m2. In two reference buildings included in a Swedish database of construction costs [49], the construction of the building skeleton structure represented 29% and 36% of the total cost of the building body and interior.

3. Case Description

The analysis is based on the geometry of an existing 1960s building located in central Linköping, Sweden. The building underwent renovation in 2014, and the effects on the building from the renovation have been previously been studied with regard to energy demand and indoor environment, using an empirically validated whole building energy simulation model [16,50]. To address the choice between energy renovation and the demolition and construction of a new building with regard to the differences in thermal performance, three additional construction types have been included in the analysis. The buildings have a thermal performance representing common original Swedish constructions from the 1940s, 1950s, and 1970s. A comparison is made with the demolition and the construction of a new building with the same external geometry as the reference building. The new building meets the minimum requirements for new Swedish buildings in the building code. All of the buildings are assumed to be heated with district heating as the energy carrier, which is common in larger Swedish municipalities.

3.1. Reference Building

The reference building was constructed in 1961, and originally had a lightweight concrete construction and was ventilated with an exhaust air ventilation system. The building has five stories, with a ceiling height of 2.5 m. The top four floors have three apartments each, and the ground floor compromises a storage area and office premises. The façade and a building cross section can be seen in Figure 2.
The geometry, construction, and U-values of the building are seen in Table 2.

3.2. Typical Building Types

Three building constructions that were common in Sweden in the 1940s, 1950s, and 1970s are applied to the external geometry of the reference building [53] to be able to compare the costs of the energy renovation of the buildings with different thermal performance and construction. The 1970s building is assumed to have a similar thermal performance as the reference building, but has an insulated cavity wall construction. The two older buildings are assumed to have brick façades and natural ventilation. It is common for older buildings in Sweden to have high ceilings. The 1940s and 1950s buildings are therefore assumed to have one less floor. The total internal height of the building means that each floor has a height of 3.1 m. The studied building types are presented in Table 3, and the U-values in Table 4. All of the buildings are assumed to have a ground slab with a U-value ranging between 0.2 and 0.3 W/m2·°C, which cannot be insulated. The window area per floor is assumed to be the same for all of the buildings.
The buildings are all assumed to have the same external geometry. This means that the internal surface areas will differ, depending on the wall thickness. With thicker walls, the rentable area and the heated area will be smaller. The heated area and rentable apartment area are shown in Table 5.
The airtightness of the reference building was measured prior to and after the performed renovation using the blower door technique [50], and the results were used for the reference building and the building from 1970 prior to renovation. Air tightness measurement was also performed in a building constructed in 1950, and serves as the infiltration prior to renovation in the 1940s and 1950s buildings. The building is located in the same area as the reference building, had old two-pane windows, and a lightweight concrete structure. In addition to the infiltration, the 1940s and 1950s buildings are assumed to have an air exchange corresponding to the lowest recommended ventilation flow of 0.35 l/s·m2. The lowest minimal required exhaust air flow has been used for the 1960s and 1970s buildings. As the building has small apartments, the exhaust air flow is relatively high in relation to the floor area. All of the buildings have an airing corresponding to 2 l/s·apartment [54]. A summary of the building air tightness and airflows is seen in Table 6.
As the buildings have different assumed constructions, the renovation measures will vary slightly. The renovation measures are divided into two categories, namely: inevitable renovation measures, and EEMs that are performed with the purpose of reducing the heat demand and operation costs of the building. The study includes the minimal maintenance of the building body as an inevitable renovation cost. In addition to this, the thermal performance of the building envelope can be improved by insulation and by changing to windows with lower U-values. A summary of the renovation measures and EEMs is shown in Table 7.

4. Methodological Approach

The study is divided into three parts, as follows: (1) Identifying LCC optimal EMMs with energy saving targets ranging between 10%–70% in the four building types using the optimization tool OPtimal Energy Retrofit Advisory-Multiple integer Linear programming (OPERA-MILP); (2) calculation of the LCC of the demolition of the four building types and the construction of a new building; and (3) the identification of the LCC optimal EEMs for achieving the same energy performance as the new building used in part two, and a comparison between the costs for energy renovation and the demolition and construction of a new building. The cost-optimal EEMs are identified using OPERA-MILP, as in part one. The process can be seen in Figure 3.
The heating demand of the building is calculated using a quasi-steady state heat balance calculation. The district heating tariff at the building’s location in Linköping, Sweden, is used to calculate heating costs.
The analysis is primarily focused on the cost of the building skeleton structure and the parts of the building that have an influence on energy use. An analysis is performed using additional costs from Swedish examples to contrast to the higher revenues from the rent in newly constructed buildings.

4.1. LCC Optimal Energy Renvoation

The long-life cycle of a building makes an LCC approach suitable for comparing the costs of different renovation measures in a building. By adding present and discounted future costs, different investment alternatives can be compared [19]. In a building context, the LCC consists of costs related to the construction, technical installations, operation, and maintenance. When the investment in an EEM is lower than the cost saving for operation, the measure is profitable. The study and comparison between energy renovation and the construction of a new building focuses on the building skeleton structure, windows, installation of a heating system and a ventilation system, and heating of the building. The LCC does not include the costs for interior or other installations.
The optimization tool OPtimal Energy Retrofit Advisory (OPERA) was originally designed in the 1980s to identify which EEMs lead to the lowest LCC (LLCC) during a selected life cycle [55]. Increased focus on the cost-effective reduction in energy use of buildings leads to the development of a constraint on maximal energy use using multiple integer linear programming (MILP), so that the most suitable EEMs can be identified for a predefined target. The tool has been used in several studies of multi-family buildings and historic buildings [20,21,26,56,57,58]. The validation of the heat demand calculated in OPERA-MILP has been performed using a dynamic whole building simulation [21,59] in the simulation tool IDA Indoor Climate and Energy (IDA ICE). IDA ICE has been validated in accordance with Standard 140-2004 from the American Society of Heating, Refrigerating and Air-Conditioning Engineers [60], European CEN Standard EN 15255-2007 and 15265-2007 [61], and CEN Standard EN 13791 [62]. A test cell validation was performed with measurements in IEA’s Solar Heating and Cooling Programme Task 34, with good agreement between the prediction and measurements [63].
As OPERA-MILP is designed for finding the lowest LCC, it is possible that the actual energy saving from the suggested EEMs is higher than the target. If a higher energy saving than the target is optimal, the LCC for the actual target is calculated by removing the measures with the highest increase in LCC per reduced kWh. Note that these EEMs are not cost-optimal, and are calculated to illustrate how different energy saving targets for an energy renovation can affect the selected measures and LCC.
OPERA-MILP calculates the LCC of a renovated building (LCCrenovation) using the discounted sum of maintenance costs (LCCmaintenance), the cost of installing a heating system (LCCHS), the cost of investments in EEMs (LCCEEM) that are implemented in the building to reduce heat demand, and the operation cost of heating the building during the selected life cycle (LCCheating). Any residual value (RV) is subtracted from the LCC if the investment has a value at the end of the selected life cycle.
LCC renovation   =   LCC maintenance   +   LCC HS   +   LCC EEM   +   LCC heating     RV
The present values for non-recurring investments (PVN) in building maintenance, the heating system, and EEMs are calculated in Equation (2).
PV N   =   N   ×   ( 1   +   r ) a
where N is the non-recurring cost, r is the real interest rate, and a is the number of years until the cost occurs. A new investment is made if the technical life cycle is shorter than the period for which the LCC is calculated.
For the operation cost that recurs annually, in this case heating, the present value (PVR) is calculated in Equation (3).
PV R   =   R   ×   1     ( 1   +   r ) b r
where R is the annually recurring cost of space heating, and b is the number of years that R occurs during the life cycle. The heating demand for the building is calculated with a quasi-steady state heat balance calculation with twelve time steps. The LCC is calculated during a lifetime of 40 years, and a real interest rate of 5% is used.
Maintenance costs are inevitable costs, and occur regardless of whether or not EEMs are implemented in the building. The EEMs of the building envelope consist of thermal insulation. The cost of the building envelope (Cenvelope (SEK/m2)), is calculated in Equation (4).
C envelope   =   CE 1   +   ( CE 2   +   CE 3   ×   t )
where CE 1 is the inevitable maintenance cost (SEK/m2), CE 2 is costs related to insulating the envelope independent of the insulation thickness (SEK/m2), CE 3 is costs related to insulating the envelope dependent on and linear to the insulation thickness (SEK/m2·m), and t is the thickness of the insulation (m). The cost function for the maintenance and insulation of the building envelope is visualized in Figure 4.
The cost of the window replacement is based on the inevitable costs for replacing windows with new windows (CE1) with the same U-value as the original windows. OPERA-MILP also includes different window types with lower U-values, which have different additional costs (CE2).
The investment cost of the heating system ( C heating   system (SEK)) is dependent on the maximum installed power of the system, and is calculated in Equation (5).
C heating   system   =   HS 1   +   HS 2   ×   P   +   HS 3   ×   P
where HS 1 is the cost of installing a new heating system regardless of maximum power (SEK), HS 2 is the cost of installing a new heating system and is linear to the maximum power of the heating system (SEK/kW), P is the maximum power of the heating system (kW), and HS 3 is the costs related to the systems needed in connection with the heating system, such as pipes, a chimney, or a bore hole (SEK). The heating systems (HS1 and HS2) and related systems (HS3) can have different technical lifetimes.
Heat losses can be reduced by increasing the airtightness of the building by weather-stripping. The cost of each unit that is weather-stripped, an interval for how often the measure has to be performed, and the changes in resulting air exchange rate have to be defined. The function can also be used for heat recovery ventilation measures by giving the cost of a new heat recovery ventilation system (HRX system) and the reduction in air exchange rate that corresponds to the heat exchanger efficiency.

Cost of Renovation Measures

Renovation costs will differ depending on the original building construction and geometry, as well as the geographic location. The Swedish database Wikells Sektionsfakta was used to summarize the cost of all of the renovation measures, technical installations, and demolition included in the study. Wikells Byggberäkningar AB is a Swedish company that offers a database with costs for the construction and labor for building parts and technical installations in buildings, and is a common database for cost calculations for new buildings and renovations in Sweden [49]. The costs for wall and attic insulation (CE2 and CE3) have been linearized from insulation with a thickness ranging between 50 and 200 mm. The costs for installing windows (CE1) are the same regardless of thermal, but the lifetime is shorter for wood frame windows. A window with a better thermal performance has a higher CE2 cost. The cost of a new district heating exchanger is linearized based on district heating exchangers with a thermal power ranging between 40 and 100 kW. The costs are summarized in Table 8. To be able to compare this with a newly constructed building, the roof tiles are exchanged and the roof foundation is renovated. The cost of this is 285 kSEK, which is added to the total renovation costs for all of the buildings.
The HRX system that was installed in the reference building during the actual renovation was used in the optimization. The heat recovery efficiency was measured at 57.4% during one month of operation [50]. The cost is slightly higher per apartment area for the naturally ventilated buildings that require exhaust air ducts. The cost of new shafts is assumed to be the same in all buildings. The infiltration rate is based on the blower door measurements performed in the reference building after it was renovated and fitted with an HRX system, and represents 0.49 l/s per external surface area [50]. The total cost and the corresponding air exchange rate with an HRX system are shown in Table 9. Note that this is not the actual air exchange rate, only the corresponding losses due to infiltration and ventilation after heat recovery.

4.2. LCC of Newly Constructed Building

The LCC of a newly constructed building is calculated in a similar way as the LCC for the renovation cases. The LCC is the sum of the total cost of demolition (Cdemolition (SEK)), the discounted sum of the construction costs (LCCconstruction (SEK)), the installation costs for the heating system (LCCHS (SEK)), and the operation cost for heating the building during the entire life cycle (LCCheating (SEK)), minus any residual value, as in Equation (6).
LCC new   constriction   =   C demolition +   LCC construction + LCC HS + LCC heating RV
The LCC for construction, heating system and heating in Equation (6) is calculated in accordance with Equations (2) and (3).

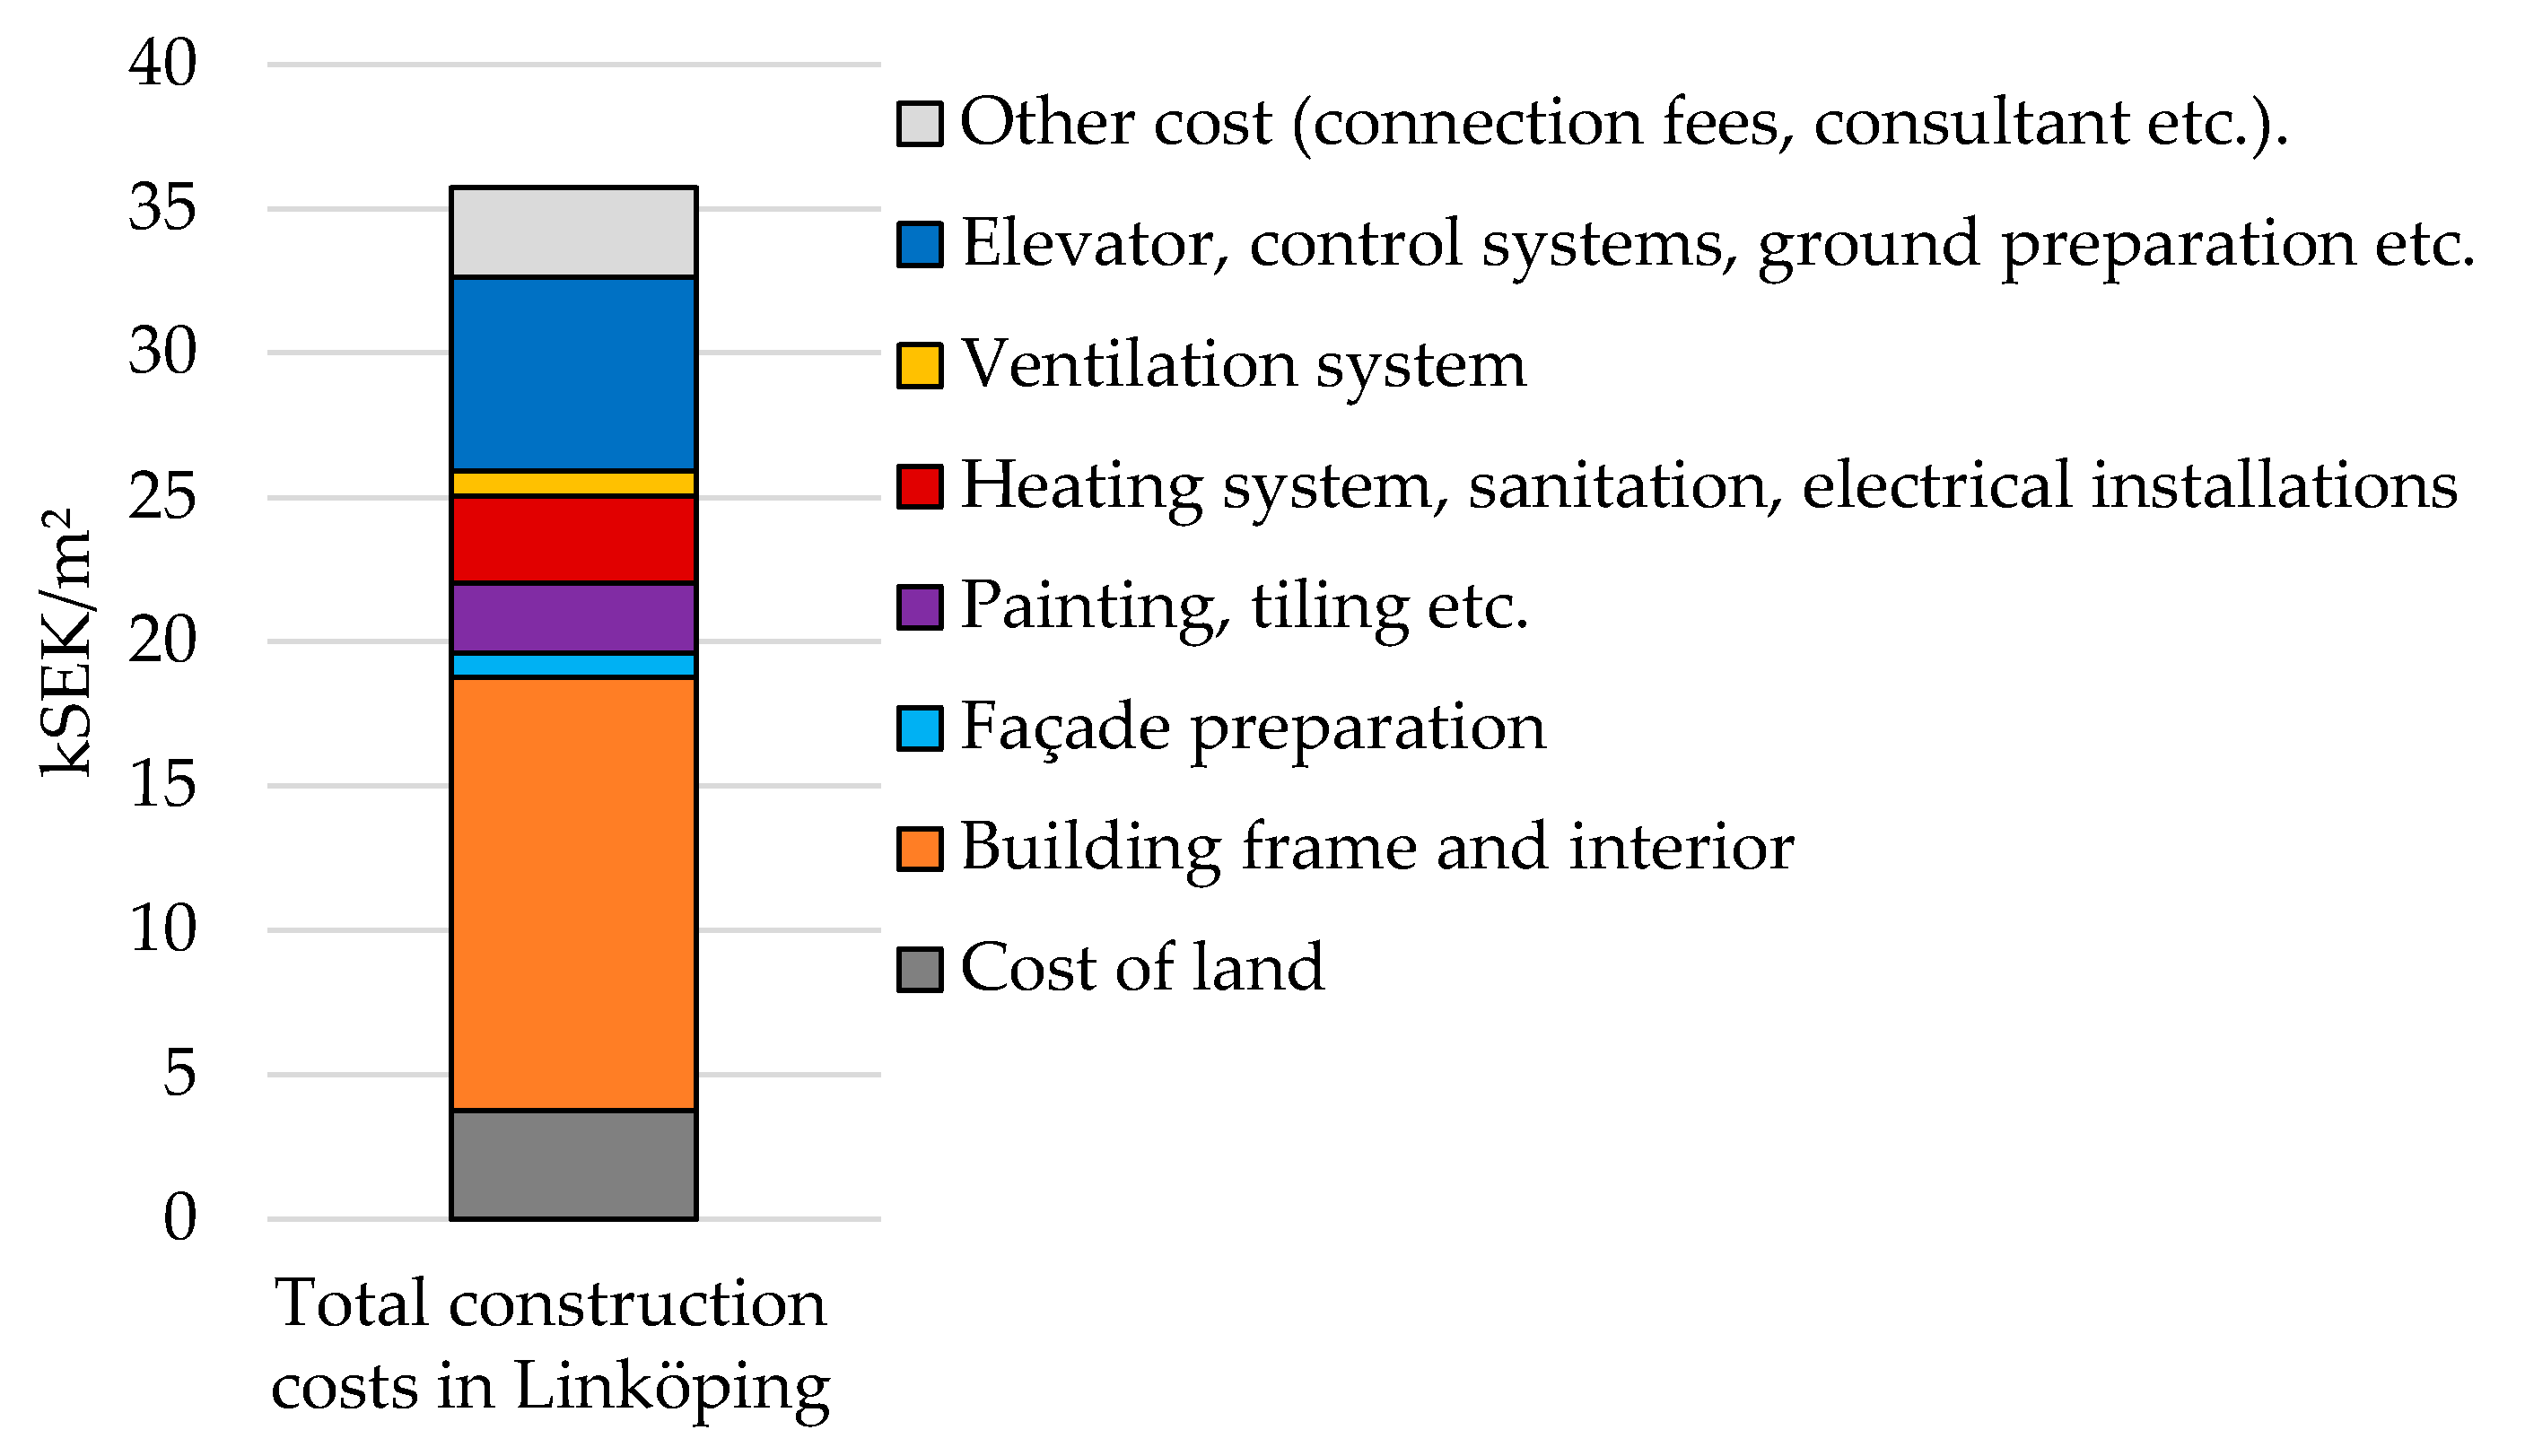
Demolition and Construction Costs

The analysis includes the cost from Wikells Sektionsfakta for demolishing the old building prior to the construction of a new building [49]. As the construction varies between the different building types, they will have different demolition costs. Building constructions with a high thickness or a large mass have higher demolition costs than thin and light constructions, and hence the cavity wall from the 1970s building has a significantly higher cost per square meter of wall area. The newer buildings with more windows also have slightly higher demolition costs related to the window demolition. The demolition costs are summarized in Table 10.
The Swedish building code is established by the National Board of Housing, Building, and Planning, and states that a newly constructed multi-family building in central Sweden should have a maximal energy demand of 85 kWh of primary energy per square meter of heated area and year, including domestic hot water and facility electricity. Electricity has a primary energy factor of 1.6, and all other energy carriers have a primary energy factor of 1.0 [64]. As a basis for the building constructed in accordance with the building code, a building model from the Swedish Association of Public Housing Companies was used [65]. The building model can be built up to eight floors high, with four to eight apartments per floor, and some contractors [66] offer a building model with prefabricated elements for faster construction. The building construction, U-values, and energy performance can be seen in Table 11.

4.3. Calculation of Space Heating Demand and Heating Costs

The energy demand of the building and the cost of annual space heating are calculated with a quasi-steady heat balance calculation, including twelve time steps. The heat balance summarizes the heat losses from the building envelope, ventilation, and infiltration (see Equation (7)).
E heating   =   ( Q transmission   +   Q ventilation   +   Q infiltration )   ×   DH     E IHG     E solar
where Q transmission is the envelope transmission losses (W/°C), Q ventilation is the losses from ventilation (W/°C), Q infiltration is the losses from infiltration (W/°C), DH are the degree hours (°Ch), E IHG is the internal heat gain from appliances and occupants (Wh), and E solar is the useful solar radiation (Wh). The monthly mean temperature, the indoor temperature, and the number of hours during the same month are used for calculating the degree hours. The accuracy of the quasi-steady heat balance included in OPERA-MILP have been tested against the dynamic simulation of building energy use with good agreement [21].

District Heating Tariffs

Many of the district heating tariffs in Sweden are divided up into a power demand fee and a cost related to the amount of used energy. In most cases, the cost varies during the year, and is higher during cold periods with a high heating demand. The district heating tariff that is used in the case study can be seen Table 12.

4.4. Comparison between Renvoation and Demolition and Construction of New Building

The LCC of energy renovation varies with different energy saving targets. OPERA-MILP is thus used to identify the EEMs with the lowest LCC that achieves the same energy performance in the four studied building types as the new building. As the heated area varies, the buildings have slightly different electricity demands for facility purposes and mechanical ventilation, which affects the maximal allowed space heating demands. The primary energy factor of 1.6 is used for electricity and 1 for district heating, in accordance with the Swedish building code [64].
To be able to compare energy renovation and the demolition and construction of a new building from a broader perspective, an analysis is performed where the additional costs related to the renovation and new construction from Swedish examples are included. In the three renovation projects most similar to the energy renovation included in this analysis (Katjas gata, Trondheim 2, and Nystad 7; see Table 1), the costs for renovation that do not affect energy use ranged between 14.4 to 17.4 SEK/m2 apartment area. The highest costs have been included in the analysis. The costs of the construction of a multi-family building, presented in Figure 1, are used for the additional costs related to new constructions. The rent in the renovated reference building and the rents from the newly constructed building in the same area are used for calculating the present value of the revenues from the rents during the life cycle, in accordance with Equation (3). The renovation that was performed in the reference building took six months to perform, which means six months without rental revenues. The new construction is assumed to take 18 months [48]. A summary of the costs, rent, and time requirement are in Table 13.

5. Results and Analysis

5.1. Life Cycle Costs of Renovation

The combinations of EEMs that are found to be cost-optimal vary between the buildings. In the buildings with a building envelope with a poor thermal performance (1940s and 1950s buildings), it is cost-effective to add thermal insulation to the attic to achieve the LLCC. In the buildings with a relatively good thermal performance, such as the typical buildings from the 1960s and the 1970s, it is not cost-effective to implement EEMs to achieve the LLCC.
The LLCC in the 1940s building is achieved by insulating the attic with 0.22 m, and a reduction in heat demand of 13.3% is achieved (see Table 14). With an energy saving target above 20%, the most cost-effective approach is to insulate the attic with 0.24 m and the façade with 0.16 m. Other energy saving levels are not optimal from a cost perspective. Ventilation measures are not cost-optimal because of the low air exchange rate prior to renovation, and should only be applied when an energy saving target of 70% is set.
The EEMs that are cost-effective in the 1950s building are similar to those in the 1940s building (see Table 15). The LLCC measures mean a reduction in heat demand of 15.9%. As with the 1940s building, an energy saving target between 20% and 50% gives a more ambitious renovation as the most cost-optimal solution, with a reduction in space heating demand of 53.9%, by adding 0.16 m insulation to the façade and 0.24 m to the attic.
In the 1960s building with better energy performance prior to renovation than the two older buildings, no EEMs are found to be cost-optimal to implement in order to reduce the heat demand (see Table 16). The windows are changed to modern three-pane windows that have a longer lifetime than the original window type. When the energy saving target is above 40%, the installation of an HRX system is a cost-effective EEM. It should be noted that the actual reduction in heat demand is higher than the target, as the reduction is not linear in the same way as insulation. A reduction in the heat demand of 40% cannot be achieved by insulation measures and window replacement alone. In contrast to the two older buildings without mechanical ventilation, significant heat losses occur from ventilation, and the reduction in heat losses is greater with an HRX system.
Similar to the 1960s building, an HRX system is a cost-effective measure in the 1970s building, but above an energy saving target of 10% (see Table 17). Reducing the heat demand by 10%, 20%, or 30% from insulation measures involves a higher cost than the optimal level of 44.2%, which includes an HRX system and replacing the windows with modern three-pane windows, but no other thermal improvements of the building envelope. As in the 1960s building, it is not possible to achieve a reduction of 40% without ventilation measures.
The increase in LCC between different energy saving targets is far from linear, and also varies between the different building types (see Figure 5).
They gray dots in Figure 5 are the cost of achieving the exact energy saving targets, and are not cost-optimal. Although these will have a smaller investment cost at the time of renovation, they will have a large increase in LCC, as the reduction in heat demand is too small to compensate for the investment. In three of the buildings, the optimal level of renovation is a level that has a much lower heat demand than many of the lower energy saving targets. In fact, in the oldest buildings, the LCC for a reduction in heat demand between 20% and 50% is higher than a combination of EEMs that achieve a reduction of heat demand by 60%. In the 1960s building, a reduction of heat demand between 20% and 30% does yield a lower LCC, but is still relatively close to a reduction in heat demand of 44.9% (HRX installation) in terms of LCC. This highlights the importance of identifying the renovation measures that are suitable in the specific context. Although a general energy saving target might have been set for an energy renovation, a higher reduction might be a more cost-effective approach when considering the life cycle of a building. The type of construction should also be considered as well as its condition. If the façade is in need of maintenance, part of the costs related to adding thermal insulation, such as scaffolding, are already needed, and thus reduce the cost of thermal insulation if it is not implemented as part of a renovation.

Comparison with Other Renovation Projects

In the most ambitious renovations (60% and 70% energy saving targets), investments in EEMs represent more than 50% of the total LCC. The cost of the energy renovation per apartment area for the 1960s and 1970s buildings is seen in Figure 6. The costs for EEMs presented in this study are similar to those found in Katjas gata, Trondheim 2, and Nystad 7 (presented in Table 1). These three energy renovations also have similar renovation measures to the ones identified for the 1960s and 1970s buildings.

5.2. Cost of Demolition and the Construction of a New Building

A large proportion of the cost of constructing a new building is related to the demolition of the existing building (see Figure 7). The 1940s, 1950s, and 1960s buildings have external walls with relatively light materials (brick and lightweight concrete), and are thus less expensive to demolish and dispose compared with the concrete frame of the 1970s building. The cost of demolition and disposal is more than twice as high for the 1970s concrete wall compared to the three other wall types included in the analysis (see Table 10). A significant cost is also related to the construction of the internal floors. Together, they represent almost half the cost.
During the lifecycle of the building, the construction remains the largest part of the LCC (see Figure 8). The operation of the building (power demand fee and energy demand fees) represents around 10% of the total LCC in all of the buildings, except the 1970s building.

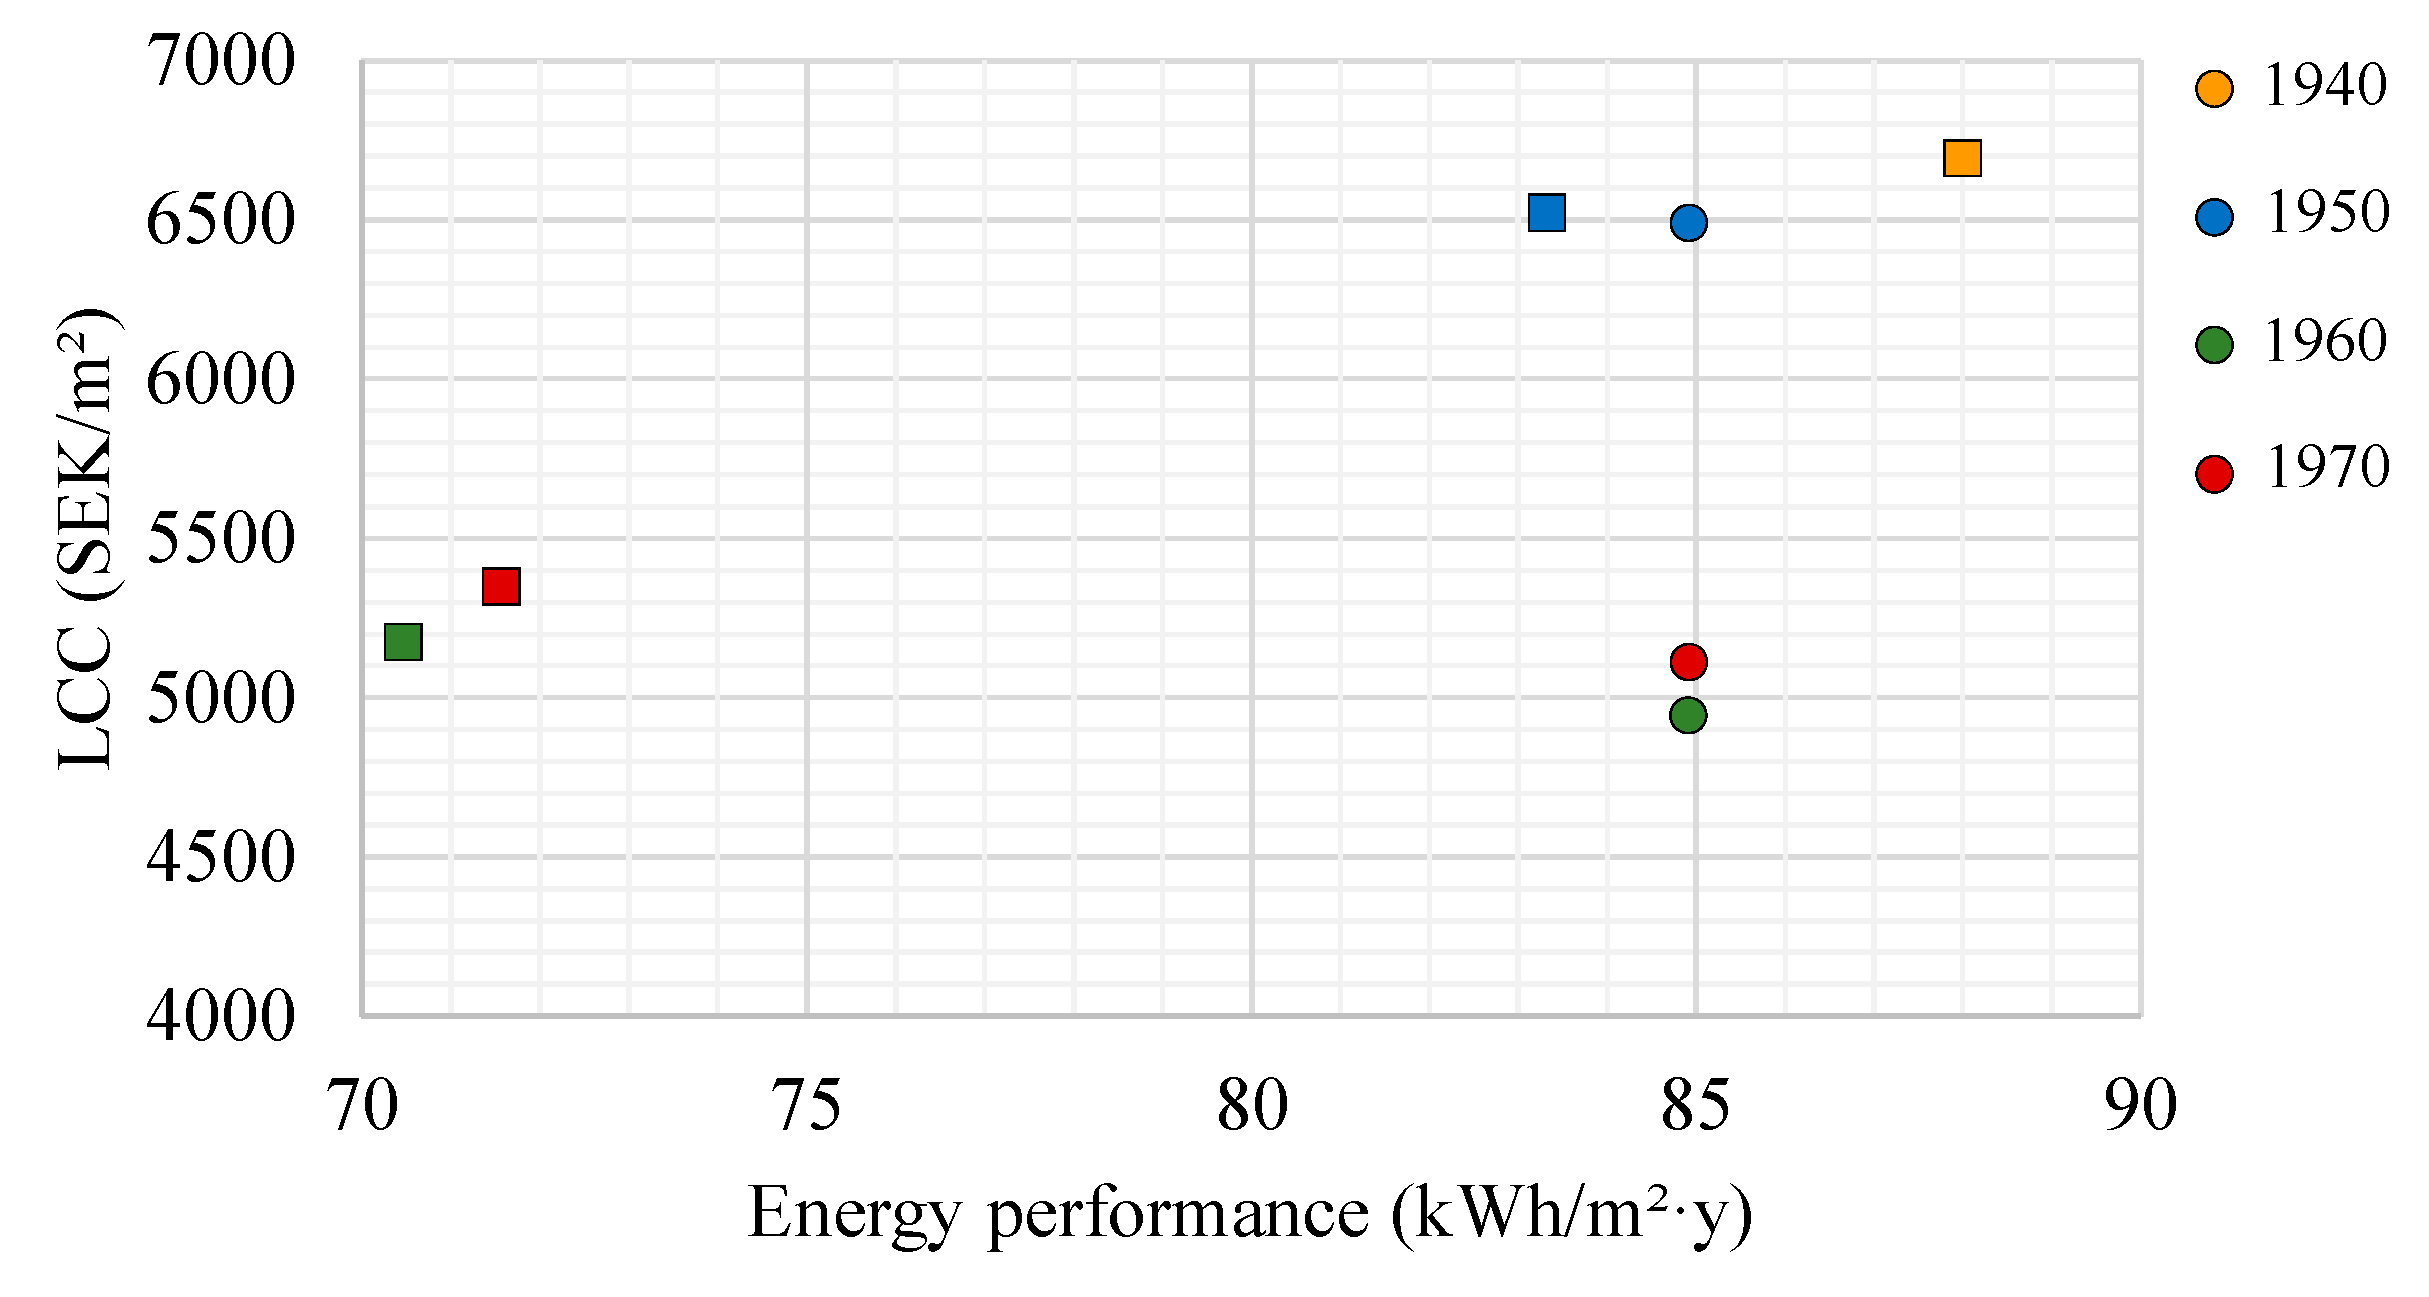
5.3. Comparison between the Renovation and the Construction of a New Building

The renovated buildings included in this analysis vary not only in construction, but also in the relationship between the internal volumes and floor area, because of the differences in ceiling height. This means that although the costs of renovation are similar with regard to, for example, the façade area, attic area, and ventilation unit, the rentable area and heated area are significantly smaller in the two buildings with higher ceiling heights. This means that a more ambitious energy renovation is required in order to achieve a similar energy performance per heated area compared with a building with a smaller internal volume to floor area ratio. The two newest buildings have similar or larger heated and rentable areas compared to the new building, which means that it is cheaper to renovate them so that they achieve similar energy performance as a new building. To allow for a comparison between energy renovation and the construction of a new building, an optimization was performed for each of the four buildings to find the LCC of an energy renovation to reach the same energy performance as the new building included in the analysis. All of the renovations include installing an HRX system, and the average required U-value and energy performance for all buildings are summarized in Table 18. The 1940s building cannot be improved to match the energy performance of the newly constructed building, and the best energy performance that can be achieved by implementing all of studied EEMs is 87.9 kWh/m2·y. The 1950s building has a slightly higher heated area and better thermal performance of the building envelope prior to renovation compared to the 1940s building, and can thus be renovated to the same energy performance as the new building, although a significant amount of insulation is needed (0.34 m attic insulation and 0.36 m façade insulation). The higher ceiling height of the two older buildings compared with the two newer buildings and the newly constructed building means that a more ambitious energy renovation approach is needed. The buildings from the 1960s and the 1970s can be renovated to the same performance as the new building by installing HRX and insulating the façade with 0.13 m and 0.16 m, respectively.
The costs for renovation or construction and the LCC are summarized in Table 19. The cost of renovating the buildings from the 1940s and the 1950s is around 5 kSEK/m2 of apartment area. Note that the 1940s building does not reach the same energy performance as the newly constructed building included in the analysis. The cost for the 1960s and 1970s buildings is around 3.5 kSEK/m2. The cost of the construction of a new building is around 8 kSEK/m2 for the demolition of the 1940s, 1950s, and 1960s buildings, and around 9.4 kSEK/m2 for the 1970s building. The total LCC is approximately 1.4 kSEK/m2 higher than the renovation or construction costs for the five story buildings (1960s, 1970s, and new building), and approximately 1.6 kSEK/m2 for the four story buildings (1940s and 1950s buildings), because of the smaller apartment area.
There is currently no energy performance requirement when Swedish buildings undergo renovation. Table 18 and Table 19 have already shown that it would not be possible to reach the energy performance requirement set for newly constructed buildings in the oldest building included in the study. The building from the 1950s can be renovated to the standard of a new building, but the maximum energy performance that is possible with the EEMs included in the study means that the best possible energy performance that could be achieved is 83.3 kWh/m2 (see Figure 9). The 1960s and 1970s buildings can be renovated to an energy performance of 70.4 and 71.5 kWh/m2, respectively, with the EEMs included in this analysis.
A comparison between a renovated building and a newly constructed building means that several aspects have to be considered. There are also differences in rent levels in larger and smaller cities, city layout, and accessibility of the building, as well as the competence and economy of the building owner. This means that any comparison is highly contextualized. As previous results have indicated, the costs and suitable EEMs also depend on the buildings type.
The cost of renovating the building skeleton structure has been shown, in previous sections, to be lower than demolishing and constructing a new building. However, the revenue from rent is higher for newly constructed buildings compared with renovated buildings, which means that part of the additional costs for the construction of a new building are compensated for. Figure 10 shows the LCC of renovation and demolition and new construction with additional costs from a Swedish setting included (see Table 13). The LCC is significantly higher for new construction. Even though the rent is higher for newly constructed buildings, it remains the most expensive approach in all of the building types included in the analysis.

6. Discussion

This study analyzes the cost of energy renovation of a multi-family building in Sweden, and compares it to demolishing the building and constructing a new building. The focus is on the costs for the building skeleton structure. The study uses an optimization approach to find the life cycle cost (LCC) optimal energy efficiency measures for four different building types, representing common Swedish building types from the 1940s, 1950s, 1960s, and 1970s. The LCC for demolishing the building and constructing a new building is calculated for each building type. The new building included in the analysis fulfils the design requirement of the Swedish building code.
The energy renovation costs identified in the study are similar to the costs related to the energy efficiency measures (EEMs) implemented in other similar Swedish energy renovations. The analysis shows that it is cost-effective to add thermal insulation to the attic in the two buildings with the poorest thermal performance of the building envelope (1940s and 1950s). The cost of attic insulation is relatively low, and none of the more extensive EEMs, such as façade insulation or the installation of a mechanical ventilation system, are cost-optimal. In the studied buildings with a slightly better thermal performance (1960s and 1970s), no EEMs are found to be cost-effective when the lowest LCC is the objective function. The building with the poorest thermal performance prior to energy renovation remains the building with the poorest thermal performance after energy renovation. In three of the buildings, it is more cost-effective to aim for higher energy savings than a low energy saving target. This indicates that it is important to carefully consider the building’s characteristics when choosing an energy renovation approach. The analysis suggests that ventilation measures are not suitable for the naturally ventilated buildings. The losses from ventilation are significantly lower, and the majority of the heat is lost because of the poor thermal performance of the building envelope in the building types with natural ventilation included in the study. The buildings included in the study are assumed to be relatively air tight. In a building with significant air leakage due to infiltration, air tightness improvements should be considered.
In the case of the demolition and construction of a new building, the demolition of the building body and the construction of the internal concrete floors represent almost half of the LCC. The demolition costs are especially high in buildings with a concrete building structure. A comparison was made between renovating the four building types to the same energy performance (according to the Swedish building code) as the newly constructed building included in the analysis. The 1940s building would be the most expensive building to renovate, and because of the poor thermal performance prior to energy renovation and the high volume to floor area ratio, it is not possible to reach the same energy performance as the new building with the energy efficiency measures included in the analysis. The best energy performance that can be achieved is 87.9 kWh/m2 at an LCC of 6.7 kSEK/m2. The building with the lowest cost for energy renovation to the standard of the new building is the building from the 1960s. Although the building does not have the best thermal performance of the building envelope among the buildings included in the analysis, it has the largest heated area, which means that a less ambitious energy renovation approach is needed. The 1960s building can achieve an energy performance of 84.9 kWh/m2 at an LCC of 5.0 kSEK/m2. Demolishing the 1940s and 1960s building, and constructing a new building with an energy performance of 84.9 kWh/m2, has an LCC of 9.5 kSEK/m2. The thermal performance is thus not the only parameter that will influence the choice between energy renovation and the demolition and construction of a new building; the shape factor of the volume to floor area ratio also has a significant impact on the LCC/m2 and the possibility of achieving energy saving targets in a cost-effective manner. The increase in revenues from rent in newly constructed buildings is not able to compensate for the higher costs of the demolition and construction of a new building.
Several aspects have to be considered in the choice between energy renovation and the demolition and construction of a new building. This study has isolated the cost of the building skeleton structure and the parts of the building that affect the energy use of the building to analyze the LCC of energy renovation versus the demolition and the construction of a new building. Although energy performance is central to national construction goals, several other aspects are also important, such as aesthetics and comfort, rent for renovated and newly constructed apartments, and suitability for intended use.

7. Conclusions

The demolition and construction of a new building has a higher LCC than energy renovation of existing buildings. The higher rent in the newly constructed buildings compared to the renovated buildings does not compensate for the total costs related to new construction. With a large volume to floor area ratio common in older buildings, the LCC of energy renovation is higher, and a more ambitious energy renovation is required in order to achieve the same energy performance as a new building. An ambitious energy renovation is not cost-optimal in any of the studied building types if the lowest LCC is the main objective. The LCC of the energy renovation is highly dependent on the building type and thermal performance prior to energy renovation. Among the studied buildings, the highest cost has been identified for the building with the smallest apartment area in relation to the internal volume and poorest thermal performance of the building envelope.

Author Contributions

Conceptualization, L.L.F., P.R. and B.M.; Data curation, L.L.F.; Formal analysis, L.L.F.; Funding acquisition, B.M.; Investigation, L.L.F.; Methodology, L.L.F., P.R. and B.M.; Project administration, B.M.; Supervision, P.R. and B.M.; Visualization, L.L.F.; Writing—original draft, L.L.F.; Writing—review & editing, L.L.F., P.R. and B.M.

Funding

This study has been financed by the Swedish Research Council Formas.

Acknowledgments

The authors are grateful for the support in calculating the building demolition costs by Wikells Sektionsfakta AB, Sweden.

Conflicts of Interest

The authors declare no conflict of interest.

References

  1. European Commission. EU Energy Statistical Pocketbook and Country Datasheets|Energy. Available online: https://ec.europa.eu/energy/en/data/energy-statistical-pocketbook (accessed on 10 June 2019).
  2. Gynther, L.; Lapillonne, B.; Pollier, K. Energy Efficiency Trends and Policies in the Household and Tertiary Sectors—An Analysis Based on the ODYSSEE and MURE Databases. Available online: http://www.odyssee-mure.eu/publications/br/energy-efficiency-trends-policies-buildings.pdf (accessed on 10 June 2019).
  3. European Commission. Energy Performance of Buildings. Available online: https://ec.europa.eu/energy/en/topics/energy-efficiency/buildings (accessed on 10 June 2019).
  4. European Parliament. Directive 2010/31/EU of the European Parliament and of the Council—on the Energy Performance of Buildings. Available online: https://eur-lex.europa.eu/legal-content/EN/TXT/?uri=CELEX%3A32010L0031 (accessed on 10 June 2019).
  5. Lechtenböhmer, S.; Schüring, A. The potential for large-scale savings from insulating residential buildings in the EU. Energy Effic. 2011, 4, 257–270. [Google Scholar] [CrossRef]
  6. Morelli, M.; Rønby, L.; Mikkelsen, S.E.; Minzari, M.G.; Kildemoes, T.; Tommerup, H.M. Energy retrofitting of a typical old Danish multi-family building to a “nearly-zero” energy building based on experiences from a test apartment. Energy Build. 2012, 54, 395–406. [Google Scholar] [CrossRef]
  7. Liu, L.; Moshfegh, B.; Akander, J.; Cehlin, M. Comprehensive investigation on energy retrofits in eleven multi-family buildings in Sweden. Energy Build. 2014, 84, 704–715. [Google Scholar] [CrossRef]
  8. Popescu, D.; Bienert, S.; Schützenhofer, C.; Boazu, R. Impact of energy efficiency measures on the economic value of buildings. Appl. Energy 2012, 89, 454–463. [Google Scholar] [CrossRef]
  9. Ferreira, M.; Almeida, M.; Rodrigues, A. Impact of co-benefits on the assessment of energy related building renovation with a nearly-zero energy target. Energy Build. 2017, 152, 587–601. [Google Scholar] [CrossRef]
  10. Thomsen, K.E.; Rose, J.; Mørck, O.; Jensen, S.Ø.; Østergaard, I.; Knudsen, H.N.; Bergsøe, N.C. Energy consumption and indoor climate in a residential building before and after comprehensive energy retrofitting. Energy Build. 2016, 123, 8–16. [Google Scholar] [CrossRef]
  11. Prasauskas, T.; Martuzevicius, D.; Kalamees, T.; Kuusk, K. Effects of Energy Retrofits on Indoor Air Quality in Three Northern European Countries. Energy Procedia 2016, 96, 253–259. [Google Scholar] [CrossRef] [Green Version]
  12. Liu, L.; Rohdin, P.; Moshfegh, B. Evaluating indoor environment of a retrofitted multi-family building with improved energy performance in Sweden. Energy Build. 2015, 102, 32–44. [Google Scholar] [CrossRef]
  13. Mørck, O.; Almeida, M.; Ferreira, M.; Brito, N.; Thomsen, K.E.; Østergaard, I. Shining examples analysed within the EBC Annex 56 project. Energy Build. 2016, 127, 991–998. [Google Scholar] [CrossRef] [Green Version]
  14. Kuusk, K.; Kalamees, T.; Link, S.; Ilomets, S.; Mikola, A. Case-study analysis of concrete large-panel apartment building at pre- and post low-budget energy-renovation. J. Civ. Eng. Manag. 2017, 23, 67–75. [Google Scholar] [CrossRef]
  15. Blomqvist, S.; La Fleur, L.; Amiri, S.; Rohdin, P.; Ödlund, L. The impact on system performance when renovating a multifamily building stock in a district heated region. Sustainability 2019, 11, 2199. [Google Scholar] [CrossRef]
  16. La Fleur, L.; Rodhin, P.; Moshfegh, B. Energy use and perceived indoor environment in a Swedish multifamily building before and after major renovation. Sustainability 2018, 10, 766. [Google Scholar] [CrossRef]
  17. Wrålsen, B.; O’Born, R.; Skaar, C. Life cycle assessment of an ambitious renovation of a Norwegian apartment building to nZEB standard. Energy Build. 2018, 177, 197–206. [Google Scholar] [CrossRef] [Green Version]
  18. Friesen, C.; Malbert, B.; Nolmark, H. Renovating to Passive Housing in the Swedish Million Programme. Plan. Theory Pract. 2012, 13, 115–131. [Google Scholar] [CrossRef]
  19. Gluch, P.; Baumann, H. The life cycle costing (LCC) approach: A conceptual discussion of its usefulness for environmental decision-making. Build. Environ. 2004, 39, 571–580. [Google Scholar] [CrossRef]
  20. Liu, L.; Rohdin, P.; Moshfegh, B. LCC assessments and environmental impacts on the energy renovation of a multi-family building from the 1890s. Energy Build. 2016, 133, 823–833. [Google Scholar] [CrossRef]
  21. Milić, V.; Ekelöw, K.; Moshfegh, B. On the performance of LCC optimization software OPERA-MILP by comparison with building energy simulation software IDA ICE. Build. Environ. 2017. [Google Scholar] [CrossRef]
  22. Spickova, M.; Myskova, R. Costs Efficiency Evaluation using Life Cycle Costing as Strategic Method. Procedia Econ. Financ. 2015, 34, 337–343. [Google Scholar] [CrossRef]
  23. Brown, N.W.O.; Malmqvist, T.; Bai, W.; Molinari, M. Sustainability assessment of renovation packages for increased energy efficiency for multi-family buildings in Sweden. Build. Environ. 2013, 61, 140–148. [Google Scholar] [CrossRef]
  24. Almeida, M.; Ferreira, M. Cost effective energy and carbon emissions optimization in building renovation (Annex 56). Energy Build. 2017, 152, 718–738. [Google Scholar] [CrossRef]
  25. Niemelä, T.; Kosonen, R.; Jokisalo, J. Cost-effectiveness of energy performance renovation measures in Finnish brick apartment buildings. Energy Build. 2017, 137, 60–75. [Google Scholar] [CrossRef] [Green Version]
  26. Liu, L.; Rohdin, P.; Moshfegh, B. Investigating cost-optimal refurbishment strategies for the medieval district of Visby in Sweden. Energy Build. 2018, 158, 750–760. [Google Scholar] [CrossRef]
  27. Tokarik, M.S.; Richman, R.C. Life cycle cost optimization of passive energy efficiency improvements in a Toronto house. Energy Build. 2016, 118, 160–169. [Google Scholar] [CrossRef]
  28. Murray, S.N.; Walsh, B.P.; Kelliher, D.; O’Sullivan, D.T.J. Multi-variable optimization of thermal energy efficiency retrofitting of buildings using static modelling and genetic algorithms—A case study. Build. Environ. 2014, 75, 98–107. [Google Scholar] [CrossRef]
  29. Kuusk, K.; Kalamees, T.; Maivel, M. Cost effectiveness of energy performance improvements in Estonian brick apartment buildings. Energy Build. 2014, 77, 313–322. [Google Scholar] [CrossRef]
  30. Itard, L.; Klunder, G. Comparing environmental impacts of renovated housing stock with new construction. Build. Res. Inf. 2007, 35, 252–267. [Google Scholar] [CrossRef]
  31. Verbeeck, G.; Cornelis, A. Renovation versus demolition of old dwellings Comparative analysis of costs, energy consumption and environmental impact. In Proceedings of the PLEA2011—27th International conference on Passive and Low Energy Architecture, Louvain-la-Neuve, Belgium, 13–15 July 2011; pp. 1–6. [Google Scholar]
  32. Power, A. Does demolition or refurbishment of old and inefficient homes help to increase our environmental, social and economic viability? Energy Policy 2008, 36, 4487–4501. [Google Scholar] [CrossRef]
  33. Power, A. Housing and sustainability: Demolition or refurbishment? Urban Des. Plan. 2010, 163, 205–216. [Google Scholar] [CrossRef]
  34. Weiler, V.; Harter, H.; Eicker, U. Life cycle assessment of buildings and city quarters comparing demolition and reconstruction with refurbishment. Energy Build. 2017, 134, 319–328. [Google Scholar] [CrossRef]
  35. Ferreira, J.; Duarte Pinheiro, M.; De Brito, J. Economic and environmental savings of structural buildings refurbishment with demolition and reconstruction—A Portuguese benchmarking. J. Build. Eng. 2015, 3, 114–126. [Google Scholar] [CrossRef]
  36. Morelli, M.; Harrestrup, M.; Svendsen, S. Method for a component-based economic optimisation in design of whole building renovation versus demolishing and rebuilding. Energy Policy 2014, 65, 305–314. [Google Scholar] [CrossRef]
  37. Alba-Rodríguez, M.D.; Martínez-Rocamora, A.; González-Vallejo, P.; Ferreira-Sánchez, A.; Marrero, M. Building rehabilitation versus demolition and new construction: Economic and environmental assessment. Environ. Impact Assess. Rev. 2017, 66, 115–126. [Google Scholar] [CrossRef]
  38. Sadick, A.; Issa, M.H. Differences in teachers’ satisfaction with indoor environmental quality and their well-being in new, renovated and non-renovated schools. Indoor Built Environ. 2018, 27, 1272–1286. [Google Scholar] [CrossRef]
  39. Bullen, P.A.; Love, P.E.D. The rhetoric of adaptive reuse or reality of demolition: Views from the field. Cities 2010, 27, 215–224. [Google Scholar] [CrossRef] [Green Version]
  40. Bullen, P.; Love, P. A new future for the past: A model for adaptive reuse decision-making. Built Environ. Proj. Asset Manag. 2011, 1, 32–44. [Google Scholar] [CrossRef]
  41. Swedish Association of Public Housing Companies; Fastigehetsägarna (Swedish Assisiation for Property Owners); Swedish Union of Tenants. Att Arbeta med Hyressättningsmodeller—En Handledning för Systematisk Hyressättning. Available online: https://www.sabo.se/trycksaker/att-arbeta-med-hyressattningsmodeller/ (accessed on 10 June 2019).
  42. Lind, H. Leder Hyreslagens Regler Till Rätt Renoveringar: Analys och Förslag; Building and Real Estate Economics, Real Estate and Construction Management, School of Architecture and the Built Environment (ABE), KTH: Stockholm, Sweden, 2015. [Google Scholar]
  43. Byman, K.; Jernelius, S. Ekonomi vid Ombyggnader med Energisatsningar. Stockholm, Sweden, 2012. Available online: https://insynsverige.se/documentHandler.ashx?did=96754 (accessed on 10 June 2019).
  44. Martinsson, L. Uvärdering av prefabricerad vägg—System för tilläggsisolering vid renovering av flerbostadshus Byggbarhet i produktion Prefab i renovering. 2014. Available online: https://www.bebostad.se/library/1846/utvaerdering-av-prefabricerad-vaegg-slutrapport.pdf (accessed on 10 June 2019).
  45. Statistics Sweden Priser för Nyproducerade Bostäder. Available online: https://www.scb.se/hitta-statistik/statistik-efter-amne/boende-byggande-och-bebyggelse/byggnadskostnader/priser-for-nyproducerade-bostader/ (accessed on 17 December 2018).
  46. BeBo Brogården—Passivhusrenovering. Available online: http://www.bebostad.se/library/1777/godaex-brogaarden-2014.pdf (accessed on 17 December 2018).
  47. BeBo Backa Röd—Lågenergirenovering. Available online: http://www.bebostad.se/library/1776/godaex-backa-roed-2014.pdf (accessed on 17 December 2018).
  48. Swedish National Board of Housing Building and Planning. Produktionskostnader för nyproduktion av flerbostadshus; Swedish National Board of Housing Building and Planning: Karlskrona, Sweden, 2009; ISBN 9789186045555.
  49. Wikells Byggberäkningar AB Kalkylprogram och kalkylböcker inom Bygg, El och VVS—Wikells Byggberäkningar. Available online: http://www.wikells.se/omwikells.aspx (accessed on 10 June 2019).
  50. La Fleur, L.; Moshfegh, B.; Rohdin, P. Measured and predicted energy use and indoor climate before and after a major renovation of an apartment building in Sweden. Energy Build. 2017, 146, 98–110. [Google Scholar] [CrossRef] [Green Version]
  51. International Standard ISO 6946:2007. Building Components and Building Elements—Thermal Resistance and Thermal Transmittance—Calculation Method 2007. Available online: https://www.iso.org/standard/40968.html (accessed on 11 June 2019).
  52. International Standard ISO 13370:2007. Thermal Performance of Buildings—Heat Transfer via the Ground—Calculation Methods 2007.
  53. Adalberth, K.; Wahlström, Å.; Abel, E.; Tućan, B. Energibesiktning av byggnader: Flerbostadshus och Lokaler; SIS förlag: Stockholm, Sweden, 2009; ISBN 9789171627551. [Google Scholar]
  54. Sveby Brukarindata bostäder. Available online: http://www.sveby.org/ (accessed on 10 June 2019).
  55. Gustafsson, S.-I. Optimal Energy Retrofits on Existing Multi-Family Buildings; Linköping Studies in Science and Technology. Dissertation No. 0280-7971; Linköping University: Linköping, Sweden, 1986; ISBN 91-7870-118-X. [Google Scholar]
  56. Gustafsson, S.-I. Mixed integer linear programming and building retrofits. Energy Build. 1998, 28, 191–196. [Google Scholar] [CrossRef]
  57. Gustafsson, S.I. Optimal fenestration retrofits by use of MILP programming technique. Energy Build. 2001, 33, 843–851. [Google Scholar] [CrossRef]
  58. Gustafsson, S.I.; Bojic, M. Optimal heating-system retrofits in residential buildings. Energy 1997, 22, 867–874. [Google Scholar] [CrossRef]
  59. La Fleur, L.; Rohdin, P.; Moshfegh, B. Investigating cost-optimal energy renovation strategies for a multifamily building in Sweden. Energy Build. 2019. submitted. [Google Scholar]
  60. Equa Simulation AB. Validation of IDA Indoor Climate and Energy 4.0 Build 4 with Respect to ANSI/ASHRAE Standard 140-2004. Solna, Sweden, 2010. Available online: http://www.equaonline.com/iceuser/validation/ASHRAE140-2004.pdf (accessed on 10 June 2019).
  61. Equa Simulation AB. Validation of IDA Indoor Climate and Energy 4.0 with Respect to CEN Standards EN 15255-2007 and EN 15265-2007. Solna, Sweden, 2010. Available online: http://www.equaonline.com/iceuser/validation/CEN_VALIDATION_EN_15255_AND_15265.pdf (accessed on 10 June 2019).
  62. Kropf, S.; Zweifel, G. Validation of the Building Simulation Program IDA-ICE According to CEN 13791 “Thermal Performance of Buildings—Calculation of Internal Temperatures of a Room in Summer Without Mechanical Cooling—General Criteria and Validation Procedures”; Hochschule Technik+Architektur Luzern. HLK Engineering. 2001. Available online: http://www.equaonline.com/iceuser/validation/ICE_vs_prEN%2013791.pdf (accessed on 10 June 2019).
  63. Loutzenhiser, P.; Manz, H.; Maxwell, G. Empirical Validations of Shading/Daylighting/Load Interactions in Building Energy Simulation Tools; A Report from the International Energy Agency´s SHC Task 34/ECBCS Annex 42 Project C; International Energy Agency: Paris, France, 2007. [Google Scholar]
  64. Swedish National Board of Housing Building and Planning. The Swedish Building Code; Swedish National Board of Housing Building and Planning: Karlskrona, Sweden, 2018; ISBN 9789175635804.
  65. Swedish Association of Public Housing Companies SABOs Kombohus Plus. Available online: https://www.sabo.se/nyproduktion/sabo-kombohus/sabos-kombohus-plus/ (accessed on 16 January 2019).
  66. Skanska Kombohus. Available online: https://www.skanska.se/vart-erbjudande/byggentreprenader/byggkoncept/kombohus/ (accessed on 16 January 2019).
Figure 1. Building costs for newly constructed multi-family buildings in Linköping, Sweden, based on findings from [48] and corrected to current cost based on increase in construction costs in central Sweden [45].
Energies 12 02218 g001
Figure 2. Façade facing south (left) and cross section of building (right).
Energies 12 02218 g002
Figure 3. Overview of methodological approach and results from the three parts. LCC—life cycle cost.
Energies 12 02218 g003
Figure 4. Cost function for insulation of the building envelope.
Energies 12 02218 g004
Figure 5. Increase in LCC for different energy saving targets for the buildings from the 1940s (a), the 1950s (b), the 1960s (c), and the 1970s (d). Gray indicates that the combination of energy efficiency measures is not optimal. LLCC—lowest LCC.
Energies 12 02218 g005
Figure 6. Cost of energy renovation per apartment area at the different energy saving targets compared to three other energy renovated buildings from the 1960s and the 1970s (presented in Table 1).
Energies 12 02218 g006
Figure 7. Investment cost of the demolition and construction of a building skeleton structure and ventilation system.
Energies 12 02218 g007
Figure 8. LCC for the demolition and construction of a new building for the buildings from the 1940s, 1950s, 1960s, and 1970s.
Energies 12 02218 g008
Figure 9. LCC for renovation to energy performance requirement in newly constructed building (circles), and highest energy performance achieved with all of the EEMs included in the analysis (squares).
Energies 12 02218 g009
Figure 10. LCC for renovation and demolition and construction, as well as the revenues from rent during the building life cycle.
Energies 12 02218 g010
Table 1. Summary of energy renovation performed in Sweden.
Con-struction YearProject NameExtensive Demo-litionInsu-lation of Building EnvelopeNew WindowsHeat Reco-veryImproved Air-TightnessIndivi-dual Metering and CHargingControl SystemBal-ancing Heating SystemSolar COLlec-torsEnergy Use1 (kWh/m2)Energy Renovation Cost 2 SEK3/m2Total Renovation Costs (SEK/m2)Ref
BeforeAfter
1969–1972Gårdssten X XXXX X263145273617,055[43]
1971–1973BrogårdenXXXXXX 17758744124,714[43,44,46]
1971Katjas gata X XXX 17652398619,266[43,47]
1974Nystad 7 XXX X 16478175116,167[43]
1974Trond-heim 4 XXX X 21494229019,670[43]
1 Energy use per heated area (above 10 °C); 2 Renovation cost per apartment or other rentable area. Costs are calculated at the current cost, based on an increase in construction from the renovation year to 2017, reported by Statistics Sweden [45]; 3 Exchange rate 1 Euro = 10.6 SEK.
Table 2. Description of the reference building.
Building SegmentArea (m2)Original ConstructionU-Value 1 (W/m²·°C)
External walls569.90.01 m plasterboard,
0.25 m lightweight concrete,
cladding
0.43
Windows112.8 2three-pane1.9 3
Floor216.50.2 m concrete,
0.1 m insulation
Ground 4
0.2
Attic194.50.05 m concrete,
0.12 m mineral wool,
0.2 m concrete
0.25 5
1 U-values calculated in accordance with international standard ISO 6946—building components and building elements—thermal resistance and thermal transmittance [51]; 2 22.5 m2 per floor; 3 Glazing U-value; 4 Ground properties and floor U-value calculated in accordance with ISO 13370—thermal performance of buildings—heat transfer via the ground (calculation methods [52]); 5 Including the insulating capacity of the external roof (0.15 m concrete, 0.04 m cork, roofing tile).
Table 3. Construction and ventilation systems of the analyzed building types.
Building TypeWall Construction (thickness)Attic ConstructionWindow TypeNumber of FloorsNumber of ApartmentsVentilation SystemSpace Heating Demand (kWh/m2·year)
1940s1½ brick wall
(440 mm)
Wood beams and sawdust insulationtwo-pane49Natural188.0
1950sInsulated brick wall
(350 mm)
Wood beams and sawdust insulationtwo-pane49Natural157.0
1960sLightweight concrete
(260 mm)
Insulated concrete joistthree-pane512Exhaust113.5
1970sInsulated concrete cavity wall with external brick
(400 mm)
Insulated concrete joistthree-pane512Exhaust116.2
Table 4. Assumed U-values for all of the buildings included in the analysis.
Building Segment1940195019601970
Wall U-value (W/m2·°C)1.030.770.450.42
Attic U-value (W/m2·°C)0.50.50.250.25
Window U-value (W/m2·°C)2.72.71.91.9
Floor U-value (W/m2·°C)0.30.30.20.2
Average U-value (W/m2·°C)0.940.790.510.50
Table 5. Heated area and rentable apartment are in the studied building types.
Type of Area1940s1950s1960s1970s
Heated area (m2)804.7834.61072.51032.9
Rentable apartment area (m2)683.1698.9918.4886.2
Table 6. Air tightness, ventilation flows, and airing of the studied buildings.
Air Exchange1940s1950s1960s1970s
Specific air leakage at ± 50 Pascal 1 (l/s·m2)0.460.460.350.35
Exhaust air flow 2 (l/s·m2)--0.580.60
Natural ventilation flow1 (l/s·m2)0.350.35--
Airing (l/s·apartment)2222
1 per external area of building envelope; 2 per heated floor area.
Table 7. Inevitable renovation measures and energy efficiency measures (EEMs) of the different building segments.
Building SegmentInevitable Renovation MeasuresEnergy Efficiency Measures
FaçadeFaçade cleaning and repainting of lightweight concrete structure,
none for brick structure
Insulation with mineral wool,
new façade plaster
Attic and roofReplacement of roof tiles and repair of roof foundationInsulation of attic with mineral wool
WindowsNew wood framed windows with original U-valueNew aluminum framed windows with U-value 1.1 or 0.8 W/m2·°C
Ventilation systemNoneSupply and exhaust air ventilation system with heat recovery
Heating systemReplacement of district heating exchanger-
Table 8. Costs for different renovation measures and heating systems.
Insulation MeasuresCE1
(SEK/m2)
CE2
(SEK/m2)
CE3
(SEK/m·m2)
Thermal
Conductivity (W/m·°C)
Technical Lifetime
Attic (max 400 mm)02485440.03740 years
Lightweight concrete façade (max 400 mm)409125612830.03740 years
Brick façade (max 400 mm)0166512830.03740 years
Window MeasuresCE1
(SEK/m2)
CE2
(SEK/m2)
CE3Window U-Value (W/m2·°C)Technical Lifetime
Original windows178950-1.930 years
Window type 127895441-1.140 years
Window type 2278951367-0.840 years
Heating SystemHS1
(SEK)
HS2
(SEK/kW)
HS3
(SEK/kW)
-Technical Lifetime
District heating exchanger33,33653535-20 years3
1 Wood-framed three pane windows (non-gas filled), g-value 0.68; 2 Aluminum-framed windows (gas filled), g-value 0.43; 3 Technical lifetime of pipes and ventilation ducts is 40 years.
Table 9. Air exchange rate before and after installation of an heat recovery ventilation (HRX) system, and the cost of the new ventailtion systems.
HRX Properties1940s1950s1960s1970s
Corresponding air exchange rate with HRX 10.47 h−10.45 h−10.51 h−10.52 h−1
Cost HRX1.3 MSEK1.3 MSEK1.32 MSEK1.32 MSEK
1 The reduction in air exchange rate corresponds to the reduction in heat losses from ventilation due to the heat recovery in the HRX system.
Table 10. Demolition costs for building parts in the 1940s, 1950s, 1960s, and 1970s buildings from Wikells Sektionsfakta [49].
Building Segment1940s1950s1960s1970s
Wall demolition (SEK/m2)10748706032747
Demolition of joist and internal floors (SEK/m2)1140114011401140
Roof demolition (SEK/m2)878878878878
Window and door demolition (kSEK)28.528.535.435.4
Table 11. Construction, U-values, and energy performance of the new building designed in accordance with the Swedish building code.
Building SegmentConstructionU-valueAreaCost per m2 [49]
WallsPrefabricated sandwich elements
(thickness 270 mm)
0.29 W/m2·°C591.6 m22310 SEK
Attic160 mm concrete
200 mm mineral wool
80 mm concreteRoof
0.16 W/m2·°C194.0 m21830 SEK
FloorInsulated ground slab0.2 W/m2·°C216.0 m21096 SEK
WindowsThree-pane, low emissivity0.8 W/m2·°C112.8 m29262 SEK
Internal floorReinforced concrete joists
(thickness 300 mm)
-864 m21527 SEK
RoofConcrete tiles of wood frame foundation-344.5 m­770 SEK
Other information
Heated area1069.5 m2
Rentable area916.0 m2
Number of floors5
Annual heat demand49.6 MWh
Space heat demand46.4 kWh/m2·year
Energy demand 184.9 kWh/m2·year
Maximum power 231.1 kW
Heat supply systemDistrict heating
1 Including standard domestic hot water (25 kwh/m2·year when included in rent) based on findings from a Swedish setting [54], and facility electricity use from the renovated reference building (1749 kWh for lighting and other facility use, 7288 kWh for HRX ventilation); 2 At the winter outdoor design temperature of −17.6°C.
Table 12. Cost of district heating in Linköping, Sweden.
Maximal PowerDemand Fee (SEK/year)Demand Fee (SEK/kW 1)Heating Price Jan–Feb, Dec (SEK/kWh)Heating Price Mar–Apr, Oct–Nov (SEK/kWh)Heating Price May–Sep (SEK/kWh)
5–50 kW 112009310.450.320.08
51–250 kW 147008560.450.320.08
1. For power demand when the outdoor temperature is −17.6°C.
Table 13. Costs per apartment area for other renovations, excluding EEMs, additional costs for new construction, rent, and time requirement for performing renovation or demolition and construction.
Renovation or Construction CharacteristicsRenovation (kSEK/m2)Demolition and New Construction (kSEK/m2)Ref
Renovation and maintenance costs17.4-[43]
Technical installations-9.8[48]
Interior installations-13.4[48]
Other costs-2.6[48]
Rent0.991.23-
Time requirement6 months18 months[48]
Table 14. EEMs at different energy saving targets between 10% and 70% for the 1940s building. LLCC—lowest LCC.
Energy Saving TargetWindow U-Value (W/m²·°C)Additional Insulation (m)HRXEnergy Use (kWh/m2·y)Power Demand (kW)Reduced Heat DemandLCCOptimal
NorthEastSouthWestFaçadeAttic
Original2.72.72.72.7---188.062.0-3.08No
10%1.11.11.11.1-0.02-169.355.110.0%2.86No
LLCC1.11.11.11.1-0.24-160.552.914.6%2.81Yes
20%1.11.11.11.10.01--150.550.520.0%3.69No
30%1.11.11.11.10.02--131.545.830.0%3.54No
40%1.11.11.11.10.05--112.741.040.0%3.40No
50%1.11.11.11.10.070.24-93.936.250.0%3.32No
20%–50%1.11.11.11.10.160.24-76.731.759.2%3.24Yes
60%1.11.11.11.10.180.24-75.131.260.1%3.24Yes
70%1.10.81.11.10.260.36Yes56.326.170.0%4.45Yes
Max.0.80.80.80.80.400.40Yes48.123.974.7%4.57No
Table 15. EEMs at different energy saving targets between 10% and 70% for the 1950s building.
Energy Saving TargetWindow U-Value (W/m²·°C)Additional Insulation (m)HRXEnergy Use (kWh/m2·y)Power Demand (kW)Reduced Heat DemandLCCOptimal
NorthEastSouthWestFaçadeAttic
Original2.72.72.72.7---157.056.1-2.87No
10%1.11.11.11.1---141.349.910.0%2.68No
LLCC1.11.11.11.1-0.24-129.746.917.4%2.60Yes
20%0,81.10,81.1-0.30-125.545.820.0%2.64Yes
30%1.11.11.11.10.04--110.041.730.0%3.41No
40%1.11.11.11.10.040.24-94.237.740.0%3.27No
50%1.11.11.11.10.110.24-78.533.350.0%3.25No
20%–50%1.11.11.11.10.160.24-72.831.753.7%3.23Yes
60%0.81.10.80.80.260.32-62.828.960.0%3.31Yes
70%0.81.10.80.80.300.34Yes47.024.470.0%4.49Yes
Max.0.80.80.80.80.400.40Yes44.023.772.0%4.56No
Table 16. EEMs at different energy saving targets between 10% and 70% for the 1960s building.
Energy Saving TargetWindow U-Value (W/m²·°C)Additional Insulation (m)HRXEnergy Use (kWh/m2·y)Power Demand (kW)Reduced Heat DemandLCCOptimal
NorthEastSouthWestFaçadeAttic
Original1.91.91.91.9---113.557.4-3.30No
LLCC1.11.11.11.1---109.553.63.5%3.13Yes
10%0.81.10.80.8-0.30-102.151.010.0%3.21Yes
20%1.11.11.11.10.12--90.246.920.5%3.75Yes
30%1.10.80.80.80.220.36-79.443.130.0%3.83Yes
40%1.11.11.11.1--Yes65.238.142.5%13.93Yes
50%1.11.11.11.10.03-Yes56.735.050.0%4.60No
50%1.11.11.11.10.12-Yes46.731.458.8%4.54Yes
60%1.11.11.11.10.16-Yes44.630.660.7%4.54Yes
70%0.80.80.80.80.260.36Yes34.026.670.0%4.67Yes
Max.0.80.80.80.80.400.40Yes31.925.871.9%4.75No
1 Reduction from HRX is higher than 40%. A reduction of 40% cannot be achieved by insulation measures alone.
Table 17. EEMs at different energy saving targets between 10% and 70% for the 1970s building.
Energy Saving TargetWindow U-Value (W/m²·°C)Additional Insulation (m)HRXEnergy Use (kWh/m2·y)Power Demand (kW)Reduced Heat DemandLCCCost Optimal
NorthEastSouthWestFaçadeAttic
Original1.91.91.91.9---116.256.4 3.04No
LLCC1.11.11.11.1---112.152.63.5%2.86Yes
10%0.81.10.81.1-0.30-104.550.110.0%2.94No
20%1.11.11.11.10.14--93.046.220.0%3.75No
30%0.80.80.80.80.220.40-81.342.430.0%3.86No
10%–40%1.11.11.11.1--Yes64.836.644.2% 13.65Yes
50%1.11.11.11.10.03-Yes58.134.350.0%4.57No
50%1.11.11.11.10.12-Yes47.830.758.9%4.52Yes
60%1.11.11.11.10.16-Yes45.830.060.6%4.53Yes
70%0.80.80.80.80.260.40Yes34.826.070.0%4.66Yes
Max.0.80.80.80.80.400.40Yes32.525.172.1%4.74No
1 Reduction from HRX is higher than 40%. A reduction of 40% cannot be achieved by insulation measures alone.
Table 18. Average U-value of the building envelope needed in order to achieve the required energy performance for the newly constructed buildings heated with district heating in central Sweden.
Building TypeUaverage (W/m2·°C)Annual Space Heating Demand (MWh)Power Demand (kW)Space Heating Demand 1 (kWh/m2·y)Facility Electricity 1 (kWh/m2·y)Domestic Hot Water 1 (kWh/m2·y)Energy Performance 1 (kWh/m2·y)
1940s0.1838.723.948.114.82587.9
1950s0.1938.124.045.614.32584.9
1960s0.2949.831.346.413.52584.9
1970s0.2847.330.045.914.02584.9
New0.3049.631.146.413.52584.9
1 Primary energy use according to primary energy factors in the Swedish building code [64].
Table 19. Total LCC, LCC per apartment area, and renovation or construction cost per apartment area for the construction of a new building and renovation to the same energy performance as a new building (presented in Table 18).
Cost and Energy Use1940s1950s1960s1970s
RenovateRebuildRenovateRebuildRenovateRebuildRenovateRebuild
LCC (MSEK)4.578.704.538.604.548.704.539.90
LCC (SEK/m2)668594966485939149479498511410,799
Renovation/construction cost (SEK/m2)51538147498480443596815037529451
Energy performance (kWh/m2)88.084.984.984.984.984.984.984.9

